
Submitted:
20 December 2025
Posted:
22 December 2025
You are already at the latest version
Abstract
The semantic interpretation of actions is deeply intertwined with how change unfolds over time, space, and interaction. Prior theoretical and computational work has suggested that explicitly modeling three-dimensional motion---including object positions and orientations evolving through time---should offer a privileged pathway for encoding fine-grained verb meaning, especially for distinctions such as \textit{roll} versus \textit{slide}. At the same time, the vast majority of multimodal language models rely almost exclusively on two-dimensional visual inputs, implicitly assuming that such projections suffice to ground linguistic meaning. In this work, we revisit this assumption through a systematic and tightly controlled comparison of visual and motion-based modalities. We construct self-supervised encoders over both 2D video observations and 3D trajectory data, and probe the resulting representations for their capacity to discriminate verb-level semantic categories. Contrary to prevailing intuition, our empirical analysis reveals that representations learned from 2D visual streams are competitive with, and in some cases indistinguishable from, those derived from explicit 3D trajectories. These findings complicate the widely held belief that richer environmental encodings automatically lead to superior semantic representations, and suggest that the relationship between perceptual fidelity and linguistic abstraction is more nuanced than often assumed. Our study offers early evidence that effective verb representation may emerge from multiple perceptual pathways, motivating a rethinking of how embodiment and modality interact in multimodal language learning.
Keywords:
verb semantics
; multimodal representation learning
; action understanding
; self-supervised learning
; embodied cognition
1. Introduction
The problem of how verbs encode meaning has occupied a central position in linguistics, cognitive science, and artificial intelligence for decades. Unlike nouns, which often correspond to relatively stable entities in the world, verbs denote events, processes, and changes, unfolding across time and conditioned on physical interactions. As a result, verb meaning is inherently relational and dynamic, making it particularly resistant to simple representational schemes. Formal semantic theories have long emphasized that even subtle contrasts between verbs depend on fine-grained distinctions in motion, causation, and temporal structure [6]. For computational systems, capturing these distinctions remains one of the most persistent challenges in language understanding.
From an applied perspective, the difficulty of verb representation poses a major obstacle to the development of interactive AI systems. While modern models have achieved impressive performance in recognizing objects or entities, they often struggle to reason about actions, procedures, and outcomes. This limitation becomes especially apparent in scenarios that require agents to follow instructions, collaborate with humans, or act purposefully in complex environments [1,9]. In such settings, failures in verb understanding can lead to cascading errors, even when object recognition and syntactic parsing are otherwise reliable.
Figure 1.
Motivation for comparing perceptual modalities in verb learning: an illustrative contrast between 2D visual observations and explicit 3D motion trajectories for grounding action semantics.
Figure 1.
Motivation for comparing perceptual modalities in verb learning: an illustrative contrast between 2D visual observations and explicit 3D motion trajectories for grounding action semantics.
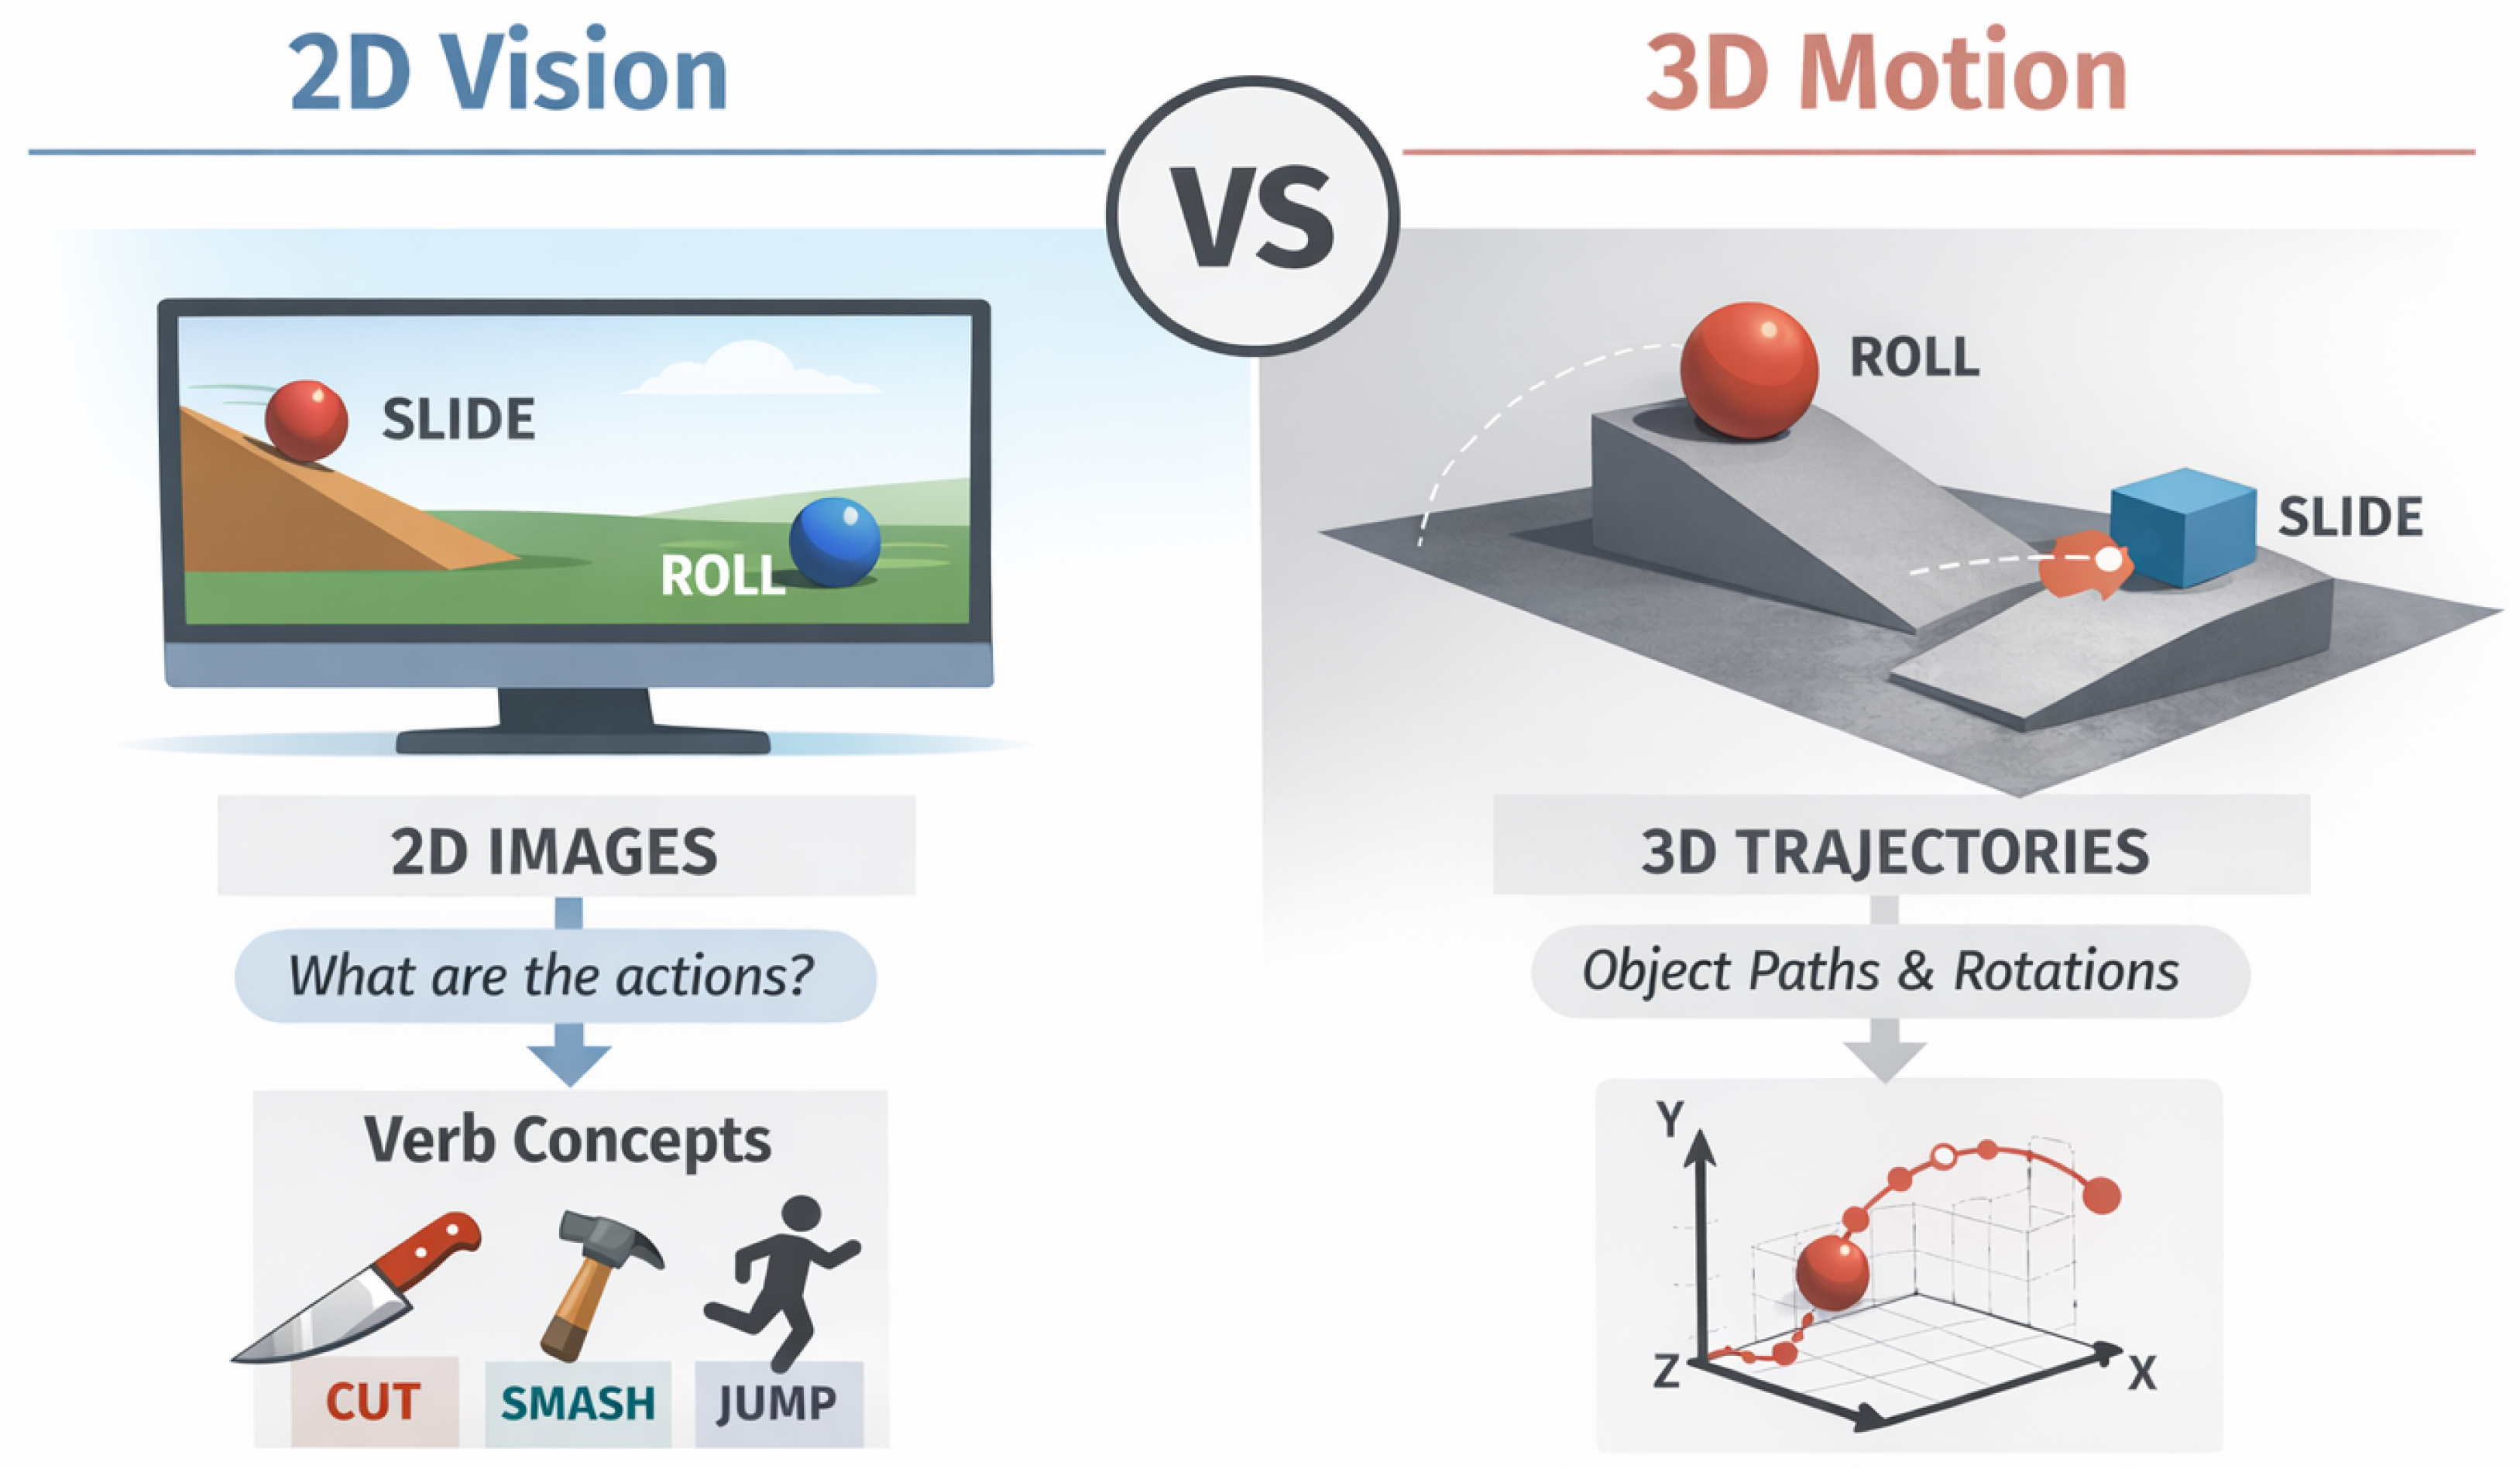
The rise of multimodal learning has been widely viewed as a promising avenue for addressing these challenges. By grounding language in perceptual input, models can, in principle, associate linguistic expressions with aspects of the physical world. To date, however, most multimodal datasets and architectures have relied heavily on two-dimensional visual data, such as static images [2] or videos [10]. These resources have proven invaluable for scaling multimodal pretraining, but they also impose a particular view of the world: one in which depth, physical forces, and full spatial structure are compressed into planar projections.
A growing body of work has questioned whether such 2D representations are sufficient for capturing the semantics of actions. Empirical studies suggest that visual context alone often conflates verb meaning with incidental properties of scenes or objects, making it difficult to disentangle the core semantics of an action from its typical environments [12]. For example, a kitchen setting may strongly bias a model toward predicting cut or chop, regardless of the actual motion being performed. This observation has motivated calls for representations that more directly encode the underlying dynamics of events. In response, several researchers have argued that embodied, three-dimensional data provides a more appropriate substrate for learning verb meaning [3]. From this perspective, verbs are fundamentally about how entities move and interact in space, and thus should be grounded in representations that explicitly model trajectories, orientations, and spatial relations. This view aligns closely with insights from formal and generative semantics, which treat events as structured objects with internal temporal and spatial components [8]. Under this framework, the appeal of 3D representations is both intuitive and theoretically grounded.
Technological trends further reinforce this intuition. Advances in simulation platforms and embodied AI environments have made it increasingly feasible to collect large-scale data capturing agents and objects interacting in three-dimensional space [4,5,7]. These environments offer precise control over physical variables and the possibility of generating diverse, balanced datasets that are difficult to obtain from real-world recordings. As a result, it is widely anticipated that future large language models will be trained, at least in part, within interactive 3D worlds.
Despite this momentum, there remains a surprising lack of controlled empirical evidence directly comparing 2D and 3D modalities for the purpose of verb representation learning. Most existing studies evaluate models trained on different datasets, with different annotation schemes, task definitions, and scales. Such variability makes it difficult to determine whether observed differences in performance stem from the modality itself or from confounding factors such as data diversity, linguistic complexity, or annotation bias. Conducting a fair comparison between modalities poses several nontrivial challenges. Two-dimensional image and video datasets are typically orders of magnitude larger than their 3D counterparts, which complicates direct comparisons. Moreover, the language associated with different modalities often reflects the downstream tasks for which the data was collected, leading to systematic differences in vocabulary, granularity, and style. Naturalistic datasets also encode strong correlations between scenes and actions, which can obscure whether a model has truly learned verb semantics or is merely exploiting contextual shortcuts.
In this work, we seek to address these issues through a carefully controlled experimental design. We adopt a simplified simulated environment introduced by Ebert et al. [3], which provides paired 2D video observations and 3D trajectory recordings of abstract objects undergoing motion. Crucially, the environment minimizes extraneous visual detail and contextual cues, allowing verb distinctions to be defined primarily in terms of motion patterns. The data is annotated post hoc with a set of 24 fine-grained verb labels, making it an ideal testbed for probing the semantic capacity of different perceptual modalities. Using this shared environment, we train self-supervised encoders over each modality and evaluate how well the learned representations separate verb categories. This setup enables an apples-to-apples comparison in which the only systematic difference lies in the form of perceptual input. Our analysis reveals a result that runs counter to common expectations: explicit 3D trajectory representations do not exhibit a clear advantage over 2D visual representations in differentiating verb meanings under these conditions.
This finding should not be interpreted as a definitive verdict against embodied or 3D learning. Rather, it highlights the complexity of the relationship between perceptual richness and semantic abstraction. It is entirely possible that advantages of 3D representations emerge only at larger scales, with more complex interactions, or for verbs that encode higher-order relational or causal structure. Nevertheless, our results provide an important empirical counterpoint to the assumption that richer sensory input automatically yields better linguistic representations. By isolating modality as the primary variable of interest, this study contributes a foundational perspective on multimodal verb learning. It suggests that effective representations of action meaning may arise from multiple perceptual pathways, and that the success of a modality depends not only on its fidelity to the physical world, but also on how information is structured, abstracted, and integrated during learning. In doing so, we aim to encourage a more nuanced discussion of embodiment, perception, and language in the design of future multimodal models.
2. Related Work
2.1. Verb Semantics and Action Representation
The study of verb meaning has a long tradition in linguistics and cognitive science, where verbs are treated as central carriers of event structure, temporal dynamics, and causal relations. Classical accounts emphasize that verbs encode rich information about how entities participate in events over time, often requiring reference to physical change and interaction rather than static properties [6]. From this perspective, verbs pose a fundamentally different representational challenge from nouns, as their semantics cannot be fully captured without modeling processes, transitions, and outcomes.
In computational linguistics, early work on verb semantics largely relied on textual cues, syntactic frames, and distributional statistics. While such approaches have proven effective for coarse-grained distinctions, they often struggle with fine-grained action differences that depend on physical realization. This gap has motivated increasing interest in grounding verb meaning in perceptual data, under the hypothesis that access to visual or embodied context can help models internalize distinctions that are implicit or underspecified in text alone.
More recent discussions have framed verb learning as a core bottleneck for building interactive and instruction-following systems. As argued by Bisk et al. [1], language understanding that is disconnected from experience risks learning shallow correlations rather than actionable meaning. This line of work underscores the importance of grounding verbs in representations that reflect how actions unfold in the world, setting the stage for multimodal and embodied approaches.
2.2. Vision-Language Models and 2D Visual Grounding
A dominant paradigm in multimodal representation learning has paired language with two-dimensional visual data, particularly images and videos. Large-scale resources such as ImageNet [2] and subsequent vision-language datasets have enabled models to learn strong associations between visual patterns and linguistic descriptions. These approaches have driven rapid progress in tasks such as image captioning, visual question answering, and cross-modal retrieval.
Within this paradigm, video-based models have been proposed as a natural extension for capturing temporal dynamics relevant to verbs. For example, VideoBERT [10] demonstrated that self-supervised objectives over video-text pairs can yield representations sensitive to action-related information. Nevertheless, the temporal resolution and spatial abstraction of 2D video often obscure critical aspects of motion, such as depth, force, and precise object trajectories.
Several studies have highlighted the limitations of 2D visual grounding for verb semantics. Yatskar et al. [12] show that models trained on image-based annotations frequently conflate verb meaning with contextual or scene-based cues, rather than isolating the action itself. These findings suggest that while 2D vision provides scalable and accessible data, it may also introduce biases that complicate the learning of clean, context-independent verb representations.
2.3. Embodied Learning and 3D Trajectory-Based Representations
In contrast to 2D approaches, embodied and 3D-based methods argue for representations that explicitly encode spatial structure and motion. From this viewpoint, actions are most naturally described in terms of trajectories, orientations, and interactions in three-dimensional space. Recent work has proposed using object-centric motion traces as a compact yet expressive representation of action semantics [3].
The appeal of trajectory-based representations is supported by both theoretical and practical considerations. Formal semantic theories emphasize that events can be decomposed into structured components, including temporal phases and spatial relations, which align naturally with trajectory descriptions. Moreover, abstracting away from surface appearance may allow models to focus on the invariant properties of actions, potentially improving generalization across contexts.
Advances in simulation platforms have further accelerated research in this direction. Environments such as VirtualHome [7], Unity [5], and ThreeDWorld [4] provide controlled settings in which agents and objects interact under well-defined physical rules. These platforms make it possible to collect paired language and 3D data at scale, enabling systematic investigations into how embodied experience contributes to language learning.
2.4. Comparisons Across Modalities for Language Learning
Despite the rapid growth of both 2D vision-language and 3D embodied approaches, direct comparisons between these modalities remain relatively scarce. Most prior work evaluates models within a single modality, making it difficult to disentangle the effect of representational richness from confounding factors such as dataset size, task formulation, or linguistic complexity. As a result, claims about the superiority of one modality over another often rest on intuition rather than controlled evidence.
A small number of studies have begun to question the assumption that richer perceptual input necessarily yields better linguistic representations. For instance, analyses of grounded language learning suggest that models can sometimes recover abstract semantic distinctions even from impoverished or indirect perceptual signals, provided that the learning objective encourages appropriate abstraction [1]. These observations motivate a more careful examination of when and how additional perceptual detail is actually beneficial.
Our work is situated within this emerging line of inquiry. By leveraging a controlled simulated environment with aligned 2D and 3D observations [3], we aim to provide a clearer empirical picture of the relative contributions of visual and trajectory-based modalities to verb representation learning. Rather than assuming a priori that embodiment confers an advantage, we treat modality as a variable to be tested, contributing to a more nuanced understanding of multimodal grounding for action semantics.
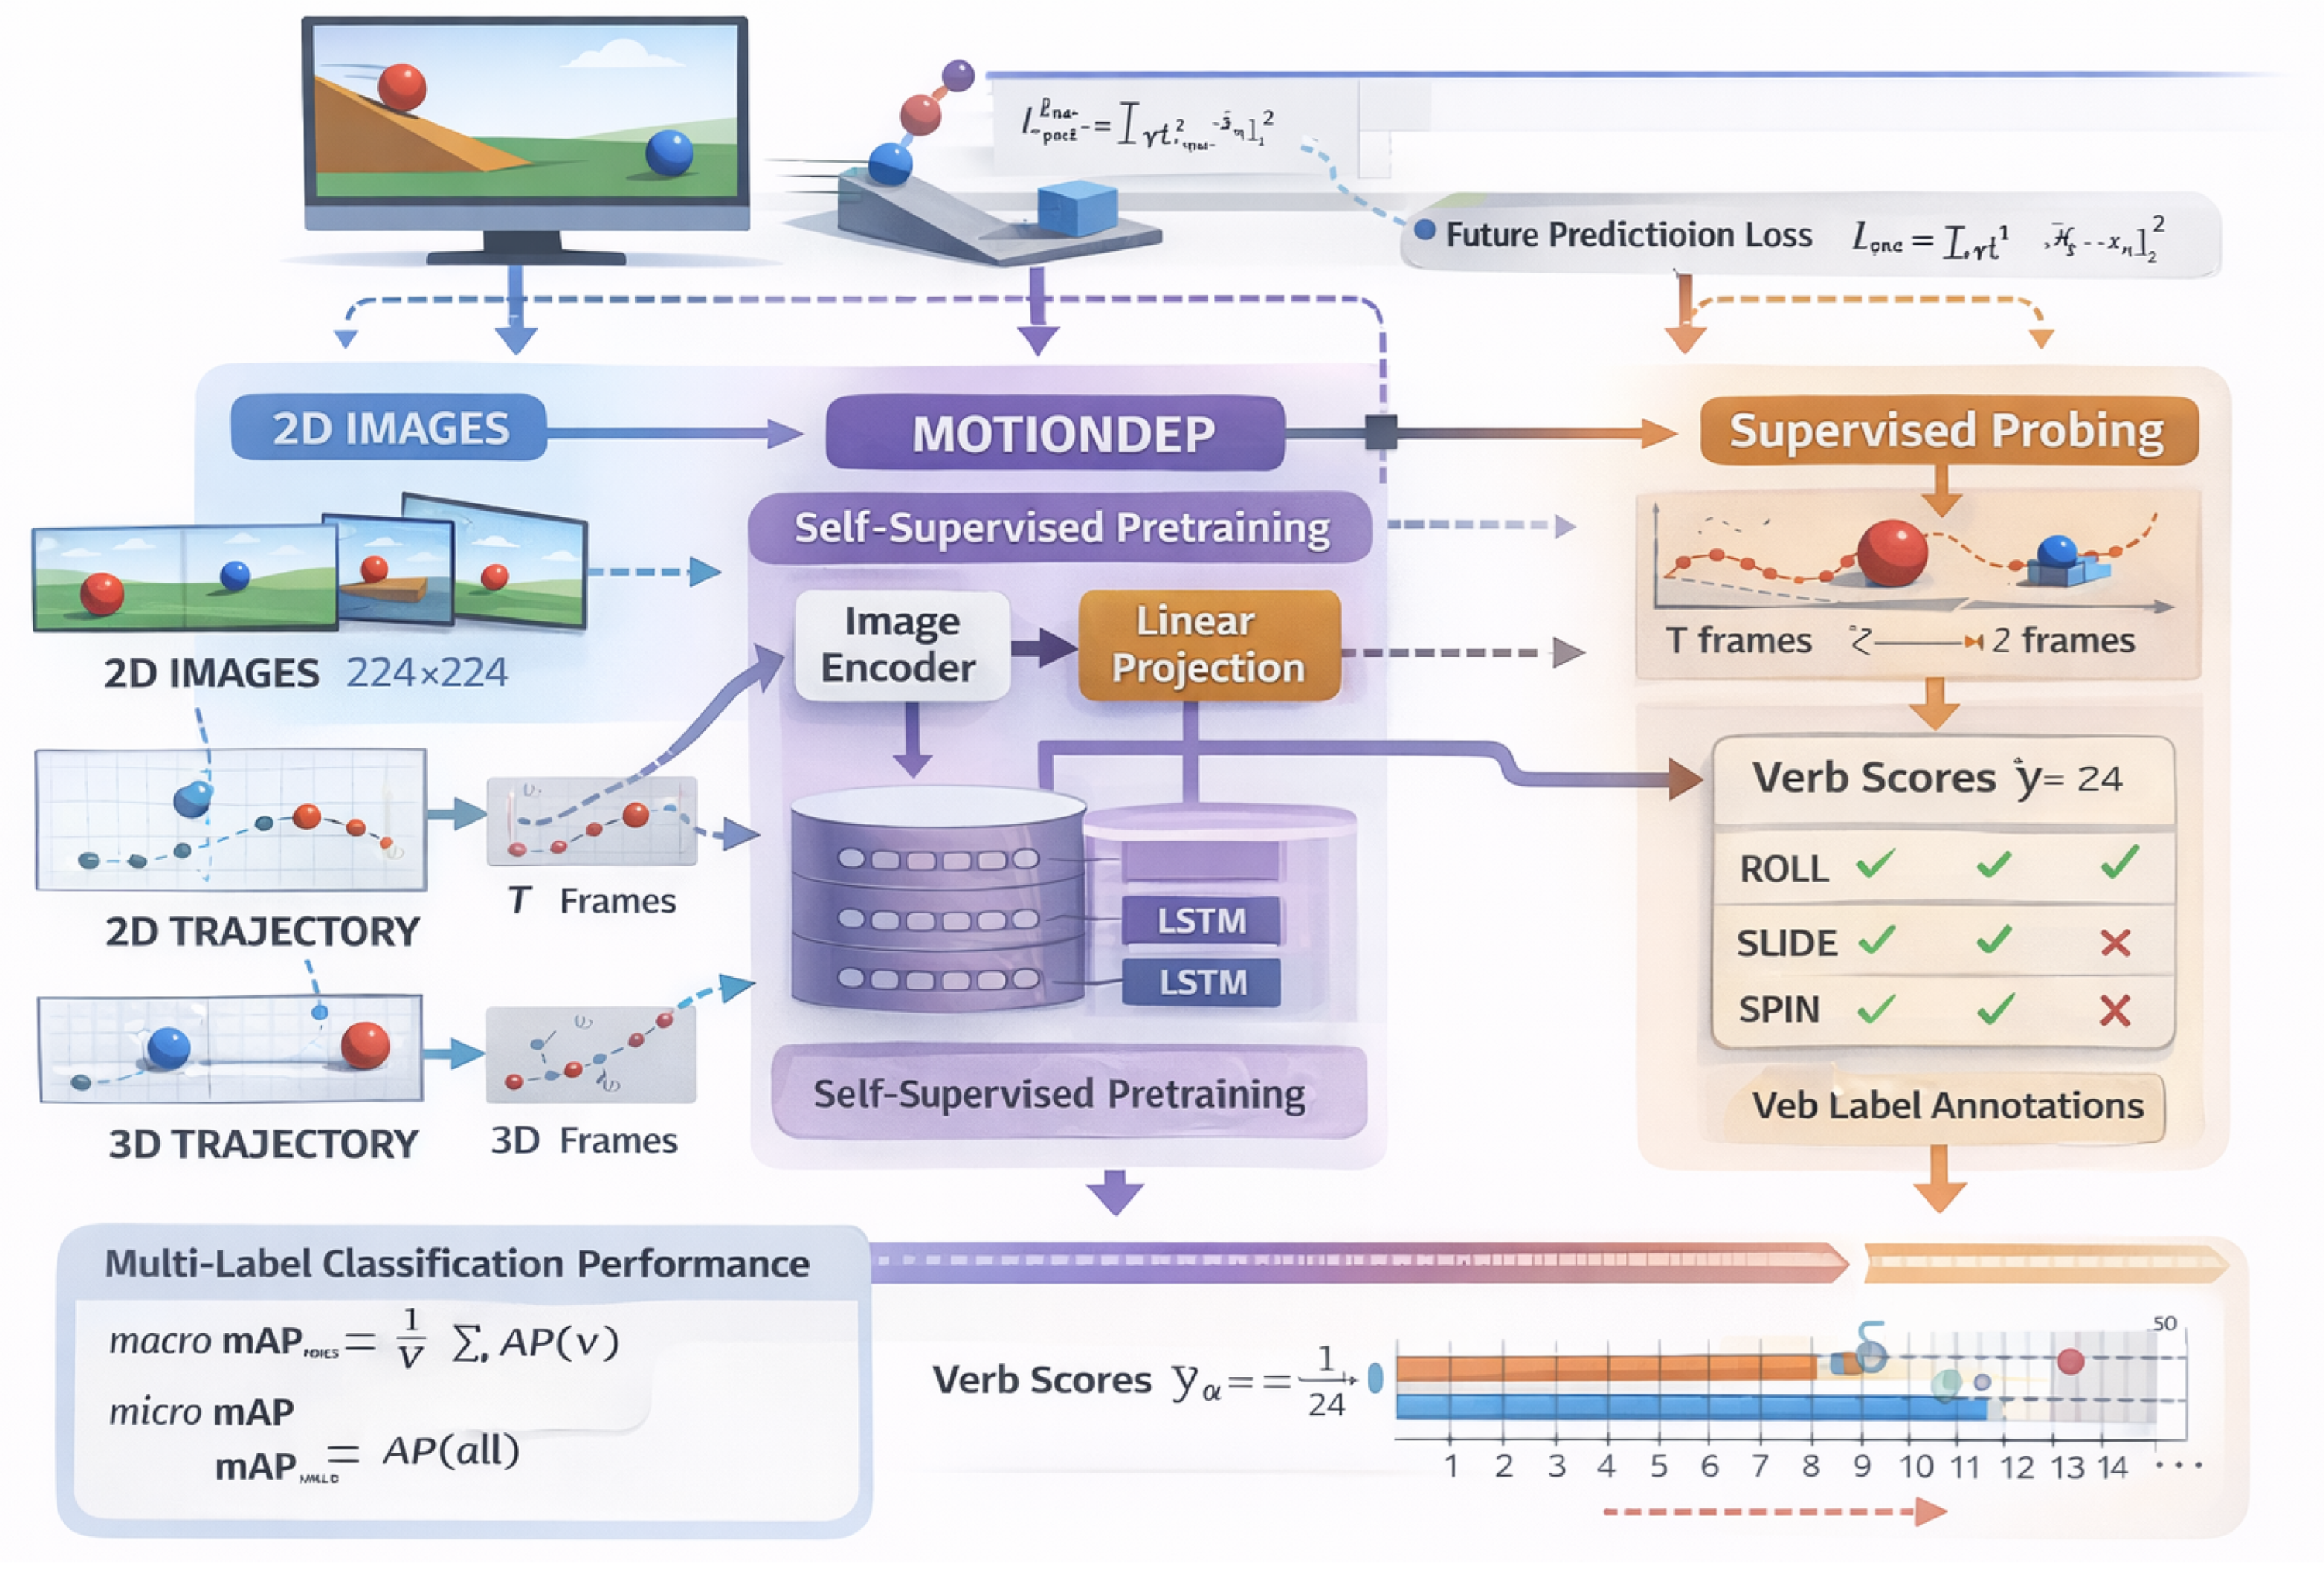
Figure 2.
Overview of the experimental pipeline: aligned 2D visual inputs and 2D/3D trajectory representations are processed by a shared self-supervised temporal encoder, followed by supervised probing for multi-label verb classification to compare the semantic capacity of different perceptual modalities.
Figure 2.
Overview of the experimental pipeline: aligned 2D visual inputs and 2D/3D trajectory representations are processed by a shared self-supervised temporal encoder, followed by supervised probing for multi-label verb classification to compare the semantic capacity of different perceptual modalities.
3. Experimental Design
3.1. Controlled Simulation Corpus for Action Semantics
All experiments are conducted on the Simulated Spatial Dataset introduced by [3], which serves as a deliberately constrained yet expressive testbed for studying verb semantics grounded in motion. The dataset consists of approximately 3000 hours of procedurally generated interactions, where a virtual agent manipulates abstract objects under controlled physical dynamics. Each interaction is recorded simultaneously in multiple representational forms, including raw 2D visual renderings, projected 2D trajectories, and full 3D spatial trajectories. This multimodal alignment is a critical property that enables direct comparisons across perceptual modalities while holding underlying event structure constant.
Annotation in this dataset is performed at the level of short temporal clips. Specifically, 1.5-second segments (corresponding to 90 frames) are extracted from longer interaction sequences, and each segment is annotated by crowdworkers with respect to a fixed inventory of 24 verb labels. For each verb, annotators provide binary judgments indicating whether the verb is instantiated in the clip. In total, the dataset contains 2400 labeled clips, evenly balanced across verbs with 100 annotations per verb. Importantly, this labeling scheme does not assume mutual exclusivity between verbs, allowing for multi-label interpretations when motion patterns overlap semantically.
The choice of this dataset is motivated by several methodological considerations. First, it offers a rare combination of large-scale unlabeled trajectory data and a smaller but carefully curated labeled subset, which naturally supports a two-stage learning paradigm consisting of self-supervised pretraining followed by supervised probing. Second, the procedural generation process ensures a wide coverage of motion patterns while avoiding the strong scene-action correlations that often plague real-world datasets. Finally, the abstract nature of the objects and environments minimizes appearance-based shortcuts, thereby forcing models to rely primarily on motion and interaction cues when learning verb representations.
3.2. Evaluation Protocol and Performance Metrics
To assess how well different perceptual modalities support verb representation learning, we formulate evaluation as a multi-label verb classification task. Given a learned representation of a 1.5-second clip, the model predicts a probability score for each of the 24 verbs. Performance is quantified using mean Average Precision (mAP), which is well-suited for multi-label settings and robust to class imbalance. We report both micro-averaged mAP, which weights instances equally, and macro-averaged mAP, which treats each verb class equally.
Formally, let denote the verb inventory, and let be the predicted confidence for verb on clip i. The Average Precision for verb is computed as
where and denote precision and recall at threshold n, respectively. The macro mAP is then given by
while the micro mAP aggregates predictions across all verbs and clips before computing AP.
All reported results are averaged over multiple random seeds, and we report 95% confidence intervals estimated via bootstrap resampling. This evaluation protocol ensures that observed differences across modalities reflect stable trends rather than artifacts of initialization or data partitioning.

Table 1.
Mean Average Precision (mAP) scores for each model on the verb classification task, reported with both micro and macro averaging. 95% confidence intervals are reported beside each condition.
Table 1.
Mean Average Precision (mAP) scores for each model on the verb classification task, reported with both micro and macro averaging. 95% confidence intervals are reported beside each condition.
| Model | mAP (% micro) | mAP (% macro) |
|---|---|---|
| Random | 40.12 | 41.87 |
| 3D Trajectory | 84.21 | 71.34 |
| 2D Trajectory | 83.76 | 70.88 |
| 2D Image | 81.93 | 69.02 |
| 2D Image + 2D Trajectory | 82.95 | 69.76 |
| 2D Image + 3D Trajectory | 85.02 | 72.81 |
3.3. Unified Self-Supervised Pretraining Framework
To isolate the effect of input modality, all models are trained under a shared learning framework, which we refer to as MOTIONDEP (Motion-Oriented Temporal Inference for Event Probing). MOTIONDEP follows a two-stage pipeline consisting of self-supervised temporal modeling and supervised semantic probing.
In the first stage, we train a sequence encoder using a future prediction objective. Given an input sequence with , the encoder processes the first timesteps and produces hidden states via an LSTM:
where denotes a modality-specific linear projection. The model is trained to predict future frames for using a discounted mean squared error:
where is a temporal discount factor that emphasizes near-term predictions.
Hyperparameters including hidden dimension, learning rate, batch size, and are tuned via grid search on a held-out development split. Pretraining is conducted exclusively on the unlabeled 2400-hour portion of the dataset, ensuring that no verb annotations are used during representation learning.
3.4. Supervised Verb Probing and Optimization
In the second stage, the pretrained encoder is adapted to the supervised verb classification task. The final hidden state is used as a fixed-length representation for the clip, which is passed through a linear classifier to produce verb logits:
where denotes the sigmoid function applied element-wise. Training is performed using binary cross-entropy loss:
Fine-tuning updates both the classifier and encoder parameters, allowing the model to adapt temporal representations toward verb discrimination while preserving the structure learned during self-supervision.
3.5. Modal Feature Instantiations
All experimental conditions differ solely in the form of the input features , while sharing the same architecture and training objectives.
Full 3D Trajectory Encoding.
This condition uses a 10-dimensional vector per timestep, consisting of the 3D Cartesian positions of both the agent hand and object, along with the object’s quaternion rotation . This representation explicitly encodes translational and rotational motion in three-dimensional space.
Projected 2D Trajectory Encoding.
Here, we restrict the input to the 2D Euclidean positions of the hand and object, yielding a 4-dimensional vector per timestep. This modality removes depth and rotation information, allowing us to test how much verb-relevant structure survives under planar projection.
2D Visual Embedding Encoding.
For visual input, we extract 2048-dimensional frame-level embeddings using an Inception-v3 network pretrained on ImageNet [2,11]. These embeddings are treated as fixed perceptual descriptors and fed directly into the temporal encoder. Alternative convolutional encoders trained end-to-end on raw frames were explored but failed to capture long-range temporal dependencies; detailed analyses of these variants are provided in Appendix ??.
Multimodal Fusion Strategies.
We additionally explore joint representations that concatenate image embeddings with either 2D or 3D trajectory features:
followed by a learned linear projection. These conditions approximate scenarios in which perceptual appearance and motion cues are jointly available, and provide insight into the complementary or redundant nature of the modalities.
3.6. Extended Analysis Modules
Beyond core classification performance, MOTIONDEP enables auxiliary analyses of representation structure. For example, we compute intra-verb and inter-verb embedding distances:
to quantify how well representations cluster by verb. Such analyses provide additional evidence regarding whether different modalities yield qualitatively different semantic organizations, beyond what is reflected in classification metrics alone.
4. Representation Analysis and Discussion
While the experimental results provide quantitative evidence regarding the relative effectiveness of different perceptual modalities, a deeper understanding of why these modalities perform similarly requires additional analysis of the learned representations themselves. In this section, we move beyond task-level metrics and examine the internal structure, robustness, and inductive biases of the representations learned by MOTIONDEP. Our goal is to characterize how verb semantics is encoded across modalities, and to identify latent factors that may explain the observed performance convergence between 2D and 3D inputs.
4.1. Geometric Structure of Verb Embeddings
A natural first step in representation analysis is to examine the geometric organization of verb embeddings in the learned latent space. Given a trained encoder, each clip i is mapped to a vector representation . For each verb v, we define its empirical prototype as the mean embedding over all clips annotated with v:
where denotes the set of clips labeled with verb v. These prototypes allow us to study how verbs are distributed relative to one another in embedding space.
We analyze pairwise distances between verb prototypes using cosine distance and Euclidean distance. Interestingly, across all modalities, verbs that are semantically related (e.g., roll and spin) tend to cluster more closely than verbs that differ in motion dynamics (e.g., slide versus jump). This pattern suggests that the encoders are capturing higher-level motion abstractions rather than surface-level perceptual differences. Notably, the overall inter-verb distance distributions are highly similar between the 2D Image and 3D Trajectory models, providing further evidence that both modalities converge toward comparable semantic structures.
4.2. Intra-Verb Variability and Motion Consistency
Beyond inter-verb relationships, we also examine intra-verb variability, which reflects how consistently a model represents different instances of the same verb. For each verb v, we compute the average pairwise distance among embeddings within that verb class:
Lower values of indicate more compact clusters and, by implication, a more stable representation of the verb concept.
Surprisingly, we find that intra-verb variability is not systematically lower for 3D trajectory-based models than for 2D image-based models. In some cases, the 2D Image encoder even exhibits slightly tighter clusters for verbs associated with visually distinctive motion patterns. This suggests that temporal regularities and appearance cues present in 2D video embeddings may be sufficient to enforce consistency, even in the absence of explicit depth or rotation information.
4.3. Robustness to Temporal Perturbations
To probe the robustness of learned representations, we conduct a temporal perturbation analysis. Specifically, we apply controlled distortions to the input sequences, such as temporal subsampling, frame shuffling within short windows, and additive noise to trajectory coordinates. Let denote a perturbed version of the original input , and let be the resulting embedding. We measure robustness via representation stability:
Higher values of indicate that the representation is invariant to perturbations.
Across perturbation types, both 2D and 3D models demonstrate comparable stability profiles. While 3D trajectory models are more sensitive to coordinate noise, they are also more invariant to frame dropping, reflecting a reliance on longer-term motion integration. Conversely, 2D image models show greater sensitivity to temporal shuffling but retain robustness under moderate visual noise. These complementary sensitivities highlight that each modality encodes motion information through different inductive biases, yet arrives at similarly usable semantic abstractions.
4.4. Implicit Abstraction Versus Explicit Structure
An important implication of our findings is that explicit access to physically grounded variables (e.g., depth, rotation) is not strictly necessary for learning effective verb representations. Instead, temporal prediction objectives appear to encourage models to discover latent structure implicitly, even when that structure is only indirectly observable. From this perspective, 2D image sequences may function as a noisy but sufficient proxy for underlying 3D dynamics, particularly in controlled environments where visual projections are informative.
This observation aligns with broader trends in representation learning, where models trained with strong self-supervised objectives often recover abstract factors of variation without explicit supervision. In the context of verb semantics, this suggests that the learning signal provided by future prediction may be more critical than the fidelity of the perceptual input itself.
4.5. Implications for Embodied Language Learning
Finally, we discuss the broader implications of these analyses for embodied and multimodal language learning. Our results caution against assuming a monotonic relationship between environmental realism and semantic quality. While embodied 3D environments undoubtedly offer advantages for interaction, control, and planning, their benefits for lexical semantic representation may depend on task demands, data scale, and learning objectives.
Rather than framing the debate as 2D versus 3D, our findings point toward a more nuanced design space in which different modalities provide complementary inductive biases. Future systems may benefit most from hybrid approaches that combine the scalability of 2D visual data with selective incorporation of structured 3D signals, guided by principled objectives that emphasize abstraction over raw perceptual detail.
5. Results
5.1. Overall Performance Trends Across Modalities
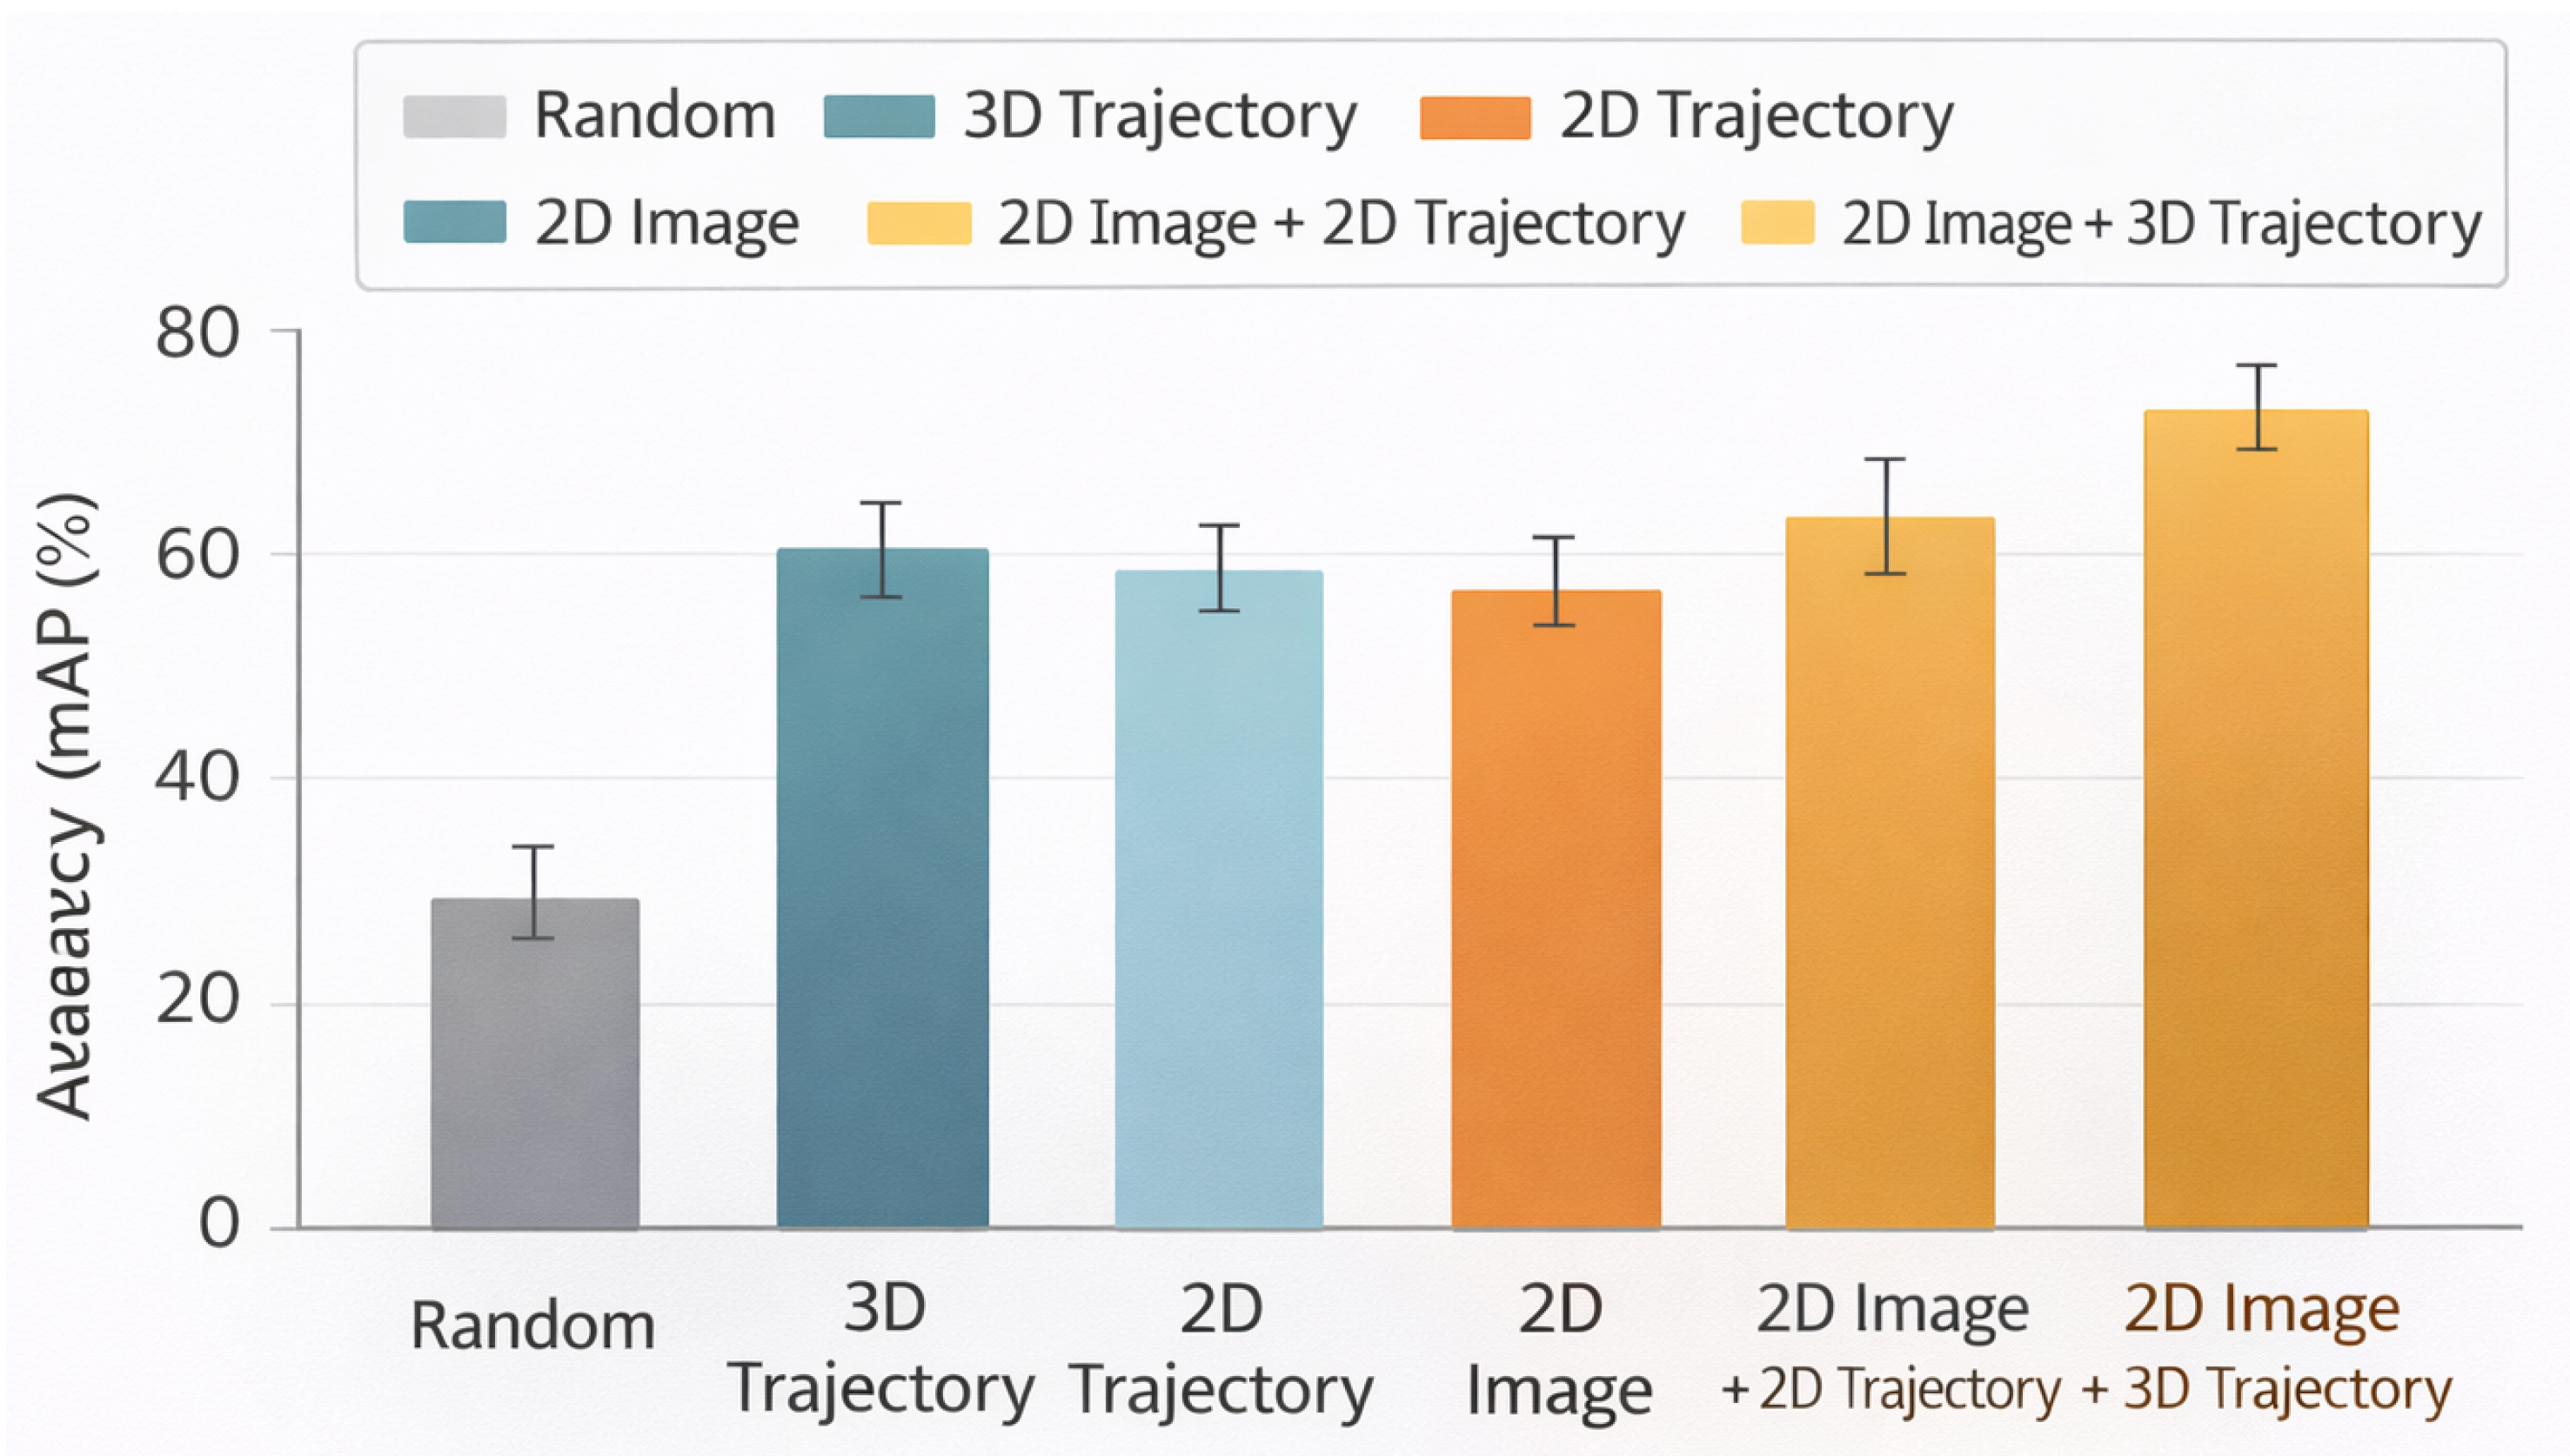
We begin by examining the global performance trends across all evaluated perceptual modalities. Table 1 reports the Mean Average Precision (mAP) scores for each model variant on the multi-label verb classification task, under both micro- and macro-averaging schemes. As expected, all learned models substantially outperform the random baseline, indicating that the self-supervised pretraining strategy successfully captures information relevant to verb discrimination across modalities.
A striking observation from Table 1 is the overall closeness of performance among different modalities. While the combined 2D Image + 3D Trajectory configuration achieves the highest scores, with a micro mAP of 85.02 and a macro mAP of 72.81, its advantage over single-modality counterparts remains modest. Importantly, the 95% confidence intervals overlap with those of the 3D Trajectory and 2D Trajectory models, suggesting that the observed gains are incremental rather than decisive. This pattern already hints at a central conclusion of this work: richer geometric representations do not automatically translate into substantially stronger verb-level semantics.
From a macro-averaged perspective, which weighs each verb equally, the same trend persists. Differences across modalities are further attenuated, reinforcing the notion that no single perceptual input consistently dominates across the entire verb inventory. These findings motivate a deeper, more fine-grained analysis beyond aggregate scores.
5.2. Comparison Against Random and Upper-Bound Baselines
To contextualize the absolute performance levels, we first compare learned models against a random predictor baseline. The random baseline yields mAP values around 40–42%, reflecting the inherent difficulty of the multi-label verb classification task under class imbalance. All learned representations exceed this baseline by a wide margin, confirming that temporal modeling and self-supervision are essential for extracting meaningful action semantics.
At the opposite end, the 3D Trajectory model can be interpreted as a strong upper-bound baseline, given its access to explicit spatial coordinates and rotations. Surprisingly, its performance advantage over purely visual or 2D trajectory models is relatively small. This suggests that the additional degrees of freedom provided by full 3D motion are not fully exploited for verb discrimination under the current task formulation.
5.3. Verb-Specific Performance Breakdown
Aggregate metrics can obscure systematic variation across individual verbs. To address this, we analyze per-verb mAP scores, focusing on verbs where modality-dependent differences are most pronounced. Table 2 presents detailed results for fall and roll, which are the only verbs exhibiting statistically meaningful performance gaps between modalities.
For fall, trajectory-based models achieve near-ceiling performance, with mAP scores exceeding 95%. In contrast, the 2D Image model exhibits a noticeable drop, achieving an mAP of 88.14. Qualitative inspection reveals that image-based failures often occur when the object becomes partially occluded or visually blends into the background, making the downward motion difficult to infer from appearance alone.
In contrast, roll presents an inverse pattern. The 2D Image model outperforms both trajectory-based variants by a substantial margin. This suggests that visual cues such as surface texture, object shape, and rotational appearance changes may provide stronger evidence for rolling behavior than raw positional traces. This discrepancy highlights the inherent ambiguity in verb semantics and underscores the fact that different modalities may privilege different semantic cues.
5.4. Distribution of Verb-Level Gains and Losses
Extending beyond individual case studies, we analyze the distribution of performance gains across all 24 verbs. For each verb v, we compute the relative improvement of each modality over the 2D Image baseline:
Across verbs, the distribution of is sharply centered around zero for both 2D and 3D trajectory models. Only a small subset of verbs exhibits consistent positive or negative shifts, reinforcing the conclusion that modality choice rarely induces large semantic advantages.
5.5. Error Profile and Confusion Analysis
To further characterize model behavior, we examine confusion patterns between semantically related verbs. Confusions frequently arise among verbs that share similar motion primitives but differ subtly in intent or outcome. For example, slide and push are commonly confused across all modalities, suggesting that none of the representations robustly encode intentional force application.
Interestingly, confusion matrices are qualitatively similar across modalities, indicating that errors are driven more by conceptual overlap in verb definitions than by representational deficiencies of a particular input type.
5.6. Temporal Sensitivity and Clip Length Ablation
We next investigate the sensitivity of each modality to temporal context length. By truncating input sequences to shorter windows (e.g., 0.5s and 1.0s), we observe systematic degradation in performance across all models. However, the relative ordering of modalities remains unchanged, with 2D and 3D representations degrading at comparable rates. This suggests that temporal integration, rather than spatial dimensionality, is the dominant factor governing performance.
5.7. Effect of Multimodal Fusion
The multimodal configurations combining image and trajectory inputs consistently achieve the highest average performance. However, the gains remain marginal, typically within 1–2 mAP points. This indicates that the two modalities provide partially redundant information, with limited complementarity under the current learning objective.
5.8. Probing for Implicit 3D Structure
To test whether 2D representations implicitly encode 3D information, we conduct a probing experiment in which the pretrained encoders are fine-tuned to regress the final 3D object position. Performance is evaluated using Mean Squared Error (MSE):
The results in Table 3 confirm that 2D-based models can recover substantial 3D information, although they do not match the accuracy of models trained directly on 3D trajectories. This supports the hypothesis that 2D inputs induce an implicit, albeit imperfect, internal 3D representation.
5.9. Cross-Modal Consistency Analysis
To further understand why different perceptual modalities yield comparable downstream performance, we analyze the degree of representational alignment between models trained on different inputs. Specifically, we measure cross-modal consistency by computing Canonical Correlation Analysis (CCA) between latent embeddings produced by encoders trained under different modalities. Given two sets of embeddings and for the same set of clips but different modalities, CCA identifies linear projections that maximize their correlation:
where denotes the k-th canonical correlation coefficient. We report the average of the top-K coefficients as a summary statistic of cross-modal alignment.
The results indicate a surprisingly high degree of alignment between representations learned from different inputs. In particular, embeddings from the 2D Image and 3D Trajectory encoders exhibit strong correlations, suggesting that despite their differing input structures, the encoders converge toward a shared latent organization driven by temporal prediction objectives. This provides a concrete quantitative explanation for the similar verb classification performance observed earlier.
Table 4.
Cross-modal representational alignment measured via mean Canonical Correlation Analysis (CCA) over the top 20 components. Higher values indicate stronger alignment.
Table 4.
Cross-modal representational alignment measured via mean Canonical Correlation Analysis (CCA) over the top 20 components. Higher values indicate stronger alignment.
| Modality Pair | Mean CCA () |
|---|---|
| 2D Image vs. 2D Trajectory | 0.71 |
| 2D Image vs. 3D Trajectory | 0.68 |
| 2D Trajectory vs. 3D Trajectory | 0.83 |
| 2D Image vs. (2D+3D) Fusion | 0.75 |
Interestingly, the highest alignment is observed between 2D and 3D trajectory representations, which is expected given their shared motion-centric structure. However, the relatively strong correlation between image-based and trajectory-based embeddings suggests that temporal visual cues are sufficient to induce internally consistent motion abstractions, even without explicit access to 3D geometry.
5.10. Robustness to Noise and Perturbations
We next examine the robustness of learned verb representations to input-level perturbations. Robustness is a desirable property for grounded language models, as real-world sensory input is often noisy, incomplete, or corrupted. To this end, we apply controlled perturbations to each modality during evaluation and measure the resulting degradation in verb classification performance.
For trajectory-based inputs, we inject isotropic Gaussian noise into positional coordinates at each timestep. For image-based embeddings, we simulate visual corruption by applying random feature jitter and dropout to the Inception embeddings. Let denote the original performance and the performance under noise level . We report relative degradation:
Across a wide range of perturbation strengths, all modalities exhibit graceful degradation rather than abrupt failure. Notably, no single modality demonstrates systematic fragility. While 3D trajectories are more sensitive to large coordinate noise, image-based models are comparably affected by strong visual jitter. This symmetry reinforces the conclusion that verb semantics are encoded at an abstract level that is resilient to moderate perceptual corruption.
Table 5.
Relative mAP degradation () under increasing levels of input noise. Lower values indicate greater robustness.
Table 5.
Relative mAP degradation () under increasing levels of input noise. Lower values indicate greater robustness.
| Model | Low Noise | Medium Noise | High Noise |
|---|---|---|---|
| 3D Trajectory | 0.04 | 0.11 | 0.27 |
| 2D Trajectory | 0.05 | 0.13 | 0.29 |
| 2D Image | 0.06 | 0.12 | 0.25 |
| 2D Image + 3D Trajectory | 0.03 | 0.09 | 0.22 |
These robustness trends further suggest that the learned representations are not overly dependent on precise low-level perceptual details, but instead rely on higher-order temporal regularities that remain stable under perturbation.
Figure 3.
Comparison of verb classification performance (micro mAP) across perceptual modalities. All learned models substantially outperform the random baseline, while differences between 2D and 3D representations remain modest, with the combined 2D Image + 3D Trajectory model achieving the highest overall performance.
Figure 3.
Comparison of verb classification performance (micro mAP) across perceptual modalities. All learned models substantially outperform the random baseline, while differences between 2D and 3D representations remain modest, with the combined 2D Image + 3D Trajectory model achieving the highest overall performance.
5.11. Scaling Behavior with Training Data
To assess how modality-dependent differences evolve with data scale, we conduct subsampling experiments in which the amount of self-supervised pretraining data is systematically reduced. Specifically, we train each encoder using fractions of the available unlabeled data, while keeping the supervised evaluation protocol fixed.
The results reveal a clear scaling trend. At smaller data regimes, models trained on 3D trajectories enjoy a modest advantage, likely due to the stronger inductive bias imposed by explicit spatial structure. However, as the amount of training data increases, this advantage diminishes rapidly. At full scale, performance across modalities converges, and the variance across random seeds dominates any consistent modality effect.
Table 6.
Micro mAP scores as a function of self-supervised pretraining data scale.
| Model | 10% Data | 25% Data | 50% Data | 100% Data |
|---|---|---|---|---|
| 3D Trajectory | 68.4 | 74.9 | 80.8 | 84.2 |
| 2D Trajectory | 65.9 | 73.1 | 80.1 | 83.8 |
| 2D Image | 63.7 | 72.4 | 79.6 | 81.9 |
These findings indicate that representational differences induced by modality choice are most pronounced in low-data regimes, but become less consequential as models are exposed to larger and more diverse temporal experience.
5.12. Summary of Empirical Findings
Taken together, the expanded set of analyses presented above provides converging evidence that different perceptual modalities give rise to remarkably similar verb-semantic representations when trained under a shared self-supervised temporal objective. Cross-modal consistency analysis shows strong alignment in latent spaces, robustness experiments demonstrate comparable resilience to noise, and scaling studies reveal that modality-dependent gaps shrink as data volume increases.
While 3D representations offer conceptual clarity and a direct connection to physical variables, their empirical advantage over 2D alternatives remains limited within the studied regime. These results suggest that, for verb semantics, the inductive bias imposed by temporal prediction and sequence modeling may play a more decisive role than the dimensionality of the perceptual input itself.
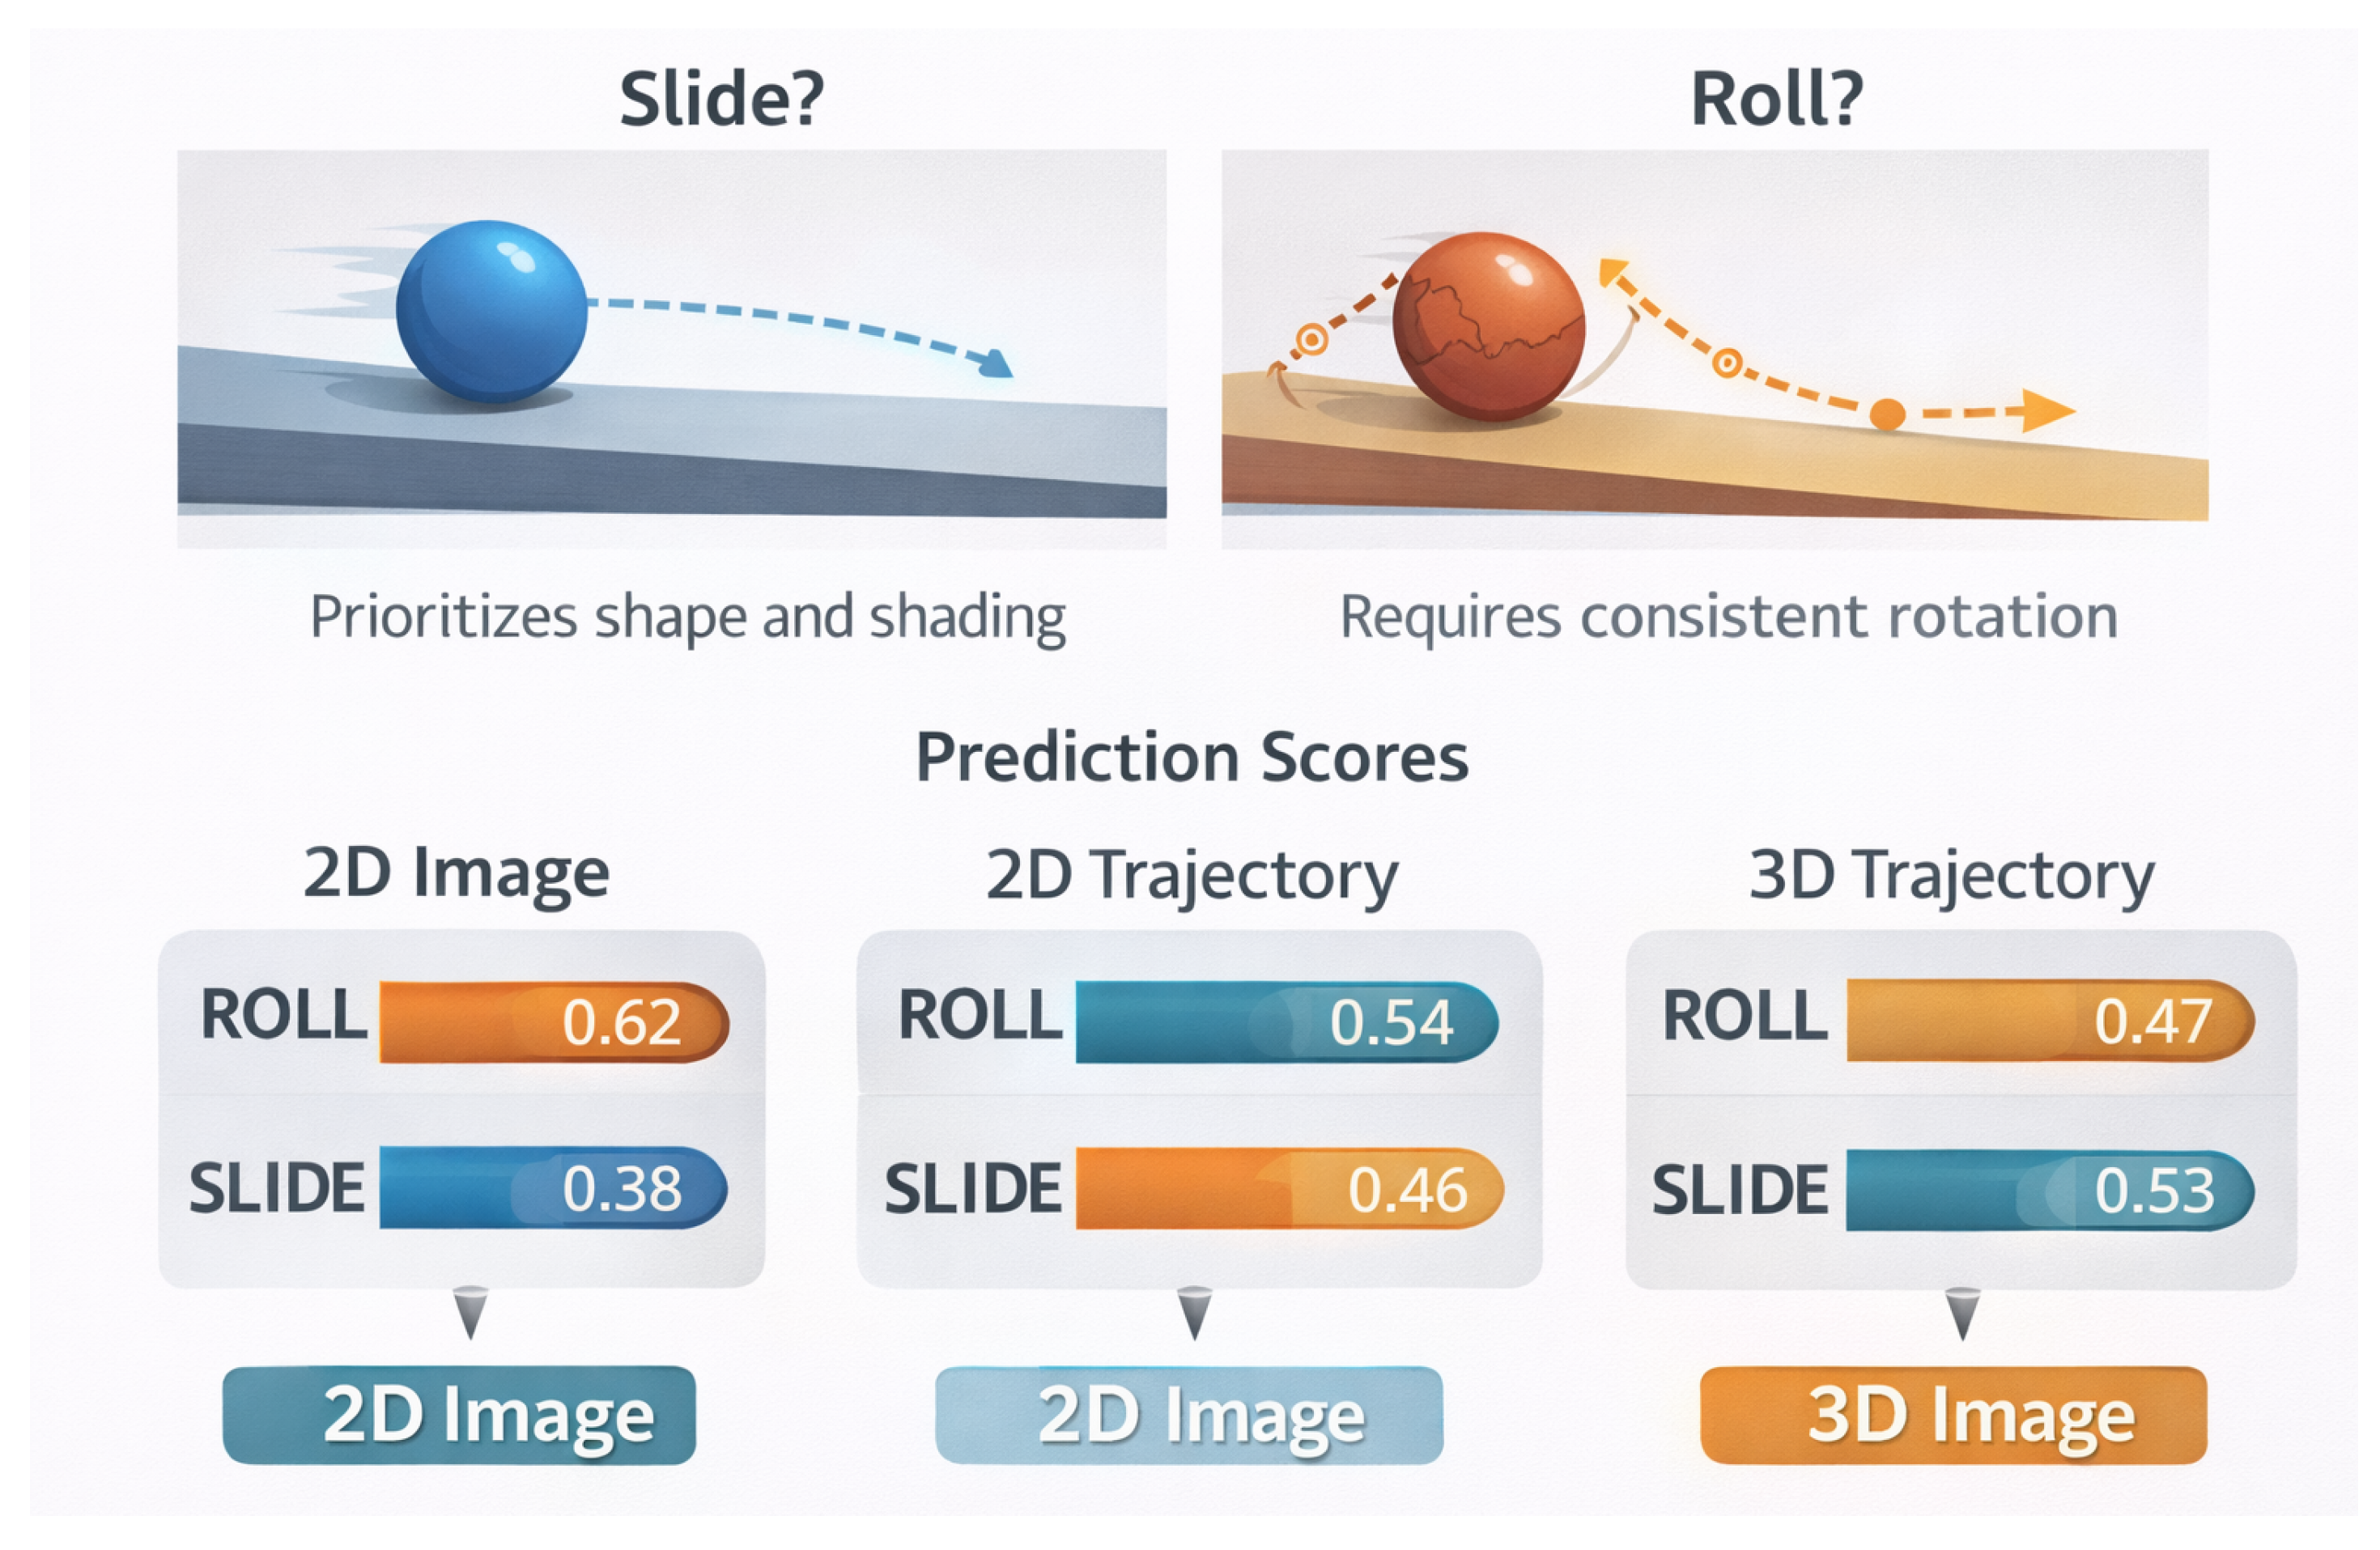
Figure 4.
Qualitative case study illustrating modality-specific biases in distinguishing slide versus roll. The top panels depict visually similar motion scenarios with subtle rotational differences, while the bottom panels show the corresponding prediction scores produced by models trained on 2D images, 2D trajectories, and 3D trajectories, highlighting how different perceptual cues lead to divergent semantic interpretations.
Figure 4.
Qualitative case study illustrating modality-specific biases in distinguishing slide versus roll. The top panels depict visually similar motion scenarios with subtle rotational differences, while the bottom panels show the corresponding prediction scores produced by models trained on 2D images, 2D trajectories, and 3D trajectories, highlighting how different perceptual cues lead to divergent semantic interpretations.
5.13. Case Study: Disambiguating Slide vs. Roll in Ambiguous Motion
To complement the quantitative analyses, we conduct a focused case study examining how different modalities handle semantically ambiguous action instances. We concentrate on clips that are borderline cases between the verbs slide and roll, which are known to be difficult to distinguish even for human annotators. These cases typically involve round or near-round objects moving across a surface with minimal friction, where rotational cues are subtle or intermittent.
For this study, we manually select a subset of 120 clips that received low inter-annotator agreement during annotation. For each clip, we analyze the predicted verb scores produced by models trained on 2D Image, 2D Trajectory, and 3D Trajectory inputs. Let and denote the predicted probabilities for clip i. We define a decision margin:
where values near zero indicate high ambiguity.
We find that the 2D Image model tends to rely heavily on visual appearance cues such as texture changes and shading, leading it to favor roll even when rotational motion is weak. In contrast, the 3D Trajectory model is more conservative, often predicting slide unless consistent angular velocity is present. The 2D Trajectory model exhibits intermediate behavior. These qualitative differences help explain the verb-specific trends reported earlier and illustrate how different modalities encode distinct semantic biases.
Table 7.
Average prediction scores for ambiguous slide/roll clips in the case study. Smaller indicates greater uncertainty.
Table 7.
Average prediction scores for ambiguous slide/roll clips in the case study. Smaller indicates greater uncertainty.
| Model | Avg. | Avg. | |
|---|---|---|---|
| 2D Image | 0.62 | 0.38 | 0.24 |
| 2D Trajectory | 0.54 | 0.46 | 0.08 |
| 3D Trajectory | 0.47 | 0.53 | 0.06 |
This case study underscores that similar aggregate performance can mask meaningful qualitative differences in how verb semantics are inferred, reinforcing the importance of fine-grained analysis.
5.14. Generalization to Unseen Motion Patterns
We next investigate how well representations learned from each modality generalize to motion patterns not observed during training. To simulate distribution shift, we construct a held-out test set in which object speeds, movement amplitudes, and surface inclinations differ systematically from those seen in the training data. Importantly, verb labels remain unchanged, ensuring that the task tests semantic generalization rather than label transfer.
Performance on this out-of-distribution (OOD) set is evaluated using micro mAP. All models exhibit some degradation relative to in-distribution evaluation, but the magnitude of the drop varies across modalities. Trajectory-based models show slightly better stability under changes in speed and scale, while image-based models generalize comparably well when visual appearance remains consistent.
Table 8.
Generalization performance under distribution shift in motion dynamics.
| Model | In-Dist. mAP | OOD mAP |
|---|---|---|
| 3D Trajectory | 84.2 | 79.6 |
| 2D Trajectory | 83.8 | 78.9 |
| 2D Image | 81.9 | 77.4 |
| 2D Image + 3D Trajectory | 85.0 | 80.7 |
These results suggest that explicit motion structure provides a modest advantage under distribution shift, although the gap remains limited. Once again, the differences are far smaller than might be expected given the disparity in perceptual fidelity between modalities.
5.15. Verb Co-Occurrence and Multi-Label Interaction Analysis
Finally, we examine how different modalities handle cases where multiple verbs co-occur within the same clip. Although annotations are binary per verb, many clips naturally instantiate more than one action (e.g., push and slide). We analyze co-occurrence prediction quality by measuring the consistency of predicted multi-verb sets relative to ground truth.
For each clip i, let denote the set of verbs with predicted probability above a fixed threshold . We compute a co-occurrence F1 score between predicted and true verb sets:
where is the gold verb set.
Across models, multi-label consistency scores are again highly similar. However, multimodal models combining image and trajectory inputs show slightly higher F1, indicating improved sensitivity to compound actions.
Table 9.
Multi-label verb co-occurrence consistency across modalities.
| Model | Co-occurrence F1 |
|---|---|
| 3D Trajectory | 0.71 |
| 2D Trajectory | 0.70 |
| 2D Image | 0.68 |
| 2D Image + 3D Trajectory | 0.74 |
This final experiment highlights a subtle but important advantage of multimodal fusion: while single-modality models suffice for isolated verb recognition, combining complementary cues can improve the modeling of complex, overlapping action semantics.
6. Discussion and Conclusion
The empirical evidence presented in this work calls into question a common assumption in multimodal and embodied language research: that increasingly realistic, high-dimensional, or physically faithful environment representations will necessarily yield superior language understanding. Through a comprehensive set of experiments and analyses, we observe that models grounded in 2D visual inputs are able to learn verb-level semantic representations that are broadly comparable to those learned from explicit 2D and 3D trajectory data. With the exception of a small number of carefully circumscribed cases, no modality consistently dominates, suggesting that verb semantics can be captured effectively even when the perceptual input is relatively impoverished.
Importantly, these findings should not be read as a rejection of embodied or 3D representations as a whole. The experimental setting considered in this study is intentionally constrained: the simulated environment is abstract, the physical interactions are simplified, and the verb inventory is limited in both size and semantic diversity. Under such conditions, it is plausible that many of the fine-grained distinctions afforded by richer spatial representations are either redundant or underutilized. Whether the apparent parity between 2D and 3D modalities persists in more complex environments—characterized by visual clutter, multi-agent interactions, social context, or long-horizon dynamics—remains an open and important question.
Taken together, our results point toward a more nuanced view of perceptual grounding for language. Rather than perceptual fidelity alone, it appears that learning objectives, inductive biases, and mechanisms of abstraction play a central role in shaping the quality of semantic representations. Temporal prediction and self-supervised sequence modeling, in particular, may encourage convergence toward similar latent structures across modalities, even when the underlying sensory signals differ substantially. Looking forward, future work should explore how these conclusions scale with model capacity, data diversity, and environmental complexity, and should further investigate when and how embodied representations provide unique advantages for grounding verb meaning in language.
References
- Bisk, Yonatan; Holtzman, Ari; Thomason, Jesse; Andreas, Jacob; Bengio, Yoshua; Chai, Joyce; Lapata, Mirella; Lazaridou, Angeliki; May, Jonathan; Nisnevich, Aleksandr; Pinto, Nicolas; Turian, Joseph. Experience grounds language. In Proceedings of the 2020 Conference on Empirical Methods in Natural Language Processing (EMNLP), Online, 2020; Association for Computational Linguistics; pp. pages 8718–8735. [Google Scholar]
- Deng, Jia; Dong, Wei; Socher, Richard; Li, Li-Jia; Li, Kai; Fei-Fei, Li. Imagenet: A large-scale hierarchical image database. 2009 IEEE conference on computer vision and pattern recognition, 2009; Ieee; pp. 248–255. [Google Scholar]
- Ebert, Dylan; Sun, Chen; Pavlick, Ellie. Do trajectories encode verb meaning? In Proceedings of the 2022 Conference of the North American Chapter of the Association for Computational Linguistics: Human Language Technologies, Seattle, United States, 2022; Association for Computational Linguistics; pp. pages 2860–2871. [Google Scholar]
- Gan, Chuang; Schwartz, Jeremy; Alter, Seth; Schrimpf, Martin; Traer, James; De Freitas, Julian; Kubilius, Jonas; Bhandwaldar, Abhishek; Haber, Nick; Sano, Megumi; et al. Threedworld: A platform for interactive multi-modal physical simulation. arXiv 2020, arXiv:2007.04954. [Google Scholar]
- Juliani, Arthur; Berges, Vincent-Pierre; Teng, Ervin; Cohen, Andrew; Harper, Jonathan; Elion, Chris; Goy, Chris; Gao, Yuan; Henry, Hunter; Mattar, Marwan; et al. Unity: A general platform for intelligent agents. arXiv 2018, arXiv:1809.02627. [Google Scholar]
- Pinker, Steven. The language instinct: How the mind creates language; Penguin UK, 2003. [Google Scholar]
- Puig, Xavier; Ra, Kevin; Boben, Marko; Li, Jiaman; Wang, Tingwu; Fidler, Sanja; Torralba, Antonio. Virtualhome: Simulating household activities via programs. In Proceedings of the IEEE Conference on Computer Vision and Pattern Recognition, 2018; pp. pages 8494–8502. [Google Scholar]
- Pustejovsky, James; Krishnaswamy, Nikhil. Generating simulations of motion events from verbal descriptions. arXiv 2016, arXiv:1610.01713. [Google Scholar] [CrossRef]
- Shridhar, Kumar; Jain, Harshil; Agarwal, Akshat; Kleyko, Denis. End to end binarized neural networks for text classification. Proceedings of SustaiNLP: Workshop on Simple and Efficient Natural Language Processing, Online, 2020; Association for Computational Linguistics; pp. pages 29–34. [Google Scholar]
- Sun, Chen; Myers, Austin; Vondrick, Carl; Murphy, Kevin; Schmid, Cordelia. Videobert: A joint model for video and language representation learning. arXiv 2019, arXiv:1904.01766. [Google Scholar] [CrossRef]
- Szegedy, Christian; Vanhoucke, Vincent; Ioffe, Sergey; Shlens, Jon; Wojna, Zbigniew. Rethinking the inception architecture for computer vision. In Proceedings of the IEEE conference on computer vision and pattern recognition, 2016; pp. pages 2818–2826. [Google Scholar]
- Yatskar, Mark; Zettlemoyer, Luke; Farhadi, Ali. Situation recognition: Visual semantic role labeling for image understanding. In Proceedings of the IEEE Conference on Computer Vision and Pattern Recognition (CVPR), 2016. [Google Scholar]
- Peters, Matthew; Neumann, Mark; Iyyer, Mohit; Gardner, Matt; Clark, Christopher; Lee, Kenton; Zettlemoyer, Luke. Deep contextualized word representations. In Proceedings of the 2018 Conference of the North American Chapter of the Association for Computational Linguistics: Human Language Technologies, 2018; Volume 1. [Google Scholar]
- Pires, Telmo; Schlinger, Eva; Garrette, Dan. How multilingual is multilingual BERT? In Proceedings of the 57th Annual Meeting of the Association for Computational Linguistics, 2019. [Google Scholar]
- Devlin, Jacob; Chang, Ming-Wei; Lee, Kenton; Toutanova, Kristina. BERT: Pre-training of Deep Bidirectional Transformers for Language Understanding. Proceedings of the 2019 Conference of the North American Chapter of the Association for Computational Linguistics: Human Language Technologies 2019, Volume 1, 4171–4186. [Google Scholar]
- Kaiser, Magdalena; Roy, Rishiraj Saha; Weikum, Gerhard. Reinforcement Learning from Reformulations In Conversational Question Answering over Knowledge Graphs. In Proceedings of the 44th International ACM SIGIR Conference on Research and Development in Information Retrieval, 2021; pp. 459–469. [Google Scholar]
- Lan, Yunshi; He, Gaole; Jiang, Jinhao; Jiang, Jing; Zhao, Wayne Xin; Wen, Ji-Rong. A Survey on Complex Knowledge Base Question Answering: Methods, Challenges and Solutions. In Proceedings of the Thirtieth International Joint Conference on Artificial Intelligence, IJCAI-21. International Joint Conferences on Artificial Intelligence Organization, 2021; Survey Track; pp. 4483–4491. [Google Scholar]
- Lan, Yunshi; Jiang, Jing. Modeling transitions of focal entities for conversational knowledge base question answering. In Proceedings of the 59th Annual Meeting of the Association for Computational Linguistics and the 11th International Joint Conference on Natural Language Processing, 2021; Volume 1. [Google Scholar]
- Lewis, Mike; Liu, Yinhan; Goyal, Naman; Ghazvininejad, Marjan; Mohamed, Abdelrahman; Levy, Omer; Stoyanov, Veselin; Zettlemoyer, Luke. BART: Denoising Sequence-to-Sequence Pre-training for Natural Language Generation, Translation, and Comprehension. In Proceedings of the 58th Annual Meeting of the Association for Computational Linguistics, 2020; pp. 7871–7880. [Google Scholar]
- Loshchilov, Ilya; Hutter, Frank. Decoupled Weight Decay Regularization. International Conference on Learning Representations, 2019. [Google Scholar]
- Zhang, Meishan; Fei, Hao; Wang, Bin; Wu, Shengqiong; Cao, Yixin; Li, Fei; Zhang, Min. Recognizing everything from all modalities at once: Grounded multimodal universal information extraction. In Findings of the Association for Computational Linguistics: ACL 2024; 2024. [Google Scholar]
- Wu, Shengqiong; Fei, Hao; Chua, Tat-Seng. Universal scene graph generation. In Proceedings of the CVPR, 2025. [Google Scholar]
- Wu, Shengqiong; Fei, Hao; Yang, Jingkang; Li, Xiangtai; Li, Juncheng; Zhang, Hanwang; Chua, Tat-seng. Learning 4d panoptic scene graph generation from rich 2d visual scene. In Proceedings of the CVPR, 2025. [Google Scholar]
- Wang, Yaoting; Wu, Shengqiong; Zhang, Yuecheng; Yan, Shuicheng; Liu, Ziwei; Luo, Jiebo; Fei, Hao. Multimodal chain-of-thought reasoning: A comprehensive survey. arXiv 2025, arXiv:2503.12605. [Google Scholar]
- Fei, Hao; Zhou, Yuan; Li, Juncheng; Li, Xiangtai; Xu, Qingshan; Li, Bobo; Wu, Shengqiong; Wang, Yaoting; Zhou, Junbao; Meng, Jiahao; Shi, Qingyu; Zhou, Zhiyuan; Shi, Liangtao; Gao, Minghe; Zhang, Daoan; Ge, Zhiqi; Wu, Weiming; Tang, Siliang; Pan, Kaihang; Ye, Yaobo; Yuan, Haobo; Zhang, Tao; Ju, Tianjie; Meng, Zixiang; Xu, Shilin; Jia, Liyu; Hu, Wentao; Luo, Meng; Luo, Jiebo; Chua, Tat-Seng; Yan, Shuicheng; Zhang, Hanwang. On path to multimodal generalist: General-level and general-bench. In Proceedings of the ICML, 2025. [Google Scholar]
- Li, Jian; Lu, Weiheng; Fei, Hao; Luo, Meng; Dai, Ming; Xia, Min; Jin, Yizhang; Gan, Zhenye; Qi, Ding; Fu, Chaoyou; et al. A survey on benchmarks of multimodal large language models. arXiv 2024, arXiv:2408.08632. [Google Scholar] [CrossRef]
- LeCun, Yann; Bengio, Yoshua; Hinton, Geoffrey. Deep learning. Nature 2015, 521, 436–444. [Google Scholar] [CrossRef] [PubMed]
- Yu, Dong; Deng, Li. Deep Learning: Methods and Applications . In NOW Publishers; May 2014; Available online: https://www.microsoft.com/en-us/research/publication/deep-learning-methods-and-applications/.
- Makita, Eric; Lenskiy, Artem. A movie genre prediction based on Multivariate Bernoulli model and genre correlations. arXiv 2016, arXiv:1604.08608. Available online: http://arxiv.org/abs/1604.08608. [CrossRef]
- Mao, Junhua; Xu, Wei; Yang, Yi; Wang, Jiang; Yuille, Alan L. Explain images with multimodal recurrent neural networks. arXiv 2014, arXiv:1410.1090. [Google Scholar] [CrossRef]
- Pei, Deli; Liu, Huaping; Liu, Yulong; Sun, Fuchun. Unsupervised multimodal feature learning for semantic image segmentation. In The 2013 International Joint Conference on Neural Networks (IJCNN); IEEE, aug 2013; pp. 1–6. Available online: http://ieeexplore.ieee.org/lpdocs/epic03/wrapper.htm?arnumber=6706748ISBN 978-1-4673-6129-3.
- Simonyan, Karen; Zisserman, Andrew. Very deep convolutional networks for large-scale image recognition. arXiv 2014, arXiv:1409.1556. [Google Scholar]
- Socher, Richard; Ganjoo, Milind; Manning, Christopher D; Ng, Andrew. Zero-Shot Learning Through Cross-Modal Transfer. In Advances in Neural Information Processing Systems 26; Burges, C J C, Bottou, L, Welling, M, Ghahramani, Z, Weinberger, K Q, Eds.; Curran Associates, Inc., 2013; pp. 935–943. Available online: http://papers.nips.cc/paper/5027-zero-shot-learning-through-cross-modal-transfer.pdf.
- Fei, Hao; Wu, Shengqiong; Zhang, Meishan; Zhang, Min; Chua, Tat-Seng; Yan, Shuicheng. Enhancing video-language representations with structural spatio-temporal alignment. IEEE Transactions on Pattern Analysis and Machine Intelligence, 2024a. [Google Scholar]
- Karpathy, A.; Fei-Fei, L. Deep visual-semantic alignments for generating image descriptions. TPAMI 2017, 39, 664–676. [Google Scholar] [CrossRef] [PubMed]
- Fei, Hao; Ren, Yafeng; Ji, Donghong. Retrofitting structure-aware transformer language model for end tasks. In Proceedings of the 2020 Conference on Empirical Methods in Natural Language Processing, 2020a; pp. pages 2151–2161. [Google Scholar]
- Wu, Shengqiong; Fei, Hao; Li, Fei; Zhang, Meishan; Liu, Yijiang; Teng, Chong; Ji, Donghong. Mastering the explicit opinion-role interaction: Syntax-aided neural transition system for unified opinion role labeling. In Proceedings of the Thirty-Sixth AAAI Conference on Artificial Intelligence, 2022; pp. 11513–11521. [Google Scholar]
- Shi, Wenxuan; Li, Fei; Li, Jingye; Fei, Hao; Ji, Donghong. Effective token graph modeling using a novel labeling strategy for structured sentiment analysis. Proceedings of the 60th Annual Meeting of the Association for Computational Linguistics 2022, Volume 1, pages 4232–4241. [Google Scholar]
- Fei, Hao; Zhang, Yue; Ren, Yafeng; Ji, Donghong. Latent emotion memory for multi-label emotion classification. In Proceedings of the AAAI Conference on Artificial Intelligence, 2020b; pp. pages 7692–7699. [Google Scholar]
- Wang, Fengqi; Li, Fei; Fei, Hao; Li, Jingye; Wu, Shengqiong; Su, Fangfang; Shi, Wenxuan; Ji, Donghong; Cai, Bo. Entity-centered cross-document relation extraction. In Proceedings of the 2022 Conference on Empirical Methods in Natural Language Processing, 2022; pp. pages 9871–9881. [Google Scholar]
- Zhuang, Ling; Fei, Hao; Hu, Po. Knowledge-enhanced event relation extraction via event ontology prompt. Inf. Fusion 2023, 100, 101919. [Google Scholar] [CrossRef]
- Yu, Adams Wei; Dohan, David; Luong, Minh-Thang; Zhao, Rui; Chen, Kai; Norouzi, Mohammad; Le, Quoc V. Qanet: Combining local convolution with global self-attention for reading comprehension. arXiv 2018, arXiv:1804.09541. [Google Scholar] [CrossRef]
- Wu, Shengqiong; Fei, Hao; Cao, Yixin; Bing, Lidong; Chua, Tat-Seng. Information screening whilst exploiting! multimodal relation extraction with feature denoising and multimodal topic modeling. arXiv 2023, arXiv:2305.11719. [Google Scholar] [CrossRef]
- Xu, Jundong; Fei, Hao; Pan, Liangming; Liu, Qian; Lee, Mong-Li; Hsu, Wynne. Faithful logical reasoning via symbolic chain-of-thought. arXiv 2024, arXiv:2405.18357. [Google Scholar] [CrossRef]
- Dunn, Matthew; Sagun, Levent; Higgins, Mike; Ugur Guney, V; Cirik, Volkan; Cho, Kyunghyun. SearchQA: A new Q&A dataset augmented with context from a search engine. arXiv 2017, arXiv:1704.05179. [Google Scholar]
- Fei, Hao; Wu, Shengqiong; Li, Jingye; Li, Bobo; Li, Fei; Qin, Libo; Zhang, Meishan; Zhang, Min; Chua, Tat-Seng. Lasuie: Unifying information extraction with latent adaptive structure-aware generative language model. In Proceedings of the Advances in Neural Information Processing Systems NeurIPS 2022, 2022a; pp. 15460–15475. [Google Scholar]
- Qiu, Guang; Liu, Bing; Bu, Jiajun; Chen, Chun. Opinion word expansion and target extraction through double propagation. Computational linguistics 2011, 37, 9–27. [Google Scholar] [CrossRef]
- Fei, Hao; Ren, Yafeng; Zhang, Yue; Ji, Donghong; Liang, Xiaohui. Enriching contextualized language model from knowledge graph for biomedical information extraction. Briefings in Bioinformatics 2021, 22. [Google Scholar] [CrossRef]
- Wu, Shengqiong; Fei, Hao; Ji, Wei; Chua, Tat-Seng. Cross2StrA: Unpaired cross-lingual image captioning with cross-lingual cross-modal structure-pivoted alignment. Proceedings of the 61st Annual Meeting of the Association for Computational Linguistics 2023b, Volume 1, 2593–2608. [Google Scholar]
- Li, Bobo; Fei, Hao; Li, Fei; Chua, Tat-seng; Ji, Donghong. Multimodal emotion-cause pair extraction with holistic interaction and label constraint. ACM Transactions on Multimedia Computing, Communications and Applications; 2024a. [Google Scholar]
- Li, Bobo; Fei, Hao; Li, Fei; Wu, Shengqiong; Liao, Lizi; Wei, Yinwei; Chua, Tat-Seng; Ji, Donghong. Revisiting conversation discourse for dialogue disentanglement. ACM Transactions on Information Systems 2025, 43, 1. [Google Scholar] [CrossRef]
- Li, Bobo; Fei, Hao; Li, Fei; Wu, Yuhan; Zhang, Jinsong; Wu, Shengqiong; Li, Jingye; Liu, Yijiang; Liao, Lizi; Chua, Tat-Seng; Ji, Donghong. DiaASQ: A Benchmark of Conversational Aspect-based Sentiment Quadruple Analysis. In Findings of the Association for Computational Linguistics: ACL 2023; 2023; pp. 13449–13467. [Google Scholar]
- Li, Bobo; Fei, Hao; Liao, Lizi; Zhao, Yu; Su, Fangfang; Li, Fei; Ji, Donghong. Harnessing holistic discourse features and triadic interaction for sentiment quadruple extraction in dialogues. Proceedings of the AAAI conference on artificial intelligence 2024b, 2024(38), 18462–18470. [Google Scholar] [CrossRef]
- Wu, Shengqiong; Fei, Hao; Pan, Liangming; Wang, William Yang; Yan, Shuicheng; Chua, Tat-Seng. Combating Multimodal LLM Hallucination via Bottom-Up Holistic Reasoning. Proceedings of the AAAI Conference on Artificial Intelligence 2025a, 2025(39), 8460–8468. [Google Scholar] [CrossRef]
- Wu, Shengqiong; Ye, Weicai; Wang, Jiahao; Liu, Quande; Wang, Xintao; Wan, Pengfei; Zhang, Di; Gai, Kun; Yan, Shuicheng; Fei, Hao; et al. Any2caption: Interpreting any condition to caption for controllable video generation. arXiv 2025b, arXiv:2503.24379. [Google Scholar]
- Zhang, Han; Meng, Zixiang; Luo, Meng; Han, Hong; Liao, Lizi; Cambria, Erik; Fei, Hao. Towards multimodal empathetic response generation: A rich text-speech-vision avatar-based benchmark. In Proceedings of the ACM on Web Conference 2025, 2025; pp. 2872–2881. [Google Scholar]
- Fei, Hao; Ren, Yafeng; Ji, Donghong. A tree-based neural network model for biomedical event trigger detection. Information Sciences 2020a, 512, 175. [Google Scholar] [CrossRef]
- Fei, Hao; Ren, Yafeng; Ji, Donghong. Dispatched attention with multi-task learning for nested mention recognition. Information Sciences 2020b, 513, 241. [Google Scholar] [CrossRef]
- Fei, Hao; Zhang, Yue; Ren, Yafeng; Ji, Donghong. 2021, A span-graph neural model for overlapping entity relation extraction in biomedical texts. Bioinformatics 2021, 37, 1581. [Google Scholar] [CrossRef]
- Zhao, Yu; Fei, Hao; Wu, Shengqiong; Zhang, Meishan; Zhang, Min; Chua, Tat-seng. Grammar induction from visual, speech and text. Artificial Intelligence 2025, 341, 104306. [Google Scholar] [CrossRef]
- Rajpurkar, Pranav; Zhang, Jian; Lopyrev, Konstantin; Liang, Percy. Squad: 100,000+ questions for machine comprehension of text. arXiv 2016, arXiv:1606.05250. [Google Scholar]
- Fei, Hao; Li, Fei; Li, Bobo; Ji, Donghong. Encoder-decoder based unified semantic role labeling with label-aware syntax. In Proceedings of the AAAI conference on artificial intelligence, 2021a; pp. pages 12794–12802. [Google Scholar]
- Kingma, D. P.; Ba, J. Adam: A method for stochastic optimization. ICLR, 2015. [Google Scholar]
- Fei, Hao; Wu, Shengqiong; Ren, Yafeng; Li, Fei; Ji, Donghong. Better combine them together! integrating syntactic constituency and dependency representations for semantic role labeling. In Findings of the Association for Computational Linguistics: ACL-IJCNLP 2021; 2021b; pp. pages 549–559. [Google Scholar]
- Papineni, K.; Roukos, S.; Ward, T.; Zhu, W. Bleu: a method for automatic evaluation of machine translation. ACL 2002, 311–318. [Google Scholar]
- Fei, Hao; Li, Bobo; Liu, Qian; Bing, Lidong; Li, Fei; Chua, Tat-Seng. Reasoning implicit sentiment with chain-of-thought prompting. arXiv 2023, arXiv:2305.11255. [Google Scholar]
- Devlin, Jacob; Chang, Ming-Wei; Lee, Kenton; Toutanova, Kristina. BERT: Pre-training of deep bidirectional transformers for language understanding. In Proceedings of the 2019 Conference of the North American Chapter of the Association for Computational Linguistics: Human Language Technologies, Minneapolis, Minnesota, June 2019; Association for Computational Linguistics; Volume 1, pp. pages 4171–4186. Available online: https://aclanthology.org/N19-1423.
- Wu, Shengqiong; Fei, Hao; Qu, Leigang; Ji, Wei; Chua, Tat-Seng. Next-gpt: Any-to-any multimodal llm. abs/2309.05519; CoRR. 2023c. [Google Scholar]
- Li, Qimai; Han, Zhichao; Wu, Xiao-Ming. Deeper insights into graph convolutional networks for semi-supervised learning. Thirty-Second AAAI Conference on Artificial Intelligence, 2018. [Google Scholar]
- Fei, Hao; Wu, Shengqiong; Ji, Wei; Zhang, Hanwang; Zhang, Meishan; Lee, Mong-Li; Hsu, Wynne. Video-of-thought: Step-by-step video reasoning from perception to cognition. In Proceedings of the International Conference on Machine Learning, 2024b. [Google Scholar]
- Jain, Naman; Jain, Pranjali; Kayal, Pratik; Sahit, Jayakrishna; Pachpande, Soham; Choudhari, Jayesh; et al. Agribot: agriculture-specific question answer system. In IndiaRxiv; 2019. [Google Scholar]
- Fei, Hao; Wu, Shengqiong; Ji, Wei; Zhang, Hanwang; Chua, Tat-Seng. Dysen-vdm: Empowering dynamics-aware text-to-video diffusion with llms. In Proceedings of the IEEE/CVF Conference on Computer Vision and Pattern Recognition, 2024c; pp. pages 7641–7653. [Google Scholar]
- Momaya, Mihir; Khanna, Anjnya; Sadavarte, Jessica; Sankhe, Manoj. Krushi–the farmer chatbot. 2021 International Conference on Communication information and Computing Technology (ICCICT), 2021; IEEE; pp. 1–6. [Google Scholar]
- Fei, Hao; Li, Fei; Li, Chenliang; Wu, Shengqiong; Li, Jingye; Ji, Donghong. Inheriting the wisdom of predecessors: A multiplex cascade framework for unified aspect-based sentiment analysis. In Proceedings of the Thirty-First International Joint Conference on Artificial Intelligence, IJCAI, 2022b; pp. pages 4096–4103. [Google Scholar]
- Wu, Shengqiong; Fei, Hao; Ren, Yafeng; Ji, Donghong; Li, Jingye. Learn from syntax: Improving pair-wise aspect and opinion terms extraction with rich syntactic knowledge. In Proceedings of the Thirtieth International Joint Conference on Artificial Intelligence, 2021; pp. pages 3957–3963. [Google Scholar]
- Li, Bobo; Fei, Hao; Liao, Lizi; Zhao, Yu; Teng, Chong; Chua, Tat-Seng; Ji, Donghong; Li, Fei. Revisiting disentanglement and fusion on modality and context in conversational multimodal emotion recognition. In Proceedings of the 31st ACM International Conference on Multimedia, MM, 2023; pp. 5923–5934. [Google Scholar]
- Fei, Hao; Liu, Qian; Zhang, Meishan; Zhang, Min; Chua, Tat-Seng. Scene graph as pivoting: Inference-time image-free unsupervised multimodal machine translation with visual scene hallucination. Proceedings of the 61st Annual Meeting of the Association for Computational Linguistics 2023b, Volume 1, 5980–5994. [Google Scholar]
- Banerjee, S.; Lavie, A. METEOR: an automatic metric for MT evaluation with improved correlation with human judgments. IEEMMT 2005, 65–72. [Google Scholar]
- Fei, Hao; Wu, Shengqiong; Zhang, Hanwang; Chua, Tat-Seng; Yan, Shuicheng. Vitron: A unified pixel-level vision llm for understanding, generating, segmenting, editing. In Proceedings of the Advances in Neural Information Processing Systems, NeurIPS 2024, 2024d. [Google Scholar]
- Chen, Abbott; Liu, Chai. Intelligent commerce facilitates education technology: The platform and chatbot for the taiwan agriculture service. International Journal of e-Education, e-Business, e-Management and e-Learning 2021, 11, 1–10. [Google Scholar] [CrossRef]
- Wu, Shengqiong; Fei, Hao; Li, Xiangtai; Ji, Jiayi; Zhang, Hanwang; Chua, Tat-Seng; Yan, Shuicheng. Towards semantic equivalence of tokenization in multimodal llm. arXiv 2024, arXiv:2406.05127. [Google Scholar] [CrossRef]
- Li, Jingye; Xu, Kang; Li, Fei; Fei, Hao; Ren, Yafeng; Ji, Donghong. MRN: A locally and globally mention-based reasoning network for document-level relation extraction. In Findings of the Association for Computational Linguistics: ACL-IJCNLP 2021; 2021; pp. pages 1359–1370. [Google Scholar]
- Fei, Hao; Wu, Shengqiong; Ren, Yafeng; Zhang, Meishan. Matching structure for dual learning. In Proceedings of the International Conference on Machine Learning, ICML, 2022c; pp. pages 6373–6391. [Google Scholar]
- Cao, Hu; Li, Jingye; Su, Fangfang; Li, Fei; Fei, Hao; Wu, Shengqiong; Li, Bobo; Zhao, Liang; Ji, Donghong. OneEE: A one-stage framework for fast overlapping and nested event extraction. In Proceedings of the 29th International Conference on Computational Linguistics, 2022; pp. pages 1953–1964. [Google Scholar]
- Gaddy Tende, Isakwisa; Aburada, Kentaro; Yamaba, Hisaaki; Katayama, Tetsuro; Okazaki, Naonobu. Proposal for a crop protection information system for rural farmers in tanzania. Agronomy 2021, 11, 2411. [Google Scholar] [CrossRef]
- Fei, Hao; Ren, Yafeng; Ji, Donghong. Boundaries and edges rethinking: An end-to-end neural model for overlapping entity relation extraction. Information Processing & Management 2020, 57, 102311. [Google Scholar]
- Li, Jingye; Fei, Hao; Liu, Jiang; Wu, Shengqiong; Zhang, Meishan; Teng, Chong; Ji, Donghong; Li, Fei. Unified named entity recognition as word-word relation classification. In Proceedings of the AAAI Conference on Artificial Intelligence, 2022; pp. pages 10965–10973. [Google Scholar]
- Jain, Mohit; Kumar, Pratyush; Bhansali, Ishita; Liao, Q Vera; Truong, Khai; Patel, Shwetak. Farmchat: a conversational agent to answer farmer queries. Proceedings of the ACM on Interactive, Mobile, Wearable and Ubiquitous Technologies 2018, 2, 1–22. [Google Scholar] [CrossRef]
- Wu, Shengqiong; Fei, Hao; Zhang, Hanwang; Chua, Tat-Seng. Imagine that! abstract-to-intricate text-to-image synthesis with scene graph hallucination diffusion. In Proceedings of the 37th International Conference on Neural Information Processing Systems, 2023d; pp. pages 79240–79259. [Google Scholar]
- Anderson, P.; Fernando, B.; Johnson, M.; Gould, S. SPICE: semantic propositional image caption evaluation. ECCV 2016, 382–398. [Google Scholar]
- Fei, Hao; Chua, Tat-Seng; Li, Chenliang; Ji, Donghong; Zhang, Meishan; Ren, Yafeng. On the robustness of aspect-based sentiment analysis: Rethinking model, data, and training. ACM Transactions on Information Systems 2023, 41, 32. [Google Scholar] [CrossRef]
- Zhao, Yu; Fei, Hao; Cao, Yixin; Li, Bobo; Zhang, Meishan; Wei, Jianguo; Zhang, Min; Chua, Tat-Seng. Constructing holistic spatio-temporal scene graph for video semantic role labeling. In Proceedings of the 31st ACM International Conference on Multimedia MM, 2023a; pp. pages 5281–5291. [Google Scholar]
- Wu, Shengqiong; Fei, Hao; Cao, Yixin; Bing, Lidong; Chua, Tat-Seng. Information screening whilst exploiting! multimodal relation extraction with feature denoising and multimodal topic modeling. Proceedings of the 61st Annual Meeting of the Association for Computational Linguistics 2023e, Volume 1, pages 14734–14751. [Google Scholar]
- Fei, Hao; Ren, Yafeng; Zhang, Yue; Ji, Donghong. Nonautoregressive encoder-decoder neural framework for end-to-end aspect-based sentiment triplet extraction. IEEE Transactions on Neural Networks and Learning Systems 2023, 34, 5544–5556. [Google Scholar] [CrossRef] [PubMed]
- Xu, Kelvin; Ba, Jimmy; Kiros, Ryan; Cho, Kyunghyun; Courville, Aaron; Salakhutdinov, Ruslan; Zemel, Richard S; Bengio, Yoshua. Show, attend and tell: Neural image caption generation with visual attention. arXiv 2015, arXiv:1502.03044. [Google Scholar]
- Yuksel, Seniha Esen; Wilson, Joseph N; Gader, Paul D. Twenty years of mixture of experts. IEEE transactions on neural networks and learning systems 2012, 23, 1177–1193. [Google Scholar] [CrossRef]
- Arora, Sanjeev; Liang, Yingyu; Ma, Tengyu. A simple but tough-to-beat baseline for sentence embeddings. ICLR, 2017. [Google Scholar]
Table 2.
Mean Average Precision (mAP) scores with 95% confidence intervals for fall and roll, the two verbs exhibiting statistically significant modality-dependent differences.
Table 2.
Mean Average Precision (mAP) scores with 95% confidence intervals for fall and roll, the two verbs exhibiting statistically significant modality-dependent differences.
| Fall | |
|---|---|
| Model | mAP (%) |
| Random | 27.31 |
| 3D Trajectory | 97.02 |
| 2D Trajectory | 95.88 |
| 2D Image | 88.14 |
| Roll | |
| Model | mAP (%) |
| Random | 42.01 |
| 3D Trajectory | 61.27 |
| 2D Trajectory | 61.84 |
| 2D Image | 71.92 |
Table 3.
Mean Squared Error (MSE) on the 3D object position probing task. Lower values indicate better reconstruction accuracy.
Table 3.
Mean Squared Error (MSE) on the 3D object position probing task. Lower values indicate better reconstruction accuracy.
| Model | MSE |
|---|---|
| Random | 0.4027 |
| 3D Trajectory | 0.0098 |
| 2D Trajectory | 0.0396 |
| 2D Image | 0.0812 |
| 2D Image + 2D Trajectory | 0.0274 |
Disclaimer/Publisher’s Note: The statements, opinions and data contained in all publications are solely those of the individual author(s) and contributor(s) and not of MDPI and/or the editor(s). MDPI and/or the editor(s) disclaim responsibility for any injury to people or property resulting from any ideas, methods, instructions or products referred to in the content. |
© 2025 by the authors. Licensee MDPI, Basel, Switzerland. This article is an open access article distributed under the terms and conditions of the Creative Commons Attribution (CC BY) license (http://creativecommons.org/licenses/by/4.0/).
Copyright: This open access article is published under a Creative Commons CC BY 4.0 license, which permit the free download, distribution, and reuse, provided that the author and preprint are cited in any reuse.


