
Submitted:
18 December 2025
Posted:
22 December 2025
You are already at the latest version
Abstract
Hydraulic redistribution (HR) in plants facilitates bidirectional water transport through the vascular system in response to soil water potential gradients, enabling water movement from deeper to shallower soil layers or vice versa, with implications for ecological facilitation. This study aimed to evaluate the efficacy of high-precision weighing lysimeters in detecting HR in olive (Olea europaea L.) using a split-root experimental setup with potted trees. Sixteen pots, each containing half of a plant's root system, were independently monitored for mass changes to quantify water transfer between irrigated and water-stressed compartments. The purposedly built precision lysimeter array effectively isolated weights despite mechanical connections between pot pairs. Results demonstrated measurable water redistribution via roots from irrigated to dry pots and highlighted the potential of the lysimeters for precise quantification of plant-mediated water dynamics. It was observed that water transfer intensity peaked shortly after irrigation and diminished over time, with pronounced effects observed during nocturnal periods or cloudy humid daily conditions. These findings confirm previous data observed with reverse flow sap flow sensors and advance understanding of HR in olive agricultural systems.
Keywords:
plant water stress
; Olea europea
; hydraulic lift
; load cells
; precision lysimeters
1. Introduction
There is extensive experimental evidence [1,2], that deep-rooted plants can transport water from deep soil or groundwater to roots in the superficial layers, or vice versa, in response to water-potential gradients — that is, using the same bidirectional hydraulic mechanism operating in the soil–root complex, but with much less resistance. This mechanism is usually called hydraulic redistribution (HR). It has also been demonstrated (e.g., using chemical tracers), that water can be transported from superficial roots to the surrounding soil and other plants, via a process whose consequences have been discussed as ecological facilitation [2,3,4,5,6]. The importance of this mechanism and its practical implications for society has been discussed by [7].
In climates with rainy winters but hot, dry summers (Mediterranean-type climates, e.g., Csa or Csb Köppen classes), the lowest water potential during the day is normally in the atmosphere but, at night, it is common for the lowest potential to be in the uppermost soil layers. In these climates, deep-rooted plants — which are more resilient to summer drought — can access water in deeper layers. However, during very wet and rainy winters, it is energetically advantageous for plants to exploit water in the superficial layers, where nutrients are also more abundant (e.g., [2]). This requires keeping those superficial roots alive throughout the summer dry period. In the case of nocturnal HR — that is, passive water transport through the plant from deeper zones with more favorable water potential (closer to zero) to superficial zones with much lower potential — this water not only keeps the superficial root system functional. It supports some daytime transpiration from those superficial roots, thereby serving as a vehicle for nutrients present in the upper soil layers.
Consequently, in late Summer, superficial roots can exhibit water flow in opposite directions with a circadian oscillation that schematically can be described as follows: 1) at night → negative flow (receiving water from deep roots), direction plant → soil; 2) during the day (or part of the day) → opposite direction (positive flow), soil → shoot. However, this dynamic, which reaches its greatest expression at the end of the summer dry season, can be reversed at the beginning of the rainy season. Observations in a bigger scale and for large groups of plants were made by several authors [8,9,10]. The analysis across climates by [9] suggests that the higher rates of HR occur in Mediterranean climates.
A pioneering study in cork oak trees (Quercus suber) (2002-2003)[11] and later on olive trees (Olea europaea) (2010–2012), one intensive and irrigated, the other traditional and rain-fed, employing bidirectional sap flow sensors within root systems, alongside complementary methodologies ([12,13,14]), has elucidated the importance and dynamics of this adaptative mechanism in coping with conditions of pronounced water deficit.
Apparently, superficial roots showed the highest flow densities after rainfall periods, whereas in summer they recorded low or even negative values for much of the day. In contrast, roots shown to grow downward exhibited low flow densities during the winter rainy season and comparatively high densities during periods of water scarcity. Even in the deficit-irrigated drip-irrigated olive grove, HR was observed — albeit discreetly — between roots along the irrigated row and roots that spread transversely into the inter-row space (unpublished data, Ferreira), as observed also by other authors (e.g., [2]).
The methods used were: (1) temperature-field deformation technique [15,16,17], which allows observation of bidirectional flows, providing relevant qualitative information and an alternative technique (2), with greater quantification capacity, the calibrated average-gradient (CAG) heat-pulse method [18,19]) where a narrower averaging window for signal analysis was used to achieve a more linear calibration curve; Ferreira et al. (2018). Although some subtle aspects of data processing can lead to nuances (CAGALG, [20]), the mechanism was fully confirmed in its daily and seasonal dynamics and consistent with meteorological derived outcomes conditions as well as soil and plant water status presented in previous publications [14]. Reverse (negative) flow was observed during ~30 % of summer nights, increasing to about 5 % of total daily root flow before the first autumn rains and accounting, on average, for 2.6 % of total daily root flow [12].
Considering the overall study, it is possible to say that the plant survival strategy in face of water-scarcity is likely to be better explained by an increase in water uptake capacities than by a reduction in water use [21].
The HR mechanisms are especially important in regions with strong contrasts between water availability in periods of intense precipitation (orographic/Atlantic influence) and periods of extreme scarcity (summer). In Lisbon, for example, only ~5 % of annual precipitation falls in summer. Portugal is a paradigmatic case in this regard, being one of the European countries with the greatest contrasts between water availability and water demand. In general, it should be emphasized that forest, agroforestry (e.g., cork oak Quercus suber, holm oak Quercus rotundifolia), and traditional non-irrigated agricultural systems such as olive (Olea europaea), grapevine (Vitis vinifera), and various other minor crops occupy vast areas of the territory in Mediterranean ecosystems of high environmental value, representative of southwestern Europe. In non-irrigated woody plants, natural deep rooting ensures survival, but maintaining synergy between the superficial and deep root systems makes plants relatively independent of rainfall patterns. This synergy can even extend to associated herbaceous species, as referred above and was shown for olive by [22]. This is relevant for the understanding of water use by mixed stands, where trees and herbaceous share the same space, as in landscaping. Improving the knowledge on water redistribution in olive trees can inform irrigation practices, such as partial-root zone drying and regulated deficit irrigation, which involve alternating watering between different root zones to enhance water stress resilience [23].
To our best knowledge, there are no studies addressing HR using precision mass balance. This is the first time an attempt was made, through a split-root system linked to weighing lysimeters. Experiments with split-root systems have shown that olive trees can maintain growth and physiological functions even when only part of the root system is watered. In these setups, one half of the root system receives full watering while the other half receives partial watering, demonstrating stress responses [24]. However, there was no quantification of mass transfer.
The main aim of this work is to detect if an array of high precision lysimeters can detect water redistribution via roots in olive, using an experimental set up with potted trees, using a split-root system.
2. Materials and Methods
2.1. Study Location and Plants Characterization and Preparation
The experiments were developed in a greenhouse at Instituto Superior de Agronomia, from the University of Lisbon, Portugal (38°42′28.18″ N, 9°11′7.5″ W).
In March 2019, eight young olive trees (Olea europaea cv. Cobrançosa) were acquired, selected for their uniform vigor and compact size, which allowed installation in precision weighing lysimeters with a split-root system.
The plants’ trunk diameter was approximately 10 mm. Average leaf area (LA) per plant was estimated to be 0.3 m2 by both counting the leaves (750 leaves per tree) and relating the stem diameter with leaf area, using the allometric relationships studied by [25]. This procedure yielded an area of 0.3 m2 per tree.
The root system of each plant was divided between two pots (A and B, Figure 1a and b) filled with a commercial substrate. A total of 16 pots (8 plants × 2 pots per plant) were used. Pot dimensions were 35 cm width, 35 cm height (approx. 25 L volume) and the pots were randomly distributed in the greenhouse (Fig. 3).
This root-splitting operation was carried out at the beginning of the vegetative growth period so that the plants could fully re-establish by October—a stage of the cycle considered suitable for conducting the trial in this species.
Each pot was installed on a platform, which in turn was positioned above load cells.
2.2. Climate Characterization or Environmental Conditions During the Experiment
According to the Köppen–Geiger climate classification [26], the study area has a warm temperate climate (Csa), with dry and hot summer and mild winter. For the exact location, average annual precipitation is about 700 mm, ca. 5% of which falls in summer and the remaining 95% distributed in the nine cooler months, a typical Mediterranean climate (https://www.ipma.pt/bin/file.data/climate-normal/cn_91-20_LISBOA_TAPADA.pdf). Indicative environmental conditions during the experimental period are presented in Fig. 2 and Table 1.
2.3. Irrigation Scheduling
Plants were maintained for several months after root division to ensure complete establishment, canopy development, and physiological stabilization, before the onset of the experimental treatments.
During the stabilization period, irrigation was supplied automatically by drip emitters until 4th October, under progressively increasing water deficit conditions. Throughout the subsequent experimental trial, irrigation was applied manually according to a partial root-zone drying (PRD) protocol, in which water was alternately delivered to only one of the two root compartments while the other was allowed to dry out.
Not all of the five irrigation events of October yielded usable data due to various disturbances at the experimental site. The results presented here correspond to two irrigation events applied exclusively to the B pots, as follows:
- 9 October at 17:30 legal time (500 mL), data analyzed over the 9–10 October period;
- 30 October at 12:09 (250 mL), data analyzed over the 30–31 October period.
In between there were three other irrigation events of 550 mL in total, per pot. Due to the lockdown periods associated with the COVID-19 pandemic, the experiment could not be continued as planned in the following year.
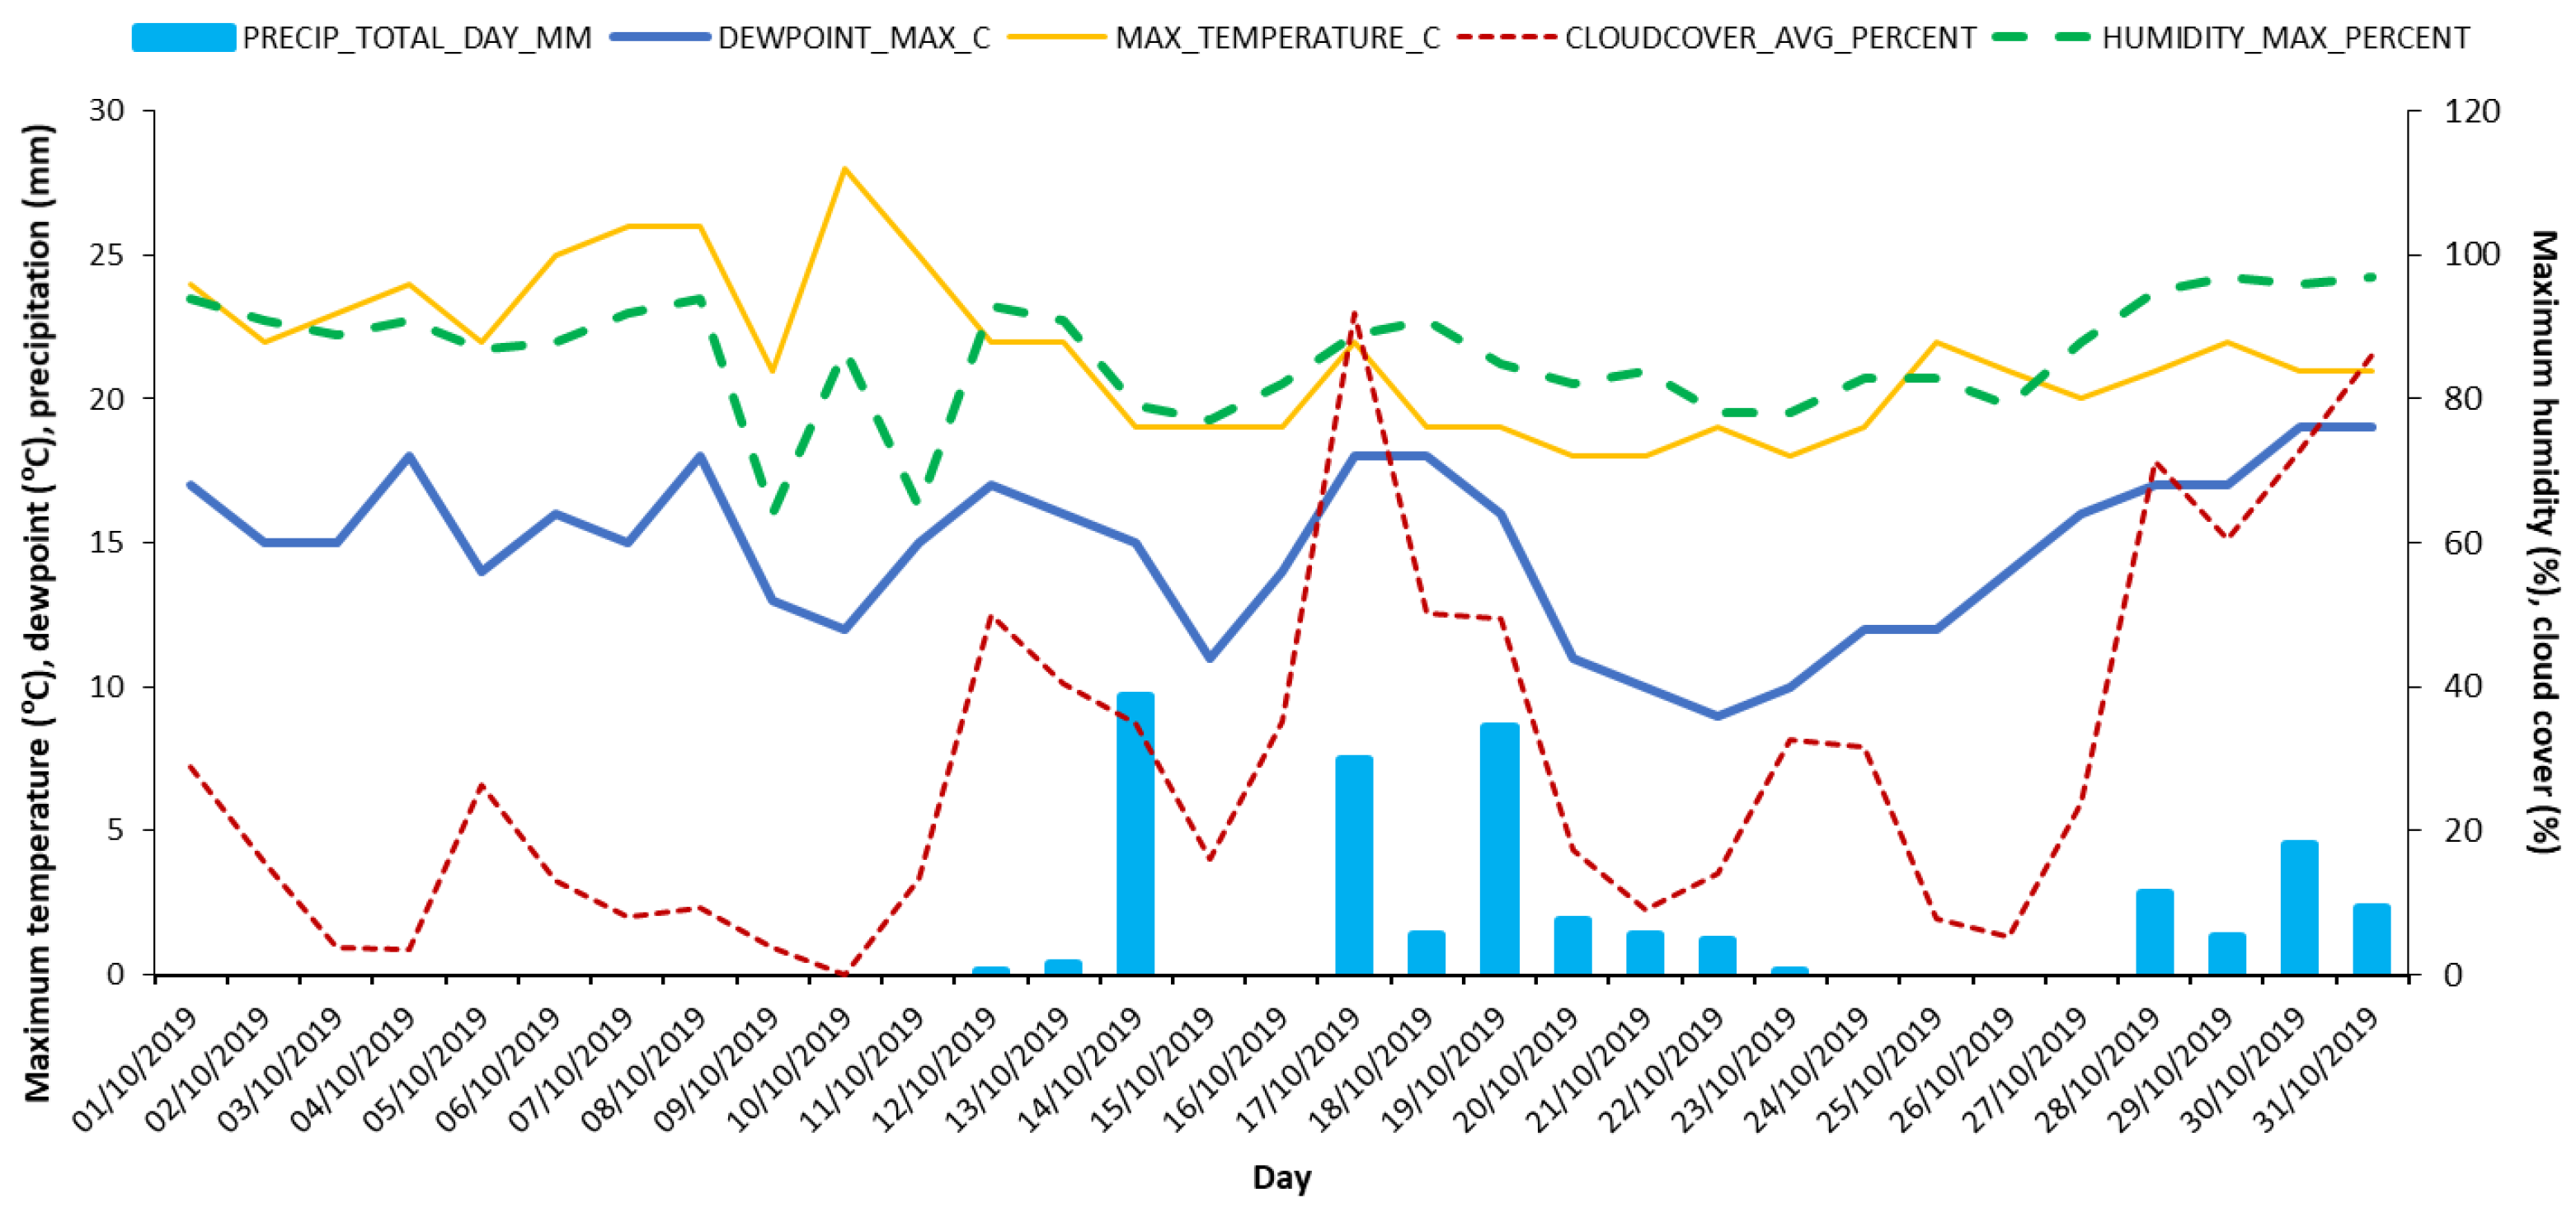
Figure 2.
Indicative data of daily precipitation (P), maximum dewpoint, maximum air temperature, cloud cover (%) and maximum relative humidity (%) for October 2019 in Lisbon, Portugal (source: weatherspark.com, AWS IPMA Lisboa-Gago Coutinho, at Humberto-Delgado-Airport).
Figure 2.
Indicative data of daily precipitation (P), maximum dewpoint, maximum air temperature, cloud cover (%) and maximum relative humidity (%) for October 2019 in Lisbon, Portugal (source: weatherspark.com, AWS IPMA Lisboa-Gago Coutinho, at Humberto-Delgado-Airport).
2.4. Precision Weighing Lysimeter Assemblage
Lysimeters were built using load cells (AP06 - Beijing True-Tec Co., Ltd) mounted in a wood frame (Figure 3). The platform–load cell assemblies were specifically designed for this experiment to ensure complete independence in the measurement of the mass of each pot, despite the fact that they were linked two-by-two through the mechanical connection at the base of each plant’s trunk (Fig. 2). The data were collected on a CR3000 datalogger (Campbell Scientific, Inc., Utah, USA) and stored every minute.
3. Results and Discussion
3.1. Time-Series Evolution of Water Transfer Processes After First Irrigation
Following the first irrigation of the B pots (17:30, October 9) there was a sudden change in their mass, corresponding to the volume applied (500 mL) suggesting a good functioning of the weighing system. But, more importantly, an increase in the total mass of the A pots was observed over a period of approximately 13 hours, accompanied by a decrease in the mass of the B pots (Figure 4a). This strongly suggests that there was a quantifiable movement of water from B to A pots, via roots, which is an important result.
The period with higher mass transfer rate was during the 13 hours after irrigation (Fig 4a). Afterwards, HR through the roots diminished or ceased. In fact, during the day the lower water potential would be in the atmosphere and no more in the soil-roots interface in pots A.
In some pairs of pots, the transfer was more intense than in others. For instance, between pairs of pots 1 and 6, mass of the two pots A increased on average about 0.1 kg for a period of about 10 hours (Fig. 4b) while the two pots B decreased about 0.1 kg, which corresponds to an overall rate of 10 g per hour. Considering all pots, this value was lower, as indicated below.
It is expected that evapotranspiration (ET) is part of the total mass transfer. Indeed, by summing up the mass of the 16 pots, a loss of weight is visible during the first hours after irrigation (from 17:30 to 21:00 h legal summer time, which was 15:45 to 19:15 solar time) (Figure 5a). This decrease is likely due to ET losses from leaves and soil surface from all pots and on average corresponded to 40 g per pot for such time period. The analysis for the following nocturnal period is useful, as the ET effect during this period is expected to be small, and doesn’t interfere with mass changes resulting from water redistribution between a pair of pots. Consequently, during the night, as observed in Figure 5a, the total pots’ weight became relatively stable.
The relationship between losses from pots B and gains of pots A (Fig. 5b) reinforces the evidence of water transfer between the two groups, with a good correspondence between opposite changes in both.
From 21:30 to 7:00 h of October 10, out of the 500 g of water received, Group B lost on average 40 g of water, while group A apparently gained 15 g more, likely due to night condensation (Fig 5b) which seemed to occur mainly in the dry pots, eventually due to higher temperature decrease at the surface (less water, less heat capacitance). Indeed, the total weight slightly increased during the night by the same 15 g (Fig 5a).
This group of results suggests the reliability of the experimental design.
3.2. Time-Series Evolution of Water Transfer Processes After Second Irrigation
The irrigation of October 30, at 12:09, on pots B was applied to soil with a much higher level of water stress then the one in October 9, as there was a decrease in the recorded weight throughout the period of the experiment (all October). The average pots mass decreased from 7.9 kg (Fig. 4b) before the irrigation of October 9 to 6.4 kg before the irrigation of October 30 (Figure 6a), in spite of other three other intermediate irrigations in between, as mentioned above. This confirms that the applied deficit irrigation did not fully compensate the water mass lost through ET, as intended.
Surprisingly the line for the afternoon of October 30 does not show a clear slope (Fig. 6a). This indicates reduced water use during that first afternoon, opposite to the sharp decrease of mass observed during the day 31.
As before, the change of mass in pots A was compared with the equivalent mass in pots B (Fig 6b) where only 7 pairs of pots were considered (one was not functioning well). It can be seen that when irrigation was applied to pots B, there was an increase in the mass of pots A over a period of 17 hours (up to the early morning of October 31) accompanied by a decrease in weight of pots B.
During this period, and as before, there is a negative correlation between the two data series. Mass changes are presented in Fig. 7a up to 6:00 in the morning. When the daylight hours of October 31 began, both groups of pots lose weight simultaneously, with a positive slope in the relationship between the masses, suggesting that during daylight October 31, the redistribution of water through the roots is highly reduced and both groups lose mass in parallel, due to ET (also clear from total mass loss in Fig. 6a). For the first night hours of October 31, the slope inverts again.
Figure 7 clearly indicates the progressive mass gain in pots A, coming from water redistribution from pots B, which attained about 65 g for the rest of October 30 and following night, corresponding to a similar mass loss of pots B. The loss for ET was about 31 g during the daylight hours of October 31; total gain (A pots) was the difference: 35 g.
Pots B constantly lose water up to the start of the second night, when water redistribution was highly reduced. This is because water losses provide water for redistribution with pots A and for ET, at a higher rate than pots A, since plants are not as stressed as the ones in pots A. During the night, average loss of pots B was 71 g and for the next hours 77 g for ET, the total loss being 148 g, out of the 250 g received in last irrigation.
Therefore, the total ET during October 31 would be 108 g, in contrast with the very low value of the proceeding afternoon. In a first glance, this indicates the need for comparative analysis of the available information on weather conditions of both days.
In fact, available data do not allow reliable estimation of ET inside the greenhouse. One can consider that the external conditions were different in relation to the previous days in high maximal humidity, maximal dew-point, cloud-cover (Fig. 2) and precipitation, so a period of high humidity and low radiation in general. Temperature was similar between the two days. The only important difference was on precipitation, which was higher during October 30. It is clear that the conditions, both the ones described and the reports from the IPMA services suggest a period of low ET. However, it is not clear that this difference in rain justifies the difference in ET rates of both days.
Another hypothesis that appears more interesting could be the reduced transpiration activity of irrigated pots, very soon after irrigation, when the lower water potential in the system is in the extremely dry soil, towards where water moves, rather than in the very humid atmosphere. Therefore, no important transpiration would occur, soil evaporation being also negligible or negative (condensation). Conversely, during the second day, the contrast of water status in both groups of pots would be less dramatic and more water would be moving to the atmosphere. As referred by [28] in a study with maize, in case of dry nights, the night-time transpiration and xylem refilling override the HR on a diurnal basis. The present situation is opposite to this, as air was almost saturated during the night.
3.3. Observed ET Rates Versus Estimates
A last step is to infer, from the limited knowledge and data available, which could be the ET expected loss during such days, in such specific conditions.
The ET rates can be obtained from the time change of the total mass of the all pots. The values observed were compared to approximative estimates of ET rates obtained using the leaf area of the young trees. In fact, to our knowledge, studies with olive trees in greenhouses are rare. We used data from studies in open field. Measurements during several years in an irrigated olive orchard [14] suggest ET well below 1 mm/day, and ET in relation to reference ET between 0.1 and 0.2, for this period of year (October to November). The authors indicate a leaf area index about 1 (m2 of leaves per m2 of total soil or social area of each plant) meaning that a limit value of 1 mm/day corresponds to 1 L/ m2 of leaves. As the pot plants are not in soil, the relationships were applied via leaf area of the leaves of each tree, evaluated as described above.
Besides, consulting reference ET data for Lisbon (ETo), it is possible to observe a value of 20.5 mm for the last 10-day period of October 2019 [27]. Using the average ETo for these 10 days and 0.1 to 0.2 as ET/ETo, ET of olive leaves in open air would be below 0.1 to 0.2 L/m2 (of leaves).
Consequently, a possibly reasonable estimate if these trees were in open air could be on average 30 to 60 g per day and per average tree in pots (for 0.3 m2 of leaves per tree). This rough estimation gives an order of magnitude, which is the same of the measures above during the October 31, 108 g. The value of 40 g for October 9, when temperature was higher, cloud cover less and no precipitation is also in the same order of magnitude since it refers only to the period after 17:30. Considering the application of 1050 g of water between October 9 and 30 morning, and the mass loss of 3000 g in this interval, the average ET is about 193 g per day and per pot, likely decreasing from the beginning of this period towards the end, due to increasing water stress and decreasing water demand of the atmosphere. If estimates are reliable, it could be inferred that ET was higher inside the greenhouse, in spite of the lack of significant convection.
4. Conclusions
In the present study, the water redistribution in olive between separated roots of the same plant (in A and B pots) was measured with weighted lysimeters: a quantifiable movement of water via roots, from irrigated pots (B) to pots where water status was very low (A) was observed.
The intensity of the transfer by HR decreases after its start following irrigation being especially apparent during the following night, when the rate attained 10 g per hour for some pots and was 40 g on average (n=8) for the night after October 9 and 65 g for the night of October 30. During a sunny day (October 9), the lower water potential would be in the atmosphere and root to shoot transfer process is dominant. Conversely, during a cloudy and rainy day after irrigation (October 30), HR still dominates in diurnal hours, being root-shoot transfer residual. After the first day of intensive HR, the root to shoot process dominates again with rates of ET of 108 g on average (October 31), taken from the time series of the total mass (all pots, n=16), which corresponds to 360 g/m2 of leaves.
The relationship between the mass of irrigated pots and mass of dry pots is in an inverse proportion in the night or in cloudy humid days, when HR dominates (Fig. 5 b) and in a direct proportion in the day, when ET dominates (Fig. 7).
The device used to measure each of the 16 pots showed to be effective in providing the weight of each half root+soil pot independently of the other half root+soil for the same plant, in spite of the mechanical link between them.
Author Contributions
Conceptualization, I.F., J.R. and F.S.; methodology, I.F., J.R. and F.S.; software, I.F., J.R. and F.S. and T.A.P.; validation, I.F., J.R., F.S. and T.A.P.; formal analysis, I.F., J.R., F.S. and T.A.P.; investigation, I.F., F.S. and J.R.; resources, I.F., J.R. and F.S..; data curation, I.F. writing—original draft preparation, I.F., J.R. and T.A.P.; writing—review and editing, I.F., J.R. and F.S. and T.A.P.; visualization, I.F., J.R., F.S. and T.A.P.; supervision, I.F.; project administration, I.F..; funding acquisition, I.F.. All authors have read and agreed to the published version of the manuscript.
Funding
This research was funded by project WASA - WAter Saving in Agriculture: technological developments for the sustainable management of limited water resources in the Mediterranean area (ERANETMED/0006/ WATER-13-109/2014, CE).
Data Availability Statement
The data presented in this study are available in the article, except for the unpublished data referring to horizontal redistribution in the field.
Acknowledgments
The authors acknowledge FCT—Fundação para a Ciência e a Tecnologia, I.P., under the project UIDB/04129/2025 of LEAF-Linking Landscape, Environment, Agriculture and Food, Research Unit; Sónia Lourenço for helping on preparation of the pots and irrigation scheduling.
Conflicts of Interest
The authors declare no conflicts of interest. The funders had no role in the design of this study; in the collection, analyses, or interpretation of data; in the writing of the manuscript; or in the decision to publish the results.
References
- Burgess, S.S.O.; Adams, M.A.; Turner, N.C.; Ong, C.K. The Redistribution of Soil Water by Tree Root Systems. Oecologia 1998, 115, 306–311. [Google Scholar] [CrossRef]
- Caldwell, M.M.; Dawson, T.E.; Richards, J.H. Hydraulic Lift: Consequences of Water Efflux from the Roots of Plants. Oecologia 1998, 113, 151–161. [Google Scholar] [CrossRef] [PubMed]
- Burgess, S.S.O. Can Hydraulic Redistribution Put Bread on Our Table? Plant Soil 2011, 341, 25–29. [Google Scholar] [CrossRef]
- Sekiya, N.; Araki, H.; Yano, K. Applying Hydraulic Lift in an Agroecosystem: Forage Plants with Shoots Removed Supply Water to Neighboring Vegetable Crops. Plant Soil 2011, 341, 39–50. [Google Scholar] [CrossRef]
- Hirota, I.; Sakuratani, T.; Sato, T.; Higuchi, H.; Nawata, E. A Split-Root Apparatus for Examining the Effects of Hydraulic Lift by Trees on the Water Status of Neighbouring Crops. Agroforestry Systems 2004, 60, 181–187. [Google Scholar] [CrossRef]
- Scholz, F.G.; Bucci, S.J.; Meinzer, F.C.; Goldstein, G. Maintenance of Root Function in Tropical Woody Species During Droughts: Hydraulic Redistribution, Refilling of Embolized Vessels, and Facilitation Between Plants. 2016, 227–241. [Google Scholar] [CrossRef] [PubMed]
- Alagele, S.M.; Jose, S.; Anderson, S.H.; Udawatta, R.P. Hydraulic Lift: Processes, Methods, and Practical Implications for Society. Agroforestry Systems 2021, 95, 641–657. [Google Scholar] [CrossRef]
- Zegada-Lizarazu, W.; Iijima, M. Hydrogen Stable Isotope Analysis of Water Acquisition Ability of Deep Roots and Hydraulic Lift in Sixteen Food Crop Species. Plant Prod Sci 2004, 7, 427–434. [Google Scholar] [CrossRef]
- Quijano, J.C.; Kumar, P. Numerical Simulations of Hydraulic Redistribution across Climates: The Role of the Root Hydraulic Conductivities. Water Resour Res 2015, 51, 8529–8550. [Google Scholar] [CrossRef]
- Yang, G.; Huang, L.; Shi, Y. Magnitude and Determinants of Plant Root Hydraulic Redistribution: A Global Synthesis Analysis. Front Plant Sci 2022, 13, 918585. [Google Scholar] [CrossRef]
- Nadezhdina, N.; Ferreira, M.I.; Silva, R.; Pacheco, C.A. Seasonal Variation of Water Uptake of a Quercus Suber Tree in Central Portugal. Plant Soil 2008, 305, 105–119. [Google Scholar] [CrossRef]
- Ferreira, M.I.; Green, S.; Conceição, N.; Fernández, J.E. Assessing Hydraulic Redistribution with the Compensated Average Gradient Heat-Pulse Method on Rain-Fed Olive Trees. Plant and Soil 2018, 425, 21–41. [Google Scholar] [CrossRef]
- Nadezhdina, N.; Ferreira, M.I.; Conceição, N.; Pacheco, C.A.; Häusler, M.; David, T.S. Water Uptake and Hydraulic Redistribution under a Seasonal Climate: Long-Term Study in a Rainfed Olive Orchard. Ecohydrology 2015, 8, 387–397. [Google Scholar] [CrossRef]
- Conceição, N.; Tezza, L.; Häusler, M.; Lourenço, S.; Pacheco, C.A.; Ferreira, M.I. Three Years of Monitoring Evapotranspiration Components and Crop and Stress Coefficients in a Deficit Irrigated Intensive Olive Orchard. Agric Water Manag 2017, 191, 138–152. [Google Scholar] [CrossRef]
- Nadezhdina, N.; Vandegehuchte, M.W.; Steppe, K. Sap Flux Density Measurements Based on the Heat Field Deformation Method. Trees 2012, 26, 1439–1448. [Google Scholar] [CrossRef]
- Nadezhdina, N. Revisiting the Heat Field Deformation (HFD) Method for Measuring Sap Flow. IForest 2018, 11, 118. [Google Scholar] [CrossRef]
- Ferreira, M.I.; Conceição, N.; David, T.S.; Nadezhdina, N. Role of Lignotuber versus Roots in the Water Supply of Rainfed Olives. Acta Hortic 2013, 991, 181–188. [Google Scholar] [CrossRef]
- Green, S.R.; Romero, R. Can We Improve Heat-Pulse to Measure Low and Reverse Flows. Acta Hortic 2012, 951, 19–30. [Google Scholar] [CrossRef]
- Green, S.; Clothier, B.; Perie, E. A Re-Analysis of Heat Pulse Theory across a Wide Range of Sap Flows. Acta Hortic 2009, 846, 95–104. [Google Scholar] [CrossRef]
- Siqueira, J.M.; Ferreira, M.I. Optimisation of CAG Technique: An Algorithm to Estimate Low and Reverse Sap Flow in Roots. Agric For Meteorol 2020, 294, 108129. [Google Scholar] [CrossRef]
- Ferreira, M.I. Oliveira, a Antiga Arte de Não Morrer de Fome Nem de Sede: Estudos No Baixo Alentejo. In Proceedings of the VIII Simpósio Nacional de Olivicultura; SPH: Santarém, portugal, 2020; p. 51. [Google Scholar]
- Lourenço, S. V.; Ferreira, M.I. Exploring Hydraulic Redistribution for Water Management in Gardens. Acta Hortic 2020, 1279, 97–101. [Google Scholar] [CrossRef]
- Aganchich, B.; Wahbi, S.; Yaakoubi, A.; El-Aououad, H.; Bota, J. Effect of Arbuscular Mycorrhizal Fungi Inoculation on Growth and Physiology Performance of Olive Tree under Regulated Deficit Irrigation and Partial Rootzone Drying. South African Journal of Botany 2022, 148, 1–10. [Google Scholar] [CrossRef]
- Polverigiani, S.; McCormack, M.L.; Eissenstat, D.M. Above-and below-Ground Responses to Soil Moisture Deficits in Olive. Acta Hortic 2011, 888, 183–190. [Google Scholar] [CrossRef]
- Häusler, M.; Ferreira, M.I.; Conceição, N. Assessment of Vegetation Parameters in Olive Trees in the Region of Alentejo: A Comparison of Direct and Indirect Methods. Acta Hortic 2014, 1038, 407–414. [Google Scholar] [CrossRef]
- Kottek, M.; Grieser, J.; Beck, C.; Rudolf, B.; Rubel, F. World Map of the Köppen-Geiger Climate Classification Updated. Meteorologische Zeitschrift 2006, 15, 259–263. [Google Scholar] [CrossRef] [PubMed]
- IPMA - Instituto Português do Mar e da Atmosfera, I.P. Boletim Meteorológico Para a Agricultura 1|13 2019.
- Thomas, A.; Yadav, B.K.; Šimůnek, J. Root Water Uptake under Heterogeneous Soil Moisture Conditions: An Experimental Study for Unraveling Compensatory Root Water Uptake and Hydraulic Redistribution. Plant and Soil 2020, 457, 421–435. [Google Scholar] [CrossRef]
Figure 1.
Schematic view of the experimental layout (a, left) and a photo of the overall experiment (b, right) with the 8 potted olive trees in 16 pots at the greenhouse, Lisbon, Portugal.
Figure 1.
Schematic view of the experimental layout (a, left) and a photo of the overall experiment (b, right) with the 8 potted olive trees in 16 pots at the greenhouse, Lisbon, Portugal.
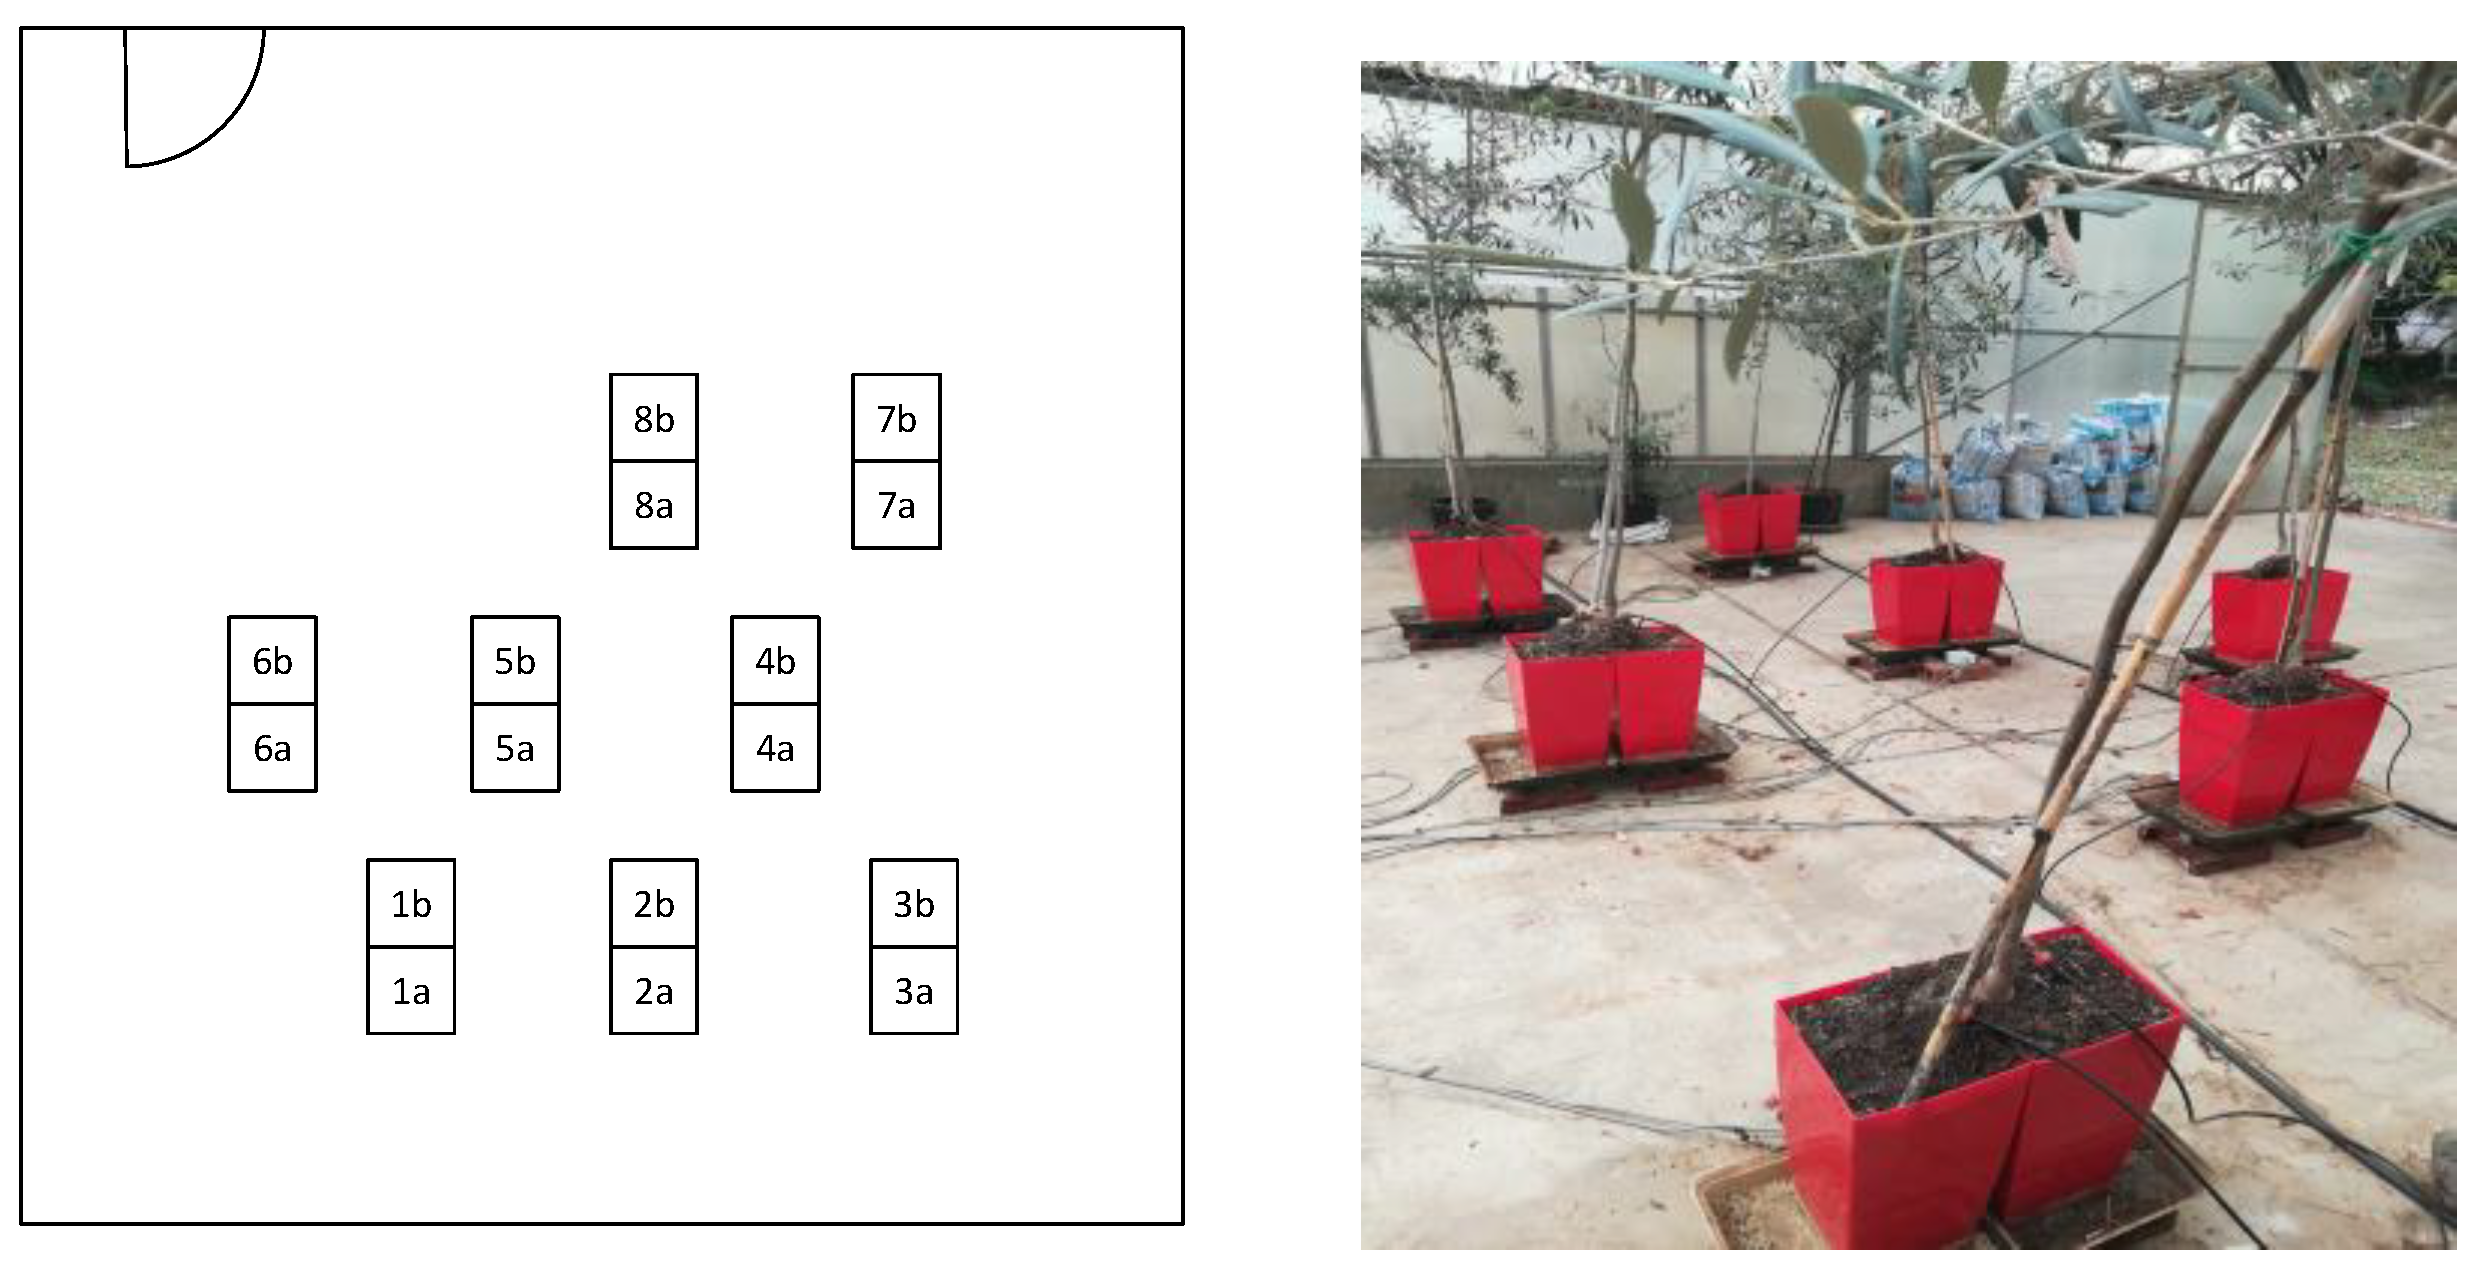
Figure 3.
Precision weighing lysimeters mounted in a platform with load cells.
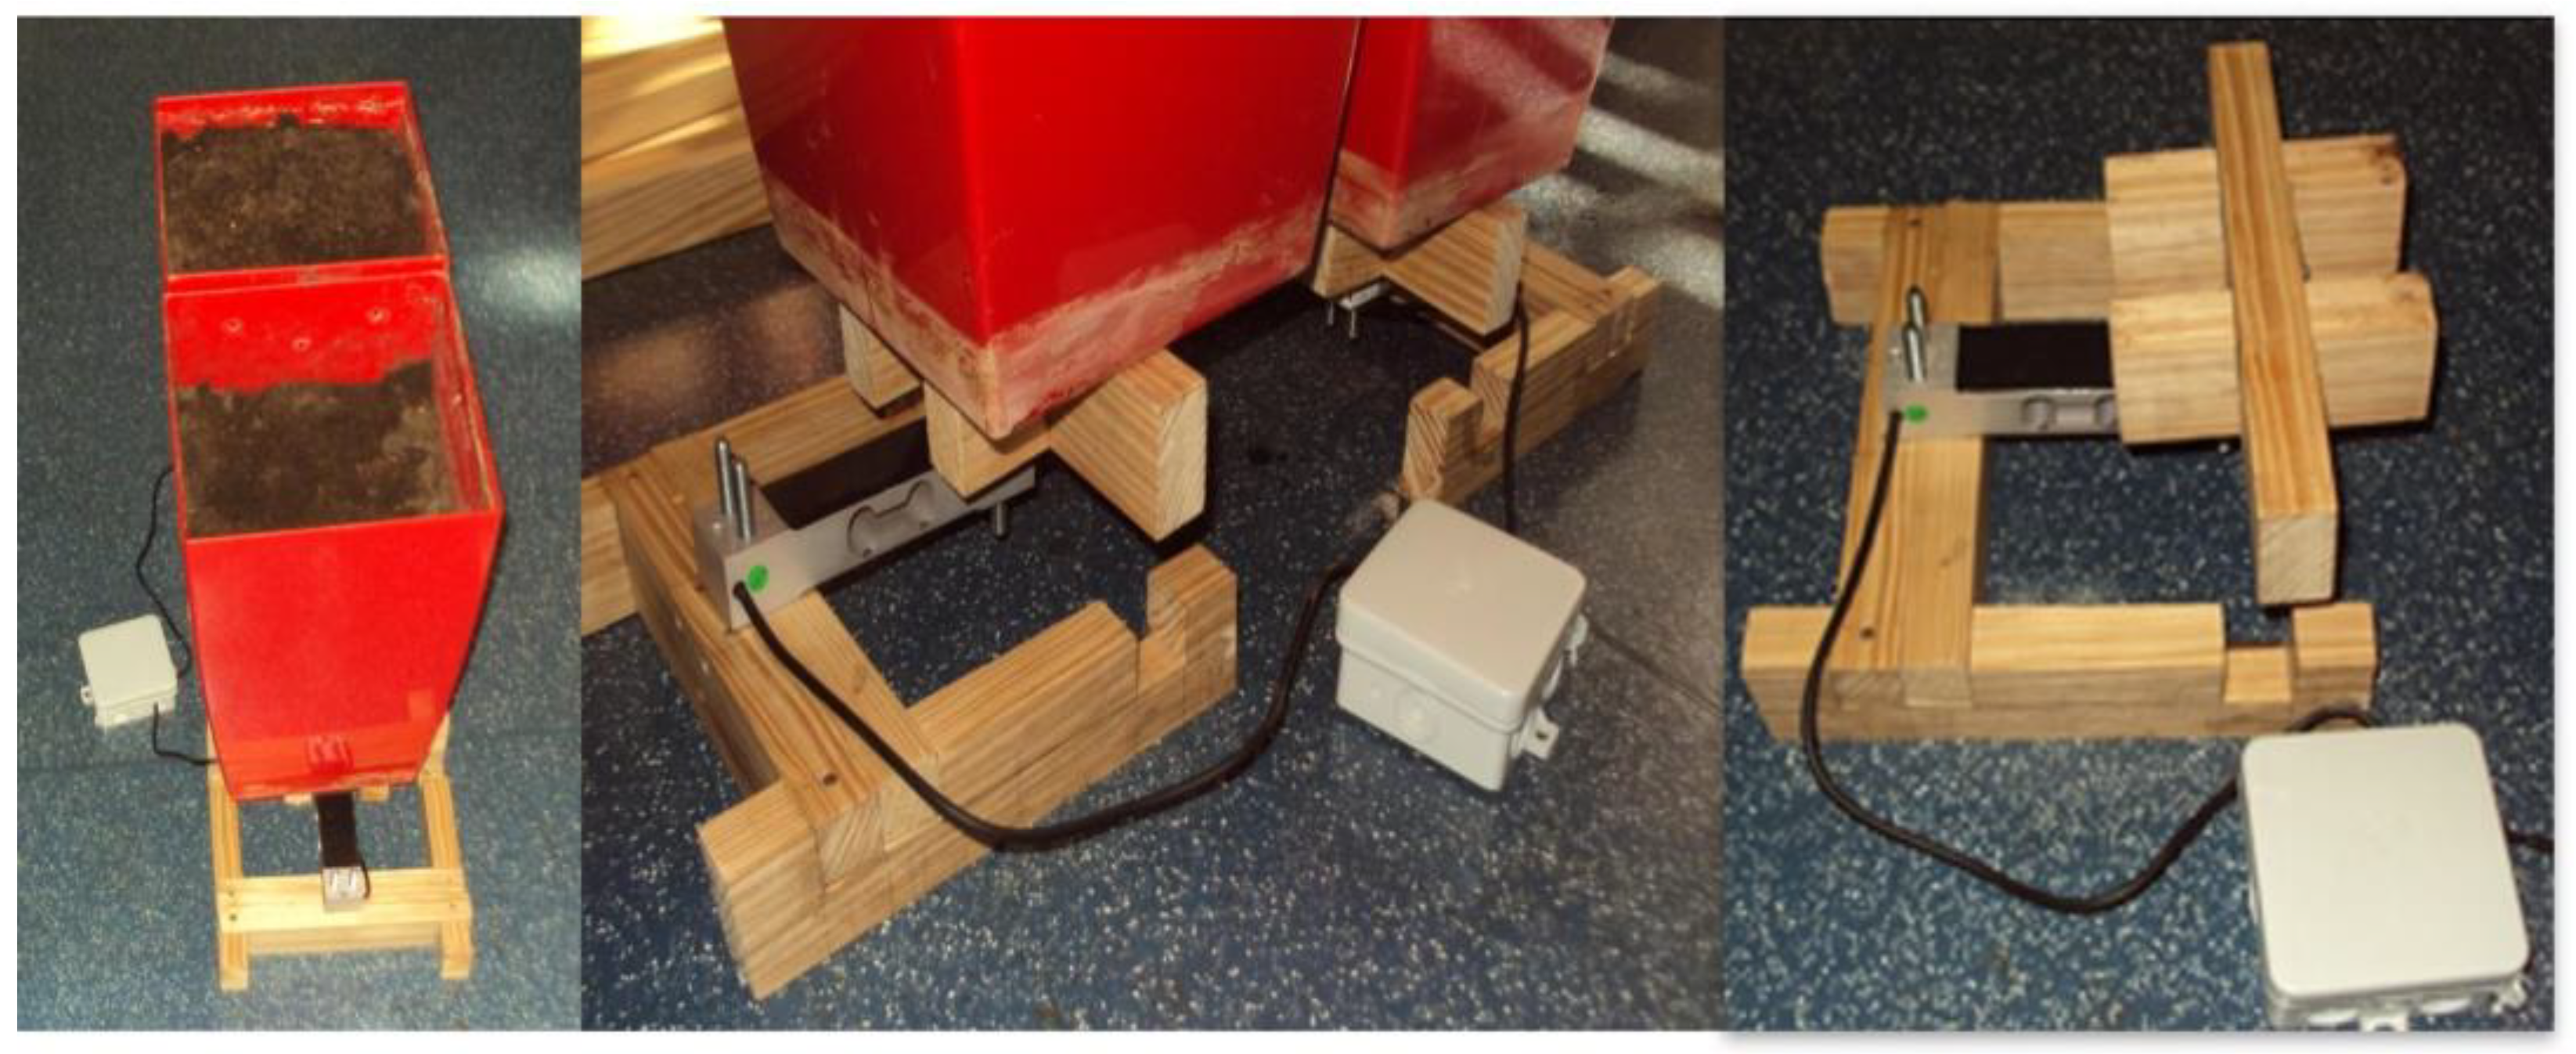
Figure 4.
Mass changes for A and B pots, after irrigation in pots B: average for all pots (a); average of pots 1 and 6 (b). Hour is legal summer time (1:45 later then solar time).
Figure 4.
Mass changes for A and B pots, after irrigation in pots B: average for all pots (a); average of pots 1 and 6 (b). Hour is legal summer time (1:45 later then solar time).
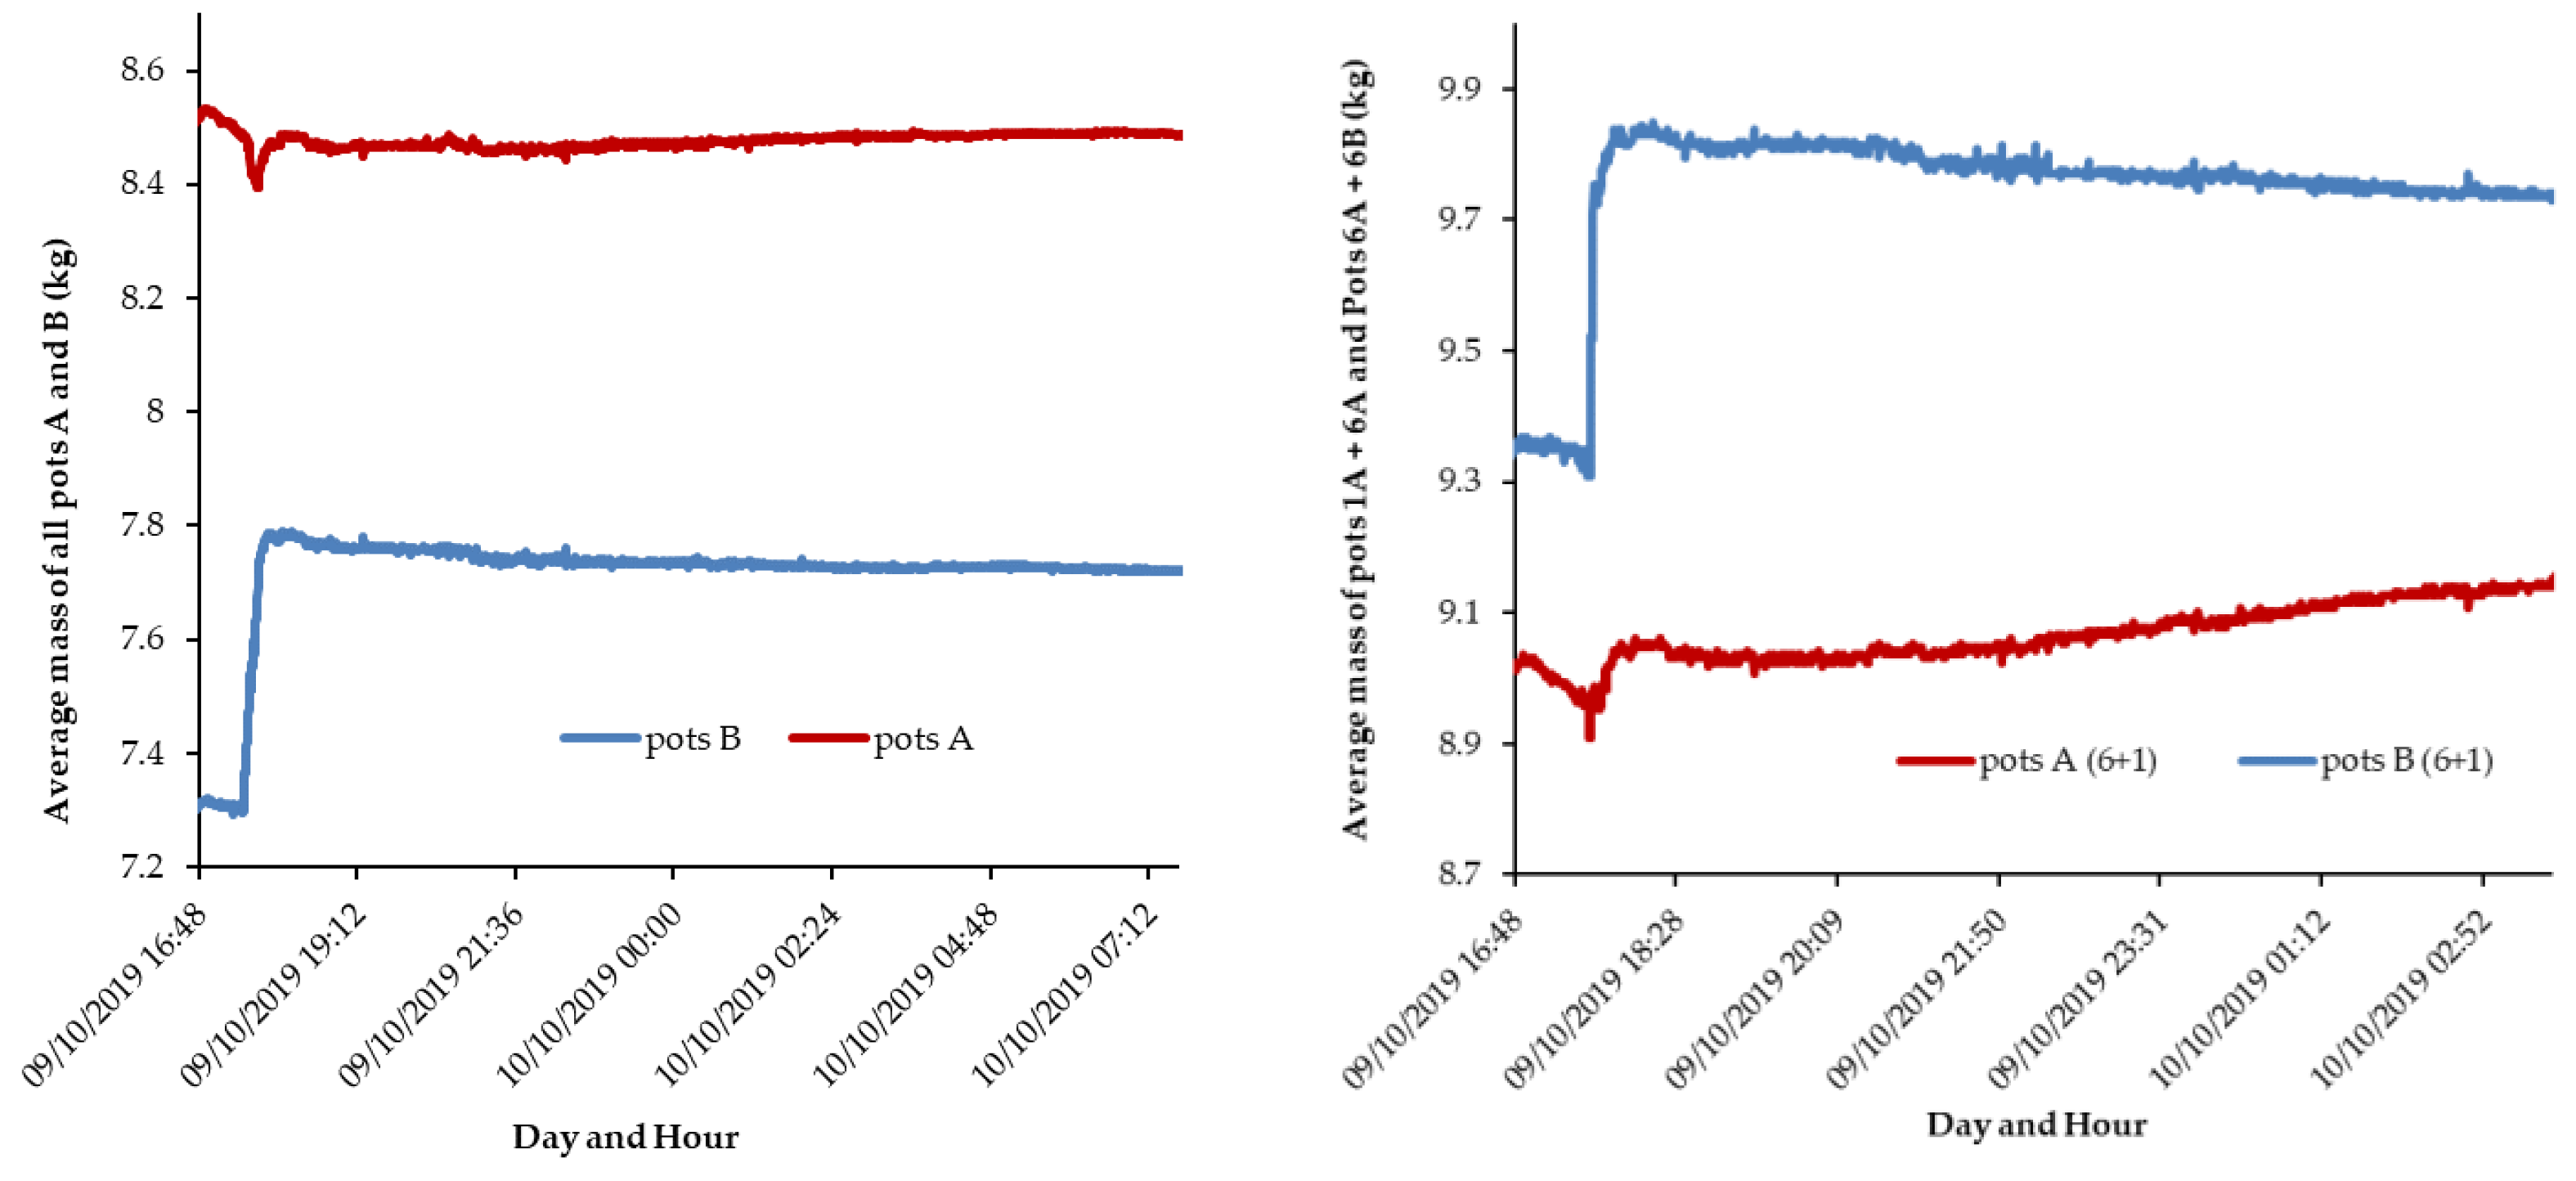
Figure 5.
Mass evolution after irrigation in pots B for (a) the sum of A and B pots (n=16); and (b) relationship between mass in pots A (gain) vs. pots B (loss), for all pairs of pots (n=8).
Figure 5.
Mass evolution after irrigation in pots B for (a) the sum of A and B pots (n=16); and (b) relationship between mass in pots A (gain) vs. pots B (loss), for all pairs of pots (n=8).
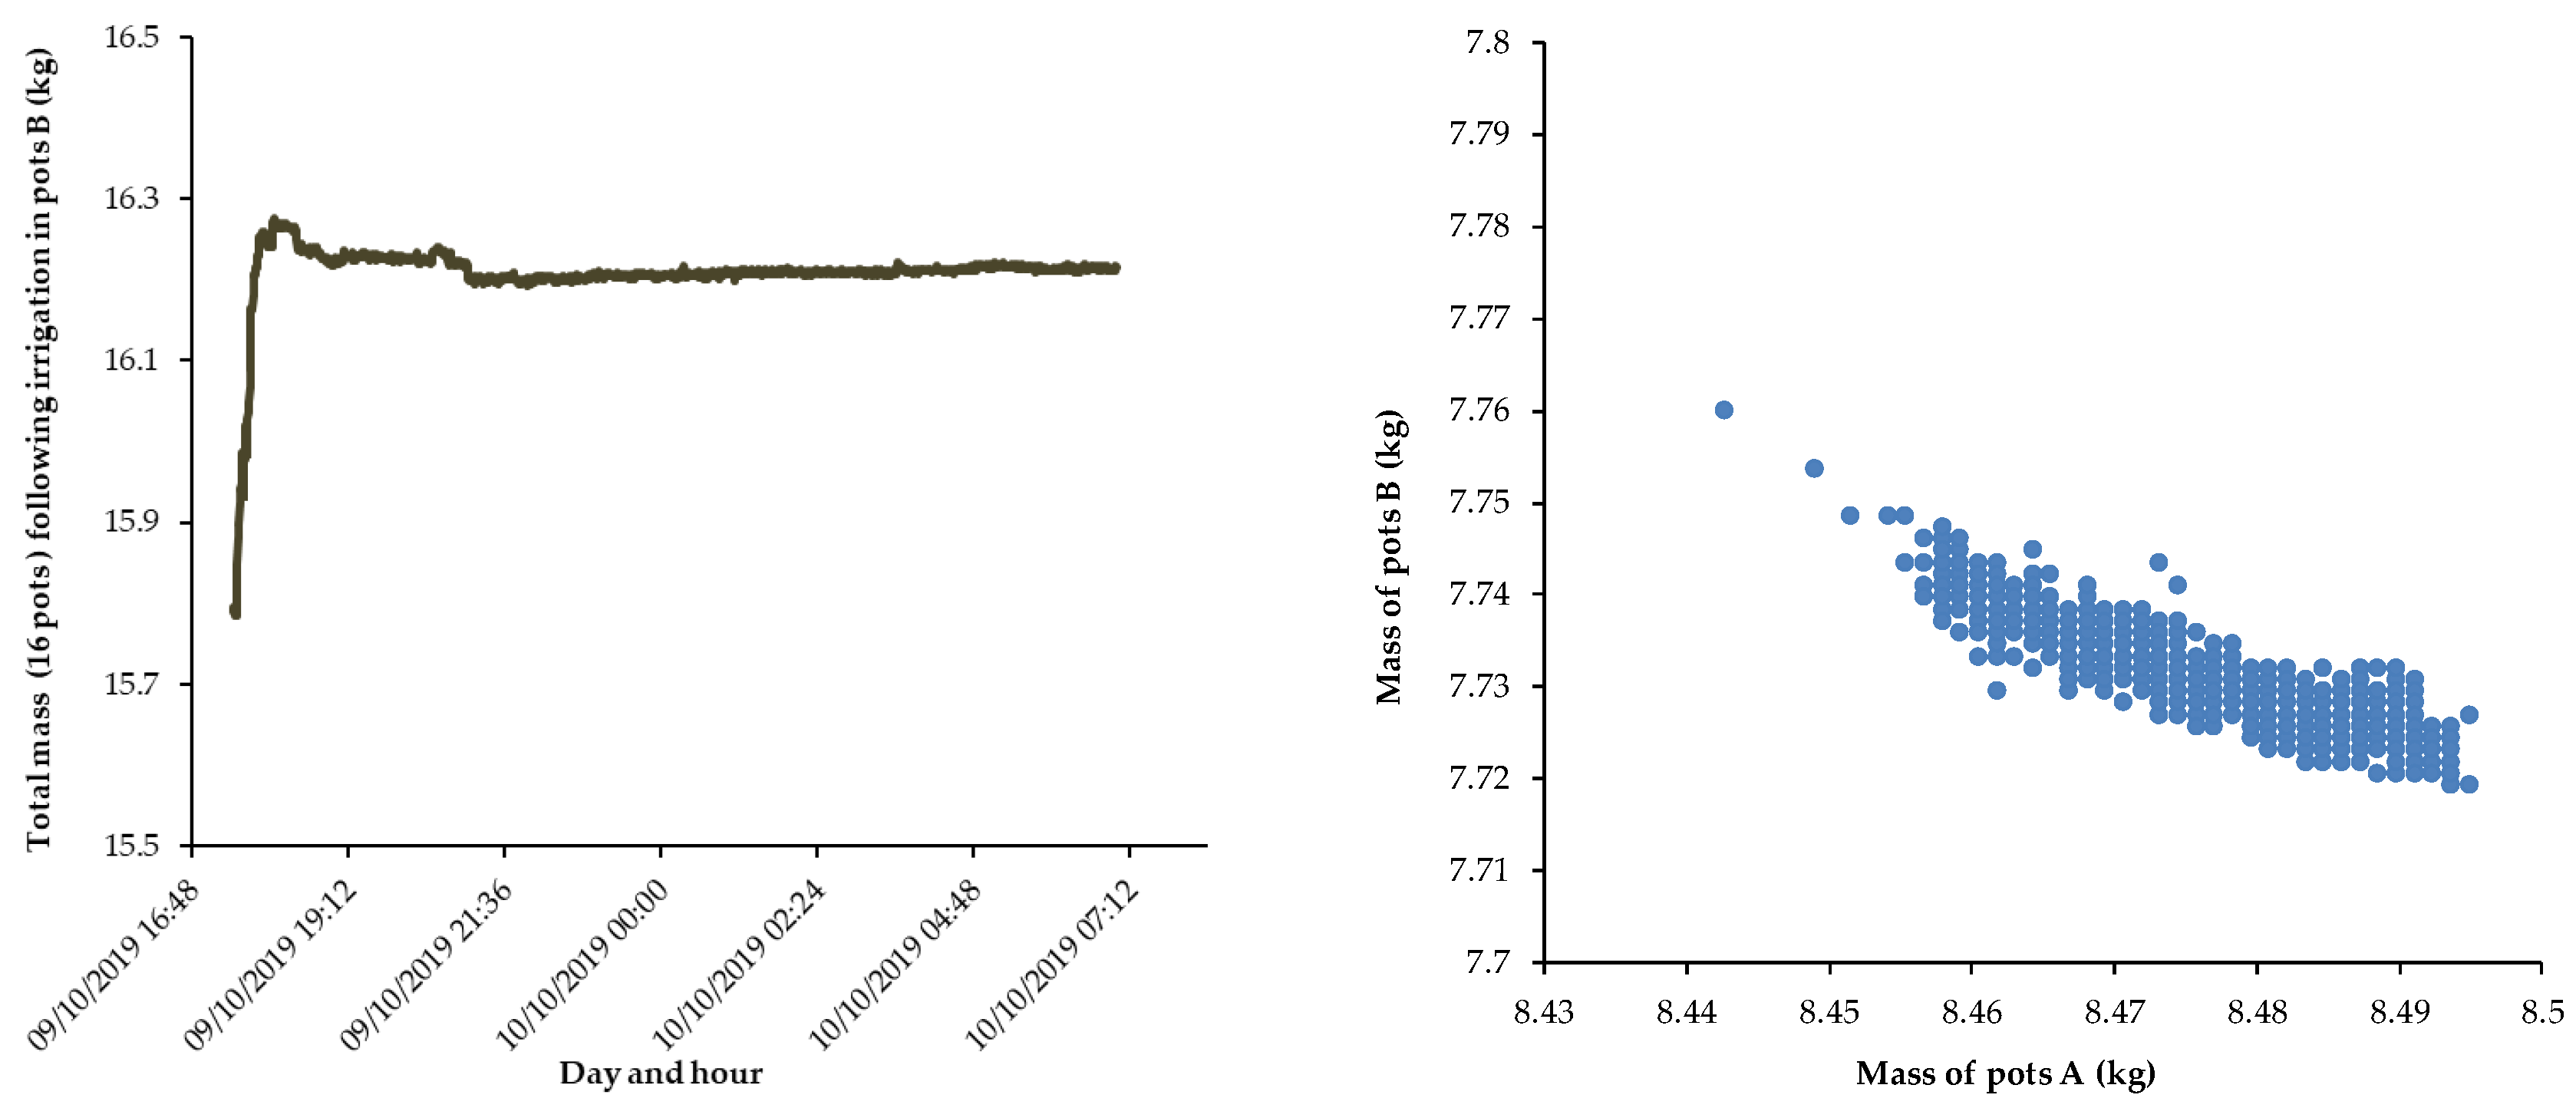
Figure 6.
Average mass (hourly values) before and after irrigation of (a) the all 16 pots, up to the end of October 31 (the difference in mass after irrigation appears divided by two, 125 g, as water was applied only in 8 pots) and (b) for separated groups A and B (n=7), up to early morning of October 31.
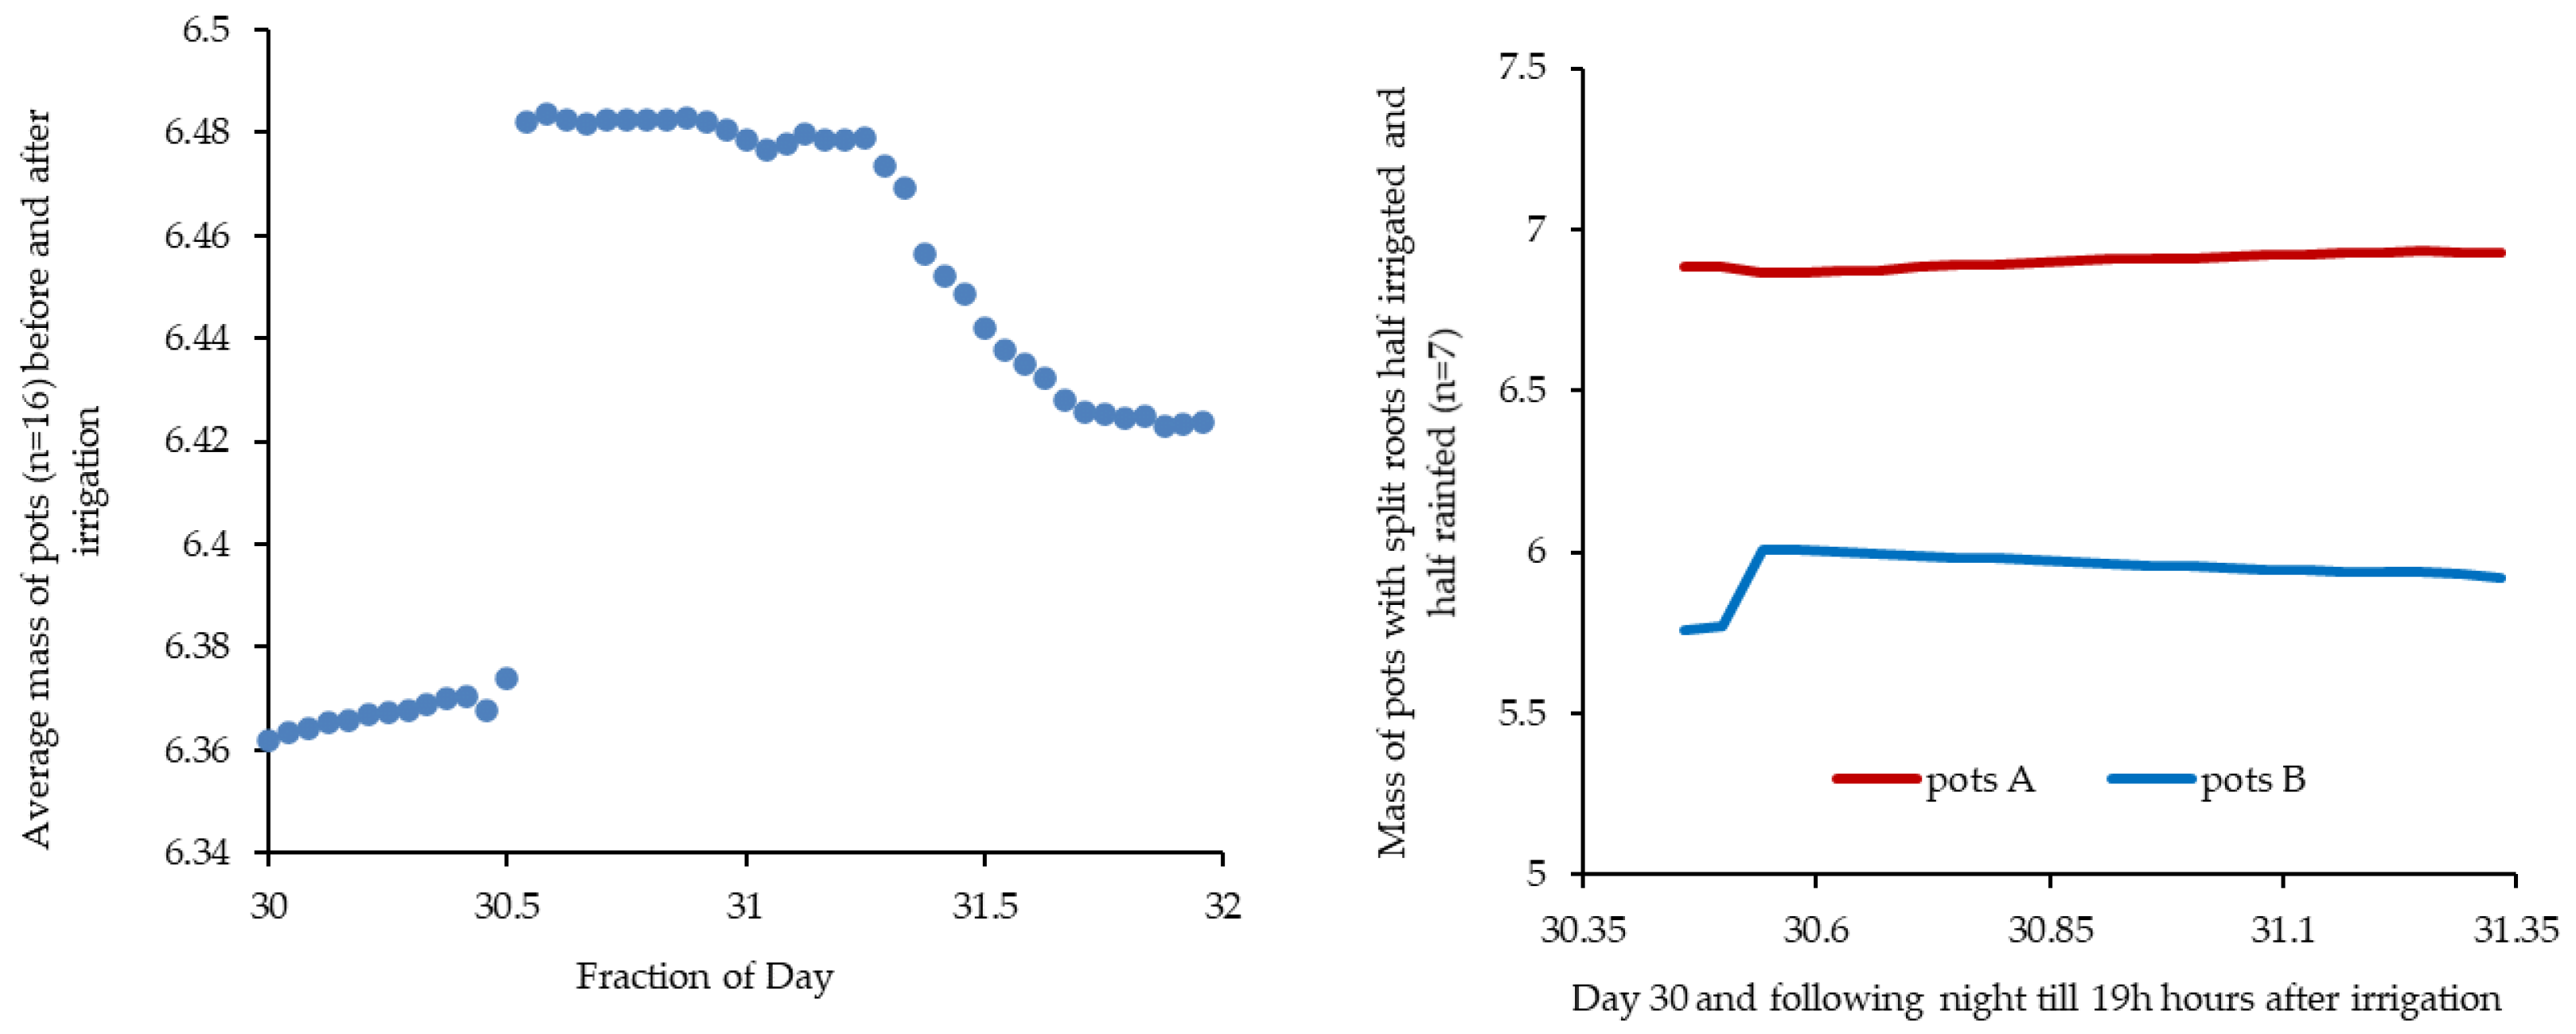
Figure 7.
Relationship between mass changes in A and B groups after irrigation, in three steps: 1) during the first 17 hours after irrigation of B pots (i.e., first afternoon and following night), 2) till water uptake occurs mostly to the shoot during the day and finally, 3) new inversion of slope as the second night starts.
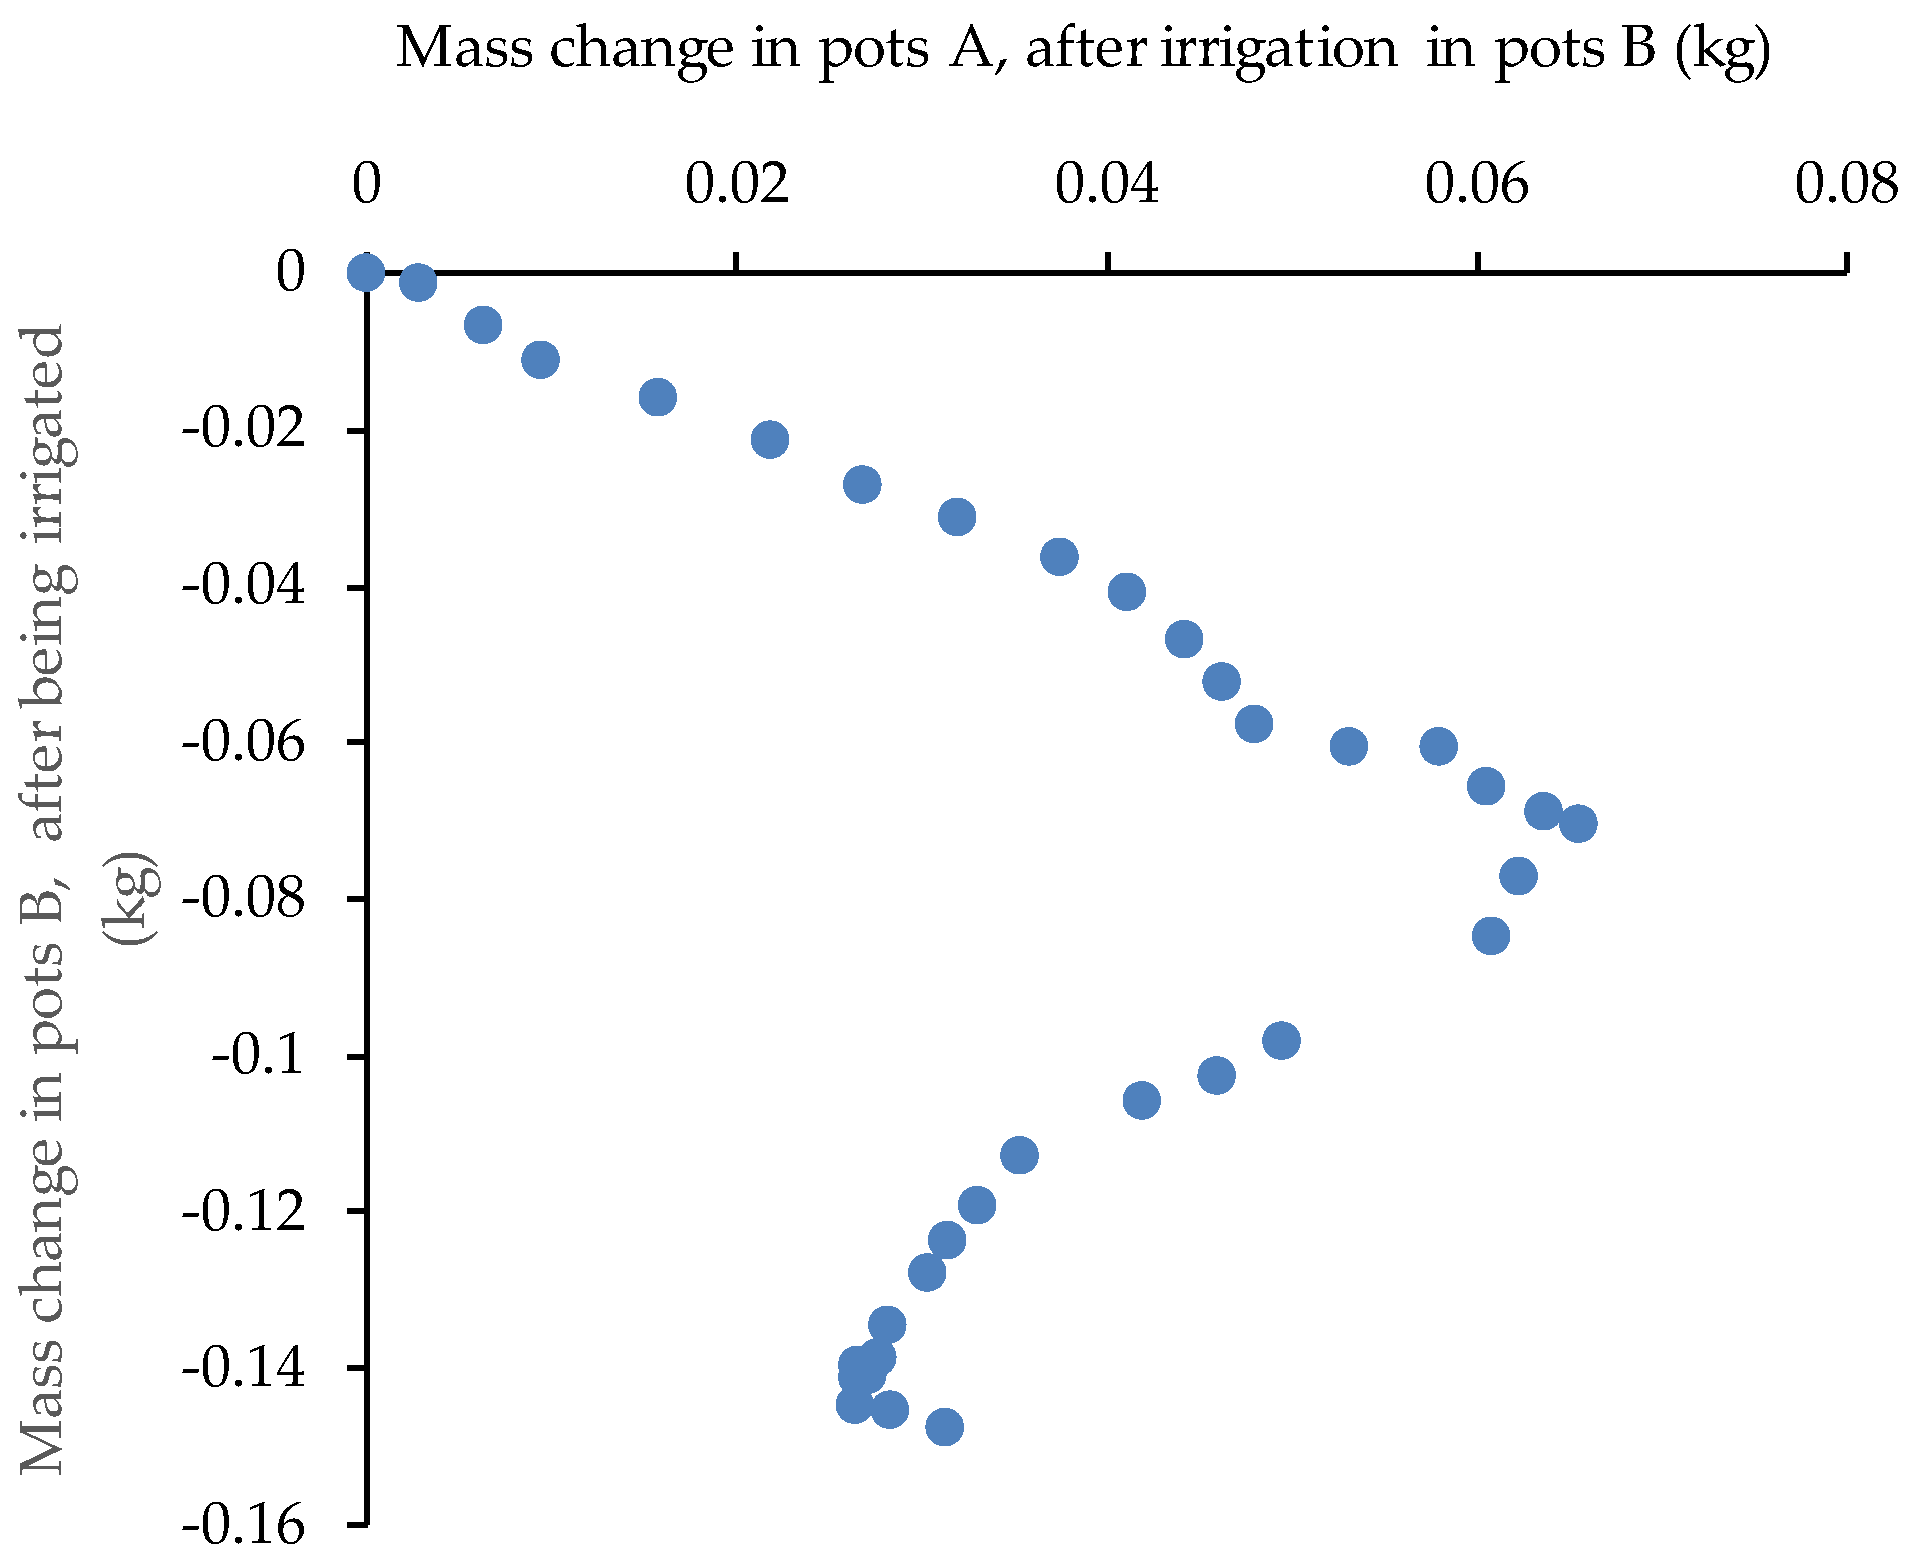

Table 1.
Selected meteorological variables for the 3rd 10-day period of October 2019, from Gago-Coutinho station, Lisbon, Portugal (Tmin – average minimum daily temperature, Tmax – average maximum daily temperature; Prec – cumulated precipitation, RH – average daily relative humidity, u – average daily wind speed at 10 m high).
| Tmin (°C) | Tmax (°C) | Prec (mm) | RH (%) | u (km/h) (10 m) |
|---|---|---|---|---|
| 13.8 | 21.1 | 11.2 | 85.5 | 9.5 |
*Source: [27].
Disclaimer/Publisher’s Note: The statements, opinions and data contained in all publications are solely those of the individual author(s) and contributor(s) and not of MDPI and/or the editor(s). MDPI and/or the editor(s) disclaim responsibility for any injury to people or property resulting from any ideas, methods, instructions or products referred to in the content. |
© 2025 by the authors. Licensee MDPI, Basel, Switzerland. This article is an open access article distributed under the terms and conditions of the Creative Commons Attribution (CC BY) license (http://creativecommons.org/licenses/by/4.0/).
Copyright: This open access article is published under a Creative Commons CC BY 4.0 license, which permit the free download, distribution, and reuse, provided that the author and preprint are cited in any reuse.


