
Submitted:
10 December 2025
Posted:
22 December 2025
You are already at the latest version
Abstract
Transcriptomic analyses of public datasets (TCGA and GTEx) revealed that both CD74 and Cathepsin L (CTSL) are significantly overexpressed in diffuse large B-cell lymphoma (DLBCL) compared to normal tissues, and their expression levels are highly correlated (Spearman R = 0.64, p = 3×1046). Kaplan–Meier analysis showed that elevated expression of both genes is associated with reduced disease-free survival (DFS), defining a high-risk CD74+/CTSL+ DLBCL subgroup. This is the first study demonstrating coordinated overexpression of CD74 and CTSL, and proposing their dual targeting via antibody–drug conjugates (ADCs) to improve outcomes in relapsed or refractory DLBCL. Cysteine cathepsins, a family of proteases, are upregulated in many cancers, facilitating tumor invasion and metastasis. Cathepsins are overexpressed and play key roles in DLBCL progression. GB111-NH₂, a potent broad-spectrum cathepsin inhibitor, significantly reduced cathepsin activity in lymphoma cell lines and patient samples. GB111-NH₂ treatment increased apoptosis and caspase-3 activation in DLBCL patient cells and chronic lymphocytic leukemia (CLL) mononuclear cells. Here, we developed a modified cathepsin inhibitor, M-GB, containing a maleimide linker for site-specific antibody conjugation. While M-GB alone has poor cell permeability, when conjugated to an antibody, it forms an ADC (M-GB-ADC) that selectively induces lymphoma cell death. M-GB-ADC demonstrated high specificity for CD74-expressing lymphoma cells while exhibiting minimal toxicity to non-target cells. Our findings highlight the potential of M-GB–ADC as a targeted therapy for overcoming rituximab resistance and treatment failure in DLBCL. This strategy enhances therapeutic efficacy and provides a treatment option by directing a cathepsin inhibitor payload specifically to malignant B cells.
Keywords:
diffuse large B-cell lymphoma
; Cathepsins
; Antibody–Drug Conjugates (ADC)
; cell death
Introduction
Diffuse large B-cell lymphoma (DLBCL) is the most common aggressive lymphoma, accounting for roughly 25–40% of Non-Hodgkin Lymphoma (NHL) diagnoses [1]. Durable remission can often be achieved with first-line chemoimmunotherapy (e.g. R-CHOP). However, ~30% of patients do not respond to initial therapy or eventually relapse with refractory disease[2,3,4]. Notably, trials intensifying or modifying R-CHOP have not significantly improved outcomes for this high-risk group[5]. Moreover, DLBCL is heterogeneous disease comprising multiple molecular subtypes [6], and those with aggressive phenotypes (e.g. activated B-cell subtype) have especially poor prognoses[5] . In recent years, new therapies have expanded the treatment landscape[7]. For example, adding the anti-CD79B ADC polatuzumab vedotin to frontline therapy yielded a modest progression-free survival (PFS) benefit (a 2-year PFS of ~77% vs 70% with R-CHOP alone)[8]. Likewise, chimeric antigen receptor (CAR) T-cell therapies targeting CD19 can induce durable remissions in ~40–50% of heavily pretreated DLBCL patients. Bispecific T-cell engager antibodies (e.g. glofitamab) have shown high response rates in refractory DLBCL (ORR ~52%, CR ~39%)[9] and gained regulatory approvals. Still, a substantial fraction of patients does not respond to these newer immunotherapies or eventually relapses, underscoring a continued need for innovative targeted treatments, particularly for those who do not benefit from the current treatments [10]. Cysteine cathepsins, a family of lysosomal proteases, have emerged as important mediators of cancer progression and potential therapeutic targets [11]. These enzymes (including cathepsin B, L, S, and others) are often overexpressed in malignancies and contribute to extracellular matrix degradation [12], tumor invasion, and metastasis[13]. Cathepsins can also modulate the tumor microenvironment; for instance, excessive cathepsin activity in the tumor niche degrades antigenic proteins and immune receptors, impairing anti-tumor immunity[14]. Cathepsin L (CTSL) is dysregulated in various cancers and has been implicated in cancer cell growth, angiogenesis, metastasis, and the development of treatment resistance[13]. In DLBCL, cathepsin S is known to facilitate antigen presentation and support tumor cell survival (through invariant chain processing), and elevated cathepsin expression is generally associated with more aggressive disease[15]. Broad-spectrum cysteine cathepsin inhibitors can induce apoptotic death of leukemia and lymphoma cells, highlighting the vulnerability of these tumors to cathepsin blockade[16]. However, no cathepsin-targeted agents have yet reached clinical approval, likely due in part to concerns about off-target effects in normal tissues[14]. A targeted delivery strategy is therefore attractive to maximize tumor-specific cathepsin inhibition while minimizing systemic toxicity.
We chose to focus on CD74, the invariant chain of MHC class II, as a cell-surface “anchor” for delivering cathepsin inhibition to lymphoma cells. When expressed on the plasma membrane, invariant chain is known as CD74, and it is highly expressed in many B-cell malignancies. Over 85% of non-Hodgkin lymphoma cases (and cell lines) express CD74 at high levels, as do the majority of chronic lymphocytic leukemias and multiple myeloma cells[17]. Importantly, CD74 undergoes extremely rapid internalization upon antibody binding, at a rate of ~8×10⁶ molecules internalized per cell per day[18]. This efficient endocytic trafficking makes CD74 an attractive target for antibody-based therapy, as an ADC can be rapidly shuttled inside the cell[5]. Indeed, CD74’s biology provides a strong rationale for ADC development: in vivo, CD74 normally functions as an MHC II chaperone and is cleaved by proteases (e.g. cathepsin S) during antigen presentation[15], and it also serves as a receptor for the pro-inflammatory cytokine MIF, triggering survival signaling pathways[18]. By targeting CD74, one can exploit its high tumor expression and quick internalization to deliver therapeutic payloads directly into malignant B cells.
CD74 has emerged as a promising therapeutic target in hematologic malignancies, and early clinical studies support this strategy. To date, only one CD74-directed agent has been reported in clinical trials: the humanized anti-CD74 monoclonal antibody milatuzumab. In a phase I/II study in relapsed/refractory NHL, milatuzumab (combined with anti-CD20 antibody veltuzumab) produced a modest overall response rate of 24%[5]. This limited efficacy of the naked antibody suggested that a more potent approach – such as an ADC – would be needed to fully exploit CD74. ADC development for CD74 is underway: for example, STRO-001 is a novel anti-CD74 ADC bearing a non-cleavable maytansinoid toxin (DAR = 2) that has demonstrated potent preclinical activity. STRO-001 was cytotoxic at low-nanomolar concentrations in 88% of tested lymphoma and myeloma cell lines, and induced tumor regressions and cures in DLBCL and mantle cell lymphoma xenograft models[5] . These findings have led to an ongoing first-in-human trial of STRO-001 in B-cell malignancies. Notably, STRO-001 and other CD74-targeted ADCs in development employ conventional cytotoxic payloads (e.g. microtubule inhibitors), which can diffuse to bystander cells and damage normal proliferating cells[19]. There remains substantial need for innovative ADC design by exploring non-traditional payloads with different mechanisms of action.
Here we propose a dual-targeting therapeutic strategy that is, to our knowledge, the first of its kind in lymphoma: an anti-CD74 ADC that delivers a cytotoxic cathepsin inhibitor payload. This approach is premised on our observation that a subset of DLBCL tumors co-overexpress CD74 and CTSL, a co-expression signature associated with significantly worse patient survival. We hypothesized that simultaneously targeting a cell-surface antigen (CD74) and an intracellular pro-tumor enzyme (cathepsin L) could provide a two-pronged attack on DLBCL cells, particularly in relapsed or refractory cases. By conjugating a cathepsin inhibitor to an anti-CD74 antibody, we aim to achieve precision delivery of the drug. The inhibitor remains essentially inert until the ADC binds to CD74 and is internalized into the lymphoma cell. This design minimizes exposure of healthy cells to the payload and could confer a wider therapeutic window than traditional ADCs. In summary, the rationale for dual targeting CD74 and cathepsin L in DLBCL is to exploit a tumor-specific vulnerability (CD74 high/CTSL high lymphomas) with a novel ADC that can overcome resistance mechanisms and spare normal tissues. In the following, we present the development and characterization of a CD74-directed cathepsin L inhibitor ADC and explore its therapeutic potential in the context of current DLBCL treatment challenges.
Materials and Methods
Cell lines and culture: DLBCL cell lines OCI-Ly19 and OCI-Ly3 (kindly provided by Dr. Neta Goldschmidt) were used, as well as SU-DHL-6 and BJAB (obtained from ATCC). Additional hematologic cancer lines included acute myeloid leukemia HL-60, chronic myeloid leukemia K562, acute T-cell leukemia Jurkat, and multiple myeloma lines MM.1S and RPMI-8226 (all from ATCC). The Burkitt’s lymphoma cell line B-Blast (provided by Hanna Ben-Bassat, Hadassah Medical Center) was also included. OCI-Ly19 cells were grown in Iscove’s Modified Dulbecco’s Medium (IMDM); OCI-Ly3 and all other cell lines were maintained in RPMI-1640. All media were supplemented with 10% fetal calf serum, 100 U/mL penicillin, 100 μg/mL streptomycin, and 1 mM L-glutamine, and cells were cultured at 37°C in a 5% CO₂ humidified incubator.
Gene expression analysis: Gene expression data for CD74 and CTSL were obtained from the GEPIA2 web platform (http://gepia2.cancer-pku.cn), which integrates RNA-seq expression profiles from The Cancer Genome Atlas (TCGA) and Genotype-Tissue Expression (GTEx) projects. Expression values were reported in transcripts per million (TPM). For tissue-wide analysis, bar and dot plots were generated in GEPIA2 comparing tumor tissues (from TCGA) to corresponding normal tissues (from TCGA or GTEx). Correlation analysis: To assess co-expression between CTSL and CD74, Spearman correlation coefficients were calculated using GEPIA2 on DLBCL (DLBC) tumor data versus relevant normal datasets. Gene expression values were log_2-transformed TPM. Survival analysis: Kaplan–Meier curves were generated via GEPIA2 to evaluate the impact of CD74 or CTSL expression on patient DFS. Patients were stratified into high vs. low expression groups based on median expression. Differences in survival were evaluated by log-rank test, and hazard ratios (HR) with 95% confidence intervals were reported from the GEPIA2 output.
Patient samples: With approval from the Hadassah Medical Center IRB (Helsinki Committee #HMO-0144-16) and written informed consent, primary samples were collected from patients and healthy donors. Peripheral blood mononuclear cells (PBMCs) were isolated by Ficoll-Paque density gradient centrifugation from blood of CLL patients (with 24-hour culture in autologous serum before use), and from blood or bone marrow of patients with DLBCL, CLL, or marginal zone lymphoma (MZL), as well as from healthy donor blood. All patient samples were obtained at diagnosis (prior to therapy).
Cathepsin activity assays: To measure cysteine cathepsin activity, detergent lysates were prepared from OCI-Ly19 and OCI-Ly3 cells, as well as from patient and healthy donor PBMCs. Samples were pre-treated with either DMSO (vehicle control) or 5 µM GB111-NH₂ (broad cathepsin inhibitor[20]) for 30 minutes at room temperature, followed by the addition of 1 µM of the fluorescent activity-based probe GB123 [21]. After 1 hour of labeling at 37°C, equal amounts of protein from each sample were separated by SDS-PAGE, and active cathepsins were visualized by scanning the gels for fluorescence (Typhoon laser scanner). In some experiments, purified recombinant human cathepsin L or cathepsin S enzymes were incubated in acetate buffer (pH 5.5) with various concentrations of inhibitors (GB111-NH₂ or M-GB) or 0.1% DMSO for 30 minutes, followed by labeling with 1 µM GB123 for 30 minutes. These samples were analyzed by SDS-PAGE and fluorescent scanning as above.
Cathepsin immunoprecipitation: To confirm the identities of active cathepsins in cell lysates, OCI-Ly19 lysates labeled with GB123 (as described above) were subjected to immunoprecipitation with cathepsin-specific antibodies. Anti-cathepsin L or anti-cathepsin S antibodies (Abcam) were added to cleared lysates, followed by protein A/G agarose beads (Santa Cruz Biotechnology). After incubation and washing, bound proteins were eluted in SDS sample buffer at 100°C for 10 minutes. The fluorescently labeled supernatant (unbound fraction) and immunoprecipitated eluate were analyzed by SDS-PAGE and gel scanning. A ~20 kDa band corresponding to cathepsin L and a ~25 kDa band corresponding to cathepsin S were thus isolated and identified.
Caspase-3 activity and apoptosis assays: OCI-Ly19 cells were treated with 5 µM GB111-NH₂ for 1 hour, then returned to fresh medium. After 24 hours, caspase-3 activity was measured in cell lysates (100 µg protein) using a colorimetric substrate (Ac-DEVD-pNA; CaspACE Assay, Promega). Cleavage of this substrate by active caspase-3 releases p-nitroaniline, which was quantified by its absorbance at 405 nm as an indicator of caspase activity. In parallel, cells were stained with Annexin V–FITC and analyzed by flow cytometry to assess phosphatidylserine exposure (an early apoptosis marker). For CLL patient samples, mononuclear cells were similarly treated with 5 µM GB111-NH₂ for 1 hour, then assessed 24 hours later by Annexin V staining and flow cytometry.
NF-κB reporter assay: OCI-Ly19 cells were stably transfected with an NF-κB response element-driven NanoLuc luciferase reporter (NlucP/NF-κB-RE vector, Promega). Transfected cells were treated for 24 hours under various conditions: with or without lipopolysaccharide (LPS, 0.5 µg/mL) to stimulate NF-κB, and in the presence or absence of 5 µM GB111-NH₂ or 10 µM SC-514 (a selective NF-κB p65 inhibitor, Calbiochem). After treatments, NanoLuc luciferase activity in cell lysates was measured using a plate reader, to quantify NF-κB transcriptional activity.
Flow cytometry for cell death and surface markers: To evaluate cell death under different treatments, OCI-Ly19 cells were exposed to various agents for 24 hours as follows: (i) 5 µM GB111-NH₂ for 1 hour (followed by washout and an additional 23 hours in fresh medium), (ii) an unconjugated control antibody (10 µg/mL IgG), (iii) 2.5 µg/mL etoposide (a DNA-damaging chemotherapeutic), or (iv) an antibody–GB111-NH₂ conjugate (ADC) generated as described below. After treatment, cells were stained with propidium iodide (PI) and analyzed by flow cytometry to quantify membrane impermeability (PI uptake), an indicator of late-stage cell death.
For cell-surface CD74 detection, OCI-Ly19 cells were treated for 24 hours ± 0.5 µg/mL LPS and ± 5 µM GB111-NH₂. Cells were then stained on ice with FITC-conjugated anti-CD74 antibody (BD Biosciences) and analyzed by flow cytometry; mean fluorescence intensity was compared between conditions.
ADC preparation (M-GB conjugation): M-GB is a modified derivative of GB111-NH₂ containing a maleimide functional group in place of the benzyloxycarbonyl moiety. This design enables conjugation to antibodies via reaction with surface-accessible cysteine residues. To prepare antibody–M-GB conjugates, the antibody of interest (0.3 mg/mL, e.g. rituximab or an anti-CD74 mAb) was incubated with M-GB (5 µM) for 30 minutes at 37°C with gentle agitation. The maleimide on M-GB reacts spontaneously with thiol groups on the antibody, forming a stable thioether bond. The reaction mixture was then concentrated and washed using a 10 kDa molecular-weight cutoff centrifugal filter (Vivaspin, GE) to remove unbound M-GB and other small molecules, yielding the purified M-GB–ADC. The average drug-to-antibody ratio was approximately 1:1 under these conditions.
Statistical analysis: Data are presented as mean ± standard deviation (SD) of at least three independent experiments. Group comparisons were made using two-tailed Student’s t-tests. A p-value < 0.05 was considered statistically significant.
Results
CD74 and CTSL are co-overexpressed in hematologic malignancies and predict poor prognosis: To explore the clinical significance of CTSL and CD74 in hematological cancers, we analyzed gene expression datasets from TCGA and GTEx. As shown in Figure 1A–B, both CTSL and CD74 are markedly overexpressed in DLBCL (diffuse large B-cell lymphoma) compared to their expression in normal tissues. CTSL is also significantly upregulated in acute myeloid leukemia (AML), whereas CD74 expression in AML remains relatively low. This contrast suggests divergent roles or regulatory mechanisms for CD74 and CTSL in myeloid versus lymphoid malignancies. Consistently, correlation analysis (Figure 1C) revealed a strong positive relationship between CTSL and CD74 expression (Spearman R = 0.64, p = 3×10^−46) across hematologic tumor samples, suggesting possible transcriptional co-regulation of these genes. In addition, survival analysis confirmed that high expression of either CD74 or CTSL correlates with reduced DFS in patients (see Figure 1D–E). These findings support the clinical relevance of CD74 and CTSL overexpression in DLBCL. High CTSL may also serve as a prognostic marker in AML, although its expression pattern in this context is distinct from that of CD74.
Cathepsin activity is elevated in lymphoma patient samples and cell lines: We next examined cysteine cathepsin enzymatic activity in primary lymphoma cells and cell lines. Peripheral blood mononuclear cells from lymphoma patients (collected at diagnosis, before therapy) were compared to healthy donor cells. Using the fluorescent probe GB123, which irreversibly labels active cathepsins [21], we observed elevated cathepsin B, L, and S activities in lysates from CLL and DLBCL patient cells relative to healthy controls (Figure 2A). Similarly, high cathepsin activity was detected in a panel of hematologic cancer cell lines, including DLBCL (OCI-Ly7, OCI-Ly19, SU-DHL-6), Burkitt lymphoma (BJAB), AML (HL-60), T-cell leukemia (Jurkat), multiple myeloma (MM.1S, RPMI-8226), and CML (K562) (Figure 2B). Multiple fluorescent bands corresponding to active cathepsins were observed on SDS-PAGE gels. To identify these bands, we immunoprecipitated GB123-labeled OCI-Ly19 lysates with cathepsin S- or cathepsin L-specific antibodies. The results showed that the ~20 kDa band represents cathepsin L and the ~25 kDa band represents cathepsin S (Figure 2C). DLBCL, AML, and myeloma cell lines showed prominent bands at ~20 and ~25 kDa (CTSL and CTSS, respectively). In BJAB, Jurkat, and K562 cells, only the ~20 kDa CTSL band was prominent. Among the DLBCL lines, OCI-Ly7 and OCI-Ly19 had higher CTSL activity than SU-DHL-6. We also noted a weaker band around ~32 kDa – likely cathepsin B – present in several cell lines and especially intense in HL-60 cells (Figure 2B). As expected, pretreatment with the inhibitor GB111-NH₂ greatly reduced all cathepsin activity signals, confirming that the GB123 probe specifically reports on cysteine cathepsin activity that GB111-NH₂ effectively blocks.
Cathepsin inhibition induces apoptosis in lymphoma cells: Given the elevated cathepsin activity in lymphoma, we investigated whether blocking cathepsin activity induces cell death. OCI-Ly19 DLBCL cells were treated with 5 µM GB111-NH₂ for an hour, and apoptosis was assessed 24 hours later. GB111-NH₂ treatment led to a significant increase in apoptosis, as evidenced by a ~4.5-fold rise in caspase-3 activity (Figure 3A) and a ~2.5-fold increase in Annexin V-positive cells (Figure 3B) compared to untreated controls. Similarly, inhibiting cathepsins with GB111-NH₂ triggered apoptosis in primary cells from CLL patients: CLL mononuclear cells showed increased Annexin V staining after 5 µM GB111-NH₂ treatment (Figure 3C, p = 0.016). In these patient CLL cells, cathepsin S activity was initially high and was reduced by ~40% following GB111-NH₂ treatment (Figure 3D).
Cathepsin inhibition suppresses NF-κB activation and CD74 upregulation: Because CD74 ICD-mediated signaling is linked to NF-κB p65 activation, we analyzed whether cathepsin inhibition affects NF-κB activity and CD74 levels. OCI-Ly19 cells stably expressing an NF-κB luciferase reporter were treated with LPS to stimulate NF-κB. LPS stimulation increased NF-κB-driven luciferase activity by ~7-fold (Figure 4A). Notably, the addition of GB111-NH₂ markedly suppressed this LPS-induced NF-κB activation, reducing it to near-baseline levels (comparable to the effect of the direct p65 inhibitor SC-514; Figure 4A). In parallel, GB111-NH₂ effectively blocked cathepsin activity in these cells under both basal and LPS-stimulated conditions (Figure 4B). We also examined cell-surface CD74 expression by flow cytometry. LPS treatment increased CD74 surface levels, whereas GB111-NH₂ abrogated this LPS-induced upregulation of CD74 (Figure 4C). Thus, cathepsin activity facilitates NF-κB activation and CD74 expression in lymphoma cells, and its inhibition can attenuate these pro-survival signals.
Combining cathepsin inhibition with other therapies enhances lymphoma cell killing: Given the pro-apoptotic effect of cathepsin inhibition alone, we next tested whether combining GB111-NH₂ with existing lymphoma therapies could improve tumor cell killing. OCI-Ly19 cells were treated for 24 hours with 10 µg/mL of an antibody (either rituximab, an anti-CD20 monoclonal antibody, or an anti-CD74 monoclonal antibody), in the presence or absence of 5 µM GB111-NH₂ (GB111-NH₂ was added 1 hour before antibody addition and present during the antibody treatment). In both cases, with anti-CD20 or anti-CD7, the addition of GB111-NH₂ significantly increased cell death compared to treatment with the antibody alone (Figure 5A). This suggests that cathepsin inhibition can potentiate the cytotoxic effects of other lymphoma therapies. However, since GB111-NH₂ is a membrane-permeable inhibitor that could also enter and affect normal cells, a more targeted delivery method is desirable to achieve cancer cell-specific cathepsin inhibition.
Design of a cathepsin inhibitor ADC (M-GB) and its properties: We therefore designed a tumor-targeted cathepsin inhibitor by modifying GB111-NH₂ into a form suitable for antibody conjugation. The resulting inhibitor, M-GB, replaces the benzyloxycarbonyl group of GB111-NH₂ with a maleimide linker moiety (Figure 5B, maleimide highlighted in gray), enabling attachment to antibody cysteine residues via thioether bond formation. Importantly, we expected that M-GB would reduce cell permeability (due to the maleimide) and thus would primarily be active only when delivered inside target cells via an antibody vehicle. We first confirmed that the structural changes in M-GB did not abolish its ability to inhibit cathepsin activity. In a biochemical assay, recombinant human cathepsin B or S were incubated with increasing concentrations of M-GB or GB111-NH₂, followed by the addition of the fluorescent cathepsin probe GB123 to measure remaining enzyme activity. M-GB proved to be a potent inhibitor of both cathepsin L and cathepsin S (Figure 5C). Inhibition of cathepsin B did require higher M-GB concentrations compared to GB111-NH₂, whereas cathepsin S was inhibited similarly by both compounds (Figure 5C). We next tested the ability of M-GB to inhibit cathepsins within intact cells. OCI-Ly19 cells were treated with either M-GB or GB111-NH₂ for 24 hours, then labeled with GB123 to visualize residual cathepsin activity. As expected, GB111-NH₂ strongly inhibited intracellular cathepsin activity (Figure 5D), while M-GB, in contrast, had minimal effect on intracellular cathepsins (Figure 5D). These results confirm that M-GB retains cathepsin-inhibitory potency, but on its own, does not readily penetrate cells, supporting its use as an ADC payload to achieve cell-specific cathepsin inhibition.
Rituximab conjugated with M-GB overcomes therapy-induced cathepsin activity and kills lymphoma cells: Prior studies have shown that cathepsin levels can increase in tumor cells following certain treatments, potentially contributing to therapy resistance. In our experiments, we observed that treating OCI-Ly3 DLBCL cells with rituximab (anti-CD20) led to a ~3.8-fold increase in intracellular cathepsin activity compared to untreated cells (Figure 6A, B; p = 0.0015). To counteract this effect, we conjugated M-GB to rituximab, thereby delivering the inhibitor specifically to CD20-positive lymphoma cells. The conjugate (designated R-M-GB) was prepared by mixing the inhibitor with the antibody as described in the Methods. OCI-Ly3 cells were then treated for 24 hours with rituximab alone, M-GB alone, or the R-M-GB conjugate. Treatment with R-M-GB resulted in significantly greater cell death (PI uptake) than rituximab alone (p = 0.049; Figure 6C). Moreover, cells receiving R-M-GB did not show the enhanced cathepsin activity that was observed with rituximab-only treatment; instead, their cathepsin activity remained low, comparable to that of untreated cells (Figure 6D). Adding rituximab and M-GB, which do not bind and cannot enter the cells, do not inhibit cathepsin activity. Thus, coupling a cathepsin inhibitor to rituximab not only enhances tumor cell killing but also prevents the therapy-induced rise in cathepsin activity that might otherwise limit rituximab’s effectiveness.
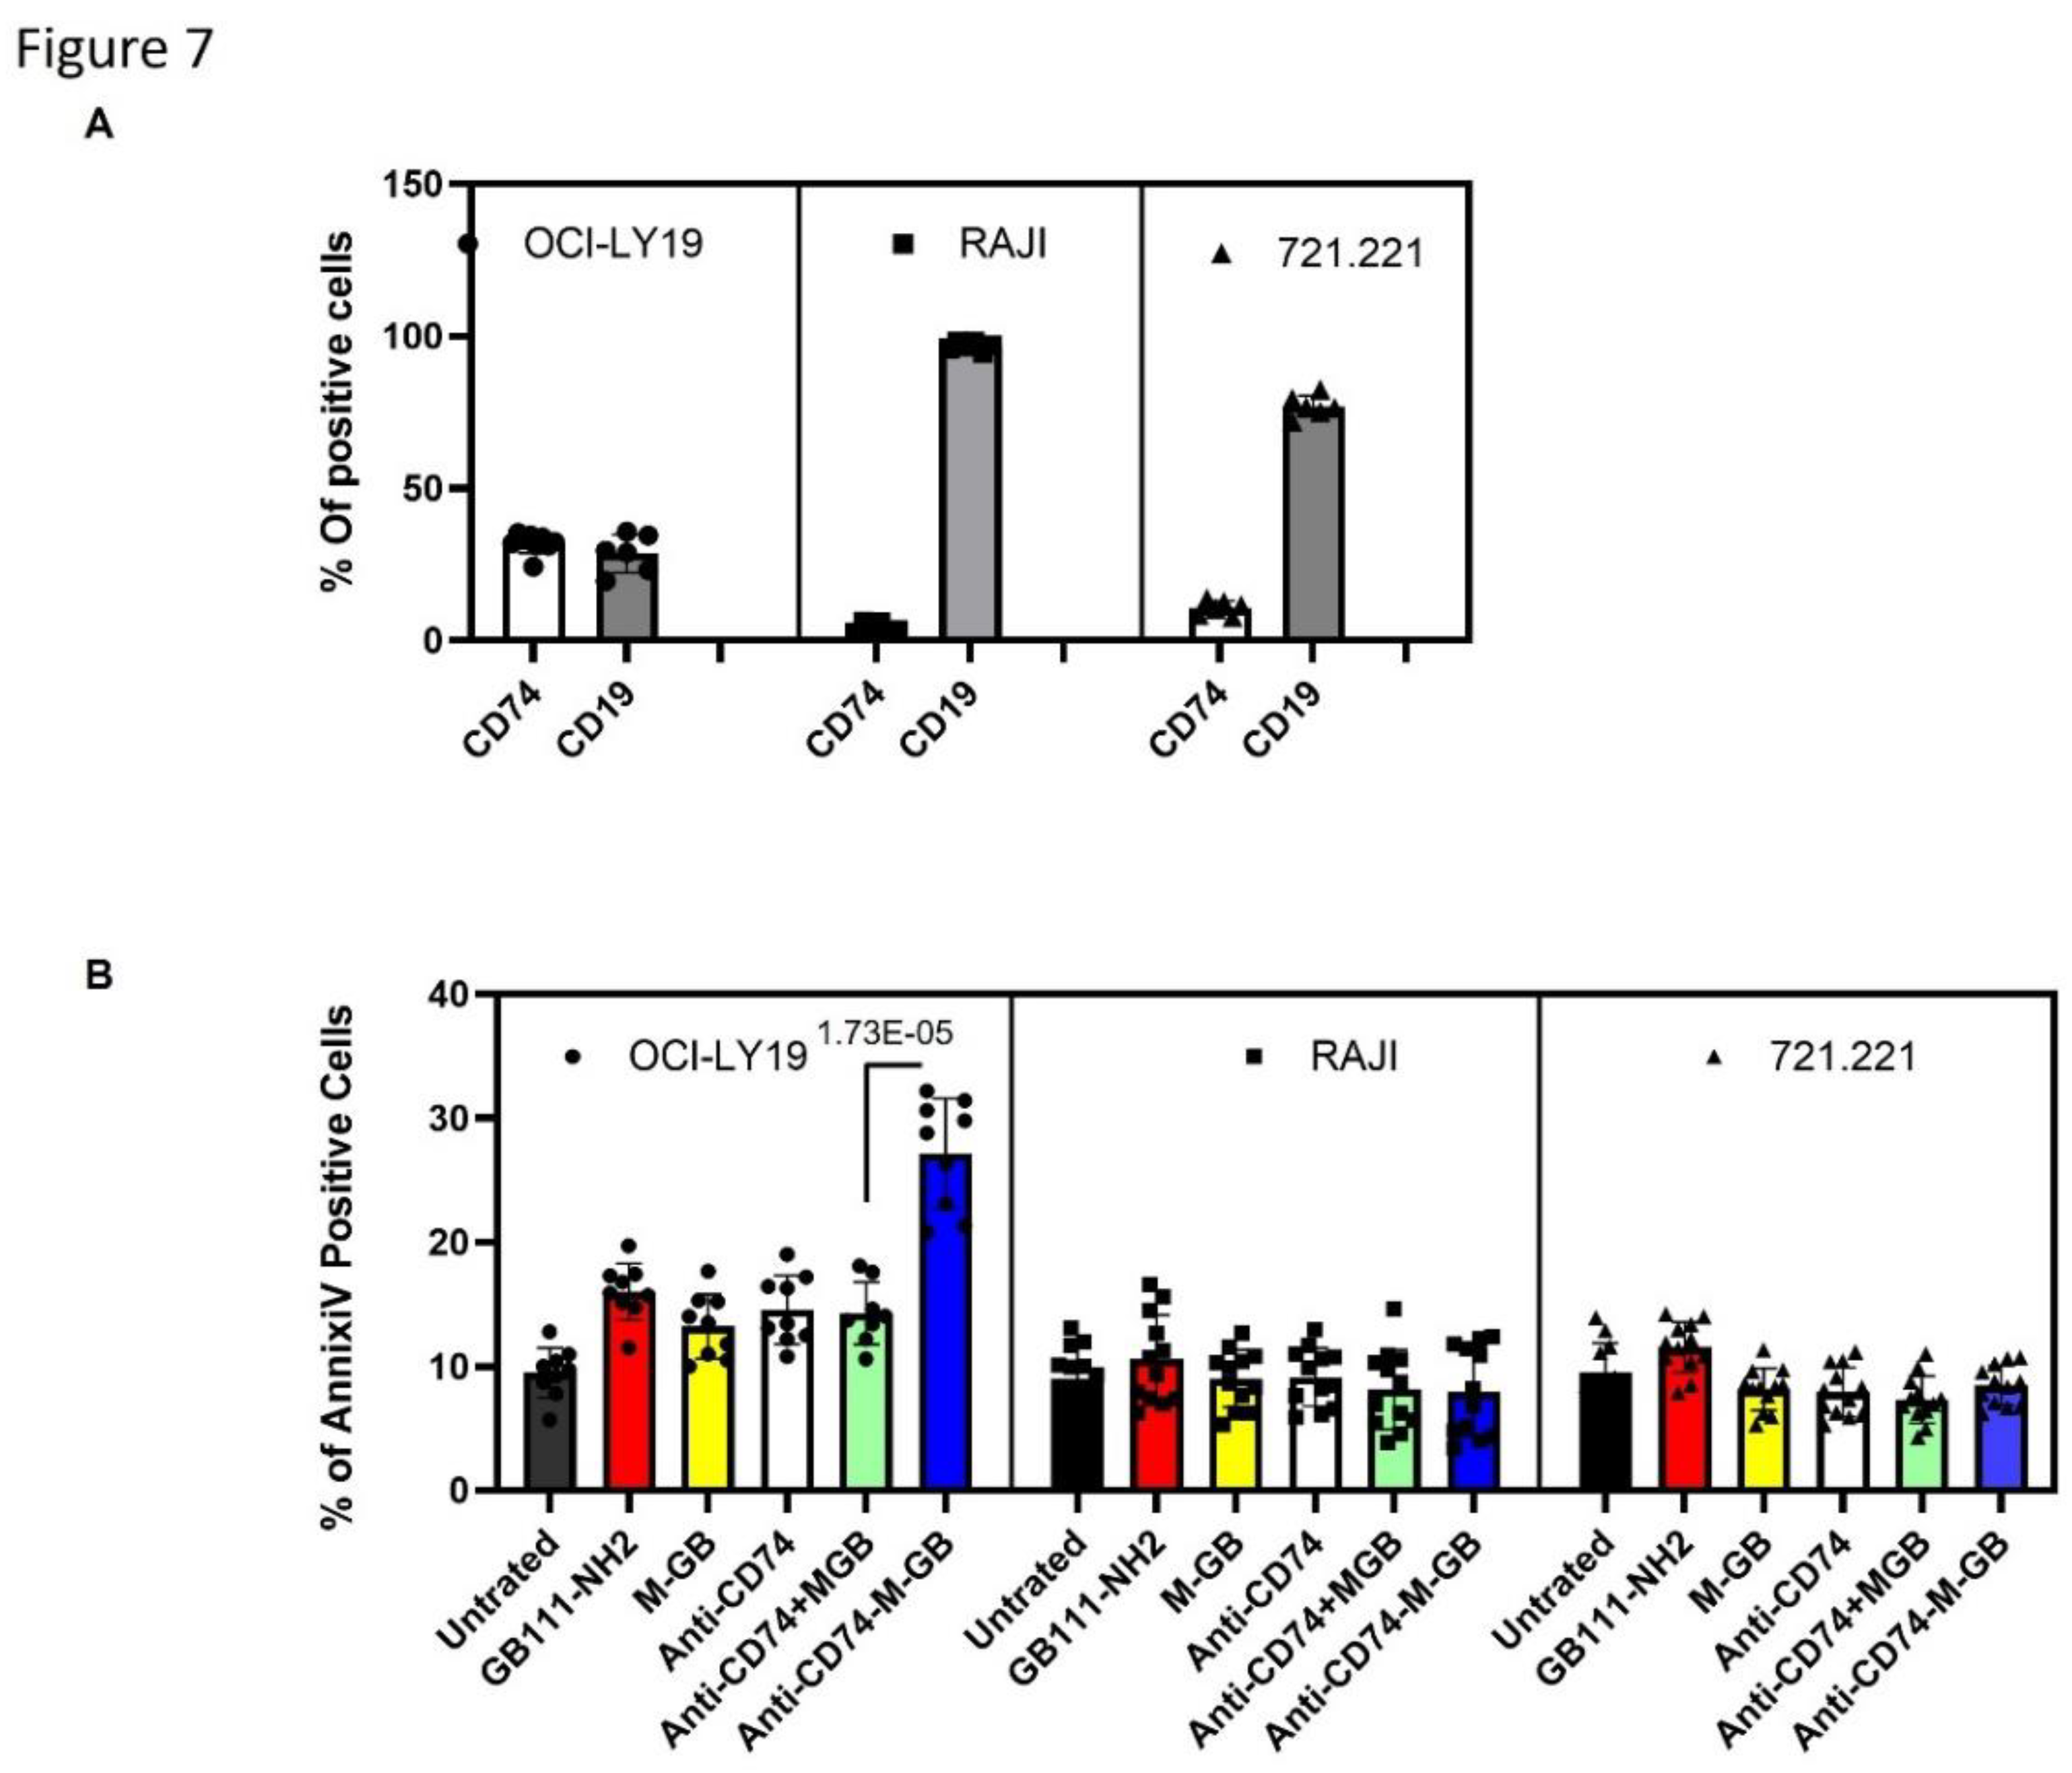
CD74-targeted M-GB ADC selectively kills CD74-positive lymphoma cells: Patients with relapsed or refractory DLBCL often develop resistance to rituximab, in part due to loss or downregulation of CD20. One strategy to overcome this is to target an alternative antigen that remains highly expressed in B-cell malignancies even when CD20 is low, such as CD74 [22]. We therefore generated an anti-CD74 ADC by conjugating M-GB to a chimeric anti-CD74 monoclonal antibody (LL1 clone). To test the specificity and efficacy of this conjugate (CD74–M-GB), we compared its effects on cells with high vs. low CD74 expression. OCI-Ly19 cells express high levels of CD74 (as well as the B-cell marker CD19), whereas Raji (Burkitt lymphoma) and 721.221 (B-lymphoblastoid) cells have very low CD74 surface expression (Figure 7A). The cells were treated with CD74–M-GB or control conditions for 24 hours, then analyzed for apoptosis by Annexin V staining. CD74–M-GB induced significantly higher apoptosis in OCI-Ly19 cells compared to either Raji or 721.221 cells (Figure 7B). Specifically, OCI-Ly19 showed a marked increase in Annexin V-positive cells, whereas Raji and 721.221 exhibited minimal cell death in response to the ADC. These differences were highly significant (P = 3.08×10⁻¹¹ for OCI-Ly19 vs Raji; P = 1.15×10⁻⁹ for OCI-Ly19 vs 721.221). These results indicate that the CD74–M-GB ADC selectively targets and kills CD74-expressing lymphoma cells while sparing CD74-negative cells, highlighting its potential as a therapeutic agent for CD74-positive malignancies.
Discussion
NHL remains a global health concern, with an estimated ~560,000 new cases and ~270,000 deaths worldwide in 2023 (Globocan 2023). DLBCL, as an aggressive NHL subtype, often presents with advanced-stage disease and extranodal involvement. Despite improvements in survival with R-CHOP chemotherapy, a significant subset of patients – especially those with high-risk features (e.g. refractory disease, “double-hit” genetics) – require better frontline and salvage therapies. New immunotherapies such as CAR T cells and bispecific antibodies have shown promise, but at least half of relapsed DLBCL patients still do not achieve durable remission with these approaches[23].This unmet need drives the search for novel targeted strategies, particularly for patients who relapse after or are resistant to rituximab-based therapy.
In this study, we identified CD74 and cathepsin L as co-expressed drivers of an aggressive DLBCL subset and demonstrated that concurrently targeting both can reveal prognostic and therapeutic vulnerabilities. Transcriptomic analysis of patient datasets revealed a high-risk CD74+/CTSL+ gene expression signature correlated with inferior outcomes, underscoring the clinical relevance of these targets. Our findings align with emerging research that highlights cysteine cathepsins as facilitators of tumor progression and therapy resistance[24]. Cathepsin L, in particular, has been linked to cancer cell invasion and metastasis in solid tumors and to treatment resistance mechanisms[24]. By showing that cathepsin inhibition induces apoptosis in DLBCL cells (including primary patient samples, as we observed with broad inhibitor GB111-NH2), we provide evidence that DLBCL is among the cancers susceptible to cathepsin-targeted therapy. This supports the notion that protease upregulation in lymphoma cells is not merely a bystander effect of malignancy but a functional contributor to tumor survival that can be therapeutically exploited[16].
A key result of our work is the demonstration that dual targeting of CD74 and cathepsin L can overcome known mechanisms of treatment resistance. Rituximab (anti-CD20) has been a backbone of DLBCL therapy for decades, but many patients relapse, often with loss or downregulation of CD20 on tumor cells [25]. Notably, our experiments showed that rituximab treatment alone led to a compensatory increase in cathepsin activity in lymphoma cells. This cathepsin upregulation may represent a survival adaptation of tumor cells under therapeutic pressure (for example, enhanced proteolysis could help cancer cells evade apoptosis or reshape the microenvironment)[26,27,28]. By contrast, when we applied our CD74-targeted cathepsin inhibitor ADC, we effectively countered the rituximab-induced rise in cathepsin activity. The ADC simultaneously delivers a protease blockade and a cytotoxic antibody signal, attacking the lymphoma on two fronts. Importantly, because CD74 remains widely expressed on B-cell tumors even when CD20 is lost[18], this strategy can target tumor cells that have evaded anti-CD20 therapy. Our dual-targeting approach thus addresses two challenges in refractory DLBCL: it provides an alternative antigen target (CD74) for tumors that escape CD20-directed treatment, and it neutralizes a pro-survival enzyme (CTSL) that lymphoma cells may upregulate in response to therapy. The net effect is a highly selective lethal hit to the tumor. In our models, the anti-CD74–M-GB ADC induced cell death only in CD74-positive lymphoma cells and spared CD74-negative cells, illustrating the precision of this approach and its potential to bypass off-target toxicity while overcoming resistance.
Our results also reinforce the attractiveness of CD74 as a therapeutic target in B-cell malignancies and validate the concept that armed antibodies can significantly outperform naked antibodies in this context. The modest efficacy of milatuzumab in NHL patients (24% response rate) hinted that CD74 targeting needed to be more potent to have a clinical impact[5]. The success of STRO-001 in preclinical lymphoma models further demonstrated that delivering a cytotoxic payload via anti-CD74 can produce deep responses[5]. Consistent with those findings, our CD74-directed ADC achieved potent killing of lymphoma cells in vitro. Critically, however, our approach diverges from prior CD74-targeted agents by employing a non-traditional payload. Whereas STRO-001 uses a maytansinoid toxin that kills by disrupting microtubules, M-GB is a cell-impermeable cysteine protease inhibitor that remains essentially inactive until internalized into the target cell. This distinction could have important clinical ramifications. Traditional ADC payloads (tubulin poisons, DNA-damaging agents, etc.) can diffuse out of target cells or be released prematurely, causing “bystander” damage to normal proliferating cells[19]. In contrast, the cathepsin inhibitor payload in our ADC is designed to act only within the CD74-expressing tumor cell, theoretically minimizing collateral toxicity. Our strategy thereby exemplifies a new generation of ADCs that carry therapeutic molecules other than conventional chemotherapy drugs. By widening the mechanism of action beyond cell division inhibitors, such ADCs aim to improve the therapeutic index and overcome resistance mechanisms that are not addressed by standard cytotoxins.
Dual targeting of a cell-surface antigen and an intracellular enzyme also has the intriguing benefit of potentially modulating the tumor microenvironment. Cathepsin L and related proteases secreted by tumor or stromal cells can degrade extracellular matrix components and cell-surface molecules[12], fostering an environment that promotes tumor invasion and shields the tumor from immune attack[14]. For example, CTSL can cleave adhesion molecules like E-cadherin and degrade immune signaling proteins, contributing to metastasis and immune evasion[13]. Inhibiting cathepsin activity within the tumor could therefore have a dual effect: directly inducing tumor cell apoptosis and simultaneously preserving the integrity of surrounding immune and structural elements. While our study focused on the cytotoxic impact of the CD74-targeted cathepsin inhibitor, it is conceivable that this approach could enhance anti-tumor immune responses by preventing the proteolytic degradation of tumor antigens and immune receptors in the lymphoma microenvironment. This hypothesis warrants investigation in future in vivo studies – for instance, evaluating whether our ADC can improve immune effector cell infiltration or function in DLBCL tumors. Such an immune-modulatory benefit would further distinguish cathepsin inhibitor ADCs from traditional ADCs, which generally do not directly augment immune activity.
Looking ahead, our dual-targeting strategy opens several new avenues for research and therapy development. First, in vivo validation will be crucial. Although our ADC showed specificity and efficacy in vitro, testing in DLBCL animal models (including patient-derived xenografts) is needed to confirm tumor delivery, anti-lymphoma activity, and safety in an organismal context. These studies will help determine the therapeutic window and whether the drug is on-target. Our ADC’s inert payload design may further improve tolerability. Patients with relapsed/refractory DLBCL, especially those who have exhausted anti-CD20 and CAR-T therapies, could potentially benefit from a CD74-directed cathepsin L inhibitor ADC. Notably, this approach may be particularly useful for individuals whose tumors have low or no CD20 expression – a scenario where current standard therapies are ineffective. Third, the concept of ADCs with non-traditional payloads can be extended beyond CD74 or DLBCL. Our platform could be adapted to other surface antigens that are highly expressed and rapidly internalized in malignant cells, whether in other lymphoma subtypes or even solid tumors. It offers a form of “precision pharmacology” whereby we deliver a targeted inhibitor (e.g., a protease inhibitor, kinase inhibitor, or metabolic enzyme inhibitor) directly to the cancer cell that depends on that pathway. Recent studies have begun to explore innovative ADC payloads, such as an ADC delivering a nicotinamide phosphoribosyltransferase (NAMPT) [29]inhibitor to CD30-positive lymphoma cells, which produced complete tumor regressions in preclinical models with a favorable safety profile. Kinesin spindle protein (KSP) inhibitors have likewise been successfully deployed as ADC payloads to avoid the neurological side effects of traditional microtubule poisons[30]. These examples illustrate the untapped potential of payload diversification in expanding our armamentarium against cancer. By integrating unique mechanism-of-action payloads, future ADCs could target cancer cell dependencies that were previously undruggable due to systemic toxicity[30]. Our study contributes to this growing field by showing that a protease inhibitor – essentially a “biochemical missile” against a tumor’s invasive and survival machinery – can be effectively used as an ADC payload in lymphoma.
In conclusion, dual targeting of CD74 and cathepsin L represents a novel therapeutic paradigm for aggressive B-cell lymphomas. We have shown that an ADC can be engineered to precisely deliver a cathepsin inhibitor to lymphoma cells, resulting in potent tumor cell killing while sparing normal cells. This strategy addresses both surface antigen escape and intracellular resistance pathways, which are common hurdles in DLBCL treatment. The translational implications of our findings are significant: a CD74-targeted cathepsin L inhibitor ADC could provide a much-needed option for patients with refractory DLBCL or those who cannot benefit from CD20-directed therapies. By validating cathepsin L as a therapeutic target and introducing an ADC with a non-classical payload, our work lays the groundwork for clinical evaluation of a first-in-class biologic. If successful, it may establish a new paradigm in which tumor cell-surface targeting is combined with modulation of a key tumor-promoting enzyme, thereby integrating direct tumor cytotoxicity with alteration of the tumor microenvironment. This dual-target approach exemplifies the next generation of precision medicine for lymphoma and potentially other cancers, and it warrants further investigation in preclinical models and clinical trials to fully realize its promise.
Ethical approval and consent to participate
Collection of patient samples was approved by the Hadassah Medical Organization IRB (approval #HMO-0144-16, approval date: 02.02.2025). Informed consent was obtained from all participants in accordance with the Declaration of Helsinki.
Consent for publication
All authors consent to the publication of this manuscript.
Availability of data and materials
All data generated or analyzed in this study are included in this published article.
Funding
This work was supported by the Rothschild Foundation (COVID grant) and the Israel Science Foundation (grants #1638/19 to G.B. and I.A., and #2704/19 to D.B.Y.), as well as the Lewis Family Trust (D.B.Y.).
Author Contributions
I.A. and R.P. designed the study. I.Z. and R.S. synthesized the M-GB compound. I.A. and N.K. performed experiments, analyzed data, and interpreted results. E.M. provided technical support. G.B. and D.B.Y. supervised the project. I.A., G.B., and R.P. wrote the manuscript. All authors read and approved of the final manuscript.
Competing interests
The authors declare no competing interests.
References
- Susanibar-Adaniya, S. & Barta, S. K. 2021 Update on Diffuse large B cell lymphoma: A review of current data and potential applications on risk stratification and management. Am J Hematol 96, 617-629 (2021). [CrossRef]
- Coiffier, B. & Sarkozy, C. Diffuse large B-cell lymphoma: R-CHOP failure-what to do? Hematology Am Soc Hematol Educ Program 2016, 366-378 (2016). [CrossRef]
- Schmitz, R. et al. Burkitt lymphoma pathogenesis and therapeutic targets from structural and functional genomics. Nature 490, 116-120 (2012). [CrossRef]
- Stiff, P. J. et al. Autologous transplantation as consolidation for aggressive non-Hodgkin's lymphoma. N Engl J Med 369, 1681-1690 (2013). [CrossRef]
- Li, X. et al. Targeting CD74 in B-cell non-Hodgkin lymphoma with the antibody-drug conjugate STRO-001. Oncotarget 14, 1-13 (2023). [CrossRef]
- Morin, R. D., Arthur, S. E. & Hodson, D. J. Molecular profiling in diffuse large B-cell lymphoma: why so many types of subtypes? Br J Haematol 196, 814-829 (2022). [CrossRef]
- Bock, A. M. & Epperla, N. Therapeutic landscape of primary refractory and relapsed diffuse large B-cell lymphoma: Recent advances and emerging therapies. J Hematol Oncol 18, 68 (2025). [CrossRef]
- Thiruvengadam, S. K. et al. Cost-effectiveness of polatuzumab vedotin combined with chemoimmunotherapy in untreated diffuse large B-cell lymphoma. Blood 140, 2697-2708 (2022). [CrossRef]
- Song, Y. Q. et al. Glofitamab monotherapy induces high complete response rates and manageable safety in Chinese patients with heavily pretreated relapsed or refractory diffuse large B-cell lymphoma. Haematologica 109, 1269-1273 (2024). [CrossRef]
- García-Sancho, A. M., Cabero, A. & Gutiérrez, N. C. Treatment of Relapsed or Refractory Diffuse Large B-Cell Lymphoma: New Approved Options. J Clin Med 13 (2023). [CrossRef]
- Löser, R. & Pietzsch, J. Cysteine cathepsins: their role in tumor progression and recent trends in the development of imaging probes. Front Chem 3, 37 (2015). [CrossRef]
- Radisky, E. S. Extracellular proteolysis in cancer: Proteases, substrates, and mechanisms in tumor progression and metastasis. J Biol Chem 300, 107347 (2024). [CrossRef]
- Almalki, A. A. et al. Targeting Cathepsin L in Cancer Management: Leveraging Machine Learning, Structure-Based Virtual Screening, and Molecular Dynamics Studies. Int J Mol Sci 24 (2023). [CrossRef]
- Zhao, K., Sun, Y., Zhong, S. & Luo, J. L. The multifaceted roles of cathepsins in immune and inflammatory responses: implications for cancer therapy, autoimmune diseases, and infectious diseases. Biomark Res 12, 165 (2024). [CrossRef]
- Wilkinson, R. D. et al. CCL2 is transcriptionally controlled by the lysosomal protease cathepsin S in a CD74-dependent manner. Oncotarget 6, 29725-29739 (2015). [CrossRef]
- Colella, R. et al. Induction of cell death in neuroblastoma by inhibition of cathepsins B and L. Cancer Lett 294, 195-203 (2010). [CrossRef]
- Zhao, S. et al. High frequency of CD74 expression in lymphomas: implications for targeted therapy using a novel anti-CD74-drug conjugate. J Pathol Clin Res 5, 12-24 (2019). [CrossRef]
- Berkova, Z. et al. CD74 interferes with the expression of fas receptor on the surface of lymphoma cells. J Exp Clin Cancer Res 33, 80 (2014). [CrossRef]
- Wang, R. et al. Antibody–Drug Conjugates (ADCs): current and future biopharmaceuticals. Journal of Hematology & Oncology 18, 51 (2025). [CrossRef]
- Blum, G. et al. Dynamic imaging of protease activity with fluorescently quenched activity-based probes. Nature Chemical Biology 1, 203-209 (2005).
- Blum, G., von Degenfeld, G., Merchant, M. J., Blau, H. M. & Bogyo, M. Noninvasive optical imaging of cysteine protease activity using fluorescently quenched activity-based probes. Nature Chemical Biology 3, 668-677 (2007).
- Grønbaek, K. & Jäättelä, M. Engaging the lysosomal compartment to combat B cell malignancies. J Clin Invest 119, 2133-2136 (2009). [CrossRef]
- Chavez, J. C. & Locke, F. L. CAR T cell therapy for B-cell lymphomas. Best Pract Res Clin Haematol 31, 135-146 (2018). [CrossRef]
- Rudzińska, M. et al. The Role of Cysteine Cathepsins in Cancer Progression and Drug Resistance. Int J Mol Sci 20 (2019). [CrossRef]
- Michot, J. M. et al. Clinical significance of the loss of CD20 antigen on tumor cells in patients with relapsed or refractory follicular lymphoma. Cancer Drug Resist 4, 710-718 (2021). [CrossRef]
- Zhang, J. et al. Cystatin m: a novel candidate tumor suppressor gene for breast cancer. Cancer Res 64, 6957-6964 (2004). [CrossRef]
- Mohamed, M. M. & Sloane, B. F. Cysteine cathepsins: multifunctional enzymes in cancer. Nat Rev Cancer 6, 764-775 (2006). [CrossRef]
- Zhang, L., Wang, H. & Xu, J. Cathepsin S as a cancer target. Neoplasma 62, 16-26 (2015).
- Neumann, C. S. et al. Targeted Delivery of Cytotoxic NAMPT Inhibitors Using Antibody-Drug Conjugates. Mol Cancer Ther 17, 2633-2642 (2018). [CrossRef]
- Conilh, L., Sadilkova, L., Viricel, W. & Dumontet, C. Payload diversification: a key step in the development of antibody–drug conjugates. Journal of Hematology & Oncology 16, 3 (2023). [CrossRef]
Figure 1.
Expression, correlation, and prognostic value of CTSL and CD74 across cancers. (a) CTSL expression (TPM) across tumor and normal tissues from TCGA and GTEx datasets. Red bars indicate tumor tissues; black bars indicate normal tissues. CTSL expression is elevated in multiple tumor types, especially KIRC, HNSC, and DLBC. (b) CD74 expression across the same tissues shows strong upregulation in tumors, most notably in DLBC and KIRC. (c) Correlation analysis between CTSL and CD74 expression in DLBCL (vs normal control tissue) reveals a significant positive correlation (Spearman R = 0.64, p = 3e−46), suggesting possible co-expression or co-regulation. (d) Kaplan-Meier survival plot of disease-free survival (DFS) based on CD74 expression. Patients with high CD74 levels showed significantly reduced DFS (log-rank p = 0.0024, HR = 5.4e+08). (e) DFS plot stratified by CTSL expression. High CTSL expression was similarly associated with poor DFS (log-rank p = 0.0043, HR = 5.4e+08), indicating its potential as a negative prognostic biomarker.
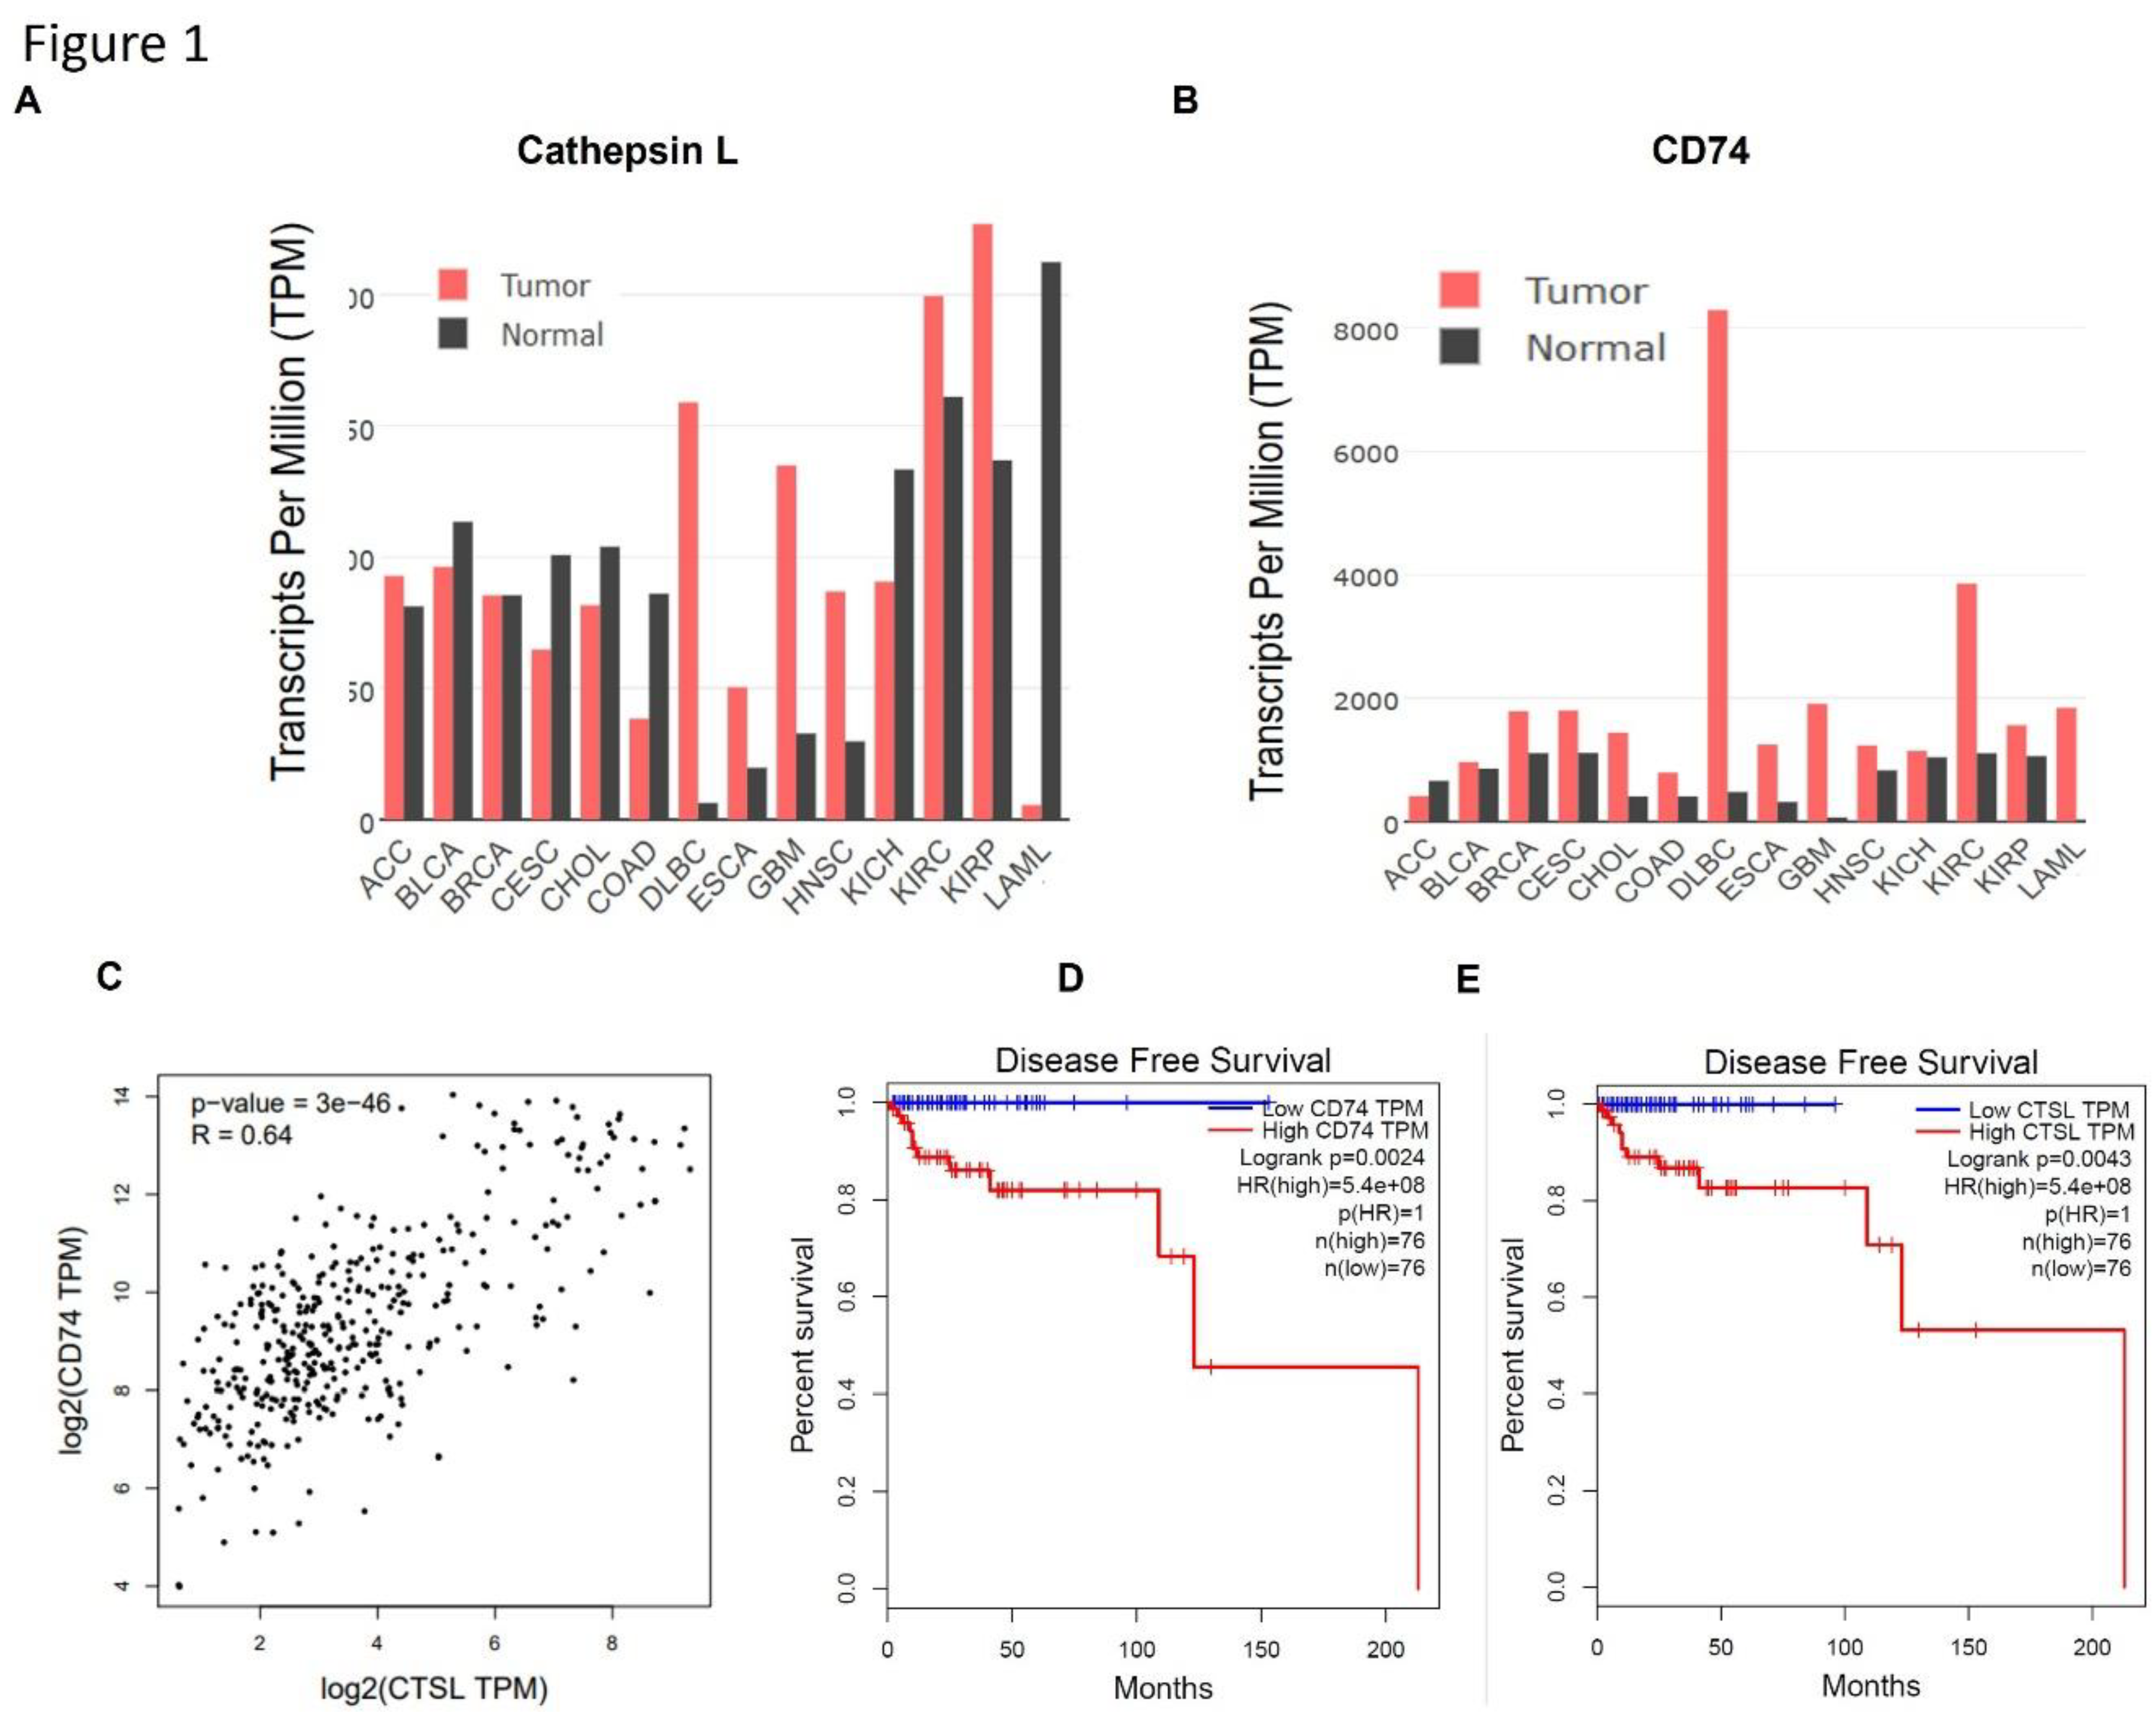
Figure 2.
Cathepsin activities in hematological malignancy patient cells and cell lines. (a) Lysates of cells from healthy donors and patients with hematologic malignancies (CLL, DLBCL, MZL) were pretreated with DMSO or with a cathepsin inhibitor (5 µM GB111-NH₂) for 30 minutes, then labeled with 1 µM GB123 for 1 hour. Equal amounts of protein were loaded for SDS-PAGE, and active cathepsins were visualized by fluorescent gel scanning. Each pair of lanes (vehicle and inhibitor pretreated) was from a different patient. (b) Cathepsin activities in cell lines of various hematologic malignancies. Cell lysates were pretreated with 5 µM GB111-NH₂ or DMSO vehicle for 20 minutes and then labelled with 1 µM GB123 for an hour. Labeled lysates were analyzed by SDS-PAGE and scanning. Arrows indicate bands corresponding to active cathepsins. (c) Immunoprecipitation of active cathepsins from OCI-Ly19 cells. Lysates were labeled with GB123 as in (a), then immunoprecipitated with antibodies against cathepsin L (CTS-L) left, or cathepsin S (CTS-S), right. The fluorescent signals in the supernatant (S) and immunoprecipitated eluate (e) fractions were analyzed by SDS-PAGE and scanning, confirming the identities of the ~20 kDa (cathepsin L) and ~25 kDa (cathepsin S) bands.
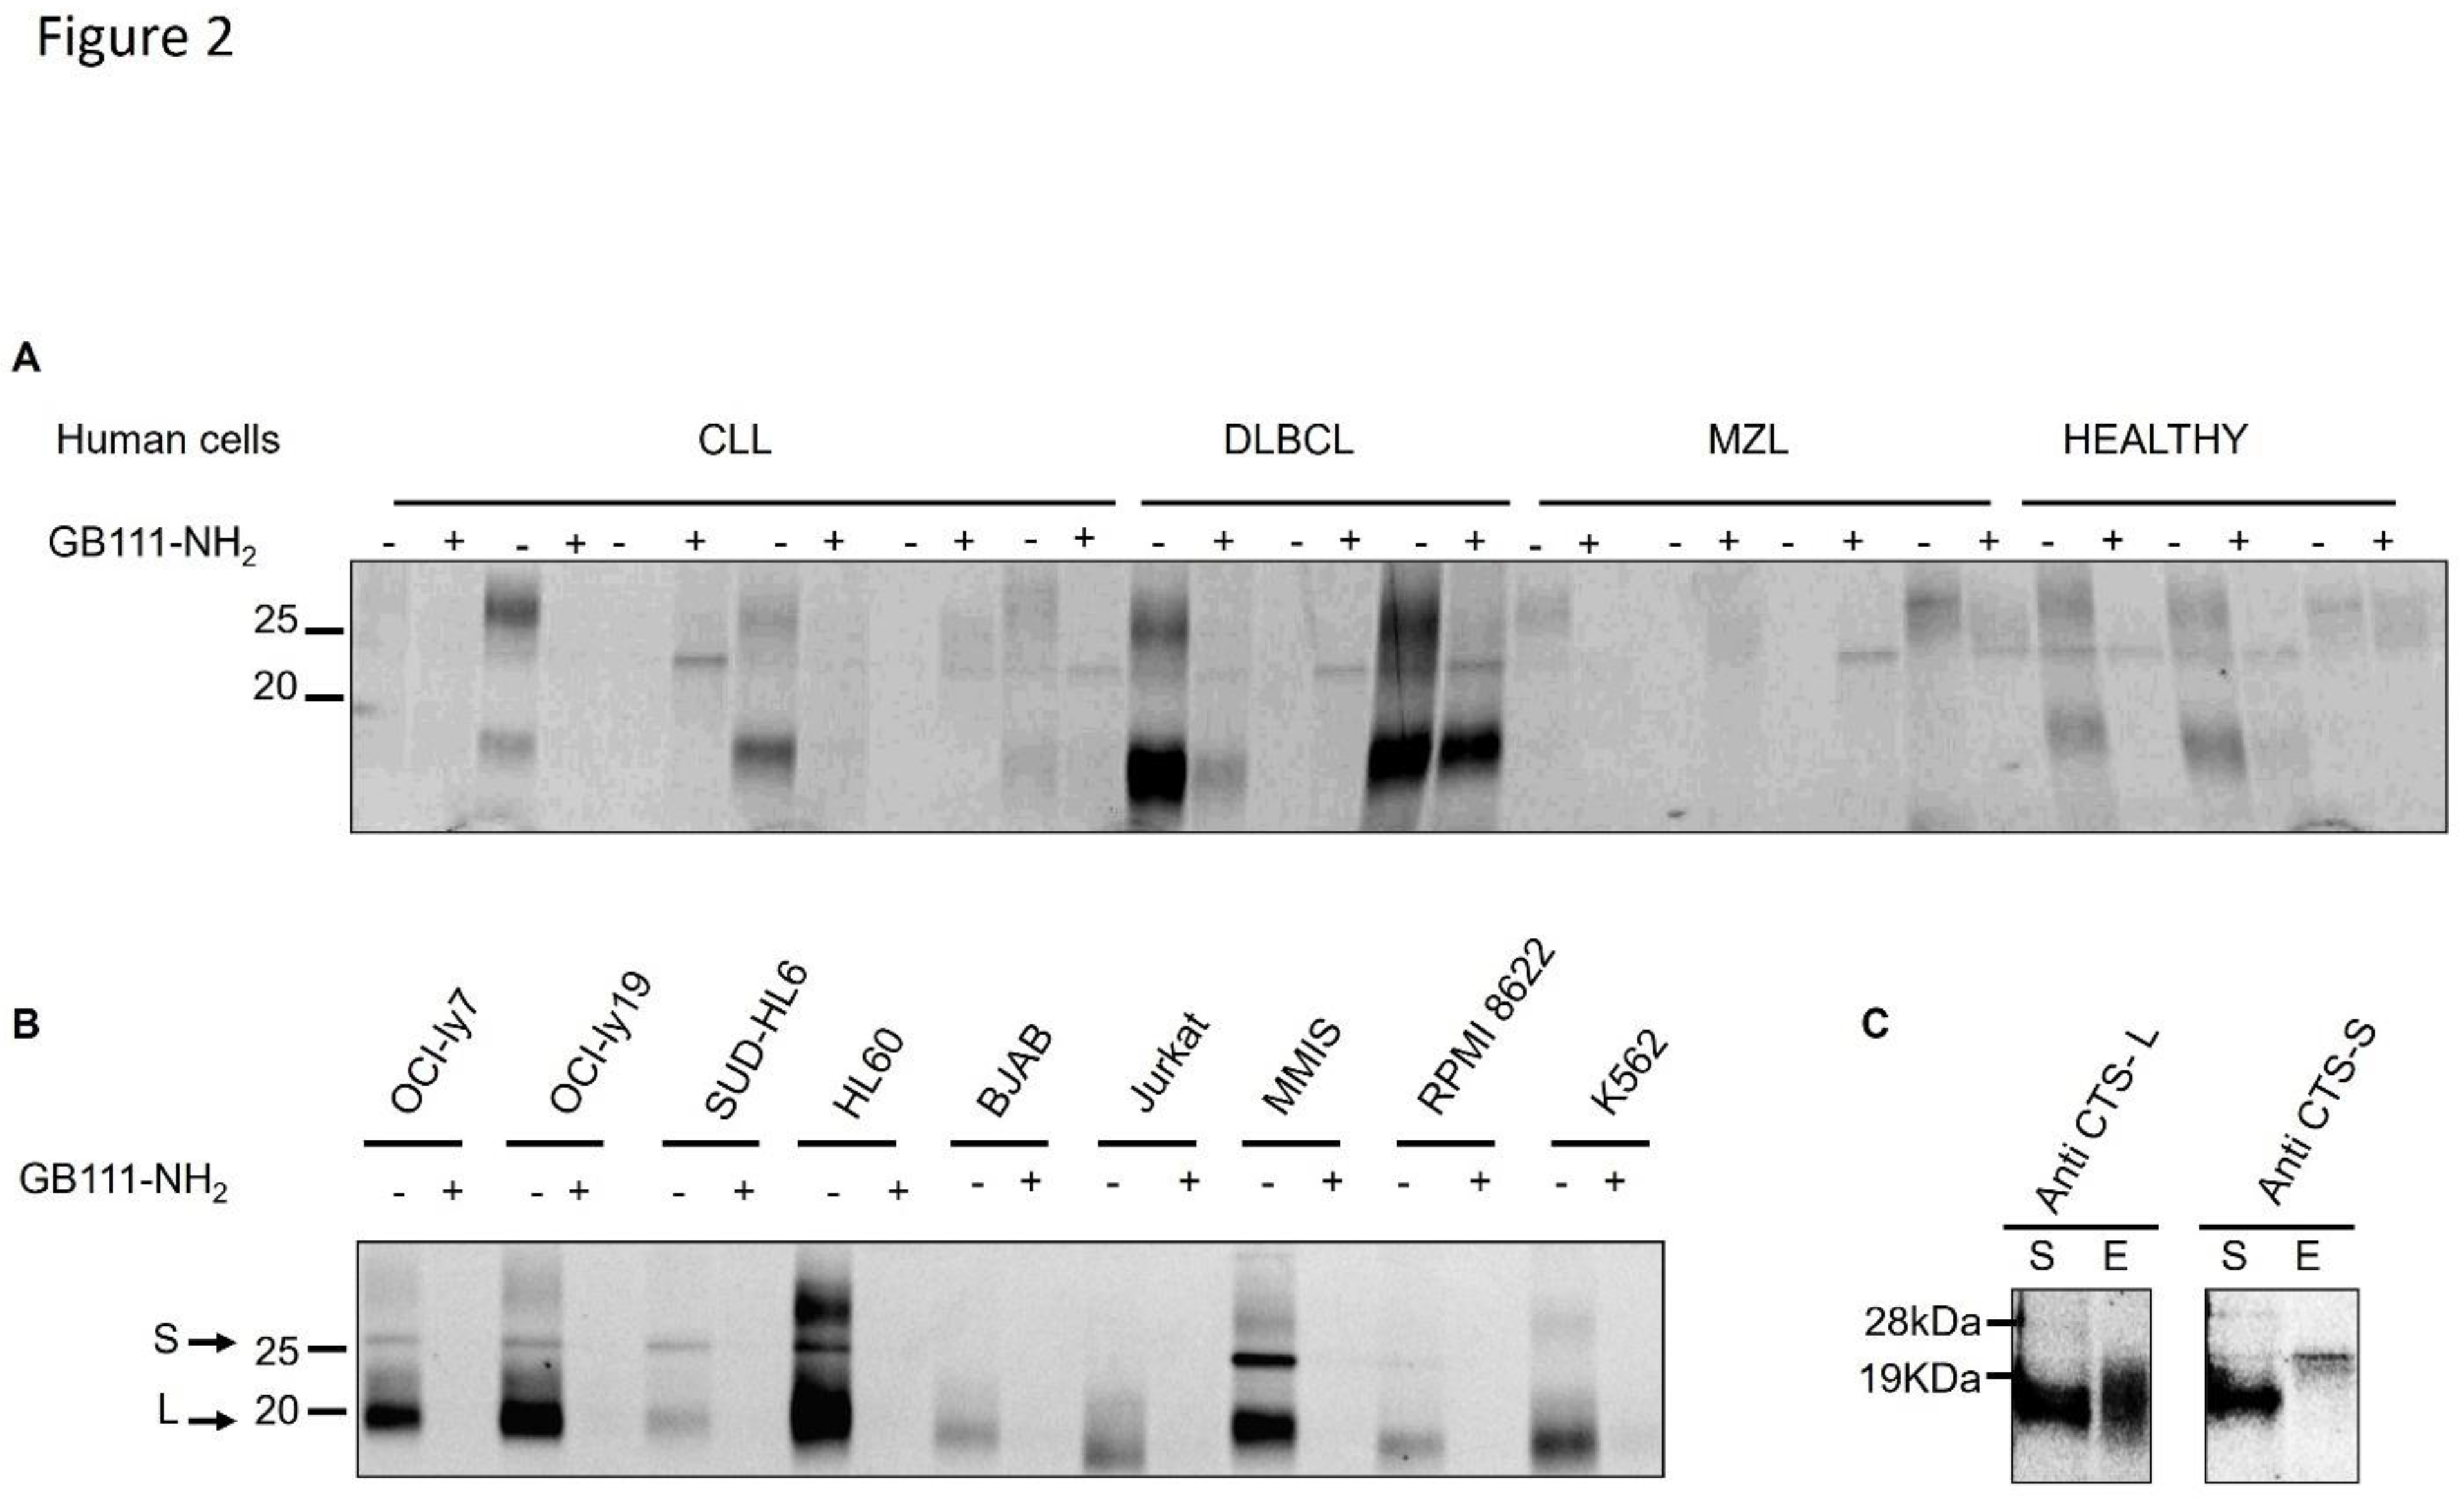
Figure 3.
Cathepsin inhibition induces apoptosis. (a) OCI-Ly19 cells were treated with 5 µM GB111-NH₂ for 1 hour. Caspase-3 activity was measured 24 hours later in cell lysates (100 µg protein) using a colorimetric substrate (Ac-DEVD-pNA), which produces a 405 nm signal upon cleavage. (b) OCI-Ly19 cells were treated with 5 µM GB111-NH₂ for 1 hour, then 24 hours later were stained with Annexin V and analyzed by flow cytometry to assess apoptosis. (c) Mononuclear cells from CLL patients were treated with 5 µM GB111-NH₂ for 1 hour, stained with Annexin V 24 hours later and analyzed by flow cytometry. (d) Lysates from the CLL cells in (c) were labeled with 1 µM GB123 for 1 hour and analyzed as in Figure 1A; the gel was Coomassie-stained to verify equal loading. In (a-d), graphs represent mean ± SD (n = 4). p<0.05 (two-tailed Student’s t-test) for inhibitor-treated vs control.
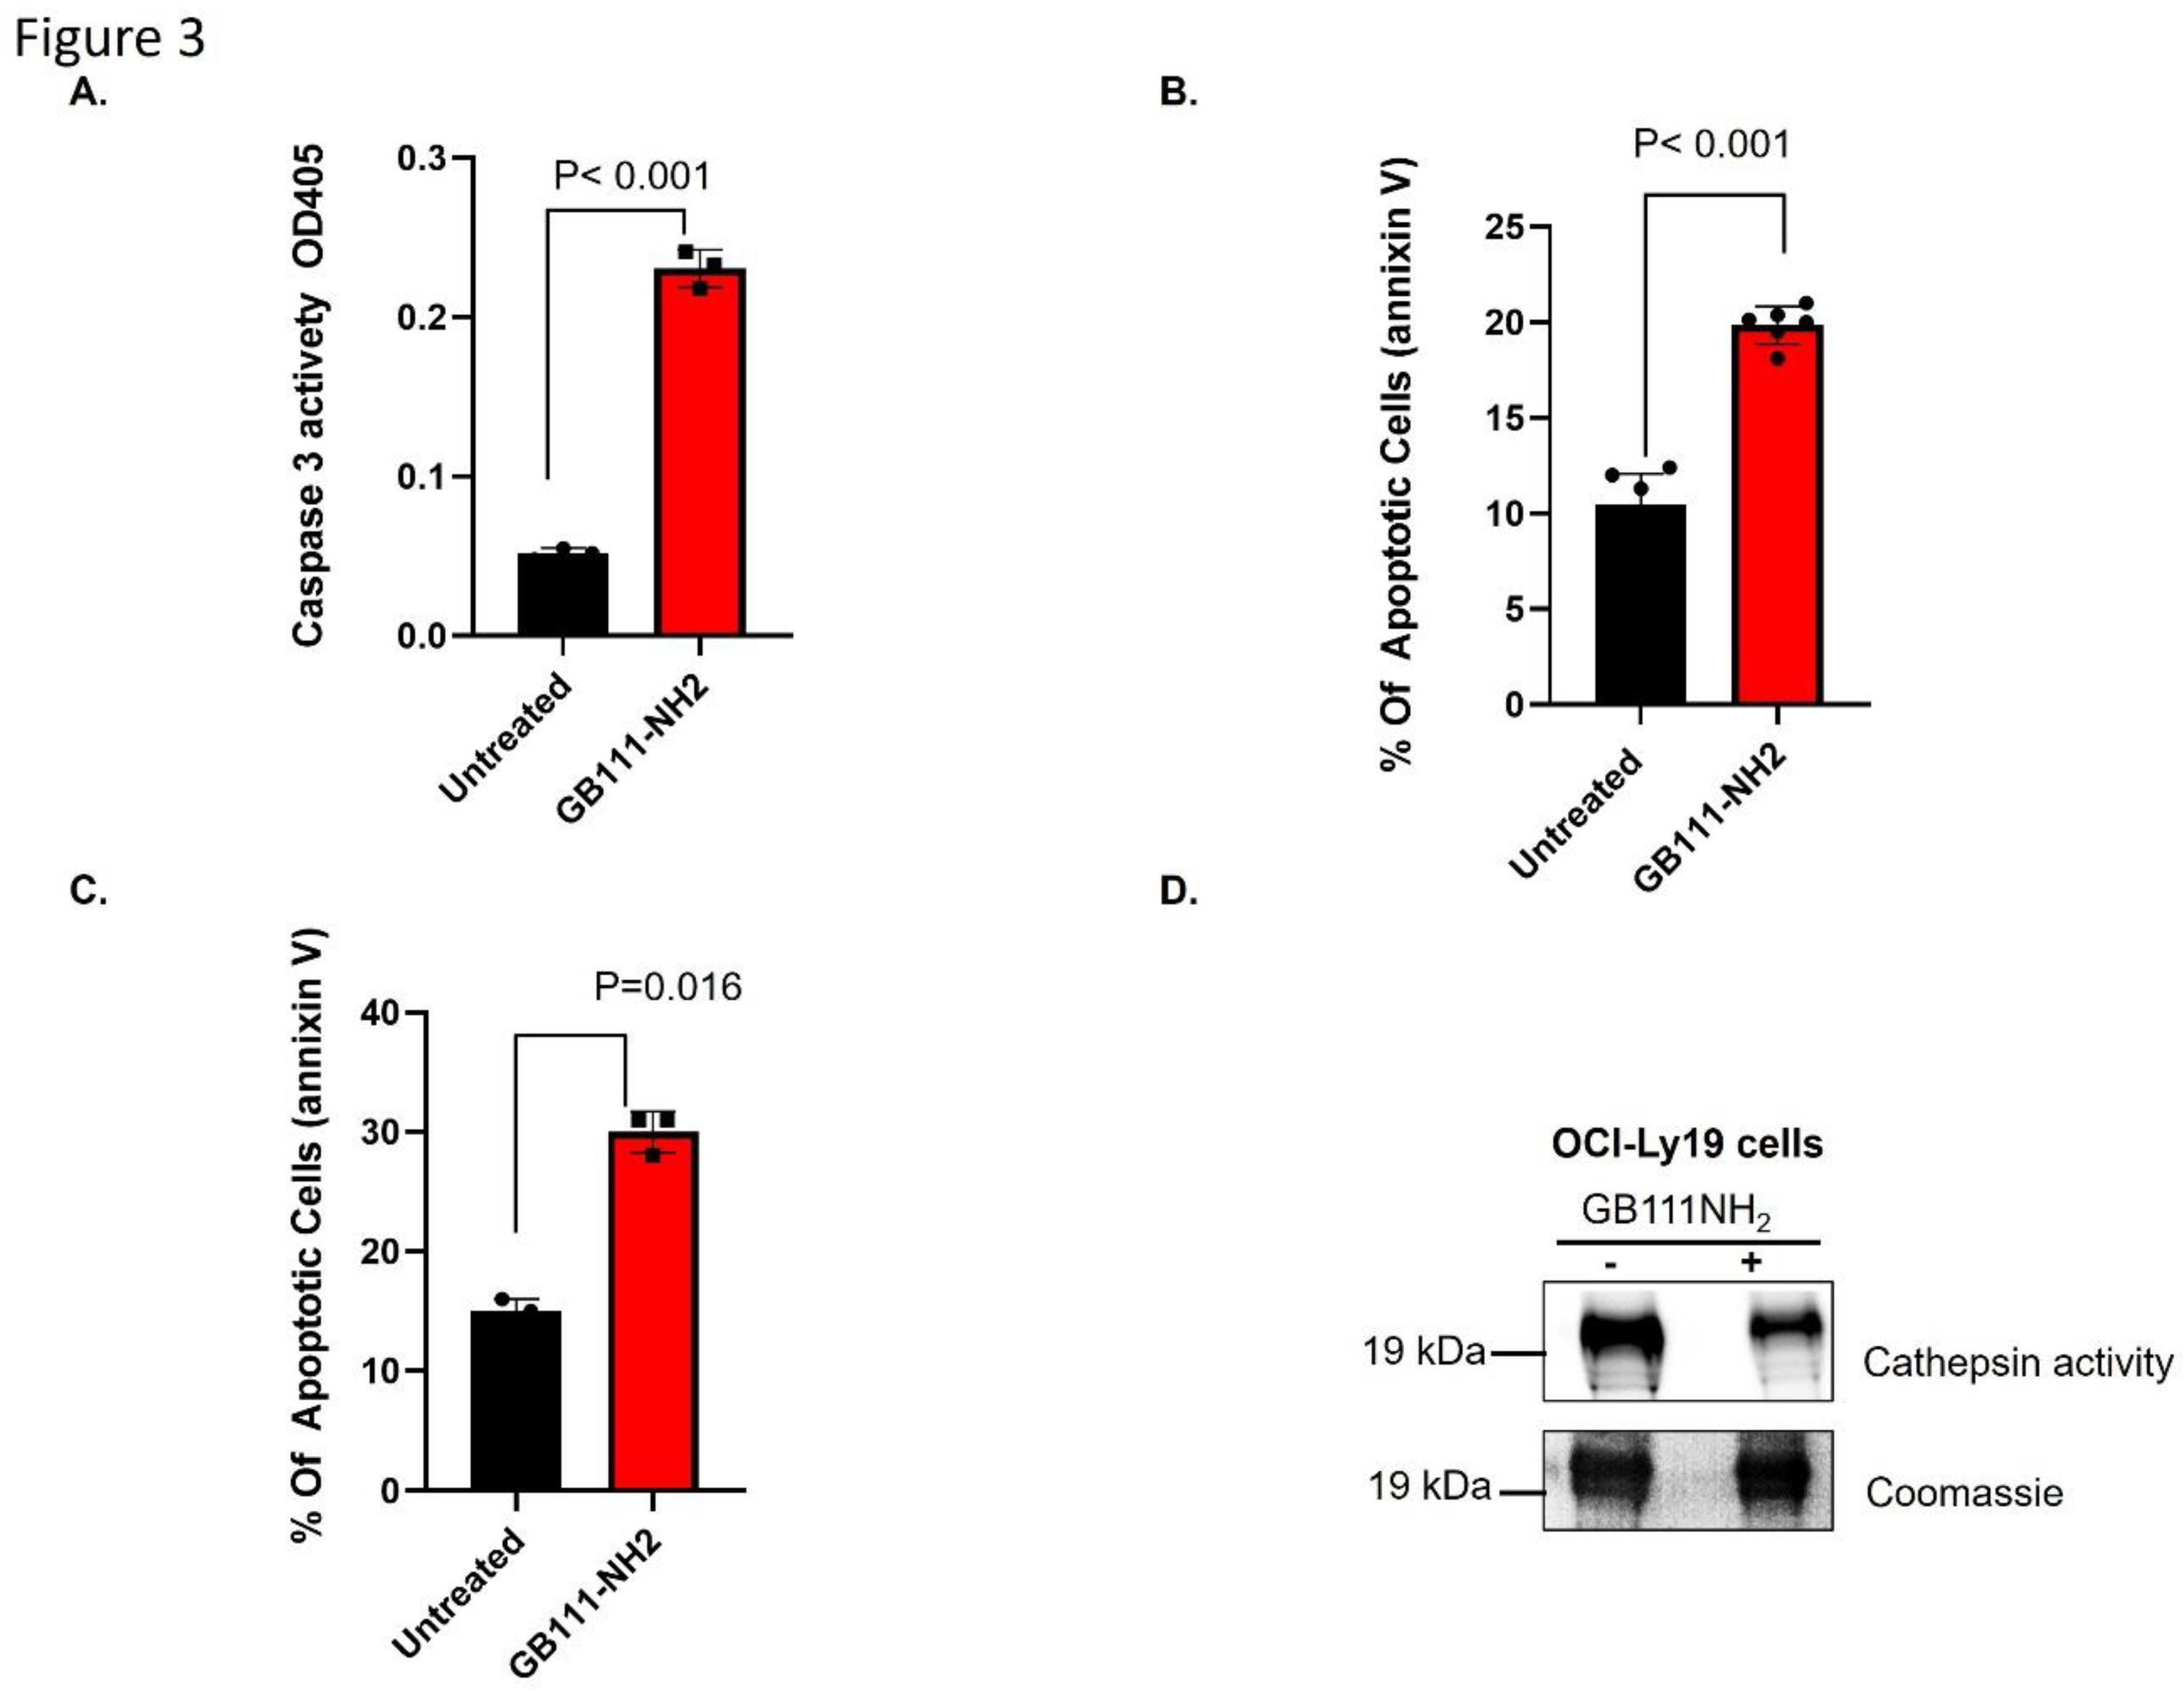
Figure 4.
Cathepsin inhibition negatively regulates NF-κB and CD74. (a) OCI-Ly19 cells stably transfected with an NF-κB luciferase reporter were treated for 24 hours ± LPS (0.5 µg/mL) in the presence or absence of 5 µM GB111-NH₂ or 10 µM SC-514 (a p65 inhibitor). NF-κB activity was measured by luciferase assay. LPS stimulation increased NF-κB activity (relative light units, RLUs) substantially, and GB111-NH₂ suppressed this induction, similar to the effect of SC-514. (b) Cell lysates from the experiment in (a) were labeled with 1 µM GB123 for 1 hour. SDS-PAGE and fluorescent scanning analyzed equal protein samples to assess active cathepsins. GB111-NH₂ effectively blocked the cathepsin activity bands under both basal and LPS-stimulated conditions. (c) Cell-surface CD74 expression was measured by flow cytometry in OCI-Ly19 cells treated for 24 hours with GB111-NH₂ (5 µM), LPS (0.5 µg/mL), or LPS + GB111-NH₂. LPS increased surface CD74, whereas GB111-NH₂ reduced surface CD74 levels (especially when combined with LPS). Graphs show mean ± SD (n = 6–10). p<0.05 for indicated comparisons (Student’s t-test).
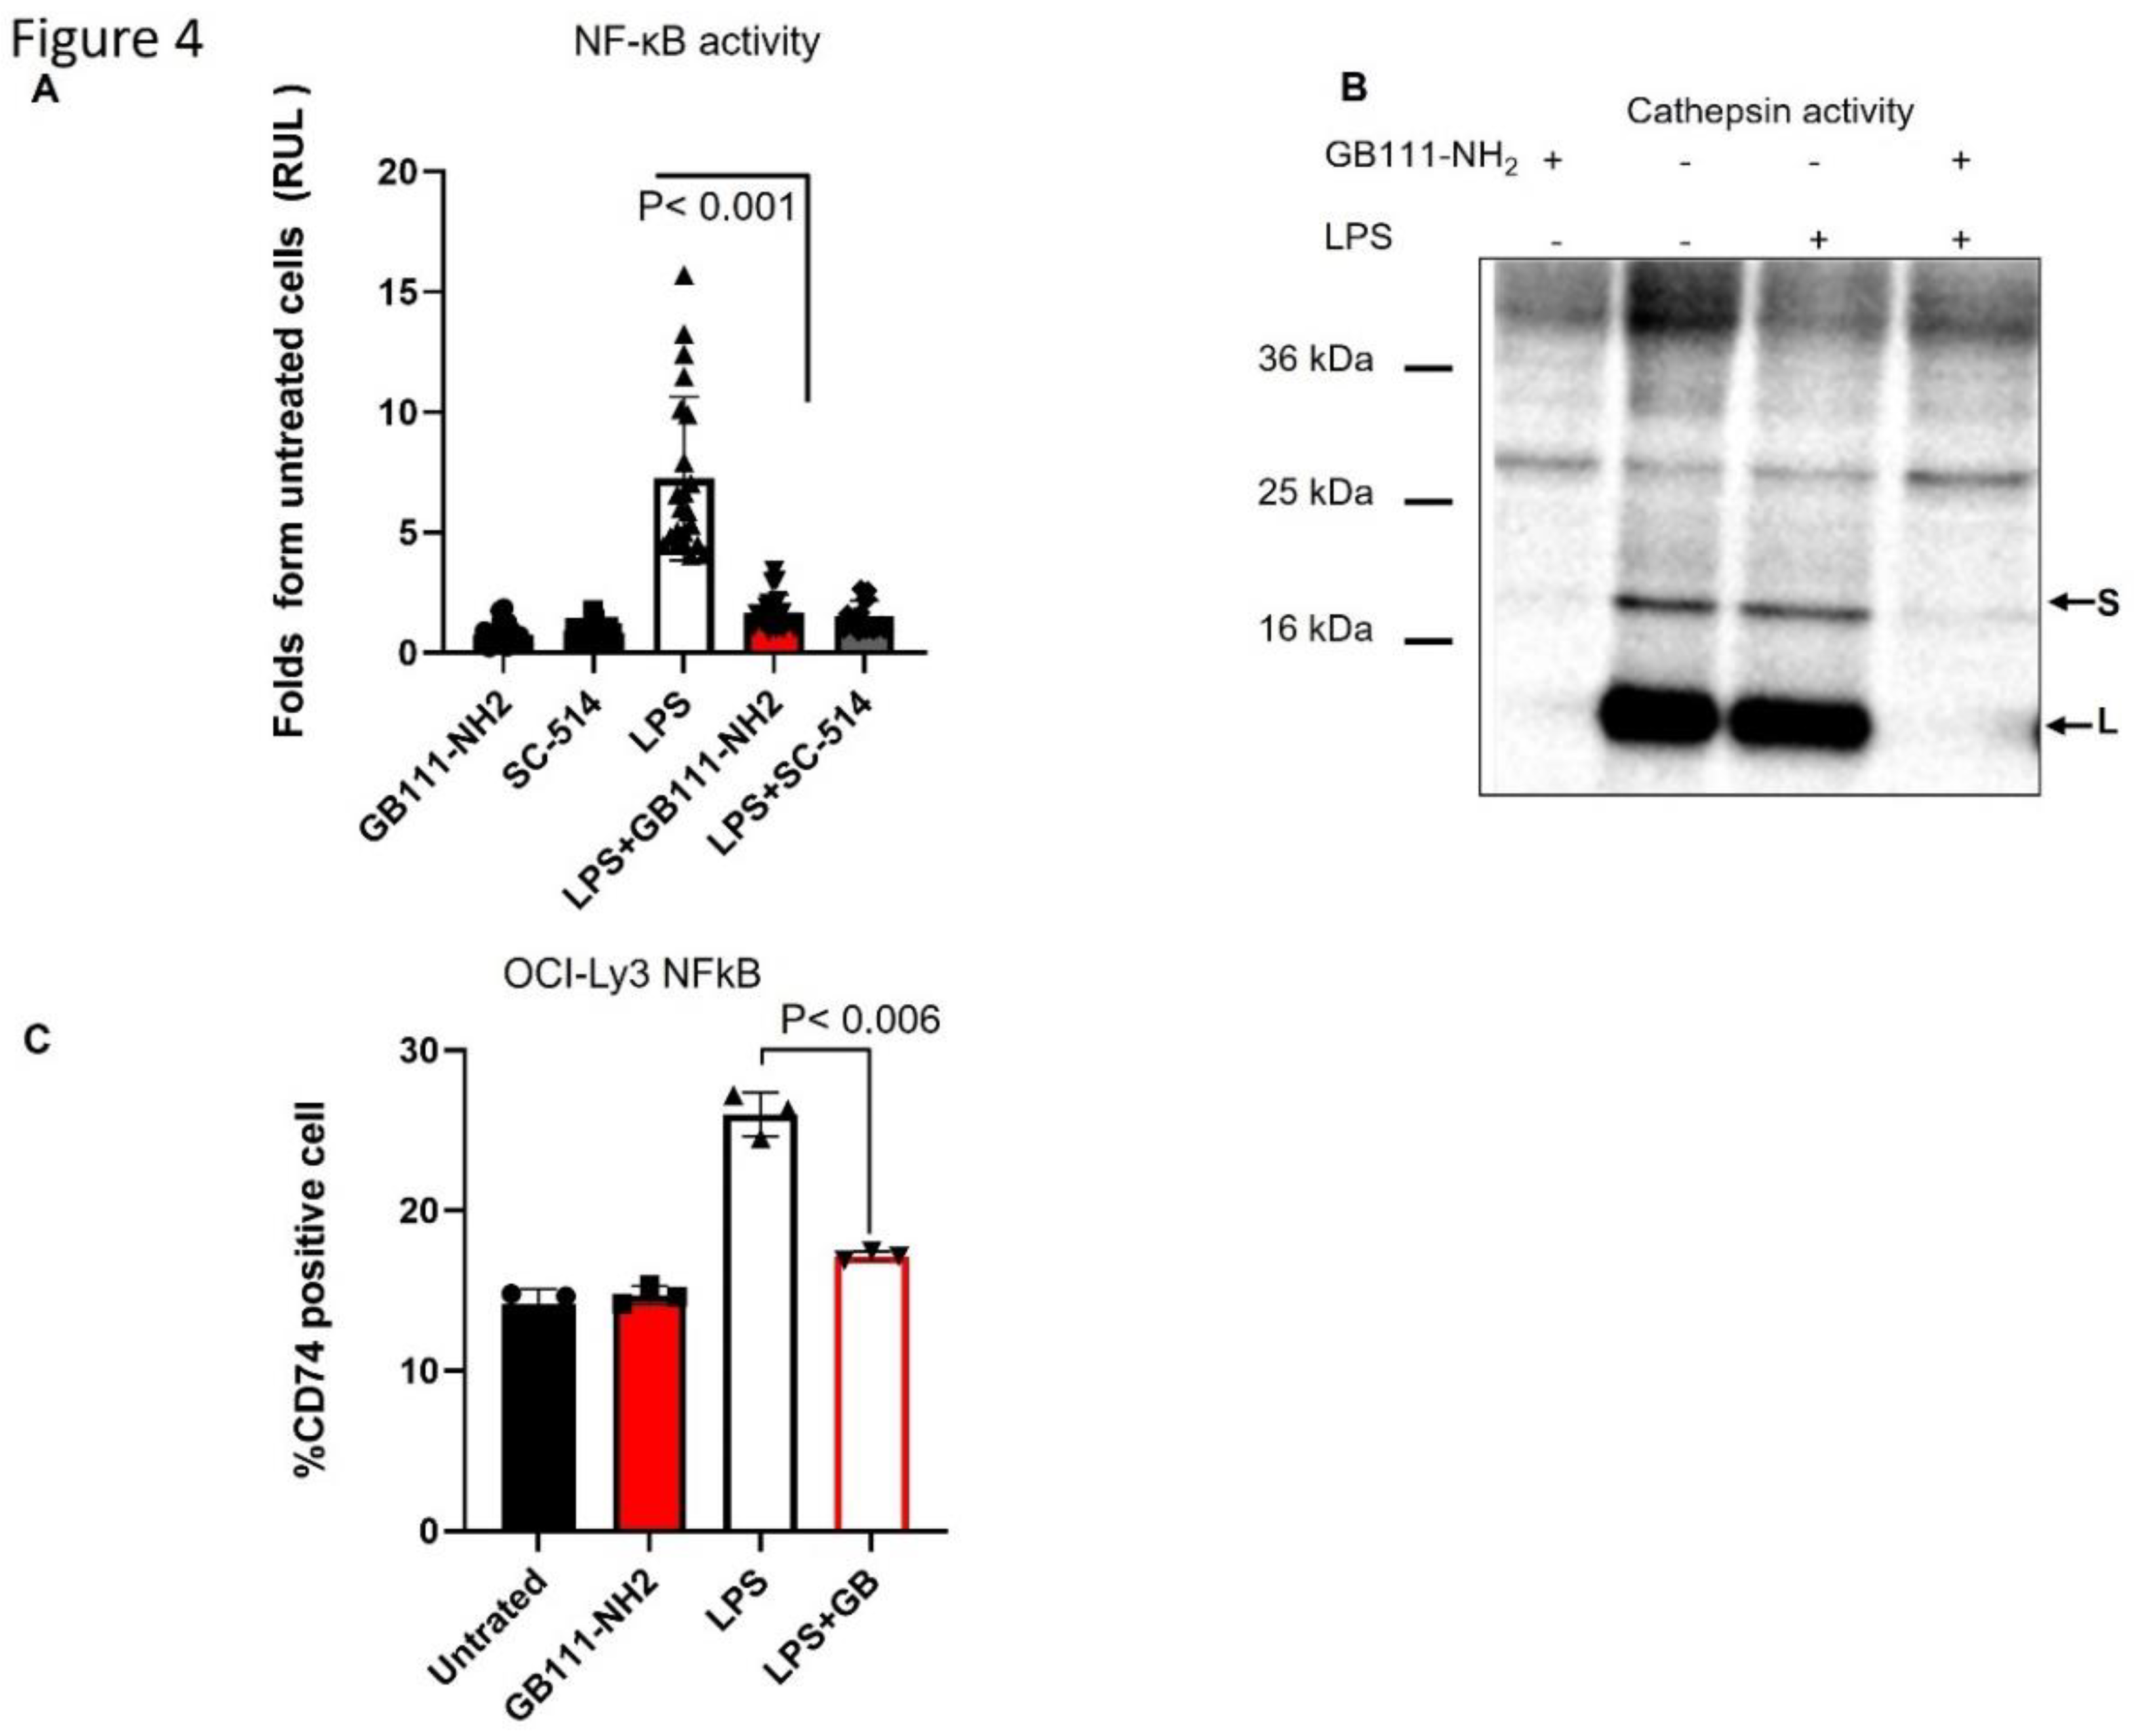
Figure 5.
Design and effects of a cathepsin inhibitor ADC. (a) OCI-Ly19 cells were treated under different conditions for 24 hours: 5 µM GB111-NH₂ (1-hour pretreatment, then removal), an unconjugated antibody (control IgG), 2.5 µg/mL etoposide (24 hours), or an antibody–M-GB conjugate (ADC) for 24 hours. Cells were then stained with PI and analyzed by flow cytometry for apoptosis. GB111-NH₂, in combination with the antibody or etoposide, increased cell death compared to the antibody or etoposide alone. (b) Chemical structures of the parent inhibitor GB111-NH₂ and the maleimide-containing derivative M-GB. The maleimide linker (gray box) replaces the benzyloxycarbonyl group, enabling conjugation to antibodies. (c) Inhibition of purified recombinant cathepsins L (rCTSL) and S (rCTSS) by GB111-NH₂ vs M-GB. Recombinant enzymes (pH 5.5) were incubated with the indicated concentrations of each inhibitor or with 0.1% DMSO (vehicle) for 30 minutes, followed by labeling with 1 µM GB123 for 30 minutes. SDS-PAGE analyzed samples, and cathepsin activity was visualized by fluorescent scanning. (d) Inhibition of endogenous cathepsin activity in intact OCI-Ly19 cells. Cells were treated with 5 µM GB111-NH₂ or 5 µM M-GB for 2 hours, then labeled with 1 µM GB123 for 1 hour. SDS-PAGE and scanning analyzed cathepsin activity in cell lysates. GB111-NH₂ strongly reduced intracellular cathepsin signals, whereas M-GB had a minimal effect. Graphs show mean ± SD (n = 5). p<0.05 (two-tailed t-test).

Figure 6.
Rituximab–M-GB conjugate counters rituximab-induced cathepsin activity and enhances cell death. (a) OCI-Ly3 DLBCL cells were treated with or without rituximab (anti-CD20, 10 µg/mL) for 24 hours. Cell lysates were labeled with 1 µM GB123 for 1 hour, separated by SDS-PAGE, and scanned for active cathepsins. (b) Fluorescent quantification of cathepsin band intensities from (A). Rituximab treatment increased cathepsin activity bands (~25 kDa) by ~3.8-fold compared to untreated cells. (c) OCI-Ly3 cells were treated for 24 hours with rituximab alone, M-GB alone, or a rituximab–M-GB conjugate (R-M-GB). Cells were stained with PI and analyzed by flow cytometry for cell death. The R-M-GB conjugate induced higher cell death than rituximab or M-GB alone. (d) After the treatments in (c), cell lysates were labeled with 1 µM GB123 for 1 hour and analyzed by SDS-PAGE and scanning. Rituximab alone increased cathepsin activity (as in a), whereas R-M-GB treatment prevented this increase, keeping cathepsin activity low. E,f) Mononuclear cells from a CLL patient (E) and a MZL patient (F) were isolated by Ficoll. Cells were treated as indicated for 24 hours, stained with PI and analyzed by flow cytometry. R-M-GB treatment resulted in greater cell death (PI-positive cells) than either rituximab or M-GB alone in these primary samples. Graphs show mean ± SD (n = 5–6). p<0.05 for R-M-GB vs rituximab (t-test).
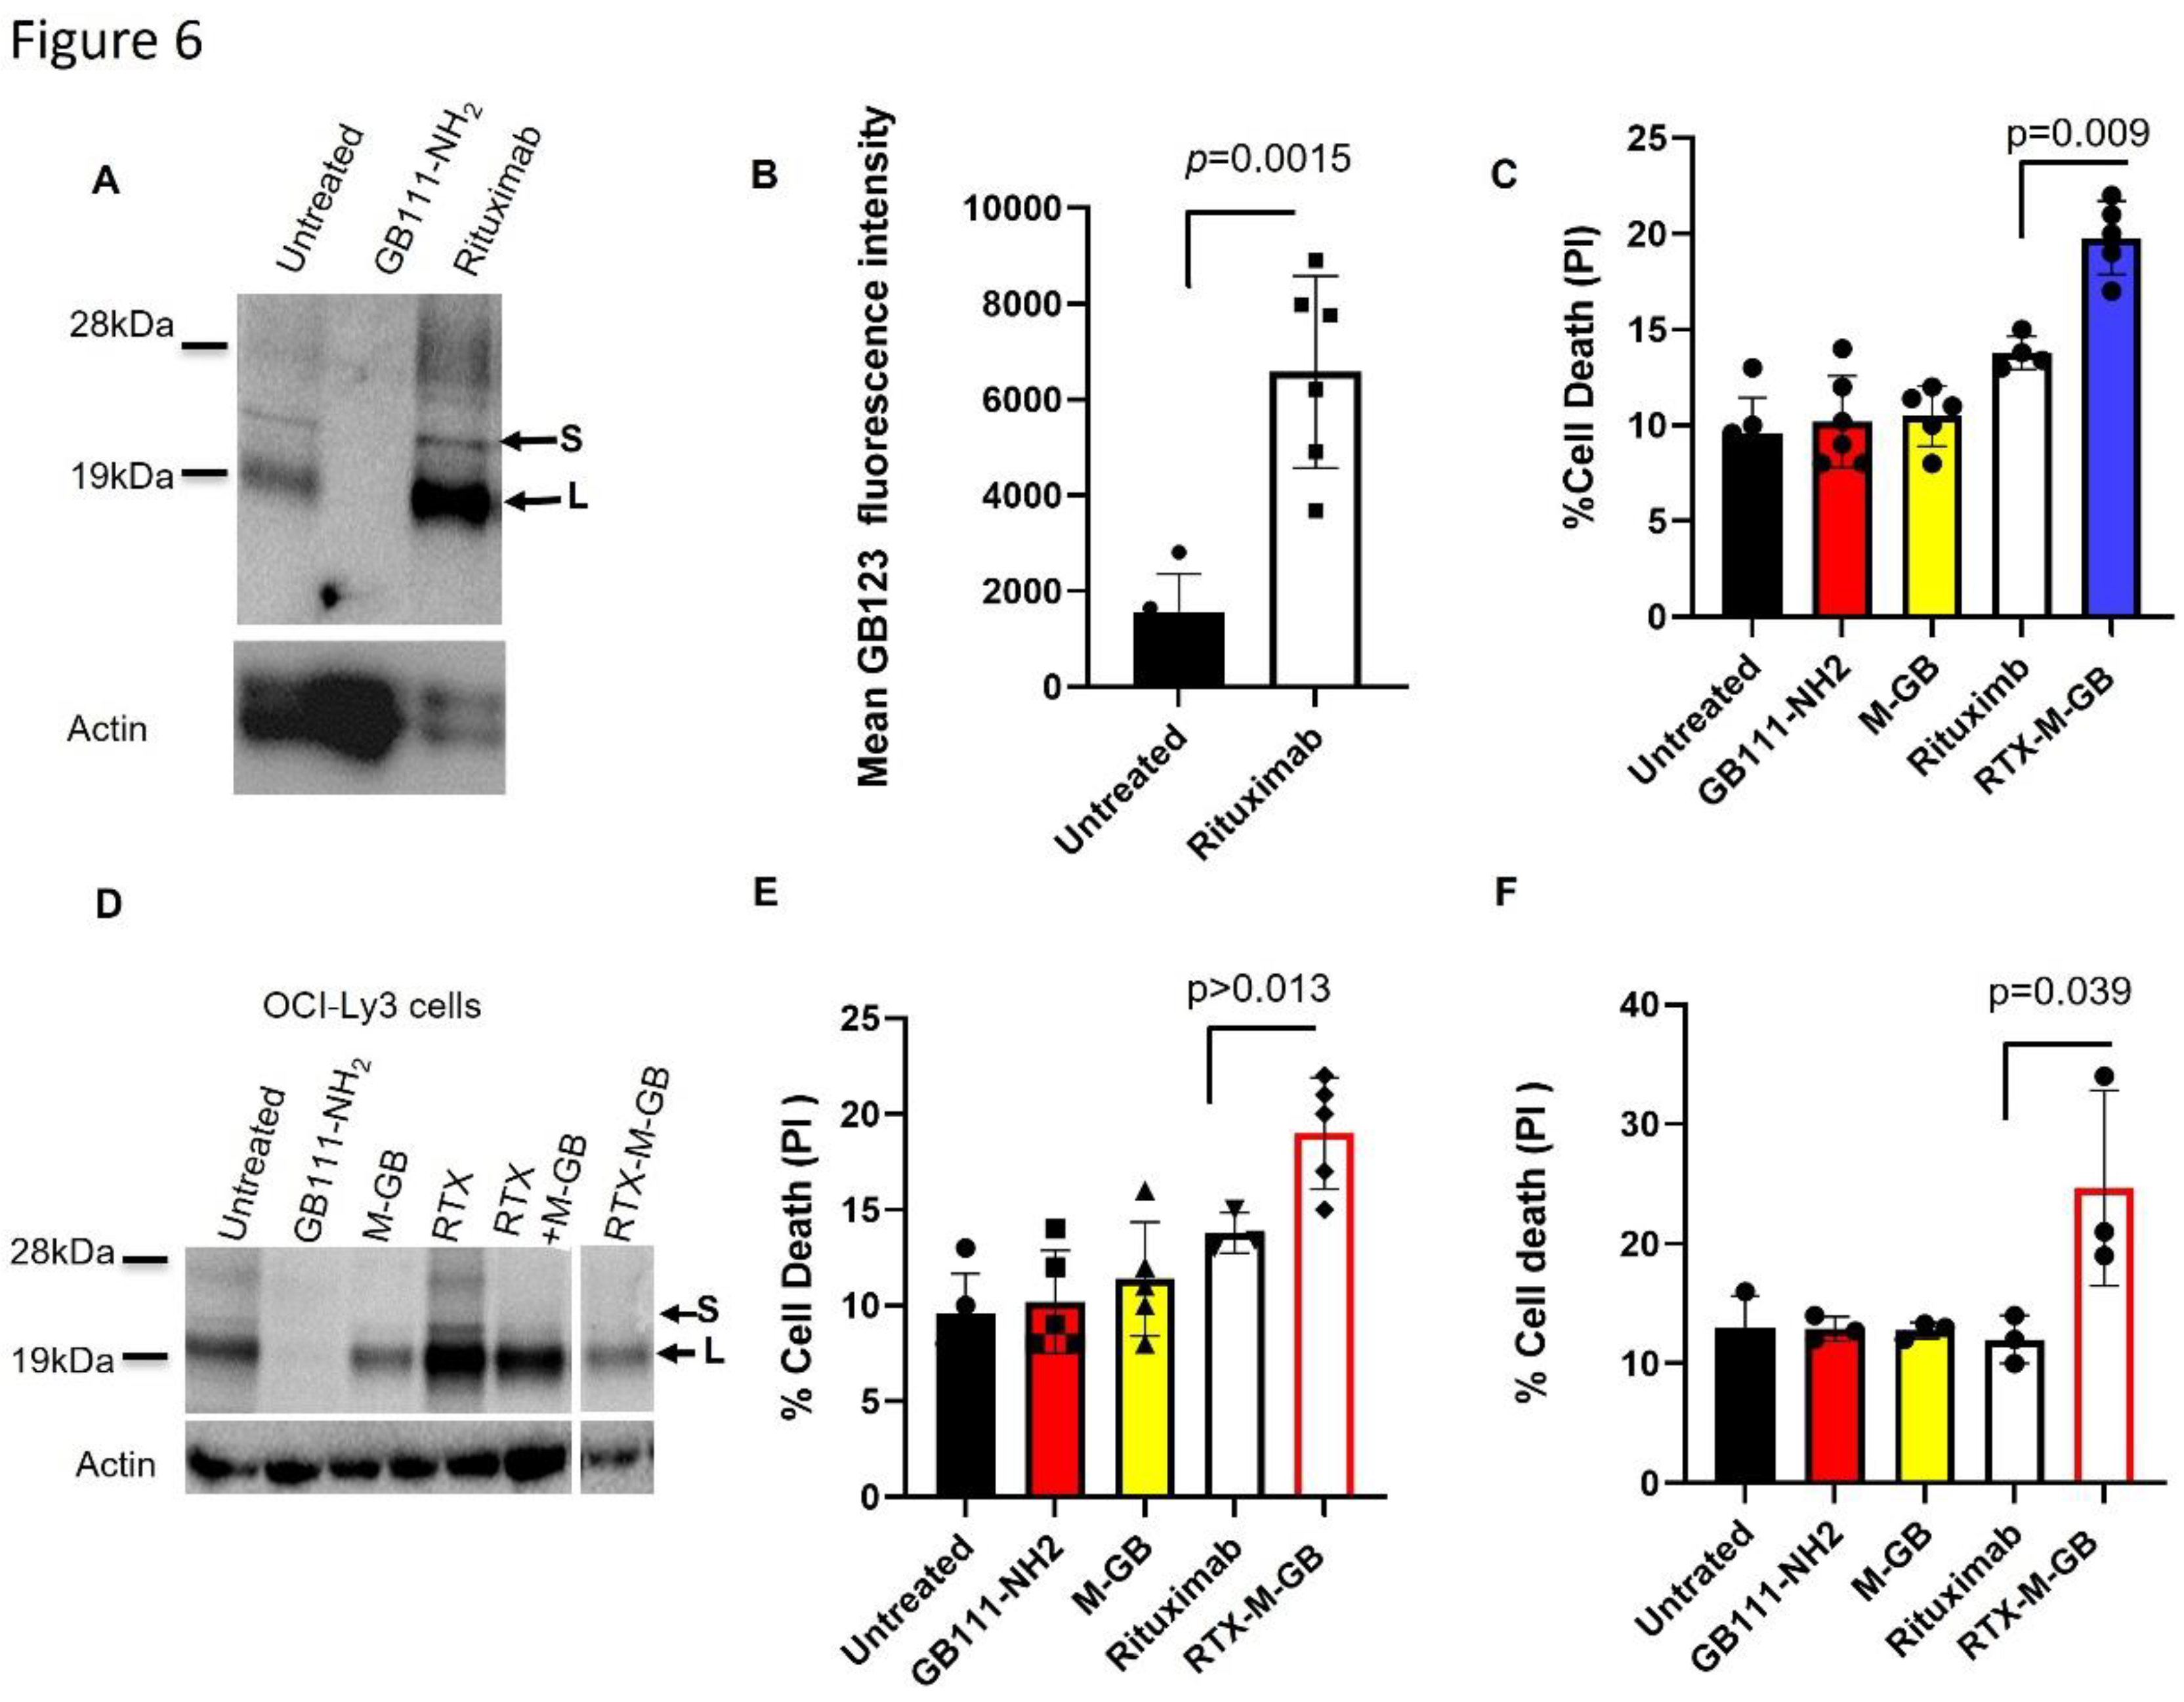
Figure 7.
CD74-targeted M-GB ADC selectively kills CD74-positive cells. (a) Flow cytometry analysis of CD74 and CD19 surface expression on OCI-Ly19 (DLBCL), Raji (Burkitt lymphoma), and 721.221 (lymphoblastoid) cells. OCI-Ly19 cells express high levels of CD74 and CD19, whereas Raji and 721.221 cells have low CD74 expression. (b) Cells were treated with an anti-CD74–M-GB conjugate (CD74–M-GB) or control conditions for 24 hours. Apoptosis was measured by Annexin V staining and flow cytometry. CD74–M-GB induced significant apoptosis in OCI-Ly19 cells, whie Raji and 721.221 cells were largely unaffected. Graphs represent mean ± SD (n = 12). p<0.05 for OCI-Ly19 vs Raji or 721.221 (two-tailed t-test).
Disclaimer/Publisher’s Note: The statements, opinions and data contained in all publications are solely those of the individual author(s) and contributor(s) and not of MDPI and/or the editor(s). MDPI and/or the editor(s) disclaim responsibility for any injury to people or property resulting from any ideas, methods, instructions or products referred to in the content. |
© 2025 by the authors. Licensee MDPI, Basel, Switzerland. This article is an open access article distributed under the terms and conditions of the Creative Commons Attribution (CC BY) license (http://creativecommons.org/licenses/by/4.0/).
Copyright: This open access article is published under a Creative Commons CC BY 4.0 license, which permit the free download, distribution, and reuse, provided that the author and preprint are cited in any reuse.


