Preprint
Article

This version is not peer-reviewed.

Prospective Monitoring of Clinical Features of Chronic Spontaneous Urticaria and Serum Values of IL-6, ESR, CBC, Total IgE, Thyroid Findings, D-Dimer and Vitamin D During Patient Treatment with Antihistamines

Submitted:

19 December 2025

Posted:

22 December 2025

You are already at the latest version

Abstract

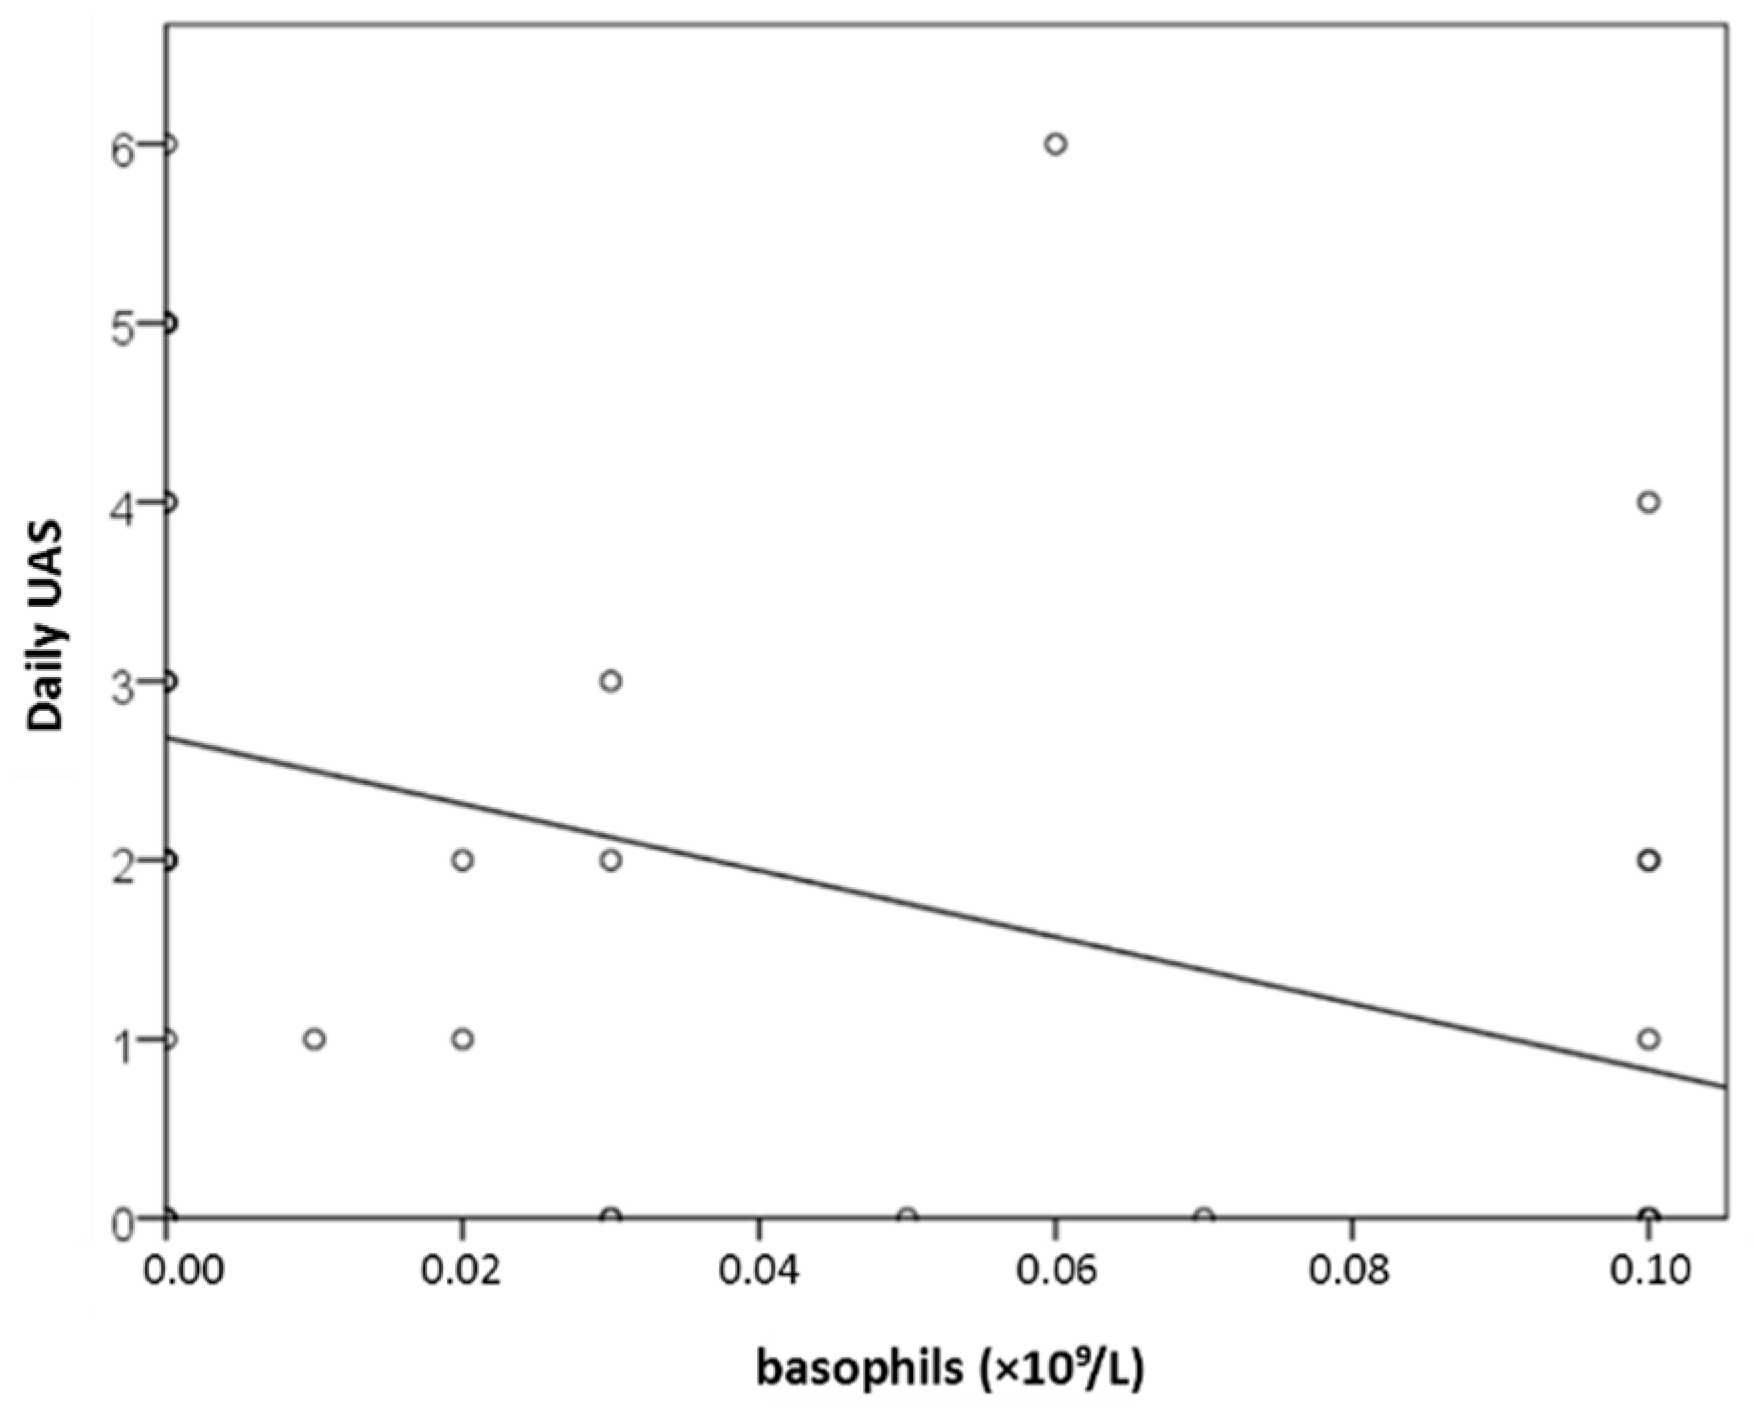
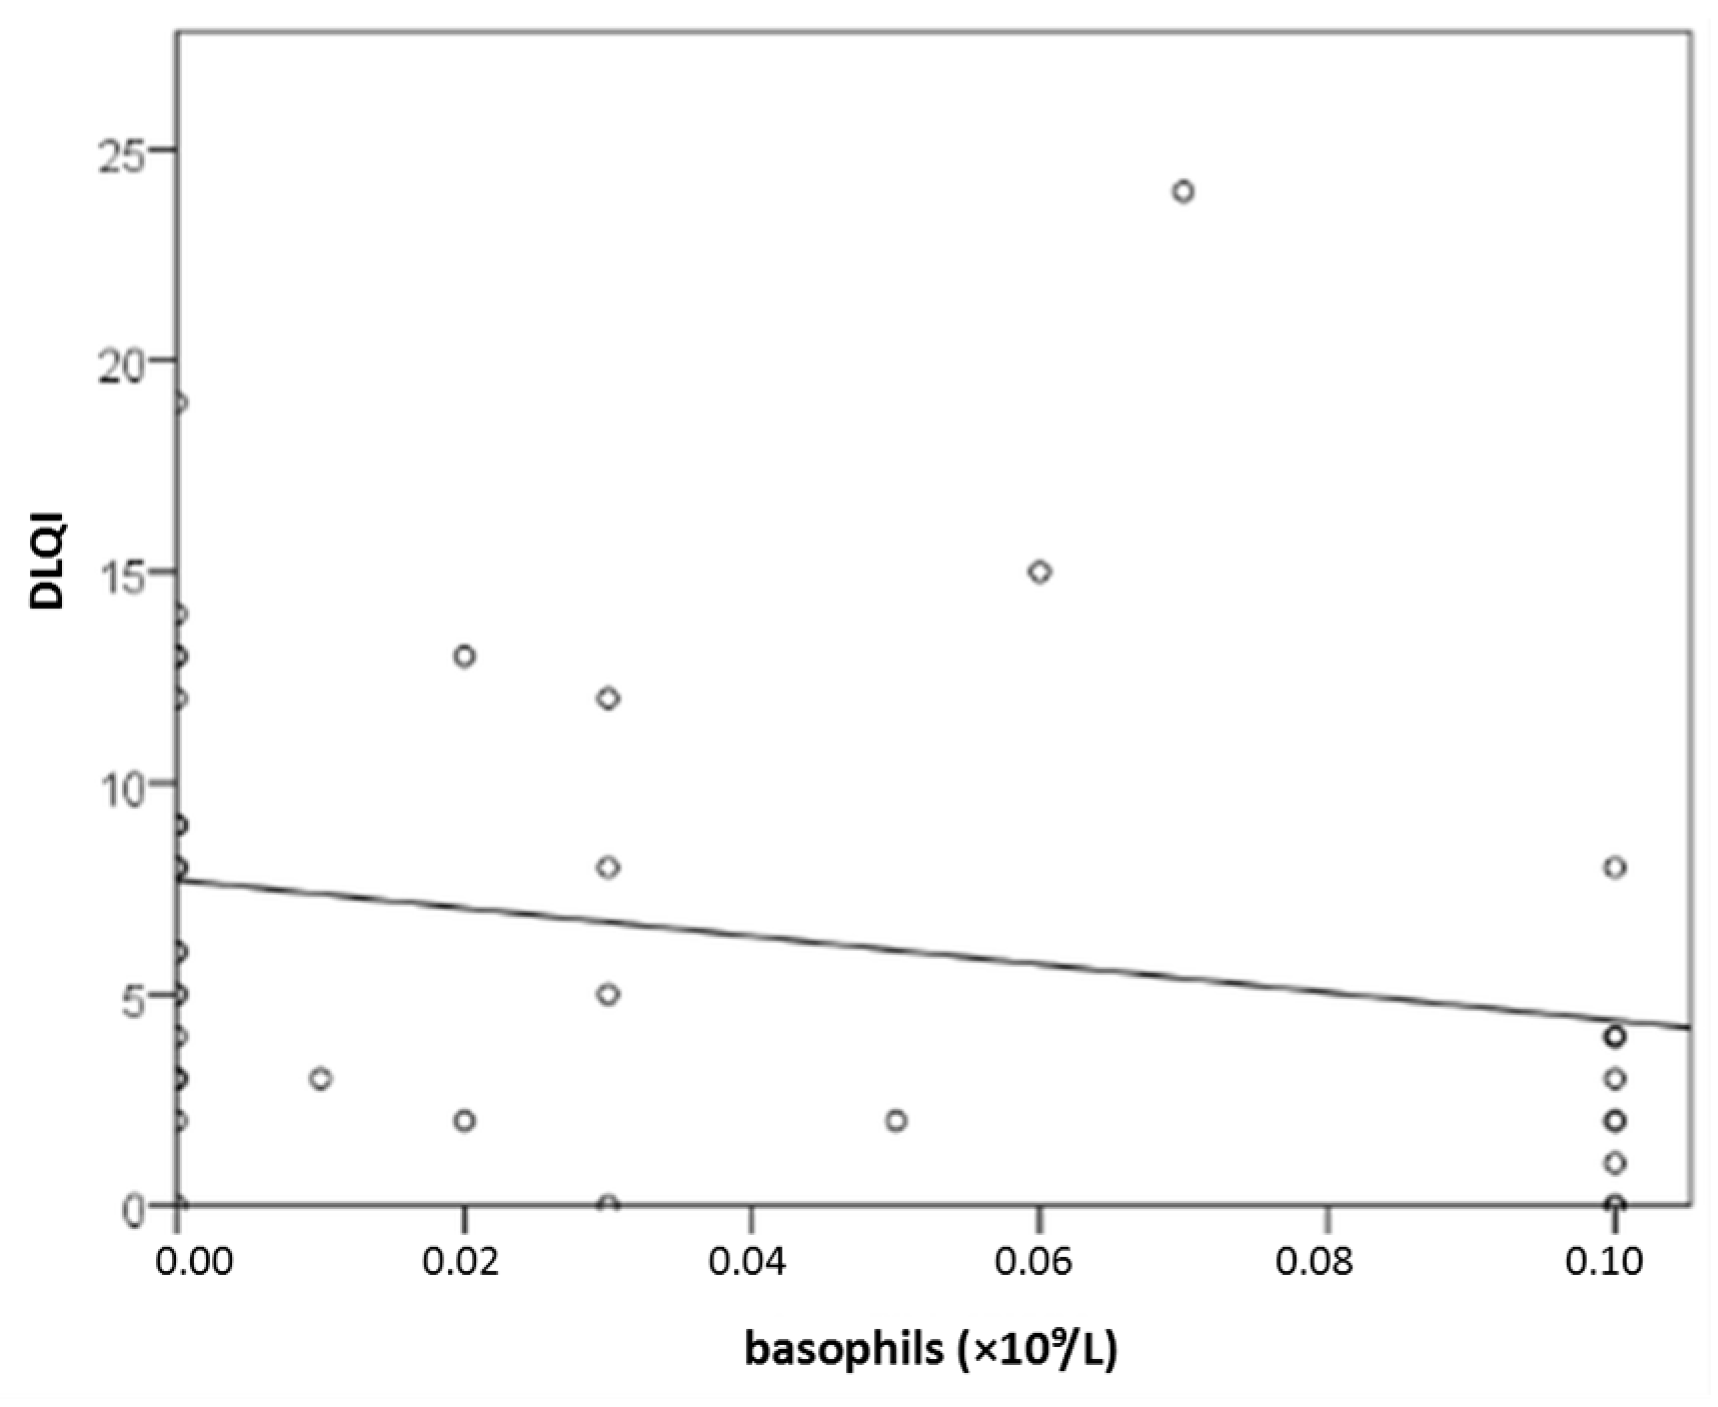
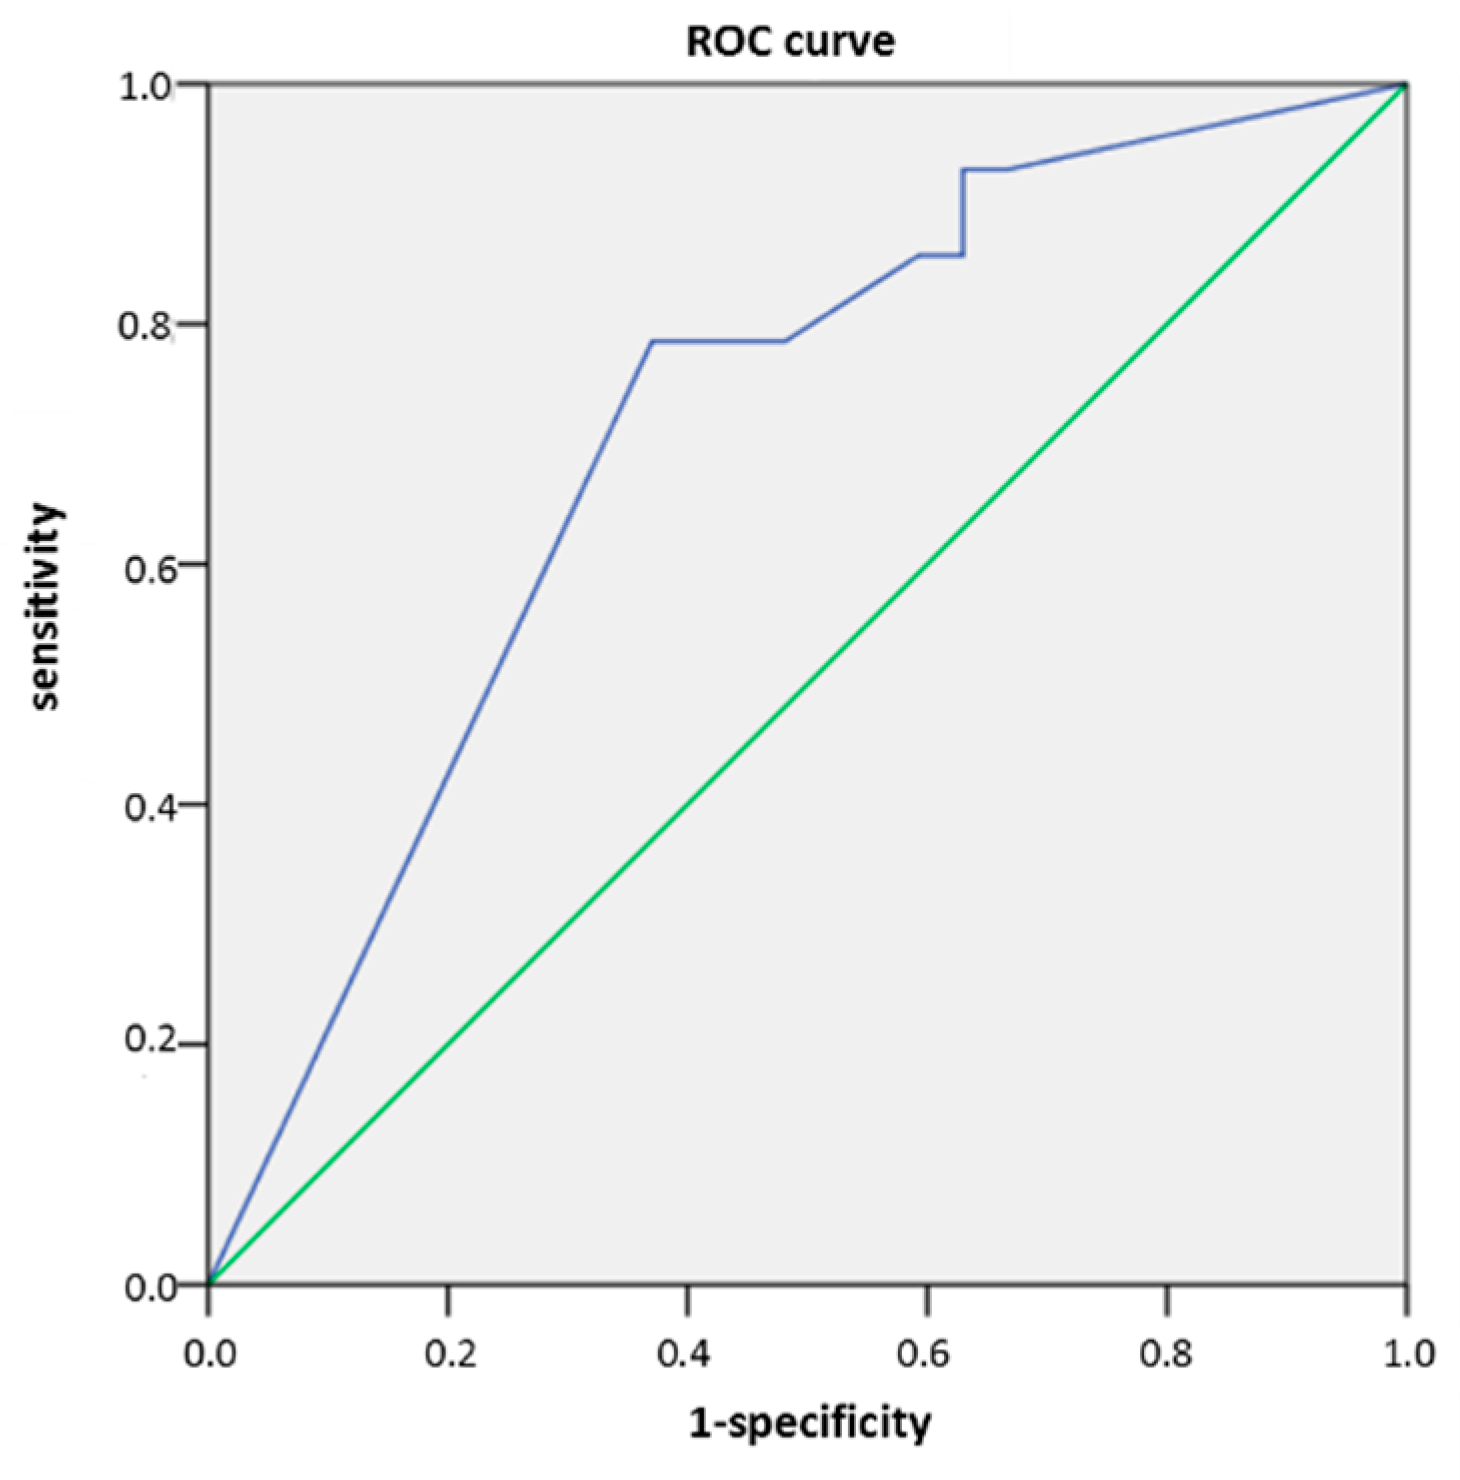
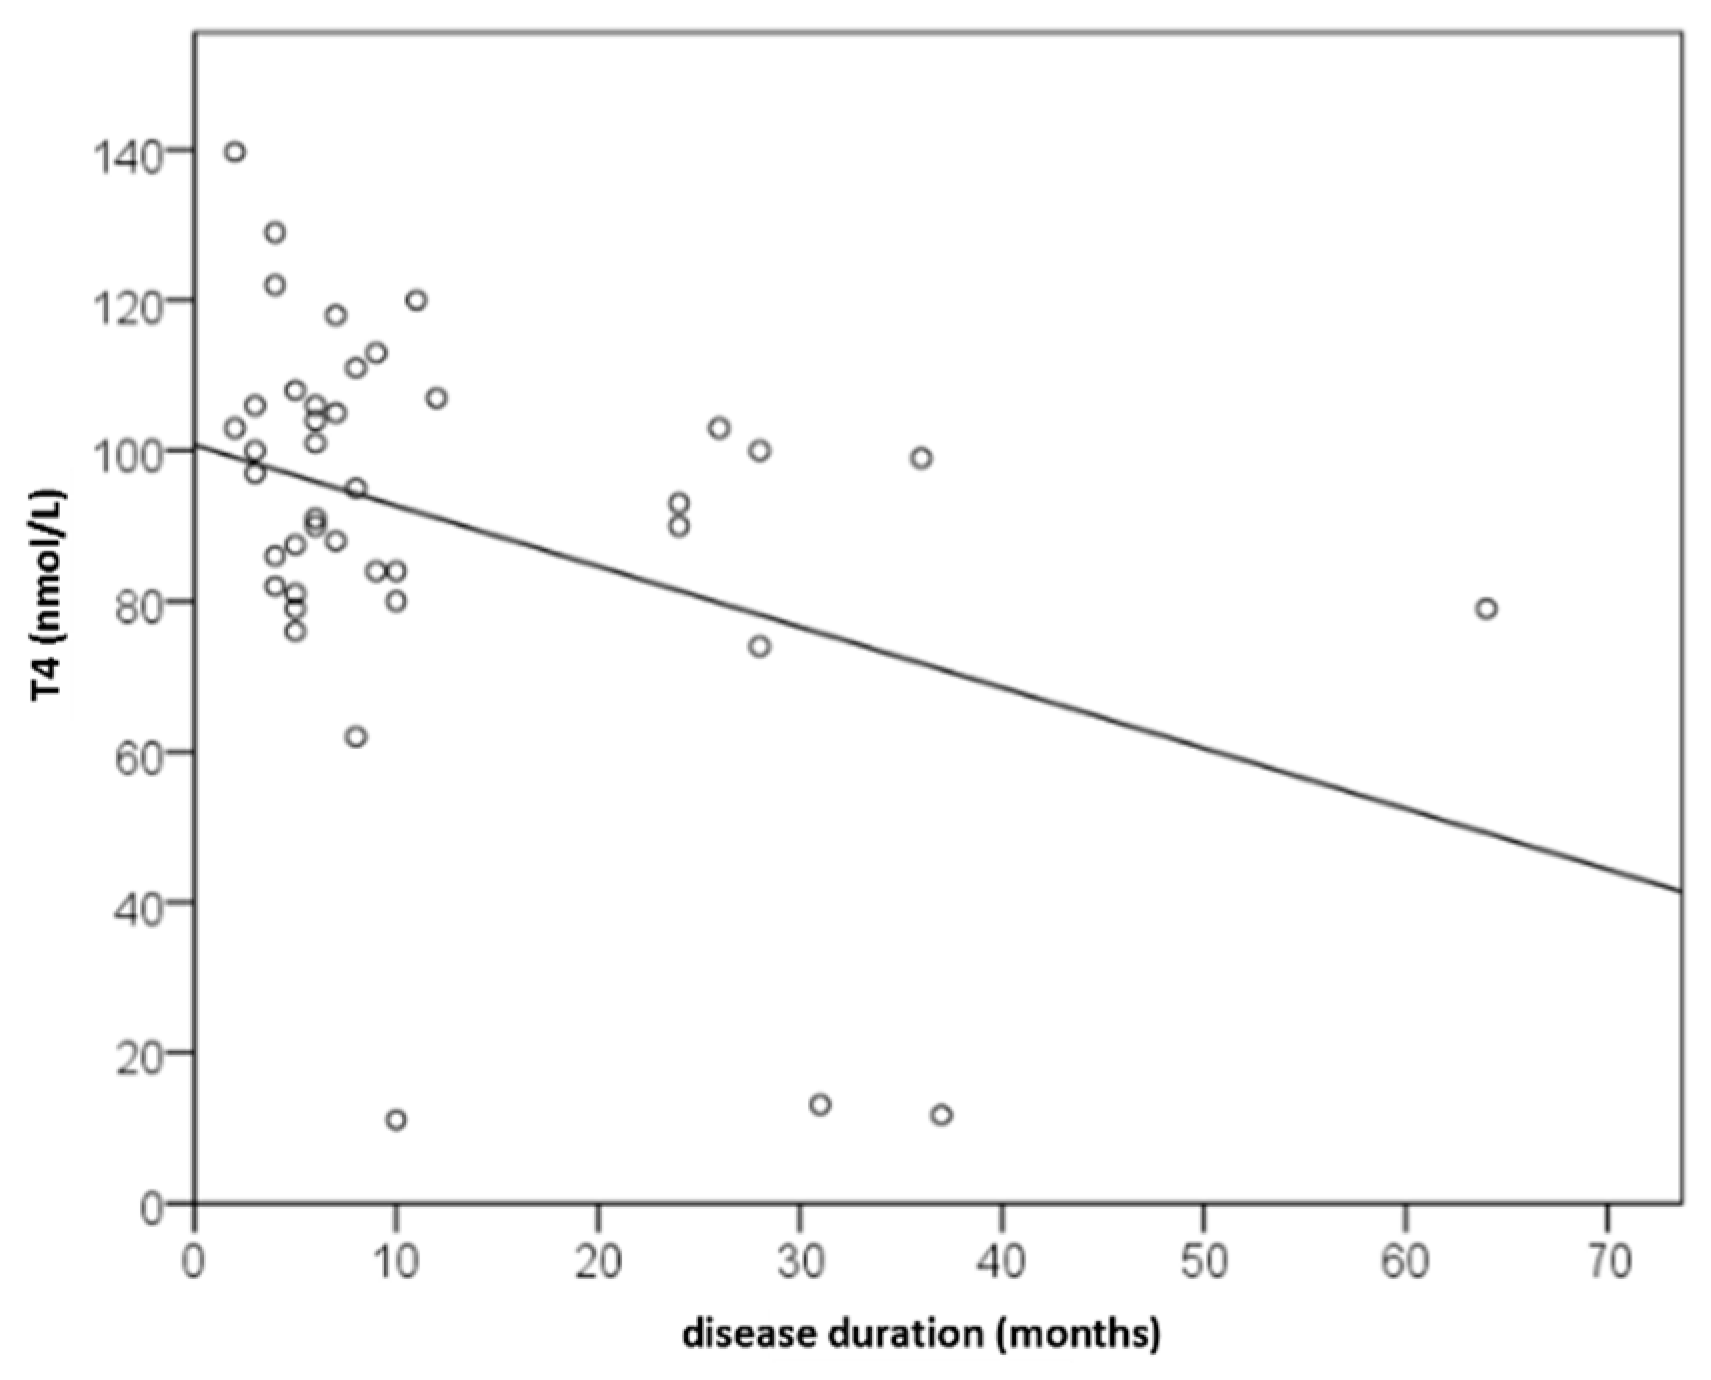
Background/Objectives: Recognizing several proposed serum biomarkers for chronic spontaneous urticaria, we investigated correlations among IL-6, ESR, CRP, CBC values, total IgE, thyroid abnormalities, ANA, D-dimer, and vitamin D in individuals with CSU/ Methods: In this prospective study of 41 patients with CSU, we assessed disease severity and quality of life using UAS7, daily UAS, UCT, DLQI, and CU-Q2oL. Concurrently, we measured serum IL-6, ESR, CRP, CBC, total IgE, thyroid antibodies and hormones, ANA, D-dimer, and vitamin D. Results: Serum parameter levels (IL-6, CBC, ESR, CRP, thyroid findigs, D-dimer, vitamin D) were most often slightly elevated, while basophil counts were frequently reduced. T4 showed a significant dependence on CSU duration(r=−0.328; p=0.036); basophil concentration significantly negatively correlated daily disease activity (daily UAS; r=−0.475; p=0.002); and with DLQI (r=−0.358 to −0.359; p≤0.034); basopenia was more frequent in patients with moderate/severe CSU than in those with mild disease or remission, as measured by daily UAS (79% vs. 37%; p=0.020); basophil concentration was the only biomarker useful in assessing CSU severity/daily UAS (sensitivity 78.6%; specificity 63%, p=0.028); ESR as the only significant predictor for UAS7 severity (p=0.038). Conclusions: These promising results highlight the need for replication in a study with a greater number of CSU patients.

Keywords: 
;  ;  ;  ;  

1. Introduction

Chronic urticaria (CU) is an inflammatory skin disease marked by recurrent wheals, pruritus, with or without angioedema, for more than six weeks [1]. CU is classified into chronic spontaneous urticaria (CSU), with no identifiable cause, and chronic induced urticaria (CIU) [2]. Its lifetime prevalence is about 4.4 % [3]. The yearly incidence is approximately 1.4% [4]. CSU in adults most commonly begins between 30 and 50 years of age and is more frequent in women [5]. Pediatric CSU is less common (0.1–0.3%), [6]. In most cases, chronic urticaria is a self-limiting disorder, but in approximately 20% of patients, the condition may persist beyond five years [7]. In the majority of cases, the underlying cause of CSU remains unknown. Clinical symptoms are unpredictable and sudden, with wheals typically recurring and treatment resistance frequently observed [8].
Adequate management is crucial in the approach to patients with CSU. Routine laboratory investigations should include CBC and/or CRP, as well as thyroid finding and total serum IgE in CSU patients, with additional tests being optional [1]. Several biomarkers have been identified as indicators of CSU activity such as CRP, ESR, and the cytokine IL-6 [9,10,11,12]. Serum inflammatory biomarkers IL-6 and CRP have been shown to strongly correlate with CSU severity [13]. In one retrospective study, a group of CSU patients resistant to second-generation antihistamines had elevated CRP values [14], which is showed by another study (better responses to treatment in patients with lower CRP values) [15], and there was no significant difference in CRP values during exacerbation and remission [16]. Patients with CSU also demonstrate systemic inflammation, with increased CRP, IL-6, IL-10, and TNF-alpha. One study on CSU patients showed significantly elevated IL-6 and TNF-α, as well as higher cortisol values levels and a lower perception of stress/PSS than in healthy controls (HCs) [17]. Moreover, an imbalance was observed between pro-inflammatory and anti-inflammatory adipokines secreted by adipocytes, which may act as contributing factors in the development or exacerbation of CSU and angioedema [18].
Studies investigating CSU severity in relation to serum biomarkers have also demonstrated an association with basophil counts and clinical manifestations of CU. Peripheral blood basopenia correlates with urticaria symptom intensity [19,20], while basophil infiltration into the skin contributes to the severity of cutaneous symptoms [21]. Basophil reactivity may be presented with FcεRI receptor density which was supported by two studies where patients treated with omalizumab had a significant reduction in FcεRI receptor density on basophils [22,23]. One study showed significantly higher D-dimer and fibrinogen levels in patients with urticaria associated with angioedema and significant decrease in D-dimer values after the first administration of omalizumab [24,25]. Numerous studies support low total IgE levels as a predictor of nonresponse or poor response to omalizumab. According to one study research, low baseline IgE values were related with nonresponse to omalizumab [26,27,28].
There are several promising predictors of nonresponse to sgAHs (high UAS7 or UAS, elevated CRP, D-dimer, concomitant CIndU, previous corticosteroid treatment, and low CU-Q2oL scores), predictors of nonresponse to omalizumab (low total IgE levels), and predictors of response to cyclosporine (positive BHRA results and low total IgE levels) [29]. Aim of this study was to acess the relationship between IL-6, ESR, CRP, CBC, total IgE, anti-TPO, anti-TG, TSH, T3, T4, ANA, D-dimer, and vitamin D, and to determine which biomarkers best reflect CSU severity.

2. Results

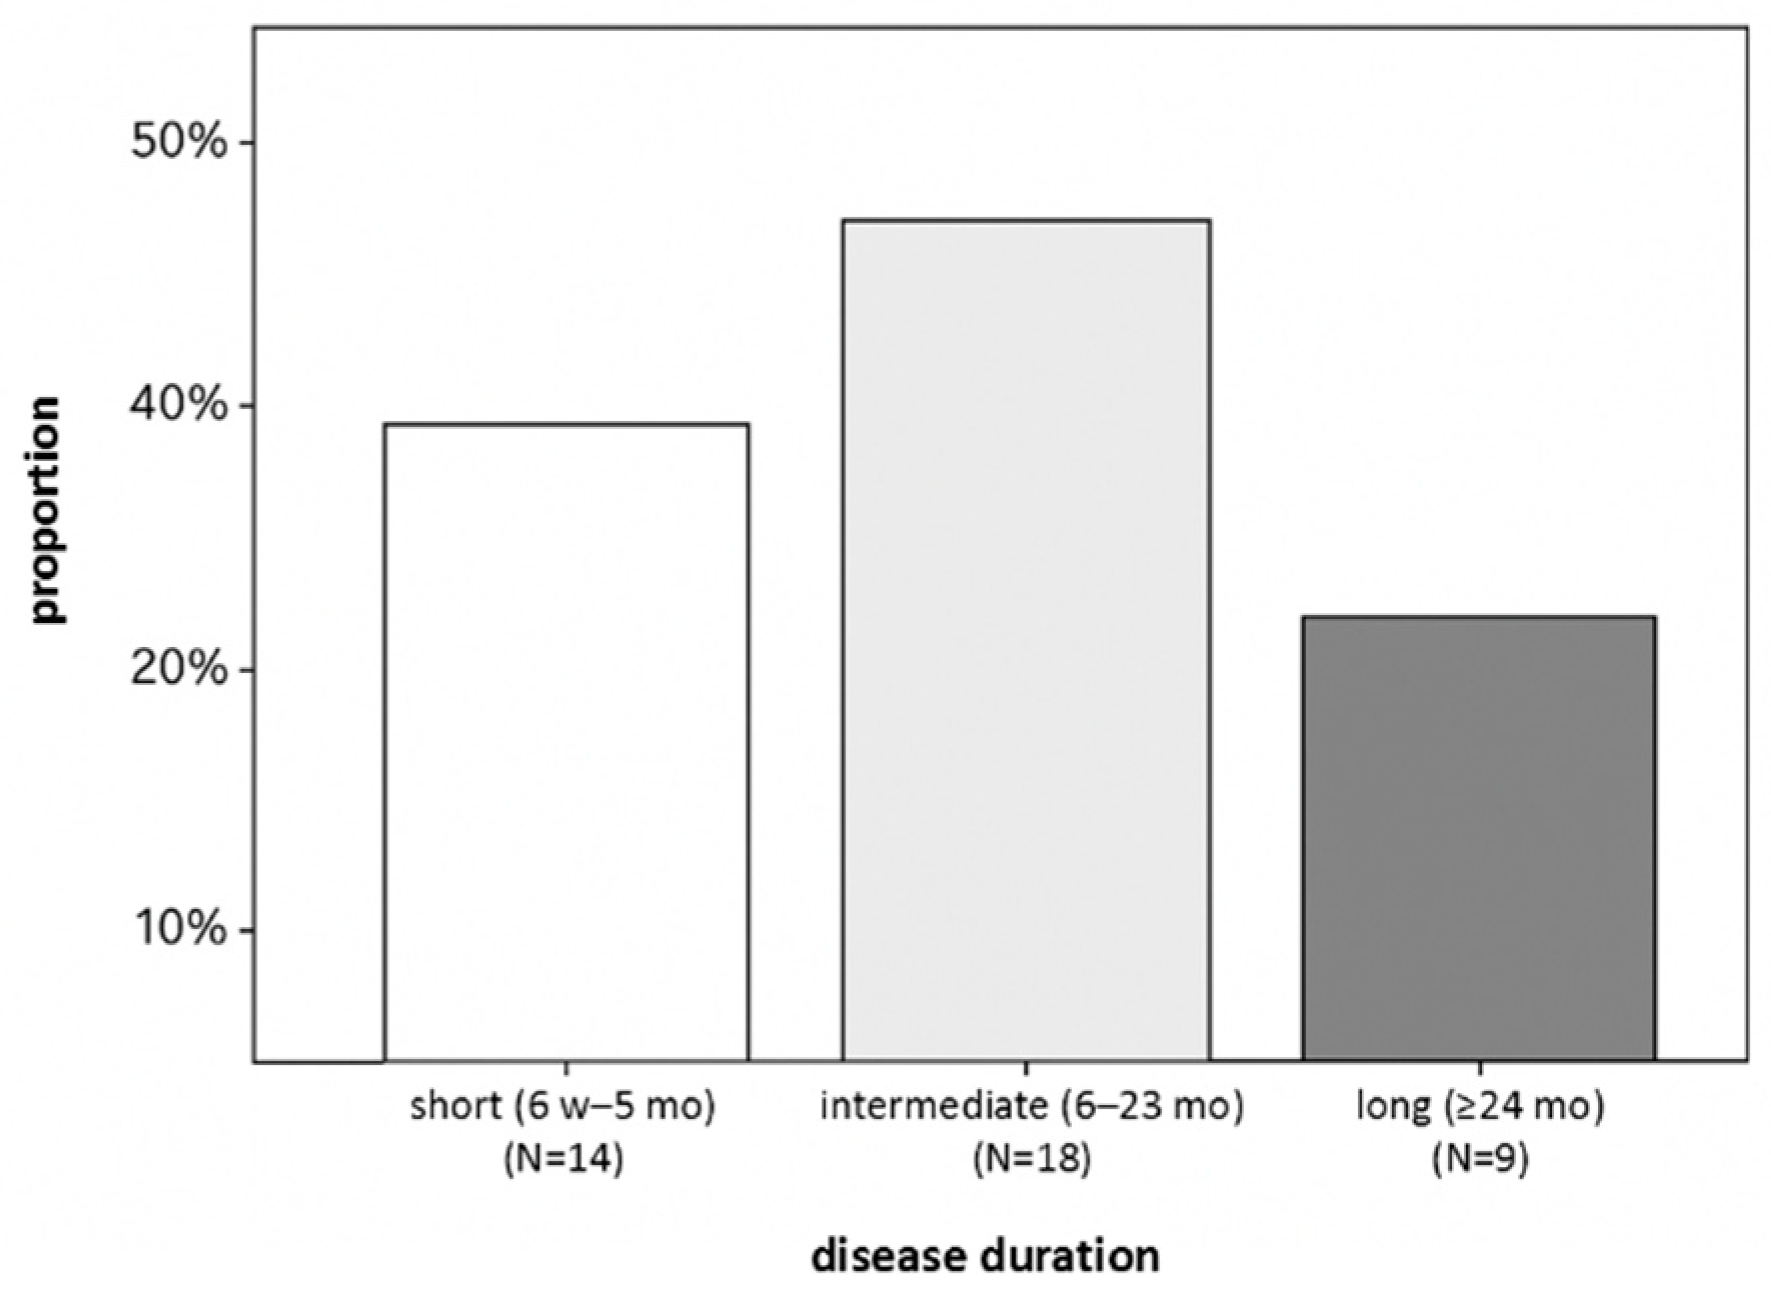
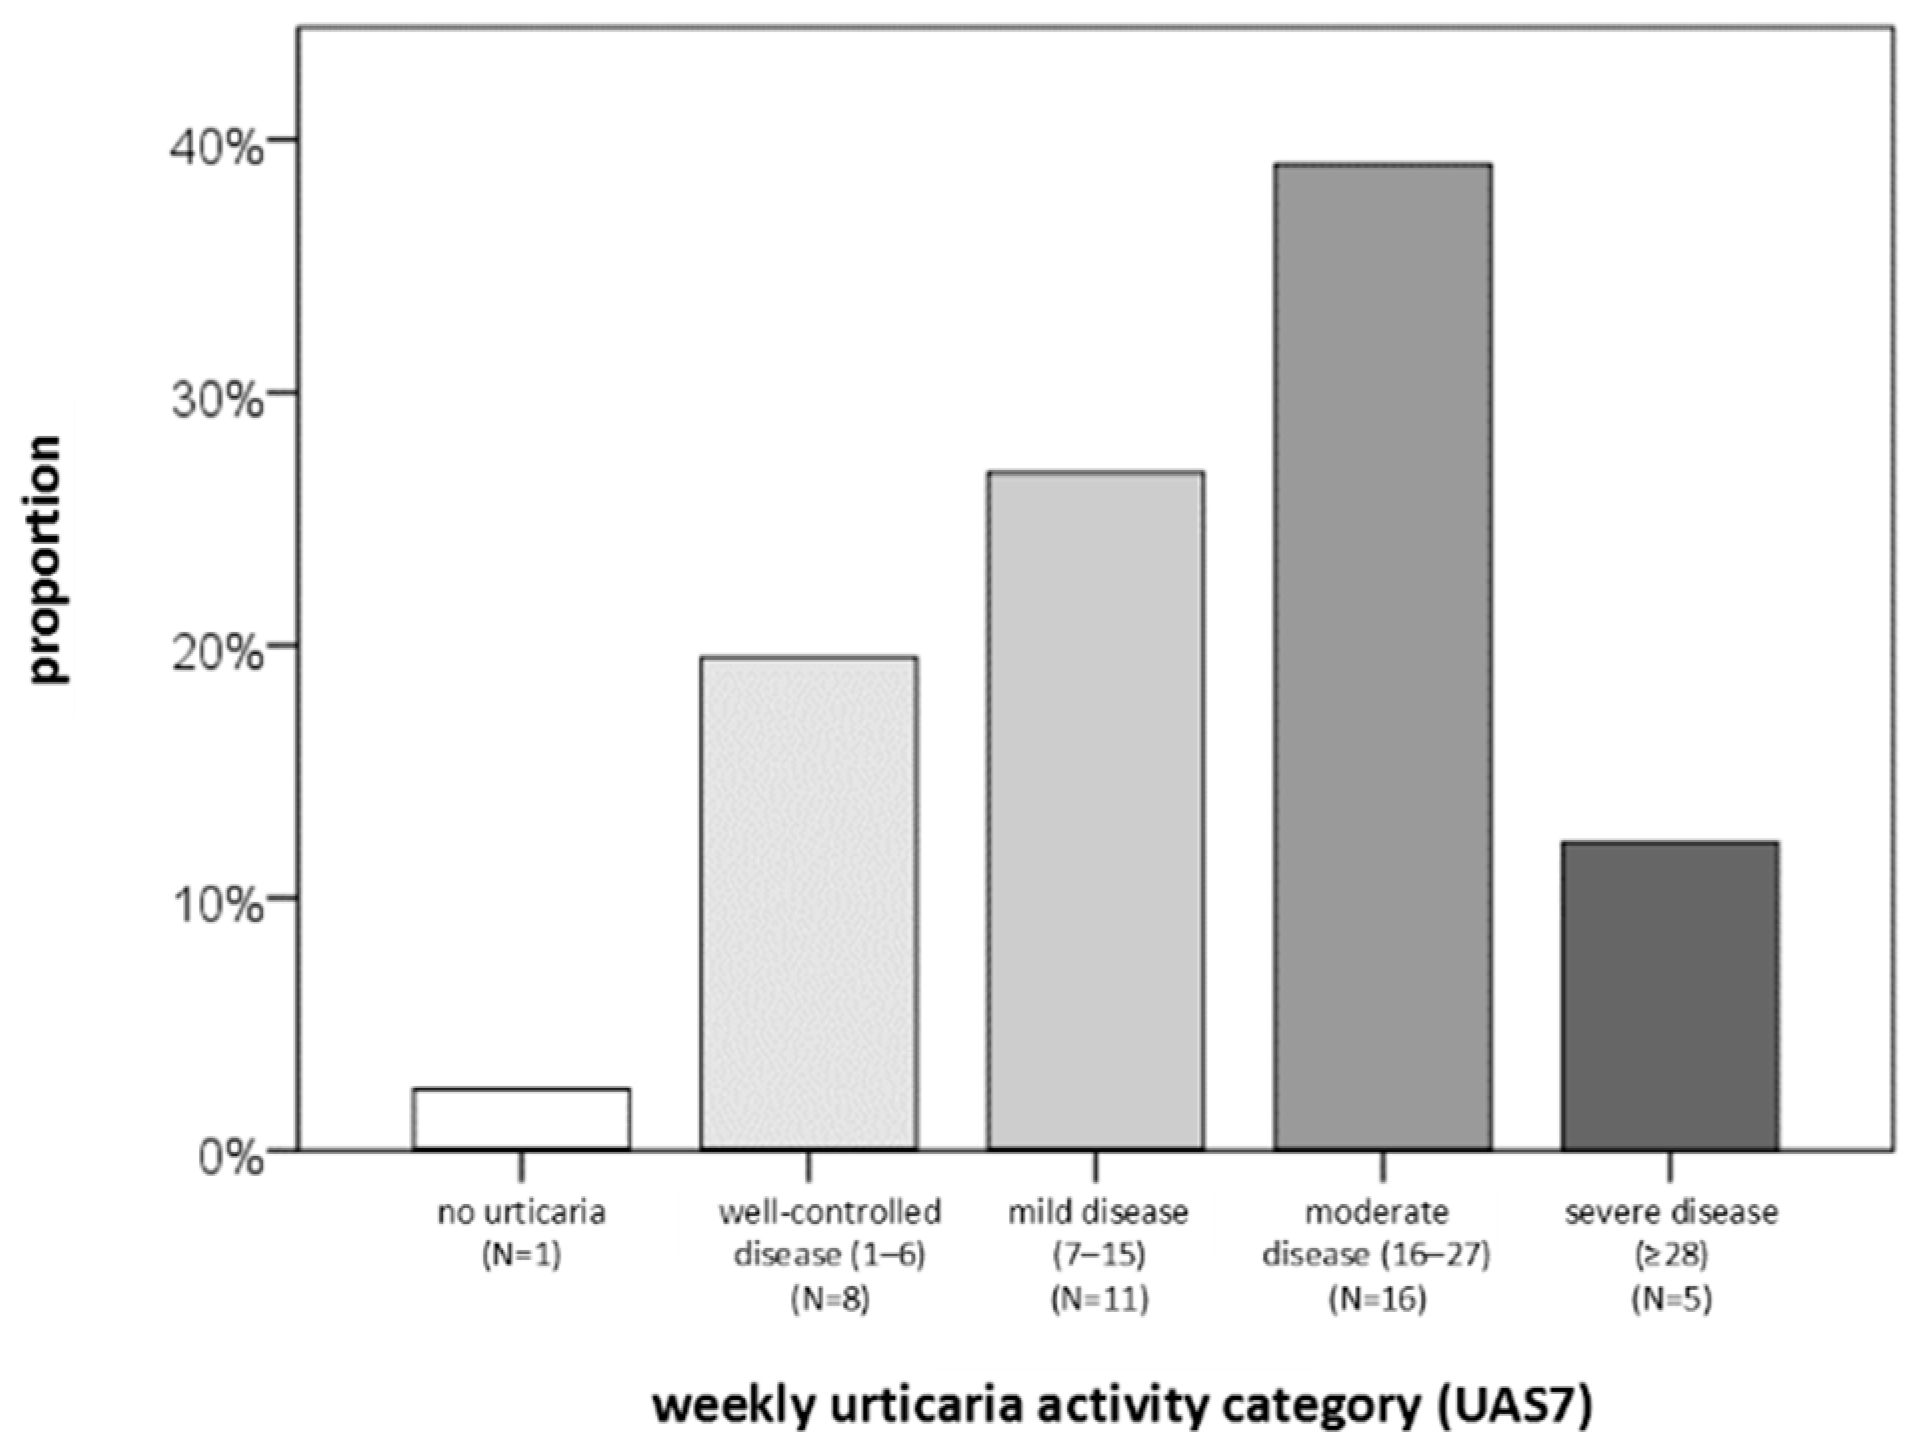
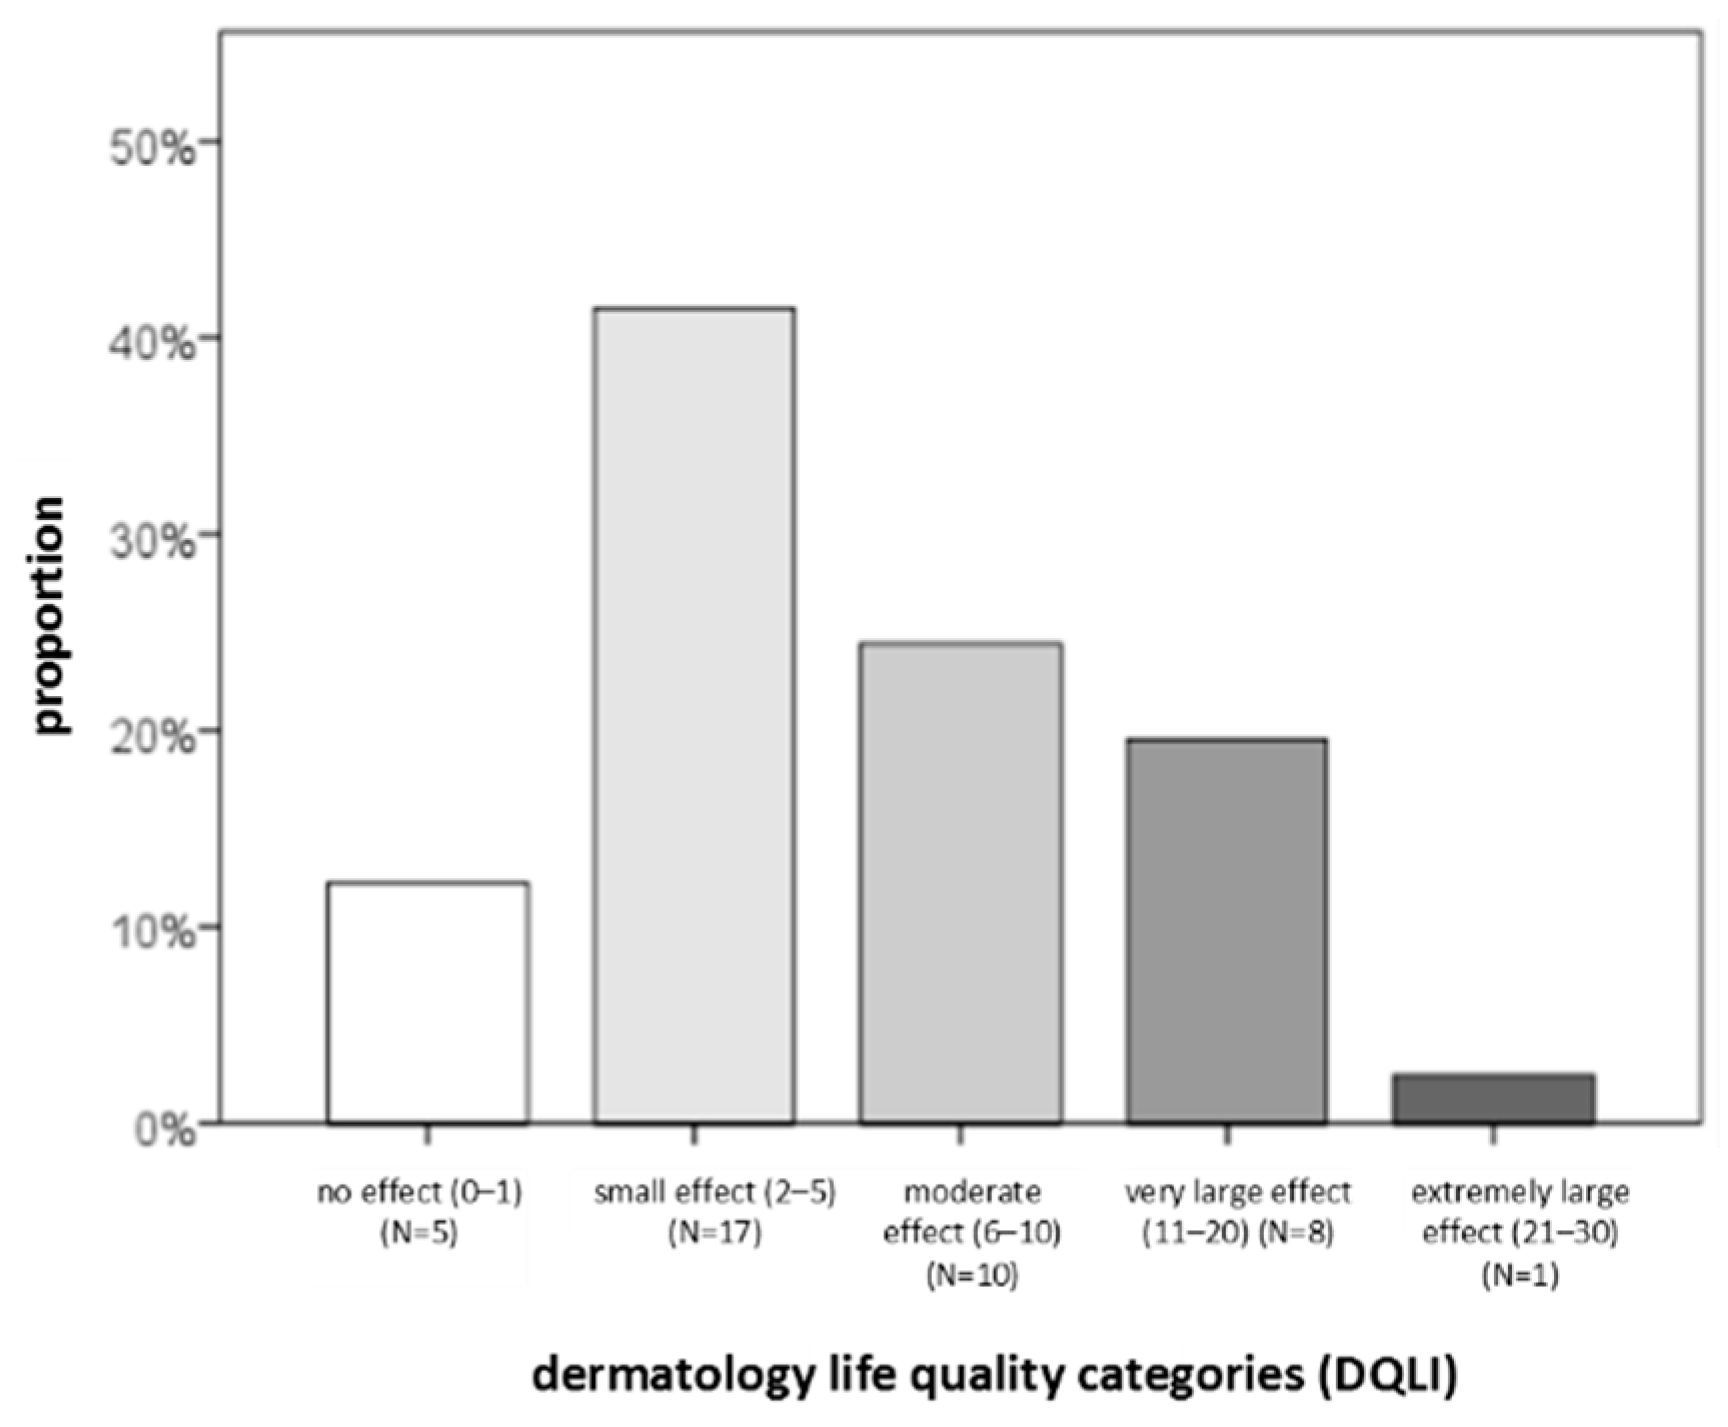
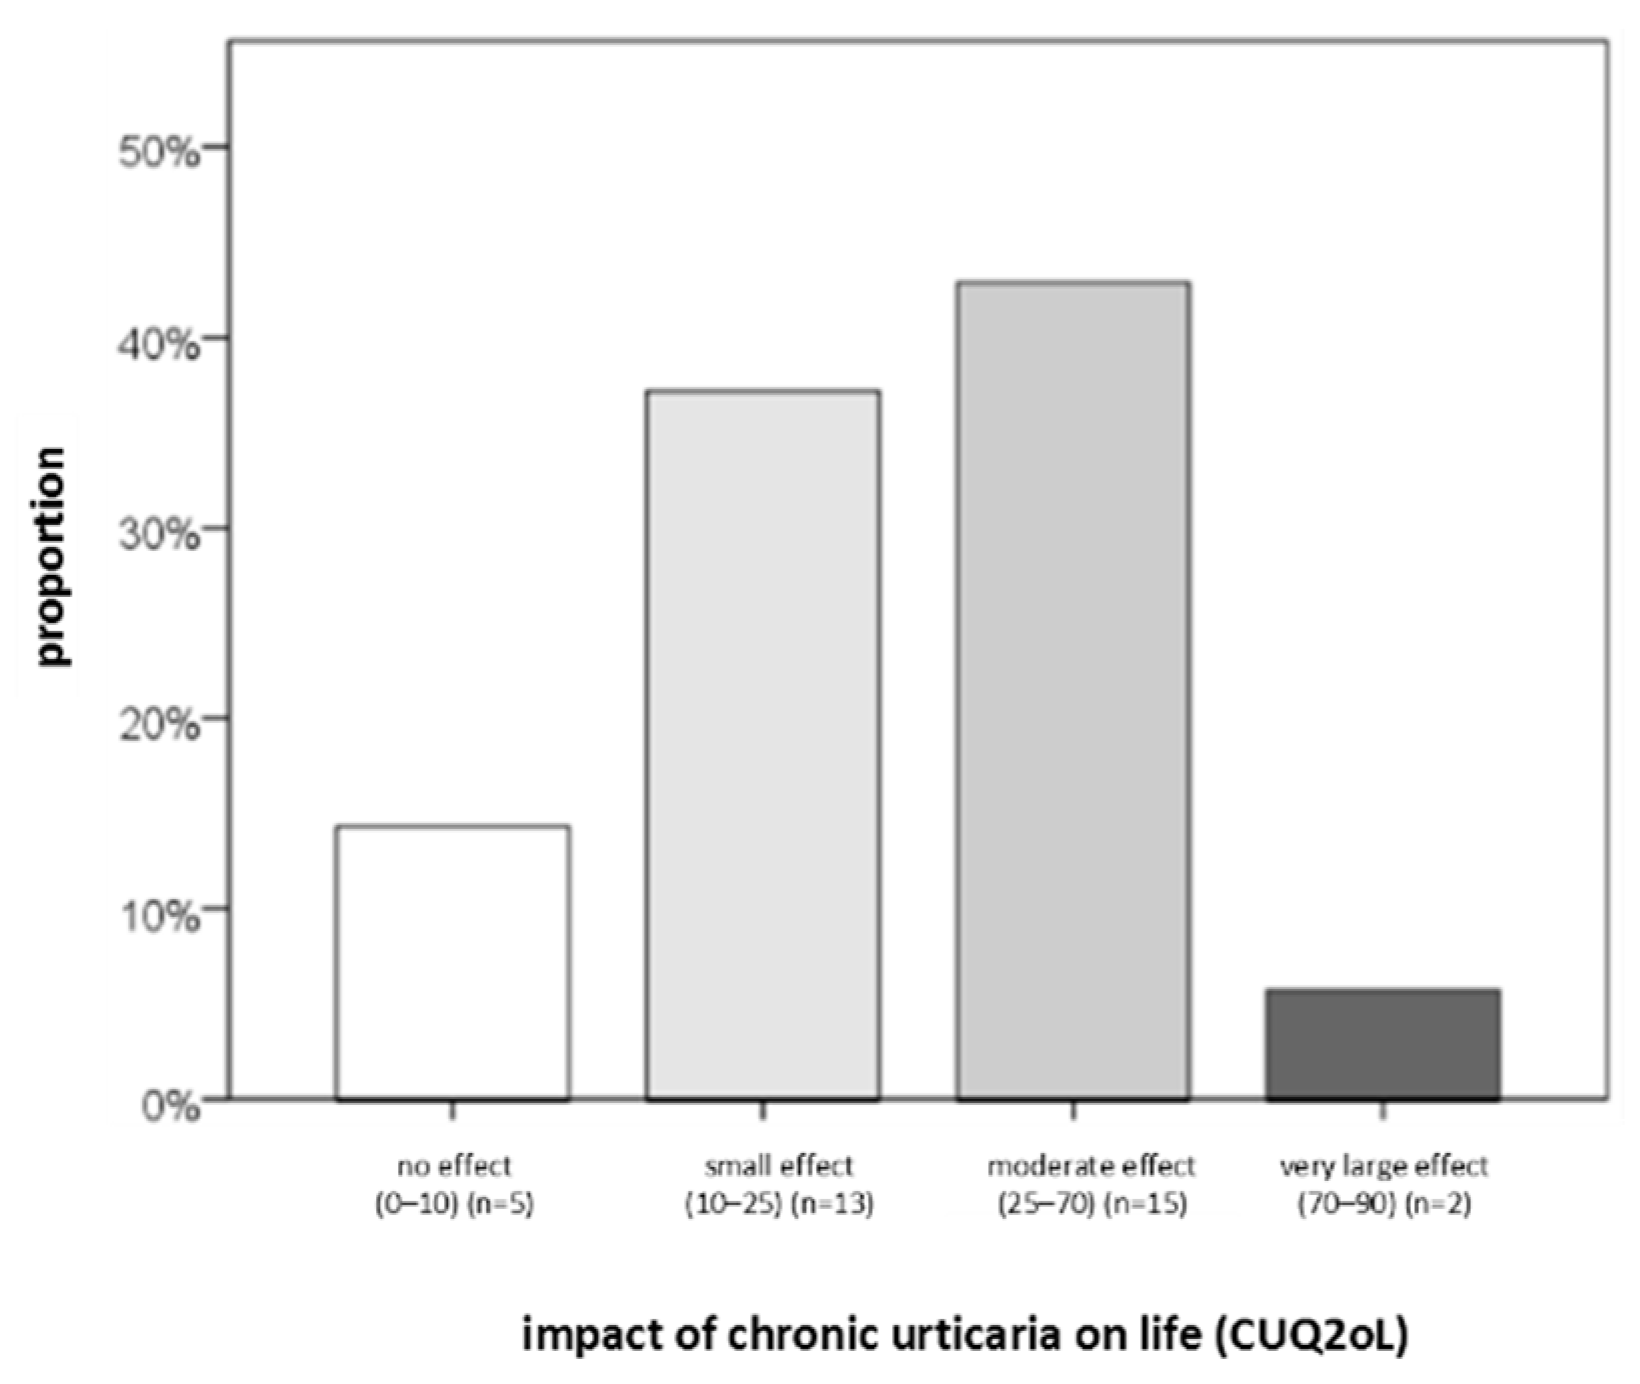
2.1. Study Population

The study included 41 CSU patients (32 women, 9 men), aged 23–79 years; 44% had disease lasting 3–6 months (Figure 1).
All examinees were over ≥18, free of autoimmune or chronic diseases, and not on immunomodulators, psychiatric drugs, or biologics. They received bilastine (20 mg twice daily, up to 4 tablets/day if needed). Only 3 of 41 had prior systemic corticosteroid use, discontinued 2–4 weeks before enrollment.
Regarding CSU severity, QoL, and disease control, the following findings were obtained. The largest proportion of patients had moderate disease (39%) and reported a small impact of the disease on DLQI (42%) (Figure 2 and Figure 3). Severe disease was present in only five patients, while one patient was in remission without urticaria (according to UAS7 severity groups). At the same time, 90% of participants had uncontrolled disease, and 43% reported a moderate impact of urticaria on their QoL (Figure 4). Based on DLQI scoring, only one patient experienced an extremely large impact of CSU on DLQI. According to CU-Q2oL categories, two patients reported a very large CSU-specific QoL impairment, and none of the patients achieved complete disease control (UCT).

2.2. Descriptive Statistics

The sample characteristics are presented in Table 1.

2.3. Associations of Serum Biomarkers with CSU Duration, Severity, Control, and QoL

Serum parameter levels (IL-6, ESR, CRP, CBC, thyroid findings, D-dimer, vitamin D) were most often slightly elevated, while basophil counts were frequently reduced. Serum parameter levels did not differ according to disease duration.

2.3.1. Analysis of IL-6 Levels

Serum IL-6 showed a linear positive correlation with CRP , D-dimer, T3 and T4 (Table 2; Table 3).

2.3.2. Results for ESR

For disease severity measured by UAS7, none of the biomarkers demonstrated statistical significance in ROC curve analyses. When biomarkers were dichotomized by reference values, ESR was the only significant factor. Although ESR did not show a linear association with disease severity, it was less frequently reduced in patients with moderate/severe CSU (UAS7) than in those with remission or mild disease (14% vs. 45%; p = 0.043). According to logistic regression, ESR was the only significant predictor for UAS7 severity (OR 4.9; 95% CI 1.1–22.2; p = 0.038). Thus, ESR within the reference range was associated with a 4.9-fold higher likelihood of moderate or severe CSU compared to mild disease. None of the other biomarkers were predictive for UAS7 severity.

2.3.3. Results for CRP

After three months of CSU treatment, only CRP levels correlated with CSU control, as assessed by the UCT questionnaire (r = –0.459; p = 0.014; Table 19). An increase in CRP values was associated with poorer CSU control according to the UCT score.

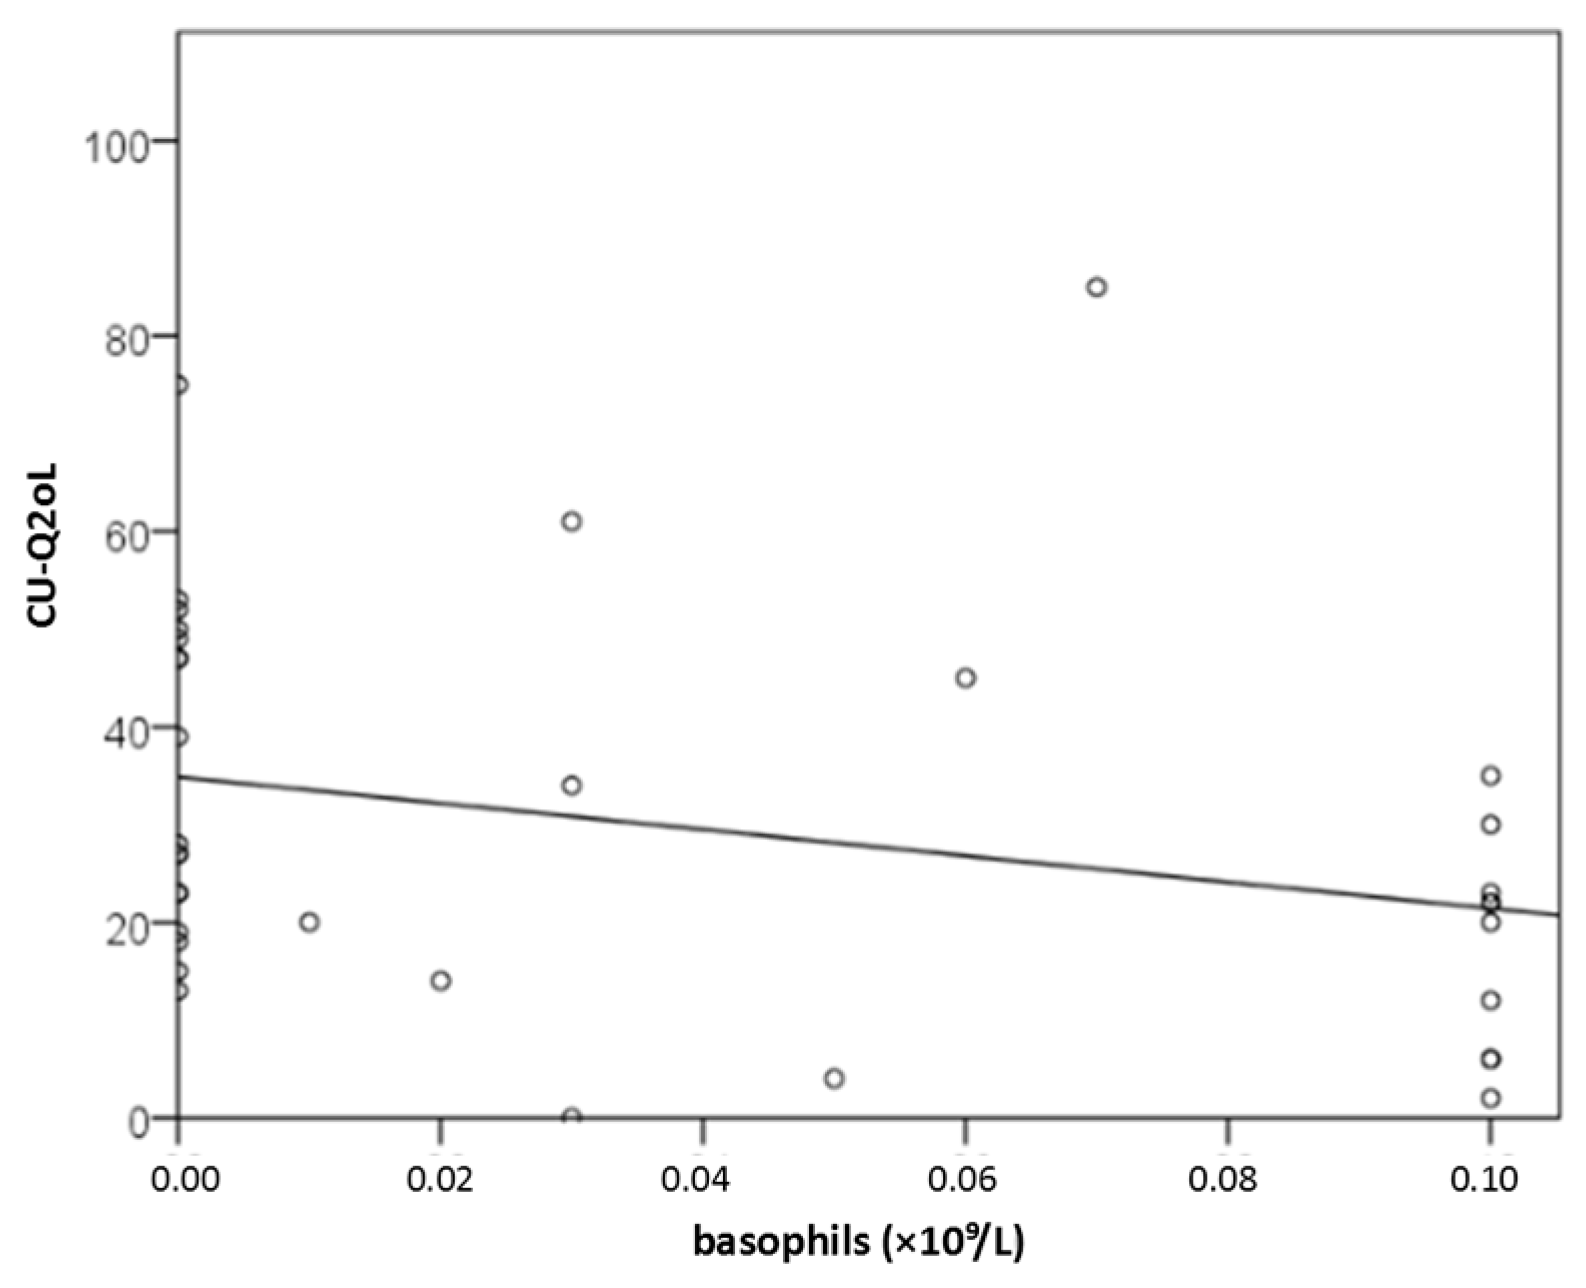
2.3.4. Result for CBC (Basophils)

Basophil concentration was significantly associated with daily disease activity (daily UAS; r = −0.475; p = 0.002), revealing a negative linear correlation, although no significant association was observed with UAS7 (Figure 5),. With each increase of basophils by 1 × 10⁹/L, daily UAS decreased by 18.6 points (y = 2.7 – 18.6x; Figure 5). Basophil counts were also significantly correlated with impaired DLQI (r = −0.358 to −0.359; p ≤ 0.034; Figure 6), but not with disease control (UCT).
Basophils may serve as biomarkers for dermatology-specific QoL impairment (DLQI): with each increase of 1 × 10⁹/L, DLQI decreased by 33.3 points (y = 7.7 – 33.3x; Figure 6). The association between basophil concentration and CU-specific QoL impairment (CU-Q2oL) was stronger than that between the proportion of basophils in blood and CU-specific QoL impairment (r = −0.385 and r = −0.359; p ≤ 0.023; Figure 7). With increasing CSU activity and CU-Q2oL, basophil levels decreased. Basopenia was more common in CSU patients with moderate or severe CSU than in patients with mild CSU or remission, as measured by daily UAS (79% vs. 37%; p = 0.020). However, no significant differences were found when comparing dichotomized groups using other questionnaires.
Logistic regression confirmed basophils as predictors of daily UAS (in contrast to T4, which was not predictive). Basopenia was associated with a 6.2-fold increased likelihood of moderate or severe CSU (OR 6.2; 95% CI 1.4–27.8; p = 0.017). Basophil concentration was the only biomarker useful in assessing CSU severity measured by daily UAS, with sensitivity 78.6%, specificity 63%, and AUC 0.71 (p = 0.028; Figure 8). Basophil concentration demonstrated moderate accuracy, being more effective in detecting severe CSU but less effective in identifying milder forms of the disease.

2.3.5. Results for Total IgE

In this prospective study, total serum IgE was measured in all participants, with a mean value of 60.3 kIU/L (range: 23.0–113.0 kIU/L). Serum D-dimer levels showed no significant correlation with disease duration, severity, or control of CSU, nor with patients’ QoL or other serum biomarkers associated with CSU.

2.3.6. Results for Thyroid Findings

Among biomarkers, only thyroxine (T4) showed a significant dependence on disease duration, with a weak negative linear correlation (r = −0.328; p = 0.036; Figure 9). Thus, with increasing disease duration, T4 levels decreased. According to the regression equation y = 101 – 0.81x, each additional month of CSU reduced T4 levels by 0.81 nmol/L.
Values of T3 were moderately positively correlated with DLQI. Thus, each 1 nmol/L increase in T3 raised DLQI impairment by 1 point (y = 3.1 + 2.0x; r = 0.371; p = 0.017; Figure 10). However, no significant difference in T3 levels was observed when comparing dichotomized DLQI groups (median 1.6 vs. 1.7). Notably, T4 was decreased in 27% of patients with moderate or severe CSU (daily UAS), but in none of the patients in remission or with mild disease (p = 0.010; V = 0.457). No significant linear association was found between daily UAS and T4 levels.
Changes in TSH levels were significantly and linearly correlated only with changes in CSU-specific QoL, as measured by the CU-Q2oL questionnaire (r = 0.655; p = 0.001. A greater reduction in TSH levels was associated with a greater improvement in QoL among patients with CSU.

2.3.7. Results for ANA

Autoimmune etiology of the disease (ANA titer ≥ 1:160) was confirmed in 22% of patients. An autoimmune background was present in only four patients. None of the patients in our study who exhibited elevated serum IL-6 levels had an autoimmune background (defined as ANA titre ≥ 1:160), whereas 17% of participants with normal serum IL-6 values did.

2.3.8. Results for D-Dimer

In this prospective study, serum D-dimer levels showed no significant correlation with disease duration, severity, or control of CSU, nor with patients’ QoL or other serum biomarkers associated with CSU. After three months of standard antihistamine therapy, serum D-dimer concentrations did not differ significantly from baseline values.

2.3.9. Results for Vitamin D

At the first measurement, all participants had suboptimal serum vitamin D levels (< 75 nmol/L), with a mean concentration of 61.0 nmol/L. Vitamin D deficiency was recorded in 6 patients (30%) with mild CSU and in 6 patients (28.6%) with moderate-to-severe CSU. At the second measurement following a 3-month course of vitamin D tretment significant increase in serum vitamin D concentration was recorded.
In the patients who received vitamin D supplementation, their vitamin D levels increased substantially, accompanied by an improvement in clinical status, which was more frequently observed in this group compared with those who did not receive supplementation (69.8 vs. 58.1 nmol/L; p = 0.428, not statistically significant).

3. Discussion

Our research showed a significant correlation between serum IL-6 values and other CSU serum biomarkers: IL-6 correlated positively and linearly with CRP, ESR, D-dimer, T3, and T4. These serum biomarkers in CSU, reflect disease activity and control, as well as quality-of-life impairment. According to one study, significantly higher CRP levels were confirmed in CSU patients than in HCs. They also observed a significant correlation between IL-6 and CRP in CSU [10]. Our findings align with these results, showing a significant positive linear correlation between IL-6 and CRP, and also support oane pilot study with similar findings[30]. Earlier work also showed higher IL-6 in CSU patients, while CRP did not differ significantly from controls [34]. In another study, IL-6 was significantly higher in CSU than in HCs; IL-6 correlated with CSU activity (UAS7), while in mild CSU IL-6 did not differ from HCs, and these findings support IL-6 as a biomarker of CSU activity [10]. In our research, high IL-6 values occurred most often in moderate/severe CSU more frequently than in CSU remission or mild CSU. This is consistent with IL-6 being an early pro-inflammatory cytokine in systemic inflammation, with higher levels observed in more severe CSU (measured by daily UAS at the time of serum sampling). The lack of statistical significance likely reflects the small number of severe cases and ongoing antihistamine use. Our pilot study did not confirm correlations between CRP and CSU severity, nor among IL-6, CRP, and ESR [30]. By contrast, Kasperska-Zajac et al. (2013) found higher CRP in CSU than in controls and a positive correlation between CRP and procalcitonin (absent in controls) [35]. In a 2021 prospective study, de Montjoye et al. observed that CSU activity (UAS7) correlated positively with CRP and negatively with peripheral blood basophils [36]. In our pilot, we again did not detect such associations between CRP and CSU severity, nor among IL-6, CRP, and ESR [30]. Kolkhir et al. reported higher CRP in antihistamine-non-responders than responders and correlations between CRP and other inflammatory markers (ESR, leukocytes/neutrophils, IL-6) [37]. In our pilot, ESR correlated with CSU severity (UAS7) (positive, linear, moderate), while CRP did not (Kuna, 2023). In the present study, ESR emerged as the only significant predictor for UAS7 severity. Ucmak et al. (2013) found associations between UAS and IL-6/CRP, but no correlation between IL-6 and CRP—as in our pilot, which showed no IL-6–CRP-ESR intercorrelation while also confirming a significant association between daily UAS and IL-6 [11].
Basophils are another clinically relevant indicator in CSU. In our study, basophil count was the only significant biomarker for assessing CSU severity by daily UAS (sensitivity 78.6%, specificity 63%). Yanase et al. (2023) linked basophils with other biomarkers (e.g., plasma histamine, total IgE) useful for defining disease activity [38]. De Montjoye et al. (2021) likewise reported a positive correlation between UAS7 and CRP and a negative correlation between CSU activity and basophil count [36]. Pooled analyses of omalizumab trials Poddighe et al. reported increases in circulating basophils during conventional-dose treatment [39,40,41,42]. Regarding omalizumab response prediction, Cakmak et al. (2022) found that blood eosinophil and basophil counts and total IgE were significant predictors of treatment response in CU [43]. De Montjoye et al. also showed CRP and D-dimer to be positively correlated; in autoimmune CSU, D-dimer was higher and basophils lower, with significant decreases in CRP and D-dimer during omalizumab therapy [36]. In our study, D-dimer did not correlate with CSU duration, severity, control, QoL or with other CSU biomarkers. Additional CSU-related factors warrant consideration. According to our results, only T4 significantly depended on CSU duration. A 2022 meta-analysis by Zhang et al. found that CSU patients had markedly higher odds of positive thyroid findings than HCs [44]. Our study supported results of study conducted by Esmaeilzadeh et al., who reported allergic rhinitis in 40.7% of CSU participants [45].
Arunkajohnsak et al. (2022) found higher ESR and a lower prevalence of allergic rhinitis in ANA-positive CSU [46]. In our study, most patients had no autoimmune background (78%); 22% had an autoimmune background (ANA ≥ 1:160), which was not associated with CSU severity. Literature indicates ANA is more often positive in CSU, but overt autoimmune diseases may be diagnosed up to 10 years after CSU onset [18], which may explain the absence of a significant association between ANA titer and CSU in our sample.
Most previous research results have shown lower vitamin D values in CSU than in HCs, and our research results support reduced vitamin D values [47,48,49,50,51]. According to one research which examined vitamin D concentrations across multiple dermatoses (CSU, atopic dermatitis, contact dermatitis), vitamin D tended to be lower in CU (not significantly) and did not differ significantly by age, sex, residence, or allergy presence/type [52].
The strength of our study are: its prospective character (rarely in the literature) obtained data that serum parameter levels (IL-6, CBC, ESR, CRP, thyroid findigs, D-dimer, vitamin D) were most often slightly elevated, while basophil counts were frequently reduced; T4 showed a significant dependence on CSU duratio; basophil concentration significantly negatively correlated with daily disease activity (daily UAS); and with DLQI; basopenia was more frequent in patients with moderate/severe CSU than in those with mild disease or remission, as measured by daily UAS (79% vs. 37%); basophil concentration was the only biomarker useful in assessing CSU severity/daily UA (sensitivity 78.6%; specificity 63%); ESR as the only significant predictor for UAS7 severity.
However, we may mention the limitations of this research which should be taken into account: the low number of participants (they were mostly those with mild CSU), and data that some of our patients recently were treated by systemic corticosteroids, as well as their concurrent antihistamine use

4. Materials and Methods

4.1. Subjects

Our prospective study was conducted at the Department of Dermatovenereology, University Hospital Center “Sestre Milosrdnice,” Zagreb, Croatia, from November 2021 to March 2023.
A total of 41 adults with CSU were enrolled (32 women, 9 men; age range 23–79 years). In 44% of participants, the disease had been present for 3–6 months. All patients were treated with bilastine (20 mg twice daily, increased up to four tablets daily during exacerbations).
Inclusion criteria were age ≥18 years and a confirmed diagnosis of CSU with daily or near-daily wheals or angioedema for at least 6 weeks. Exclusion criteria included acute urticaria, urticarial vasculitis, other non-chronic urticaria subtypes, inducible urticaria unrelated to CSU, isolated angioedema, systemic diseases affecting assessment, and use of immunosuppressive drugs, psychoactive therapy, biologics, or systemic corticosteroids within two weeks prior to enrolment.

4.2. The Ethical Statement

Our research was approved by the Ethics Committee of the University Hospital Center “Sestre Milosrdnice”, Zagreb, Croatia in November 2021 (Number of protocol: 251-29-11-21-01-9), and all patients included in the study gave their written informed consent to participate.

4.3. Methods

Blood samples were collected to measure serum IL-6, ESR, CRP, CBC, total IgE, thyroid findings, ANA, D-dimer, and vitamin D. Participants also completed standardized assessment tools for CSU severity: the daily UAS (day of sampling), UAS7 (previous 7 days), UCT (previous 4 weeks), and DLQI (previous 7 days).

4.3.1. Serum Parameters

ESR, CRP, IL-6, and other serum markers were analyzed using standard laboratory methods. ESR was determined by the Westergren technique using citrate-treated blood in Vaccuette® tubes. CRP was measured on the Architect c8000 analyzer (latex immunoturbidimetry; reference range 0–5 mg/L). Serum IL-6 was quantified by electrochemiluminescence on the Roche Cobas E601 system (reference range 0–7 pg/mL).
From a whole blood sample collected by venipuncture into an ethylenediaminetetraacetic acid (EDTA) tube a complete blood count (CBC) was performed, specifically determining the concentration and proportion of basophils in the blood. Basophil values were expressed both as an absolute count and as a percentage of the total leukocyte count. Basopenia was defined as a basophil count lower than 0.1 × 10³/mm³.
For the determination of total IgE, a blood sample was collected into additive-free tubes (Vaccuette®, Greiner Bio-One, Kremsmünster, Austria), centrifuged, and total IgE levels were measured from serum using a chemiluminescent assay on the Immulite 2000 analyzer (Siemens Healthcare Diagnostics Products GmbH, Marburg, Germany). Reference values for total IgE were ≤114 kIU/L.
For the determination of thyroid findings, a blood sample was collected into additive-free tubes, centrifuged, and serum concentrations of the aforementioned parameters were measured using a Cobas e601 immunoassay analyzer (Roche Diagnostics, Basel, Switzerland).
For the determination of antinuclear antibody (ANA) titers, a blood sample was collected into additive-free tubes (Vaccuette®, Greiner Bio-One, Kremsmünster, Austria), centrifuged, and ANA determination was performed using the indirect immunofluorescence method on HEp-2 cells, which are considered the gold standard for ANA detection. The antihuman immunoglobulin conjugate labeled with the fluorochrome fluorescein isothiocyanate (FITC) used in the ANA IIF test is specific for IgG-class antibodies. For interpretation, ANA titers below 1:160 were considered negative, whereas patients with CSU who had an ANA titer ≥1:160 were considered to have an underlying autoimmune disorder as one of the possible etiopathogenetic causes of CSU.
For the determination of D-dimer, a blood sample was collected into a sodium citrate tube (Vaccuette®, Greiner Bio-One, Kremsmünster, Austria), and values were determined from plasma.
For the determination of vitamin D from serum, a blood sample was collected into an additive-free tube (Vaccuette®, Greiner Bio-One, Kremsmünster, Austria), centrifuged, and the serum vitamin D concentration was measured using the commercially available Elecsys® Vitamin D assay on a Cobas e601 immunoassay analyzer (Roche Diagnostics, Basel, Switzerland).

4.3.2. Questionnaires

To assess CSU severity and patient QoL, we used the UAS7, once-daily UAS, UCT, DLQI, and CU-Q2oL, in accordance with current guidelines [1].
The Urticaria Activity Score (UAS) evaluates wheals and pruritus over a 24-hour period [1,30].
UCT consists of four questions evaluating symptom burden, QoL impact, medication effectiveness, and overall disease control over the preceding four weeks, a total score of 0–16 (≥12 indicates well-controlled urticaria, whereas <12 reflects poor control) [31].
DLQI) covers six domains (symptoms, daily activities, leisure, work/school, relationships, and treatment) over a 7-day recall. [32].
CU-Q2oL is specifically designed to assess QoL impairment in CSU patients. It consists of 23 questions across six domains [1,33].

4.3.3. Statistical Analysis

Data normality was assessed using the Kolmogorov–Smirnov and Shapiro–Wilk tests. Associations were analyzed with Spearman’s rank correlation (Cohen’s criteria: r = 0.25–0.3 weak, 0.3–0.5 moderate, 0.5–0.7 strong, >0.7 very strong) and linear regression.
Serum and salivary biomarkers were compared across disease categories using Kruskal–Wallis and Mann–Whitney tests.
Univariate and multivariate logistic regression analyses were employed to evaluate predictors of the clinical severity of CSU based on biomarker levels. The sensitivity and specificity of each biomarker significantly associated with clinical severity were assessed using receiver operating characteristic (ROC) curve analysis.
Interindividual variability of salivary IL-6 was estimated as the standard deviation of all participants’ first measurements, while intraindividual variability was calculated as the mean difference between paired samples from the same participants collected within the same period, expressed with standard deviation and 95% CI. Intraindividual variability was further evaluated using the intraclass correlation coefficient (ICC) and the Wilcoxon test.
Comparison of initial (T1) and follow-up (T2) findings was conducted using the Wilcoxon test, with effect size quantified as for the Mann–Whitney test.
All analyses were performed using IBM SPSS Statistics software, version 22.0 (IBM Corp., Armonk, NY, USA), with the level of statistical significance set at p < 0.05.

5. Conclusions

Considering the limitations of our study which should be taken into account, our results support using the once-daily UAS to determine CSU severity, basophil counts for assessing CSU severity by daily UAS, the assessment of serum IL-6 in the routine diagnostics of patients with CSU.

Author Contributions

Conceptualization, M.K. and L.L.-M.; methodology, M.K., M.Š., and L.L.-M.; software, M.K.; and F.I.M.; validation, M.K., L.L.-M. and M.Š.; formal analysis, E.B.; and F.I.M.; investigation, M.K.; resources, M.K.; and M.A.; data curation, M.K., M.Š., E.B.; and F.I.M.; writing—original draft preparation, M.K. and L.L.-M.; writing—review and editing, M.K. ; visualization, M.K.; supervision, L.L.-M. and M.Š.; project administration, M.K.; funding acquisition, L.L.-M.; and M.A. All authors agreed to the published version of the manuscript.

Funding

Statement No external sources of funding were received for this research.

Institutional Review Board Statement

The study was conducted in accordance with the Declaration of Helsinki, and approved Ethics Committee of University Hospital Center “Sestre Milosrdnice”, Zagreb, Croatia, in November 2021 (Number of protocol: 251-29-11-21-01-9), for studies involving humans. The study was carried out on equipment purchased through the grant KK.01.1.1.02-0014 of the European Regional Development Fund.

Informed Consent Statement

Every participant signed informed consent. The patient(s) additionally provided written consent for the publication of this manuscript.

Conflicts of Interest

None.

References

  1. Zuberbier, T.; Abdul Latiff, A.H.; Abuzakouk, M.; Aquilina, S.; Asero, R.; Baker, D.; et al. The international EAACI/GA2LEN/EuroGuiDerm/APAAACI guideline for the definition, classification, diagnosis, and management of urticaria. Allergy. 2022;77(3):734-766. [CrossRef]
  2. Pozderac, I.; Lugović-Mihić, L.; Artuković, M.; Stipić-Marković, A.; Kuna, M.; Ferček, I. Chronic inducible urticaria: Classification and prominent features of physical and non-physical types. Acta. Dermatovenerol. Alp. Pannonica. Adriat. 2020;29:141–148. [CrossRef]
  3. Fricke, J.; Ávila, G.; Keller, T.; Weller, K.; Lau, S.; Maurer, M.; Zuberbier, T.; Keil, T. Prevalence of chronic urticaria in children and adults across the globe: Systematic review with meta-analysis. Allergy. 2020;75:423–432. [CrossRef]
  4. Bracken, S.J.; Abraham, S.; MacLeod, A.S. Autoimmune theories of chronic spontaneous urticaria. Front. Immunol. 2019;10:627. [CrossRef]
  5. Kolkhir, P.; Giménez-Arnau, A.M.; Kulthanan, K.; Peter, J.; Metz, M.; Maurer, M. Urticaria. Nat. Rev. Dis. Primers. 2022;8:61. [CrossRef]
  6. Poddighe, D. The prevalence of chronic spontaneous urticaria (CSU) in the pediatric population. J. Am. Acad. Dermatol. 2019;81:e149. [CrossRef]
  7. Saini, S.S.; Kaplan, A.P. Chronic spontaneous urticaria: the devil’s itch. J. Allergy. Clin. Immunol. Pract. 2018;6(4):1097. [CrossRef] [PubMed]
  8. Baiardini, I.; Canonica, G.W.; La Grutta, S.; Braido, F. Clinically significant differences in patient-reported outcomes evaluations in chronic spontaneous urticaria. Curr. Opin. Allergy. Clin. Immunol. 2020;20(3):261-267. [CrossRef] [PubMed]
  9. Aleem, S.; Masood, Q.; Hassan, I. Correlation of C-reactive protein levels with severity – of chronic urticaria. Indian. J. Dermatol. 2014;59(6):636. [CrossRef]
  10. Kasperska-Zajac, A.; Sztylc, J.; Machura, E.; Jop, G. Plasma IL-6 concentration correlates with clinical disease activity and serum C-reactive protein concentration in chronic urticaria patients. Clin. Exp. Allergy. 2011;41(10):1386–1391. [CrossRef] [PubMed]
  11. Ucmak, D.; Akkurt, M.; Toprak, G.; Yesilova, Y.; Turan, E.; Yildiz I. Determination of dermatology life quality index, and serum C-reactive protein and plasma interleukin-6 levels in patients with chronic urticaria. Postep. Dermatol. I Alergol. 2013;30(3):146–151. [CrossRef]
  12. Zhang, Y.; Zhang, H.; Du, S.; Yan, S.; Zeng, J. Advanced biomarkers: therapeutic and diagnostic targets in urticaria. Int. Arch. Allergy. Immunol. 2021;182(10):917-931. [CrossRef]
  13. Rajappa, M.; Chandrashekar, L.; Sundar, I.; Munisamy, M.; Ananthanarayanan, P.H.; Thappa, D.M.; et al. Platelet oxidative stress and systemic inflammation in chronic spontaneous urticaria. Clin. Chem. Lab. Med. 2013;51(9),1789–1794. [CrossRef]
  14. Mishal, J.; Zeldin, Y.; Schlesinger, M. Clinical and laboratory features of antihistamine-resistant chronic idiopathic urticaria. Allergy. Asthma. Proc. 2011; 32(6): 460-466. [CrossRef]
  15. Yan, S.; Chen, W.; Su, J.; et al. Association between C reactive protein and clinical characteristics in patients with chronic spontaneous urticaria. J. Central South Univer. Med. Sci. 2017; 42(2): 168-172. [CrossRef]
  16. Huilan, Z.; Bihua, L.; Runxiang, L.; Jiayan, L.; Luyang, L.; Zhenjie, L. Features of antihistamine-resistant chronic urticaria and chronic urticaria during exacerbation. Indian. J. Dermatol. 2015; 60(3): 323. [CrossRef]
  17. Lugovic-Mihic, L.; Štrajtenberger, M.; Kuna, M.; Ladika-Davidović, B.; Barac, E.; Vilibić, M. Association Between Proinflammatory Cytokines IL-6 and TNF-Alpha, Psychological Stress and Chronic Spontaneous Urticaria Severity. Preprints 2025, 2025081087. [CrossRef]
  18. Confino-Cohen, R.; Chodick, G.; Shalev, V.; Leshno, M.; Kimhi, O.; Goldberg, A. Chronic urticaria and autoimmunity: associations found in a large population study. J. Allergy. Clin. Immunol. 2012;129 (5):1307-1313. [CrossRef] [PubMed]
  19. Saini, S.S. Chronic spontaneous urticaria: etiology and pathogenesis. Immunol. Allergy. Clin. North. Am. 2014;1;34(1):33–52. [CrossRef]
  20. Oliver, E.T.; Sterba, P.M.; Saini, S.S. Interval shifts in basophil measures correlate with disease activity in chronic spontaneous urticaria. Allergy. Eur. J. Allergy Clin. Immunol. 2015;70(5):601-603. [CrossRef] [PubMed]
  21. Oliver, E.T.; Sterba, P.M.; Devine, K.B.; Vonakis, B.M.; Saini, S.S. Altered expression of chemoattractant receptorhomologous molecule expressed on TH2 cells on blood basophils and eosinophils in patients with chronic spontaneous urticaria. J. Allergy. Clin. Immunol. 2016;137(1):304-306. [CrossRef] [PubMed]
  22. Jörg, L.; Pecaric-Petkovic, T.; Reichenbach, S.; et al. Double-blind placebo-controlled trial of the effect of omalizumab on basophils in chronic urticaria patients. Clin. Exp. Allergy. 2018; 48(2): 196-204. [CrossRef]
  23. Deza, G.; Bertolin-Colilla, M.; Pujol, R.M.; et al. Basophil FcepsilonRI expression in chronic spontaneous urticaria: a potential immunological predictor of response to omalizumab therapy. Acta. Dermato-Venereol. 2017; 97(6): 698-704. [CrossRef]
  24. Štrajtenberger, M.; Lugović-Mihić, L.; Stipić-Marković, A.; Artuković, M.; Mihić, R.; Dolački, L.; Pravica, N.B.; Lokner, I. Analysis of coagulation factors in angioedema/urticaria: increased values of D-dimer and fibrinogen in isolated angioedema. Acta. Dermatovenerol. Alp. Pannonica. Adriat. 2024 Jun;33(2):63-68. [CrossRef] [PubMed]
  25. Asero, R.; Marzano, A.V.; Ferrucci, S.; Cugno, M. D-dimer plasma levels parallel the clinical response to omalizumab in patients with severe chronic spontaneous urticaria. Int. Arch. Allergy. Immunol. 2017; 172(1): 40-44. [CrossRef] [PubMed]
  26. Marzano, A.V.; Genovese, G.; Casazza, G.; et al. Predictors of response to omalizumab and relapse in chronic spontaneous urticaria: a study of 470 patients. J. Eur. Acad. Dermatol. Venereol. 2019; 33(5): 918-924. [CrossRef]
  27. Ertas, R.; Ozyurt, K.; Atasoy, M.; Hawro, T.; Maurer, M. The clinical response to omalizumab in chronic spontaneous urticaria patients is linked to and predicted by IgE levels and their change. Allergy. 2018; 73(3): 705-712. [CrossRef]
  28. Magen, E.; Chikovani, T.; Waitman, D.A.; Kahan, N.R. Factors related to omalizumab resistance in chronic spontaneous urticaria. Allergy. Asthma. Proc. 2019; 40(4): 273-278. [CrossRef]
  29. Fok, J.S.; Kolkhir, P.; Church, M.K.; Maurer, M. Predictors of treatment response in chronic spontaneous urticaria. Allergy. 2021 Oct;76(10):2965-2981. [CrossRef] [PubMed]
  30. Kuna, M.; Štefanović, M.; Ladika Davidović, B.; Mandušić, N.; Birkić Belanović, I.; Lugović-Mihić, L. Chronic Urticaria Biomarkers IL-6, ESR and CRP in Correlation with Disease Severity and Patient Quality of Life-A Pilot Study. Biomedicines. 2023;11(8):2232. [CrossRef] [PubMed]
  31. Weller, K.; Groffik, A.; Church, M.K.; Hawro, T.; Krause, K.; Metz, M.; et al. Development and validation of the urticaria control test: a patient-reported outcome instrument for assessing urticaria control. J. Allergy. Clin. Immunol. 2014;133(5):1365-1372, 1372.e1-6. [CrossRef]
  32. Finlay, A.Y.; Khan, G.K. Dermatology life quality index (DLQI)--a simple practical measure for routine clinical use. Clin. Exp. Dermatol. 1994;19(3):210-216. [CrossRef]
  33. Kocatürk, E.; Kızıltaç, U.; Can, P.; Öztaş Kara, R.; Erdem T., Kızıltaç, K.; et al. Validation of the turkish version of the urticaria control test: correlation with other tools and comparison between spontaneous and inducible chronic urticaria. World. Allergy. Organ. J. 2019; 26;12(1):100009. [CrossRef]
  34. Kasperska-Zajac, A.; Brzoza, Z.; Rogala, B. Plasma concentration of interleukin 6 (IL-6), and its relationship with circulating concentration of dehydroepiandrosterone sulfate (DHEA-S) in patients with chronic idiopathic urticaria. Cytokine. 2007;39(2):142-6. [CrossRef] [PubMed]
  35. Kasperska-Zajac, A.; Grzanka, A.; Machura, E.; Mazur, B.; Misiolek, M.; Czecior, E.; et al. Analysis of procalcitonin and CRP concentrations in serum of patients with chronic spontaneous urticaria. Inflamm. Res. 2013;62(3):309-312. [CrossRef]
  36. de Montjoye, L.; Darrigade, A.S.; Giménez-Arnau, A.; Herman, A.; Dumoutier, L.; Baeck, M. Correlations between disease activity, autoimmunity and biological parameters in patients with chronic spontaneous urticaria. Eur. Ann. Allergy. Clin. Immunol. 2021; 53(2):55-66. [CrossRef] [PubMed]
  37. Kolkhir, P.; Altrichter, S.; Hawro, T.; Maurer, M. C-reactive protein is linked to disease activity, impact, and response to treatment in patients with chronic spontaneous urticaria. Allergy. 2018;73(4):940-948. [CrossRef]
  38. Yanase, Y.; Matsubara, D.; Takahagi, S.; Tanaka, A.; Ozawa, K.; Hide, M. Basophil characteristics as a marker of the pathogenesis of chronic spontaneous urticaria in relation to the coagulation and complement systems. Int. J. Mol. Sci. 2023;24(12):10320. [CrossRef] [PubMed]
  39. Poddighe, D.; Vangelista, L. Effects of omalizumab on basophils: potential biomarkers in asthma and chronic spontaneous urticaria. Cell. Immunol. 2020;358:104215. [CrossRef]
  40. Gericke, J.; Metz, M.; Ohanyan, T.; Weller, K.; Altrichter, S.; Skov, P.S.; et al. Serum autoreactivity predicts time to response to omalizumab therapy in chronic spontaneous urticaria. J. Allergy. Clin. Immunol. 2017;139(3):1059-1061.e1. [CrossRef]
  41. Metz, M.; Torene, R.; Kaiser, S.; Beste, M.T.; Staubach, P.; Bauer, A.; et al. Omalizumab normalizes the gene expression signature of lesional skin in patients with chronic spontaneous urticaria: a randomized, double-blind, placebo-controlled study. Allergy. 2019;74(1):141-151. [CrossRef]
  42. Akdogan, N.; Demirel Ogut, N.; Dogan, S.; Atakan, N. Long-term effects of omalizumab on peripheral blood cells and C-reactive protein levels in patients with chronic spontaneous urticaria. Dermatol. Ther. 2019;32(4):e12966. [CrossRef]
  43. Cakmak, M.E. Comparison of the Patients with Chronic Urticaria Who Responded and Did Not Respond to Omalizumab Treatment: A Single-Center Retrospective Study. Int. Arch. Allergy. Immunol. 2022;183(11):1209-1215. [CrossRef] [PubMed]
  44. Zhang, L.; Qiu, L.; Wu, J.; Qi, Y.; Wang, H.; Qi, R.; et al. IgE and IgG anti-thyroid autoantibodies in Chinese patients with chronic spontaneous urticaria and a literature review. Allergy. Asthma. Immunol. Res. 2022;14(1):131-142. [CrossRef] [PubMed]
  45. 27./110. Esmaeilzadeh, H.; Eskandarisani, M.; Nabavizadeh, H.; Alyasin, S.; Vali, M.; Mortazavi, N. Investigating the association of atopy and aeroallergen sensitization and chronic spontaneous urticaria. Postepy. Dermatol. Alergol. 2022;39(1):121-125. [CrossRef] [PubMed]
  46. Arunkajohnsak, S.; Jiamton, S.; Tuchinda, P.; Chularojanamontri, L.; Rujitharanawong, C.; Chanchaemsri, N.; et al. Do antinuclear antibodies influence the clinical features of chronic spontaneous urticaria?: a retrospective cohort study. Biomed. Res. Int. 2022; 29;2022:7468453. [CrossRef]
  47. Grzanka, A.; Machura, E.; Mazur, B.; Misiolek, M.; Jochem, J.; Kasperski, J.; et al. Relationship between vitamin D status and the inflammatory state in patients with chronic spontaneous urticaria. J Inflamm (Lond). 2014; 11(1):2. doi: 10.1186/1476-9255-11-2.
  48. Wu, C.H.; Eren, E.; Ardern-Jones, M.R.; Venter, C. Association between micronutrient levels and chronic spontaneous urticaria. Biomed. Res. Int. 2015;2015:926167. [CrossRef]
  49. Lee, S.J.; Ha, E.K.; Jee, H.M.; Lee, K.S.; Lee, S.W.; Kim, M.A.; et al. Prevalence and risk factors of urticaria with a focus on chronic urticaria in children. Allergy. Asthma. Immunol. Res. 2017;9(3):212-219. [CrossRef]
  50. Thorp, W.A.; Goldner, W.; Meza, J.; Poole, J.A. Reduced vitamin D levels in adult subjects with chronic urticaria. J. Allergy. Clin. Immunol. 2010;126(2):413; author reply 413-414. [CrossRef]
  51. Woo, Y.R.; Jung, K.E.; Koo, D.W.; Lee, J.S. Vitamin D as a marker for disease severity in chronic urticaria and its possible role in pathogenesis. Ann. Dermatol. 2015;27(4):423-430. [CrossRef] [PubMed]
  52. Lugović-Mihić, L.; Mandušić, N.; Dasović, M.; Pondeljak, N.; Kuna, M.; Pozderac, I. Vitamin D supplementation in patients with atopic dermatitis, chronic urticaria and contact irritant and allergic dermatitis—possible improvement without risk. Folia. Med. 2022; 64(3):467–477. [CrossRef]
Figure 1. Distribution of CSU patients (percentage) according to disease duration; N – number of patients with CSU, w – weeks, mo – months.
Preprints 190521 g001
Figure 2. Distribution of CSU patients (percentage) according to weekly disease activity (UAS7). N – number of patients with.
Preprints 190521 g002
Figure 3. Distribution of CSU patients (percentage) according to different levels of impac. N – number of patients with.
Preprints 190521 g003
Figure 4. Distribution of CSU patients (percentage) according to CSU-specific QoL impact (CU-Q2oL) N – number of patients with CSU.
Preprints 190521 g004
Figure 5. Association between basophil count (×10⁹/L) and daily UAS (p = 0.002).
Preprints 190521 g005
Figure 6. Association between basophil count (×10⁹/L) and DLQI impairment (p ≤ 0.034).
Preprints 190521 g006
Figure 7. Association between basophil count (×10⁹/L) and CU-Q2oL impairment (p ≤ 0.023).
Preprints 190521 g007
Figure 8. Sensitivity and specificity curve of basophil count in CSU patients for assessing CSU clinical severity measured by daily UAS (p = 0.028) p = level of statistical significance.
Preprints 190521 g008
Figure 9. Dependence of serum thyroxine (T4, nmol/L) on CSU duration (months) (p = 0.036).
Preprints 190521 g009
Figure 10. Association between serum T3 (nmol/L) concentration and impaired dermatological QoL measured by DLQI in CSU patients.
Preprints 190521 g010
Table 1. Descriptive statistics of patients with CSU.
Variable N mean ± SD median IQR Min Max
Disease duration (months) 41 12,2 ± 12,8 7 5 – 11,5 2 64
vitamin D (nmol/L ) 41 60,3 ± 24,3 61,0 43,5 – 72,5 23,0 113,0
Percentage of basophils (%) 41 0,66 ± 0,36 0,50 0,35 – 0,80 0,0 1,7
Basophil concentration (x 109/L) 41 0,03 ± 0,4 0,00 0,00 – 0,09 0,00 0,10
ESR (mm/3,6 ks) 41 8,9 ± 6,9 6,0 4,0 – 12,5 2,0 28,0
D-dimer (mg/L) 39 0,48 ± 0,48 0,32 0,21 – 0,54 0,10 2,73
total IgE (kIU/L) 41 203,1 ± 396,7 94,0 18,5 – 171,0 3,0 2292,0
anti-TG (kIU/L) 41 24,3 ± 107,3 0,9 0,7 – 2,3 0,3 677,3
N – number of patients with CSU; SD – standard deviation; IQR – interquartile range (25th–75th percentile); min – minimum value; max – maximum value; mo. – months.
Table 2. Correlation of serum IL-6 values ​​with other serum biomarkers in patients with CSU.
Variables serum IL-6 (pg/mL)
CRP (mg/L) R 0,379
P 0,016
r N 40
vitamin D (nmol/L) R 0,11
P 0,5
N 40
Basophil presentage (%) R −0,097
P 0,553
N 40
Basophil concentration (x 109/L) R −0,146
P 0,368
N 40
ESR (mm/3,6 ks) R 0,319
P 0,045
N 40
D-dimers (mg/L) R 0,606
P < 0,001
N 39
p – level of statistical significance, r – Spearman's correlation coefficient, N – number of patients with CSU. Abbreviations: IL-6 – interleukin 6, CRP – C-reactive protein, SE – erythrocyte sedimentation rate.
Table 3. Correlation of serum IL-6 values ​​with other serum biomarkers in patients with CSU.
total IgE (kIU/L) R 0,207
P 0,199
N 40
TSH (mIU/L) R 0,275
P 0,09
N 39
T3 (nmol/L) R 0,370
P 0,019
N 40
T4 (nmol/L) R 0,321
P 0,043
N 40
anti-TPO (kIU/L) R −0,143
P 0,384
N 39
anti-TG (kIU/L) R 0,252
P 0,117
N 40
p – level of statistical significance, r – Spearman's correlation coefficient, N – number of patients with KSU. Abbreviations: IL-6 – interleukin 6, IgE – immunoglobulin E, TSH – thyroid-stimulating hormone, T3 – triiodot; hyronine, T4 – thyroxine, anti-TPO – antibodies to thyroid peroxidase, anti-TG – antibodies to thyroglobulin.
Disclaimer/Publisher’s Note: The statements, opinions and data contained in all publications are solely those of the individual author(s) and contributor(s) and not of MDPI and/or the editor(s). MDPI and/or the editor(s) disclaim responsibility for any injury to people or property resulting from any ideas, methods, instructions or products referred to in the content.
Copyright: This open access article is published under a Creative Commons CC BY 4.0 license, which permit the free download, distribution, and reuse, provided that the author and preprint are cited in any reuse.
Prerpints.org logo

Preprints.org is a free preprint server supported by MDPI in Basel, Switzerland.

Subscribe

Disclaimer

Terms of Use

Privacy Policy

Privacy Settings

© 2026 MDPI (Basel, Switzerland) unless otherwise stated