
Submitted:
18 December 2025
Posted:
19 December 2025
You are already at the latest version
Abstract
Background/Objectives: Thymic epithelial tumors (TETs) are rare, histologically heterogeneous neoplasms lacking robust molecular biomarkers. Hippo pathway dysregulation—driving YAP1/TEAD-dependent transcription—has been implicated across cancers, but transcript-level data in TETs are limited. Methods: We retrospectively profiled 26 formalin-fixed, paraffin-embedded (FFPE) specimens by SYBR real-time quantitative polymerase chain reaction (RT-qPCR) among different World Health Organization (WHO) subtypes with the focus on the hippo kinase core targets YAP1, TEAD4, MST1/STK4, SAV1, LATS1, and MOB1A. Expression was normalized to the geometric mean of HPRT1and TBP and summarized as 2-ΔΔCq [log2 fold changes (FC)] relative to pooled normal. Group differences were tested non-parametrically. Results: YAP1 and TEAD4 were upregulated across tumors, most prominently in type A (YAP1 ≈+3.43) and B3 (YAP1 ≈+2.78) thymomas, with TEAD4 strongly increased in thymic carcinoma (TC) (≈+3.49) and elevated in type A/B3. Upstream kinases were reduced, particularly in TC (MST1 ≈−1.38; LATS1 ≈−1.34), and modestly in B1. SAV1 was elevated in type A (≈+2.25) and B3 (≈+2.01), while MOB1A remained near baseline with slight subtype shifts. Differential expression among WHO subtypes was significant for YAP1 (p = 0.003), TEAD4 (p = 0.015), SAV1 (p = 0.004), MST1 (p = 0.012), and LATS1 (p = 0.036, all Kruskal–Wallis), but not for MOB1A (p = 0.09). Conclusions: TETs exhibit subtype-dependent Hippo pathway alterations, characterized by enhanced YAP1–TEAD4 transcriptional output and progressive reduction of the MST1/LATS1 kinase module, most pronounced in TC. These transcript-level patterns support the potential of Hippo-based biomarkers and may guide future therapeutic strategies.
Keywords:
hippo signaling pathway
; thymic epithelial tumors
; RT-qPCR
; relative gene expression
; TETs
; YAP1
; TEAD4
1. Introduction
Thymic epithelial tumors (TETs) are uncommon cancers of thymic epithelium with heterogeneous clinical courses [1]. Although they comprise only 0.2–1.5% of all malignancies, they are the most frequent tumors of the anterior mediastinum [2]. Histology alone insufficiently predicts biological behavior—particularly given that clinical aggressiveness spans from thymoma type A/AB through B1–B3 to thymic carcinoma (TC)—making risk stratification and the separation of indolent from aggressive disease challenging and underscoring the need for robust molecular biomarkers to improve diagnosis and prognosis [2,3].
A detailed understanding of the molecular basis of cancer is fundamental to designing effective, individualized therapies [4]. Among signaling circuits that drive tumorigenesis when deregulated, the Hippo pathway centrally regulates tissue and organ growth during development; its disruption promotes malignancy by coupling unchecked proliferation with impaired apoptosis—two canonical cancer hallmarks [4]. Hippo dysregulation arises from both genetic and non-genetic mechanisms and contributes to tumor development across entities– including glioma, breast, liver, lung, prostate, colorectal, and gastric cancers [5,6,7]. Importantly, diverse upstream disturbances appear to converge on a shared downstream output: activation of the transcriptional co-effectors Yes-associated protein 1 (YAP1) and transcriptional co-activator with PDZ-binding motif (TAZ/WWTR1), which, through TEA domain transcription factors 1–4 (TEAD1–4), reprogram gene expression linked to tumor progression, metastasis, immune modulation, metabolic adaptation, and therapy resistance [4,6]. Humans encode four TEAD paralogs (TEAD1–4) that partner with YAP/TAZ; therapeutic efforts have therefore sought to interfere with YAP/TAZ–TEAD complex formation [6].
Prior work on Hippo signaling in TETs remains limited; although key studies implicate this pathway, uncertainties persist regarding subtype-resolved expression patterns and their clinical relevance [2,8]. Moreover, Hippo activity appears context dependent, with reports across cancers noting differences related to subcellular localization (nuclear vs. cytoplasmic) and tumor type, highlighting the need for careful, subtype-aware analyses [2,6,8].
Building on our prior immunohistochemical (IHC) survey of TETs—which demonstrated widespread expression of core and upstream Hippo components and, notably, associated cytoplasmic TEAD4 with poorer overall survival [2]—we now focused on a transcript-level characterization of the Hippo pathway in a subset of the original cohort. Specifically, we profiled quantitative real-time polymerase chain reaction (qPCR) expression of the pathway’s output and control tiers—YAP1, TEAD4, and the upstream regulators mammalian STE20-like kinase 1 (MST1/STK4), Salvador family WW domain-containing protein 1 (SAV1), large tumor suppressor kinase 1 (LATS1), and MOB kinase activator 1A (MOB1A)— across histological subtypes, using pooled normal thymus as reference. Our primary aim was to describe the messenger RNA (mRNA) expression patterns of these core Hippo components across TETs subtypes relative to normal thymus and to assess whether transcript-level differences qualitatively mirror and extend the protein-level alterations observed previously, thereby providing a complementary expression-based layer to existing IHC data and that may inform the potential of Hippo-based biomarkers in TETs.
2. Materials and Methods
2.1. Study Design and Ethical Considerations
This retrospective, anonymized study was conducted in accordance with the Declaration of Helsinki (institutional review board (IRB) statement IRB-2024-07 dated 2024-04-05).
2.2. Case Selection and Tissue Processing
This study includes 26 archival FFPE samples, comprising 23 thymic epithelial tumors (TETs) and three samples of non-neoplastic thymus (N1–N3), diagnosed between 2013 and 2023 in the Department of Pathology, Nuremberg Clinic (Nuremberg, Germany). The median age at diagnosis was 59 years (range 36–77 years), with a slight male predominance. Clinical and pathological characteristics refer to the 23 TET patients and are summarized in Table 1.
This collection of cases derives from a larger group of IHC-characterized cohort of 77 cases from our previous investigation [2]. The selection of cases to be included in the present investigation was based on block quality and available tissue, comprising normal thymus (N) (n = 3), thymoma type A (n = 3), thymoma B1–B3 (n = 5 each), and TC (n = 5). For each selected paraffin embedded block, 5–10 sections of 5 µm thickness were prepared.
2.3. RNA Extraction and Nucleic Acid Quantification
Total RNA was isolated using the Maxwell® RSC FFPE RNA Kit (Promega, Madison, WI, USA) following the manufacturer’s instructions, including a deparaffinization step and DNase I treatment. Because thymic tissue can harbor a physiologically high genomic DNA (gDNA) burden, RNA and residual DNA concentrations were quantified fluorometrically to guide downstream primer strategies (Qubit™, Thermo Fisher Scientific, Waltham, MA, USA). Spectrophotometric purity (A260/280) was assessed with a NanoDrop™ Lite (Thermo Fisher Scientific, Waltham, MA, USA; Table S1), with an expected ratio of 1.8–2.0. As RIN/DV200 metrics are of limited utility for highly fragmented FFPE-derived RNA, functional integrity was assessed indirectly by consistent amplification of short amplicons of reference genes and by passing of the kit-provided internal control (IC) in all analyzed samples (see Section 2.4.3).
2.4. One-Step RT-qPCR Workflow
Reverse transcription (RT) and qPCR were performed in a single-tube, two-phase protocol using the QuantiNova® SYBR® Green RT-PCR Kit (QIAGEN, Hilden, Germany; Cat. No. 208154) on a CFX96™ Real-Time PCR Detection System (Bio-Rad, Hercules, CA, USA), strictly following the manufacturer’s instructions.
2.4.1. Input Optimization
To balance conservation of FFPE eluate with robust amplification, total nucleic acid input was titrated in pilot reactions (10–100 ng per 20 µL). An input of 50 ng per 20 µL provided consistent amplification, linear response, and acceptable replicate dispersion and was used for all analytical runs.
2.4.2. Cycling Conditions and Data Acquisition
Reactions (20 µL) contained 10 µL 2× SYBR® Green RT-PCR Master Mix, 0.2 µL QN SYBR® Green RT-Mix, 2 µL 10× primer mix (0.5 µM each primer), 2 µL RNA template (50 ng) and 5.8 µl nuclease-free water, or optional additional 1 µL QN IC RNA and 4.8 µl nuclease-free water.
QuantiNova® SYBR® Green RT-PCR Kits use a two-step hot-start system with sequential activation of reverse transcriptase (50 °C, 10 min) and DNA polymerase (95 °C, 2 min), followed by 40 cycles of 95 °C for 5 s and 60 °C for 10 s, minimizing non-specific amplification and primer–dimer formation. Melt curve analysis (65-95 °C; 0.2 °C increments for 5s) verified single-product amplification. Cq values were calculated with CFX Manager™ Dx version 3.1 (Bio-Rad, Hercules, CA, USA) using a constant baseline and threshold across plates.
The CFX96™ Real-Time PCR instrument (Bio-Rad) was replaced due to scheduled maintenance after the measurement of sample 21. To verify inter-run comparability and exclude a systematic bias introduced by the replacement, two representative FFPE samples were analyzed in triplicate for selected targets [YAP1, MOB1A, TATA-box binding protein (TBP) and Hypoxanthine-guanine phosphoribosyl transferase 1 [HPRT1, RealTimePrimers.com (RTP)] on both cyclers, accepting an inter-instrument variation of ≤0.5–1 Cq. When the QuantiNova® SYBR® Green RT-PCR kit lot was changed, lot-to-lot consistency was assessed by re-analyzing the same two cDNA samples across four independent reagent lots, accepting an inter-instrument variation of ≤0.5–1 Cq. Details of cross-instrument, inter-run variability and lot-to-lot testing are provided in Section 3.1. and in Supplementary Tables S2-S4.
SAV1 and LATS1 were quantified in a subsequent qPCR run (block 2) due to reagent resupply, using the same reference genes [HPRT1 (RTP) and TBP) and the same ΔΔCq normalization to the median of normal thymus samples (N1 and N3) as for all other targets.
2.4.3. Run Controls and Acceptance Criteria
Each plate included no-template controls (NTC) for every assay and no-reverse-transcriptase controls (NRT) for every sample. NTCs were required to show no amplification or a late signal with Cq ≥ 37.5 within 40 cycles; NRTs were required to be negative to exclude material gDNA contribution. Specificity was confirmed by single-peak melt curves.
An internal amplification control (QuantiNova Internal Control RNA, QN IC RNA) of the QuantiNova® LNA® PCR Reference Assay (QIAGEN, Hilden, Germany; Ref. No. 249920) was included once for every sample. The QN IC RNA monitors the efficiency of reverse transcription and amplification and is intended to detect instrument or reagent malfunction, assay setup errors, and the presence of PCR inhibitors; it is detected as a 200 bp amplicon [9]. Assay performance was considered acceptable for ΔCq (sample − IC) < 2 (Table S5).
A separate pooled positive calibrator was not included. Inter-run performance was monitored via the kit-provided IC and predefined quality criteria (QC) (see Section 2.8), and all expression values were normalized to validated reference genes (see Section 2.6).
For MOB1A, the initial measurement of the normal thymus sample N1 failed quality control (all three technical replicates invalid), and N1 was therefore re-analyzed on an additional qPCR plate. Cq values from this repeat run were normalized using the same reference genes [(TBP and HPRT1 (RTP)], and N1 was retained as calibrator for MOB1A in combination with N3.
2.5. Primer Design, Procurement, and Assay Validation
Primers targeted core Hippo-pathway genes. PrimeTime™ qPCR Primers for MST1/STK4 (Hs.PT.58.20785666), SAV1 (Hs.PT.58.45488696), LATS1 (Hs.PT.58.40644872), MOB1A (Hs.PT.58.40138473), YAP1 (Hs.PT.58.22607088), TEAD4 (Hs.PT.58.23238289), TBP (Hs.PT.58.20792004), peptidyl-prolyl isomerase A (PPIA; Hs.PT.39a.22214851), and HPRT1 (Hs.PT.58.20881146) were obtained from Integrated DNA Technologies (IDT™, Coralville, IA, USA). HPRT1 was also sourced from RealTimePrimers.com (USA; VHPS-4263).
Amplicon lengths were 94–141 bp (FFPE-compatible). In-silico specificity (BLAST) ensured transcript coverage and excluded pseudogene/gDNA matches. Despite DNase I treatment, low-level gDNA carryover was detectable in some NRT controls during early validation; therefore, assays were designed or replaced to span exon–exon junctions. Notably, SAV1 (IDT™; Hs.PT.58.45727297) and PPIA showed sporadic NRT signals in a subset of specimens; SAV1 was replaced by an alternative exon–exon assay (IDT™; Hs.PT.58.45488696), and PPIA was excluded from normalization (see Section 3.3.). In-run validation required a single melt curve peak and absence of NRT signals.
Two different TAZ (WWTR1) primers from IDT™ (Hs.PT.58.1944253 and Hs.PT.58.19363927) were initially included in the qPCR panel, but their SYBR Green assay showed low expression levels, recurrent primer–dimer amplification and/or non-specific amplification in NTCs and NRT controls. Because robust quantification could not be ensured, TAZ(WWTR1) qPCR data were excluded from further analyses. LATS1 (IDT™; Hs.PT.58.39498320) was also replaced because of non-specific amplification (Table S6 and Figure S1).
Details of the primer design, including forward and reverse primer sequence, amplicon size, exon location, and RefSeq number are listed in the Supplementary Table S6.
PCR efficiency was assessed using a 1:5 serial dilution [50–0.4 ng input complementary DNA (cDNA)] of a representative FFPE thymic sample (Table S7). Relative expression was calculated with the 2^−ΔΔCq method, assuming approximately equal amplification efficiencies across assays (E ≈ 2). Apparent efficiencies >100% are common when using FFPE-derived templates and primarily reflect matrix- and template-related artefacts rather than true reaction kinetics [10,11,12,13,14].
2.6. Reference Gene Strategy and Stability Assessment
Candidate reference genes included HPRT1 (RTP), HPRT1 (IDT™), TBP and PPIA selected based on prior use in thymic tissues/FFPE qPCR and reported stability in relative expression analyses [15,16,17]. All candidates were assayed across 26 samples (Table S8 and S9). Expression stability was evaluated with RefFinder (composite of geNorm, NormFinder, BestKeeper, and ΔCq approaches) [18]. The a priori criterion was the lowest composite rank across groups, with composite values ≤1.5 considered indicative of good stability and values >2–3 suggesting suboptimal reference genes. The geometric mean of the top two genes was predefined for normalization. The impact of run-specific variation on downstream ΔΔCq and log2FC estimates was mitigated by using the pooled median of two normal thymus tissues (N1/N3) measurements as the common calibrator for all runs (see Section 2.7.).
2.7. Quantification and Data Processing
Primary data were Cq values from technical triplicates. Outlier handling followed Section 2.8. Relative expression was computed as 2-ΔΔCq (reported as FC), normalizing to the geometric mean of HPRT1 (RTP) and TBP; for visualization and statistical analyses, values were additionally expressed as log2FC (Table S10 and S11). Calculations were performed in Excel (Microsoft, Redmond, WA, USA; version 16.100.3). The calibrator was defined as the median of N1 and N3; Normal sample 2 (N2) was excluded from the calibrator due to benign cyst histology with sparse thymic parenchyma and atypically high ΔCq values.
2.8. Replicates and Quality Criteria
All reactions were run in technical triplicates and assessed for intra-assay variability (Table S12 and S13). Triplicates with all three Cq values within ≤ 0.5 Cq were considered technically consistent (“gold standard”). For FFPE-derived RNA, a total spread of up to 0.8 Cq was accepted (“FFPE accepted”). Any replicate deviating by > 0.5 Cq from the mean of the two most consistent replicates was defined as a technical outlier and excluded from mean and standard deviation (SD) calculations. Reactions without two consistent replicates (ΔCq > 0.8) were classified as invalid and repeated. Biological replication was provided by independent tissue specimens per diagnostic group (N, A, B1, B2, B3, TC).
2.9. Statistics
Log2FC expression values were tested for normality. Group comparisons were tested using non-parametric tests (Mann–Whitney U test or Kruskal–Wallis ANOVA as appropriate) with correction for multiple comparisons (Benjamini–Hochberg false discovery rate). Correlations were assessed by Spearman’s correlation coefficient. The significance level was α = 0.05 (two-sided). Analyses were performed using STATA software 11.0 (STATA/SE, StataCorp LP, USA).
2.10. Reporting Standards
Methods and reporting adhere to the core recommendations of the original Minimum Information for Publication of Quantitative Real-Time PCR Experiments (MIQE) guidelines (2009) [10] and were further designed in alignment with key MIQE 2.0 updates, with detailed assay information and raw data provided in the Supplementary Material [19]. Supplementary materials include sample input concentrations and spectrophotometric purity (A260/280 ratios) (Table S1), reagent lot comparison (Table S2), inter-run variability (Table S3), cross-instrument comparison (Table S4), calculation of internal controls (ICs) (Table S5), primer assay oligonucleotide sequences (Table S6) and melt profiles (Figure S1), primer efficiency assessment (Table S7), replicate-level QC and exclusion criteria of excluded HKG samples excluded in analysis (Table S8), HKG Cq datasets used for RefFinder stability analysis (Table S9), calculation sheets for relative gene expression block 1 (Table S10), calculation sheets for relative gene expression block 2 (Table S11), raw Cq data matrices (Table S12), replicate-level QC metrics and exclusion criteria of samples included in analysis (Table S13), and details HKG stability statistics from RefFinder (Table S14), relative gene expression in relation to IHC results on a per-sample basis (Table S15).
3. Results
3.1. qPCR Assay Performance and Normalization Strategy
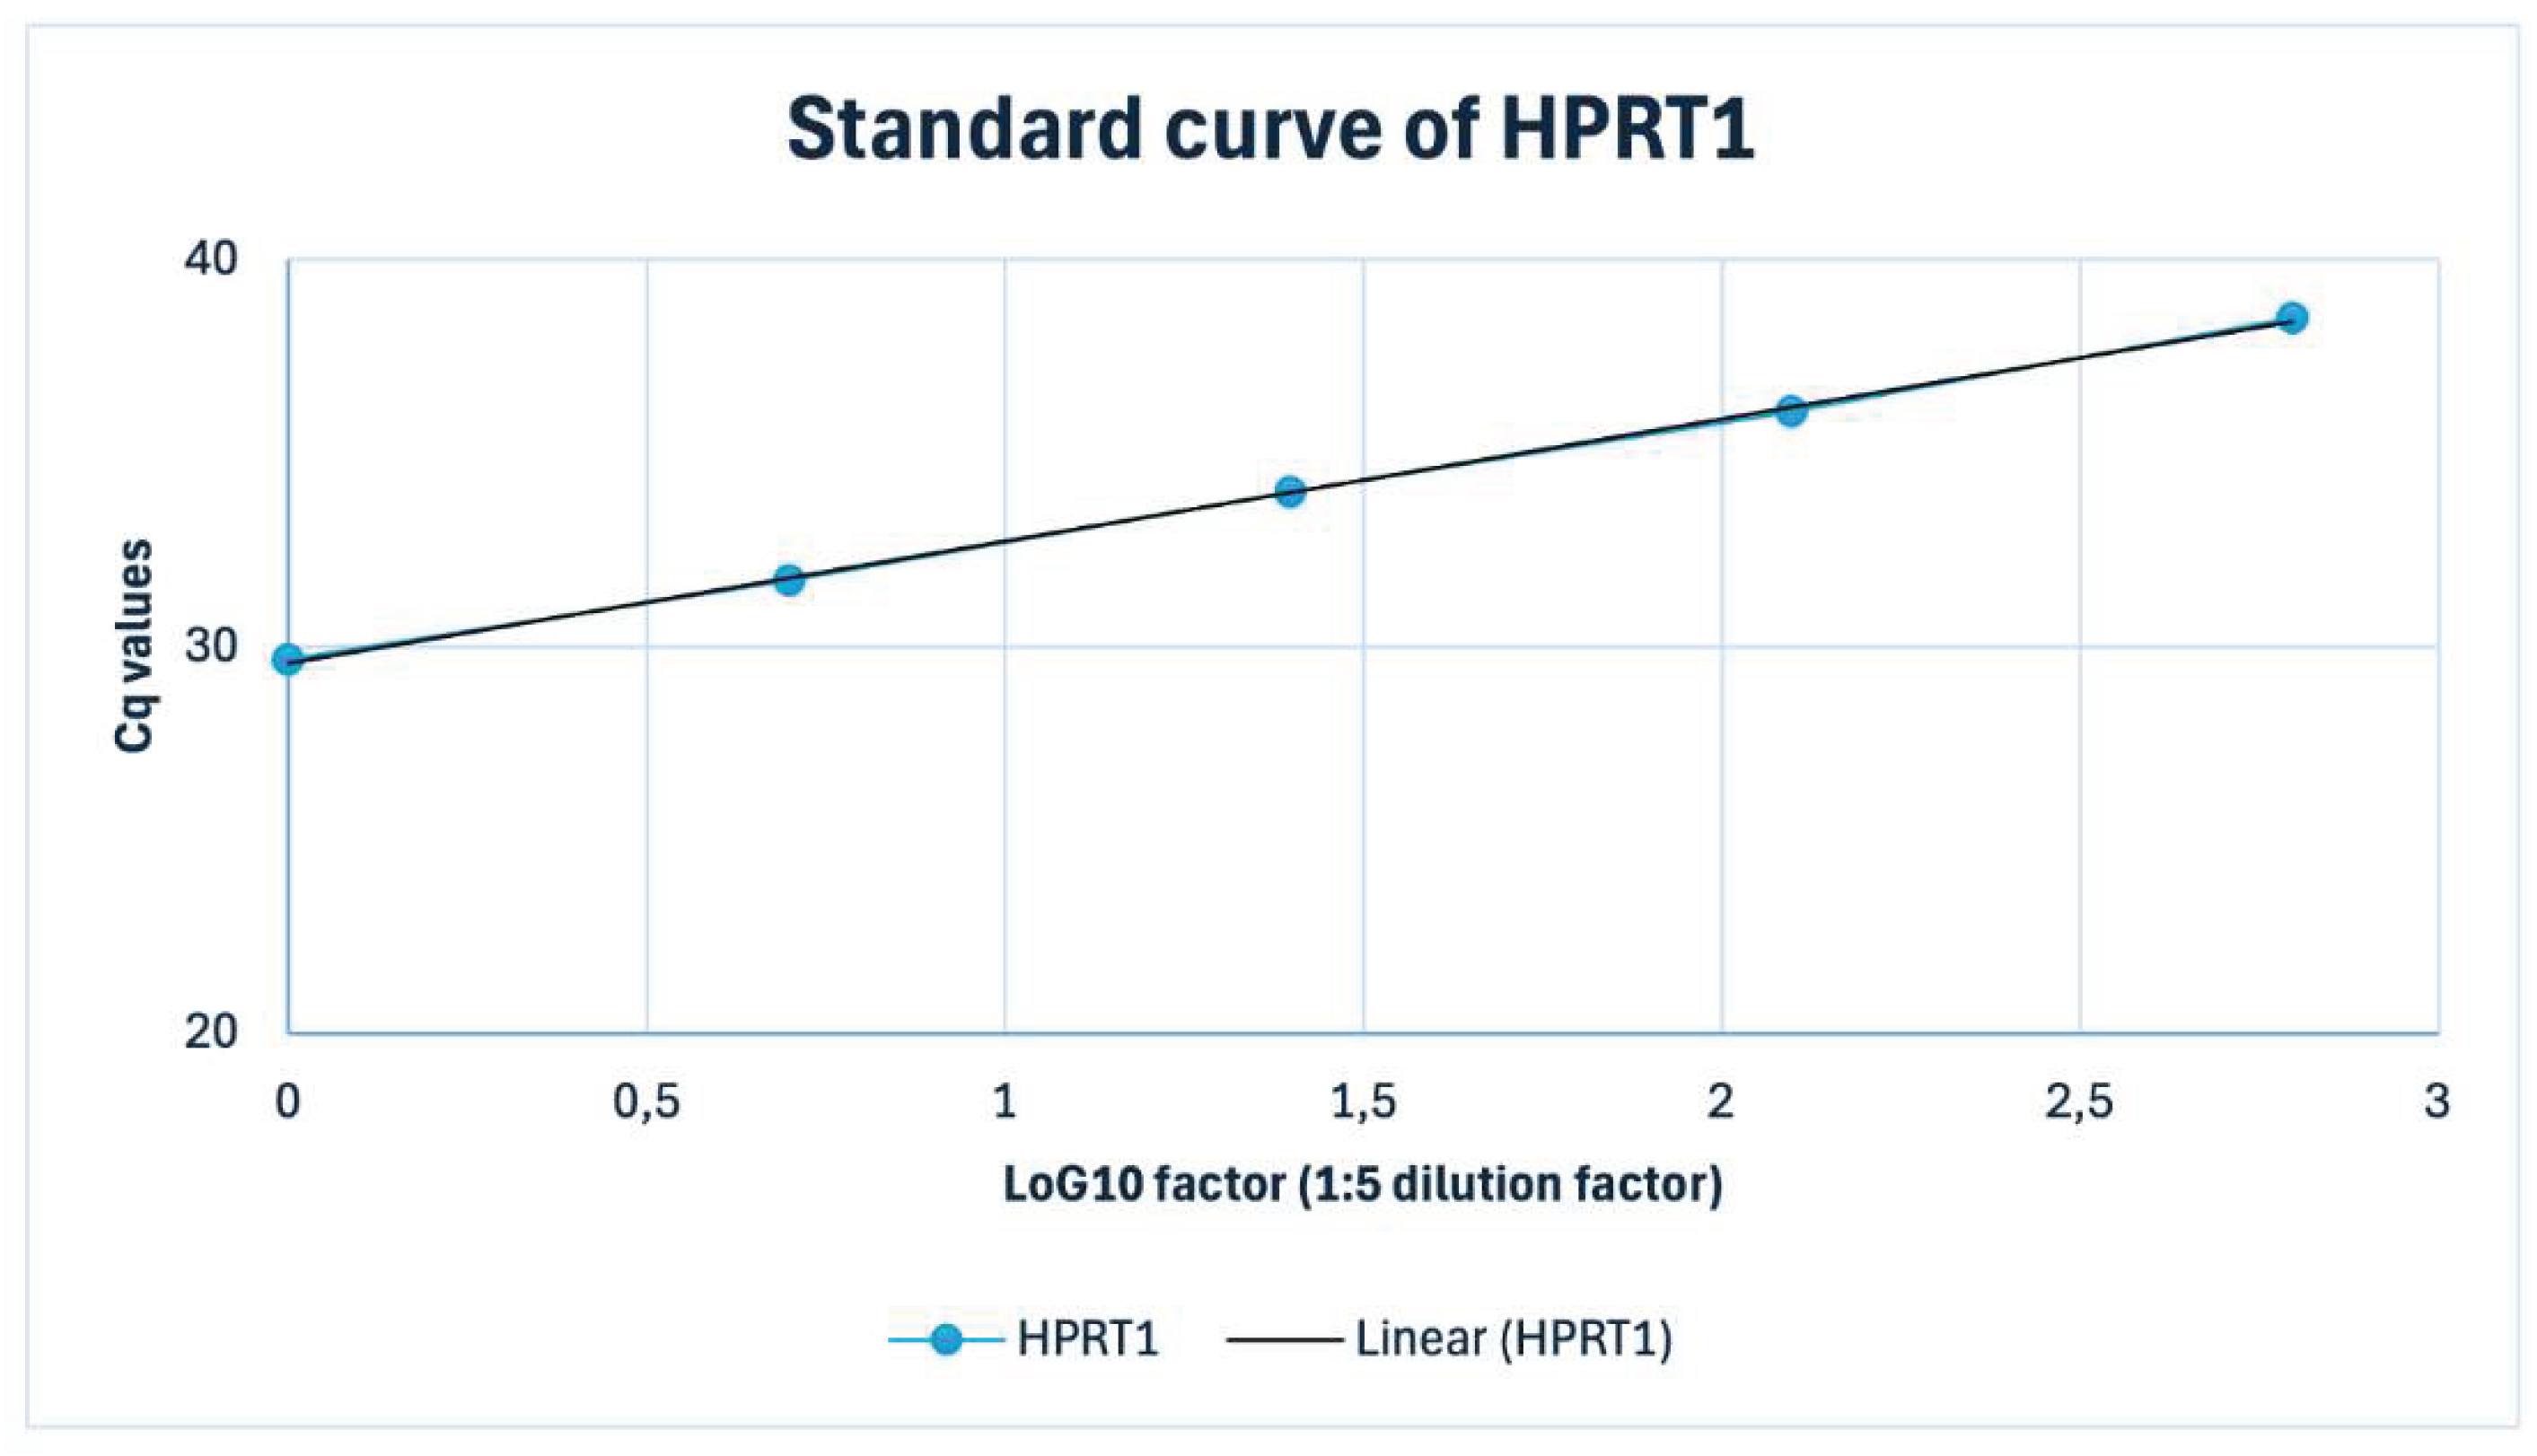
All primer assays showed log-linear amplification within their working range under FFPE conditions, with comparable Cq spans across targets. On this basis, relative expression was calculated using the comparative 2-ΔΔCq approach, assuming approximately similar amplification behavior across assays (E ≈ 2). The performance of the qPCR assays under FFPE conditions is exemplified by a standard curve for the reference gene HPRT1 (RTP) (Figure A.1). A 1:5 serial dilution of FFPE-derived cDNA (50–0.08 ng input) yielded a highly linear relationship between Cq and log10 template amount (R2 = 1.00) with an apparent amplification efficiency of approximately 107% (E = 2.07). Apparent efficiencies derived from FFPE-based dilution series frequently exceeded 100%, which likely reflects matrix- and template-related effects rather than true reaction kinetics; these numerical values were therefore not used for assay-specific efficiency correction, and the comparative Cq (2−ΔΔCq) approach assuming E ≈ 2 was retained for all subsequent analyses [10,11,12,13,14]. Detailed efficiency estimates for all assays are provided in Supplementary Table S7.
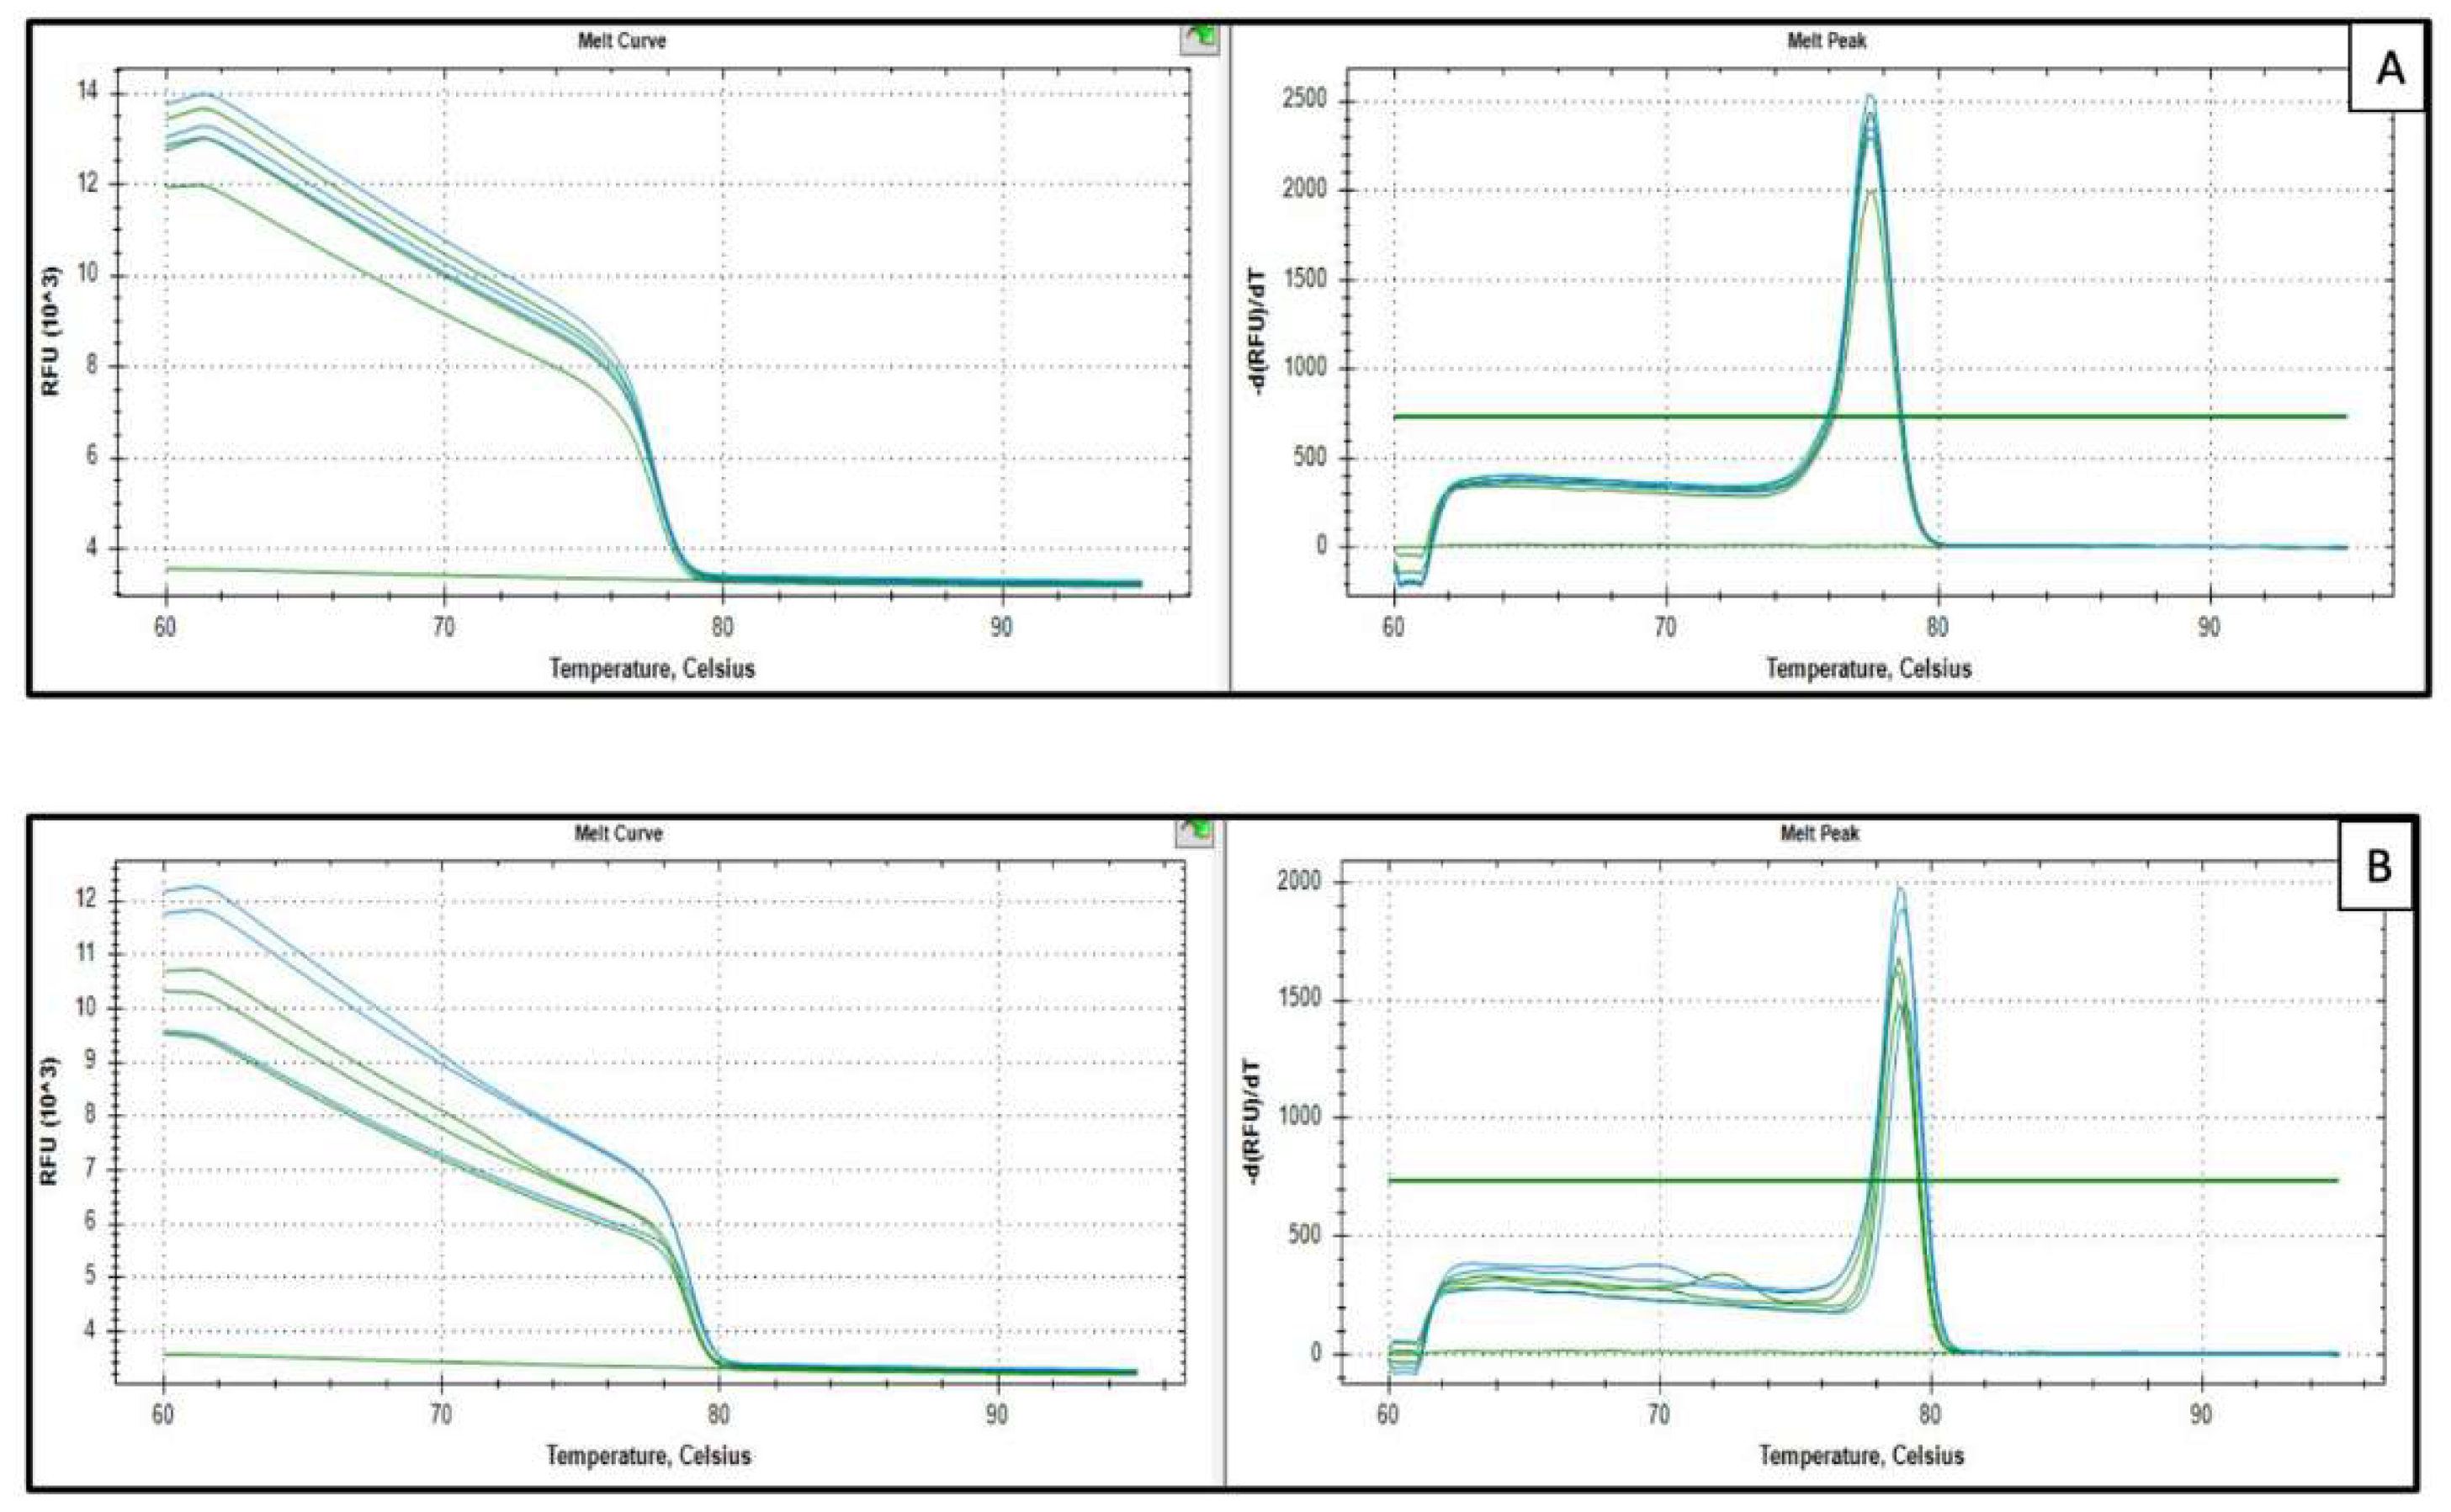
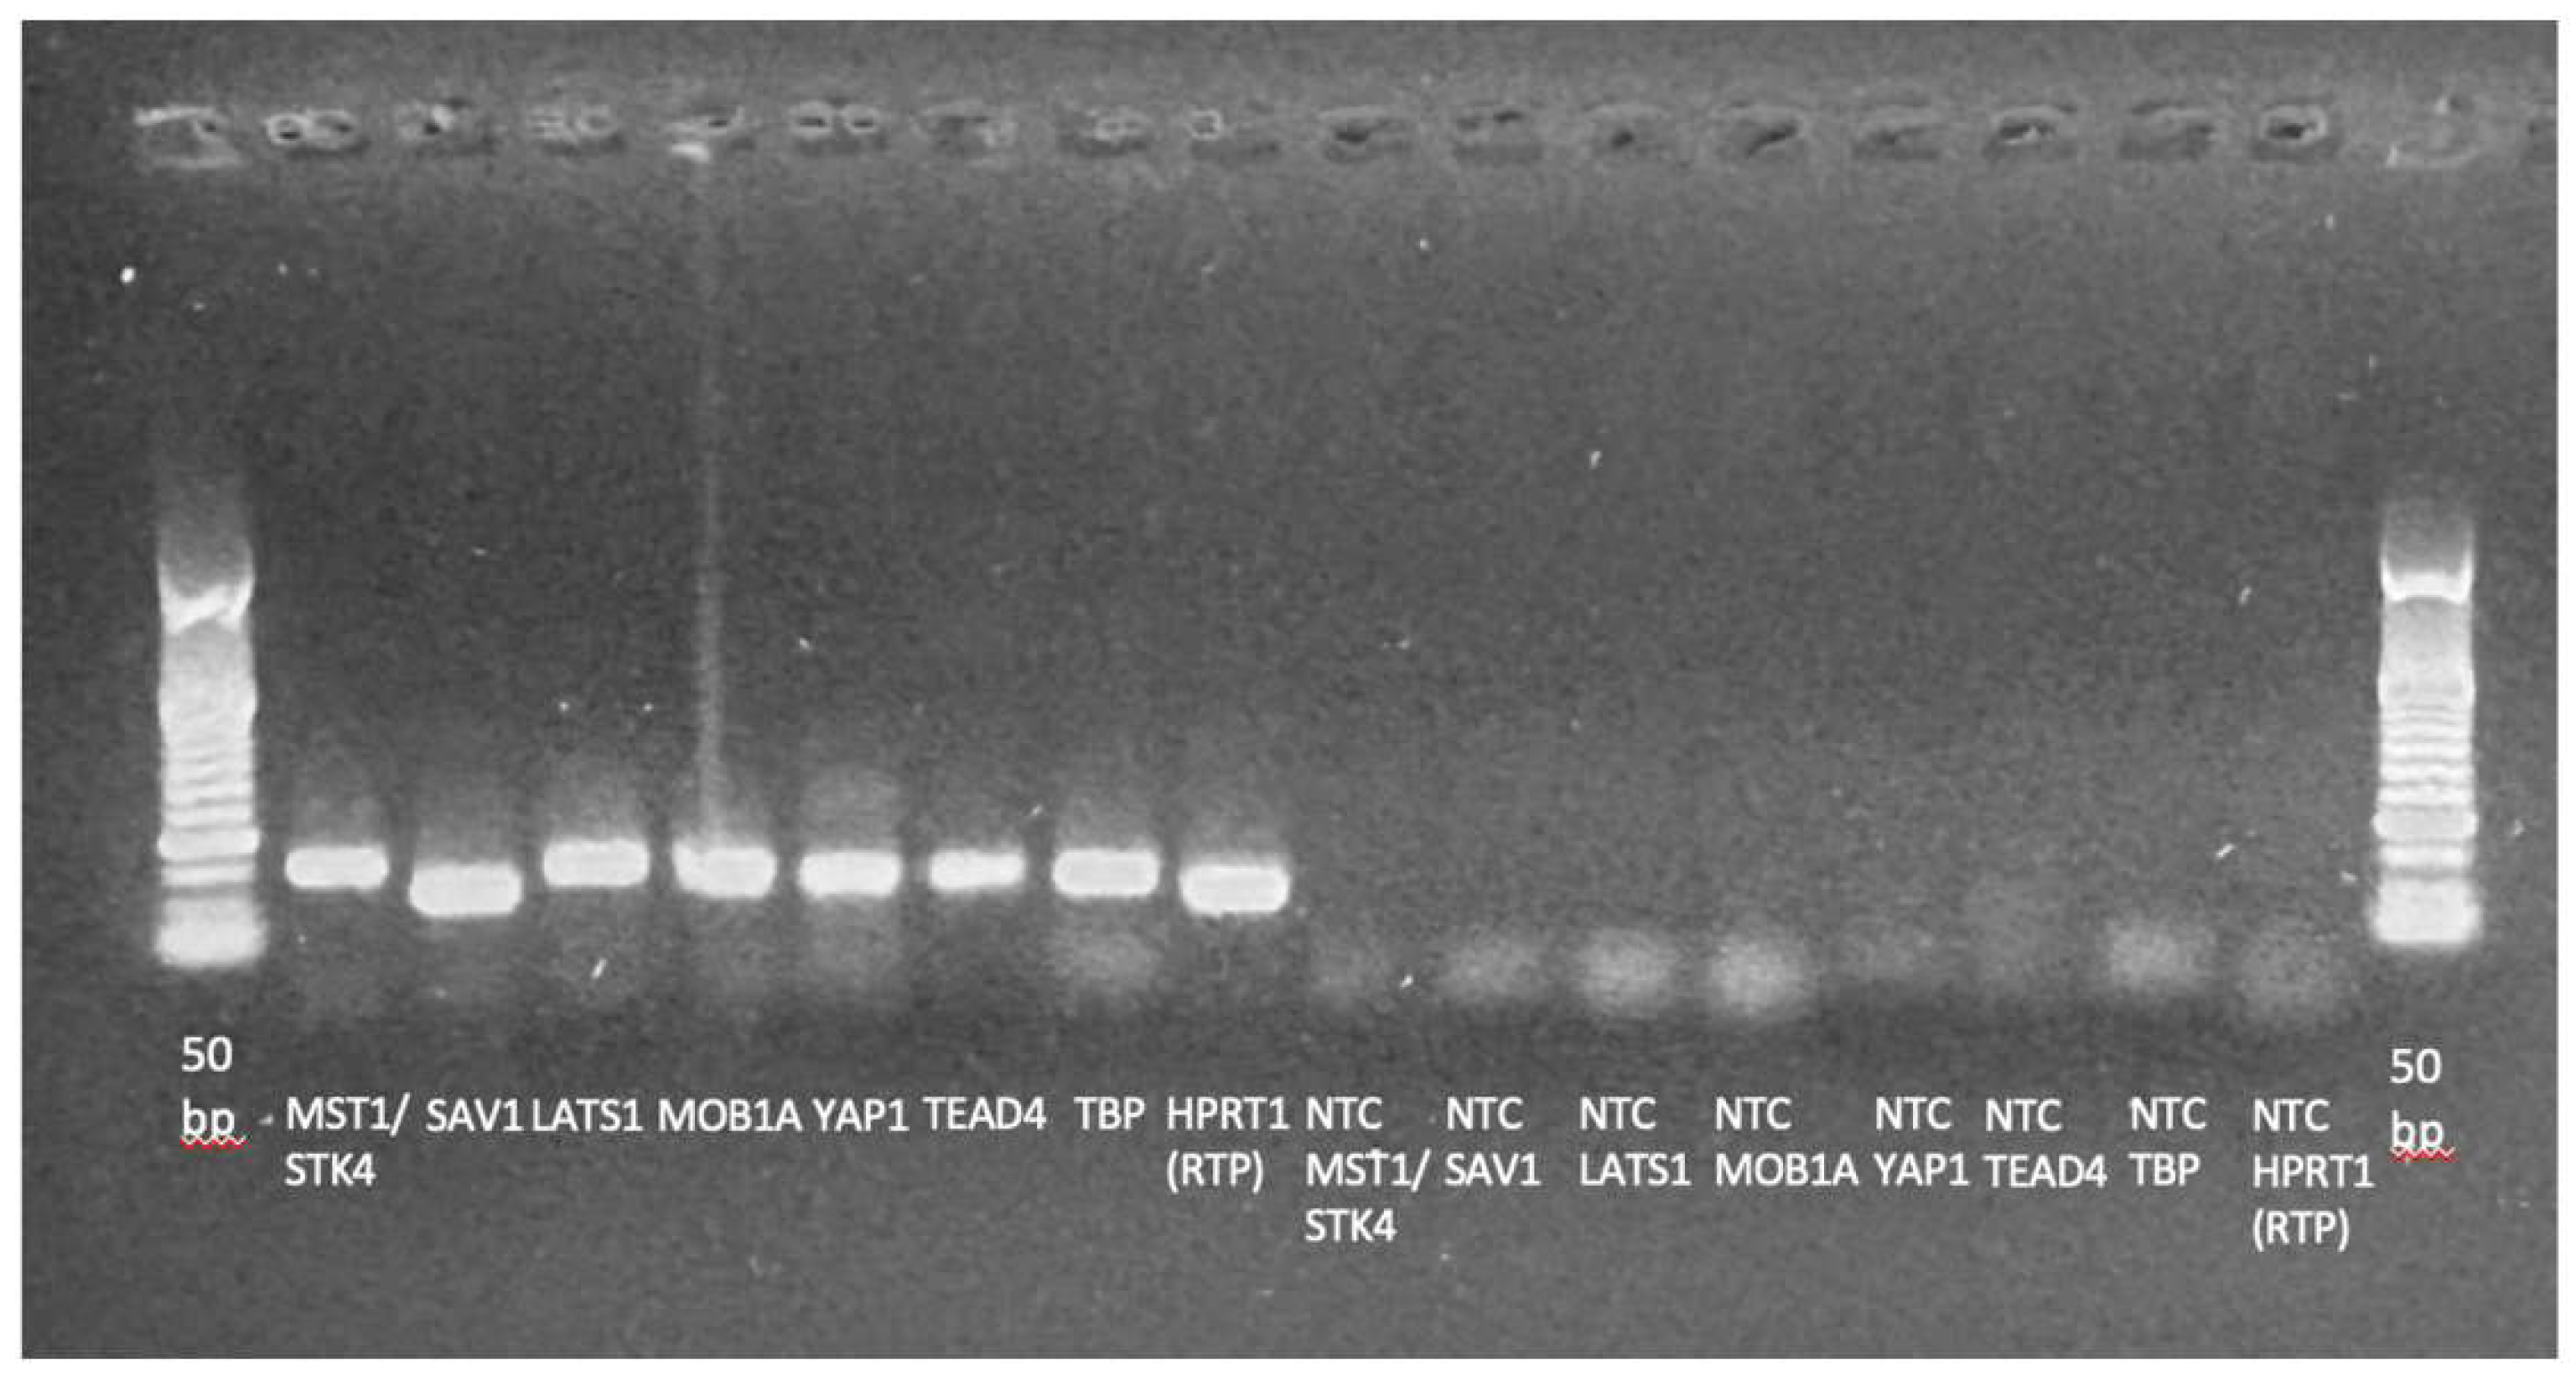
All qPCR assays included in the analysis showed single-peak melting curves and agarose gel electrophoresis demonstrating single bands at the expected amplicon sizes. For TEAD4 and YAP1, a minor primer–dimer peak at ~72 °C was occasionally (TEAD4: 3/17 plates; YAP1: 1/17 plates) observed in NTCs only, at very late Cq values (Cq ≥ 37.5), and was therefore considered negligible for quantification. Representative melting curves for HPRT1 (RTP) and TEAD4 and a gel image for the final assay panel are shown in Appendix Figure A.2 and Figure A.3, respectively, while full melting-curve sets for all included assays and melt curves of excluded assays are provided in Supplementary Figure S1.
In the absence of a pooled inter-run calibrator, potential plate effects were assessed by comparing reference-gene Cq distributions across plates. TBP and HPRT1 (RTP) Cq values were highly correlated (Spearman’s correlation coefficient rho=0.88, p <0,001 for the first block and rho=0.89, p <0.001 for the second block) and showed acceptable inter-run deviations (Kruskal–Wallis, p >0.10 in all cases; Table S3), indicating that both reference genes responded concordantly to biological and technical variability between runs and plates.
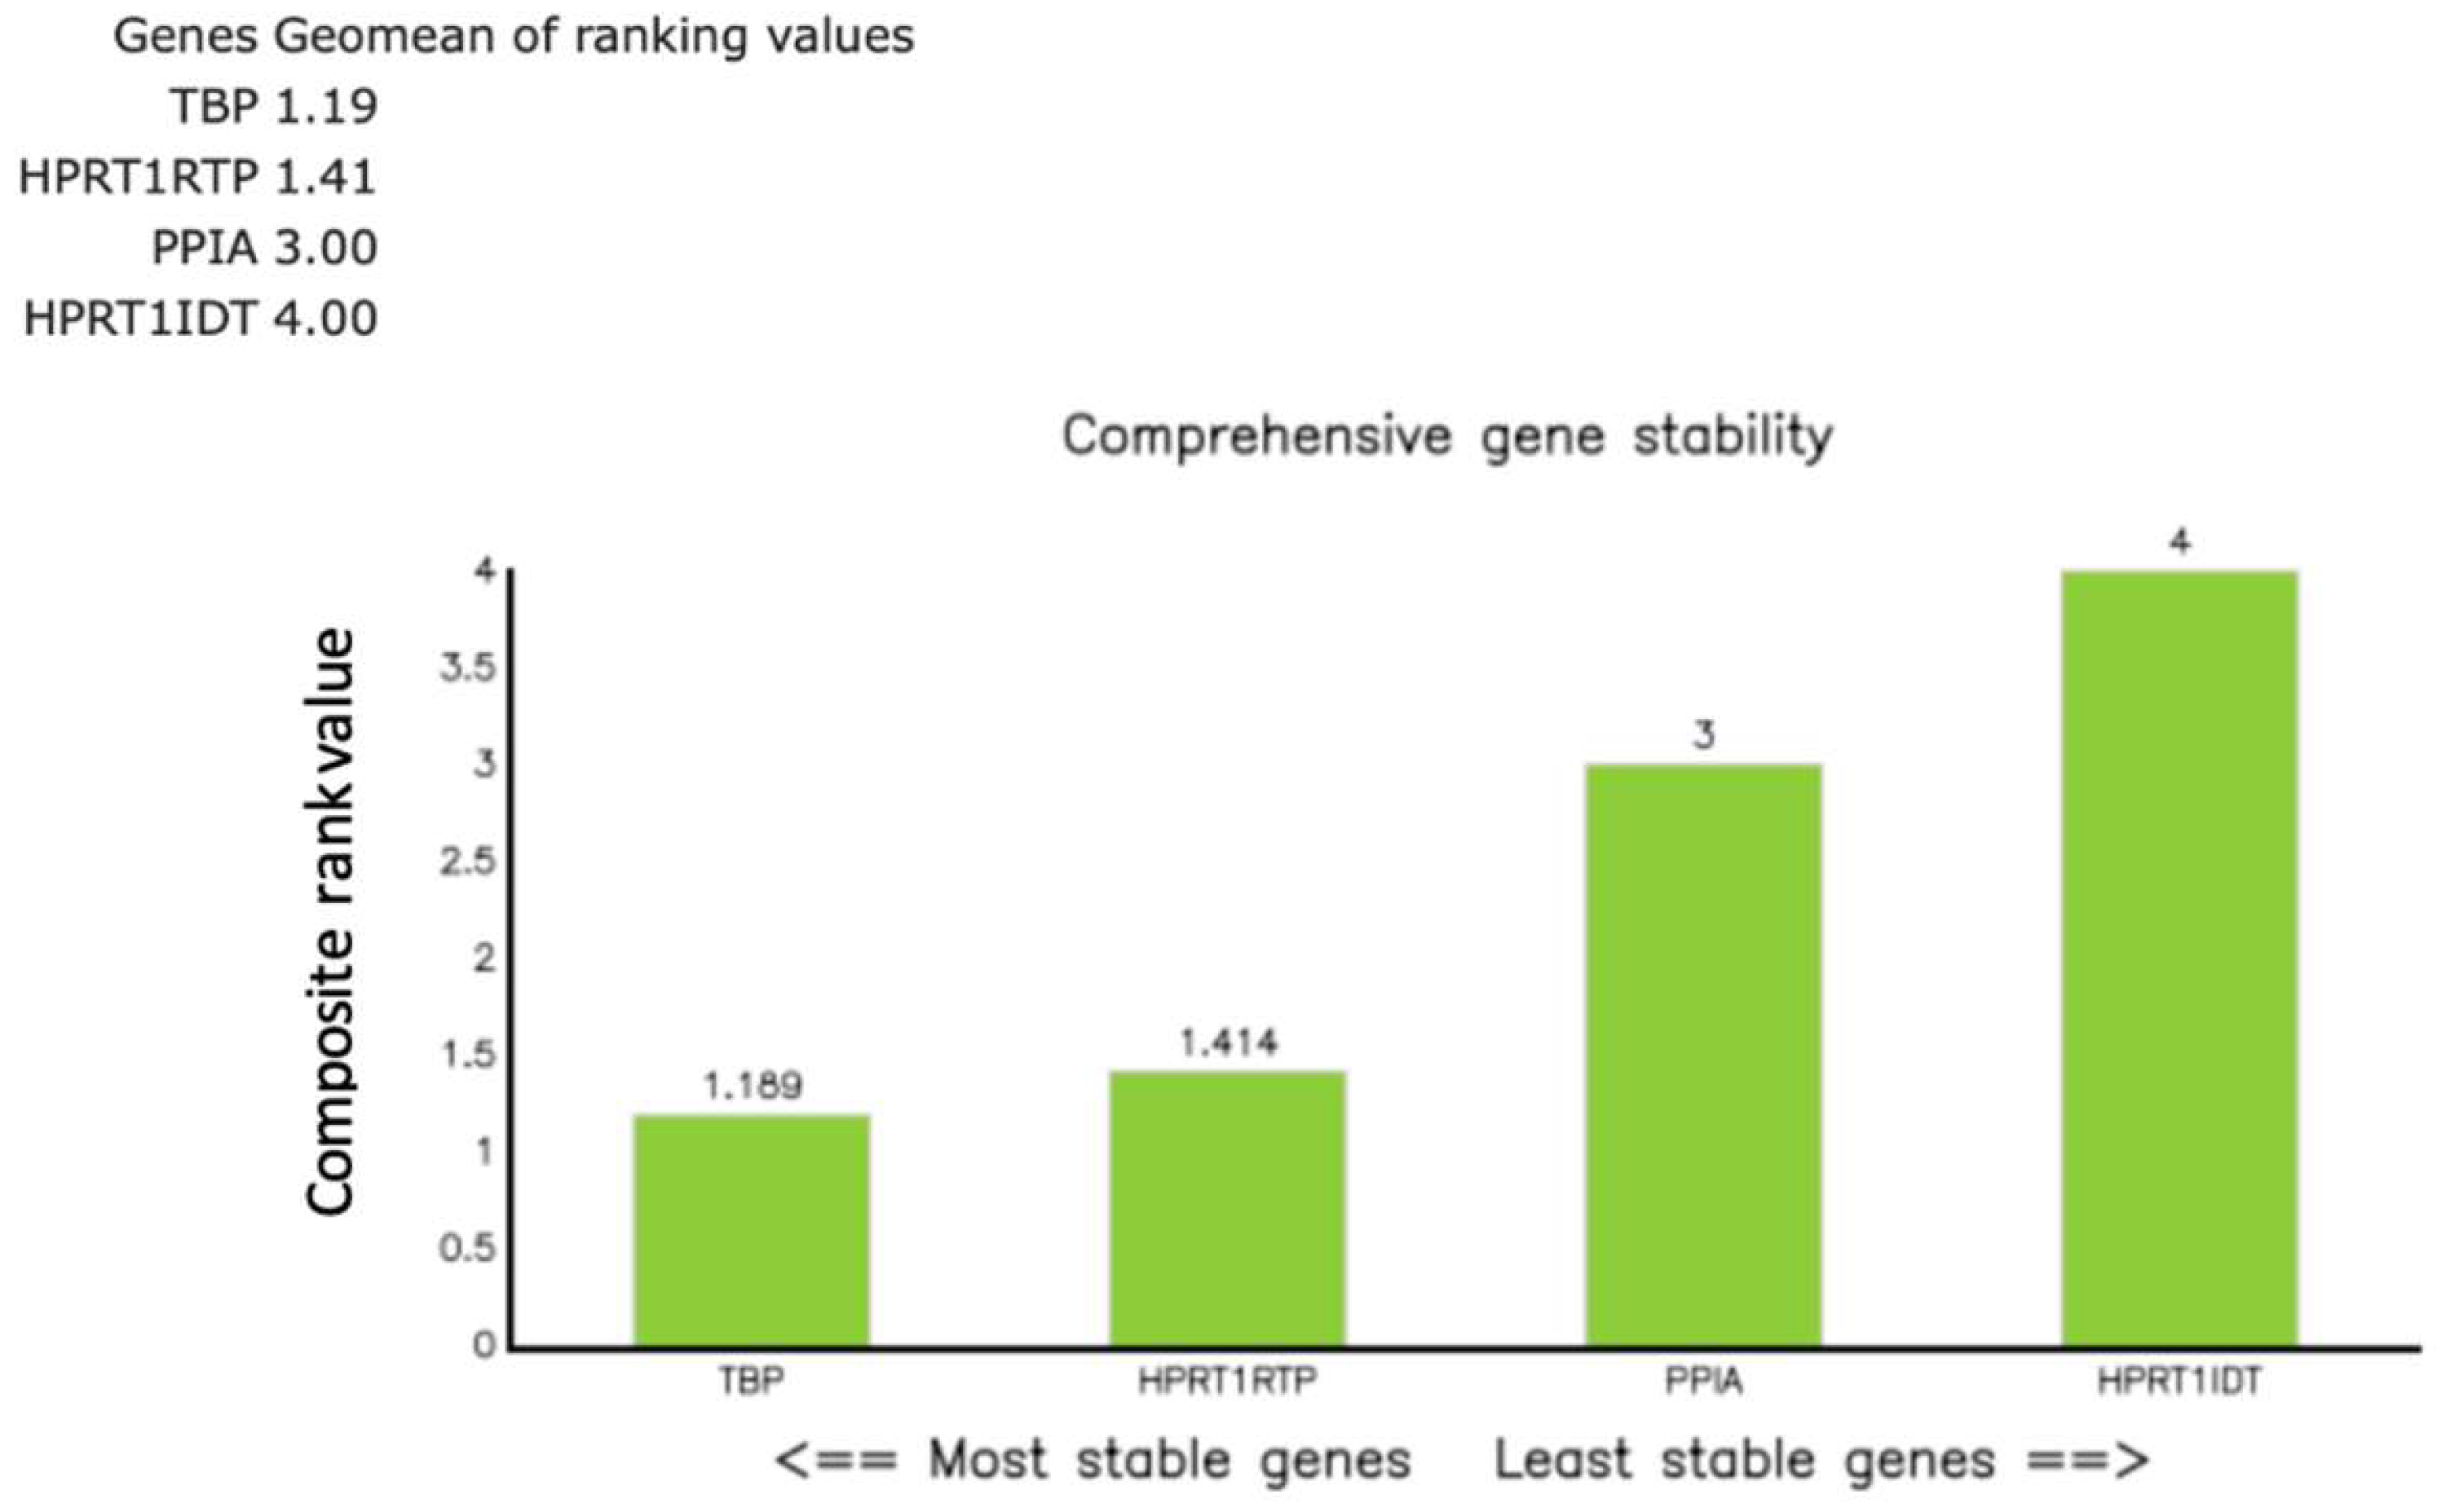
Among the candidate reference genes, RefFinder identified HPRT1 (RTP; composite rank value 1.41) and TBP (composite rank value 1.19) as the most stable genes across all 26 samples. Composite ranks were interpreted using predefined a priori thresholds (≤1.5, good stability; >2-3, suboptimal stability). Their geometric mean was used for normalization, while HPRT1 (IDT™; composite rank value 4.00) ranked lower and PPIA (composite rank value 3.00) was discarded as reference gene due to sporadic gDNA-related amplification (see Section 2.5). The RefFinder ranking and the resulting geometric-mean normalization strategy are summarized in Appendix Figure A.4, and detailed stability scores and rankings for all candidate reference genes are provided in Supplementary Tables S14.
The two histologically normal thymus samples used as reference controls (N1 and N3) exhibited minimal variability in Hippo pathway gene expression, with log2FC values consistently close to zero (approximately −0.5 to +0.5, with most values falling within ~−0.3 to +0.3). This low dispersion confirmed their suitability as a combined calibrator for relative expression analyses. In contrast, the third non-neoplastic sample (N2), which showed benign cystic alterations and reduced epithelial content, displayed a markedly divergent expression profile and was therefore not included as reference.
3.2. Relative Expression of Hippo Pathway Genes
Relative expression levels of six Hippo pathway genes (MST1/STK4, SAV1, LATS1, MOB1A, YAP1 and TEAD4) are presented for descriptive and statistical reporting as log2FC relative to the median of normal thymus samples (N1 and N3) as the calibrator (2-ΔΔCq). A FC of 1.0 (log2FC = 0) corresponds to the expression level in normal thymic tissue, with expression levels normalized to the housekeeping genes HPRT1 (RTP) and TBP. For readability, the corresponding approximate FCs (~x-fold) derived from the log2FC values are shown in parentheses where appropriate. For each gene, median log2FC values were determined for thymic epithelial tumor subtypes (A, B1–B3, and TC) and are reported descriptively, highlighting inter-subtype differences and, where evident, intra-group heterogeneity. Individual sample values are visualized as boxplots to illustrate the distribution within each subtype.
The analyzed targets are presented in downstream order along the Hippo signaling cascade, starting from the upstream kinases (MST1/STK4, SAV1, LATS1 and MOB1A) to the transcriptional coactivator (YAP1) and its nuclear effector (TEAD4).
3.2.1. Relative Expression of MST1 (STK4)
MST1 (STK4) was broadly reduced, most prominently in TC (median log2FC = −1.38, corresponding to ~0.4-fold relative to normal thymus, Mann–Whitney U test, TC vs. all other groups (N, A, B1–B3, TC), p = 0.002) and in B1 (median log2FC = −0.68 (~0.6-fold). Type A displayed notable dispersion (roughly log2FC −1.0 to +1.4 across cases), yielding a slightly negative median overall; B2 and B3 were modestly below normal (Figure 1A). A Kruskal–Wallis test restricted to tumor subtypes confirmed a statistically significant differential expression of MST1 among different World Health Organization (WHO) histological subtypes (p = 0.012). Representative IHC micrographs (Figure 1B–E) depict the observed range of cytoplasmic MST1 staining and show partial overlap with the mRNA distribution in Figure 1A.
3.2.2. Relative Expression of SAV1
SAV1 was clearly elevated in type A thymomas [median log2FC = +2.25 (~5-fold)] and in B3 [log2FC = +2.01 (~4-fold)], with modest increases in B2 and TC (around median log2FC +0.7). B1 centered around baseline with low dispersion (Figure 2A). These differences among different histological TET subtypes were proven to be statistically significant (Kruskal–Wallis, p = 0.004). Representative IHC images (Figure 2B,C) demonstrate the spectrum of cytoplasmic SAV1 protein expression across the cohort and qualitatively corresponding to the mRNA distribution shown in Figure 2A.
3.2.3. Relative Expression of LATS1
LATS1 was strongly reduced in TC (median log2FC = −1.34 (~0.4-fold), Mann–Whitney U test, TC vs. all other groups (N, A, B1–B3, TC), p = 0.008). B1 showed a mild decrease (median log2FC = −0.83 (~0.6-fold) with wide dispersion, whereas types A, B2, and B3 were near baseline on median (Figure 3A). Kruskal–Wallis test confirmed a statistically significant differential expression of LATS1 among different WHO histological subtypes (p = 0.036). Representative IHC panels (Figure 3B– D) highlight inter-case variability in cytoplasmic LATS1 staining and partly reflect the RT-qPCR distribution in Figure 3A.
3.2.4. Relative Expression of MOB1A
MOB1A remained largely stable across TET subtypes (Kruskal–Wallis, p = 0.09). Modest increases were observed in type A (median log2FC = +0.22) and in B3 (median log2FC = +0.33) while slight decreases characterized B1 (median log2FC = −0.13) and TC (median log2FC = −0.14). B2 clustered near baseline with low-to-moderate dispersion (Figure 4A). Representative IHC images (Figure 4B– E) illustrating the range of cytoplasmic MOB1A protein expression observed in the cohort and show variable correspondence with the mRNA distribution in Figure 4A.
3.2.5. Relative Expression of YAP1
YAP1 expression was elevated across all tumor subtypes. The strongest induction occurred in type A thymomas [median log2FC = +3.43 (~11-fold)] and in B3 thymomas [median log2FC = +2.78 (~7-fold)], followed by TC [median log2FC = +1.64 (~3-fold)]. B1 and B2 showed lower medians (median log2FC 0.18 to 0.74) but marked inter-sample variability, ranging from near-baseline to moderately elevated expression (Figure 5A). Kruskal–Wallis confirmed the statistically significant differential expression among TET subtypes (p = 0.003). Representative IHC images (Figure 5B– G) demonstrate the spectrum of cytoplasmic YAP1 protein expression across the cohort, consistent with the mRNA pattern shown in Figure 5A.
3.2.6. Relative Expression of TEAD4
TEAD4 showed pronounced upregulation in TC (median log2FC = +3.49 (~11-fold), Mann–Whitney U test, TC vs. all other groups (N, A, B1–B3, TC), p = 0.004) and clear increases in type A [median log2FC = +1.74 (~3- to 4-fold)] and B3 [median log2FC = +1.55 (~3-fold)]. B1 remained close to baseline yet was dispersed (log2FC about −0.7 to +1.1), and B2 exhibited a widespread with a near-zero median, indicating heterogeneity rather than a uniform shift (roughly log2FC −1.9 to +2.3 across cases, Figure 6A). These differences among different histological TET subtypes were proven to be statistically significant (Kruskal–Wallis, p = 0.015). Representative IHC panels (Figure 6B– E) highlight inter-case variability in TEAD4 staining and show qualitative agreement with the RT-qPCR distribution in Figure 6A.
3.3. Consolidated Overview of the Relative Expression Results of Hippo Pathway Genes
Table 2 summarizes the sample-wise fold changes (FCs) and corresponding log2FC values for the core Hippo pathway components, while Table 3 presents the subtype-specific median log2FC values.
To provide an integrated overview of these expression patterns across TET subtypes, the median log2FC values of all Hippo components were subsequently visualized in a heatmap (Figure 7).
4. Discussion
TETs are rare neoplasms of the anterior mediastinum that display marked histological heterogeneity and a wide range of clinical behavior, making prognostic assessment based on histology alone challenging [1,2,3,20,21]. The Hippo signaling pathway, a central regulator of tissue growth and tumor progression, has emerged as relevant in TETs [2,8,22,23,24,25,26]. However, prior work has focused predominantly on IHC analyses [2,8], while systematic data at the mRNA level remain scarce and the functional implications of observed alterations are largely unclear [27]. In the present study, we systematically investigated the mRNA expression of the key Hippo pathway components YAP1, TEAD4, MST1/STK4, SAV1, LATS1 and MOB1A in TETs using RT-qPCR and related these findings to WHO histological subtype and existing IHC data (Table S15) from the same cohort to better delineate the relationship between transcript and protein levels and to further explore the potential of Hippo-based biomarkers in this rare tumor entity.
Taken together, our RT-qPCR data show a subtype-dependent deregulation of the Hippo pathway in TETs at the mRNA level, with strongly upregulated YAP1 and TEAD4 transcripts in type A and B3 thymomas and in TCs, and clearly reduced MST1/STK4 and LATS1 levels that are most pronounced in carcinomas. In contrast, adaptor proteins display a divergent pattern, with SAV1 increased in type A and B3 thymomas, whereas MOB1A remains largely stable across subtypes. Our observations are in line with the established oncogenic role of YAP/TEAD complexes in other human cancers, where high YAP1 and TEAD4 expression or activity have been linked to increased proliferation, epithelial–mesenchymal transition (EMT), stemness features, immune modulation and poor prognosis in several tumor types, e.g., ovarian cancer, lung adenocarcinoma, urothelial carcinoma [30,31,32,33,34,35,36,37,38]. While TETs are genetically less complex than many other solid cancers [20,28,39], the convergence of our mRNA data with this broader literature supports the biological plausibility that enhanced YAP1–TEAD4 transcriptional output may also play a role in more aggressive behavior in a subset of TETs [32,40,41,42]. The observed downregulation of MST1 and LATS1 is in keeping with their tumor-suppressive role in the canonical Hippo cascade, where reduced expression or activity of these kinases can facilitate unchecked YAP/TAZ–TEAD signaling [43,44,45]. Given that SAV1 acts as a scaffold that promotes MST1/2–LATS1/2 complex formation and activation [22,45,46], such upregulation may reflect a compensatory response to upstream perturbations or context-dependent rewiring of Hippo control, rather than a straightforward loss-of-function scenario [46,47,48]. The combination of these kinase reductions with preserved or elevated SAV1 and MOB1A expression therefore argues for a nuanced, component-specific modulation of the Hippo kinase cassette in TETs, rather than a simple global shutdown of the pathway [26,45,49,50].
This mRNA signature partially mirrors our IHC findings, supports a model of gradually increasing YAP/TEAD activity along the A–B–TC spectrum, and complements previous IHC studies of Hippo signaling in TETs [1,2,3,8,28,29]. Palamaris et al. reported widespread expression of YAP1, TAZ, LATS1 and TEAD4 in thymomas and TCs, with complex nuclear–cytoplasmic localization patterns [8]. In a separate IHC cohort, we similarly observed strong expression of core and upstream Hippo components and linked high cytoplasmic TEAD4 to poorer overall survival [2]. In the present study, higher YAP1 and TEAD4 mRNA levels in type A, B3 and TC cases parallel stronger YAP/active YAP (AYAP) and TEAD4 staining, whereas MST1, SAV1, LATS1 and MOB1A show only modest or heterogeneous transcript changes despite consistently intense cytoplasmic protein expression. These observations indicate that Hippo deregulation in TETs is strongly shaped by post-transcriptional and post-translational control rather than simple on/off shifts in transcript abundance [22,45,51,52,53]. Individual tumors displayed discordant TEAD4 staining patterns, implying that YAP/TAZ-dependent feedback further shapes TEAD4 localization and functional activation in TETs [32,35,51,52,53,54]. Several methodological aspects likely contribute to these transcript–protein discrepancies. qPCR was performed on bulk tumor tissue, whereas IHC scoring was restricted to tumor cells. Differences in the proportion of thymocytes and stromal elements between samples are therefore expected to influence bulk mRNA measurements and may blunt subtype-specific differences. Moreover, IHC is inherently semi-quantitative and, in our cohort, showed clear ceiling effects for several Hippo core components (e.g., MOB1A, SAV1, LATS1). This narrow dynamic range is particularly relevant for protein-stable molecules whose levels are regulated predominantly beyond the transcript level [51,52,53]. Together, these considerations highlight that mRNA and protein data provide complementary views of Hippo pathway deregulation in TETs and that transcript abundance alone does not fully capture functional pathway activity, especially for upstream regulators [22,45,51,52,53,54].
When viewed against the broader molecular landscape of TETs defined by large-scale sequencing efforts, our findings add a pathway-focused perspective rather than uncovering new driver events [27,28,39,55,56]. Integrated genomic analyses, such as the TCGA study by Radovich et al. and the more recent multiomics work by Möhrmann et al., have shown that TETs are characterized by relatively low mutational burdens, frequent General Transcription Factor II-I (GTF2I) mutations in indolent thymomas, and more complex genomic alterations in TCs [28,39]. Within this framework, Hippo dysregulation appears to represent one of several converging signaling alterations rather than a single dominant driver [28,39]. Our findings therefore fit with a model in which Hippo pathway changes modulate, rather than fully determine, the biological behavior of TETs and act in concert with other genomic and microenvironmental factors [48,57,58,59].
The present work provides, to our knowledge, one of the first dedicated transcript-level analyses of core Hippo pathway components in TETs and integrates these data with previously established IHC patterns [2], but has methodological limitations. First, all analyses were performed on FFPE material, including archival blocks of up to almost ten years of age, which is associated with RNA fragmentation and pre-analytical variability [60,61]. Nonetheless, stable reference gene performance and concordant trends across related genes and subtypes argue against random artefacts and support the robustness of the main expression patterns. Second, the number of cases per histological subtype was limited, reducing statistical power and underscoring the exploratory nature of some comparisons. This is partly offset by the embedding of the qPCR series in a larger IHC study from the same cohort with consistent Hippo-related protein expression in TETs [2]. Third, despite careful assay design and run-to-run quality control, residual technical variability cannot be excluded, as is typical for FFPE-based transcript studies. Moreover, thymic tissue and TETs harbor high amounts of gDNA, which could not be completely removed even by repeated DNase treatment. We therefore used exon–exon spanning assays with partially larger amplicon length, which are suboptimal for FFPE but still showed reproducible, linear amplification [10,62]. Within these constraints, the recurrent upregulation of YAP1/TEAD4 and the reduction of MST1/LATS1 in more aggressive subtypes are likely to be robust and biologically meaningful, whereas subtle FCs should be interpreted with caution. Future studies in larger cohorts and, where feasible, using fresh-frozen material and functional assays will be important to validate and extend these findings.
Although this study offers an integrated transcript-level overview of Hippo pathway components in TETs, several questions remain open. A key next step will be to validate these expression patterns in larger, independently collected cohorts with comprehensive clinicopathological and outcome data. In parallel, functional studies in appropriate thymic epithelial model systems will be required to define how Hippo pathway alterations translate into cellular phenotypes and treatment responses [21,22,63]. Integrating RT-qPCR and IHC with higher-dimensional approaches, including whole-transcriptome profiling, genomic and epigenomic analyses, as well as single-cell or spatial methods to capture tumor–immune interactions, may further help to place Hippo dysregulation within the broader molecular context of TETs and to identify co-operating pathways. In particular, proteomic and phosphoproteomic approaches could help map Hippo pathway activity and phosphorylation patterns, thereby capturing post-translation regulation that may not be reflected at the mRNA level. Finally, as pharmacologic inhibitors targeting the YAP/TAZ–TEAD interface are entering early clinical development, our data support further exploration of Hippo-related biomarkers in TETs to guide future biomarker-driven trials [2,64,65,66,67].
5. Conclusions
In conclusion, our study shows that Hippo pathway deregulation in TETs is not uniform but subtype-dependent, with a consistent increase in YAP1–TEAD4 transcriptional output particularly in type A, B3 thymomas and TCs. These changes are accompanied by a progressive reduction of the upstream kinases MST1 and LATS1, most pronounced in TCs, whereas SAV1 and MOB1A display more nuanced, component-specific modulation. Together, these patterns support a model of a gradual shift from relatively preserved kinase control with variable YAP1–TEAD4 activation in indolent thymomas towards a state of reinforced YAP1–TEAD4 signaling on a weakened MST1/LATS1 brake in more aggressive entities. Integration with IHC data underscores that Hippo dysregulation in TETs is shaped by both transcriptional and post-transcriptional mechanisms and that mRNA levels only partially mirror protein localization and activity. Our findings provide a pathway-focused framework for Hippo signaling in TETs and support further evaluation of YAP1/TEAD4- and kinase-based readouts as candidate biomarkers and potential entry points for future Hippo-targeted therapeutic strategies in this rare tumor entity.
Supplementary Materials
The following supporting information can be downloaded at the website of this paper posted on Preprints.org, Table S1: Sample input concentrations and spectrophotometric purity (A260/280 ratios); Table S2: Reagent lot comparison; Table S3: Inter-run variability; Table S4: Cross-instrument comparison; Table S5: Calculation of internal controls (ICs); Table S6: Primer assay oligonucleotide sequences; Figure S1: Melt curves of the primer assays; Table S7: Primer efficiency assessment; Table S8: Replicate-level QC and exclusion criteria of excluded housekeeping gene (HKG) samples excluded in analysis; Table S9: Housekeeping gene (HKG) Cq datasets used for RefFinder stability analysis; Table S10: Calculation sheets for relative gene expression block 1; Table S11: Calculation sheets for relative gene expression block 2; Table S12: Raw Cq data matrices; Table S13: Replicate-level quality control (QC) metrics and exclusion criteria of samples included in analysis; Table S14: Details of the HKG stability statistics from RefFinder; Table S15: Relative gene expression in relation to IHC results on a per-sample basis.
Author Contributions
Conceptualization, L.E., N.G. and G.L.; methodology, L.E. and N.G.; software, L.E. and G.L.; validation, L.E., N.G. and G.L..; formal analysis, L.E. and N.G.; investigation, L.E.; resources, J.N.; data curation, L.E. and G.L.; writing—original draft preparation, L.E.; writing—review and editing, G.L. and N.G.; visualization, L.E. and G.L.; supervision, G.L. and N.G.; project administration, G.L., N.G. and J.N.; funding acquisition, J.N. All authors have read and agreed to the published version of the manuscript.
Funding
This research received no external funding.
Institutional Review Board Statement
The study was conducted in accordance with the Declaration of Helsinki and approved by the Institutional Review Board of the Paracelsus Medical University (PMU) (IRB-2024-07; 2024-04-05).
Informed Consent Statement
Due to the retrospective nature of the studies and the absence of impact on patients’ treatment, informed consent was not necessary.
Data Availability Statement
The data in this work can be obtained upon request from the corresponding author.
Conflicts of Interest
The authors declare no conflicts of interest.
Abbreviations
The following abbreviations are used in this manuscript:
| PMU TET(s) |
Paracelsus Medical University Thymic Epithelial Tumor(s) |
| FFPE (RT)-qPCR |
Formalin-fixed, paraffin-embedded (Real-time) quantitative polymerase chain reaction |
| WHO FC(s) TC YAP1 TAZ WWTR1 TEAD1-4 IHC |
World Health Organization Fold change(s) Thymic Carcinoma Yes-associated protein 1 Transcriptional co-activator with PDZ-binding motif WW domain-containing transcription regulator 1 TEA domain transcription factor 1-4 Immunohistochemistry/immunohistochemical |
| MST1/2 SAV1 |
Mammalian STE20-like kinases 1/2 Salvador homolog 1 |
| LATS1/2 | Large tumor suppressor kinases 1/2 |
| MOB1(A) mRNA IRB gDNA IC RT TBP HPRT1 RTP Cq Log2FC N NTC NRT QC PPIA IDTTM cDNA MIQE HKG EMT AYAP TCGA GTF2I |
Mps one binder 1(A) Messenger RNA Institutional review board Genomic DNA Internal control Reverse transcription TATA-box binding protein Hypoxanthine-guanine phosphoribosyltransferase 1 RealTimePrimers.com Quantification Cycle Log2-transformed fold changes Normal (thymus) sample No-template controls No-reverse transcription control Quality control Peptidyl-prolyl isomerase A Integrated DNA Technologies Complementary DNA Minimum Information for Publication of Quantitative Real-Time PCR Experiments Housekeeping gene Epithelial–mesenchymal transition Active YAP1 The Cancer Genome Atlas Program General Transcription Factor II-I |
Appendix A
Appendix A.1
Figure A1.
Standard Curve of the HPRT1 (RTP) qPCR assay in a representative FFPE thymic sample (TET B3). A 1:5 serial dilution of FFPE cDNA (50–0.08 ng input) yielded a highly linear relationship between Cq and log10 template amount (R2 = 1.0) with an amplification efficiency of approximately 107%.
Figure A1.
Standard Curve of the HPRT1 (RTP) qPCR assay in a representative FFPE thymic sample (TET B3). A 1:5 serial dilution of FFPE cDNA (50–0.08 ng input) yielded a highly linear relationship between Cq and log10 template amount (R2 = 1.0) with an amplification efficiency of approximately 107%.
Appendix A.2
Figure A2.
Representative melt curve analysis examples with their no-template control (NTC). A. HPRT1 (RTP, Sample 20); B. TEAD4 (Sample 1 and 2). Melt curve analysis (65–95 °C; 0.2 °C increments for 5 s) on a CFX96™ Real-Time PCR Detection System (Bio-Rad, Hercules, CA, USA) verified single-product amplification. Cq values were calculated with CFX Manager™ Dx version 3.1 (Bio-Rad, Hercules, CA, USA) using a constant baseline and threshold across plates.
Appendix A.3
Figure A3.
Agarose gel electrophoresis of the included assays with their NTCs. The image was acquired using an EZEE ClearView UV transilluminator (Cleaver Scientific). Electrophoresis was performed on a 1.5% agarose gel at 120 V for 20 minutes.
Figure A3.
Agarose gel electrophoresis of the included assays with their NTCs. The image was acquired using an EZEE ClearView UV transilluminator (Cleaver Scientific). Electrophoresis was performed on a 1.5% agarose gel at 120 V for 20 minutes.
Appendix A.4
Figure A4.
RefFinder composite stability ranking of the candidate reference genes TBP, HPRT1 (RTP), PPIA and HPRT1 (IDT™) in 26 thymic samples. The green bars represent the RefFinder composite rank values, calculated as the geometric mean of the stability ranks obtained from geNorm, NormFinder, BestKeeper and the comparative ΔCq method; lower values indicate more stable expression. TBP (1.19) and HPRT1 (RTP; 1.41) showed the highest stability (composite value ≤1.5), whereas PPIA (3.00) and HPRT1 (IDT™; 4.00) were less stable. Consequently, the geometric mean of TBP and HPRT1 (RTP) was used for normalization in subsequent analyses [18].
References
- Imbimbo, M.; Salfi, G.; Borgeaud, M.; Ottaviano, M.; Froesch, P.; Bouchaab, H.; Cafarotti, S.; Addeo, A. Thymic epithelial tumors: what’s new and what’s next? ESMO Rare Cancers 2025, 4, 100024. [Google Scholar] [CrossRef]
- Elm, L.; Gerlitz, N.; Hochholzer, A.; Papadopoulos, T.; Levidou, G. Hippo Pathway Dysregulation in Thymic Epithelial Tumors (TETs): Associations with Clinicopathological Features and Patients’ Prognosis. International Journal of Molecular Sciences 2025, 26, 5938. [Google Scholar] [CrossRef] [PubMed]
- von der Thüsen, J. Thymic epithelial tumours: histopathological classification and differential diagnosis. Histopathology 2024, 84, 196–215. [Google Scholar] [CrossRef] [PubMed]
- Barron, D. A.; Kagey, J. D. The role of the Hippo pathway in human disease and tumorigenesis. Clin Transl Med 2014, 3, 25. [Google Scholar] [CrossRef]
- Lo Sardo, F.; Strano, S.; Blandino, G. YAP and TAZ in Lung Cancer: Oncogenic Role and Clinical Targeting. Cancers 2018, 10, 137. [Google Scholar] [CrossRef]
- Pham, T. H.; Pahuja, K. B.; Hagenbeek, T. J.; Zbieg, J.; Noland, C. L.; Pham, V. C.; Yao, X.; Rose, C. M.; Browder, K. C.; Lee, H.-J.; et al. Targeting the Hippo pathway in cancers via ubiquitination dependent TEAD degradation; eLife Sciences Publications, Ltd., 2024. [Google Scholar] [CrossRef]
- Sanchez-Vega, F.; Mina, M.; Armenia, J.; Chatila, W. K.; Luna, A.; La, K. C.; Dimitriadoy, S.; Liu, D. L.; Kantheti, H. S.; Saghafinia, S.; et al. Oncogenic Signaling Pathways in The Cancer Genome Atlas. Cell 2018, 173, 321–337.e310. [Google Scholar] [CrossRef]
- Palamaris, K.; Levidou, G.; Kordali, K.; Masaoutis, C.; Rontogianni, D.; Theocharis, S. Searching for Novel Biomarkers in Thymic Epithelial Tumors: Immunohistochemical Evaluation of Hippo Pathway Components in a Cohort of Thymic Epithelial Tumors. Biomedicines 2023, 11, 1876. [Google Scholar] [CrossRef]
- QIAGEN. QuantiNova SYBR Green RT-PCR Handbook; 2024. [Google Scholar]
- Bustin, S. A.; Benes, V.; Garson, J. A.; Hellemans, J.; Huggett, J.; Kubista, M.; Mueller, R.; Nolan, T.; Pfaffl, M. W.; Shipley, G. L.; et al. The MIQE Guidelines: Minimum Information for Publication of Quantitative Real-Time PCR Experiments. Clinical Chemistry 2009, 55, 611–622. [Google Scholar] [CrossRef]
- Dietrich, D.; Uhl, B.; Sailer, V.; Holmes, E. E.; Jung, M.; Meller, S.; Kristiansen, G. Improved PCR Performance Using Template DNA from Formalin-Fixed and Paraffin-Embedded Tissues by Overcoming PCR Inhibition. PLOS ONE 2013, 8, e77771. [Google Scholar] [CrossRef]
- Ruijter, J. M.; Pfaffl, M. W.; Zhao, S.; Spiess, A. N.; Boggy, G.; Blom, J.; Rutledge, R. G.; Sisti, D.; Lievens, A.; De Preter, K.; et al. Evaluation of qPCR curve analysis methods for reliable biomarker discovery: bias, resolution, precision, and implications. Methods 2013, 59, 32–46. [Google Scholar] [CrossRef]
- Suslov, O.; Steindler, D. A. PCR inhibition by reverse transcriptase leads to an overestimation of amplification efficiency. Nucleic Acids Res 2005, 33, e181. [Google Scholar] [CrossRef] [PubMed]
- Svec, D.; Tichopad, A.; Novosadova, V.; Pfaffl, M. W.; Kubista, M. How good is a PCR efficiency estimate: Recommendations for precise and robust qPCR efficiency assessments. Biomol Detect Quantif 2015, 3, 9–16. [Google Scholar] [CrossRef] [PubMed]
- Borowska, D.; Rothwell, L.; Bailey, R. A.; Watson, K.; Kaiser, P. Identification of stable reference genes for quantitative PCR in cells derived from chicken lymphoid organs. Veterinary Immunology and Immunopathology 2016, 170, 20–24. [Google Scholar] [CrossRef]
- Rácz, G. A.; Nagy, N.; Gál, Z.; Pintér, T.; Hiripi, L.; Vértessy, B. G. Evaluation of critical design parameters for RT-qPCR-based analysis of multiple dUTPase isoform genes in mice. FEBS Open Bio 2019, 9, 1153–1170. [Google Scholar] [CrossRef]
- Medrano, G.; Guan, P.; Barlow-Anacker, A. J.; Gosain, A. Comprehensive selection of reference genes for quantitative RT-PCR analysis of murine extramedullary hematopoiesis during development. PLOS ONE 2017, 12, e0181881. [Google Scholar] [CrossRef] [PubMed]
- Xie, F.; Xiao, P.; Chen, D.; Xu, L.; Zhang, B. miRDeepFinder: a miRNA analysis tool for deep sequencing of plant small RNAs. Plant Mol Biol 2012. [Google Scholar] [CrossRef]
- Bustin, S. A.; Ruijter, J. M.; van den Hoff, M. J. B.; Kubista, M.; Pfaffl, M. W.; Shipley, G. L.; Tran, N.; Rödiger, S.; Untergasser, A.; Mueller, R.; et al. MIQE 2.0: Revision of the Minimum Information for Publication of Quantitative Real-Time PCR Experiments Guidelines. Clinical Chemistry 2025, 71, 634–651. [Google Scholar] [CrossRef]
- Kuhn, E.; Pescia, C.; Mendogni, P.; Nosotti, M.; Ferrero, S. Thymic Epithelial Tumors: An Evolving Field. Life 2023, Vol. 13, 314. [Google Scholar] [CrossRef]
- Müller, D.; Loskutov, J.; Küffer, S.; Marx, A.; Regenbrecht, C. R. A.; Ströbel, P.; Regenbrecht, M. J. Cell Culture Models for Translational Research on Thymomas and Thymic Carcinomas: Current Status and Future Perspectives. Cancers 2024, Vol. 16, 2762. [Google Scholar] [CrossRef]
- Fu, M.; Hu, Y.; Lan, T.; Guan, K.-L.; Luo, T.; Luo, M. The Hippo signalling pathway and its implications in human health and diseases. Signal Transduction and Targeted Therapy 2022, 7, 376. [Google Scholar] [CrossRef]
- Wang, Y.; Xu, X.; Maglic, D.; Dill, M. T.; Mojumdar, K.; Ng, P. K.-S.; Jeong, K. J.; Tsang, Y. H.; Moreno, D.; Bhavana, V. H.; et al. Comprehensive Molecular Characterization of the Hippo Signaling Pathway in Cancer. Cell Reports 2018, 25, 1304–1317.e1305. [Google Scholar] [CrossRef]
- Yu, F. X.; Zhao, B.; Guan, K. L. Hippo Pathway in Organ Size Control, Tissue Homeostasis, and Cancer. Cell 2015, 163, 811–828. [Google Scholar] [CrossRef] [PubMed]
- Zhao, B.; Li, L.; Lei, Q.; Guan, K. L. The Hippo-YAP pathway in organ size control and tumorigenesis: an updated version. Genes Dev 2010, 24, 862–874. [Google Scholar] [CrossRef] [PubMed]
- Zhong, Z.; Jiao, Z.; Yu, F.-X. The Hippo signaling pathway in development and regeneration. Cell Reports 2024, 43, 113926. [Google Scholar] [CrossRef] [PubMed]
- Elm, L.; Levidou, G. The Molecular Landscape of Thymic Epithelial Tumors: A Comprehensive Review. Int J Mol Sci 2024, 25. [Google Scholar] [CrossRef]
- Radovich, M.; Pickering, C. R.; Felau, I.; Ha, G.; Zhang, H.; Jo, H.; Hoadley, K. A.; Anur, P.; Zhang, J.; McLellan, M.; et al. The Integrated Genomic Landscape of Thymic Epithelial Tumors. Cancer Cell 2018, 33, 244–258.e210. [Google Scholar] [CrossRef]
- Schmauch, B.; Cabeli, V.; Domingues, O. D.; Le Douget, J. E.; Hardy, A.; Belbahri, R.; Maussion, C.; Romagnoni, A.; Eckstein, M.; Fuchs, F.; et al. Deep learning uncovers histological patterns of YAP1/TEAD activity related to disease aggressiveness in cancer patients. iScience 2025, 28, 111638. [Google Scholar] [CrossRef]
- Chen, M.; Huang, B.; Zhu, L.; Chen, K.; Liu, M.; Zhong, C. Structural and Functional Overview of TEAD4 in Cancer Biology. Onco Targets Ther 2020, 13, 9865–9874. [Google Scholar] [CrossRef]
- Gong, X.; Li, N.; Sun, C.; Li, Z.; Xie, H. A Four-Gene Prognostic Signature Based on the TEAD4 Differential Expression Predicts Overall Survival and Immune Microenvironment Estimation in Lung Adenocarcinoma. Front Pharmacol 2022, 13, 874780. [Google Scholar] [CrossRef]
- Hsu, S.-C.; Lin, C.-Y.; Lin, Y.-Y.; Collins, C. C.; Chen, C.-L.; Kung, H.-J. TEAD4 as an Oncogene and a Mitochondrial Modulator. Frontiers in Cell and Developmental Biology;Review 2022, 10–2022. [Google Scholar] [CrossRef]
- Liu, J.-Y.; Li, Y.-H.; Lin, H.-X.; Liao, Y.-J.; Mai, S.-J.; Liu, Z.-W.; Zhang, Z.-L.; Jiang, L.-J.; Zhang, J.-X.; Kung, H.-F.; et al. Overexpression of YAP 1 contributes to progressive features and poor prognosis of human urothelial carcinoma of the bladder. BMC Cancer 2013, 13, 349. [Google Scholar] [CrossRef]
- Liu, M.; Song, Y.; Kang, Y.; Xue, N.; Zhao, J.; Jin, Y.; Liu, C.; Wang, B. Integrative analysis identifies TEAD4 as a universal prognostic biomarker in human cancers. In Frontiers in Immunology; Original Research, 2025; pp. 16–2025. [Google Scholar] [CrossRef]
- Park, J. H.; Shin, J. E.; Park, H. W. The Role of Hippo Pathway in Cancer Stem Cell Biology. Molecules and Cells 2018, 41, 83–92. [Google Scholar] [CrossRef]
- Sun, Z.; Xu, R.; Li, X.; Ren, W.; Ou, C.; Wang, Q.; Zhang, H.; Zhang, X.; Ma, J.; Wang, H.; et al. Prognostic Value of Yes-Associated Protein 1 (YAP1) in Various Cancers: A Meta-Analysis. PLOS ONE 2015, 10, e0135119. [Google Scholar] [CrossRef] [PubMed]
- Xia, Y.; Chang, T.; Wang, Y.; Liu, Y.; Li, W.; Li, M.; Fan, H.-Y. YAP Promotes Ovarian Cancer Cell Tumorigenesis and Is Indicative of a Poor Prognosis for Ovarian Cancer Patients. PLOS ONE 2014, 9, e91770. [Google Scholar] [CrossRef]
- Zhang, W.; Li, J.; Wu, Y.; Ge, H.; Song, Y.; Wang, D.; Yuan, H.; Jiang, H.; Wang, Y.; Cheng, J. TEAD4 overexpression promotes epithelial-mesenchymal transition and associates with aggressiveness and adverse prognosis in head neck squamous cell carcinoma. Cancer Cell International 2018, 18, 178. [Google Scholar] [CrossRef] [PubMed]
- Möhrmann, L.; Rostock, L.; Werner, M.; Oleś, M.; Arnold, J. S.; Paramasivam, N.; Jöhrens, K.; Rupp, L.; Schmitz, M.; Richter, D.; et al. Genomic landscape and molecularly informed therapy in thymic carcinoma and other advanced thymic epithelial tumors. Med 2025, 6, 100612. [Google Scholar] [CrossRef] [PubMed]
- Hu, X.; Zhang, Y.; Yu, H.; Zhao, Y.; Sun, X.; Li, Q.; Wang, Y. The role of YAP1 in survival prediction, immune modulation, and drug response: A pan-cancer perspective. Front Immunol 2022, 13, 1012173. [Google Scholar] [CrossRef] [PubMed]
- Luo, J.; Zou, H.; Guo, Y.; Tong, T.; Chen, Y.; Xiao, Y.; Pan, Y.; Li, P. The oncogenic roles and clinical implications of YAP/TAZ in breast cancer. British Journal of Cancer 2023, 128, 1611–1624. [Google Scholar] [CrossRef]
- Zanconato, F.; Cordenonsi, M.; Piccolo, S. YAP/TAZ at the Roots of Cancer. Cancer Cell 2016, 29, 783–803. [Google Scholar] [CrossRef]
- Bae, J. S.; Kim, S. M.; Lee, H. The Hippo signaling pathway provides novel anti-cancer drug targets. Oncotarget 2017, 8, 16084–16098. [Google Scholar] [CrossRef]
- Furth, N.; Aylon, Y. The LATS1 and LATS2 tumor suppressors: beyond the Hippo pathway. Cell Death Differ 2017, 24, 1488–1501. [Google Scholar] [CrossRef] [PubMed]
- Meng, Z.; Moroishi, T.; Guan, K. L. Mechanisms of Hippo pathway regulation. Genes Dev 2016, 30, 1–17. [Google Scholar] [CrossRef]
- Bae, S. J.; Ni, L.; Osinski, A.; Tomchick, D. R.; Brautigam, C. A.; Luo, X. SAV1 promotes Hippo kinase activation through antagonizing the PP2A phosphatase STRIPAK. Elife 2017, 6. [Google Scholar] [CrossRef]
- Lin, Z.; Xie, R.; Guan, K.; Zhang, M. A WW Tandem-Mediated Dimerization Mode of SAV1 Essential for Hippo Signaling. Cell Rep 2020, 32, 108118. [Google Scholar] [CrossRef]
- Zhang, H.; Yang, Z.; Nakamura, F. Importance of the filamin A-Sav1 interaction in organ size control: evidence from transgenic mice. Int. J. Dev. Biol. 2023, 67, 27–37. [Google Scholar] [CrossRef]
- Ni, L.; Zheng, Y.; Hara, M.; Pan, D.; Luo, X. Structural basis for Mob1-dependent activation of the core Mst-Lats kinase cascade in Hippo signaling. Genes Dev 2015, 29, 1416–1431. [Google Scholar] [CrossRef] [PubMed]
- Han, H.; Wang, W. A tale of two Hippo pathway modules. The EMBO Journal 2023, 42, EMBJ2023113970. [Google Scholar] [CrossRef] [PubMed]
- Liu, Y.; Deng, J. Ubiquitination-deubiquitination in the Hippo signaling pathway (Review). Oncol Rep 2019, 41, 1455–1475. [Google Scholar] [CrossRef]
- Nguyen, T. H.; Kugler, J. M. Ubiquitin-Dependent Regulation of the Mammalian Hippo Pathway: Therapeutic Implications for Cancer. Cancers (Basel) 2018, 10. [Google Scholar] [CrossRef]
- Peng, S.; Li, C.; He, Y.; Xue, L.; Guo, X. Regulatory roles of RNA binding proteins in the Hippo pathway. Cell Death Discovery 2025, 11, 36. [Google Scholar] [CrossRef]
- Cunningham, R.; Hansen, C. G. The Hippo pathway in cancer: YAP/TAZ and TEAD as therapeutic targets in cancer. Clin Sci (Lond) 2022, 136, 197–222. [Google Scholar] [CrossRef]
- Yang, J.; Zhang, B.; Guan, W.; Fan, Z.; Pu, X.; Zhao, L.; Jiang, W.; Cai, W.; Quan, X.; Miao, S.; et al. Molecular genetic characteristics of thymic epithelial tumors with distinct histological subtypes. Cancer Med 2023, 12, 10575–10586. [Google Scholar] [CrossRef]
- Takata, S. Genomic insights into molecular profiling of thymic carcinoma: a narrative review. Mediastinum 2024, 8, 39. [Google Scholar] [CrossRef]
- Yang, D.; Zhang, N.; Li, M.; Hong, T.; Meng, W.; Ouyang, T. The Hippo Signaling Pathway: The Trader of Tumor Microenvironment. Front Oncol 2021, 11, 772134. [Google Scholar] [CrossRef] [PubMed]
- Mokhtari, R. B.; Ashayeri, N.; Baghaie, L.; Sambi, M.; Satari, K.; Baluch, N.; Bosykh, D. A.; Szewczuk, M. R.; Chakraborty, S. The Hippo Pathway Effectors YAP/TAZ-TEAD Oncoproteins as Emerging Therapeutic Targets in the Tumor Microenvironment. Cancers (Basel) 2023, 15. [Google Scholar] [CrossRef]
- Ghaboura, N. Unraveling the Hippo pathway: YAP/TAZ as central players in cancer metastasis and drug resistance. Excli j 2025, 24, 612–637. [Google Scholar] [CrossRef] [PubMed]
- von Ahlfen, S.; Missel, A.; Bendrat, K.; Schlumpberger, M. Determinants of RNA quality from FFPE samples. PLoS One 2007, 2, e1261. [Google Scholar] [CrossRef]
- Cronin, M.; Pho, M.; Dutta, D.; Stephans, J. C.; Shak, S.; Kiefer, M. C.; Esteban, J. M.; Baker, J. B. Measurement of gene expression in archival paraffin-embedded tissues: development and performance of a 92-gene reverse transcriptase-polymerase chain reaction assay. Am J Pathol 2004, 164, 35–42. [Google Scholar] [CrossRef]
- Aggerholm-Pedersen, N.; Safwat, A.; Bærentzen, S.; Nordsmark, M.; Nielsen, O. S.; Alsner, J.; Sørensen, B. S. The importance of reference gene analysis of formalin-fixed, paraffin-embedded samples from sarcoma patients - an often underestimated problem. Transl Oncol 2014, 7, 687–693. [Google Scholar] [CrossRef]
- Liu, X.; Wang, C.; Huang, Y.; Lv, Q.; Yu, C.; Ying, J.; Duan, L.; Guo, Y.; Huang, G.; Shen, W.; et al. Abnormal Cellular Populations Shape Thymic Epithelial Tumor Heterogeneity and Anti-Tumor by Blocking Metabolic Interactions in Organoids. Adv Sci (Weinh) 2024, 11, e2406653. [Google Scholar] [CrossRef] [PubMed]
- Hagenbeek, T. J.; Zbieg, J. R.; Hafner, M.; Mroue, R.; Lacap, J. A.; Sodir, N. M.; Noland, C. L.; Afghani, S.; Kishore, A.; Bhat, K. P.; et al. An allosteric pan-TEAD inhibitor blocks oncogenic YAP/TAZ signaling and overcomes KRAS G12C inhibitor resistance. Nat Cancer 2023, 4, 812–828. [Google Scholar] [CrossRef]
- Chapeau, E. A.; Sansregret, L.; Galli, G. G.; Chène, P.; Wartmann, M.; Mourikis, T. P.; Jaaks, P.; Baltschukat, S.; Barbosa, I. A. M.; Bauer, D.; et al. Direct and selective pharmacological disruption of the YAP-TEAD interface by IAG933 inhibits Hippo-dependent and RAS-MAPK-altered cancers. Nat Cancer 2024, 5, 1102–1120. [Google Scholar] [CrossRef] [PubMed]
- Pobbati, A. V.; Kumar, R.; Rubin, B. P.; Hong, W. Therapeutic targeting of TEAD transcription factors in cancer. Trends Biochem Sci 2023, 48, 450–462. [Google Scholar] [CrossRef] [PubMed]
- Lao, Z.; Chen, X.; Pan, B.; Fang, B.; Yang, W.; Qian, Y. Pharmacological regulators of Hippo pathway: Advances and challenges of drug development. Faseb j 2025, 39, e70438. [Google Scholar] [CrossRef] [PubMed]
Figure 1.
MST1 expression in thymic epithelial tumors (TETs). (A) Boxplots depicting MST1 mRNA expression (log2FC) among World Health Organization (WHO) histological subtypes of TETs [Types A, B1–B3 and TC)]; values are normalized to HPRT1 [RealTimePrimers.com (RTP)]/TBP, using the median of two normal thymus samples as calibrator (N). (B–E) Representative immunohistochemical (IHC) images corresponding to the mRNA distribution shown in (A): (B) type A thymoma with moderately increased MST1 staining (cytoplasmic,×630); (C) type B3 thymoma with strong MST1 staining (cytoplasmic, ×400); (D) TC with high MST1 staining (cytoplasmic, ×630); (E) MST1 normal thymic tissue staining (cytoplasmic, ×400).
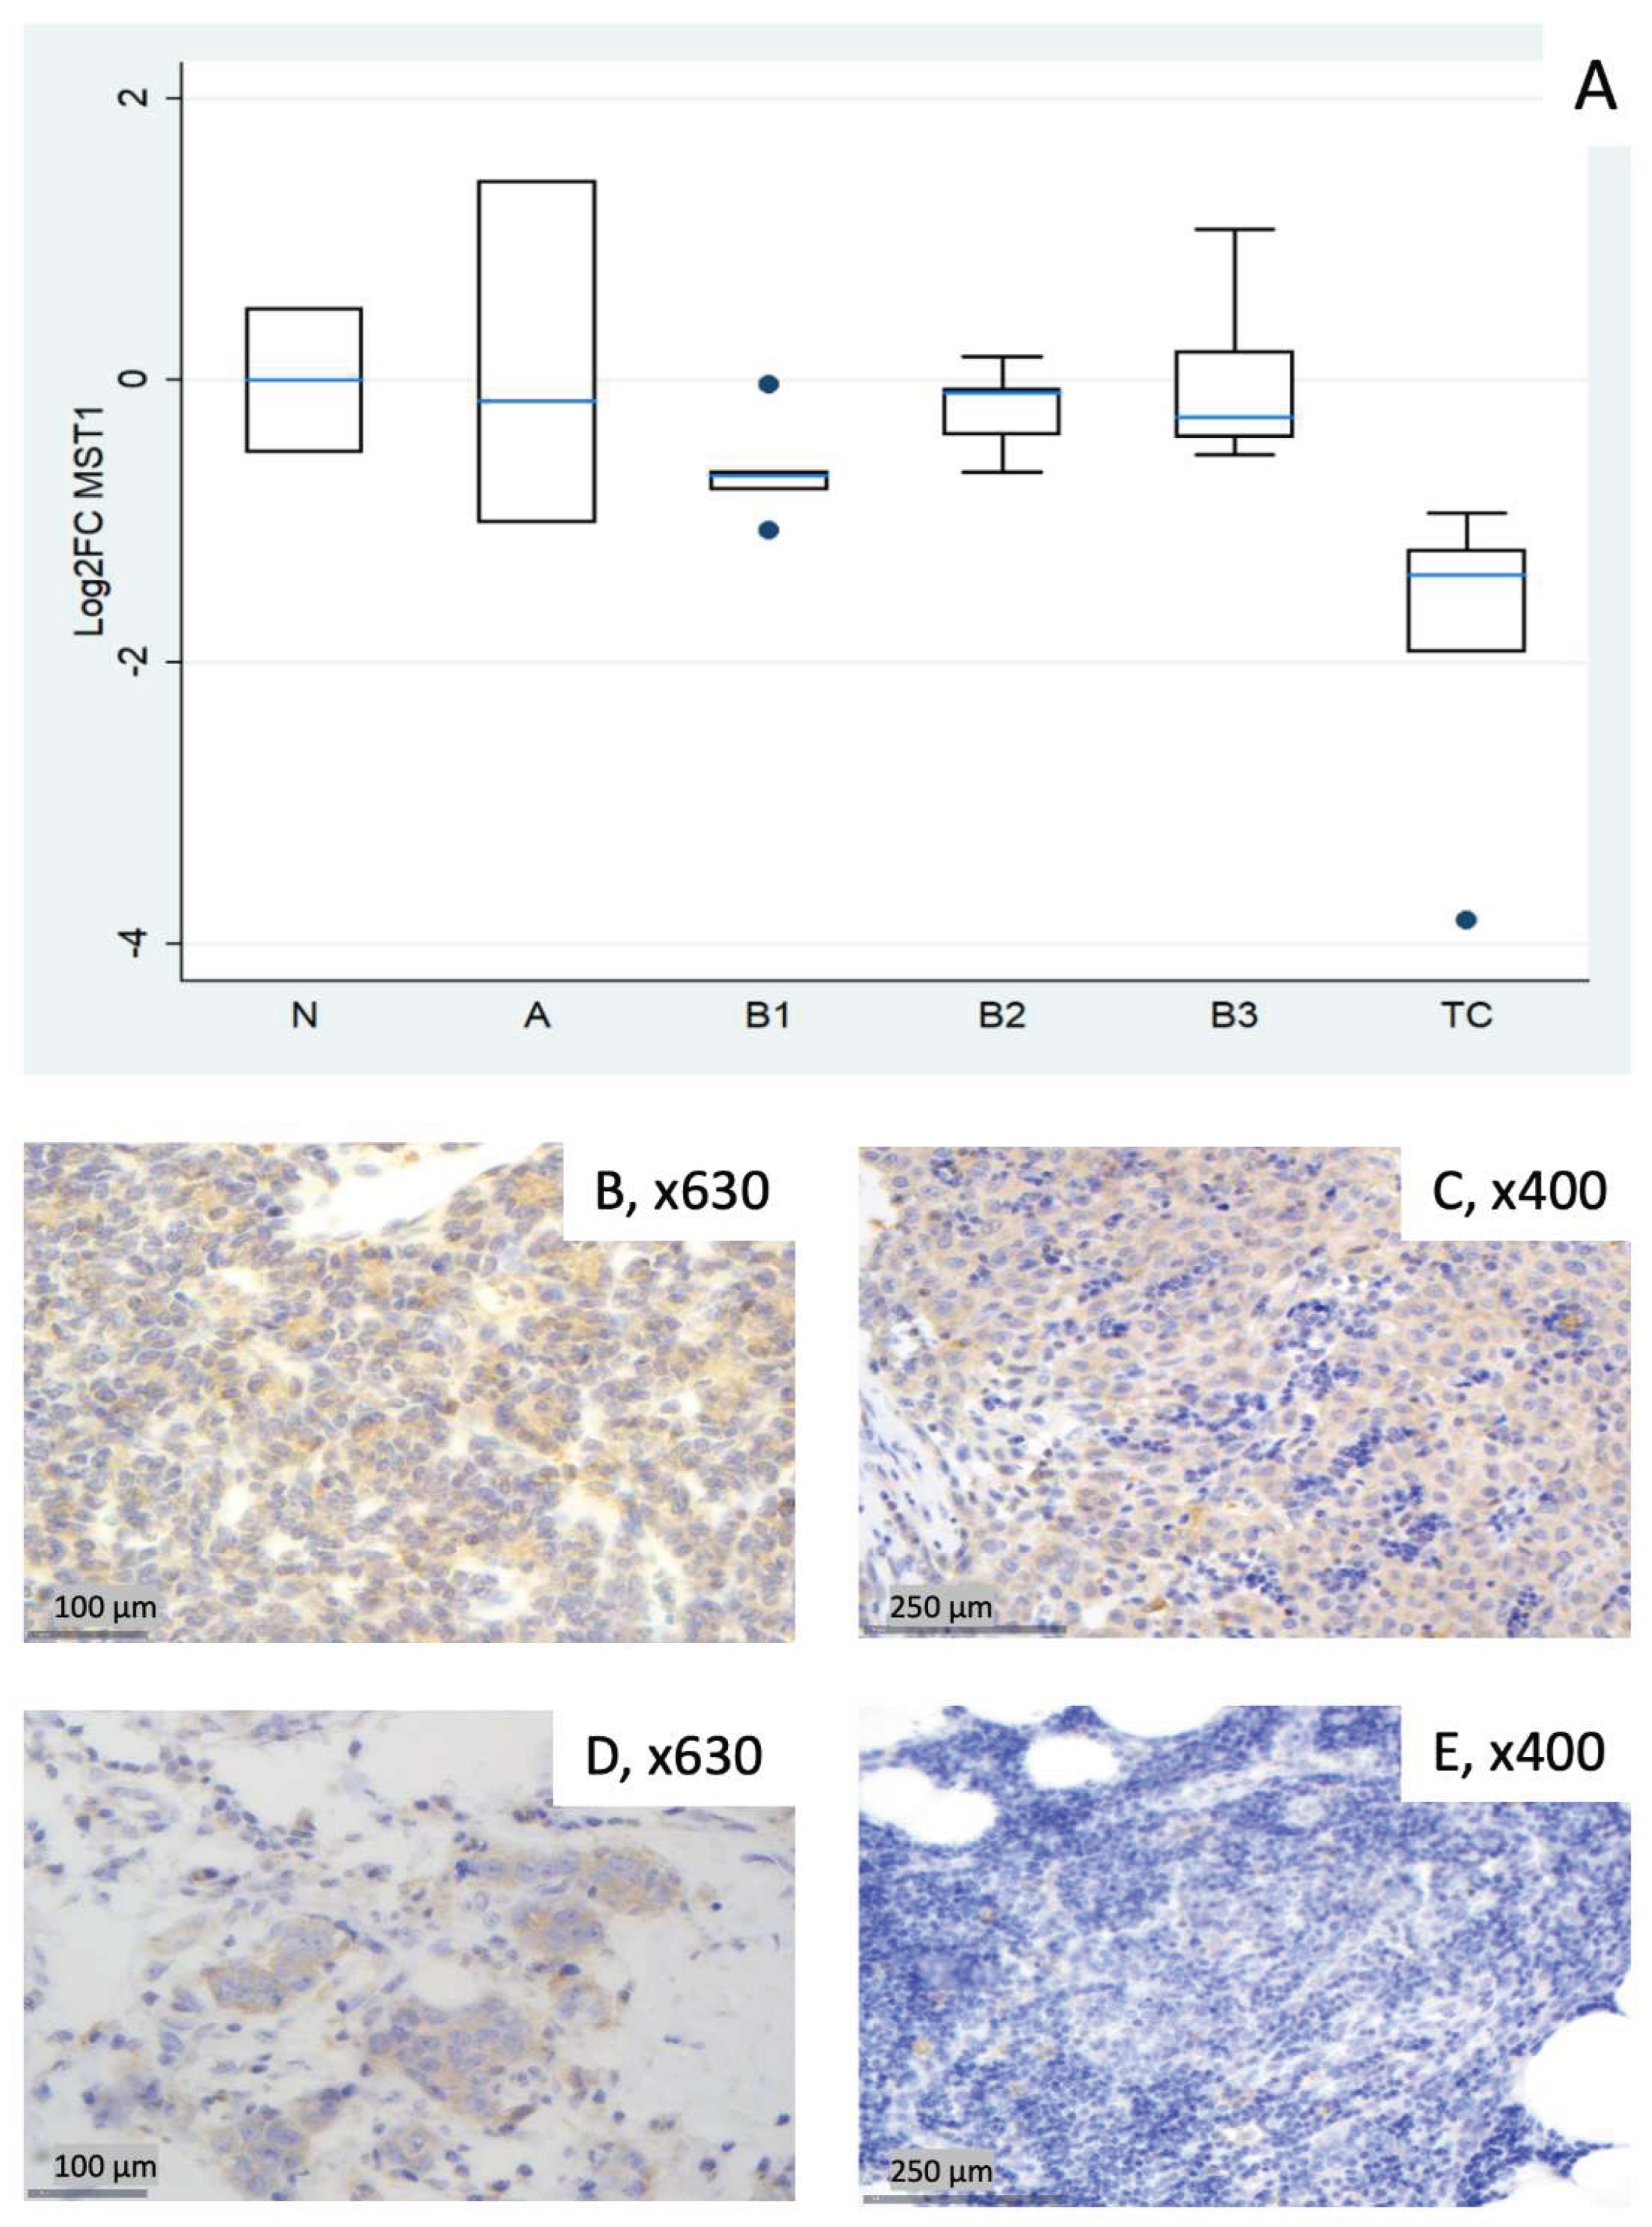
Figure 2.
SAV1 expression in TETs. (A) Boxplots depicting SAV1 mRNA expression (log2FC) across WHO histological subtypes of TETs, normalized to HPRT1 (RTP)/TBP, using the median of two normal thymus samples as calibrator (N). (B, C) Representative IHC images corresponding to the mRNA distribution shown in (A): (B) type B3 thymoma showing strong SAV1 expression (cytoplasmic, ×400). (C) SAV1 normal thymic tissue expression (cytoplasmic, ×400).
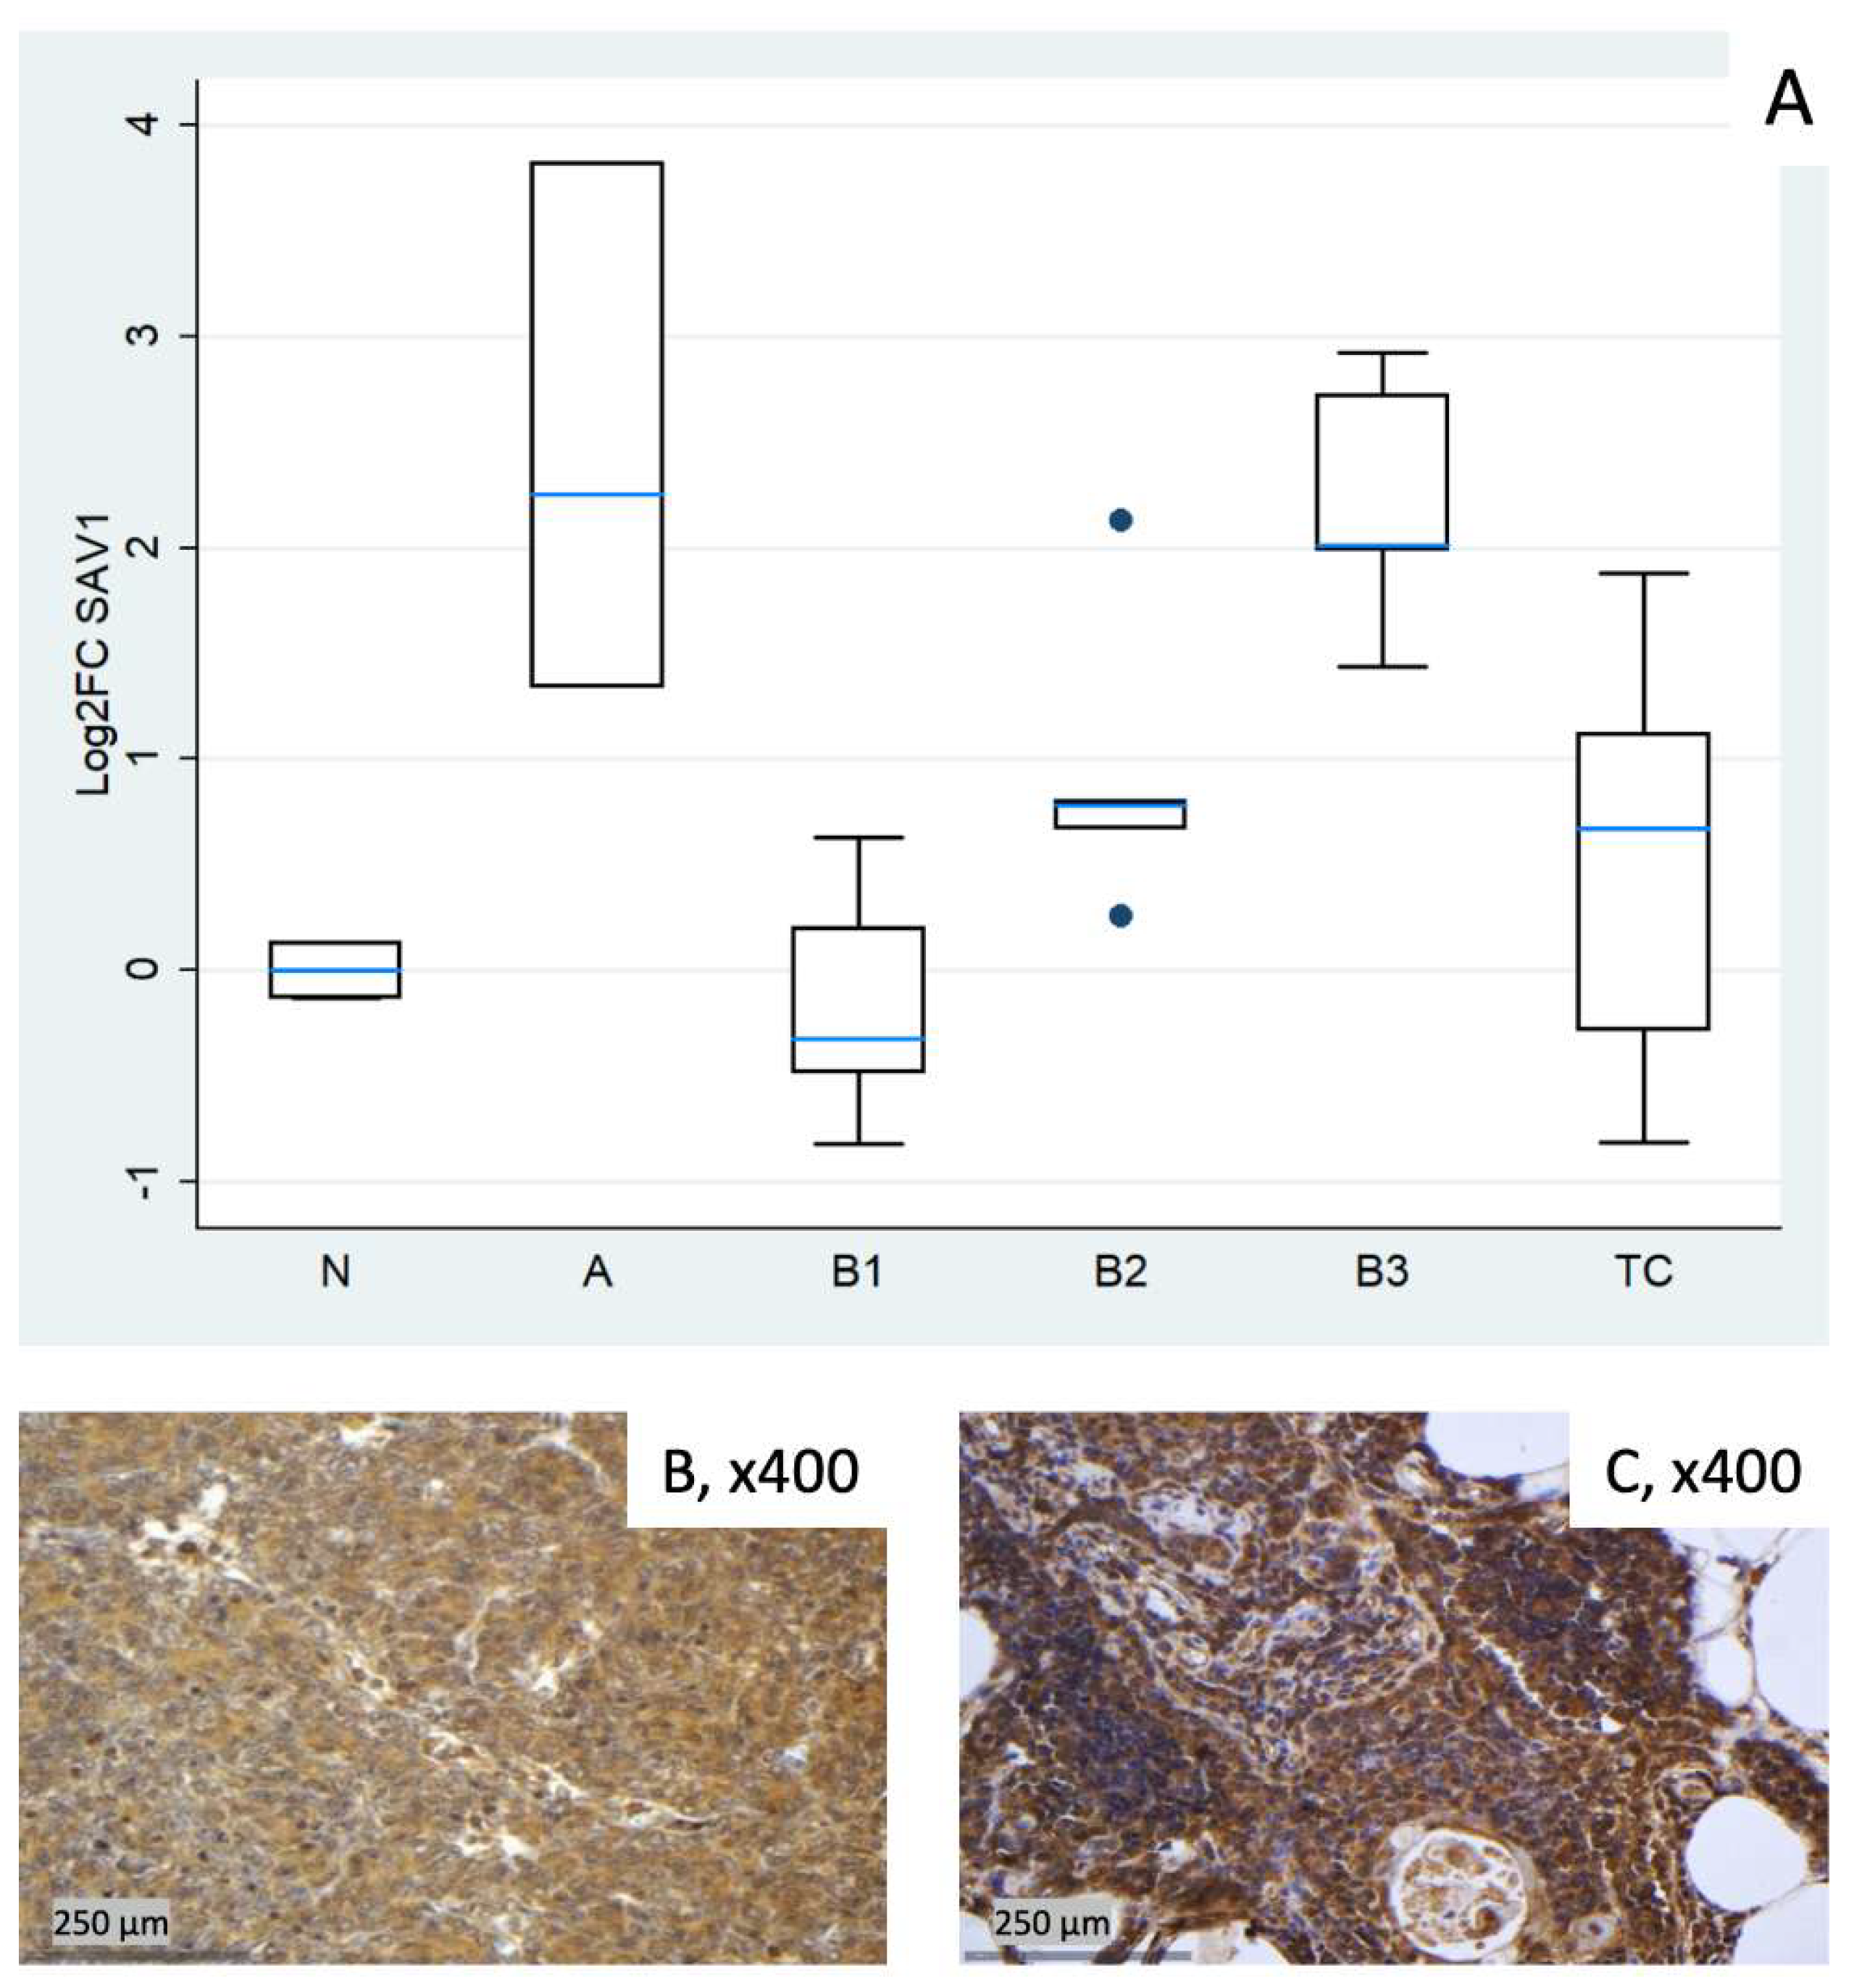
Figure 3.
LATS1 expression in TETs. (A) Boxplots depicting LATS1 mRNA expression (log2FC) across WHO histological subtypes of TETs, normalized to HPRT1 (RTP)/TBP, using the median of two normal thymus samples as calibrator (N). (B–D) Representative IHC images corresponding to the mRNA distribution shown in (A): (B) type A thymoma showing strong LATS1 expression (cytoplasmic, ×400). (C) TC with moderate LATS1 staining (cytoplasmic, ×400). (D) LATS1 normal thymic tissue expression (cytoplasmic, ×400).
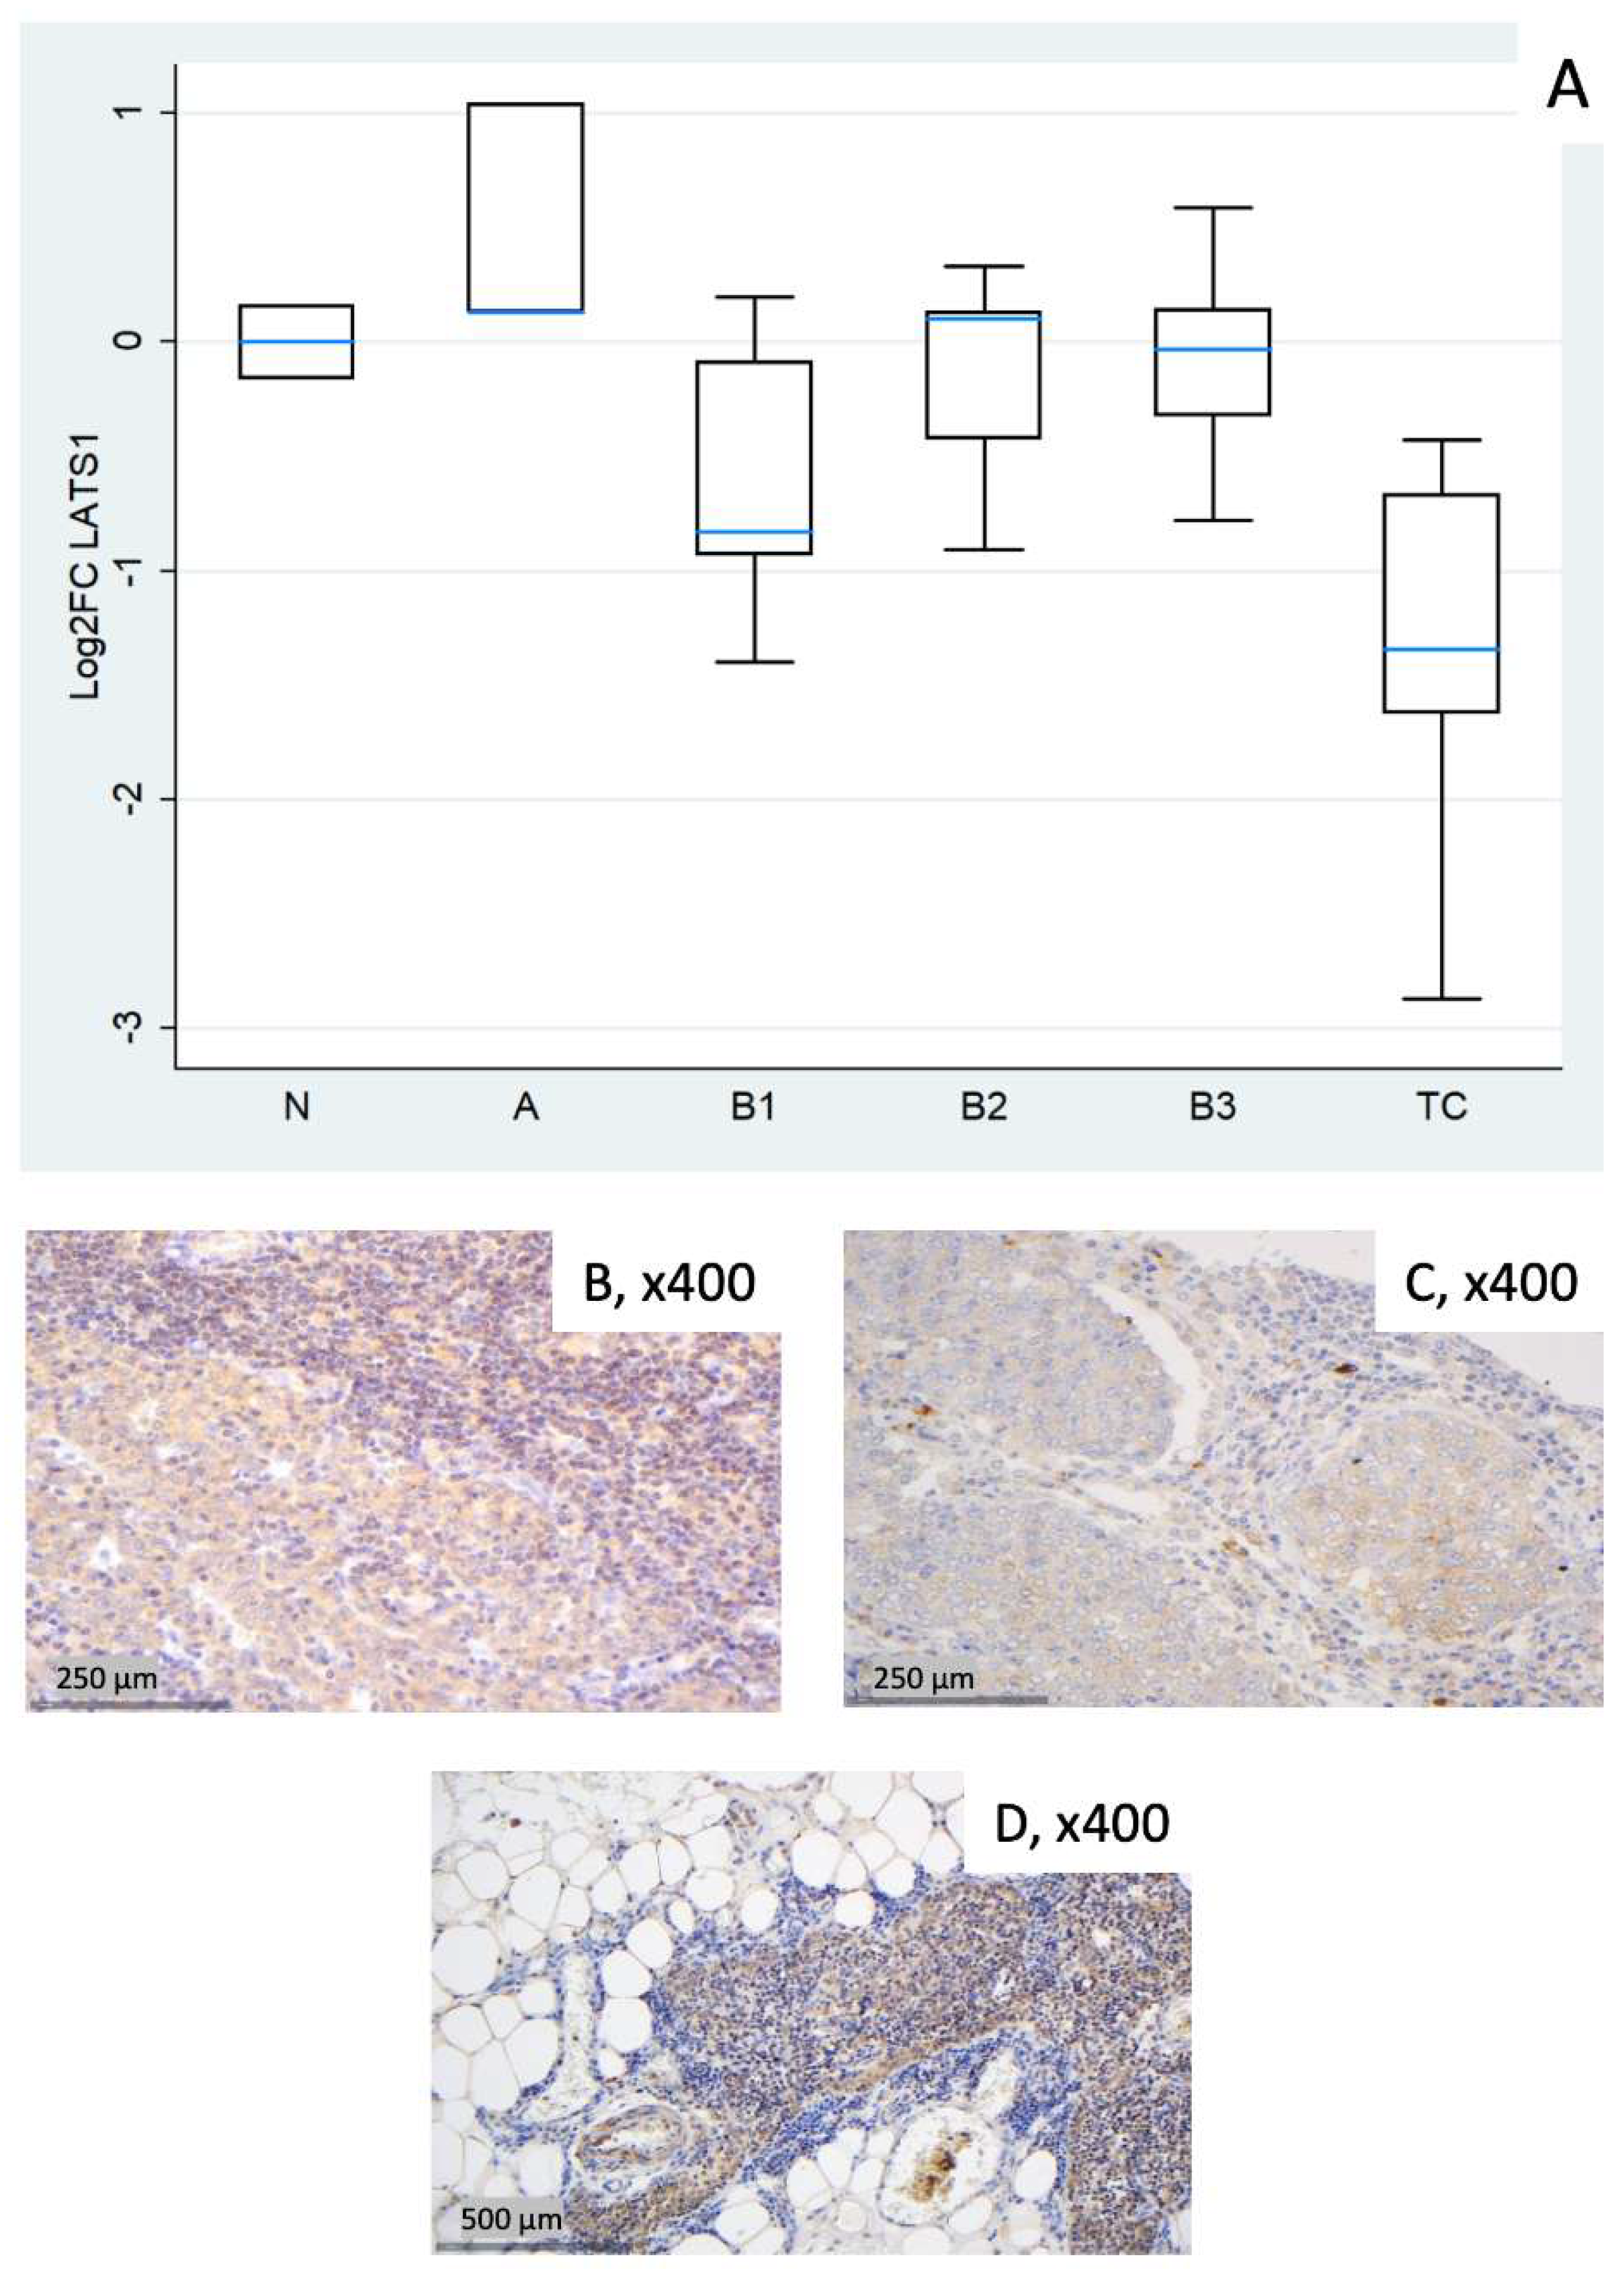
Figure 4.
MOB1A expression in TETs.(A) Boxplots depicting MOB1A mRNA expression (log2FC) across WHO histological subtypes of TETs, normalized to HPRT1 (RTP)/TBP, using the median of two normal thymus samples as calibrator (N). (B-E) Representative IHC images corresponding to the mRNA distribution shown in (A): (B) type A thymoma showing strong MOB1A expression (cytoplasmic, ×400). (C) Type B3 thymoma with strong MOB1A staining (cytoplasmic, ×400). (D) TC with strong MOB1A staining (cytoplasmic, ×400). (E) MOB1A normal thymic tissue staining (cytoplasmic, ×400).
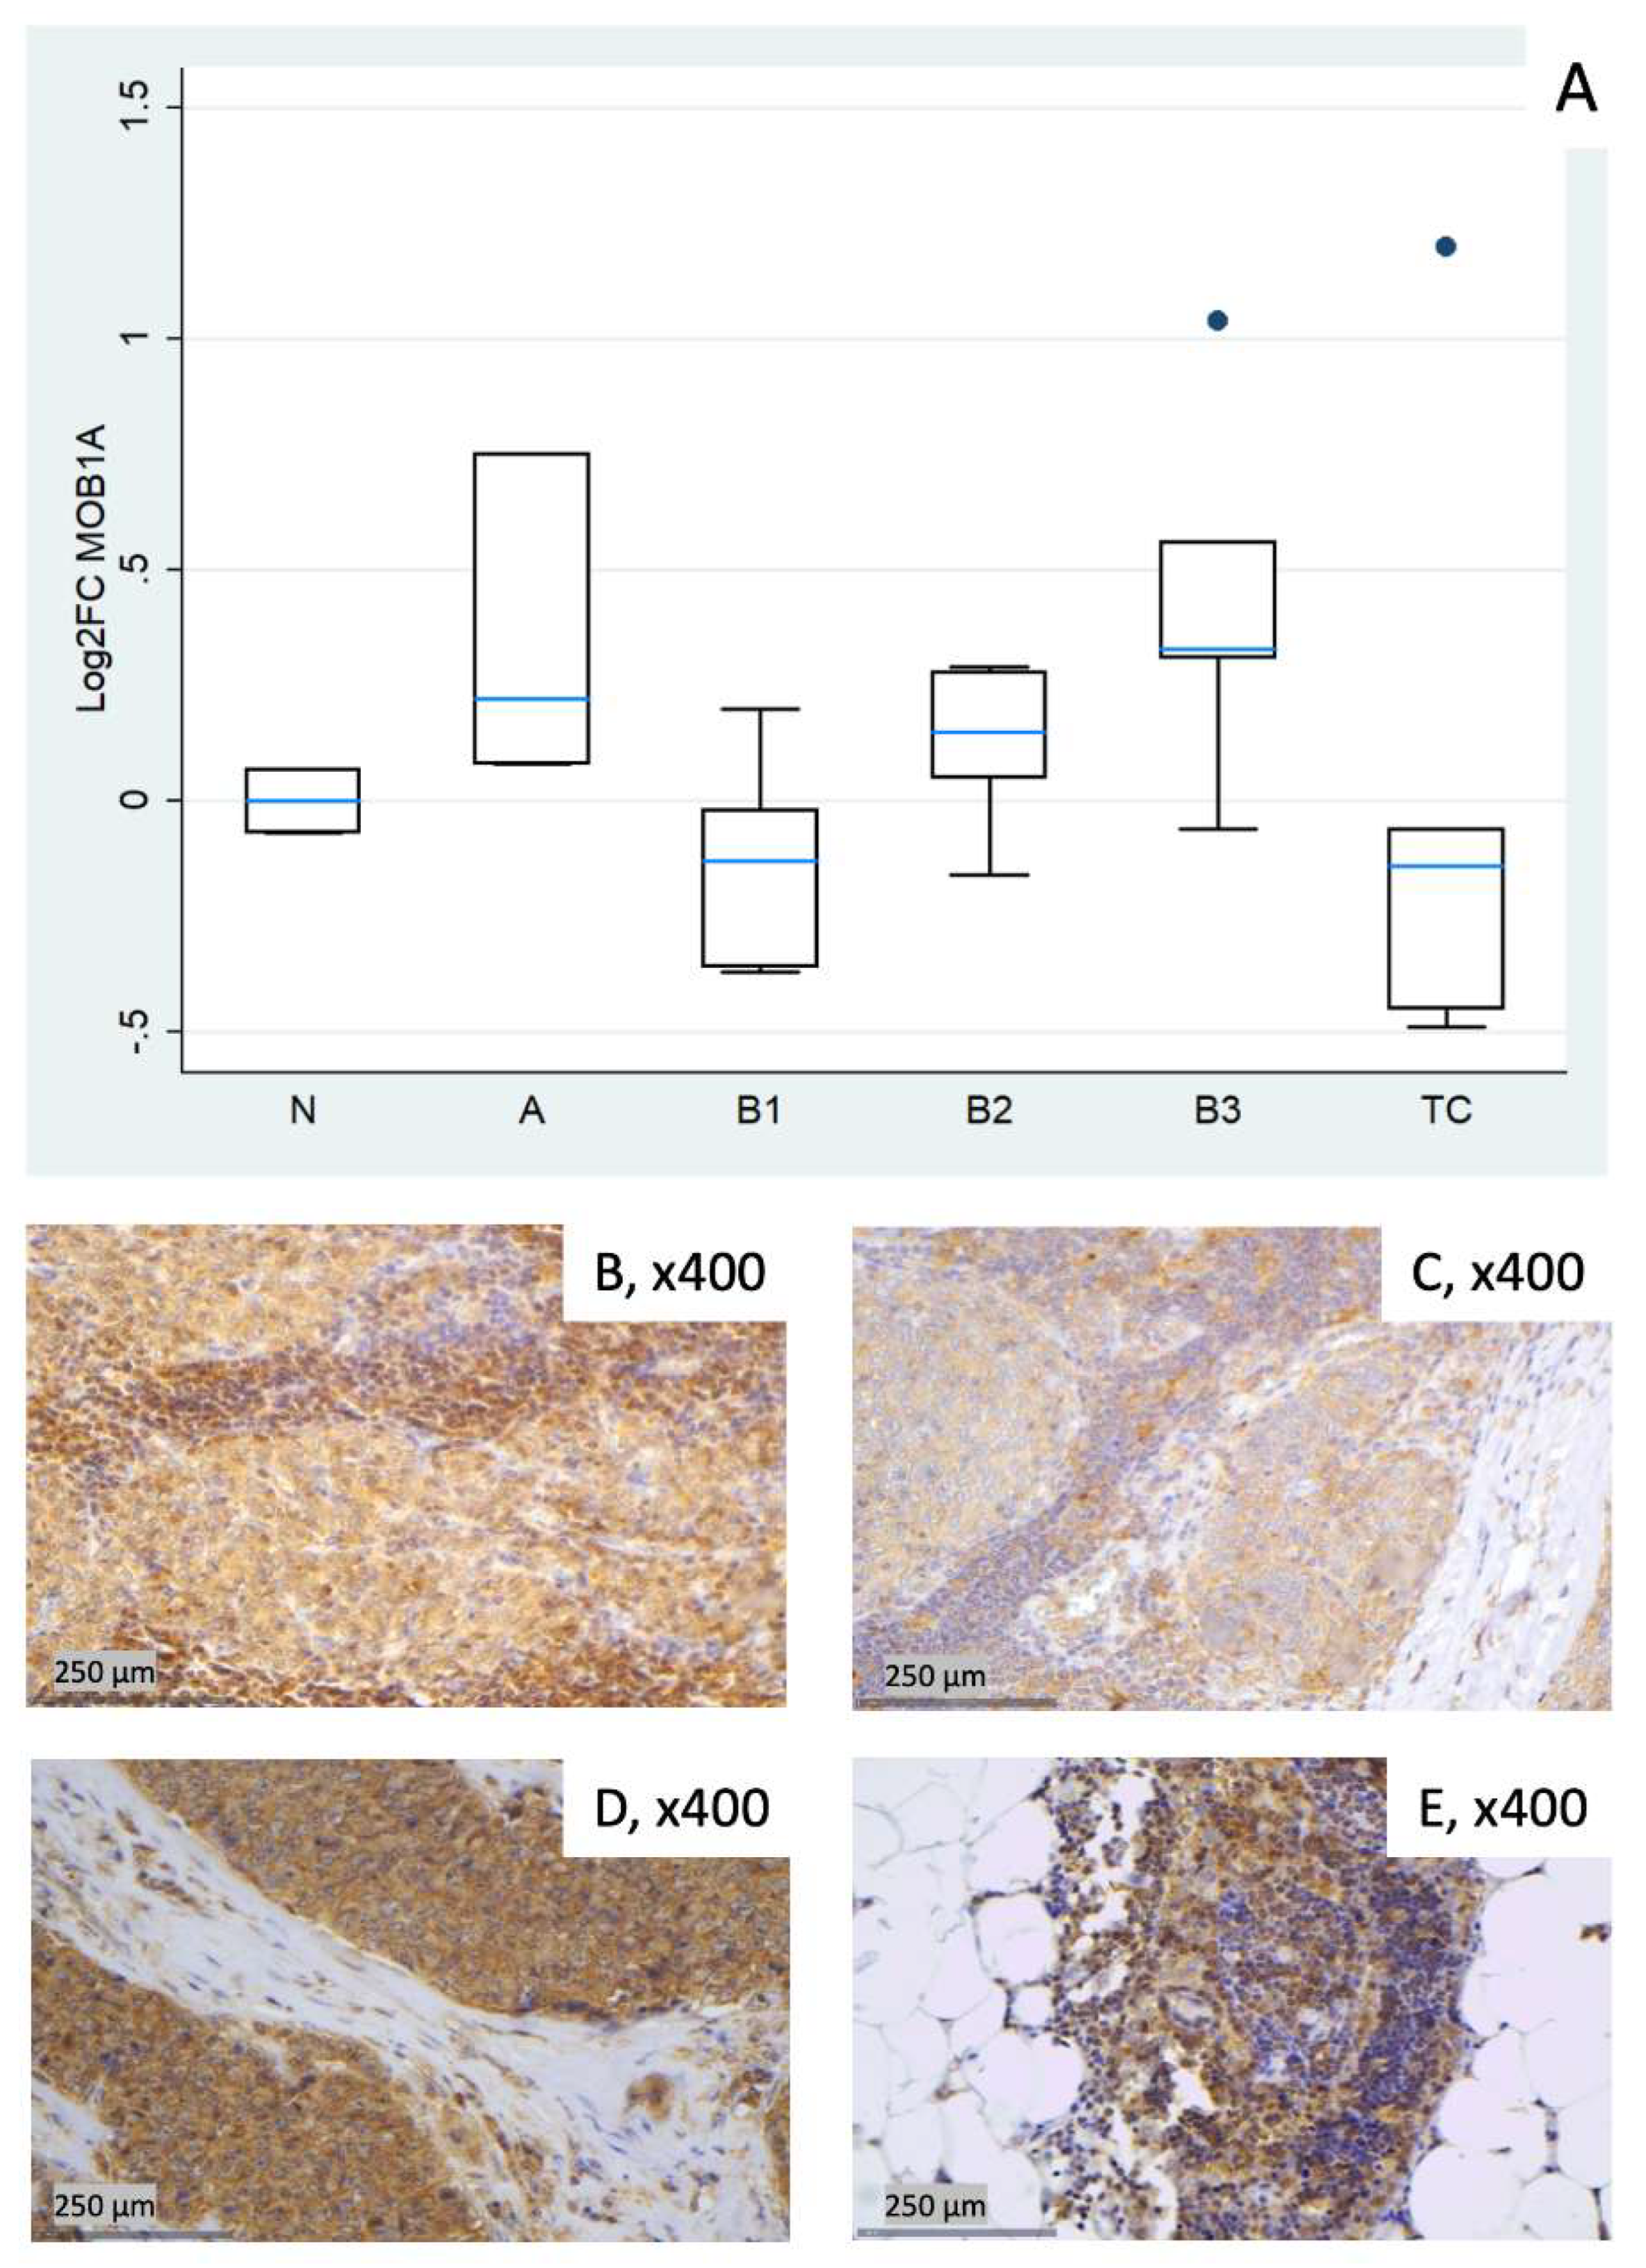
Figure 5.
YAP1 and active YAP1 (AYAP) expression in TETs. (A) Boxplots depicting YAP1 mRNA expression (log2FC) across WHO histological subtypes of TETs, normalized to HPRT1 (RTP)/TBP, using the median of two normal thymus samples as calibrator (N). (B–D) Representative IHC images corresponding to the mRNA distribution shown in (A): (B) type A thymoma with YAP1 staining (cytoplasmic, nuclear, ×400); (C) type B2 thymoma with moderate YAP1 staining (cytoplasmic, ×400); (D) YAP1 normal thymic tissue staining (nuclear, cytoplasmic, ×400). (E–G) Representative IHC images of AYAP: (E) type A thymoma with strong AYAP staining (cytoplasmic, nuclear, ×400); (F) TC with low nuclear but moderate cytoplasmic AYAP staining (nuclear, cytoplasmic, ×400); (G) AYAP normal thymic tissue staining (nuclear ×400).
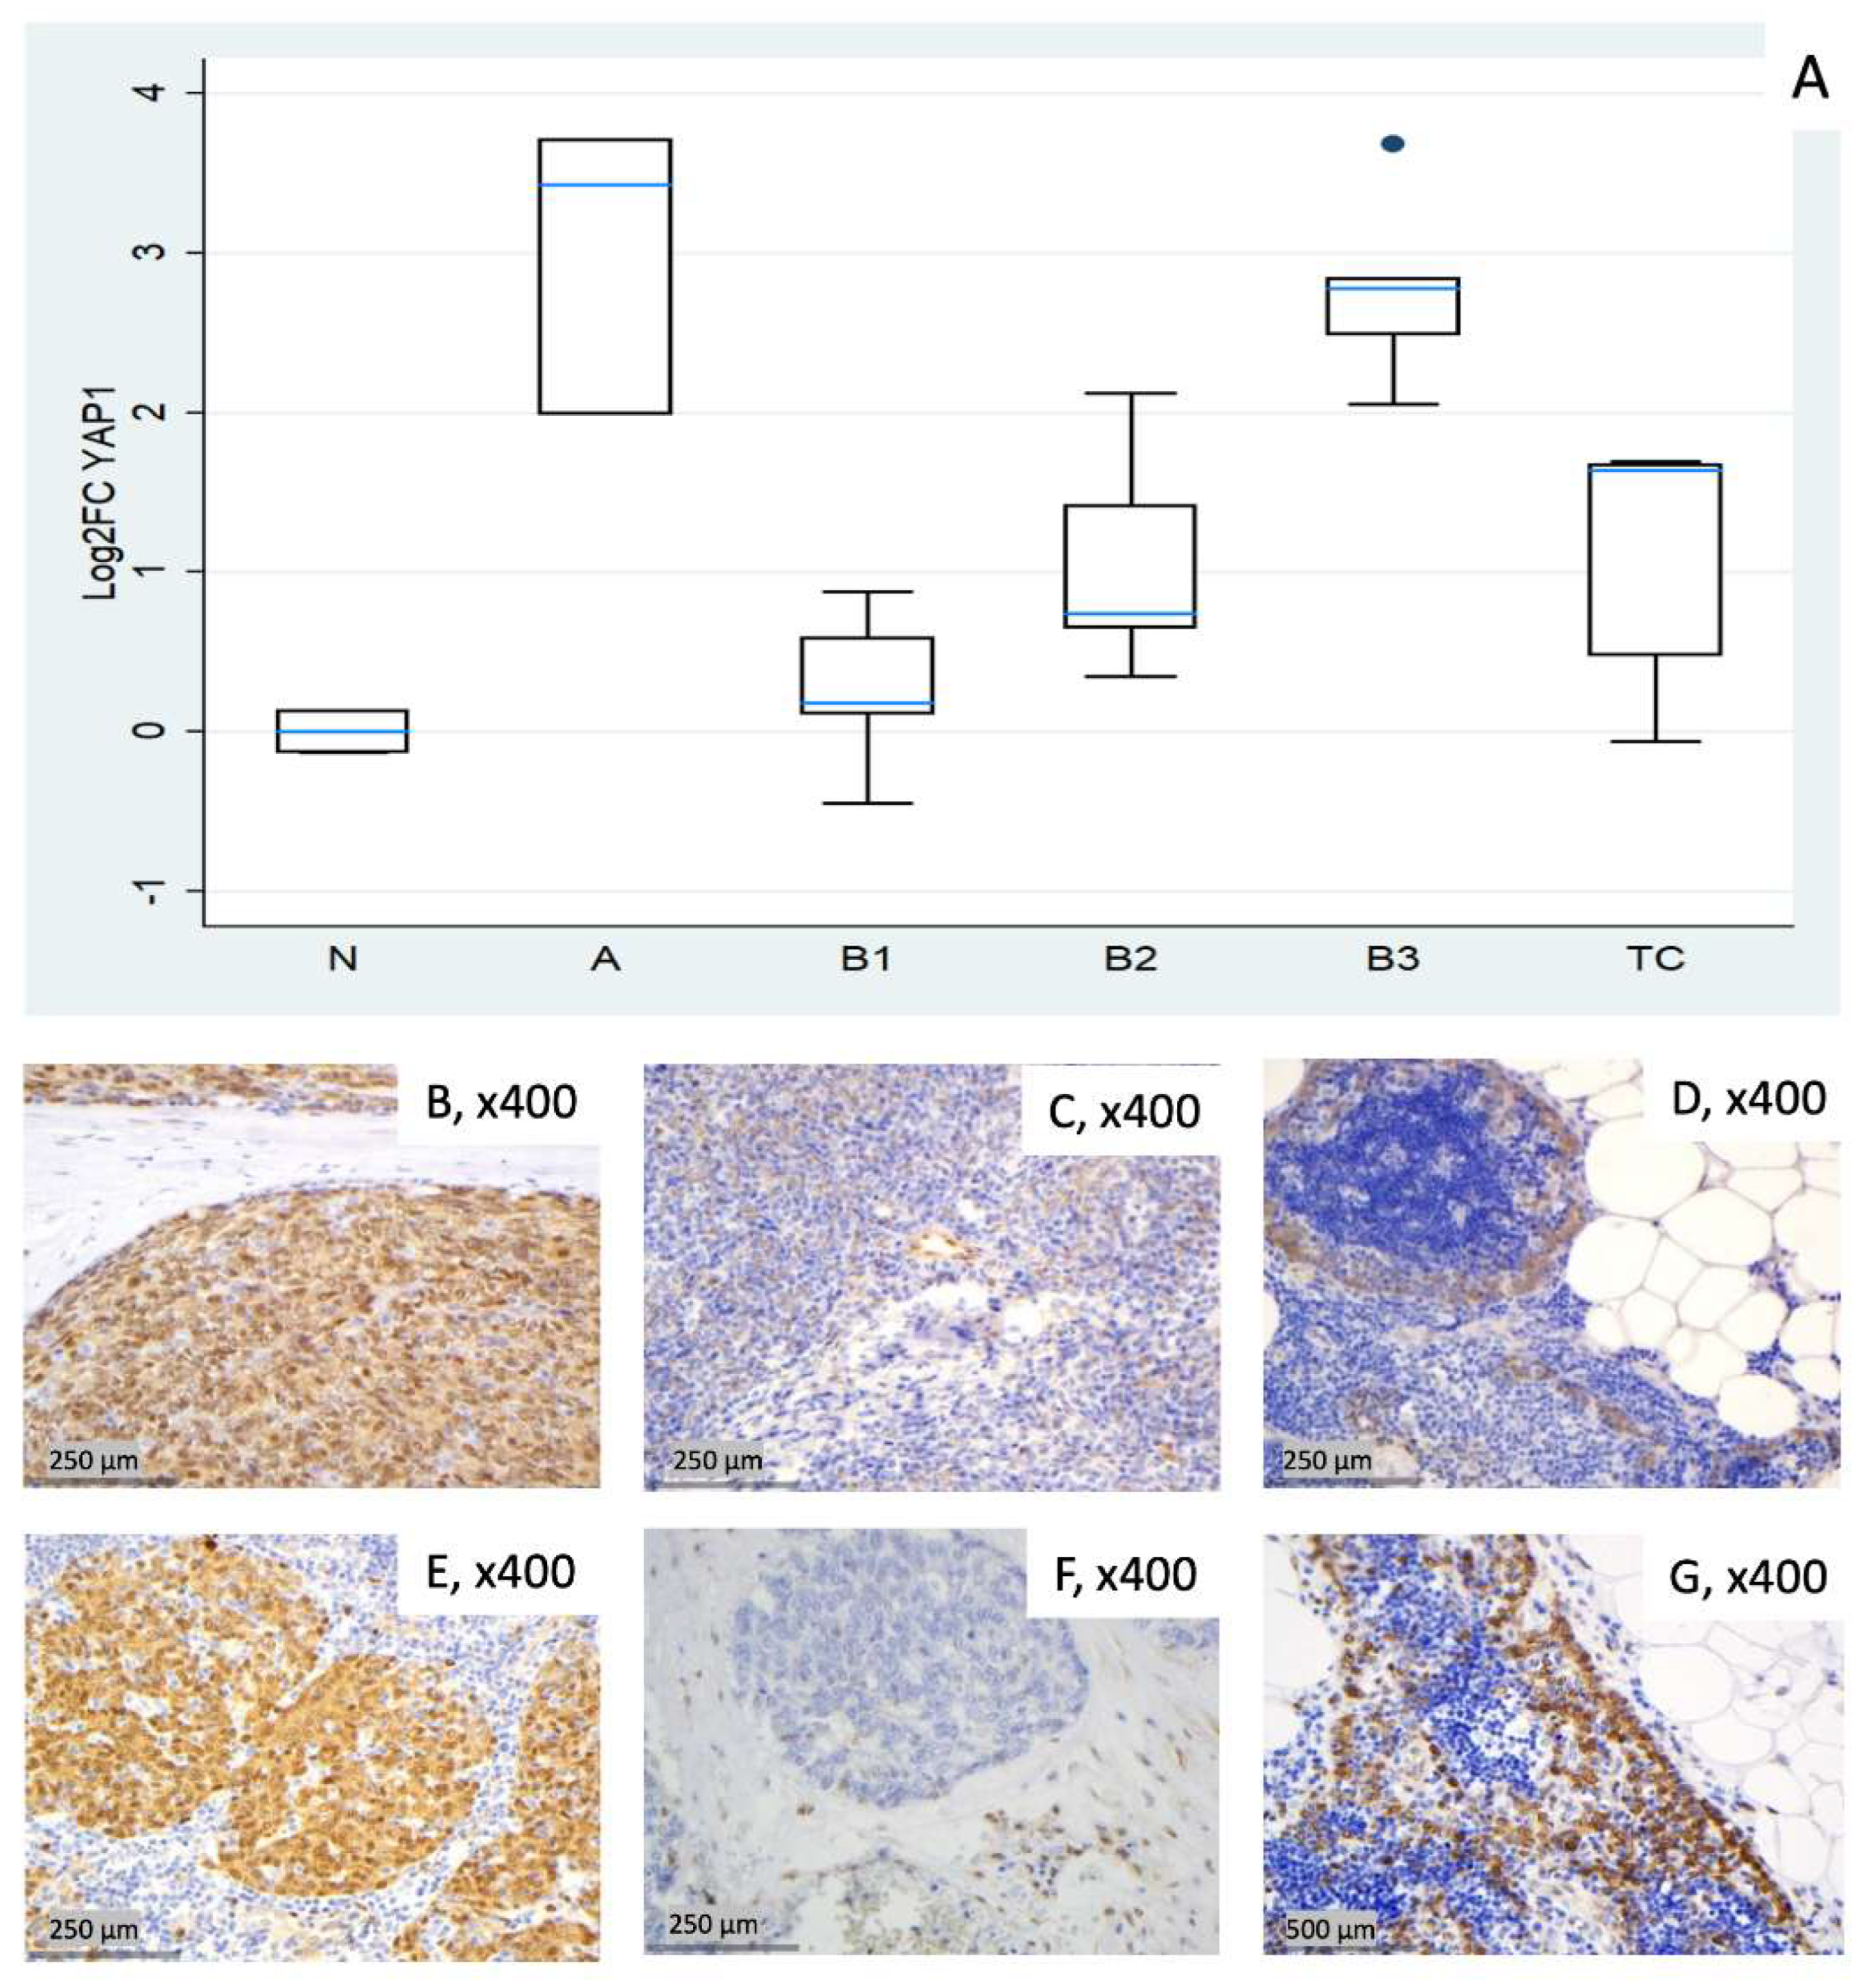
Figure 6.
TEAD4 expression in TETs. (A) Boxplots depicting TEAD4 mRNA expression (log2FC) across WHO histological subtypes of TETs, normalized to HPRT1 (RTP)/TBP, using the median of two normal thymus samples as calibrator (N). (B–E) Representative IHC images corresponding to the mRNA distribution shown in (A): (B) TC with moderate nuclear and strong cytoplasmic TEAD4 staining (nuclear, cytoplasmic, ×400); (C) type B1 thymoma with low TEAD4 staining (cytoplasmic, ×400); (D) type A thymoma with strong TEAD4 staining (nuclear, cytoplasmic, ×400); (E) TEAD4 normal thymic tissue staining (cytoplasmic, nuclear×400).
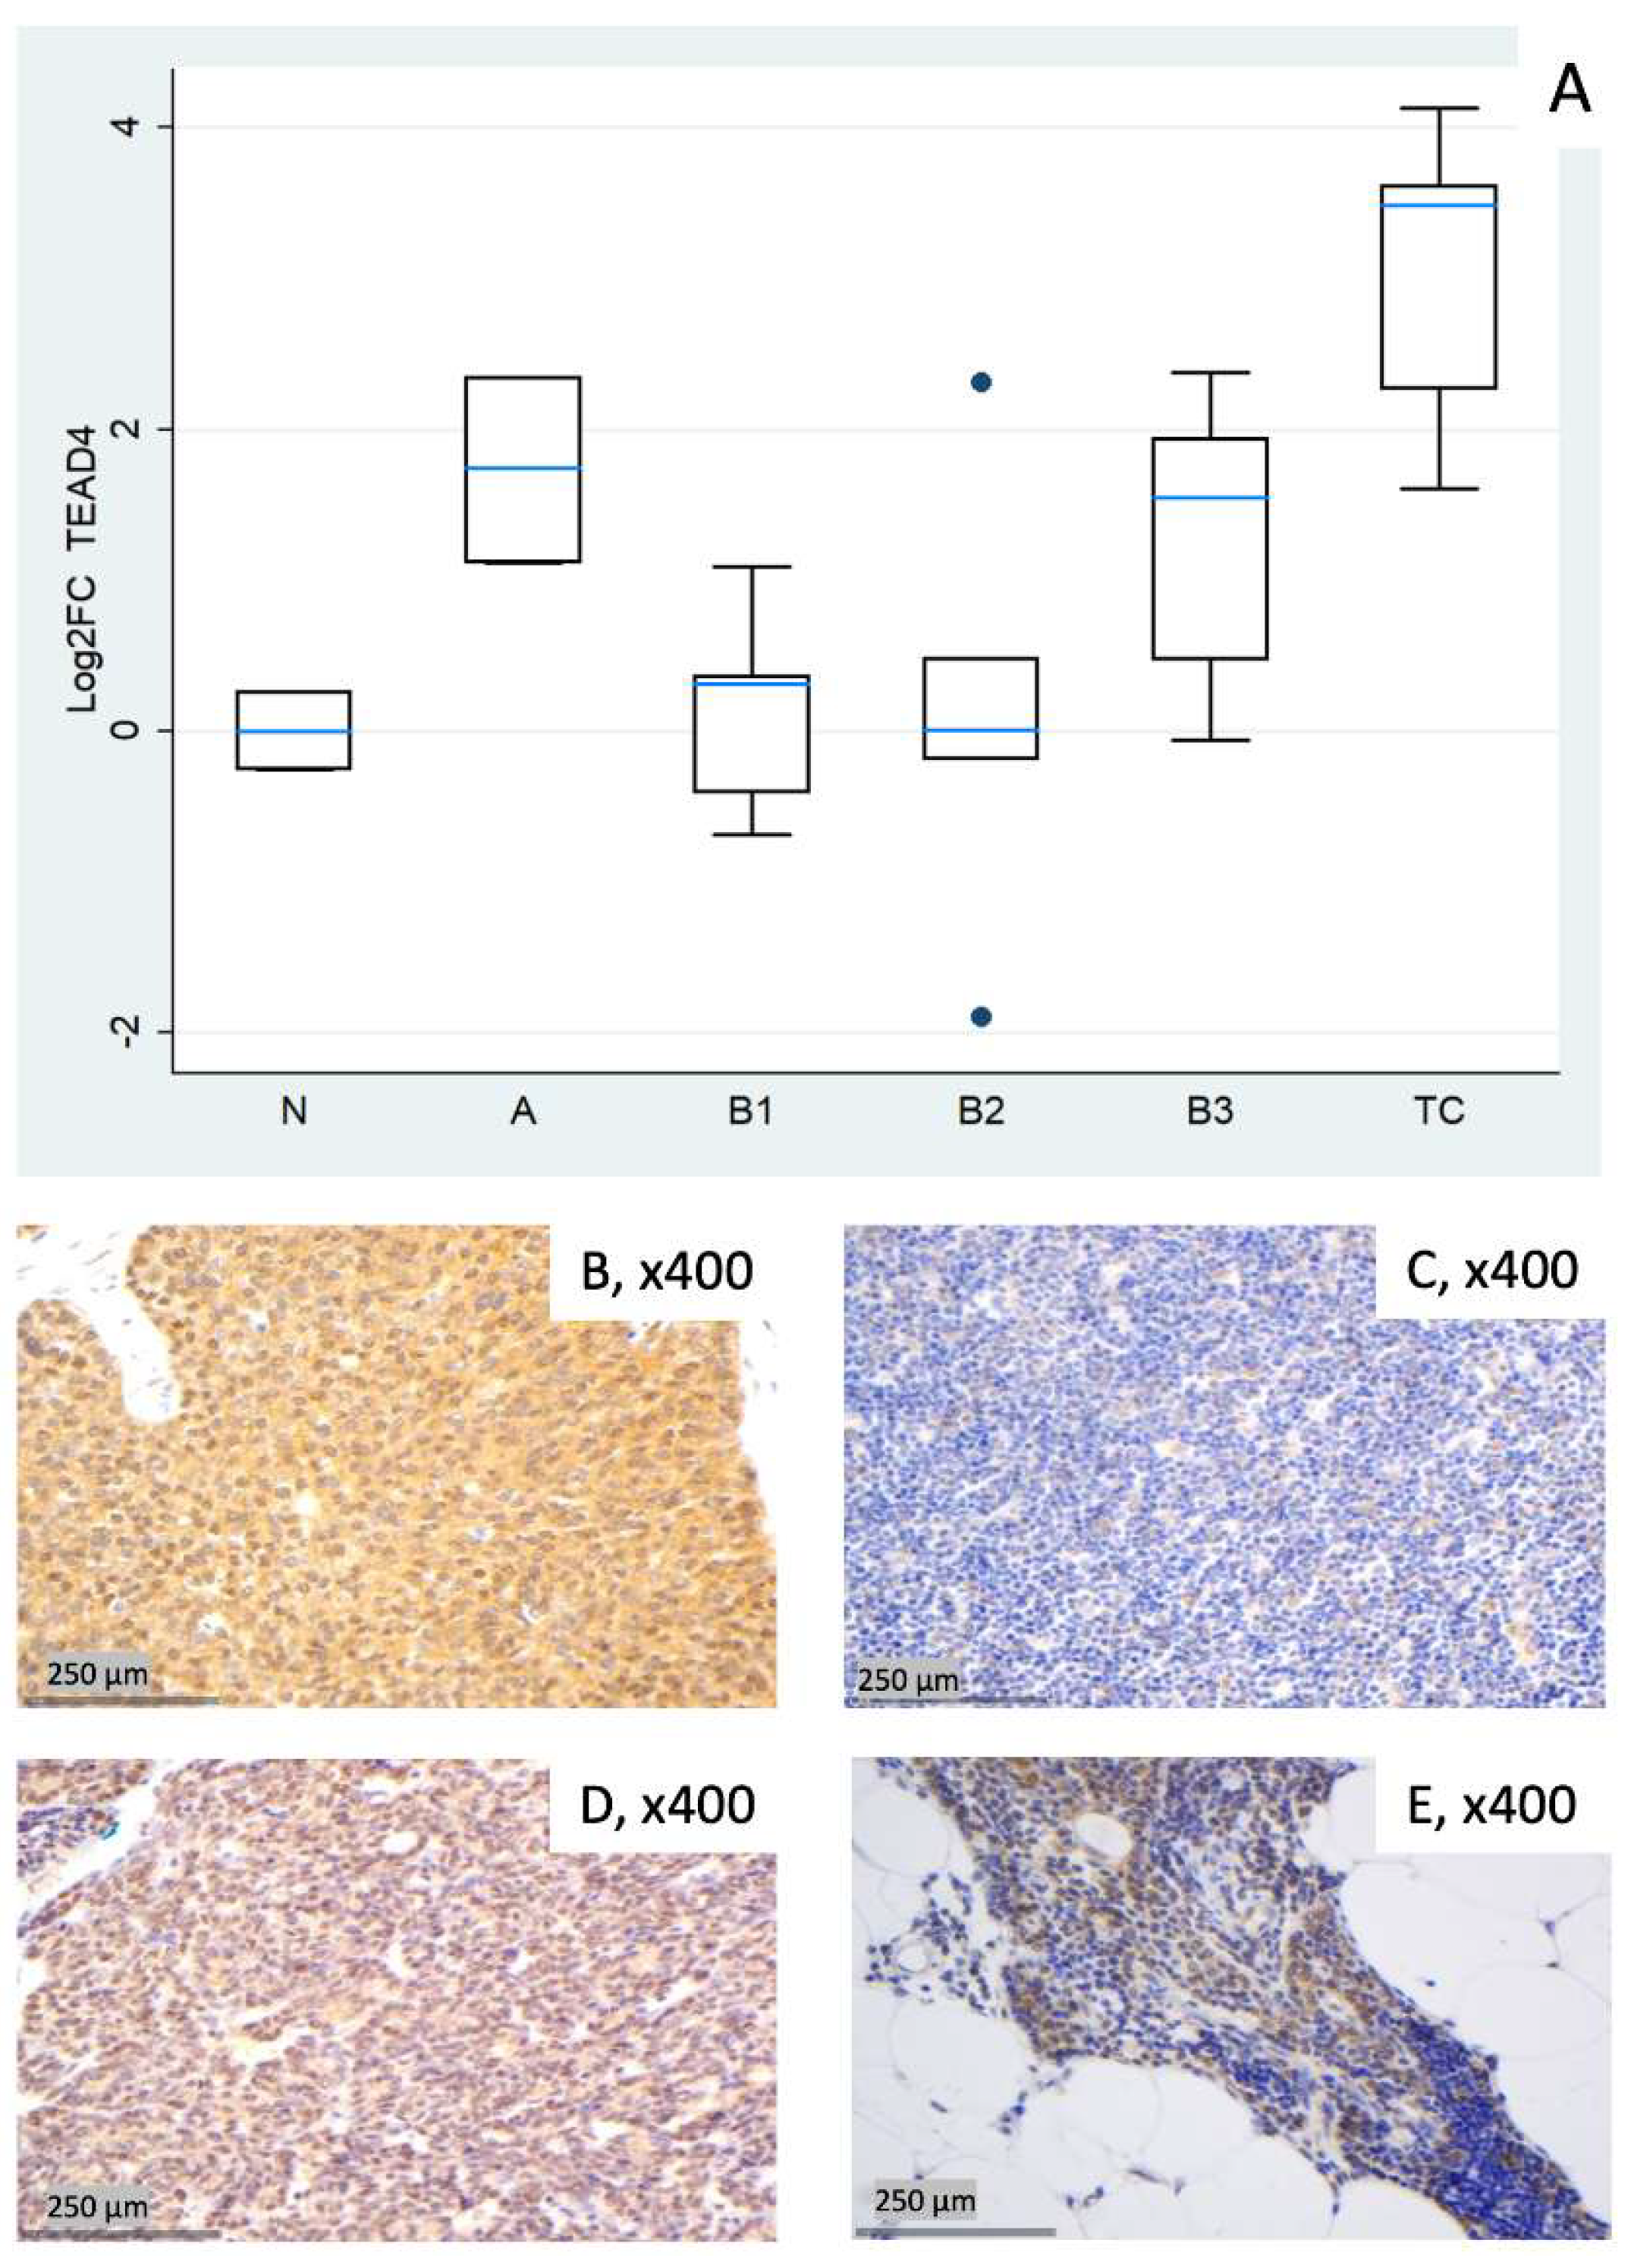
Figure 7.
Median log2FCs per TET subtype. Heatmap of median log2FCs for Hippo pathway components across thymic epithelial tumor subtypes (A, B1–B3, TC). Values are medians of tumor samples normalized to normal thymus (N1/3). Warmer colors indicate higher expression relative to normal, cooler colors indicate lower expression.
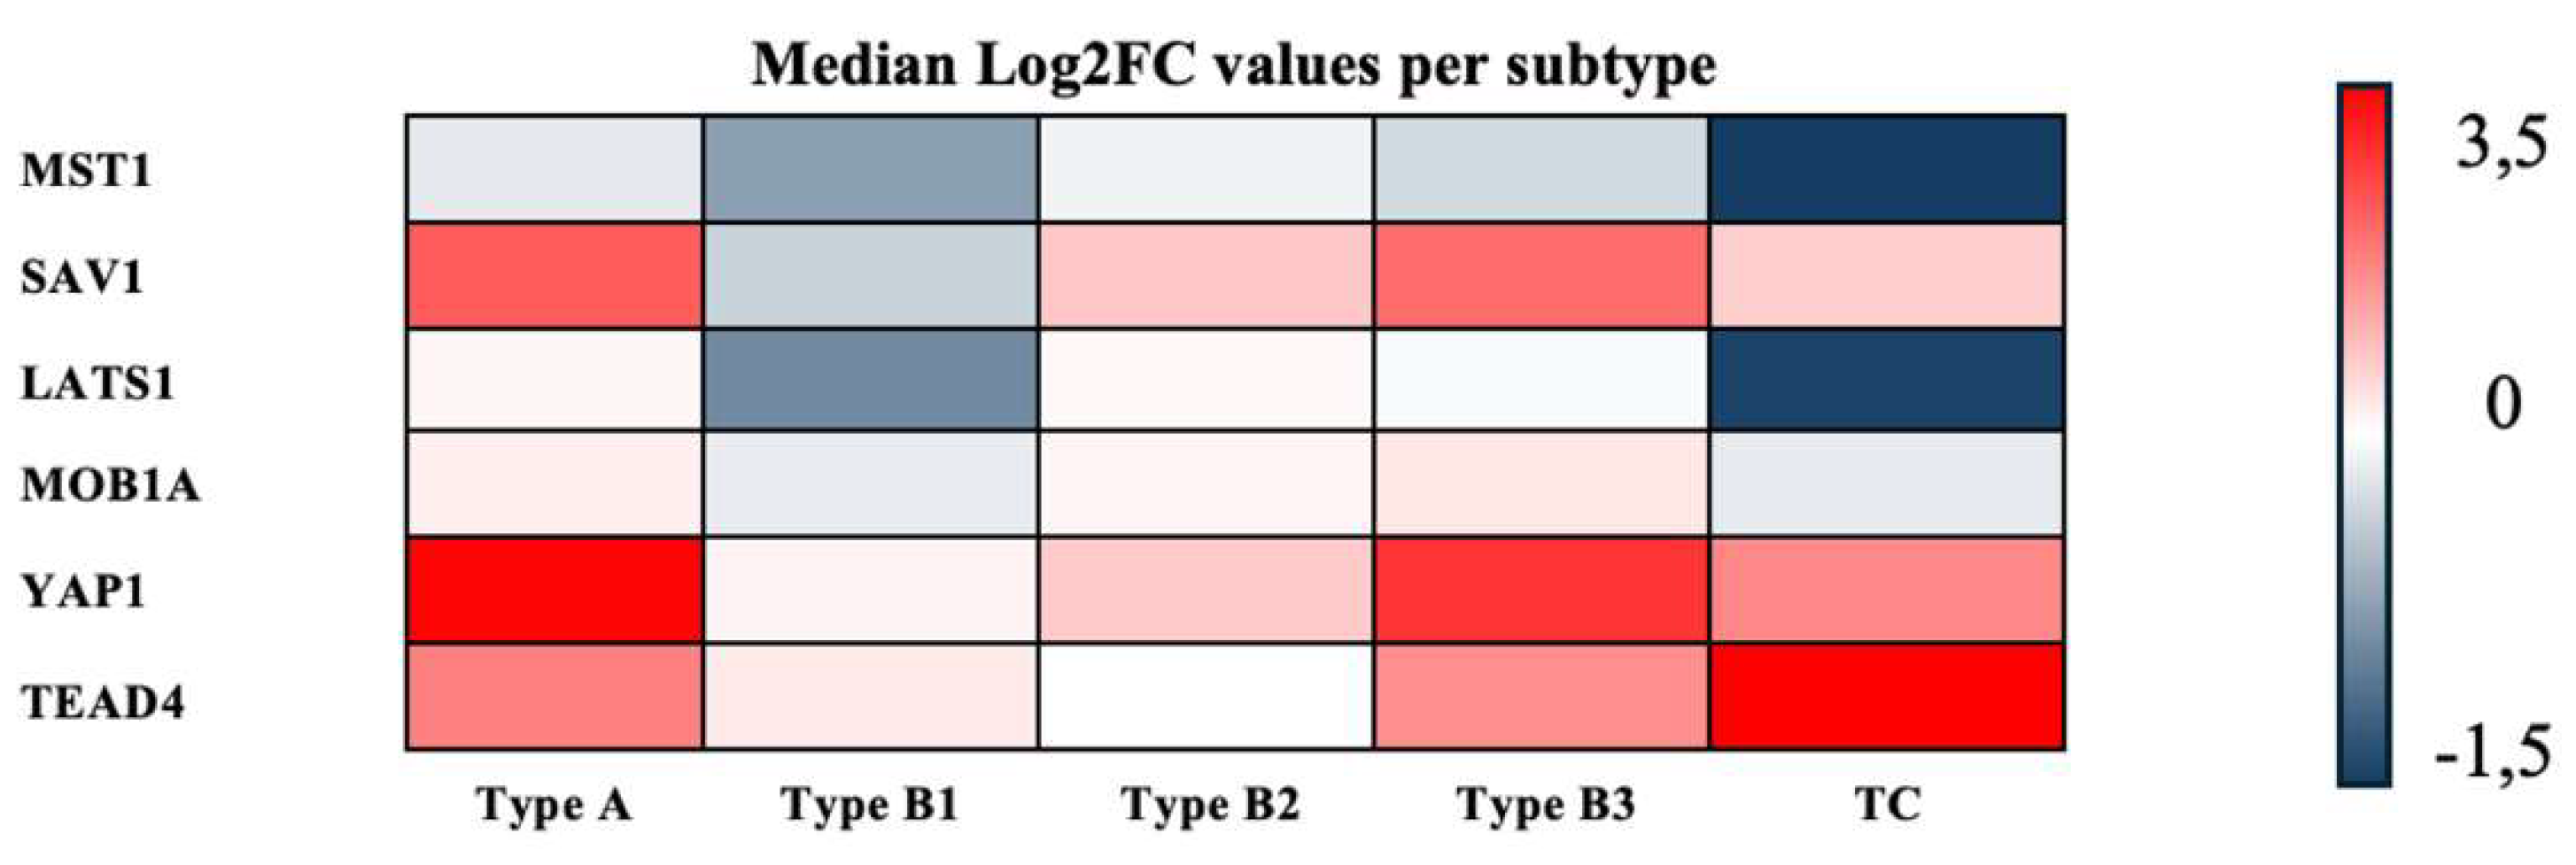

Table 1.
Clinicopathological characteristics of the 23 patients diagnosed with thymic epithelial tumors (TETs) included in the RT-qPCR cohort. Three additional samples of non-neoplastic thymus (N1–N3) served as normal reference tissue and are not listed.
Table 1.
Clinicopathological characteristics of the 23 patients diagnosed with thymic epithelial tumors (TETs) included in the RT-qPCR cohort. Three additional samples of non-neoplastic thymus (N1–N3) served as normal reference tissue and are not listed.
| Parameter | Median | Mix-Max | |
| Age (years) | 59 | 36-77 | |
| Tumor size (cm) | 7.5 | 2.4-13 | |
| Number | % | ||
| Gender | |||
| Male | 13 | 56.5 | |
| Female | 10 | 43.5 | |
| WHO subtypes | |||
| Type A | 3 | 13 | |
| Type B1 | 5 | 21.7 | |
| Type B2 | 5 | 21.7 | |
| Type B3 | 5 | 21.7 | |
| Thymic carcinoma (TC) | 5 | 21.7 | |
| Masoka-Koga stage* | |||
| I | 5 | 21.7 | |
| II | 9 | 39.1 | |
| III | 2 | 8.7 | |
| IVa | 3 | 13 | |
| IVb | 2 | 8.7 | |
| Presence of Myasthenia Gravis | 4 | 17.4 | |
| Event | |||
| Alive, cencored | 23 | 100 | |
| Dead | 0 | 0 | |
*For two samples Masoka-Koga stage was not available.
Table 2.
Results of the gene expression analysis of core Hippo pathway components in thymic epithelial tumors (TETs). Shown are sample-wise fold changes (FC, median N1/N3) and corresponding log2 fold change (log2FC) values for MST1, SAV1, LATS1, MOB1A, YAP1 and TEAD4 relative to normal thymus (N), with expression levels normalized to the housekeeping genes HPRT1 (RTP) and TBP. Fold-change values < 1 were interpreted as downregulation and values > 1 as upregulation compared with normal thymus; accordingly, log2FC values < 0 indicate downregulation and values > 0 indicate upregulation. N2 was excluded due to a benign cyst (labeled in red).
| Fold Change (FC) (Median N1/N3) | Log2FC | |||||||||||
| Sample (TET subtype) | MST1 | SAV1 | LATS1 | MOB1A | YAP1 | TEAD4 | MST1 | SAV1 | LATS1 | MOB1A | YAP1 | TEAD4 |
| 1 (N) | 1.42 | 0.92 | 1.12 | 0.95 | 0.91 | 0.84 | 0.51 | –0.13 | 0.16 | –0.07 | –0.13 | –0.26 |
| 2 (N)* | 1.34 | 1.53 | 1.76 | 1.13 | 2.25 | 0.94 | 0.42 | 0.62 | 0.82 | 0.18 | 1.17 | –0.08 |
| 3 (N) | 0.70 | 1.09 | 0.89 | 1.05 | 1.10 | 1.20 | –0.51 | 0.13 | –0.16 | 0.07 | 0.13 | 0.26 |
| 4 (A) | 2.66 | 2.52 | 1.09 | 1.68 | 3.98 | 2.17 | 1.41 | 1.34 | 0.13 | 0.75 | 1.99 | 1.12 |
| 5 (A) | 0.90 | 14.07 | 2.05 | 1.06 | 10.76 | 5.07 | –0.15 | 3.82 | 1.04 | 0.08 | 3.43 | 2.34 |
| 6 (A) | 0.50 | 4.76 | 1.09 | 1.17 | 13.11 | 3.33 | –1.01 | 2.25 | 0.13 | 0.22 | 3.71 | 1.74 |
| 7 (B1) | 0.58 | 0.72 | 0.94 | 0.91 | 1.08 | 1.24 | –0.78 | –0.48 | –0.09 | –0.13 | 0.11 | 0.31 |
| 8 (B1) | 0.64 | 1.54 | 0.56 | 0.78 | 1.84 | 1.28 | –0.65 | 0.63 | –0.83 | –0.37 | 0.88 | 0.36 |
| 9 (B1) | 0.98 | 1.15 | 1.15 | 0.78 | 1.50 | 0.75 | –0.03 | 0.20 | 0.20 | –0.36 | 0.59 | –0.41 |
| 10 (B1) | 0.48 | 0.80 | 0.52 | 1.15 | 1.13 | 2.13 | –1.07 | –0.32 | –0.93 | 0.20 | 0.18 | 1.09 |
| 11 (B1) | 0.62 | 0.56 | 0.38 | 0.98 | 0.73 | 0.62 | –0.68 | –0.82 | –1.40 | –0.02 | –0.45 | –0.69 |
| 12 (B2) | 1.13 | 1.20 | 1.08 | 0.89 | 1.57 | 0.88 | 0.17 | 0.26 | 0.10 | –0.16 | 0.65 | –0.19 |
| 13 (B2) | 0.64 | 1.60 | 0.75 | 1.04 | 1.67 | 0.27 | –0.65 | 0.67 | –0.42 | 0.05 | 0.74 | –1.90 |
| 14 (B2) | 0.76 | 1.74 | 0.53 | 1.11 | 2.68 | 1.01 | –0.39 | 0.80 | –0.91 | 0.15 | 1.42 | 0.01 |
| 15 (B2) | 0.94 | 4.38 | 1.26 | 1.21 | 4.34 | 4.97 | –0.09 | 2.13 | 0.33 | 0.28 | 2.12 | 2.31 |
| 16 (B2) | 0.96 | 1.72 | 1.09 | 1.22 | 1.28 | 1.39 | –0.06 | 0.78 | 0.13 | 0.29 | 0.35 | 0.48 |
| 17 (B3) | 0.69 | 2.70 | 0.98 | 1.24 | 4.15 | 1.38 | –0.53 | 1.44 | –0.03 | 0.31 | 2.05 | 0.47 |
| 18 (B3) | 2.10 | 3.96 | 1.50 | 1.47 | 6.86 | 0.96 | 1.07 | 1.99 | 0.59 | 0.56 | 2.78 | –0.06 |
| 19 (B3) | 0.76 | 4.03 | 0.58 | 0.96 | 5.61 | 3.84 | –0.40 | 2.01 | –0.78 | –0.06 | 2.49 | 1.94 |
| 20 (B3) | 1.15 | 7.54 | 1.10 | 2.05 | 12.79 | 5.21 | 0.20 | 2.92 | 0.14 | 1.04 | 3.68 | 2.38 |
| 21 (B3) | 0.83 | 6.57 | 0.80 | 1.25 | 7.15 | 2.93 | –0.26 | 2.72 | –0.32 | 0.33 | 2.84 | 1.55 |
| 22 (TC) | 0.43 | 3.67 | 0.74 | 0.73 | 3.11 | 4.83 | –1.21 | 1.88 | –0.43 | –0.45 | 1.64 | 2.27 |
| 23 (TC) | 0.07 | 0.57 | 0.14 | 2.30 | 3.23 | 17.48 | –3.83 | –0.81 | –2.87 | 1.20 | 1.69 | 4.13 |
| 24 (TC) | 0.38 | 0.82 | 0.63 | 0.91 | 1.40 | 3.05 | –1.38 | –0.28 | –0.67 | –0.14 | 0.48 | 1.61 |
| 25 (TC) | 0.26 | 1.59 | 0.33 | 0.71 | 0.96 | 11.22 | –1.93 | 0.67 | –1.62 | –0.49 | –0.06 | 3.49 |
| 26 (TC) | 0.52 | 2.17 | 0.39 | 0.96 | 3.19 | 12.19 | –0.94 | 1.12 | –1.34 | –0.06 | 1.67 | 3.61 |
Table 3.
Summary of subtype-specific median log2FC values for the core Hippo pathway components in TETs. Shown are the median expression changes for MST1, SAV1, LATS1, MOB1A, YAP1 and TEAD4 across the histological TET subtypes A, B1, B2, B3 and TC, calculated relative to normal thymus (N) and normalized to the housekeeping genes HPRT1 (RTP) and TBP. Median log2FC values < 0 were interpreted as downregulation and values > 0 as upregulation compared with normal thymus.
| MST1 | SAV1 | LATS1 | MOB1A | YAP1 | TEAD4 | |
|---|---|---|---|---|---|---|
| Thymoma Type A | –0.15 | 2.25 | 0.13 | 0.22 | 3.43 | 1.74 |
| Thymoma Type B1 | –0.68 | –0.32 | –0.83 | –0.13 | 0.18 | 0.31 |
| Thymoma Type B2 | –0.09 | 0.78 | 0.10 | 0.15 | 0.74 | 0.01 |
| Thymoma Type B3 | –0.26 | 2.01 | –0.03 | 0.33 | 2.78 | 1.55 |
| Thymus Carcinoma (TC) | –1.38 | 0.67 | –1.34 | –0.14 | 1.64 | 3.49 |
Disclaimer/Publisher’s Note: The statements, opinions and data contained in all publications are solely those of the individual author(s) and contributor(s) and not of MDPI and/or the editor(s). MDPI and/or the editor(s) disclaim responsibility for any injury to people or property resulting from any ideas, methods, instructions or products referred to in the content. |
© 2025 by the authors. Licensee MDPI, Basel, Switzerland. This article is an open access article distributed under the terms and conditions of the Creative Commons Attribution (CC BY) license (http://creativecommons.org/licenses/by/4.0/).
Copyright: This open access article is published under a Creative Commons CC BY 4.0 license, which permit the free download, distribution, and reuse, provided that the author and preprint are cited in any reuse.


