
Submitted:
18 December 2025
Posted:
19 December 2025
You are already at the latest version
Abstract
Amid COVID-19-related in-person school closures in 2021, an agent-based simulation grounded in social impact theory was implemented and documeted to investigate the effects of in-person school closure on nonmedical prescription opioid use among adolescents in Ontario, Canada. The results of model simulations forecasted an alarming rebound effect in the opioid use prevalence after the lifting of in-person school closures and identified secure medication storage in households as an effective strategy for mitigating associated risks. This study evaluates this result by comparing the baseline projection from the previously published study with newly released 2023 data from the Ontario Student Drug Use and Health Survey. Furthermore, it employs the developed agent-based model to simulate the projection through 2030 and assesses the efficacy of secure medication storage in households for the coming years. The study confirms that the previously published simulation projection for 2023 closely aligns with observed data, showing nonmedical prescription opioid use prevalence among Ontario adolescents nearly doubling from 2021 to 2023. Additionally, the results show that nonmedical prescription opioid use prevalence among youth is projected to remain at these elevated levels. Critically, the findings suggest that the temporal window for effective secure medication storage interventions has elapsed, and these interventions are now expected to have minimal impact on reducing this increase, even when applied extensively. The agreement between reported predictions and observed data demonstrates that a simulation model with relevant conceptual foundation can accurately predict future trends and provide sufficient lead time for policymakers to implement interventions within critical time-sensitive windows to alter undesirable trajectories before public health crises escalate.
Keywords:
agent‐based modeling
; social impact theory
; forecast validation
; youth
; nonmedical prescription opioid use
; in‐person school closures
1. Introduction
The COVID-19 pandemic disrupted various aspects of adolescent life, particularly through in-person school closures [1,2,3]. By April 2020, most Canadian schools had closed their physical campuses, and shift to online learning for students [4,5]. In-person school closures were implemented with the goal of mitigating the direct health effects of the COVID-19 pandemic; however, their broader impacts on youth quality of life were less immediately recognized [6,7]. The combination of increased stress, isolation during in-person school closures, and spending more time at home could potentially affect youth wellbeing [8,9,10,11] and substance use [12,13,14] during this period.
One of the most readily available substances with potential for misuse in many Canadian households is prescription opioids [15,16]. Nonmedical prescription opioid use is defined as the use of prescription pain medications without a prescription or in ways other than prescribed [17]. This type of misuse has been a persistent public health challenge among North American adolescents [18,19]. The availability of prescription opioids in family medicine cabinets makes them particularly accessible to youth. Additionally, adolescents may perceive prescription opioids as safe for recreational use because they are legitimate medications, in contrast to illicit opioids such as heroin or fentanyl [20,21].
COVID-19-related in-person school closures caused youth to spend more time at home, and therefore access patterns to prescription opioids potentially changed. Although parental supervision increased, parents had to balance their own work responsibilities and could not consistently monitor youth access to controlled medications. Furthermore, youth mental health challenges intensified as in-person peer interactions were minimized [22,23,24] . Understanding how the interplay of substance availability, peer influences, and family dynamics would simultaneously influence youth nonmedical prescription opioid use required a methodology that could capture these multifaceted interactions [25].
Traditional statistical methods in substance use research require extensive historical data to identify past patterns [26]. Although such methods can incorporate covariates and control for confounding, they describe relationships as they have previously occurred. Therefore, standard statistical approaches such as regression models, time-series analyses, and other traditional techniques have limitations when forecasting future patterns and have limited capacity to represent how these relationships may change under novel conditions [27,28,29].
These constraints necessitate the use of methodologies that are capable of characterising the causal mechanisms underlying observed trends in real-world contexts. These methodologies should represent multifaceted dynamic, and provide a structure to test hypothetical interventions and explore counterfactual scenarios. Computational simulation models are well known to fulfill these requirements [30,31,32]. Two established frameworks in this space are System Dynamics Models (SDM) [33] and Agent-Based Models (ABM) [34].
System dynamics models are capable of studying feedback loops at the aggregate-level, and are well suited for capturing population-level trends. The Susceptible–Infected–Recovered (SIR) model [35], as a famous System dynamics model, excels at capturing disease transmission at an aggregated level. However, SIR model does not have any structure related to individual decision-making processes and is therefore unable to fully represent the complex social dynamics of human behavior [36]. In contrast, agent-based models offer a bottom-up modeling approach by simulating individual agents with their own characteristics (i.e., heterogeneities) who interact within an environment, resulting in aggregate patterns. Therefore, agent-based models empower researchers to observe how macro-level patterns emerge from micro-level interactions based on individual decision rules and agent behaviors [37,38].
Several studies have employed agent-based simulations to examine how peer networks shape substance use behaviors among adolescents [39,40,41,42]. However, these studies have incorporated the complex dynamics of social network structures in stable social contexts. Notably, in-person school closures during the COVID-19 pandemic disrupted this stability [43], creating unprecedented circumstances for youth. Despite the use of agent-based models in some studies to investigate social network disruptions among youth during the COVID-19 pandemic [44,45], these models concentrated on controlling disease transmission.
Several statistical studies have documented changes in adolescent substance use during the COVID-19 pandemic using self-reported survey data [14,46,47]. However, due to the lack of simulation models in this area, future trajectories remained unclear, as standard statistical methods were unable to project patterns under evolving conditions [48,49]. Consequently, these limitations make computational simulation models an absolute necessity for projecting the future of adolescent substance use beyond the COVID-19 pandemic. To our knowledge, beyond our earlier work [50], there is no published study in the literature that has employed agent-based modelling methodology to generate projections of adolescent substance use trajectories following the lifting of in-person school closures during the COVID-19 pandemic. Furthermore, validation of computational simulation projections against subsequently released empirical data remains rare in the literature, constraining the ability to assess whether the published studies capture the underlying causal processes.
In 2021, amid ongoing uncertainty about in-person school closures, reopening timelines, and their long-term consequences for youth nonmedical prescription opioid use, we published a study [50] in which we developed an agent-based simulation model grounded in social impact theory [51] to project how in-person school closures might influence youth opioid use patterns in the coming years. The agent-based model was parameterized using data from the 2019 Ontario Student Drug Use and Health Survey (OSDUHS) [52,53]. The current study evaluates how closely the prior study’s projections align with newly released 2023 OSDUHS [54] and further extends the model to simulate these projections through 2030 and analyze policy intervention scenarios.
2. Materials and Methods
This study extends our previously developed agent-based simulation [50], which drew on the social impact model of opinion formation [55,56]. The prior study [50] was developed to explore how peer networks, household opioid availability, and socio-cultural environment influence the prevalence of nonmedical prescription opioid use among youth, their prescription opioid resources, and the frequency of nonmedical prescription opioid use within the past year. The Ontario Student Drug Use and Health Survey (OSDUHS) [52,53] was the main source for parameterization and calibration. The model was implemented using the simulation software AnyLogic Version 8.8.0 [57] and run daily for a time horizon from 2017 to 2025. For the purposes of this study, the existing agent-based modeling framework was retained without structural modification, and the projection horizon was extended through 2030 to assess long-term trends and intervention scenarios. The following section provides an overview of the agent-based model structure and scenarios. Further details on the formulation drawn from the opinion dynamics literature [58,59] and on the severity of acute withdrawal symptoms for opioid drugs [60] , which are incorporated into the model implementation, can be found in the prior manuscript [50].
The agent-based model includes three agent types representing youth, family, and socio-cultural environment. The model simulates a virtual population of Ontario adolescents with 10,000 youth agents. Youth agents are embedded within family units, each represented by a family agent. The socio-cultural environment is a simplified representation of youth neighborhoods, recreational areas, social events, and other contextual factors that influence adolescents’ attitudes toward drug use. The spatial architecture of the model is based on a cellular automata structure [61,62] , with a three-level design that captures social networks across the three different agent types. Social network density for youth and their peers is variable based on in-person school closures and reopening, implemented through Moore neighborhoods [63] with different diameters.
Youth agents transition through behavioral states represented by three individual state charts named: Youth Drug Use Opinion Evidence Base state chart, Frequency of Drug Use in Past Year state chart, and Drug Source state chart (see Figure 1). Social impact theory provides the theoretical foundation for triggering transitions between the states of the Youth Drug Use Opinion Evidence Base state chart. To integrate social impact model of opinion formation within the agent-based model, each youth agent possesses two independent attributes: persuasiveness (capacity to influence peers toward attitude change to become similar to self) and supportiveness (ability to reinforce existing attitudes among like-minded peers). Initial decisions emerge from the cumulative social impact across peer interactions, family environment, and the influence of the socio-cultural environment. When this aggregate influence exceeds the minimum threshold, a youth initiates nonmedical prescription opioid use. This initiation mechanism applies to youth without prior opioid use exposure, as those without prior opioid use exposure have not yet experienced acute opioid withdrawal symptoms that could affect decision-making regarding opioid use.
Following initial nonmedical prescription opioid use, youth behavior regarding opioid use continues to be shaped by all three previously discussed factors; however, an additional physiological dimension, implemented as the severity of acute opioid withdrawal symptoms, also influences youth behavior in this regard. The severity of acute opioid withdrawal symptoms, characterized by a lognormal function of days since the last dose, can either reinforce continued use or motivate cessation attempts [60]. The Frequency of Drug Use in Past Year state chart updates continuously to monitor the cumulative number of nonmedical prescription opioid use events for a youth agent over the past year. The Drug Source state chart represents the primary origins of a youth’s most recent prescription opioid acquisition, distinguishing among family sources, peer sources, and an unspecified category. Access to family-sourced opioids is possible for youth when at least one household member holds a legitimate prescription. In the absence of a family source, youth may obtain opioids from peers within their immediate social network. Any remaining sources of opioids are classified under the unspecified category. Further details on the formulation drawn from the opinion dynamics literature [58,59] and on the severity of acute withdrawal symptoms for opioid drugs [60] , which are incorporated into the model implementation, can be found in [50].
The parameterization and calibration procedures remain unchanged from the prior study [50], consistent with the goal of evaluation of its reported projections. These procedures draw extensively on the Ontario Student Drug Use and Health Survey (OSDUHS) [52,53] to characterize dynamics of nonmedical prescription opioid use among youth in Ontario. A complete description of the model’s parameterization and calibration procedures is fully documented in the prior study [50].
The first part of this study validated the accuracy of the prior study’s predictions regarding the prevalence of nonmedical prescription opioid use among Ontario adolescents in 2023. The agent-based model presented in [50] was calibrated using data from the Ontario Student Drug Use and Health Survey (OSDUHS) through 2021 [52,53] and subsequently generated projections until 2025, incorporating Ontario’s in-person school closure timeline during the COVID-19 pandemic. The current paper evaluated these projections by comparing the reported results for the prevalence of nonmedical prescription opioid use among Ontario adolescents with newly released OSDUHS [54] which incorporate 2023 data.
The second component of this study extended the model projections through 2030 to assess safe medicine storage intervention effectiveness on future nonmedical prescription opioid use prevalence among Ontario adolescents. Three levels of intervention were implemented as 20%, 50%, and 80% reductions in youth household opioid exposure, beginning in 2027. For each intervention level, 100 different realizations were executed to generate a sample of potential outcomes, given a set of inputs. Each simulation began with a 3-year burn-in period to establish equilibrium conditions consistent with empirical observations. Then, each simulation was run for a time horizon from 2017 to the end of 2030. Outcomes of interest were plotted daily to compare scenarios and characterize temporal trajectories.
3. Results
This section presents the results of the agent-based simulation model. A Monte Carlo simulation approach was employed to characterize uncertainty in the results. Each scenario was executed for 100 runs to represent a set of independent simulations with randomly sampled inputs. This approach will result in a probabilistic assessment of the outcomes. The results in this section are organized into three parts: the first part validates the prior study’s predictions for the prevalence of nonmedical prescription opioid use among Ontario adolescents against newly released 2023 Ontario Student Drug Use and Health Survey (OSDUHS); the second part provides baseline projections for the prevalence of nonmedical prescription opioid use among Ontario adolescents through 2030; and the third part evaluates the impact of three levels of reductions (20%, 50%, and 80%) in youth household opioid exposure on the prevalence of nonmedical prescription opioid use among Ontario adolescents, which are introduced at the beginning of 2027.
3.1. Validation of Prior Published Results Against Newly Released 2023 Ontario Student Drug Use and Health Survey (OSDUHS)
Figure 2 presents the model-generated prevalence of nonmedical prescription opioid use among Ontario adolescents from 2017 through 2025, as published in the prior study [50], alongside reported empirical OSDUHS data on the percentage of Ontario adolescents reporting past-year nonmedical use of opioid pain relievers from 2007 to the newly released 2023 data [54]. The two vertical black arrows in Figure 2a indicate the start and end of the Ontario school closure timeline. Blue dots in Figure 2a represent empirical data extracted from OSDUHS on the prevalence of nonmedical prescription opioid use among Ontario adolescents, which were used to validate the model-generated prevalence for 2017, 2019, and 2021, when the prior study was conducted. A comparison of Figure 2a and Figure 2b highlights that the trajectory, magnitude and time course of the model-generated prevalence of nonmedical prescription opioid use among Ontario adolescents in 2023 closely align with the OSDUHS empirical data (an absolute error of approximately 5%). This result suggests that the model effectively captures impacts of in-person school closures on nonmedical opioid use among youth and provides reliable predictive quality under previously unobserved circumstances.
It is also important to note that OSDUHS provides only discrete measurements every two years; therefore, four data points are available between the beginning of 2017 and the end of 2023. The published graph in the OSDUHS [54]( p. 13) provides linear interpolation between these points, and based on this interpretation, the 2021–2023 data suggest a gradual, steady increase in the percentage of Ontario adolescents reporting past-year nonmedical use of opioid pain relievers. In contrast, the model-generated prevalence is updated daily, producing 2,557 temporal data points over the same period. This high-resolution output allows the model to reveal underlying dynamics in nonmedical prescription opioid use prevalence that remain invisible in OSDUHS. As shown in Figure 2b, the model-generated results reveal a nonlinear trajectory in adolescent nonmedical opioid use, which appears to be governed by the phases of school closures. During the COVID-19 pandemic, Ontario experienced multiple phases of school closures and reopening [5]: initial closures from March to June 2020, phased and localized reopening followed by additional full closures in 2021 that lasted more than six months, and the full province-wide reopening on January 17, 2022. The model reflects these dynamics, showing a gradual rise during the early reopening–closure cycles, a sudden decline during the extended closures, and a rapid rebound following full reopening. Cross-sectional surveys alone, such as OSDUHS, cannot capture the complex dynamics of how multiple levels of social network disruptions influence opioid-use patterns; this finding underscores the essential role of simulation models.
3.2. Extended Model-Generated Projections Of Nonmedical Prescription Opioid Use Prevalence Among Ontario Adolescents Through 2030
Figure 3 depicts the model-generated projections of nonmedical prescription opioid use prevalence among Ontario adolescents through 2030 under the baseline scenario. The simulation indicates that prevalence will continue to increase gradually from 2023 to 2030, reaching levels approximately 1.5 times higher by the end of the decade. While this increase is less pronounced than the 2021–2023 surge, the persistent upward trend in nonmedical prescription opioid use prevalence among Ontario adolescents remains concerning.
3.2. Investigating Impact of Reductions in Youth Household Opioid Exposure Through Safe mediecin Storage Scenarios
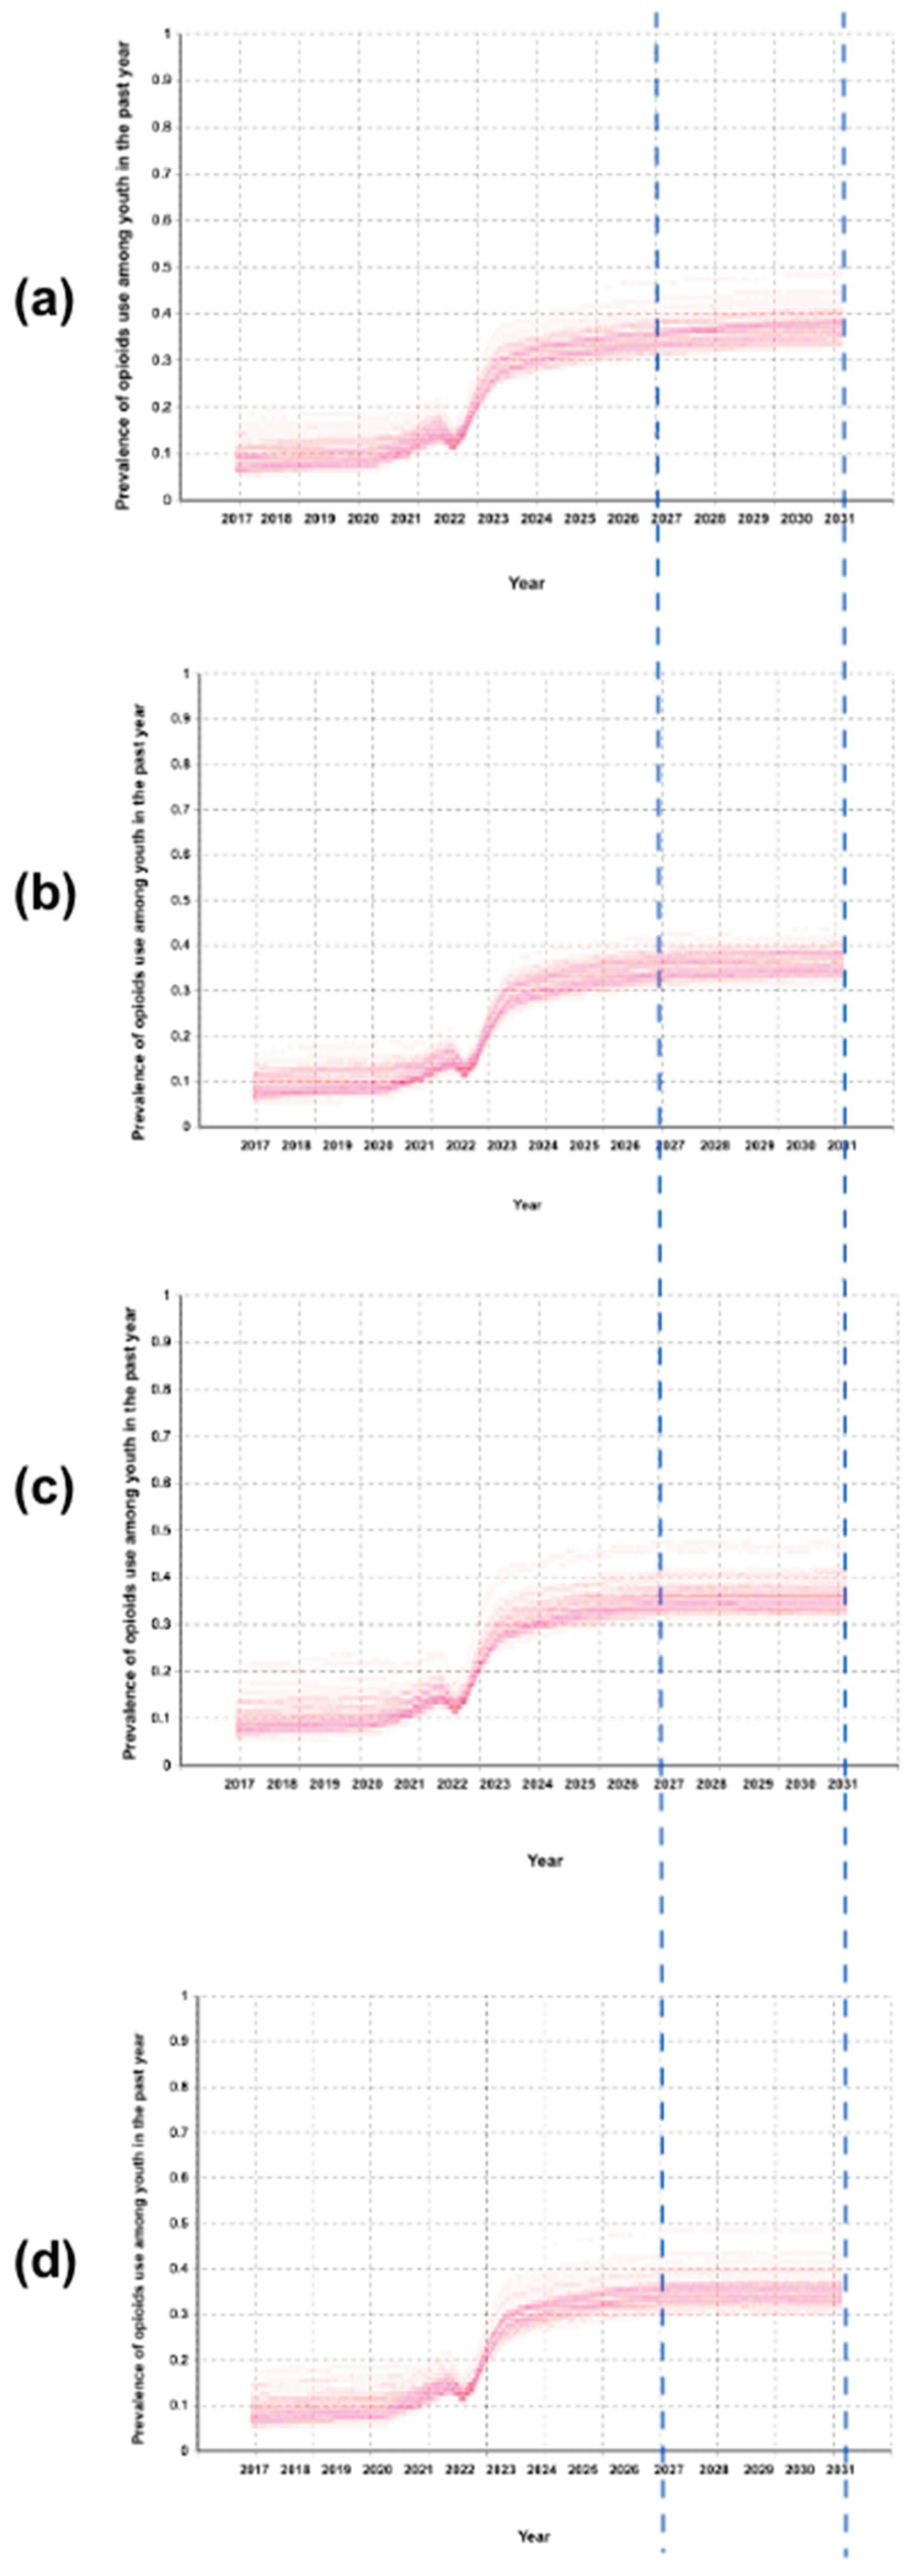
Figure 4 displays a comparison of the model-generated for the prevalence of youth nonmedical prescription opioid use under the implementation of safe medicine storage interventions at the beginning of 2027. The two blue dashed lines indicate the intervention period, shown for comparison across all panels in Figure 4. Figure 4a presents the baseline scenario representing the prevalence of youth nonmedical prescription opioid use without any intervention, providing a reference for comparison with alternative scenarios. Figure 4b shows the model-generated prevalence of youth exhibiting nonmedical prescription opioid use in the past year after applying a 20% reduction in youth exposure to prescription opioids at home at the beginning of 2027. Figure 4c shows the model-generated prevalence of youth exhibiting nonmedical prescription opioid use in the past year after applying a 50% reduction in youth exposure to prescription opioids at home at the beginning of 2027. Figure 4d shows the model-generated prevalence of youth exhibiting nonmedical prescription opioid use in the past year after applying an 80% reduction in youth exposure to prescription opioids at home at the beginning of 2027. The model’s results indicate that decreasing youth exposure to prescription opioids even by the highest level of 80% leads to only a small reduction (5%) in the prevalence of nonmedical prescription opioid use among youth in 2030 compared to the baseline. This small reduction in the model-generated prevalence of youth opioid use after applying the intervention by 2027 suggests that peer networks and social influence factors have already become sufficiently established to sustain elevated opioid use patterns largely independent of household opioid availability.
4. Discussion
The OSDUHS data documented that the percentage of Ontario adolescents reporting past-year nonmedical use of opioid pain relievers nearly doubled from 2021 to 2023, returning to levels not seen since 2007 [54]. The projected trajectory results generated by the model in the prior study [50], which showed an overshoot in adolescent nonmedical prescription opioid use prevalence after the lifting of in-person school closures, were confirmed by these empirical data from OSDUHS. Furthermore, the findings indicate that the prevalence of nonmedical prescription opioid use among youth is expected to remain at elevated levels. Importantly, the results suggest that the optimal time window for effective secure medicine storage interventions has passed.
These results carry important implications for computational modeling of substance use behaviors. First, this agent-based model grounded in social impact theory could simulate reliable predictions about nonmedical opioid use during unprecedented circumstances. Validation of the findings from the prior study demonstrated that the developed agent-based model’s underlying mechanisms captured the fundamental dynamics of how youth nonmedical prescription opioid use behaviors may spread through peer networks. These underlying mechanisms represented through social impact theory and the severity of acute opioid withdrawal symptoms. The agreement between projections and observed data indicates that the agent-based model captures actual causal processes rather than curve-fitting, as it reproduces prevalence levels comparable to those observed in 2007, which were outside the calibration period for the simulation model. While there is a 5% discrepancy between the empirical data and the reported result, drug use is often considered a complex human behavior [64,65], and the model’s ability to reproduce the overall direction, magnitude, and timing of observed trends represents a strong qualitative fit, which is often more important for agent-based models than exact numerical precision.
Second, this study demonstrates how simulation modeling temporal resolution offers a valuable means to overcome the constraints of observational data collection. Given that empirical data in OSDUHS are collected only every two years, traditional analyses rely solely on linear interpolation between these discrete measurement points and characterize the change as escalation between 2021 and 2023 in the prevalence of nonmedical opioid use among youth. However, the simulation’s temporal resolution yields a continuous understanding of youth nonmedical prescription opioid use trends, highlighting a rebound effect resulting from marked fluctuations between these data collection points.
Finally, the model shows that delaying safe medicine storage intervention until 2027 greatly reduces its impact on decreasing the prevalence of nonmedical prescription opioid use, with even very large reductions producing smaller effects compared with larger reductions if implemented earlier [50]. The findings highlight that the value of validated simulation models extends beyond retrospective explanation to forward-looking projection, enabling proactive rather than reactive policy responses through early reliance.
While this simulation model’s successful prediction of the 2023 lends confidence to its projections, the newly projected results should be interpreted with caveats. The current simulation model represents peer networks in a stylized way (i.e., three-level cellular automata) for a close youth population that could capture key features of youth interaction, however, it does not include several aspects of real relationships. The implemented closed youth population does not allow new members to enter, and this study does not account for the influence of online social networks. Furthermore, this study focuses on changes in social influence during in-person school closures and does not account for any new conditions in subsequent years. Although the baseline projection through 2030 indicates a gradual increase in the prevalence of nonmedical prescription opioid use among adolescents, any new influential factors introduced in subsequent years may alter this trajectory over the long term. Specially, youth who use prescription opioids may also experiment with other substances or switch to different ones, particularly as socialization opportunities expand and opioid availability is disrupted. The study focuses specifically on how youth opioid use is affected by peer networks and does not capture the full complexity of newly introduced conditions.
Overall, reliable forecasting of the evolution of complex systems, including drug use patterns, is widely recognized as a major research challenge within systems science [49,66,67], and validating simulation projections against newly released data represents a valuable opportunity to enhance knowledge transfer within the computational modeling community and, as a result, advance the field of modeling. To strengthen forecasting capabilities, simulation modelers are encouraged to compare their published projections against emerging empirical data and explain any observed concordance or discrepancies. Journal editors are well positioned to support this process by establishing dedicated publication channels for validation studies and promoting transparent modeling practices. These efforts can ultimately facilitate integrating simulation models into anticipatory decision-making and designing affective public health interventions.
5. Conclusions
The post–in-person school closures forecasts of adolescent nonmedical prescription opioid use generated by the agent-based model grounded in social impact theory predicted an escalating trend, which has now been validated by empirical evidence. The simulation outcomes forecasted a rapid rebound following the lifting of in-person school closures, and this phenomenon has been confirmed by the 2023 OSDUHS. Furthermore, the results highlight a continued gradual increase in the model-generated prevalence of nonmedical prescription opioid use among Ontario adolescents, and indicate that safe storage interventions become less effective. This result suggests that peer networks and social influence have well-established as the primary factors driving opioid use among youth. These findings further emphasize the critical importance of implementing preventive measures during the limited timeframe when they can still impactfully alter trajectories.
Funding
This research received no external funding.
Informed Consent Statement
Not applicable.
Data Availability Statement
The data presented in this study are openly available at www.camh.ca/osduhs (accessed on 8 December 2025). The implemented model can be found at https://doi.org/10.5281/zenodo.7559419. (The implementation of the initial model was conducted as part of the author’s PhD research at the University of Saskatchewan.).
Conflicts of Interest
The author declares no conflicts of interest.
Abbreviations
The following abbreviations are used in this manuscript:
| COVID-19 | COronaVIrus Disease 2019 |
| OSDUHS | Ontario Student Drug Use and Health Survey |
| SDM | System Dynamics Model |
| ABM | Agent-Based Model |
| SIR model | Susceptible–Infected–Recovered model |
References
- Vaillancourt, T.; McDougall, P.; Comeau, J.; Finn, C. COVID-19 School Closures and Social Isolation in Children and Youth: Prioritizing Relationships in Education. Facets 2021, 6, 1795–1813. [Google Scholar] [CrossRef]
- Aurini, J.; Davies, S. COVID-19 School Closures and Educational Achievement Gaps in Canada: Lessons from Ontario Summer Learning Research. Canadian Review of Sociology/Revue canadienne de sociologie 2021, 58, 165–185. [Google Scholar] [CrossRef]
- Gadermann, A.; Thomson, K.; Gill, R.; Schonert-Reichl, K.A.; Gagné Petteni, M.; Guhn, M.; Warren, M.T.; Oberle, E. Early Adolescents’ Experiences during the COVID-19 Pandemic and Changes in Their Well-Being. Frontiers in public health 2022, 10, 823303. [Google Scholar] [CrossRef]
- LaBonte, R.; Barbour, M.K.; Mongrain, J. Teaching during Times of Turmoil: Ensuring Continuity of Learning during School Closures. In A Special Report of the Canadian eLearning Network; 2022; pp. 1–72. [Google Scholar]
- Gallagher-Mackay, K.; Srivastava, P.; Underwood, K.; Dhuey, E.; McCready, L.; Born, K.; Maltsev, A.; Perkhun, A.; Steiner, R.; Barrett, K. COVID-19 and Education Disruption in Ontario: Emerging Evidence on Impacts. 2021. [Google Scholar] [CrossRef]
- Hartney, M.T.; Finger, L.K. Politics, Markets, and Pandemics: Public Education’s Response to COVID-19. Perspectives on Politics 2022, 20, 457–473. [Google Scholar] [CrossRef]
- Esposito, S.; Principi, N. School Closure during the Coronavirus Disease 2019 (COVID-19) Pandemic: An Effective Intervention at the Global Level? JAMA pediatrics 2020, 174, 921–922. [Google Scholar] [CrossRef] [PubMed]
- Gervais, C.; Côté, I.; Lampron-deSouza, S.; Barrette, F.; Tourigny, S.; Pierce, T.; Lafantaisie, V. The COVID-19 Pandemic and Quality of Life: Experiences Contributing to and Harming the Well-Being of Canadian Children and Adolescents. International journal on child maltreatment: research, policy and practice 2023, 6, 453–475. [Google Scholar] [CrossRef] [PubMed]
- Viner, R.; Russell, S.; Saulle, R.; Croker, H.; Stansfield, C.; Packer, J.; Nicholls, D.; Goddings, A.-L.; Bonell, C.; Hudson, L. School Closures during Social Lockdown and Mental Health, Health Behaviors, and Well-Being among Children and Adolescents during the First COVID-19 Wave: A Systematic Review. JAMA pediatrics 2022, 176, 400–409. [Google Scholar] [CrossRef] [PubMed]
- Ravens-Sieberer, U.; Kaman, A.; Otto, C.; Adedeji, A.; Devine, J.; Erhart, M.; Napp, A.-K.; Becker, M.; Blanck-Stellmacher, U.; Löffler, C. Mental Health and Quality of Life in Children and Adolescents during the COVID-19 Pandemic—Results of the COPSY Study. Deutsches Ärzteblatt International 2020, 117, 828. [Google Scholar]
- Houghton, S.; Kyron, M.; Hunter, S.C.; Lawrence, D.; Hattie, J.; Carroll, A.; Zadow, C. Adolescents’ Longitudinal Trajectories of Mental Health and Loneliness: The Impact of COVID-19 School Closures. Journal of adolescence 2022, 94, 191–205. [Google Scholar] [CrossRef]
- Chin, J.; Di Maio, J.; Weeraratne, T.; Kennedy, K.; Oliver, L.; Bouchard, M.; Malhotra, D.; Habashy, J.; Ding, J.; Bhopa, S. Resilience in Adolescence during the COVID-19 Crisis in Canada. BMC Public Health 2023, 23, 1097. [Google Scholar] [CrossRef] [PubMed]
- Lundahl, L.H.; Cannoy, C. COVID-19 and Substance Use in Adolescents. Pediatric Clinics of North America 2021, 68, 977. [Google Scholar] [CrossRef]
- Dumas, T.M.; Ellis, W.E.; Van Hedger, S.; Litt, D.M.; MacDonald, M. Lockdown, Bottoms up? Changes in Adolescent Substance Use across the COVID-19 Pandemic. Addictive behaviors 2022, 131, 107326. [Google Scholar] [CrossRef]
- Nigatu, Y.T.; Wells, S.; Buckley, L.; Quilty, L.C.; Bozinoff, N.; Ali, F.; Imtiaz, S.; Hamilton, H.A. Non-Medical Use of Prescription Opioids: Use to Experience Subjective Effects vs. Other Non-Medical Use among Adults in Ontario, Canada from 2020 to 2024. Journal of Studies on Alcohol and Drugs 2025, jsad–25. [Google Scholar] [CrossRef]
- Jones, W.; Kaoser, R.; Rudoler, D.; Fischer, B. Trends in Dispensing of Individual Prescription Opioid Formulations, Canada 2005–2020. Journal of pharmaceutical policy and practice 2022, 15, 27. [Google Scholar] [CrossRef]
- Cochran, G.; Woo, B.; Lo-Ciganic, W.-H.; Gordon, A.J.; Donohue, J.M.; Gellad, W.F. Defining Nonmedical Use of Prescription Opioids within Health Care Claims: A Systematic Review. Substance abuse 2015, 36, 192–202. [Google Scholar] [CrossRef] [PubMed]
- Collins, E.A. Understanding the Risk Factors and Lived Experiences of Prescription Drug Abuse among Canadian Children and Adolescents: A Retrospective Phenomenological Study. Journal of Child & Adolescent Substance Abuse 2019, 28, 266–275. [Google Scholar] [CrossRef]
- Robinson, C.A.; Wilson, J.D. Management of Opioid Misuse and Opioid Use Disorders among Youth. Pediatrics 2020, 145, S153–S164. [Google Scholar] [CrossRef]
- Calihan, J.; Matson, P.; Alinsky, R. The Adolescent and the Medicine Cabinet; 2021. [Google Scholar]
- Seamans, M.J.; Carey, T.S.; Westreich, D.J.; Cole, S.R.; Wheeler, S.B.; Alexander, G.C.; Pate, V.; Brookhart, M.A. Association of Household Opioid Availability and Prescription Opioid Initiation among Household Members. JAMA internal medicine 2018, 178, 102–109. [Google Scholar] [CrossRef]
- Ferguson, K.N.; Coen, S.E.; Tobin, D.; Martin, G.; Seabrook, J.A.; Gilliland, J.A. The Mental Well-Being and Coping Strategies of Canadian Adolescents during the COVID-19 Pandemic: A Qualitative, Cross-Sectional Study. Canadian Medical Association Open Access Journal 2021, 9, E1013–E1020. [Google Scholar] [CrossRef]
- Hussong, A.; Midgette, A.; Thomas, T.; Coffman, J.; Cho, S. Coping and Mental Health in Early Adolescence during COVID-19. Research on Child and Adolescent Psychopathology 2021, 49(9), 1113–1123. [Google Scholar] [CrossRef] [PubMed]
- Magson, N.R.; Freeman, J.Y.; Rapee, R.M.; Richardson, C.E.; Oar, E.L.; Fardouly, J. Risk and Protective Factors for Prospective Changes in Adolescent Mental Health during the COVID-19 Pandemic. Journal of youth and adolescence 2021, 50, 44–57. [Google Scholar] [CrossRef] [PubMed]
- Kaur, L.; Tadros, E.; Patton, R. The Role of Family in Youth Opioid Misuse: A Literature Review. The Family Journal 2019, 27, 429–442. [Google Scholar] [CrossRef]
- Volkow, N.D.; Blanco, C. Research on Substance Use Disorders during the COVID-19 Pandemic. Journal of Substance Abuse Treatment 2021, 129, 108385. [Google Scholar] [CrossRef]
- Kruger, D.J.; Kirk, H.M.; Leonard, K.E.; Lynch, J.J.; Nielsen, N.; Clemency, B.M. Assessing Challenges and Solutions in Substance Abuse Prevention, Harm Reduction, and Treatment Services in New York State. SSM-Health Systems 2024, 3, 100039. [Google Scholar] [CrossRef]
- Panos, G.D.; Boeckler, F.M. Statistical Analysis in Clinical and Experimental Medical Research: Simplified Guidance for Authors and Reviewers. Drug design, development and therapy 2023, 1959–1961. [Google Scholar] [CrossRef]
- Rajula, H.S.R.; Verlato, G.; Manchia, M.; Antonucci, N.; Fanos, V. Comparison of Conventional Statistical Methods with Machine Learning in Medicine: Diagnosis, Drug Development, and Treatment. Medicina 2020, 56, 455. [Google Scholar] [CrossRef]
- Holland, J.H. Complex Adaptive Systems. Daedalus 1992, 121, 17–30. [Google Scholar]
- Pritsker, A.A.B. Why Simulation Works. In Proceedings of the Proceedings of the 21st conference on Winter simulation, 1989; pp. 1–9. [Google Scholar]
- Fowler, A. Systems Modelling, Simulation, and the Dynamics of Strategy. Journal of Business Research 2003, 56, 135–144. [Google Scholar] [CrossRef]
- Richardson, G.P.; Pugh, A.L., III. Introduction to System Dynamics Modeling with DYNAMO. Journal of the Operational Research Society 1997, 48, 1146–1146. [Google Scholar] [CrossRef]
- Railsback, S.F.; Grimm, V. Agent-Based and Individual-Based Modeling: A Practical Introduction; Princeton university press, 2019; ISBN 0-691-19004-6. [Google Scholar]
- Diekmann, O.; Heesterbeek, J.A.P. Mathematical Epidemiology of Infectious Diseases: Model Building, Analysis and Interpretation; John Wiley & Sons, 2000; Vol. 5, ISBN 0-471-49241-8. [Google Scholar]
- Bergstrom, C.T.; Hanage, W.P. Human Behavior and Disease Dynamics. Proceedings of the National Academy of Sciences 2024, 121, e2317211120. [Google Scholar] [CrossRef]
- Williams, R.A. Lessons Learned on Development and Application of Agent-Based Models of Complex Dynamical Systems. Simulation Modelling Practice and Theory 2018, 83, 201–212. [Google Scholar] [CrossRef]
- Marshall, B.D. Agent-Based Modeling. Systems science and population health 2017, 15, 87. [Google Scholar]
- Yang, Y. A Narrative Review of the Use of Agent-Based Modeling in Health Behavior and Behavior Intervention. Translational behavioral medicine 2019, 9, 1065–1075. [Google Scholar] [CrossRef] [PubMed]
- ZHANG, T. Exploring the Mechanism-Based Explanation of Complex Social Phenomena: A Social Simulation Study of the Diffusion of College Students Drinking Behavior in Friendship Networks. 2025. [Google Scholar]
- Wang, C.; Hipp, J.R.; Butts, C.T.; Jose, R.; Lakon, C.M. Peer Influence, Peer Selection and Adolescent Alcohol Use: A Simulation Study Using a Dynamic Network Model of Friendship Ties and Alcohol Use. Prevention science 2017, 18, 382–393. [Google Scholar] [CrossRef]
- Schuhmacher, N.; Ballato, L.; van Geert, P. Using an Agent-Based Model to Simulate the Development of Risk Behaviors during Adolescence. Journal of Artificial Societies and Social Simulation 2014, 17, 1–29. [Google Scholar] [CrossRef]
- Head, J.R.; Andrejko, K.L.; Cheng, Q.; Collender, P.A.; Phillips, S.; Boser, A.; Heaney, A.K.; Hoover, C.M.; Wu, S.L.; Northrup, G.R. School Closures Reduced Social Mixing of Children during COVID-19 with Implications for Transmission Risk and School Reopening Policies. Journal of the Royal Society Interface 2021, 18, 20200970. [Google Scholar] [CrossRef]
- Fouad, A.A.; El Antably, A. Agent-Based Modeling and Simulation of Pandemic Propagation in a School Environment. International Journal of Architectural Computing 2023, 21, 120–135. [Google Scholar] [CrossRef]
- Hernandez-Hernandez, A.M.; Huerta-Quintanilla, R. Managing School Interaction Networks during the COVID-19 Pandemic: Agent-Based Modeling for Evaluating Possible Scenarios When Students Go Back to Classrooms. Plos one 2021, 16, e0256363. [Google Scholar] [CrossRef]
- Vo, A.T.; Patton, T.; Peacock, A.; Larney, S.; Borquez, A. Illicit Substance Use and the COVID-19 Pandemic in the United States: A Scoping Review and Characterization of Research Evidence in Unprecedented Times. International journal of environmental research and public health 2022, 19, 8883. [Google Scholar] [CrossRef]
- Siegal, N.; Simon, K.; Freedman, S.; Aalsma, M.C.; Wing, C. Stalled Improvements? Youth Opioid Misuse 2015–2022. Journal of Adolescent Health 2025. [Google Scholar] [CrossRef]
- Dixit, A.; Jain, S. Contemporary Approaches to Analyze Non-Stationary Time-Series: Some Solutions and Challenges. Recent Advances in Computer Science and Communications (Formerly: Recent Patents on Computer Science) 2023, 16, 61–80. [Google Scholar] [CrossRef]
- Cheng, C.; Sa-Ngasoongsong, A.; Beyca, O.; Le, T.; Yang, H.; Kong, Z.; Bukkapatnam, S.T. Time Series Forecasting for Nonlinear and Non-Stationary Processes: A Review and Comparative Study. Iie Transactions 2015, 47, 1053–1071. [Google Scholar] [CrossRef]
- Shojaati, N.; Osgood, N.D. An Agent-Based Social Impact Theory Model to Study the Impact of in-Person School Closures on Nonmedical Prescription Opioid Use among Youth. Systems 2023, 11, 72. [Google Scholar] [CrossRef]
- Latané, B. The Psychology of Social Impact. American psychologist 1981, 36, 343. [Google Scholar] [CrossRef]
- Boak, A.; Elton-Marshall, T.; Mann, R.E.; Hamilton, H.A. Drug Use among Ontario Students. In Toronto, ON: Centre for Addiction and Mental Health; 2020. [Google Scholar]
- Boak, A.; Elton-Marshall, T.; Hamilton, H.A. The Well-Being of Ontario Students: Findings from the 2021 Ontario Student Drug Use and Health Survey. 2021. Available online: https://www.
- Boak, A.; Hamilton, H.A. Drug Use Among Ontario Students. 2024. [Google Scholar]
- Hołyst, J.A.; Kacperski, K.; Schweitzer, F. Social Impact Models of Opinion Dynamics. Annual Reviews Of Computational PhysicsIX 2001, 253–273. [Google Scholar]
- Castellano, C.; Fortunato, S.; Loreto, V. Statistical Physics of Social Dynamics. Reviews of modern physics 2009, 81, 591–646. [Google Scholar] [CrossRef]
- Borshchev, A. The Big Book of Simulation Modeling: Multimethod Modeling with AnyLogic 6; AnyLogic North America, 2013; ISBN 0-9895731-7-6. [Google Scholar]
- Mansouri, A.; Taghiyareh, F. Effect of Segregation on the Dynamics of Noise-Free Social Impact Model of Opinion Formation through Agent-Based Modeling. International Journal of Web Research 2019, 2, 36–44. [Google Scholar]
- Nowak, A.; Szamrej, J.; Latané, B. From Private Attitude to Public Opinion: A Dynamic Theory of Social Impact. Psychological review 1990, 97, 362. [Google Scholar] [CrossRef]
- Lerner, A.; Klein, M. Dependence, Withdrawal and Rebound of CNS Drugs: An Update and Regulatory Considerations for New Drugs Development. Brain communications 2019, 1, fcz025. [Google Scholar] [CrossRef] [PubMed]
- Ilachinski, A. Cellular Automata: A Discrete Universe; World Scientific Publishing Company, 2001; ISBN 981-310-256-X. [Google Scholar]
- Preston, K., Jr.; Duff, M.J. Modern Cellular Automata: Theory and Applications; Springer Science & Business Media, 2013; ISBN 1-4899-0393-3. [Google Scholar]
- Moore, E.F. Machine Models of Self-Reproduction; American Mathematical Society New York, 1962; Vol. 14, pp. 17–33. [Google Scholar]
- Mollick, J.A.; Kober, H. Computational Models of Drug Use and Addiction: A Review. Journal of abnormal psychology 2020, 129, 544. [Google Scholar] [CrossRef] [PubMed]
- Naumann, R.B.; Guynn, I.; Clare, H.M.; Lich, K.H. Insights from System Dynamics Applications in Addiction Research: A Scoping Review. Drug and alcohol dependence 2022, 231, 109237. [Google Scholar] [CrossRef]
- San Miguel, M.; Johnson, J.H.; Kertesz, J.; Kaski, K.; Díaz-Guilera, A.; MacKay, R.S.; Loreto, V.; Erdi, P.; Helbing, D. Challenges in Complex Systems Science. The European Physical Journal Special Topics 2012, 214, 245–271. [Google Scholar] [CrossRef]
- Ghadami, A.; Epureanu, B.I. Data-Driven Prediction in Dynamical Systems: Recent Developments. Philosophical Transactions of the Royal Society A 2022, 380, 20210213. [Google Scholar] [CrossRef]
Figure 1.
State chart structures implemented within the agent-based model. (a) The Youth Drug Use Opinion Evidence Base state chart categorizes youth as never-users, initial users, former users who have quit, or relapsed users, with transitions informed by social impact theory. (b) The Frequency of Drug Use in Past Year state chart tracks the number of nonmedical prescription opioid use episodes over the past year. (c) The Drug Source state chart classifies a youth’s most recent opioid source as originating from family, friends, or an unspecified category.
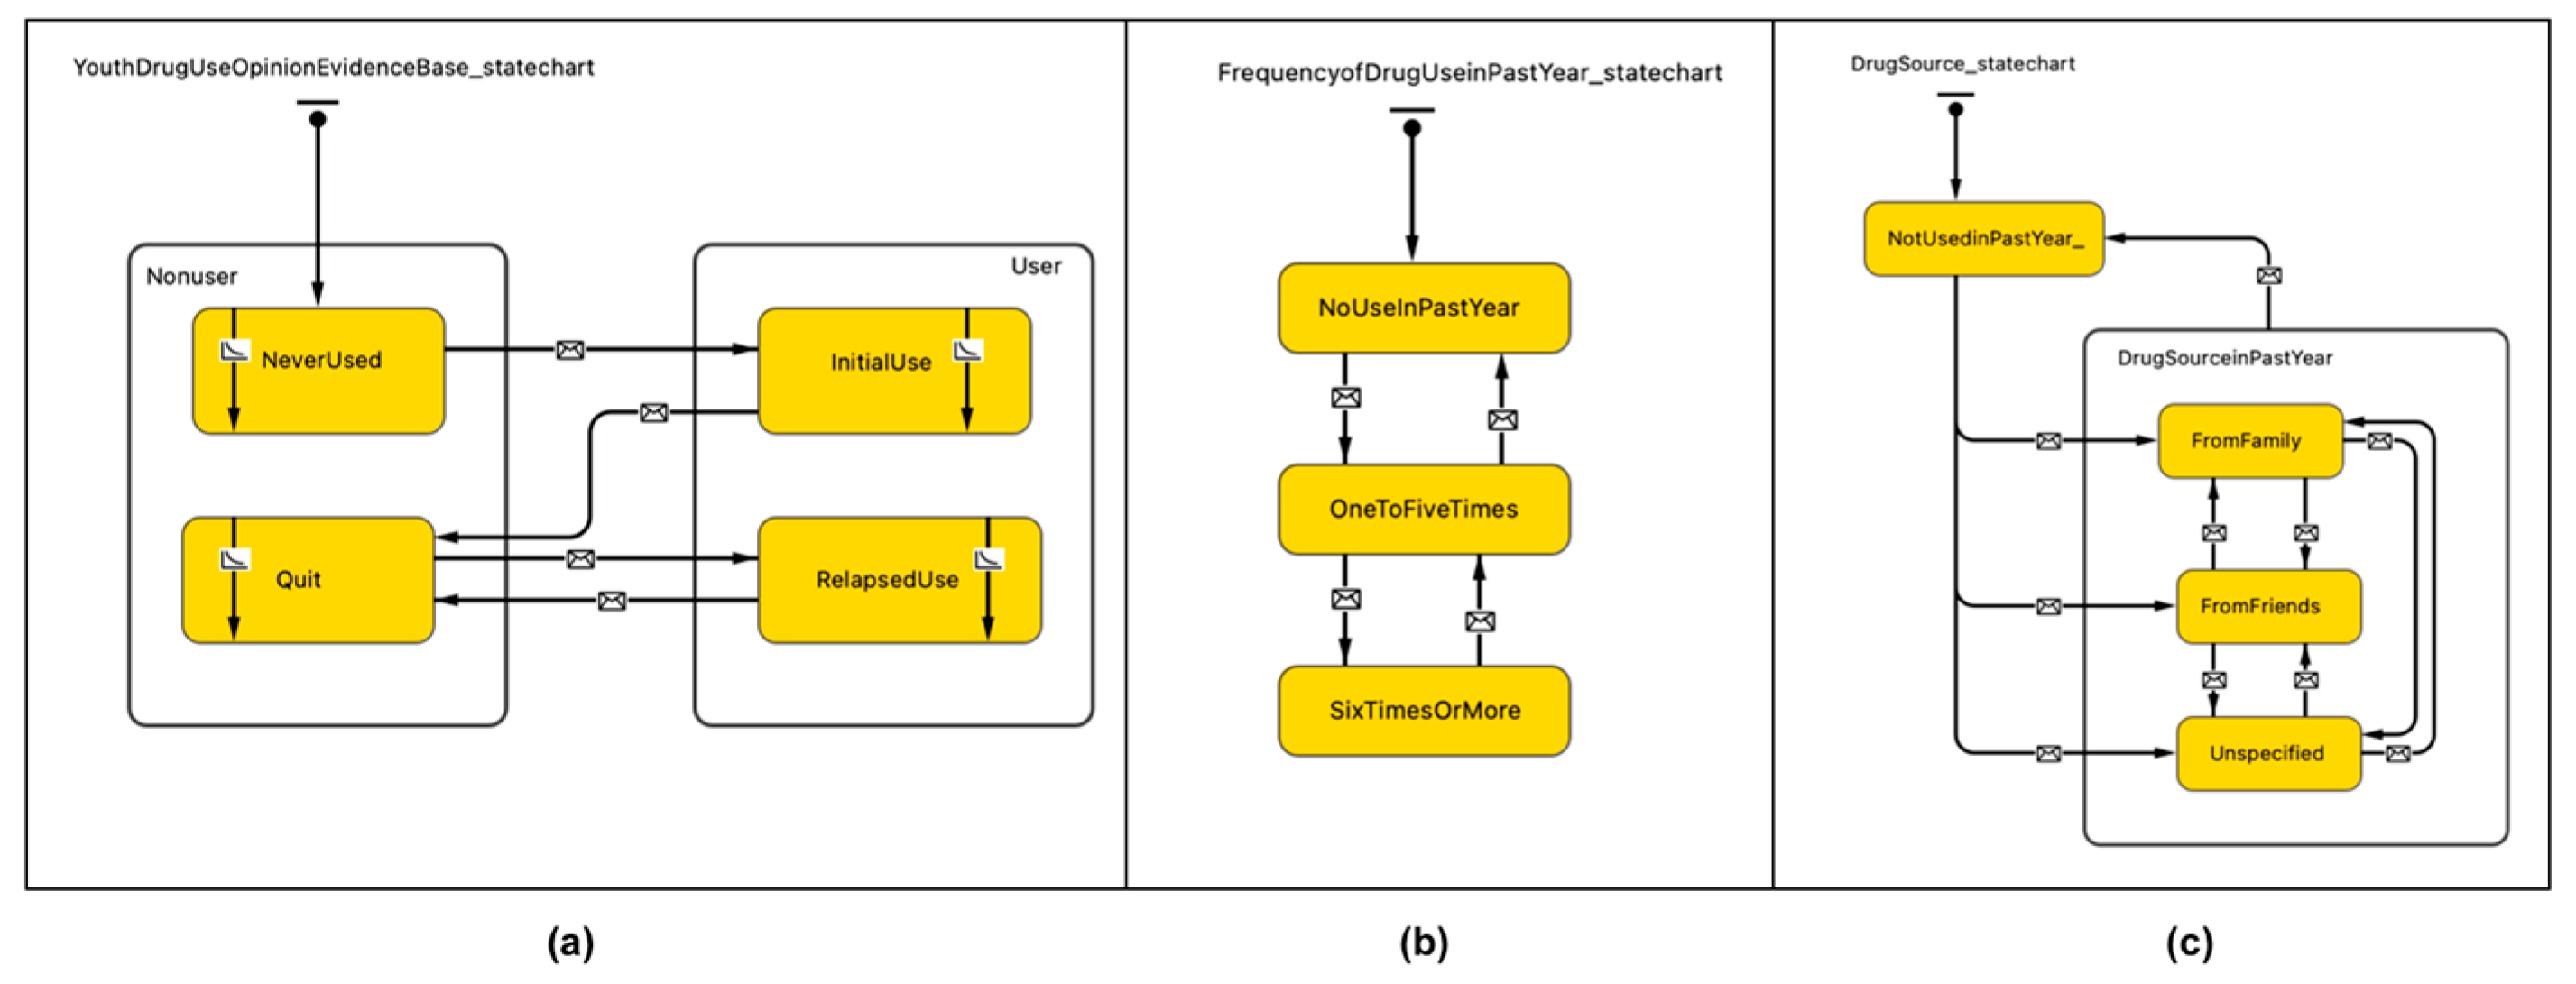
Figure 1.
Comparison of model-generated prevalence of nonmedical prescription opioid use among Ontario adolescents and empirical data from OSDUHS on the percentage of Ontario adolescents reporting past-year nonmedical use of opioid pain relievers from 2007 to the newly released 2023 data. (a) Model-generated prevalence of youth nonmedical prescription opioid use among Ontario adolescents from 2017 to 2025. The x-axis represents calendar year, and the y-axis represents the prevalence of past-year nonmedical prescription opioid use. The two vertical black arrows indicate the start and end of the Ontario school closure timeline. Blue dots represent empirical data from OSDUHS, which were used to validate the model-generated prevalence in the prior study [50]. (b) Empirical data from OSDUHS on the percentage of Ontario adolescents reporting past-year nonmedical use of opioid pain relievers from 2007 to the newly released 2023 data. The x-axis represents calendar year, and the y-axis represents the percentage of adolescents reporting past-year nonmedical prescription opioid use.
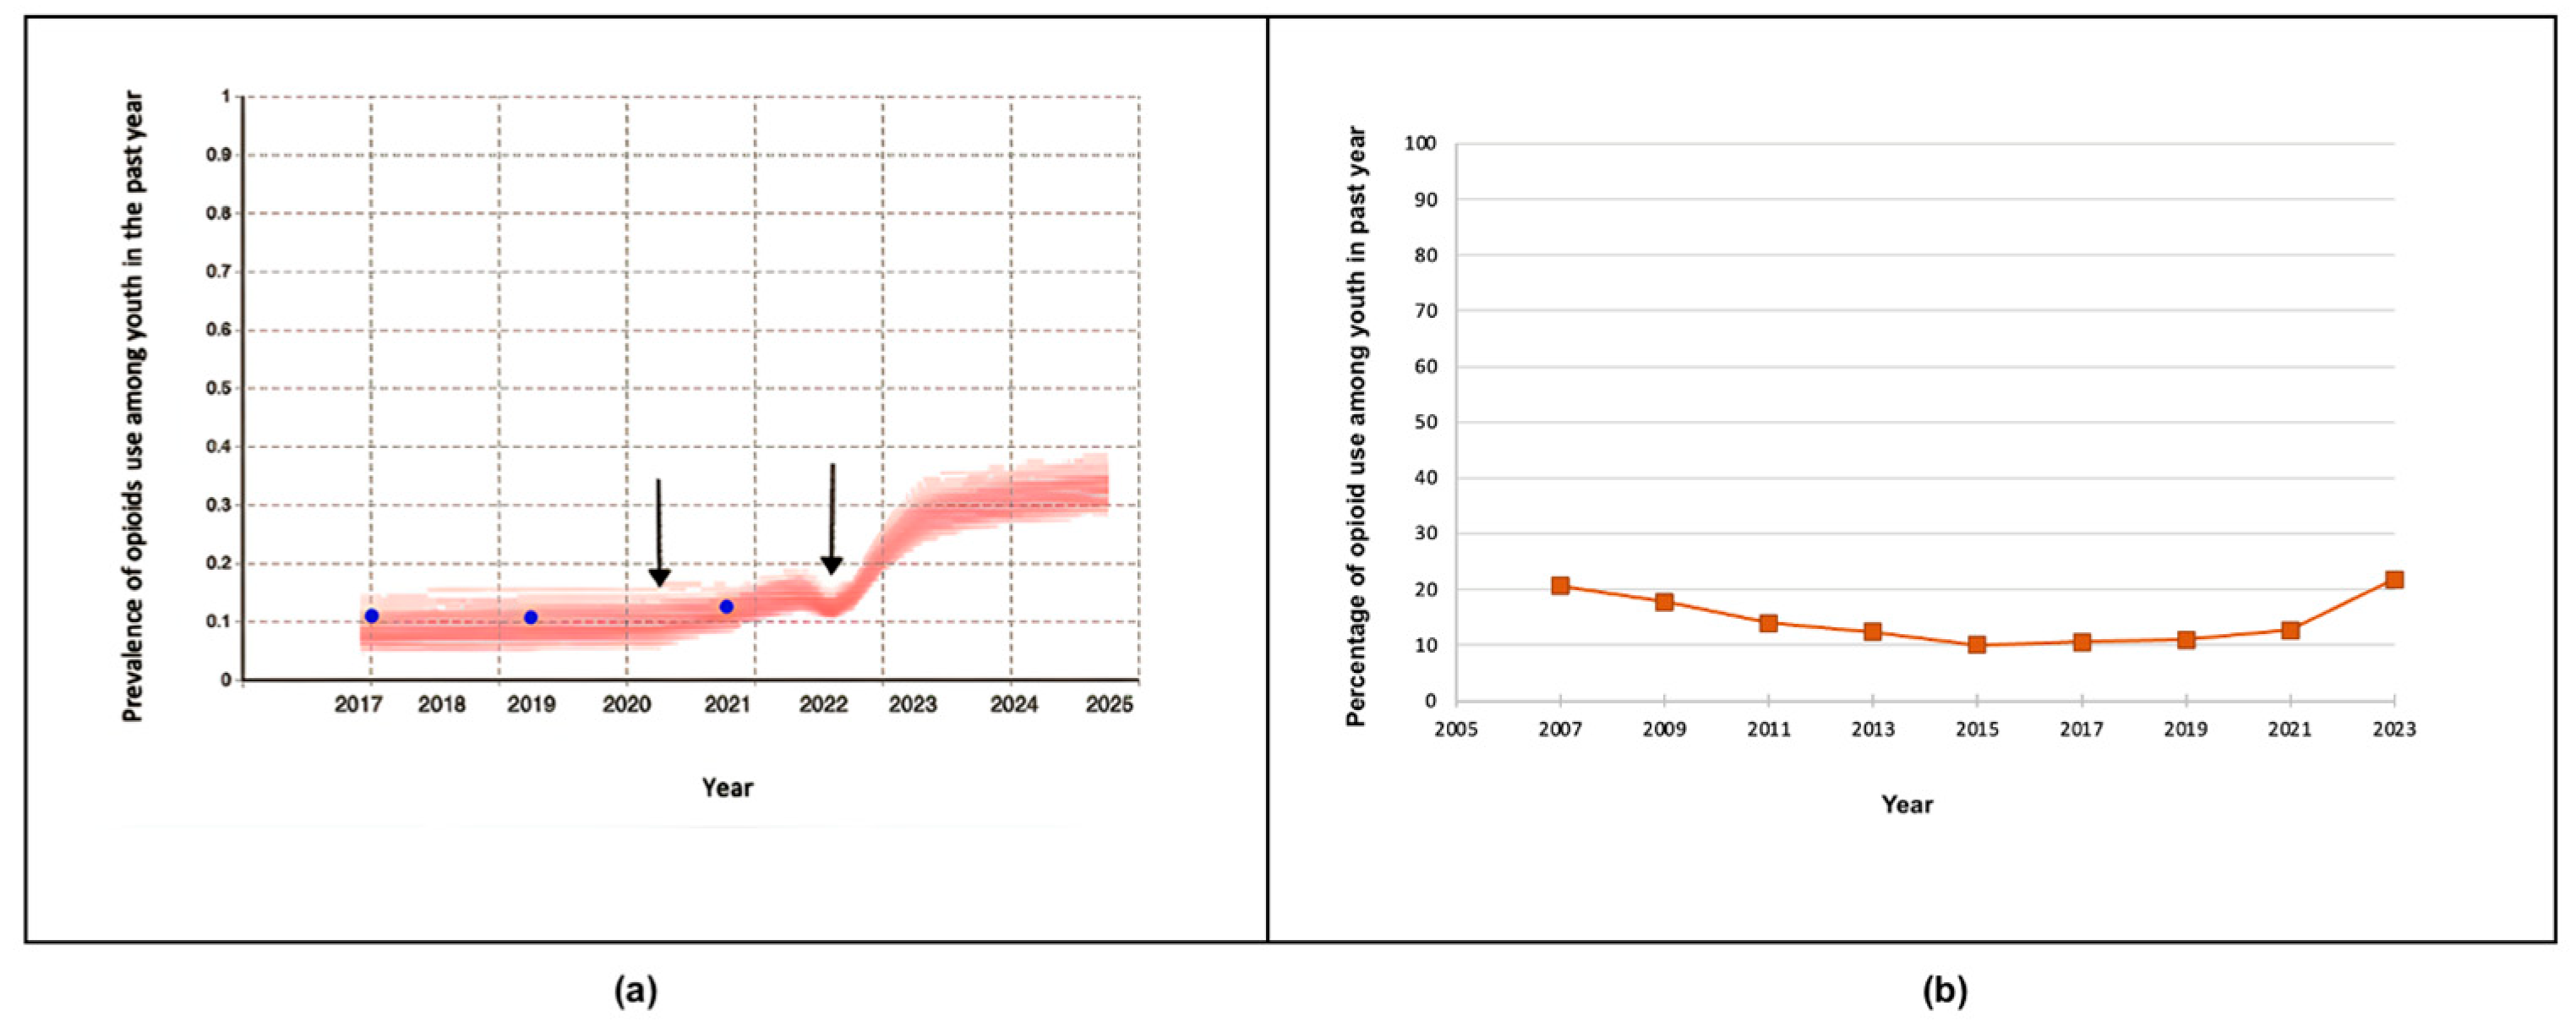
Figure 1.
Model-generated prevalence of youth exhibiting nonmedical prescription opioid use in the past year among Ontario adolescents through 2030 under the baseline scenario.
Figure 1.
Model-generated prevalence of youth exhibiting nonmedical prescription opioid use in the past year among Ontario adolescents through 2030 under the baseline scenario.
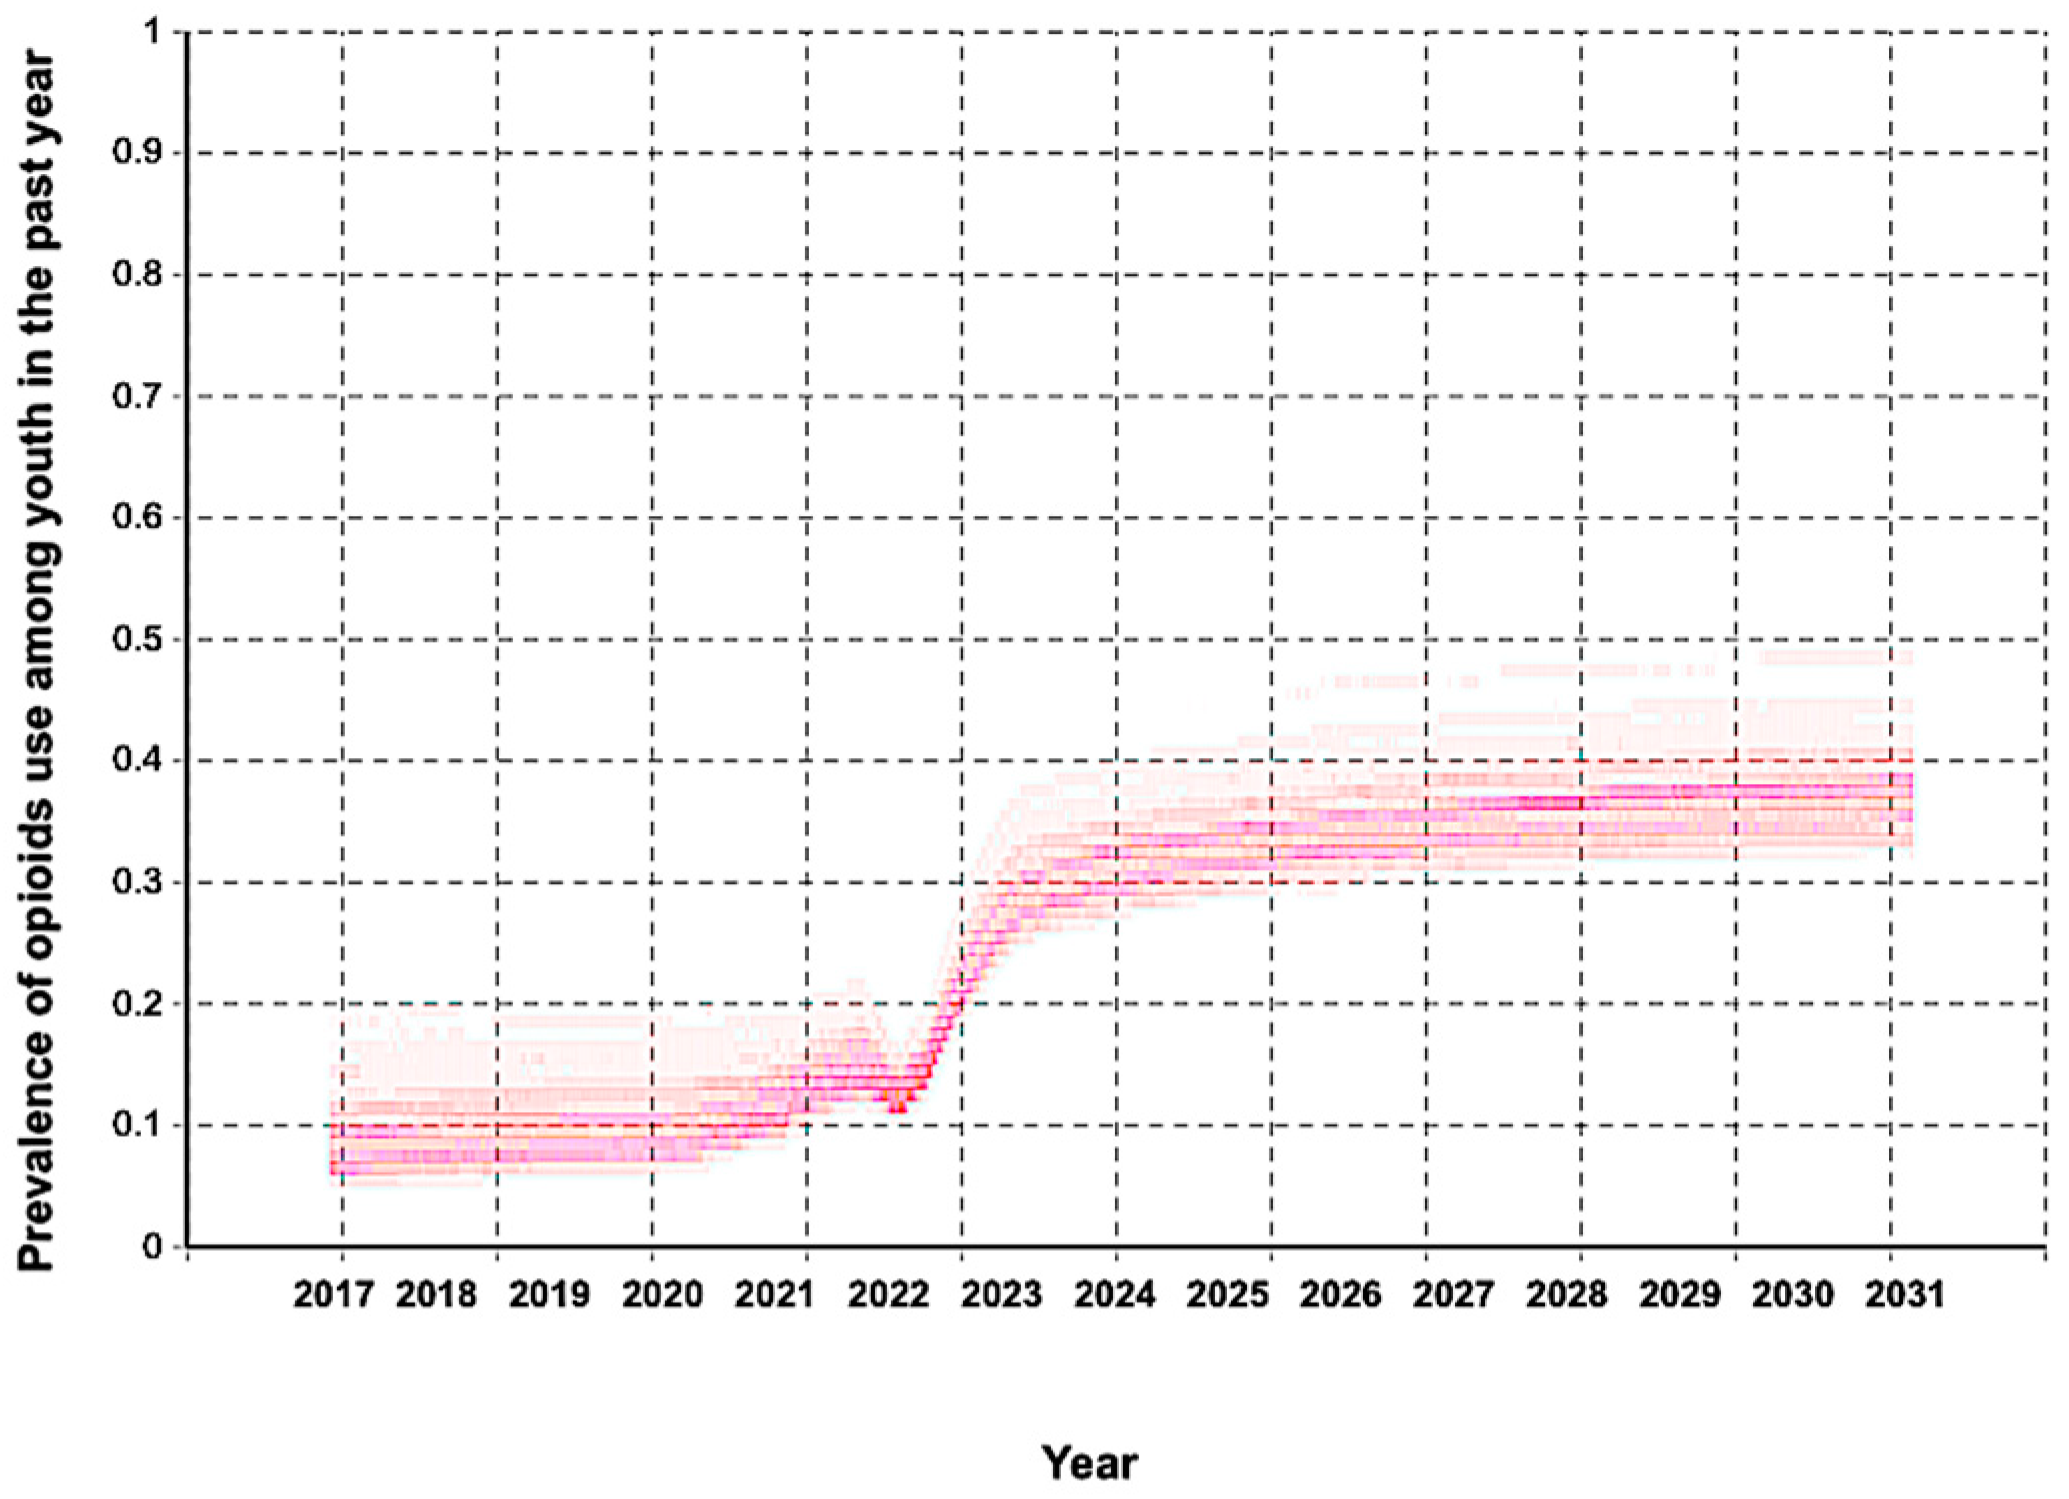
Figure 4.
Comparison of model-generated projections of past-year nonmedical prescription opioid use prevalence among Ontario adolescents under safe medicine storage interventions implemented in 2027. The x-axis represents calendar year (2017–2030), and the y-axis represents the prevalence of past-year nonmedical prescription opioid use. The two blue dashed lines mark the intervention period. (a) Model-generated prevalence of youth exhibiting nonmedical prescription opioid use in the past year for the baseline scenario. (b) Model-generated prevalence of youth exhibiting nonmedical prescription opioid use in the past year after applying a 20% reduction in youth exposure to prescription opioids at home at the beginning of 2027. (c) Model-generated prevalence of youth exhibiting nonmedical prescription opioid use in the past year after applying a 50% reduction in youth exposure to prescription opioids at home at the beginning of 2027. (d) Model-generated prevalence of youth exhibiting nonmedical prescription opioid use in the past year after applying an 80% reduction in youth exposure to prescription opioids at home at the beginning of 2027.
Disclaimer/Publisher’s Note: The statements, opinions and data contained in all publications are solely those of the individual author(s) and contributor(s) and not of MDPI and/or the editor(s). MDPI and/or the editor(s) disclaim responsibility for any injury to people or property resulting from any ideas, methods, instructions or products referred to in the content. |
© 2025 by the authors. Licensee MDPI, Basel, Switzerland. This article is an open access article distributed under the terms and conditions of the Creative Commons Attribution (CC BY) license (http://creativecommons.org/licenses/by/4.0/).
Copyright: This open access article is published under a Creative Commons CC BY 4.0 license, which permit the free download, distribution, and reuse, provided that the author and preprint are cited in any reuse.


