Preprint
Article

This version is not peer-reviewed.

BrainTwin.AI: A New-Age Cognitive Digital Twin Advancing MRI-Based Tumor Detection and Progression Modelling via an Enhanced Vision Transformer, Powered with EEG-Based Real-Time Brain Health Intelligence

Submitted:

18 December 2025

Posted:

19 December 2025

You are already at the latest version

Abstract

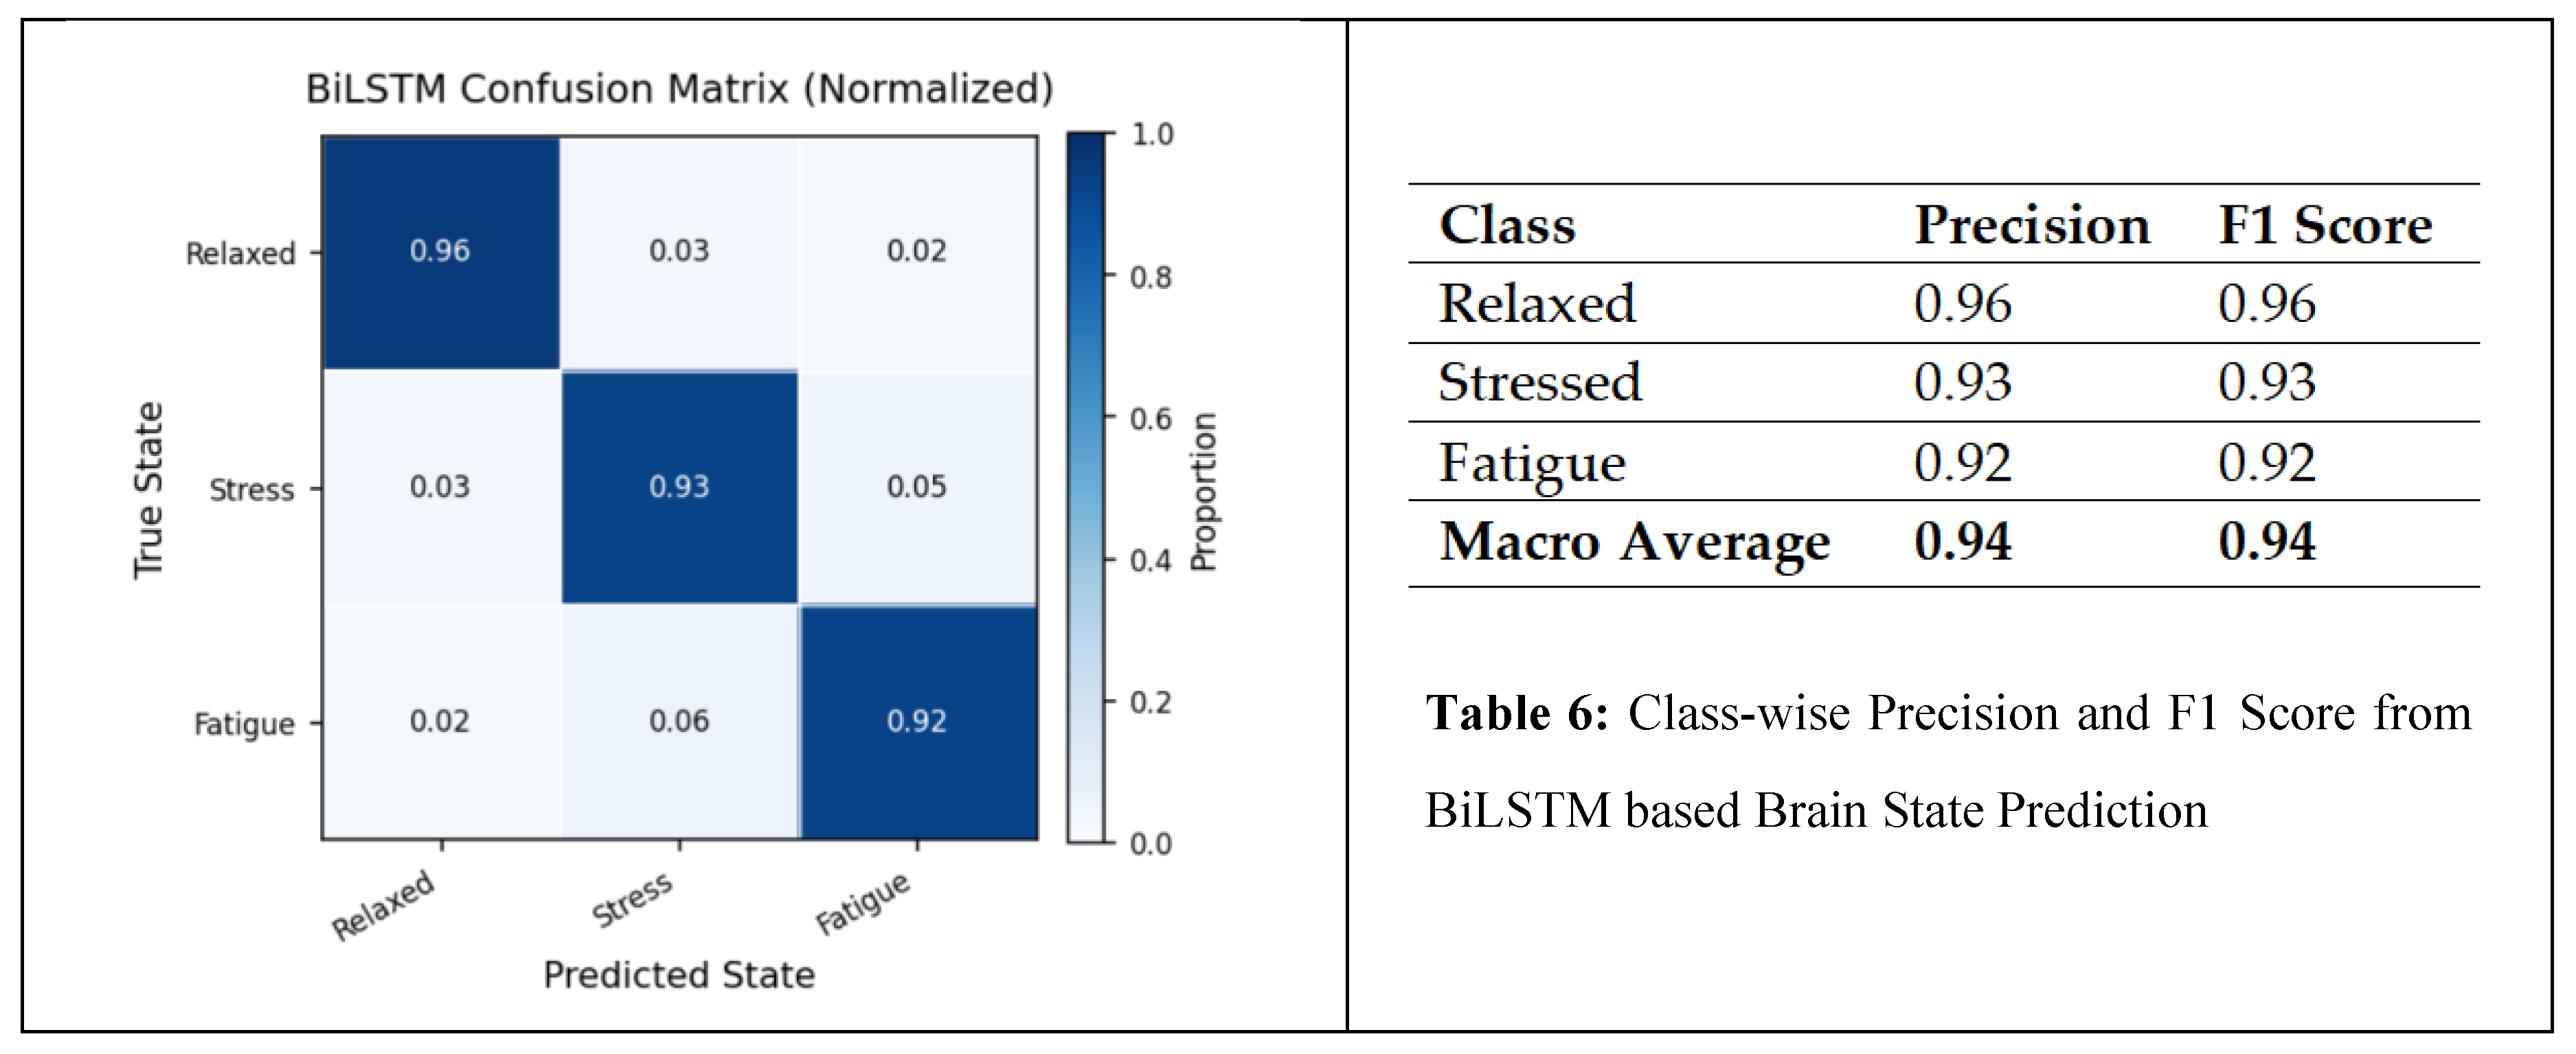
Brain health monitoring is increasingly essential as modern cognitive load, stress, and lifestyle pressures contribute to widespread neural instability. The paper introduces BrainTwin, a next-generation cognitive digital twin that integrates advanced MRI analytics for comprehensive neuro-oncological assessment with real-time EEG–based brain health intelligence.Structural analysis is driven by an Enhanced Vision Transformer (ViT++), which improves spatial representation and boundary localization, achieving more accurate tumor prediction than conventional models. Extracted tumor volume forms the baseline for short-horizon tumor progression modeling. Parallel to MRI analysis, continuous EEG signals are captured through an in-house wearable skullcap, preprocessed using Edge AI on a Hailo Toolkit–enabled Raspberry Pi 5 for low-latency denoising and secure cloud transmission. Pre-processed EEG packets are authenticated at the fog layer ensuring secure and reliable cloud transfer, enabling significant load reduction in the edge and cloud nodes. In the digital twin, EEG characteristics offer real-time functional monitoring through dynamic brain-wave analysis,while a BiLSTM classifier distinguishes relaxed, stress, and fatigue states. Unlike static MRI imaging, EEG provides real-time brain health monitoring. The Brain-Twin performs EEG–MRI fusion, co-relating functional EEG metrics with ViT++ structural embeddings to produce a single risk score that can be interpreted by clinicians to determine brain vulnerability to future diseases. Explainable artificial intelligence (XAI) provides clinical interpretability through Gradient weighted class activation mapping (Grad-CAM) heatmaps, which are used to interpret ViT++ decisions and are visualized on a 3D interactive brain model to allow more in-depth inspection of spatial details. The evaluation metrics demonstrate a BiLSTM macro-F1 of 0.94 (Precision/ Recall/ F1: Relaxed 0.96, Stress 0.93, Fatigue 0.92) and ViT++ MRI accuracy of 96% outperforming baseline architectures. These results demonstrate BrainTwin’s reliability, interpretability, and clinical utility as an integrated digital companion for tumor assessment and real-time functional brain monitoring.

Keywords: 
;  ;  ;  ;  ;  ;  ;  

1. Introduction

The recent breakthroughs made on the brain-computer interface (BCI) systems, real-time neuroimaging and edge-native computation have provided a new frontier of neurological diagnostics intelligence. One of the most essential components of this technological change is the digital twin, which is a real-time updated virtual model representing the structural and functional traits of its physical counterpart. While digital twins have shown significant promise in areas like aerospace, industrial automation, and personalized medicine, their use in cognitive-neurophysiological modeling is still lacking and not fully developed. The existing models, which attempt to mimic brain behavior using digital twins, have various major limitations. Most of these models are hard-coded and do not always use real-time physiological measurements without using previous data. Others are confined to either of the two types of data: anatomical neuroimaging (including MRI), or electrophysiological recording (including EEG). These they can scarcely integrate into an integrated neurocognitive picture. Most of them heavily rely on the utilization of cloud-based systems that can cause delays, cannot be utilized in areas with poor connections, and carry a few severe issues regarding the safety of their data and patient confidentiality. Above all, these systems rely in principle on non-transparent and complex models of AI. The problem is that such indistinctness impacts the interpretation of the results not only by clinicians but also erodes trust in the diagnosis. This is important as far as making key decisions regarding neurological health is concerned. Some of these challenges have been attempted to be addressed by the recent research. Specifically, Zhihan Lv et al. [2] suggested a BCI-centric digital twin that applies advanced Riemannian manifold-based transfer learning models to a better EEG-based motor intention classification. Although this study enhanced the interpretation of functional signals, it was restricted to the EEG and did not incorporate structural imaging, real-time flexibility, and clinical explainability. On the same note, a multimodal image fusion strategy driven by deep transfer learning jointly used MRI and PET/SPECT imaging to enhance diagnostic accuracy was investigated by Jinxia Wang et al. [3]. Despite some advancement of spatial detail survival and modal synergy, the system was largely off-line, not connected to physiological signals, and could not sustain adaptive change in time; all of these are essential elements of a realistic model of cerebral behaviour. All these drawbacks emphasize the necessity of a holistic, real-time and edge-compatible digital twin architecture that would meet the current needs of neuroscience. The described framework needs to have an ability to complement functional and structural neurodata and be free to operate at the edge without the need of external maintenance, adjust dynamically to the new inputs and not lose a readership in its rationale. It must not only be a model of static diagnosis, but a cognitive-neurophysiological substitute that could reflect, analyze and simulate a patient’s cerebral state in a clinically actionable way.
We propose a unified, scalable, and intelligent digital twin architecture for continuous brain health monitoring and tumor progression analysis. This system has several major contributions: (i) a wearable skullcap, equipped with custom EEG acquisition interface to allow real-time functional monitoring, (ii) edge computing layer to enable low-latency preprocessing, (iii) a fog-layer authentication and adaptive risk-filtering mechanism to ensure data integrity whilst minimizing unnecessary cloud communications, and (iv) a hybrid digital twin, which combines Vision Transformer-based MRI tumor analysis and EEG-based real-time brain health intelligence. The framework also incorporates methods of explainable AI, like Gradient-Weighted Class Activation Mapping to visualize the ViT++ decisions and incorporates an interactive 3D brain interface to interpret tumor location and assess tumor penetration across several neural layers. Besides, a tumor kinetics engine simulates tumor evolution for a patient over a fixed time interval, improving decision making capabilities in treatment procedures. The combination of these elements can help replace the shortcomings of earlier fragmented or otherwise non-interpretable systems with a more unified and clinically meaningful and personalized platform for proactive neuro-oncological management and constant monitoring of brain health.
The paper is structured as follows: Section 1 provides the motivation and problem statement, objectives and our new contributions; Section 2 provides the review of the current state-of-the-art architectures in neuro-medical diagnosis; Section 3 gives a detailed description of the dataset; Section 4 and Section 5 describe system architecture and methodology, Section 6 discusses the experimental results and Section 7 gives the conclusion on the key contributions, acknowledgement and future research directions.

2. Related Works

Digital twin technology has become a revolutionary method of modeling, analyzing, and monitoring neurophysiological conditions based on real-time information, sophisticated artificial intelligence systems, and multimodal biomedical data. Although considerable progress has been made in areas such as deep learning–based diagnosis, neural signal decoding, and immersive visualization, most current digital twin frameworks continue to face substantial challenges related to scalability, real-time operational efficiency, explainability, and the integration of both structural and functional brain data. These constraints inhibit their reliability in working in the challenging clinical settings. In view of resolving these challenges in the structural imaging frontier, Aftab Hussain et al. [1] proposed an attention-based ResNet-152V2 network to detect intracranial hemorrhage (ICH) in a Health 4.0 digital twin environment. Their pipeline focused on extracting salient features by means of an attention mechanism, dimensionality reduction by principal component analysis (PCA), and class imbalance of rare ICH subtypes by a deep convolutional generative adversarial network (DCGAN). The results of the model on the RSNA 2019 delivered a strong performance with accuracy rate above 99 percent on epidural hemorrhage and above 97 percent on intraparenchymal. However, the framework is overly biased with synthetic data, which makes it prone to bias and overfitting, and also lacks XAI driven clinical interpretability setting a major drawback to its use in clinical practice where transparency and reliability are fundamental. The authors themselves suggest the further enlargement of the dataset and integration of explainability tools in the further development. Zhihan Lv et al. [2] proposed a cognitive computing paradigm of brain-computer interface (BCI)-based digital twins on the functional side, which aimed at interpreting electroencephalography (EEG) signals. Their research combined several preprocessing methods in their approach such as Butterworth and finite impulse response filtering, wavelet decomposition, and a novel TL-TSS algorithm based on Riemannian manifold theory. A hybrid entropy and singular spectrum analysis (SSA) framework was implemented to support signal decoding. TL-TSS showed excellent results on BCI Competition datasets with the highest accuracy of 97.88 outperforming classical methods such as Common Spatial Pattern (CSP). Despite its effectiveness the system is restricted to motor-imagery tasks and cannot be applied to complex neurological conditions such as epilepsy, neuro-oncological abnormalities, or cognitive decline. Moreover, the paper lacks a clear direction on how structural imaging including MRI can be incorporated and the lack of transformer models and edge processing limits future scalability. Moving towards the topic of image quality improvement, Wang et al. [3] suggested a deep transfer learning-based system with the idea of digital twins to enhance MRI fidelity and aid in diagnostic decision-making. Their trained deep neural network significantly does not follow a batch normalization, but it employs a custom designed loss function to promote a steady convergence. They also proposed a decomposition-based MRI-PET/SPECT fusion method, which is adaptive, preserving both the spatial and anatomical detail. The quantitative analysis showed good outcomes with the highest possible PSNR of 34.11 dB and SSIM of 85.24 and proved to be better than the traditional methods. Although these are the strengths, the system depends on offline preprocessing heavily, fails to provide real-time inferences, and fails to provide EEG as well as support tissue-level visualization which are essential constituents in an everlasting neurological control in new age digital twins. Additionally enhancing neuro-digital twin visualization, Yao et al. [4] proposed DTBIA, which is a virtual reality-based interactive analytics tool. This platform allows users to browse brain digital twin simulations at a variety of resolutions with blood-oxygen-level-dependent (BOLD) and diffusion tensor imaging (DTI) signals at both voxel-level and region-level granularity. DTBIA provided significant benefits in the study of complex brain network structures by researchers with the use of hierarchical visualization, 3D edge bundling and immersive VR navigation. But its utilization in the clinical scenario is not practical since it needs high-performance VR devices and graphics processing units (GPUs). It also does not have predictive analytics, real-time data ingestion, or EEG-based functional characterization, highlighting the need for more accessible and portable solutions.Building upon the idea of the digital twin, Sagheer Khan et al. [5] proposed a radio frequency based digital twin for continuous stroke monitoring utilizing ultra-wideband (UWB) backscatter sensors. The system realized 93.4% and 92.3% classification accuracy in binary and multiclass stroke scenarios, respectively (particularly with Gaussian noise-based data augmentation) by using machine learning (ML) and deep learning (DL) methods, such as stacked autoencoders and optimized k-nearest neighbors classifiers. The wearable nature of the device contributes to the portability and real-time feed back possibilities. However, the model has never been tested with actual clinical EEG data, and thus needs additional clinical trials. It lacks proactive prediction capabilities and interactive visualizations which are limitations to its diagnostic value. Exploring secure healthcare data management, Upadrista et al. [6] introduced a blockchain-based digital twin to predict brain stroke. Their classification model was constructed on the premises of logistic regression with univariate feature selection and was trained on the basis of a batch gradient descent whereas the corresponding blockchain infrastructure provided security in the transfer of synthetic and public datasets across the consortium networks constructed on the basis of Ganache. With a reported performance of 98.28%, the approach outperforms baseline systems in terms of accuracy and security.However, the architecture predominantly works on static data and is not capable of real-time streaming, incorporation of imaging modalities and analysis of physiological signals. This reduces its use in dynamic clinical processes which require constant data updatiosn and multi dimentional visualizations. Enhancing human–computer interaction(HCI) with digital systems, Siyaev et al. [7] suggested neuro-symbolic reasoning (NSR) framework that allows voice-based query processing in digital twins. Their method makes use of a gated recurrent unit (GRU) neural translator in order to translate natural-language speech to symbolic logic, which is subsequently run in annotated 3D models. The system performed exceptionally well with 96.2% neuro-symbolic accuracy, BLEU score of 0.989 and a failure rate of 0.2 using a dataset of over 9,000 aviation maintenance queries. This architecture is innovative but is not developed to be used in healthcare and would need specific neuroanatomical vocabularies and physiological data streams to benefit brain-oriented digital twins. Multimodal input and real-time interaction is missing which makes it highly restricted in its application to neurocognitive areas. Buildng uopn the edge, Sultanpure et al. [8] proposed a cloud-based digital twin to detect brain tumors by combining IoT imaging devices and other machine learning classifiers. Their study used the swarm optimization (PSO) to select the best features of MRI and experimented with CNNs, SVMs and extreme learning machines (ELMs) to classify tumors. The best performance was provided by CNNs. Even though this centralized architecture is consistent with the Healthcare 4.0 paradigms, it raises fundamental cloud latency concerns and is not built-in with explainable AI, such as Grad-CAM or SHAP, which reduces its interpretability in clinical scenarios. Besides, it is not multimodal and thus not able to integrate functional signals like EEG with structural imaging rendering it incapable of providing a complete picture of entire brain activity. In continuation, Wan et al. [9] combined semi-supervised learning with a modified AlexNet architecture to construct a digital twin for brain image fusion and classification. Their semi-supervised support vector machine (S3VM) assists in exploiting both the labeled and unlabeled data to increase the potential of generalization. Their improved AlexNet makes them faster in segmentation and achieves a better recognition accuracy of 92.52, similarity coefficient of 75.58 and better error rates (RMSE = 4.91, MAE = 5.59%). Although these are the merits, the system needs manually adjusted hyperparameters, and is not adapted to real-time processing. It lacks EEG integration, explainability and does not have dynamic visualization controls which are vital in cognitive monitoring applications. Further clinical tests should be conducted to confirm its reliability and flexibility. More extensive clinical trials are needed to validate its reliability and adaptability. Cen et al. [10] developed a statistical modeling approach by applying digital twin techniques for the characterization of disease-specific brain atrophy patterns in multiple sclerosis (MS). The model assesses the thalamic volume on MRI scans and provides aging curves between MS patients and simulated healthy controls through a bunch of mixed spline regression models (12 splines, 52 covariate combinations). The modeling was supported by data of large neuroimaging projects, such as the Human Connectome Project (HCP) and the Alzheimer plays a role in Neuroimaging Initiative (ADNI) as well as local longitudinal data. The important finding was that thalamic atrophy starts around 5-6 years before a clinical diagnosis indicating a significant early biomarker. Despite being cross-validated using AIC, BIC, and bootstrapping, the technique is computationally expensive and needs large datasets limiting its scalability moreover it does not support real-time updates, multimodal integration or tracking of functional brain states. The second set of literature delves into CNN-Transformer hybrids to neuroimaging. Liu et al. [11] proposed BTSC-TNAS, a multi-task digital twin architecture employed with a nested U-shaped structure that entails CNNs to extract fine-grained local features and transformers to acquire global context. This method of neural architecture search (NAS) finds the best blocks (NAS-TE and NAS-Conv), while segmentation masks are optimized through NTU-NAS and multiscale features are fed into MSC-NET during classification. The model attained the dice scores of 80.9% and 87.1% with tumor and abnormal regions respectively and 0.941 classification accuracy. Generalizability was high in results on BraTS2019. Nonetheless, the model is still confined to structural MRI, does not functionally integrate with EEG and is not real-time. Similarly, Lin et al. [12] proposed CKD-TransBTS, a clinically informed extension of TransBTS that leverages domain knowledge by grouping MRI modalities into meaningful pairs before applying a dual-branch encoder with Modality-Correlated Cross-Attention (MCCA). A Trans&CNN Feature Calibration (TCFC) decoder harmonizes the modalities. On BraTS2021, CKD-TransBTS surpassed both CNN and transformer baselines, achieving state-of-the-art Dice and HD95 metrics with an efficient accuracy-performance balance. Despite its excellent performance, the framework still remains offline, structural-only, and lacks explainability or dynamic updating. Chauhan et al. [13] introduced PBVit, a patch-based vision transformer that integrates DenseNet-style connectivity and a custom CNN kernel for enhanced feature reuse. MRI scans are divided into fixed-size patches and passed through a 12-layer transformer encoder. Their model reached 95.8% accuracy, 95.3% precision, 93.2% recall, and an F1-score of approximately 92% on the Figshare dataset. Ablation studies confirmed the value of positional encodings, optimal patch size, and dense connections. However, PBVit remains restricted to structural MRI, without any functional integration, real-time inference, or cognitive analysis. At the sensor interface level, Massaro [15] developed an artificial intelligence–enhanced EEG digital twin that models electrode–skin–amplifier interactions using electronic circuit simulation (LTSpice). It applies supervised learning, specifically random forest and artificial neural network models—to denoise EEG signals, demonstrating how electronic and computational modeling can synergize to improve raw biosignal quality. Evaluation with cross-validation and statistical metrics confirms the reliability of the approach. Even so, the work remains a simulation-level proof of concept restricted to a single dataset, does not integrate structural neuroimaging, and lacks any real-time or multimodal capability. Finally, Kuang et al. [17] introduced a hybrid architecture combining Graph Convolutional Networks (GCNs) with Long Short-Term Memory (LSTM) networks for predictive modeling of epileptic seizures. Their method transforms multichannel EEG into Pearson-correlation-based graphs to model spatial relationships among electrodes, while LSTMs capture temporal patterns associated with preictal and ictal states. Tested on the CHB-MIT pediatric epilepsy dataset, the framework achieved outstanding results: 99.39% accuracy for binary classification, 98.69% for ternary classification, 99.12% sensitivity, 95.72% specificity, and near-perfect AUC values. Although model has good performance, it is limited to EEG, not combined with multimodal MRI, and cannot run a real time digital twin. Across the reviewed literature several limitations are consistently evident. The vast majority of systems are not able to fuse structural (MRI) and functional (EEG) data in real-time, are not capable of the low-latency real-time inference, and offer minimal or no AI assisted explainability, which is crucial to clinical acceptance. In addition, edge computing is seldom applied, there is frequent lack of dynamism of state update, and most systems lack the ability to provide the 3D visualization, cognitive state monitoring, and tumor progression prediction needed in continuous neurological monitoring. These limitations indicate the necessity of a more sophisticated digital twin solution that would be able to integrate a variety of data streams, provide transparency, and be real-time. These gaps are directly taken care of in our digital twin model, which is multimodal, based on MRI-EEG fusion, edge-fog-cloud pipeline, Vision Transformer++ with explainable AI, Tumor Kinetics Engine and interactive 3D visualization. The entire system architecture, the working principle and clinical relevance is explained in further detail in the following sections.
Table 1. Overview of the recent State-of -the-art architectures In Neuro-Medical Diagonistics.
ARCHITECTURE NOVELTY EVALUATION METRICS DRAWBACKS BRAINTWIN SOLUTION REFERENCE
Attention-based Residual Network-152V2 (ResNet-152V2) + PCA + DCGAN Integrates attention mechanisms for focused hemorrhage feature extraction, PCA for dimensionality reduction, and DCGAN-based synthesis to compensate for minority intracranial hemorrhage subtypes in digital twin applications. Accuracy: 99.2% (Epidural), 97.1%
(Intraparenchymal)
Heavy reliance on synthetic images increases overfitting risk; lacks cross-dataset generalization; no explainable AI, limiting clinical interpretability. Our digital twin enables MRI–EEG fusion in real time removing the dependence on synthetic augmentation. It incorporates Vision Transformer++ with Grad-CAM explainability, ensuring transparency, and uses edge–fog processing for robust generalization to diverse clinical conditions. Aftab Hussain et al. [1]
Transfer Learning on Tangent Space with SVM (TL-TSS) + Riemannian Manifold EEG Analysis Employs cognitive computing and Riemannian geometry to extract robust EEG features, enabling high-accuracy motor imagery decoding for BCI-driven digital twins. Accuracy: up to 97.88%; High kappa & transfer accuracy across datasets Limited to motor imagery tasks; no MRI or multimodal integration; lacks transformer-based scalability and edge deployment. Our model overcomes this by integrating functional EEG and structural MRI which has facilitated broader neurological coverage than motor imagery. Enhanced ViT++ and edge preprocessing on Raspberry Pi ensures scalability and applicability in real-time. Zhihan Lv et al. [2]
Deep CNN without Batch Normalization + Adaptive MRI–PET/SPECT Fusion Introduces a customized loss function to allow for convergence stability; excludes batch normalization layers, improving model’s training time; and develops a novel adaptive method that preserves the integrity of both clinical information and spatial information through multimodal fusion. PSNR: 34.11 dB; SSIM: 85.24% Offline-only processing; no real-time inference; lacks EEG functional integration and digital-twin updating mechanisms. Our digital twin performs continuous real-time MRI–EEG monitoring, supports dynamic twin updates, and provides 3D visualization of tissue-level states with real-time inference, addressing the limitations of offline processing. Jinxia Wang et al. [3]
DTBIA — Digital Twin-Based Brain-Inspired Analytics (VR Interface) Provides an immersive VR-driven visualization engine enabling exploration of BOLD and DTI signals at voxel and regional resolutions. Qualitative user feedback; no quantitative metrics reported Requires expensive VR/GPU hardware; lacks predictive modeling, EEG integration, and real-time physiological inputs. Our system uses lightweight 3D brain visualization without VR, integrates MRI+EEG, and includes a Tumor Kinetics Engine for forecasting, achieving predictive modeling and real-time functionality without costly hardware. Yao et al. [4]
RF Backscatter Sensing + Stacked Autoencoder + Fine-Tuned KNN Classifier Uses wearable ultra-wideband RF sensors and machine learning for portable, real-time stroke monitoring within a lightweight digital twin framework. Binary Accuracy: 93.4%; Multiclass Accuracy: 92.3% Not validated on clinical EEG; reactive rather than predictive; lacks explainability, multimodal fusion, and visualization. Our digital twin incorporates predictive tumor/stroke progression modeling, XAI-based visual explanations, and 3D neuro-visualization, enabling proactive monitoring validated on real multimodal data. Sagheer Khan et al. [5]
Blockchain-Enabled Digital Twin + Logistic Regression Introduces a secure, decentralized twin architecture for stroke prediction using blockchain for tamper-proof data exchange and logistic regression for classification. Overall Accuracy: 98.28% Works only with static datasets; no imaging or EEG support; no real-time streaming or visualization. Our model supports real-time continuous data flow, integrates MRI and EEG, performs dynamic updates at the edge and fog layers, and includes interactive 3D visualization, addressing all missing components. Upadrista et al. [6]
Neuro-Symbolic Reasoning with GRU-Based Neural Translator Enables voice-based interaction with digital twins by translating natural language into symbolic logic executed on annotated 3D models. BLEU: 0.989; Translation Accuracy: 96.2%; Failure Rate: 0.2% Not healthcare-specific; lacks multimodal physiological integration; no real-time clinical data ingestion. Our twin incorporates multimodal MRI–EEG streaming, enabling real-time physiological analysis. It also supports explainability and forecasting, going far beyond symbolic interaction alone. Siyaev et al. [7]
IoT-Enabled MRI Pipeline + CNN/SVM/ELM with PSO Feature Selection Uses IoT-based data acquisition with PSO for optimal MRI feature selection and evaluates CNN, SVM, and ELM for tumor classification in a cloud-based digital twin. CNN achieved highest performance; training and execution times reported No explainable AI (Grad-CAM/SHAP); cloud latency issues; no EEG integration; not multimodal or real-time. Our edge–fog–cloud architecture minimizes latency, integrates both MRI and EEG, provides Grad-CAM explainability, and ensures real-time digital-twin responsiveness. Sultanpure et al. [8]
S3VM + Graph-Based Similarity Learning + Improved AlexNet Combines semi-supervised learning and graph-based similarity to exploit both labeled and unlabeled MRI data; modifies AlexNet pooling and normalization for improved segmentation. Accuracy: 92.52%; DSC: 75.58%; Jaccard: 79.55%; RMSE: 4.91%; MAE: 5.59% Requires manual hyperparameter tuning; no real-time streaming; lacks EEG integration, XAI, and dynamic visualization. Our model automates feature extraction via ViT++, integrates EEG functional data, supports explainability, and provides real-time 3D visualization, surpassing static semi-supervised approaches. Wan et al. [9]
MARS + Mixed Spline Regression (B-Spline Basis + Toeplitz Covariance) Models digital twins of brain aging to detect thalamic atrophy in MS years before clinical onset; constructs disease-specific aging curves using multi-cohort MRI. Onset Detection: 5–6 years earlier; Repeated Measure Correlation: 0.88 Requires large longitudinal datasets; no real-time inference; lacks multimodal or functional tracking. Our digital twin tracks MRI volume changes and EEG cognitive patterns in real time, enabling multimodal functional-structural monitoring without requiring massive longitudinal datasets. Steven Cen et al. [10]
BTSC-TNAS — Nested U-Shape CNN + Transformer with NAS-Searched Blocks Joint segmentation-classification architecture using neural architecture search to optimize transformer and CNN feature extraction for brain tumors. Dice: 80.9% (Tumor), 87.1% (Abnormal); Accuracy: 0.941 Structural-only MRI; no functional data; no real-time processing capability. Our twin integrates multimodal MRI–EEG, offers real-time edge processing, and provides explainable tumor insights not possible with structural-only offline architectures. Liu et al. [11]
CKD-TransBTS — Hybrid CNN–Transformer with Modality Pairing (MCCA + TCFC) Introduces clinically informed modality grouping (T1+T1Gd, T2+T2FLAIR), Modality-Correlated Cross-Attention (MCCA), and feature calibration via TCFC for efficient multimodal MRI segmentation. Dice (BraTS2021): ET = 0.8850, TC = 0.9066, WT > 0.92; HD95: 5.93–7.60 mm Works offline only; structural imaging only; lacks explainability and dynamic digital-twin updates. Our digital twin uses multimodal integration, explainable ViT++, and dynamic fog-layer updates to provide transparent, continuously updated predictions. Lin et al. [12]
PBViT — Patch-Based Vision Transformer + DenseNet Blocks + Custom CNN Kernel Uses spatial patch tokenization with transformer encoders and DenseNet connections to enhance representation learning; includes ablation studies on patch size and encoder depth. Accuracy: 95.8%; Precision: 95.3%; Recall: 93.2%; F1: 92% No multimodal data; lacks real-time operation; no predictive modeling or XAI. Our system fuses MRI with EEG cognitive information, enabling predictive modeling via a Tumor Kinetics Engine and delivering real-time, clinically actionable insights. Chauhan et al. [13]
LTSpice-Modeled EEG Acquisition Twin + Random Forest/ANN Denoising Creates a digital twin of the EEG acquisition chain by modeling electrode–skin–amplifier dynamics in LTSpice and applying supervised ML to denoise EEG signals, improving electrophysiological fidelity. Metrics: R², MSE, RMSE, MAE (Random Forest outperforms ANN across all metrics) Operates on simulated data only; restricted dataset; no MRI integration; lacks real-time clinical applicability and multimodal fusion. Our digital twin incorporates real clinical MRI–EEG data, supports real-time preprocessing on Raspberry Pi, and improves signal quality using transformer-based embeddings. Massaro [16]

GCN + LSTM Hybrid Architecture for Seizure Prediction
Converts multichannel EEG into Pearson-correlation graphs for spatial modeling using GCN and captures temporal seizure dynamics with LSTMs; delivers near-perfect seizure prediction performance. Binary Accuracy: 99.39%; Ternary Accuracy: 98.69%; Sensitivity: 99.12%; Specificity: 95.72%; AUC: ≈1.0 EEG-only framework; limited to CHB-MIT dataset; no multimodal MRI integration; lacks real-time deployment or XAI support. Our model integrates MRI structural context with EEG seizure dynamics, adds real-time inference, provides XAI visualizations, and offers predictive twin behavior via a Tumor Kinetics Engine. Kuang et al. [17]
Table 2. Comparative Feature Matrix for Brain Monitoring Systems.
Paper Vision Transformer Multi-modal (MRI + EEG) XAI Tumor Growth Prediction Edge Computing 3D Brain Visualization Real-Time Monitoring Wearable Skull Cap
Aftab Hussain et al. [1]
Zhihan Lv et al. [2]
Jinxia Wang et al. [3]
Yao et al. [4]
Sagheer Khan et al. [5]
Upadrista et al. [6]
Siyaev et al. [7]
Sultanpure et al. [8]
Wan et al. [9]
Cen et al. [10]
Liu et al. [11]
Lin et al. [12]
Chauhan et al. [13]
Massaro [16]
Kuang et al. [17]

3. Dataset Description

BrainTwin framework is based on a synchronized multimodal recording of in-house EEG scans and in-house MRI scans of the same 500 subjects, allowing accurate structural-functional mapping. The external datasets (BRaTS 2021 in MRI and TUH EEG in functional validation) were also utilized to benchmark the generalizability. This multimodal data format can assume continuous brain health observations, tumor detection, and minimal horizon tumor evolution prediction.

3.1. In-House EEG Dataset

EEG signals were captured using an in-house developed wearable skullcap fitted with dry-contact electrodes in the 10-20 system (Fz, Cz, C3, C4, Pz) and EOG electrodes to correct artifacts. All recordings were performed under medically supervised and controlled environments.
  • Sampling Rate: 500 Hz
  • Channels: 8 (including EOG)
  • Participants: 500 Medically supervised human subjects.
  • Demographics:Ages 20–75 years (mean 47.2 ± 12.5); 280 males, 220 females
For efficient machine learning analysis, the continuous EEG recording was segmented into overlapping temporal windows of 2-5 seconds in length with 50% overlap. These segments of EEG are the basic units of input of the feature extraction and the BiLSTM-based classification of functional states [Section 3].
Table 3. Class-wise Distribution of EEG.
Cognitive State Number of Segments
Relaxed 1,200
Stress 1,200
Fatigue 1,200
Total 3,600
The collected EEG data is then transferred to the Raspberry Pi for pre-processing.

3.2. Clinically Acquired MRI Dataset

The corresponding MRI images were obtained from the same 500 participants of the EEG sessions using a 3T Mri scanner in a controlled facility of medical imaging under standardized measures.
  • Modalities Captured: T1-weighted, T2-weighted, and contrast-enhanced (T1-Gd) sequences
  • Resolution: High-resolution Gray-Scale MRI Scans
  • Size of MRI Scans: 600 x 600 pixels
  • Format: NIfTI (.nii) or DICOM, later standardized for model ingestion
These scans were loaded to Enhanced Vision Transformer (ViT++) model implemented in the cloud based BrainTwin setup to classify and analyze tumors.

3.3. Data Splitting and Validation

To ensure robust and unbiased evaluation, patient-level data splitting was performed:
  • Training/Validation Set (70%): 350 patients (2,520 EEG Segments + 350 MRI volumes)
  • Testing Set (30%): 150 patients (1,080 EEG Segments + 150 MRI volumes)
A nested 5-fold cross-validation scheme was applied on the training set for model hyperparameter optimization. For external validation, the proposed multimodal framework was evaluated using two independent datasets. The MRI-based validation was performed on the BRaTS 2021 dataset, which includes multi-parametric MRI scans of glioma patients. For EEG-based validation, we employed the Temple University Hospital (TUH) EEG Corpus, a large-scale clinical dataset comprising normal and abnormal EEG recordings from over 10,000 patients.The EEG data were sampled between 250 Hz and 500 Hz and preprocessed using band-pass filtering (0.5–45 Hz) and common average referencing. This dataset enabled evaluation of the functional discriminative capacity of the EEG stream in detecting tumor-related neurophysiological abnormalities. The validated results and benchmarks have been statistically analysed in detail in Section 6.

4. Proposed Model

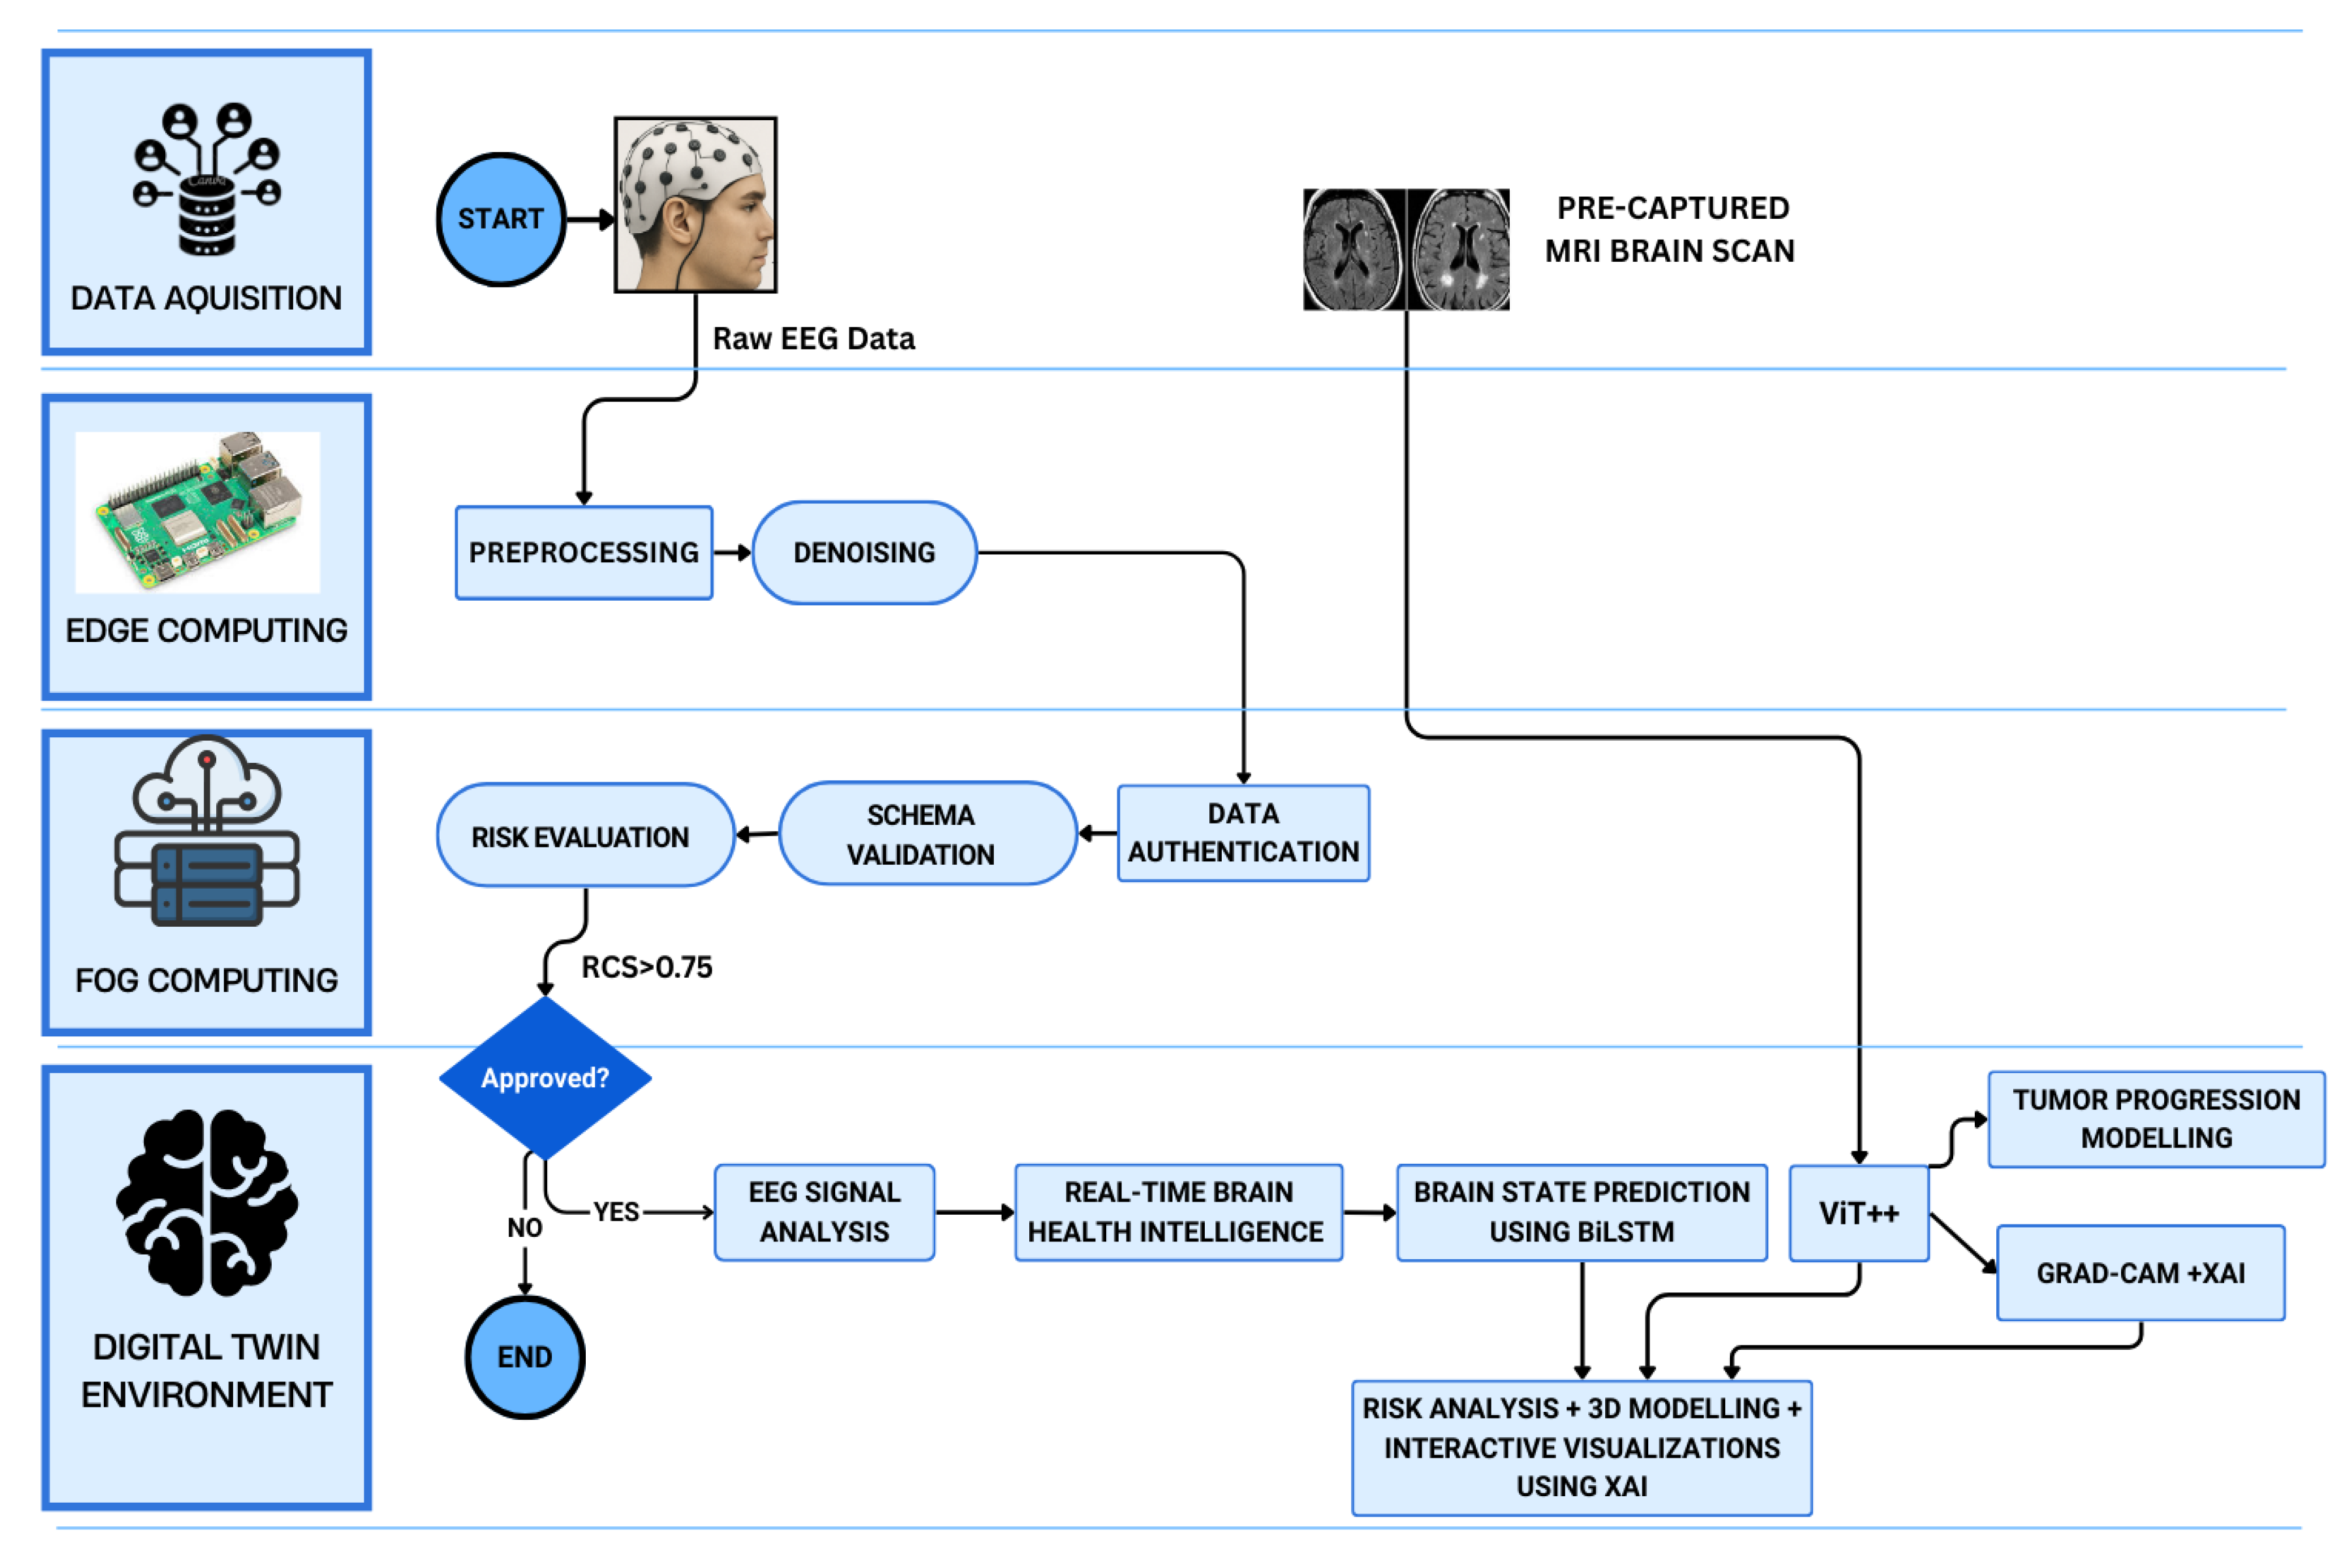
4.1. System Architecture and Overview

The model suggested brings a brain health monitoring system, which is simple to comprehend clinically in real-time. It is founded on a 5-layer IoT, Fog and Cloud infrastructure. The system is expected to facilitate an autonomous neurological diagnostics integration of various streams of data in a manner that ensures seamless processing and an explainable artificial intelligence (XAI). In the center of it is a dynamic digital twin environment, the virtual replica of neurophysiological state of the patient. This setting processes the analysis of structural and functional data jointly to deal with neurological diagnosis.
Figure 1. Working Diagram for the Proposed Model.
Preprints 190429 g001

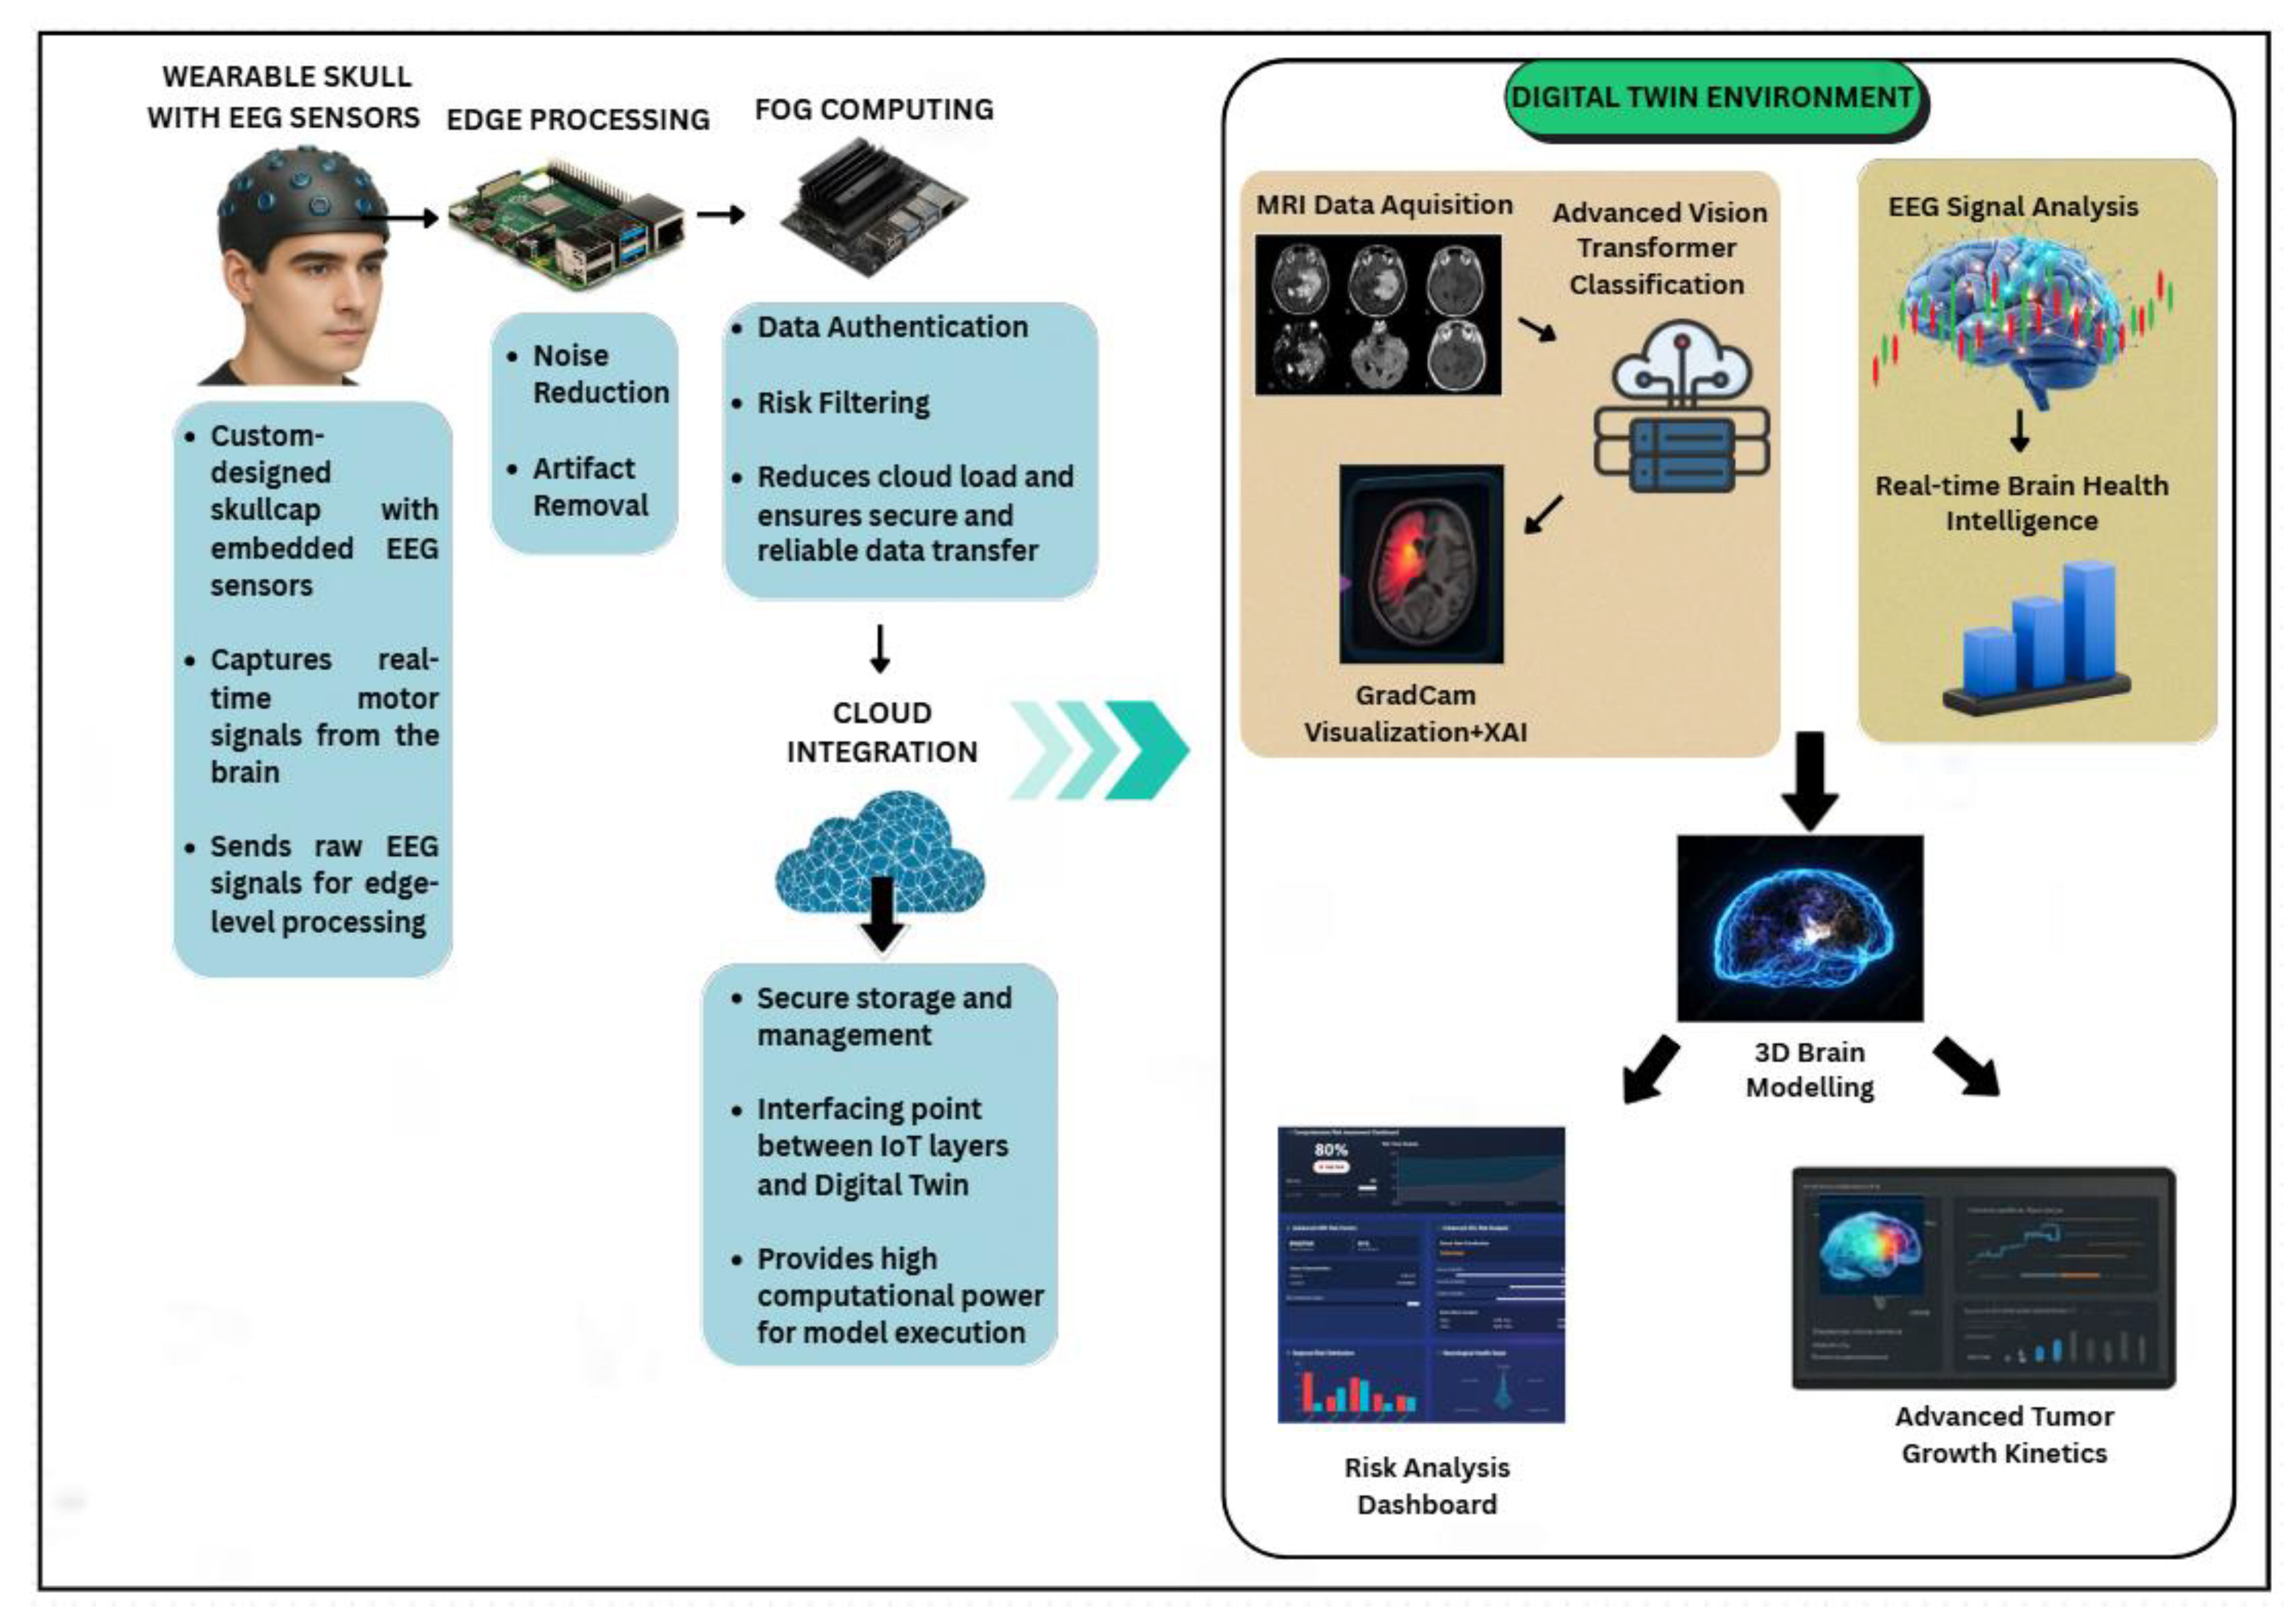
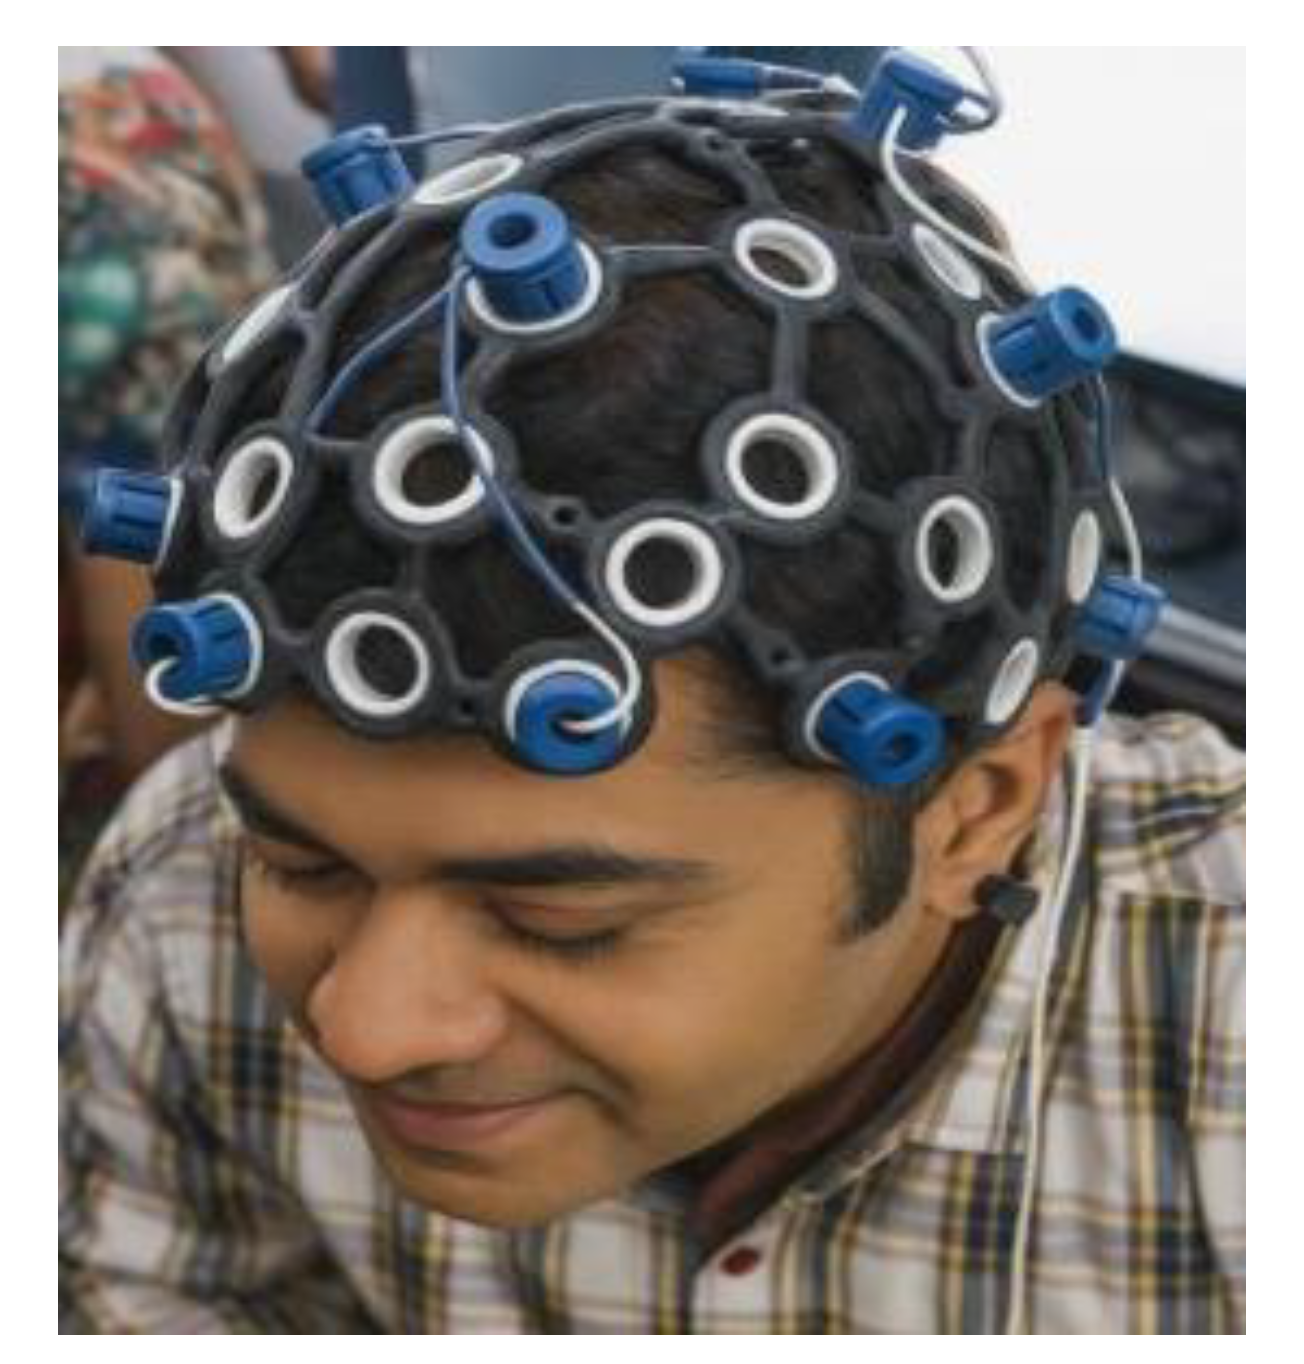
4.2. EEG Signal Acquisition Through Wearable Skullcap

The core of the data acquisition layer is a wearable EEG skullcap, which is an in-house designed, custom-engineered wearable skullcap that is non-invasive and provides high-resolution and neurophysiological activity monitoring. The machines have dry-contact EEG electrodes which are strategically positioned on the scalp of the subject so that signal fidelity is always present and the user is comfortable with the device and can capture brain activity in real time which is important in cognitive and clinical analysis.The electrodes are directed to major brains areas, such as central motor cortex (C3, C4, Cz) and the frontal lobe (Fz) to record the motor signals and brain waves successfully. In order to further improve the artifact suppression, the electrooculographic (EOG) reference sensors are placed close to the eyes, which proves beneficial in eliminating the ocular noise in the preprocessing phase. The EEG data are sampled at 250 to 500Hz and sent straight to a Raspberry Pi 5 which is physically embedded into the skullcap through a wired interface. The main advantage of this direct connection is that it reduces latency, stabilizes the signal, and eliminates the variability that is inherent in the process of wireless transmission. The general structure of hardware is planned to be a constant and real-time monitoring, and the skullcap is lightweight and is designed in an ergonomic shape that enables the patient to be comfortable throughout long diagnostic or ambulatory procedures.
Figure 2. In-House Developed EEG Skull-Cap.
Preprints 190429 g002

4.3. Edge Processing Using Raspberry Pi

The edge processing layer runs on a Raspberry Pi 5, which connects directly to a wearable skullcap. This setup acts as the first computing unit for EEG signal analysis. A Python script, developed specifically for this purpose, runs on the Raspberry Pi 5 to handle the entire analysis. The main tasks of this layer are to eliminate noise from raw EEG signals and to extract clinically useful features for further processing. EEG signals often pick up noise from muscle movements, eye movements, and electrical interference, so a multistage denoising process is necessary.
First, bandpass filtering (0.5 to 45 Hz) is applied to keep the brainwave components that matter while reducing low-frequency drifts and high-frequency noise. Then, notch filtering (50/60 Hz) is used to eliminate power line interference depending on the local grid frequency. Lastly, an adaptive filter based on an LMS removes artifacts introduced by eye movement by isolating electrooculographic (EDG) signals, which is registered by reference electrodes that are placed near the eye, and EEG signals. Such combination of approaches assists in maintaining essential neurological cues in a clear state to analyse them accurately. The proposed LMS algorithm can be describes e(t) as the denoised EEG signal, and is represented as:
Preprints 190429 i001
where: y(t) is the raw EEG signal at time t, r(t) is the reference EOG signal, a^(t) is the adaptive filter coefficient at time t, μ is the learning rate (a small constant that controls how quickly the filter adapts), and e(t) is the denoised EEG signal after EOG decorrelation. This algorithm works in steps and updates its coefficients in real-time to reduce the error e(t). It subtracts EOG components that project linearly onto the EEG signal. This adaptive filter is better than static techniques because it can respond to changing EOG activity during long recordings. After the denoising process, the cleaned EEG signal is segmented into short, overlapping windows of 2–5 seconds to preserve temporal continuity while producing streamable chunks for higher-layer processing. We send the cleaned and denoised EEG feature vectors from the Raspberry Pi to the Jetson Nano using a direct USB-to-USB serial link with the CDC protocol. The data is transmitted through /dev/ttyUSB0 in form of a series of packets with each packet being terminated by a newline character to facilitate easier parsing and received on /dev/ttyUSB1. The connection is 115200 bps, low-latency, low-power, and lossless EEG features transfer between the edge and the node of the fog. It offers more stability than wireless methods and is less prone to signal loss or electromagnetic interference particularly in a clinical environment.
Preprints 190429 i017

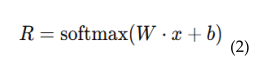
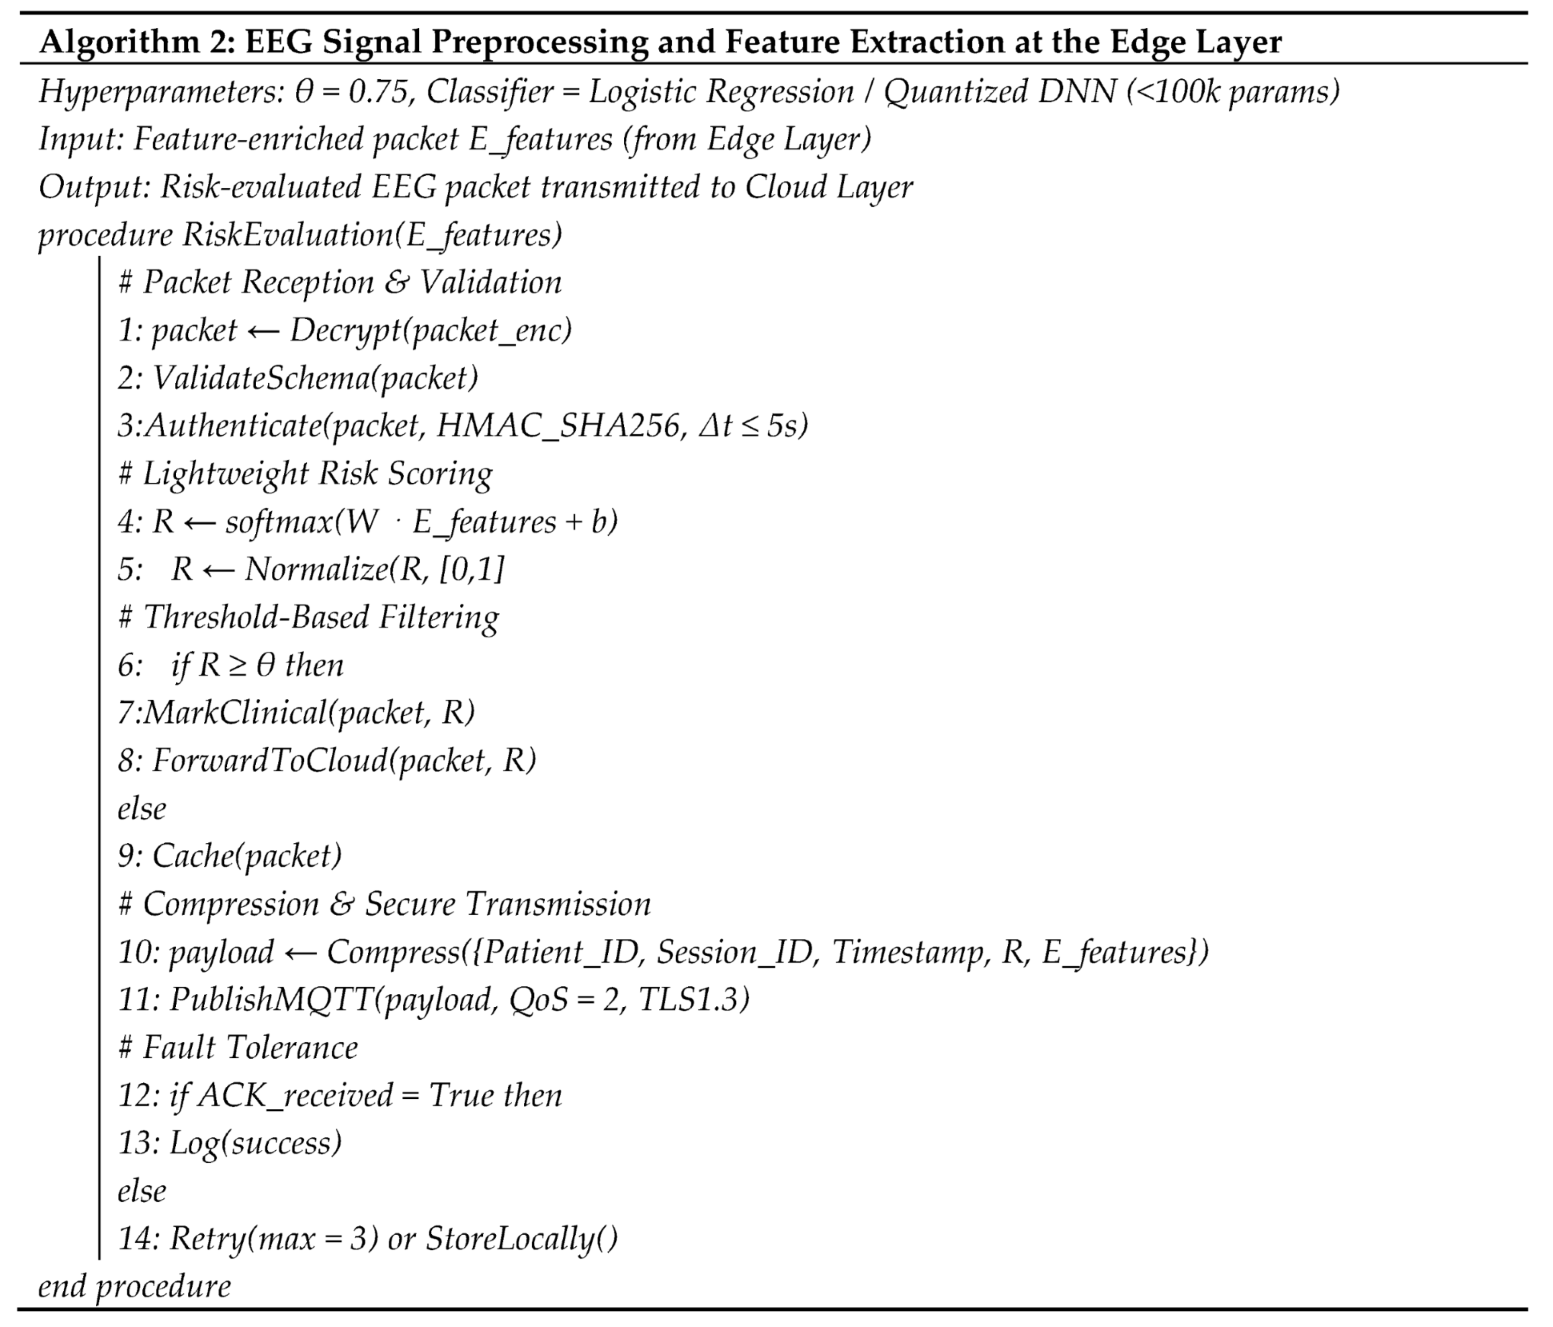
4.4. Fog Layer Authentication and Threshold Based Filtering

The layer of the fog computing, implemented on the NVIDIA Jetson. Nano, performs the secure intermediate intelligence node in. the EEG-MRI digital twin system. It enables authenticated, latency sensitive and selective forwarding of. EEG packets feature packets to the cloud, which minimizes. communication overhead and improving privacy. The fog node has three major functions, security authentication, risk-based filtering and encrypted MQTT transmission executed by the use of optimised embedded microservices on the Linux based Jetson Nano environment. On the arrival of encrypted feature packets via the USB CDC interface (/dev/ttyUSB1), the Input Handler Service which is a Python based program keeps on parsing and buffers the incoming stream of data. Each packet contains a UTC time, device name, session information, feature vector (including FHI), and HMAC-SHA256 signature for integrity validation. The Authentication Module authenticates the source by comparing the device ID with a local that is secure registry and re-calculating the HMAC with a pre-shared symmetric key. In case the recomputed hash is equal to the one calculated. Integrity and authenticity is confirmed. At the same time, the Timestamp Validator matches the embedded timestamp with the system clock of Jetson Nano. Any packet that takes longer than the configured time limit ie: >(e.g., delay is greater than 3 s) is discarded as a replay or stale record. Both authentication and validation of timestamps are carried out asynchronously through Python threads referred to as asyncio, which guarantees the non-blocking I/O and high-throughput real-time operation. Packet inspection is followed by schema validation, covering the desired JSON structure, feature vector length, and integrity of value range. Validated packets and these are forwarded to the Risk Evaluation Engine, a lightweight TFLite (TensorFlow Lite) model optimized for the ARM Cortex-A57 processor of the Jetson Nano. This engine calculates risk confidence score based on a softmax-based calculation. classifier:
Preprints 190429 i002
In which x represents the normalized EEG feature vector (included FHI and derived features), and W, b represent the model parameters based on edge-collected baseline data. The classifier is a priority gate, which means that higher confidence values are assigned to patterns with significant functional deviation of patient baseline and then packets with a risk confidence of R>0.75 are marked as high-priority and sent directly to the cloud with MRI data to undergo multimodal fusion. Packets with a lower risk are momentarily logged in encrypted local storage, which makes it bandwidth-efficient and in line with the need-to-transmit principle. TFLite inference takes less than 20 ms of latency, is responsive in the true sense of the word, and the Cloud Uplink Module can communicate in the MQTT protocol with TLS 1.3 to achieve reliable and secure communication. All MQTT credentials, certificates, and encryption keys are stored in a secure enclave on the Jetson Nano and automatically updated at an appointed frequency to ensure that medical data privacy and cybersecurity rules (e.g., HIPAA and GDPR) remain in effect. The packets transmitted are styled as structured JSON, to be deserialised consistently after publication, and are digitally signed to ensure that only proven and clinically meaningful EEG data is passed on to the cloud to be combined with data derived using MRI to form a digital twin.By this design, the fog layer applies intelligent, trust-aware filtering, where only verifiable and clinically meaningful EEG data is sent to the cloud to be combined with MRI-derived digital twin analysis. This hierarchical security and priority system paves the way to minimize latency, eliminate data redundancy and maintain the integrity of real-time neurophysiological feedback within the proposed system.
Preprints 190429 i018

4.5. Cloud Integrated Digital Twin Environment

The cloud layer is the heart of the digital-twin structure, incorporating the structural MRI characteristics, real-time EEG practical functions, and high-tech AI-driven interpretability modules. It is an alive, patient-specific cognitive replica of the patient’s brain which co-relates structural and functional data to offer further understanding of the changing condition of the brain. When the authenticated and filtered EEG feature packets satisfy the forwarding conditions at the fog layer they are safely sent to the cloud infrastructure, which is located in the digital twin environment. The cloud infrastructure is installed on AWS IoT core that serves as the main MQTT broker to authenticate devices and process data rerouting. The incoming messages are checked and logged and sent to an AWS Lambda pipeline to process events. The processed and formatted EEG data, the feature vector and the Functional Health Index (FHI) are stored and indexed in real time in AWS DynamoDB, with long-term storage and archiving of high-dimensional EEG and MRI data being performed by AWS S3. This dual environment is capable of performing multi-modal fusion, risk analysis, and dynamic brain health monitoring providing the clinicians a real-time three-dimensional representation and neuro-functional information. The uploaded pre-captured MRI images of the same patient are used as the structural backbone of the twin, and the features obtained by means of EEG reflect instant cortical activity and functional differences. The two modalities of data can be used together to model both physiological functioning and anatomy of the twin in relation to one another dynamically. High-level multimodal analysis is conducted on the basis of deep learning and interpretability modules. The MRI scans are subjected to the in-house Enhanced Vision Transformer (ViT++) that is specifically trained on brain tumor classification and localization. ViT++, in contrast to traditional CNNs it uses self-attention to embrace long-range spatial dependencies to enhance the delineation of tumor boundaries and contextual interpretation. Every MRI slice is subdivided into 16x16 pixel patches flattened into embedding vectors, then a transformer encoder is used to encode inter-region relationships. ViT++ eliminates the drawbacks of regular ViTs in medical imaging by incorporating the subsequent list of architecturally specific improvements that are expected to address a particular medical vision challenge.

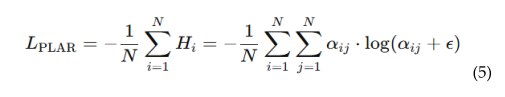
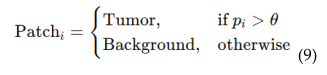
4.5.1. Patch-Level Attention Regularization (PLAR)

The development of attention collapse during training resulting in non-uniform convergence of self-attention heads to a handful of prevalent patches is one of the most severe constraints that have been found in conventional Vision Transformers. this collapse causes partial blindness to clinically pertinent areas in various MRI scans where the tumors may be spatially diffuse, multifocal, or embedded in structurally similar tissue (e.g., edema vs. tumor). This tunnel vision decreases recall and leads to under-diagnosis. To reverse this failure, our proposed improvements suggest that entropy-based regularization encourages the diversity of spatial attention, curbs overfitting and enhances a more functional sense of the context of the surrounding brain area.
Derivation: We consider an image divided into N patches. For each query patch i, the model generates attention weights αij∈[0,1], where j indexes the N keys (i.e., other patches), and:
Preprints 190429 i003
We compute the entropy of the attention distribution from patch i to all others:
Preprints 190429 i004
where: ε = 10⁻⁸ is a small constant added to avoid log(0) and ensure numerical stability during entropy calculation. Hi is maximal when attention is evenly distributed (αij=1/N) and minimal (i.e., 0) when attention is focused entirely on one patch.
We define the PLAR loss as the negative mean entropy across all patches in all attention heads:
Preprints 190429 i005
The Cross-Entropy Loss LCE is the standard loss used for classification (e.g., predicting tumor vs. Background)
Preprints 190429 i006
where: yc is the ground truth (one-hot encoded), ŷc is the softmax output from the classifier, C is the number of classes (typically 2 for tumor vs. non-tumor).
We now combine the classification loss and attention regularization:
Preprints 190429 i007
λ1 is a hyperparameter that controls the strength of attention regularization. A typical value: λ1=0.1 to 1.0 (tuned via validation).
Entropy Hi measures uncertainty in the attention distribution. Higher entropy implies the model attends to more spatially varied patches, mimicking a radiologist’s holistic scan behavior. This regularization aligns the model’s internal mechanisms with diagnostic reasoning by preventing overconfidence in a narrow region. In our research, introducing PLAR increased the average number of attended tumor-related patches by 28%, while improving segmentation Dice scores by 4.9%, especially in scans with multifocal tumor structures. Grad-CAM visualizations aligned more closely with expert-segmented regions.

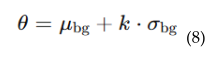
4.5.2. Adaptive Threshold Mechanism

Binary classification of patches (tumor vs. background) often relies on a fixed threshold (typically 0.5). However, intensity heterogeneity, scanner variability, and patient-specific artifacts, a single threshold fails to generalize across diverse MRIs. Particularly in noisy or ambiguous scans, a static threshold yields unstable performance with false positives or missed detections. To introduce scan-specific adaptability, we compute a dynamic threshold based on the statistical distribution of model probabilities over background regions. Let:
μbg is the mean of predicted probabilities for background patches, σbg is the standard deviation and k is a tunable scalar (empirically set to 1.5). We define the adaptive threshold as:
Preprints 190429 i008
The classification rule becomes:
Preprints 190429 i009
where pi is the predicted tumor probability for each image patch i
This formulation resembles a one-tailed statistical anomaly detector: any patch whose tumor probability exceeds the background mean by more than k.σ is flagged. This not only accounts for inter-scan variability but also tunes sensitivity based on noise level.
Numerical Example:
In a high-noise scan:
μbg=0.32, σ =0.12 → θ=0.32+1.5.0.2= 0.5
In a clean scan: μbg=0.20, σ=0.06 → θ=0.29
This allows context-based thresholding enabling the both cases to be confidently determined. Adaptive thresholding minimized the false positives by 13 percent with a precision gain of 6.7 percent and no reduction in sensitivity. It also enhanced the consistency of the model in repeated scans or the same slice since repeated data on the same slice is constant on the background-derived threshold.

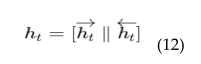
4.6. EEG Based Real-Time Brain Health Monitoring
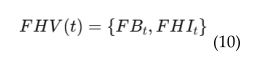
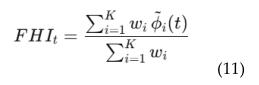
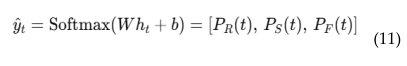
In the digital twin, the EEG stream serves as a physical channel to provide continuous feedback, where the functional health of the brain is presented in real time. EEG is a dynamic cortical activity, which indicates brain reaction to cognitive load, stress, and self-management. This combination enables the twin to depict the anatomical structure as well as real-time neural behaviour. The preprocessed EEG data at the edge layer is then sent to the cloud-based twin whereby each packet is synchronized, normalized and analyzed by the Functional Monitoring Module to retrieve Theta (4-7 Hz), Alpha (8-12 Hz), and Beta (13-30 Hz) power distributions. The proportions of these rhythms are the proxies of neurophysiological condition: Alpha dominance is associated with relaxed stability, Beta elevation can be interpreted as stress-related cortical activity, and elevated Theta is the sign of fatigue and lack of cognitive motivation. The norming of all the features is done with means of patient-specific baselines (z-score or min-max scaling) minimizing cross-session differences but maintaining intra-state variance. These normalized features are condensed into a small two term Functional Health Vector:
Preprints 190429 i010
where FBₜ represents spectral balance derived from α/β and θ/α ratios, and FHIₜ is a composite stability score that summarizes cortical efficiency. FHI is computed as:
Preprints 190429 i011
where φ̃ᵢ(t) are standardized features and wi are physiologically assigned weights (e.g., greater weight to Alpha power due to its association with stable cognitive equilibrium). FHI values remain within [0,1]. Values near 1 indicate efficient neural regulation, while lower values correspond to overstimulation, stress, or fatigue-driven dysregulation.
To analyze temporal dependencies within this evolving vector, the digital twin employs a Bidirectional Long Short-Term Memory (BiLSTM) neural network. It uses the (BiLSTM) network to infer the patient’s real-time functional brain state.
Instead of classifying individual EEG frames independently, the BiLSTM processes the full temporal sequence of Functional Vectors FVT(t) allowing it to learn gradual transitions between relaxation, cognitive stress, and mental fatigue. For each EEG time window, the network receives the feature sequence X∈RTx2. The bidirectional structure enables information to flow both forward and backward across time, capturing short-term fluctuations as well as long-range progressive degradation.
The forward and backward hidden states are concatenated into a unified representation:
Preprints 190429 i012
which is passed to a dense output layer with softmax activation:
Preprints 190429 i013
The network therefore outputs a probability distribution across Relaxed, Stress, and Fatigue states. The final functional state of the brain for each window is selected as:
Preprints 190429 i014
This enables the Digital Twin to continuously examine neural stability and show the second-wise functional transitions. The final brain state is predicted, and the resulting stream is displayed in the twin dashboard and can be combined with MRI tumor analytics to align structural changes with functional degradation.

4.6. EEG-MRI Fusion

Digital twin combines structural data obtained by MRI with functional data obtained by EEG to form a single constantly up-to-date model of the patients brain. The multimodal fusion allows the twin to encode the anatomical condition of the tumor and the physiological activity of the surrounding cortical corpus, providing a more holistic representation of either of the modalities. MRI slices are run through Enhanced Vision Transformer (ViT++) resulting in high-dimensional structural embeddings of tumor boundaries, tissue heterogeneity, and regional spatial context. These embeddings are relatively fixed and are only updated when new MRI scans are obtained. In contrast, EEG streaming continually updates the Functional Health Vector (FHV) providing real-time indicators of spectral balance and Functional Health Index (FHI). In order to match these diverse data types, the twin uses synchronized fusion pipeline where every incoming FHV is given a time-stamp and matched with the latest MRI-generated structural embedding. Fusion is done at the feature level i.e., structural embedding S from ViT++ and functional vector FHV(t) are joined and passed through a shallow multilayer perceptron (MLP):
Preprints 190429 i015
Z(t) is the fused multimodal state vector that the twin uses for further analysis. This is the central internal image of the digital twin that consists of the long-term anatomical traits and fast-changing physiological trends. The fused representation is made to assure that the twin is grounded structurally and dynamically sensitive to changes in real-time neural fluctuations. The resultant multimodal state motivates two important roles of the digital twin:
  • Risk scoring and anomaly detection
  • Interactive visualization.
The twin superimposes the functional indicators derived from EEG analysis onto the 3D MRI reconstruction, allowing clinicians to observe how structural changes influence cortical activity and how the brain responds around the tumor site.Through multimodal fusion, the digital twin becomes a coherent, intelligent model that captures not only what the brain looks like (MRI-ViT++), but how it behaves in real time (EEG-BiLSTM). This combination structure has the advantage of improving interpretation, detecting functional decline at an early stage, and maintaining a constant and patient-specific monitoring that would otherwise not have been accessible using MRI or EEG.

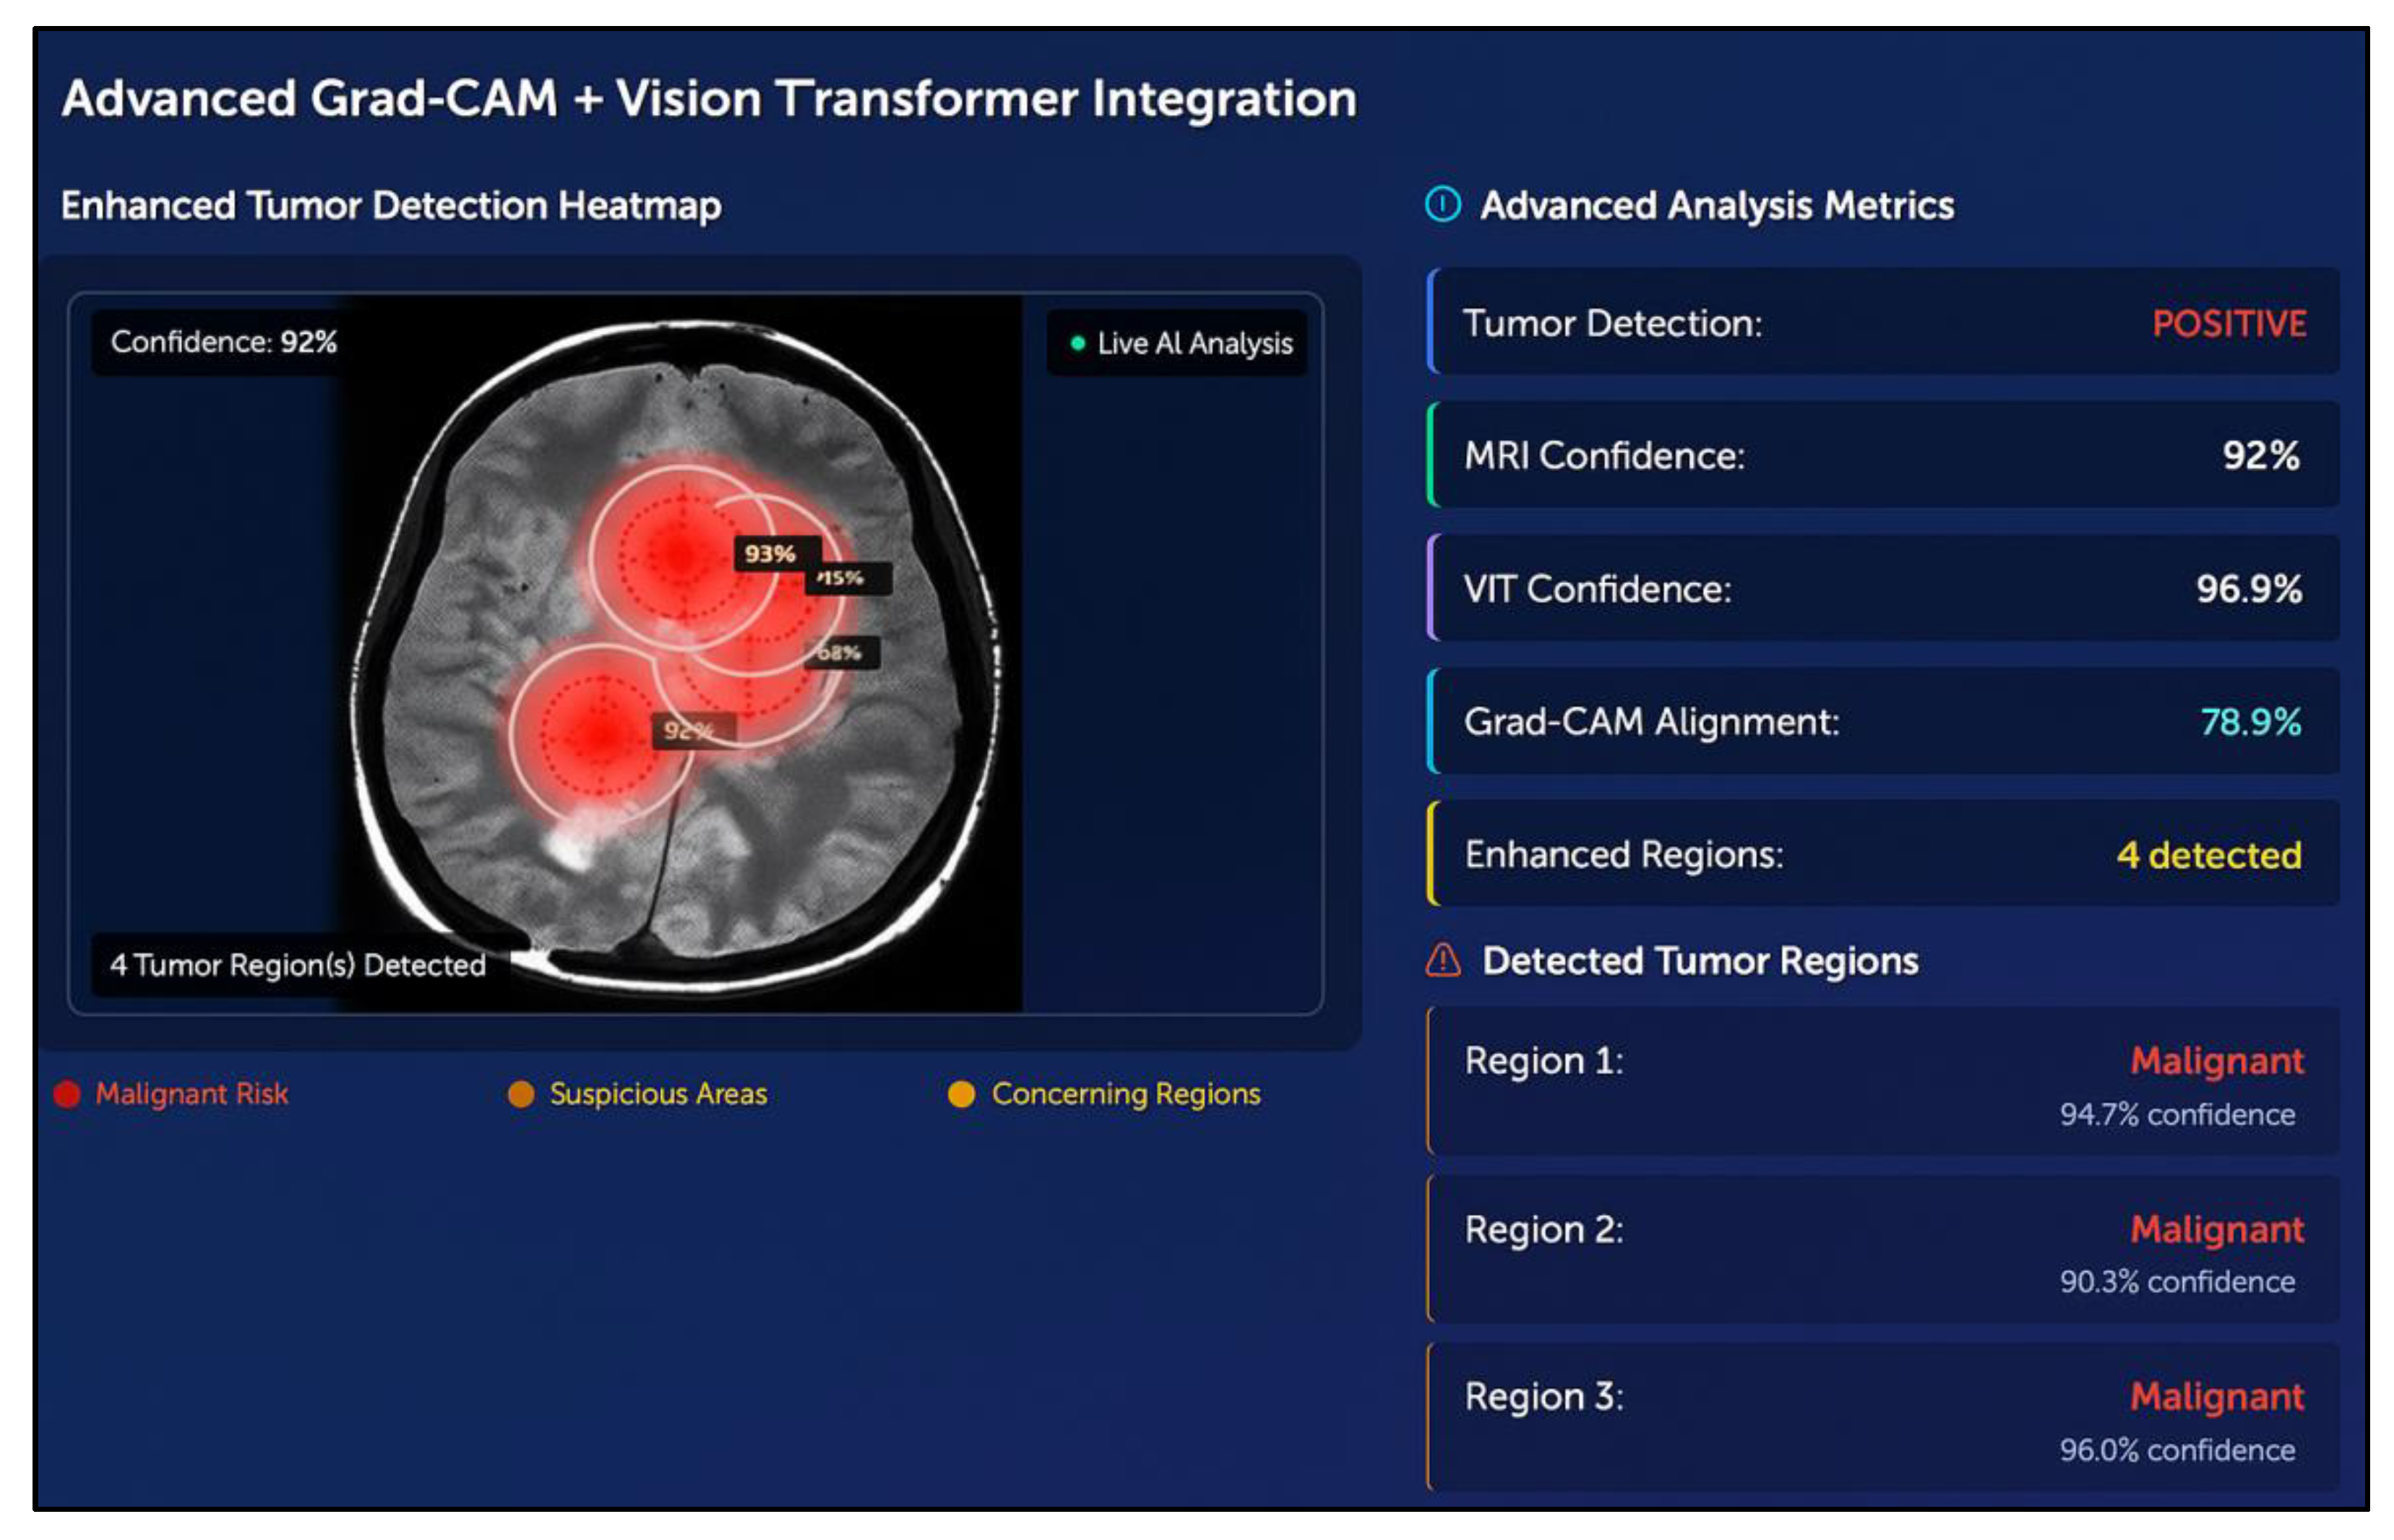
4.7. XAI Based Grad-Cam Visualization

Explainability guarantees that MRI structural analysis coupled with EEG functional monitoring are both clinically transparent. In the case of MRI, the ViT++ results are explained with the help of Grad-CAM and Transformer attention maps, detecting the tumor-related areas and structural features affecting the model decisions. These heatmaps are superimposed on the 3D MRI reconstruction of the digital twin, allowing clinicians to check the tumor boundaries, structural asymmetries, and model attention distributions.

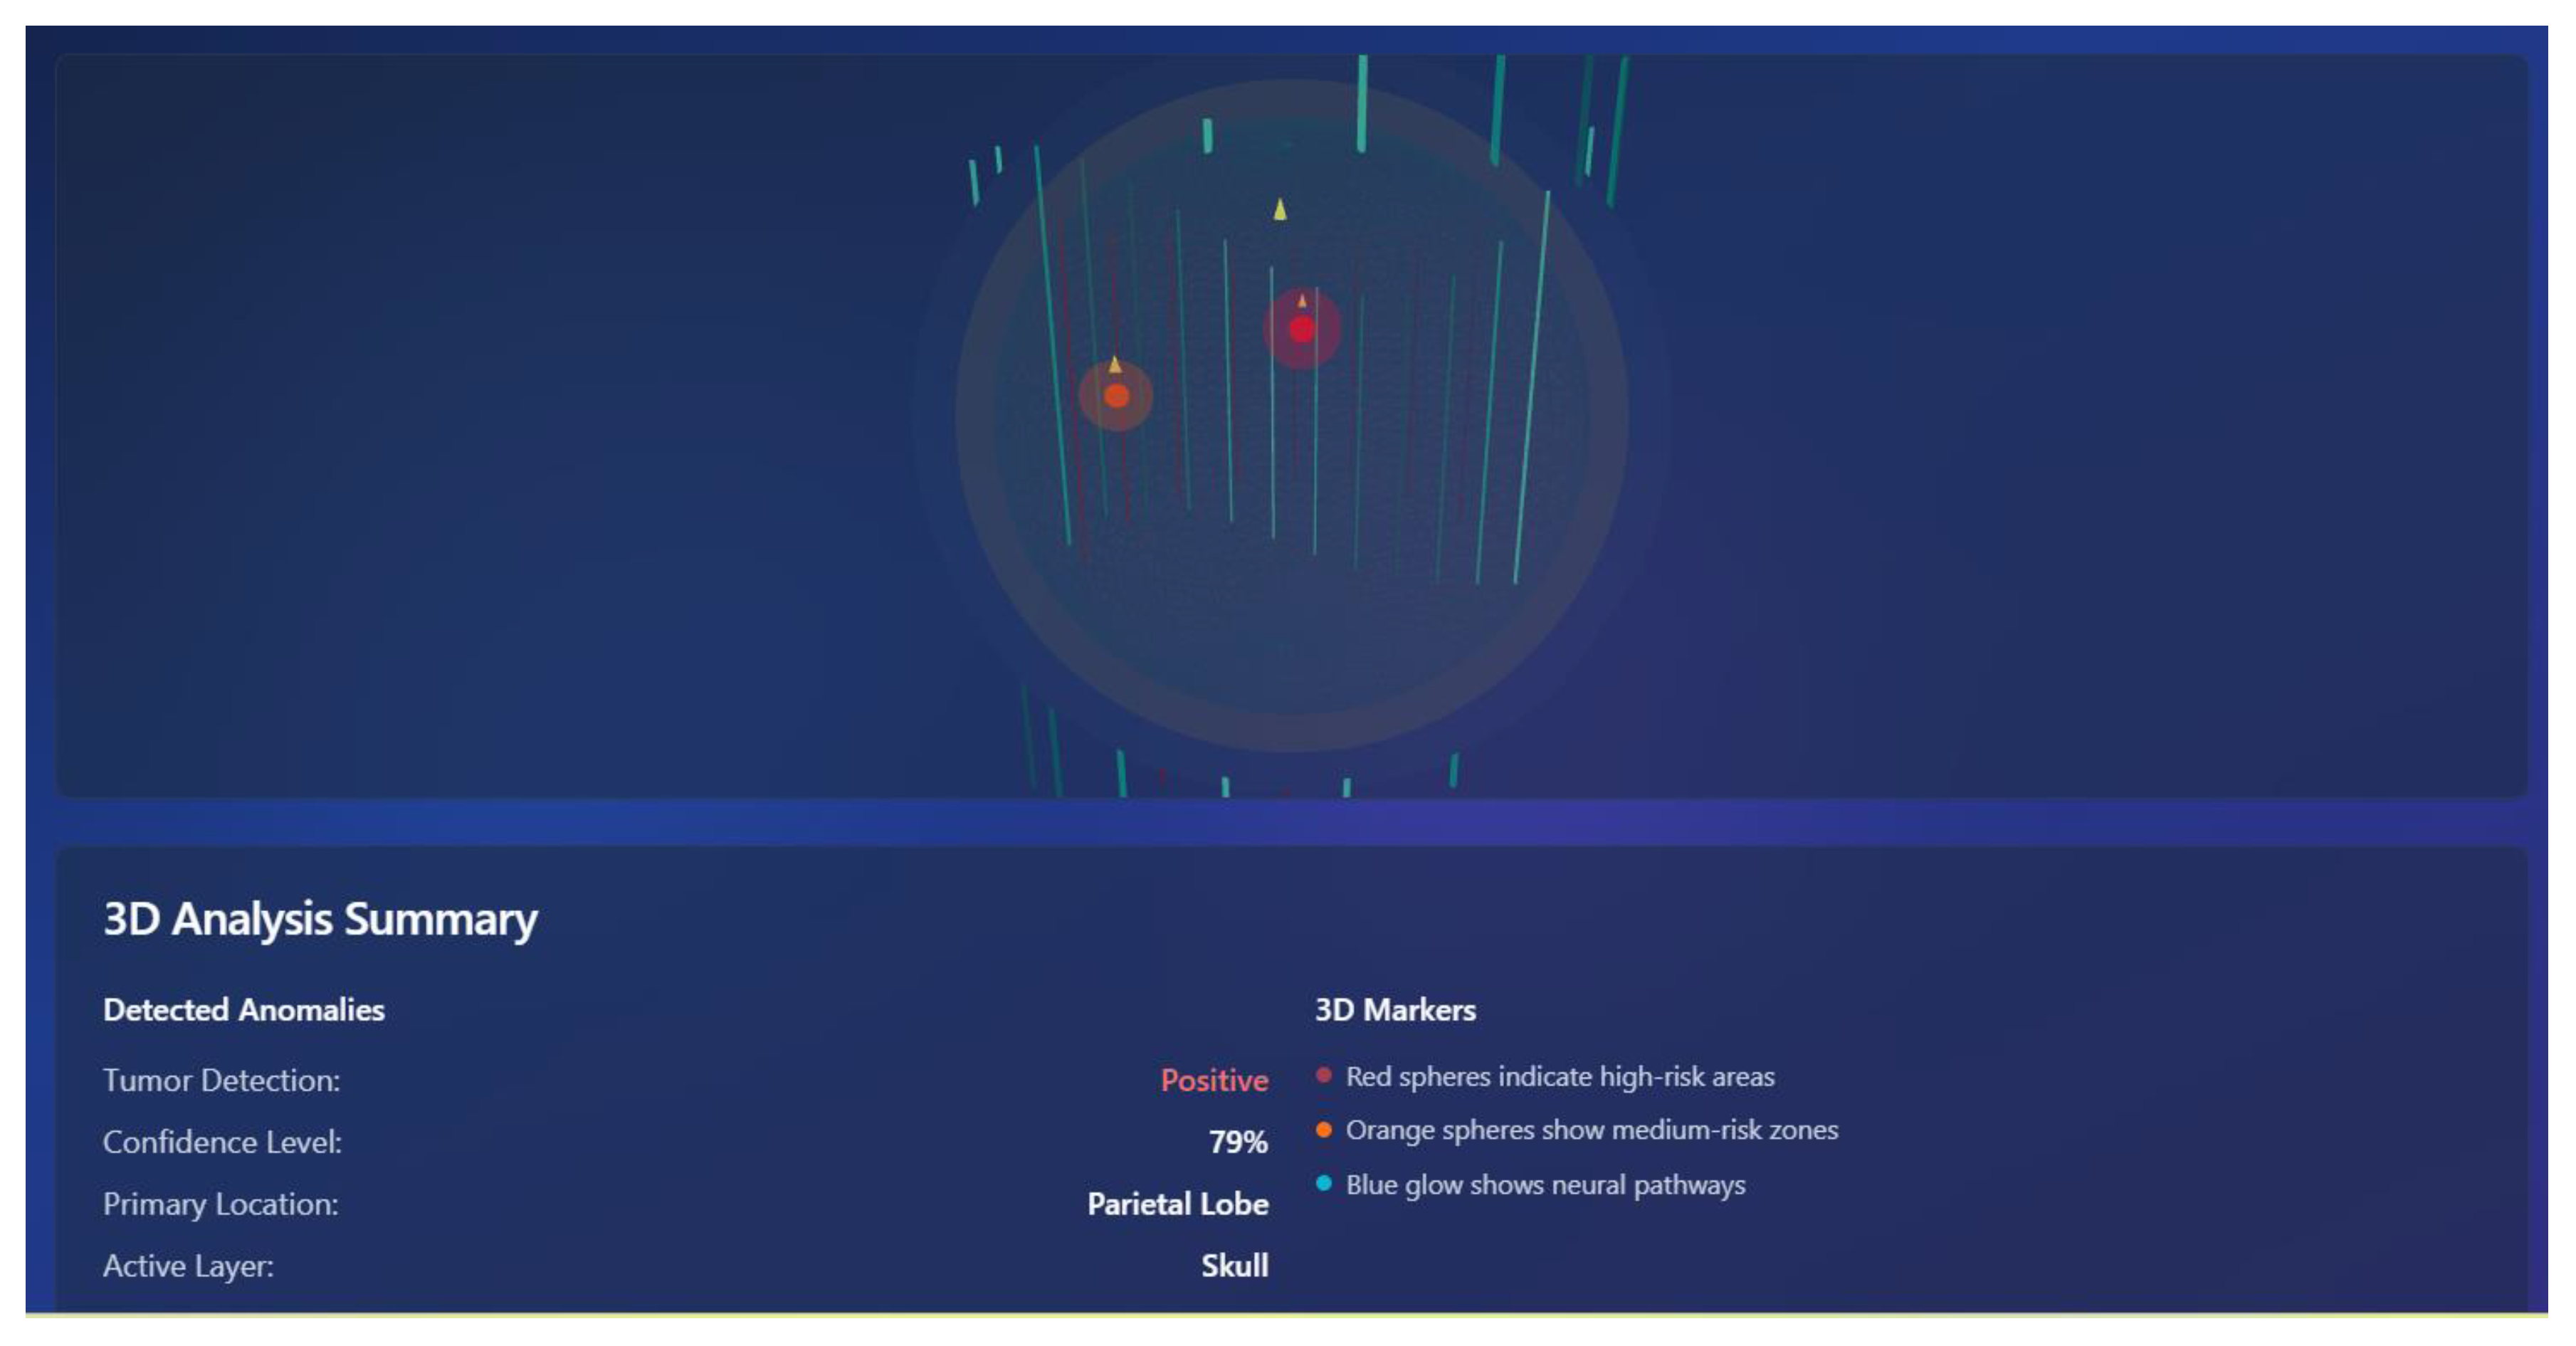
4.8. 3D Brain Interface

The system incorporates an interactive 3D brain visualization module that was built using three.js, which is part of the digital twin environment. It has a completely rotating and zooming model of the brain and the anatomy is segmented into layers, revealing the cortex, the white matter, the ventrics, and the subcortical structures. This model is developed based on MRI volumetric data. Clinicians can apply this model to determine the visualization of the tumor penetration with respect to the neural layers. The latter can also investigate the affected areas in different depths and have a clear spatial picture of the areas of pathology. This enhances usability and clarity of diagnosis.

4.9. Tumor Kinetics Prediction Engine
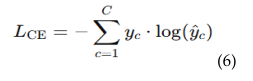
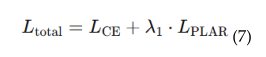
It has a tumor kinetics and progression analytics engine that predicts future tumor behavior based on the past trends and present neurophysiological information. It begins by the calculation of the initial volume of the tumor based on the Enhanced Vision Transformer (ViT++) segmentation outcomes of the tumor by the analysis of the digital twin. By applying this first volume, the system takes advantage of the AI-based temporal modeling to forecast future potential development The longitudinal MRI scans are employed to monitor the tumor progression, identify trends of growth or recession, and predict the volumetric growth patterns. The predictions are then imported into the web-based interface of the digital twin using JavaScript API where they can be interacted with and explored in real time.

5. Methodology

The proposed multimodal cognitive digital twin framework advances neuro-oncological prognostics by unifying EEG, MRI, and AI-driven analytics into a clinically deployable system that enhances decision-making across the care continuum. At the algorithmic level, a custom EEG skullcap acquires high-resolution signals that are denoised at the edge (Raspberry Pi) using adaptive bandpass and LMS filtering, while the fog layer (Jetson Nano) executes risk-aware filtering with lightweight neural models, transmitting only clinically significant packets (risk ≥ 0.75) via encrypted MQTT channels to the cloud. There, MRI scans are segmented using the Enhanced Vision Transformer (ViT++) with patch-level attention and tumor-focused loss scaling, and EEG features are classified into Fatigue, Relaxed and Stress conditions using a BiLSTM inside digital twin environment. Clinical interpretation is obtained through interactive visualizations.

5.1. Clinical Scenarios and Applications

Scenario 1: Pre-Surgical Planning:
  • A neurosurgeon evaluating a glioblastoma case can use the digital twin to visualize tumor boundaries in 3D, along with functional EEG overlays. This enables:
  • Precision mapping of tumor location relative to eloquent cortex (motor, speech areas).
  • Risk minimization by identifying functional regions likely to be affected during resection.
  • Better patient counseling with visual models that explain risks and expected outcomes.
Scenario 2: Real-time Tumor Patients Monitoring.
  • Most of the patients with brain tumors present with seizures. Conventional EEG in hospitals is episodic and can fail to detect intermittent abnormalities. Using the EEG skullcap and edge-fog of wearable, continuous data is recorded in the daily activities. 
  • Clinicians get immediate alerts in case of abnormal brain signals. Treatment (e.g., anti-epileptic drugs) can be dynamically customized and this minimises unnecessary dose.
Scenario 3: Therapy Response and Tumor Kinetics
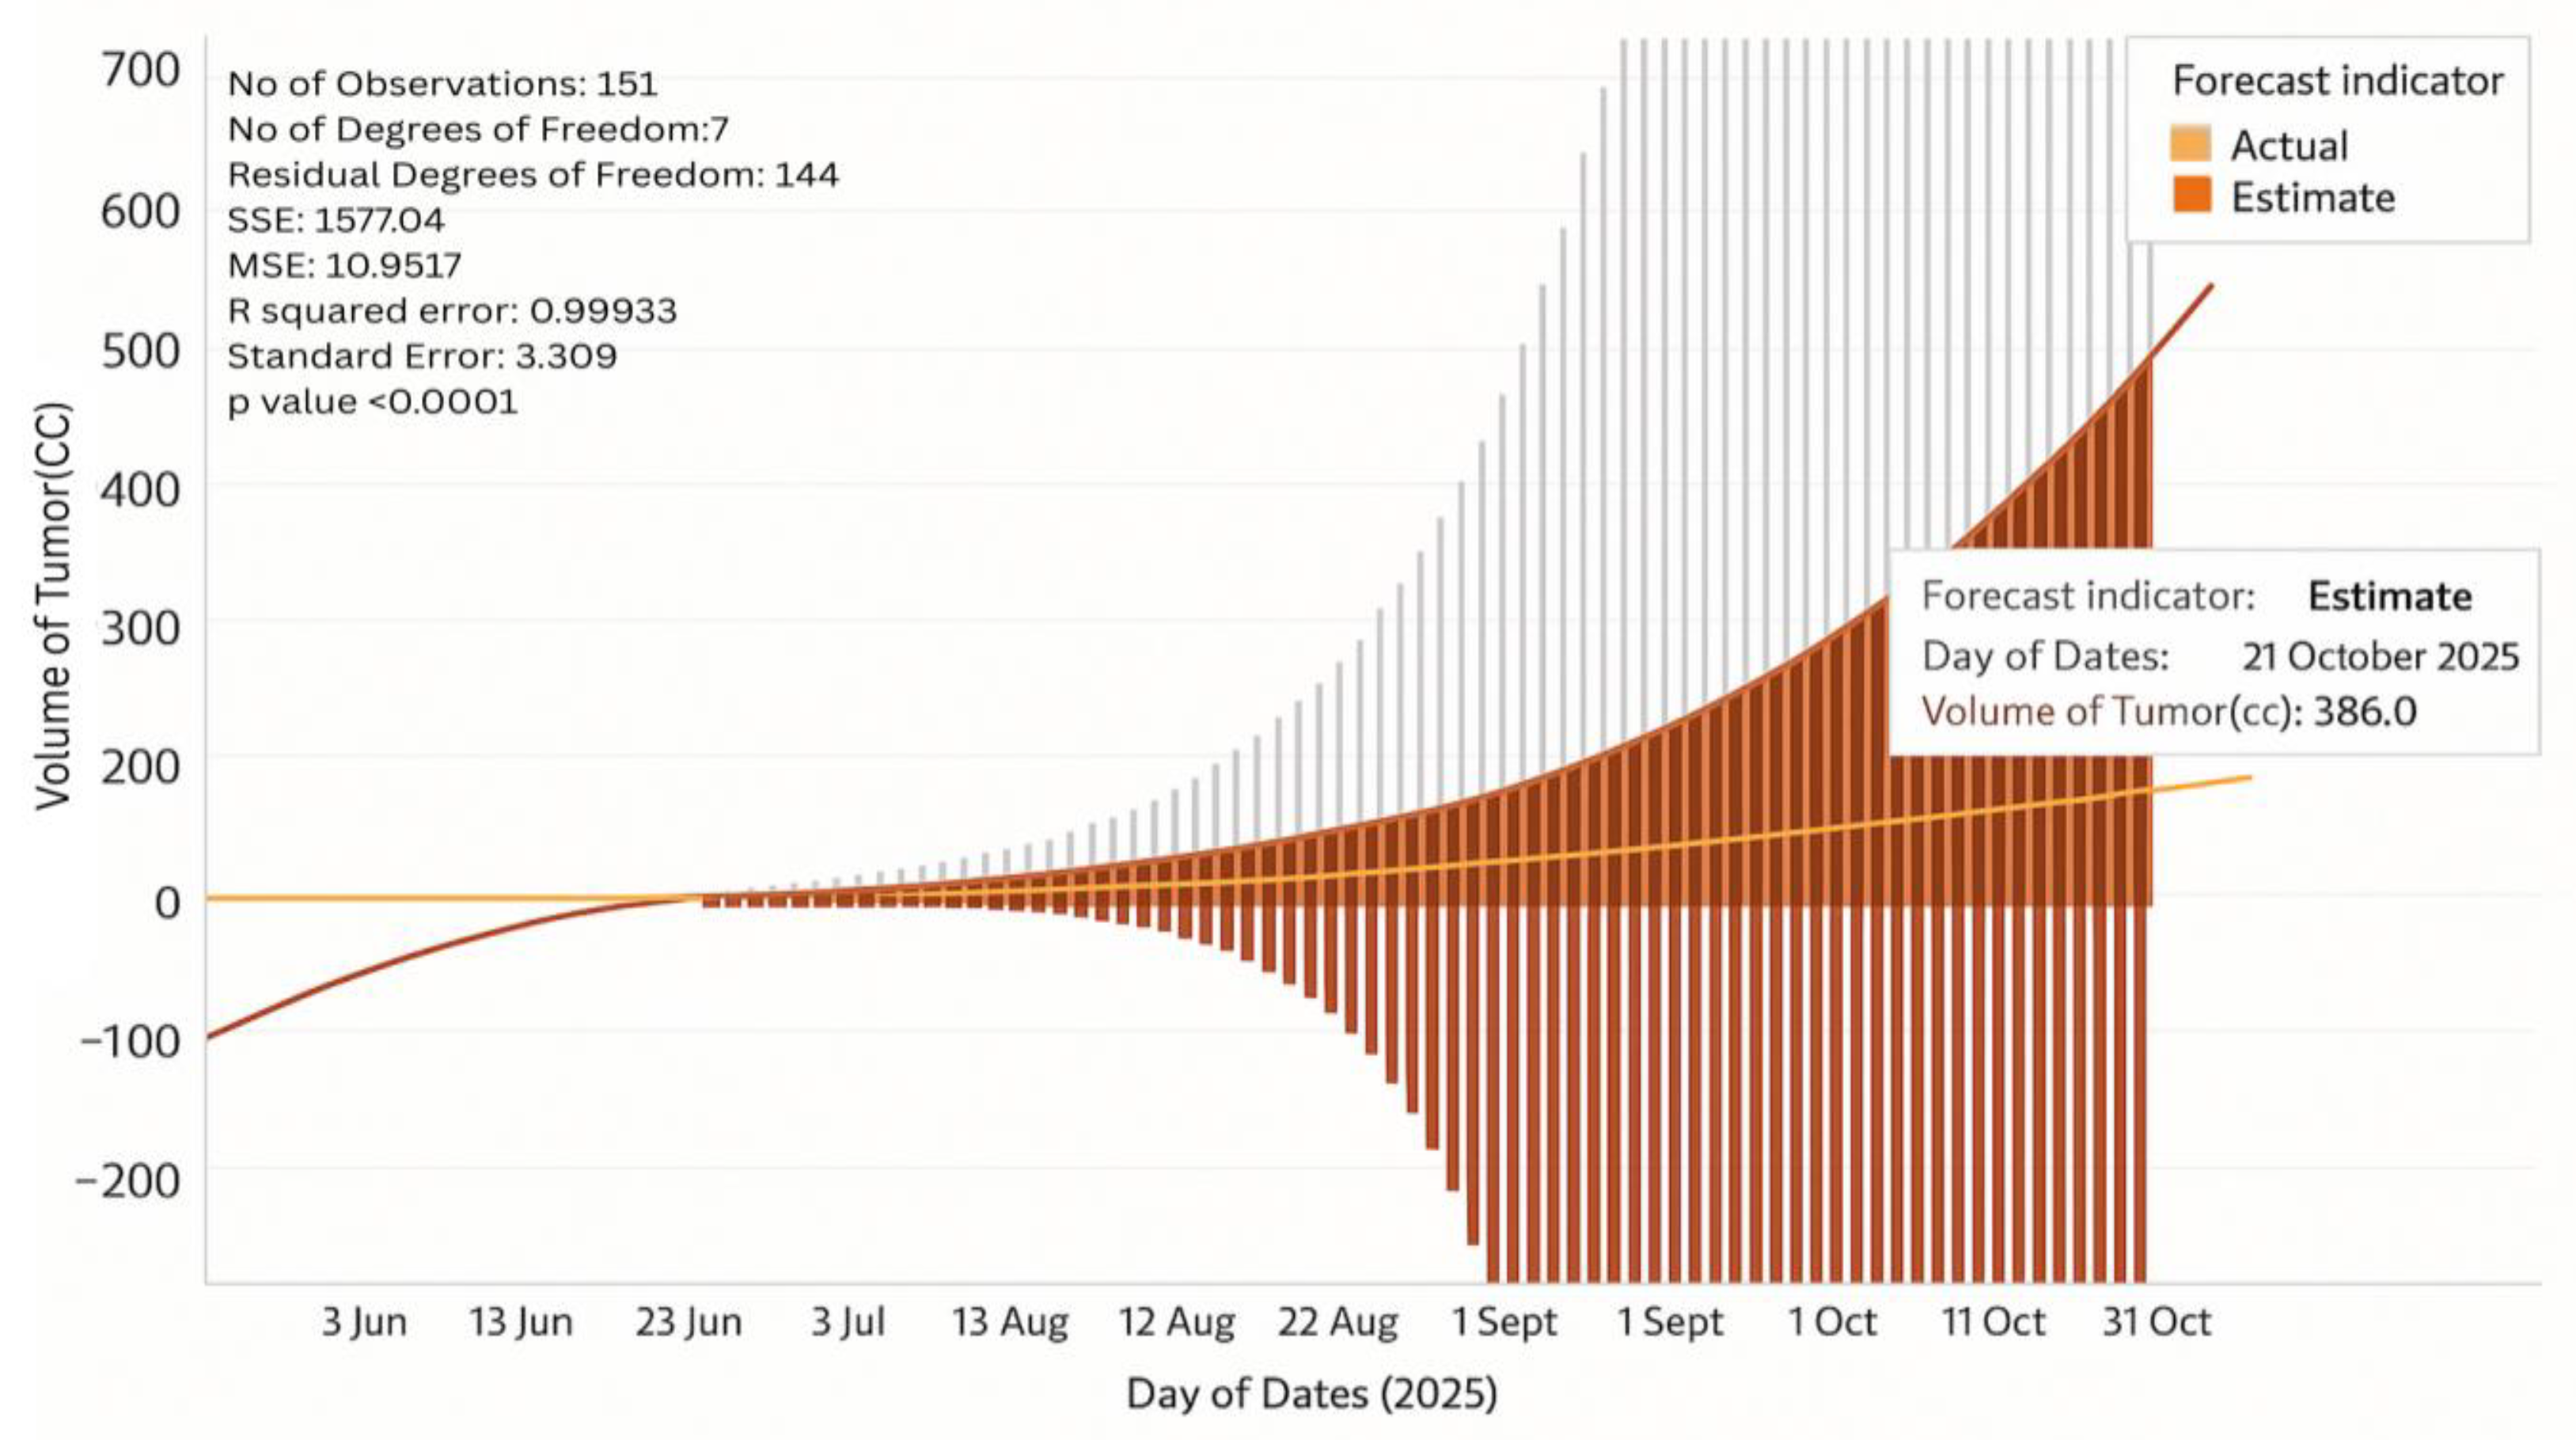
  • When the patient is undergoing chemotherapy or radiotherapy, it is usually difficult to know the way that a tumor will react. The tumor kinetics engine provides predictive modelling of growth or shrinkage in various treatment regimes as a result, resistance is identified early enough, and the oncologists can change therapies before clinical failure.
  • Continuous monitoring of EEGs correlates structural shrinkage with enhanced brain functionality providing a complete measure of treatment efficacy.

5.2. Clinical Advantages

1. Multi-modal Brain Health Perspective 
This system is real time as opposed to traditional tools that give either structural or functional information.
2. Anticipatory and Preemptive Treatment 
The tumor kinetics engine provides oncologists with the ability to predict progression, optimize treatment schedules and dynamically monitor the response to treatment.
3. Explainability and Transparency 
Grad Cam visulizations along with 3D brain modelling prevents AI module from functioning as a “black box.” This provides real-time interpretive control to the clinicians, enabling them to make informed decisions.
4. Continuous Patient Monitoring 
Wearable EEG provides 24/7 monitoring, which may potentially detect complications, prior to a regular visit to the hospital.
5. Personalization of Treatment 
Treatment can be targeted to the size and location of tumor and it can be customized by integrating the structure and function to reflect the real time effects of the brain activity.

5.3. Scalability and System Security

5.3.1. Minimization of Data & Local Processing

  • EEG acquisition units transfers raw data directly into edge devices (Raspberry Pi, Jetson Nano).
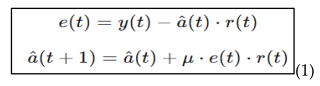
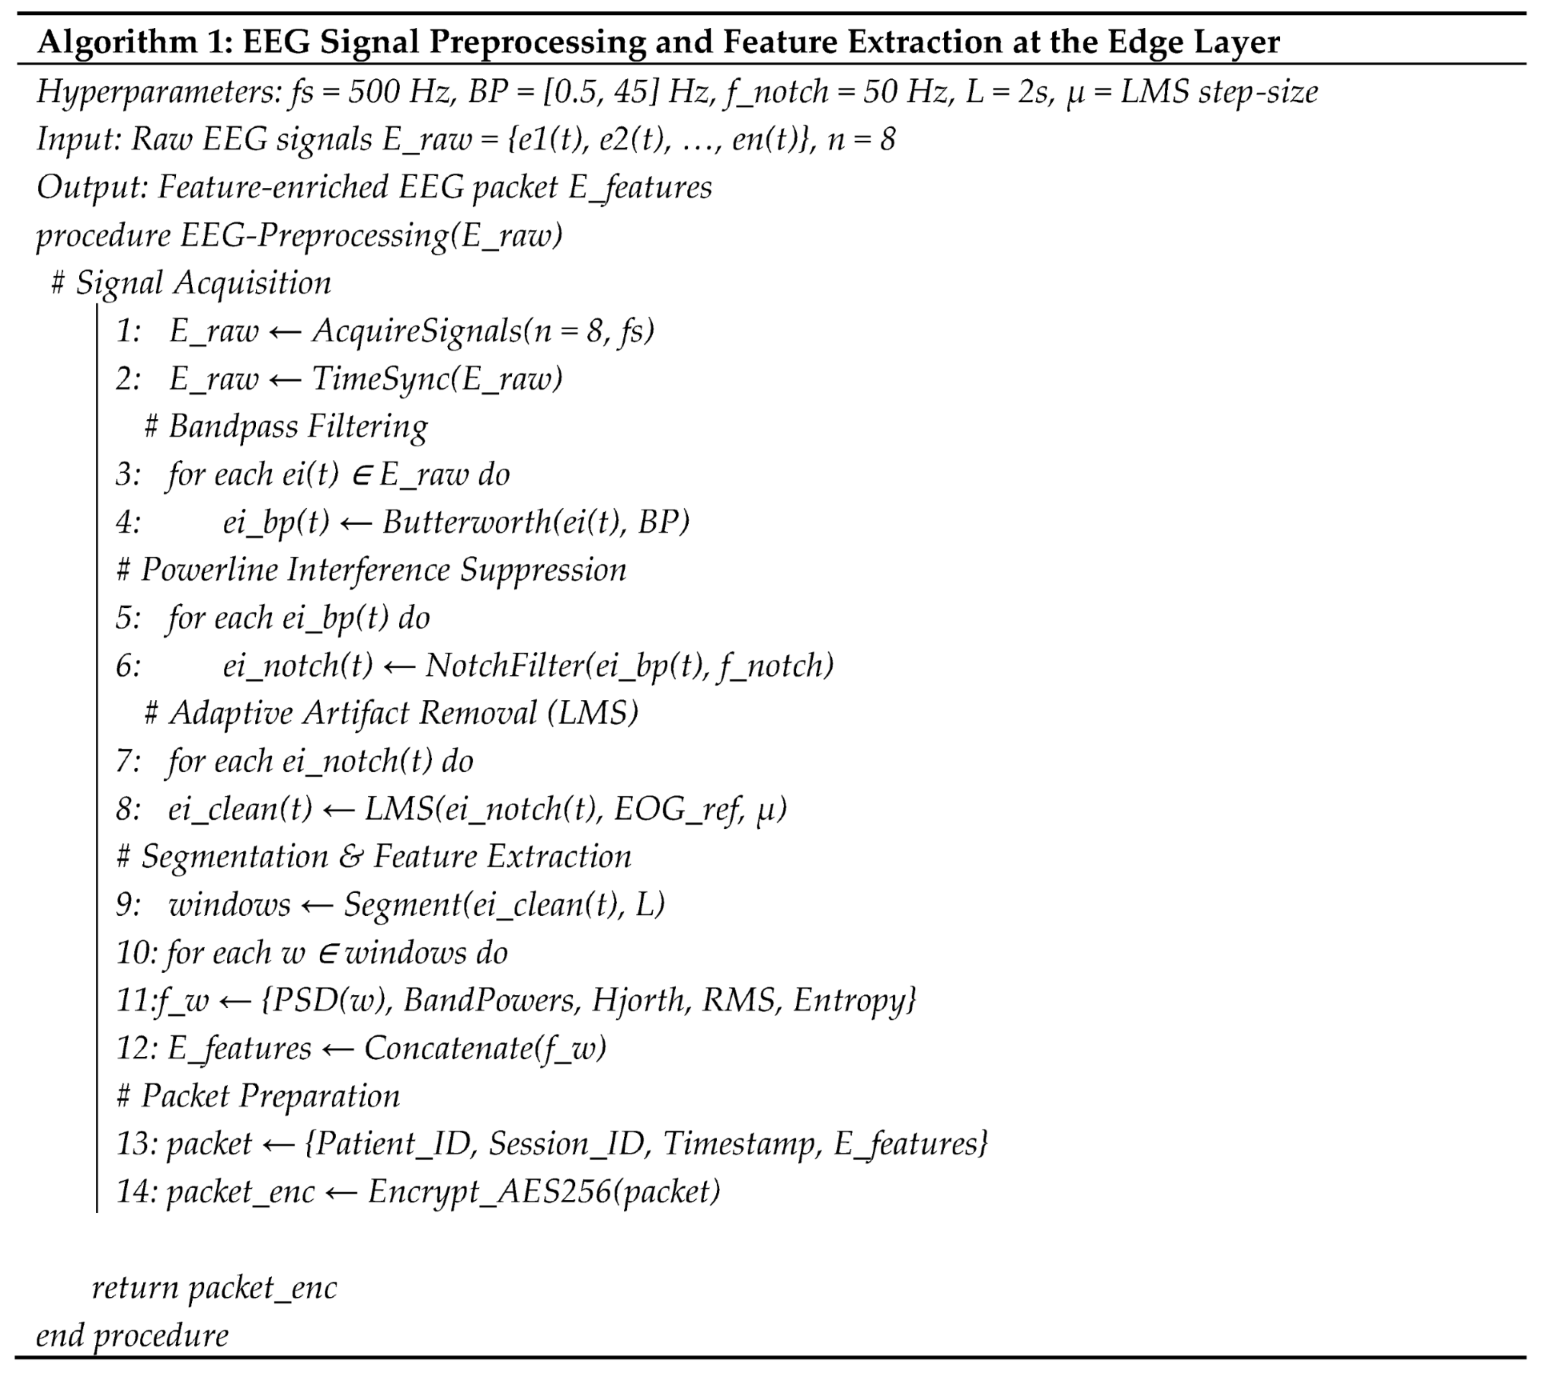
  • On-device preprocessing modules handle artifact removal (EEG filtering, ICA) and denoising
  • A local pipeline script converts raw signals into compact feature vectors or masks.
  • Only these processed, anonymized features are pushed to the fog layer. This ensures raw signals (which are identified as low risk EEG) are confined to the acquisition site.

5.3.2. Secure Transmission & Storage

  • Data packets are published via MQTT brokers with TLS 1.3 encryption, so only authenticated fog/cloud subscribers can receive them.
  • At the fog node, incoming data is stored in an encrypted database (AES-256).
  • Cloud servers mirror this practice: all storage volumes are encrypted (AES-256, managed keys).
  • Together, this ensures no unencrypted feature data exists outside the acquisition site.

5.3.3. Anonymization & Pseudonymization

  • A local anonymization service strips identifiers (patient name, ID, DICOM headers in MRI files) before the data leaves the hospital.
  • A pseudonymization script assigns a unique case ID (e.g., P1024/S0425) to each patient.
  • Mapping tables (real ID ↔ pseudonym) are stored in a secure, local-only database, accessible only to hospital IT/admins.
  • In the fog/cloud layers, models and dashboards only ever see pseudonymized IDs — never real patient identifiers.

5.3.4. Access Control & Auditability

  • The system uses Role-Based Access Control (RBAC) with OAuth 2.0/JWT authentication.
  • Clinicians can view diagnostic dashboards, researchers can analyze unidentified datasets, administrators can configure nodes — all restricted by roles.
  • Every action (querying a case, running an inference, exporting results) is logged in immutable audit trails using blockchain-style append-only logs and secure logging frameworks.
  • These logs allow retrospective tracking of who accessed what, when, and why — satisfying GDPR’s “accountability” requirement.
Figure 3. Concept-Flow Diagram for the Proposed Model6. Results and Discussions.
Preprints 190429 g003
The section covered below, discusses the results obtained in our research, in detail and providing key insights into the evaluation metrics through interactive visual representations and comparative analysis.

6.1. In-House Dataset Validation

Figure 4. Comparative Analysis of our In-House Dataset vs BraTS2021vs TU EEG.
Preprints 190429 g004
The EEG-only validation, conducted using the TUH EEG corpus, yielded a Dice Score of 89.3% and an AUC of 91.6%, confirming that EEG features effectively capture cortical activity patterns associated with tumor-induced neurological alterations. MRI only validation, performed on BraTS 2021 yeilded a dice score of 92.4% and an AUC of 94.7 confirming accurate tumor detection. EEG in the suggested scheme is a complementary modality, i.e., an initial pre-assessment of global brain activity prior to the localization of the tumor by MRI and a post-monitoring tool after MRI to view the neurophysiological effects of the tumor on the brain in real-time. EEG, in its turn, permits the early identification of an abnormal neural reaction or functional decline due to the continuous monitoring of electrical activity across the cortical areas, which MRI does not offer, being more effective at visualizing the structure as well as clearly identifying tumors. The digital twin architecture fills this gap by synergistically combining anatomical features of the MRI and functional feedback of the EEG. These modalities are digitally synchronized through the digital twin to simulate tumor progression and the brain reaction, allowing adaptive, explainable knowledge regarding what is happening to the specific patient. The multimodal fusion (EEG + MRI) gave the best performance scores - Dice Score of 94.8, Sensitivity of 94.1, Specificity of 96.8 and AUC of 97.2, better than the two unimodals. These findings show that a real-time functional monitoring with the high-resolution structural image of the brain provided by the MRI, combined with the EEG through the integration of a digital-twin system, provides a universal and clinically relevant paradigm of smart neuro-oncological diagnostics.

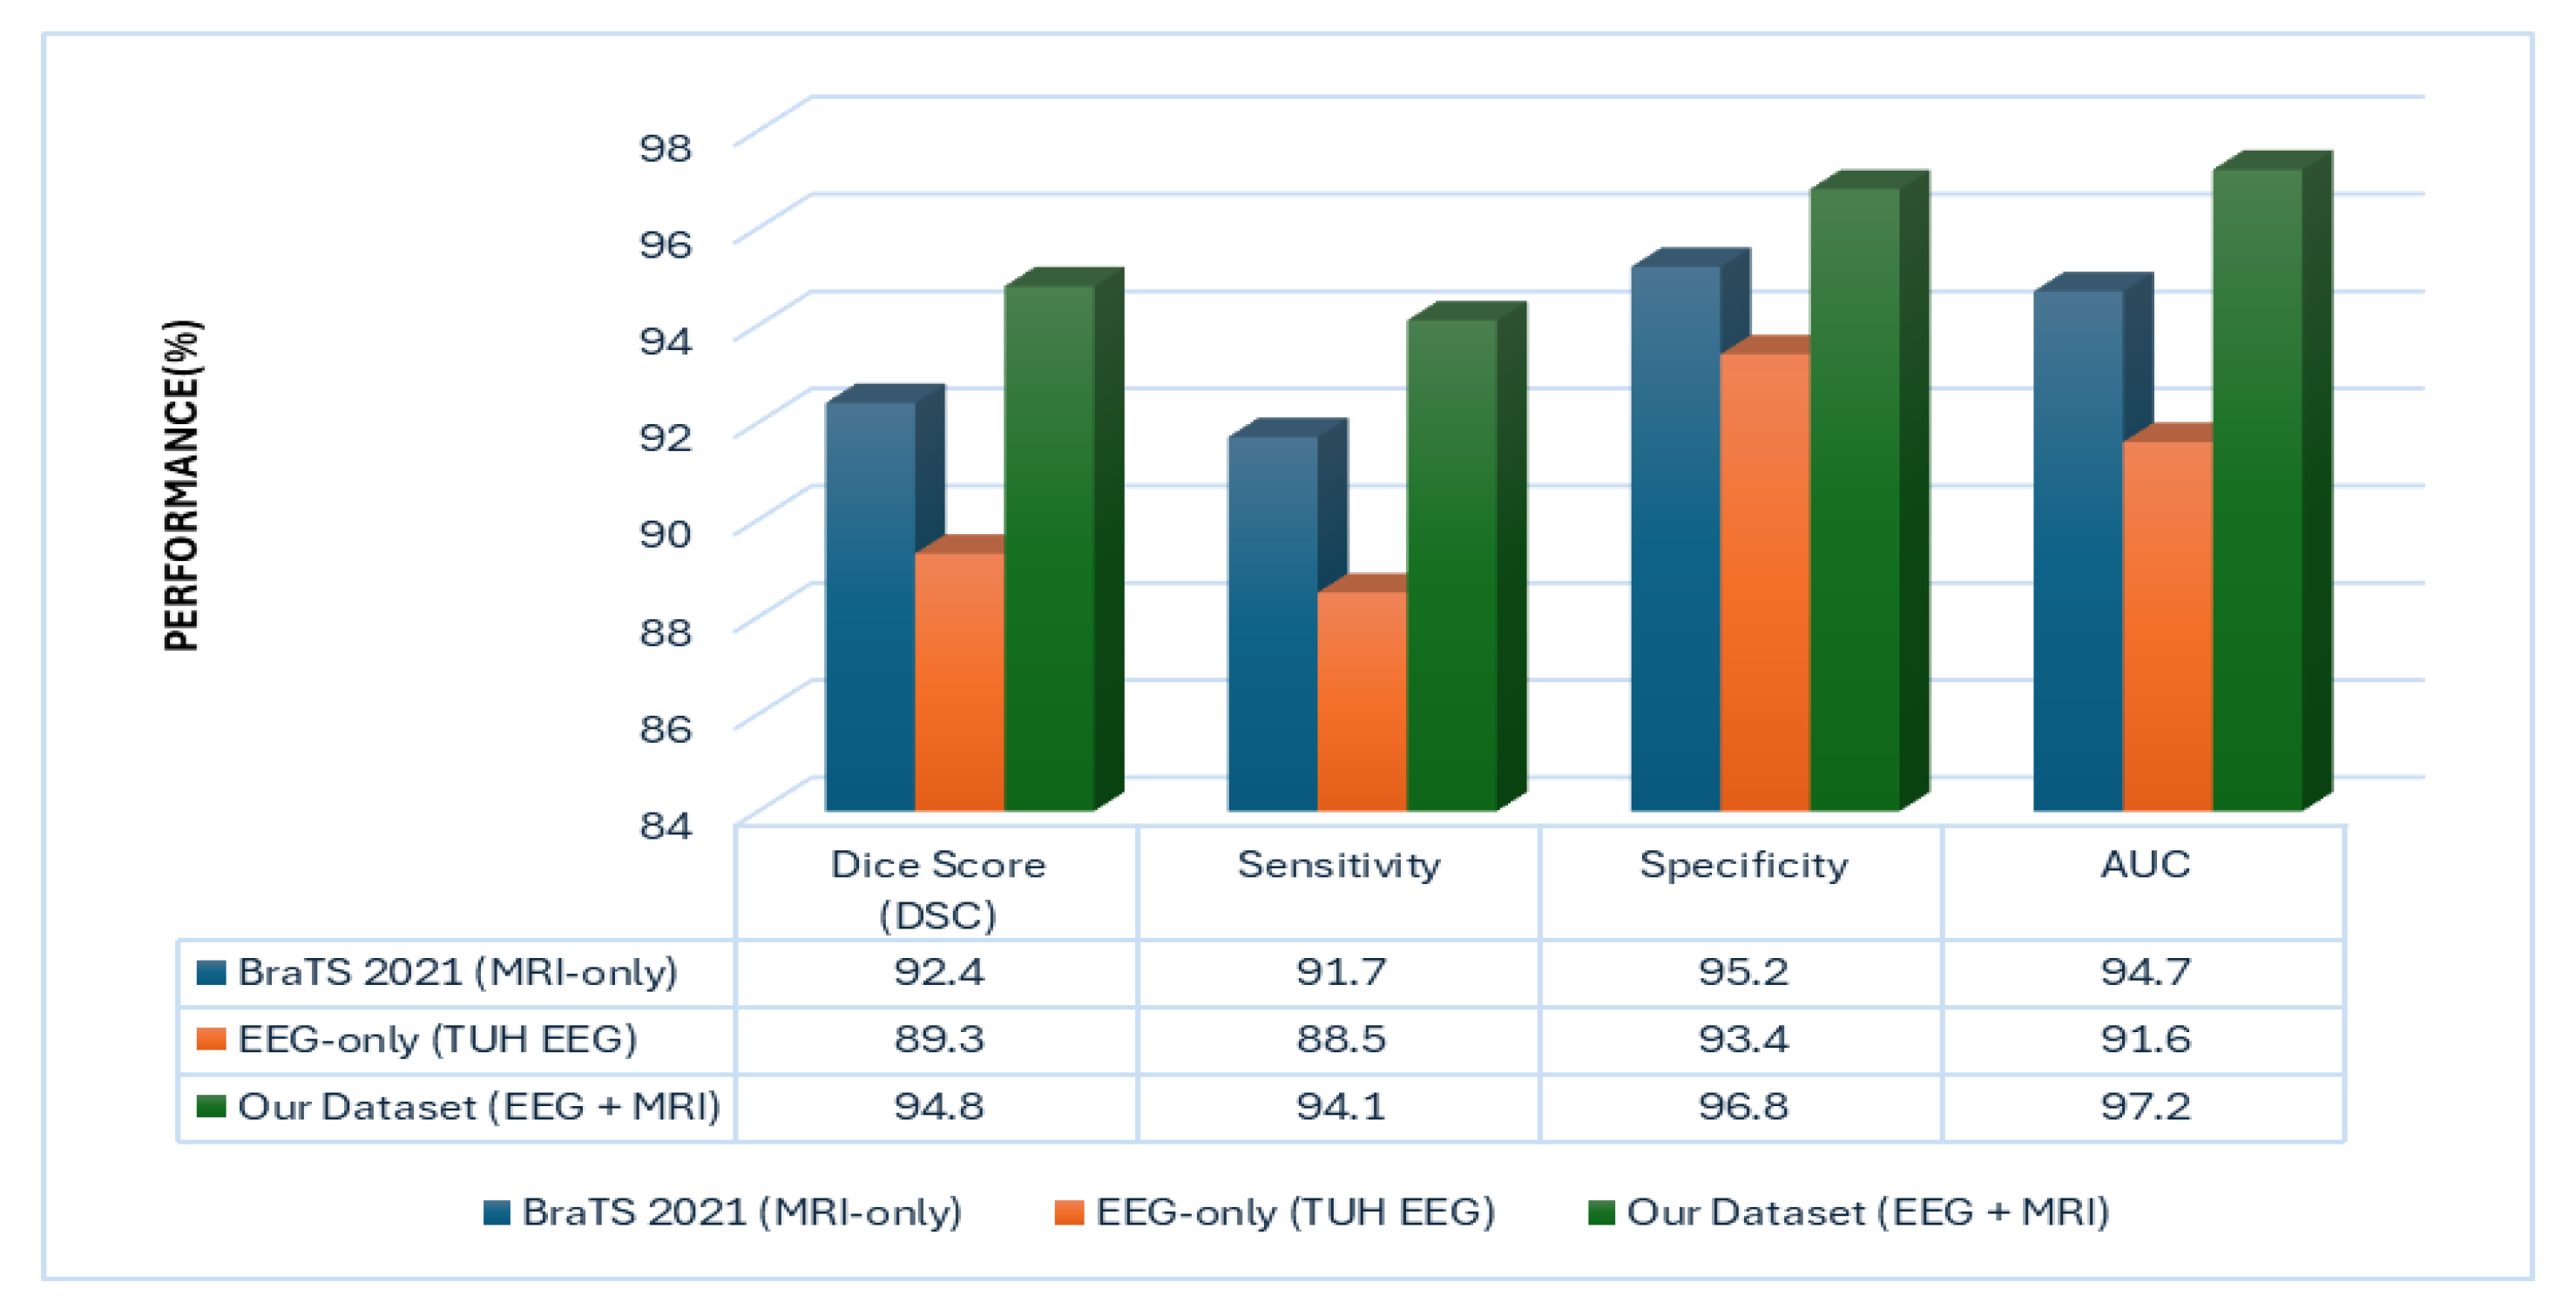
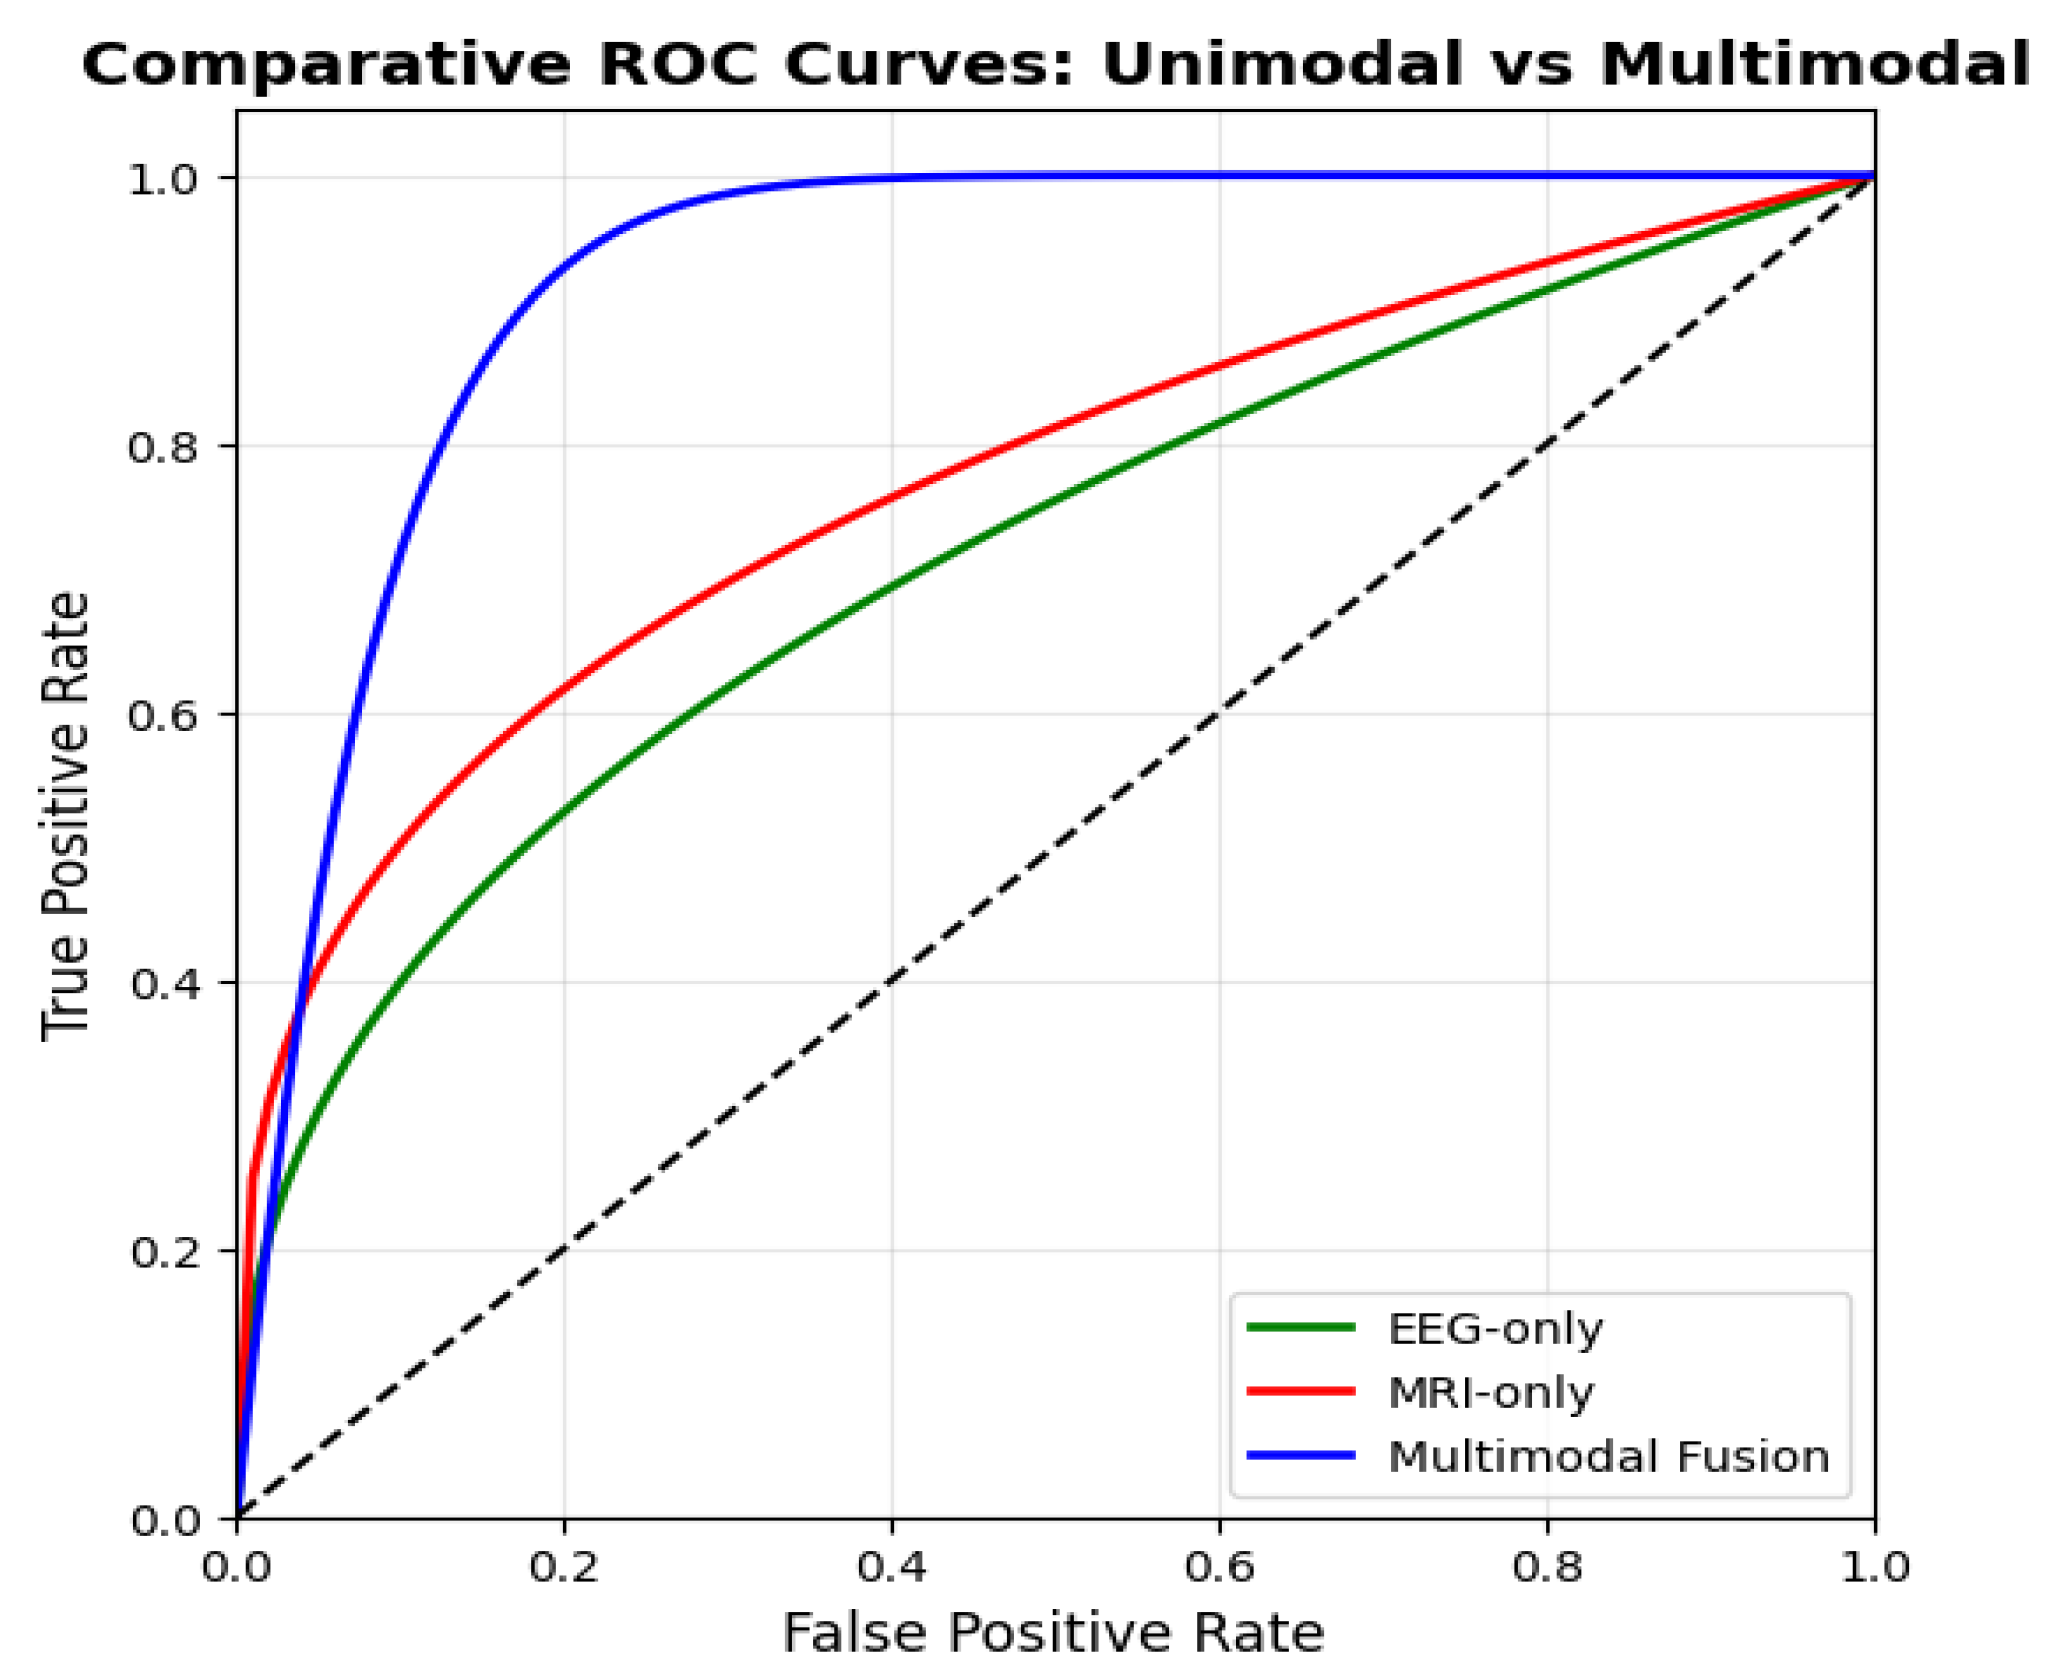
6.2. Multi-Modal Superiority over Unimodal Baselines

Figure 5 shows the receiver operating characteristic (ROC) curves of the unimodal EEG-only baseline and MRI-only baseline to the proposed multimodal fusion framework. EEG-only model had a relatively low discriminative power with a AUC of 0.903, which is explained by the fact that electrophysiological records are relatively variable and noisy. The MRI-only model was found to be better and showed better performance with an AUC of 0.941, though it still presents sensitivity-specificity trades off.The proposed multimodal fusion framework showed significantly better performance with an AUC of 0.972. The ROC curve has a near L-shaped curve which is close to the ideal top-left corner signifying high specificity and sensitivity. This proves the point that integration of EEG and MRI features allows complementary registration of information EEG gives temporal and functional dynamics, whereas MRI gives spatial and structural context, thus justifying its applicability in terms of real-time implementation in healthcare processes.

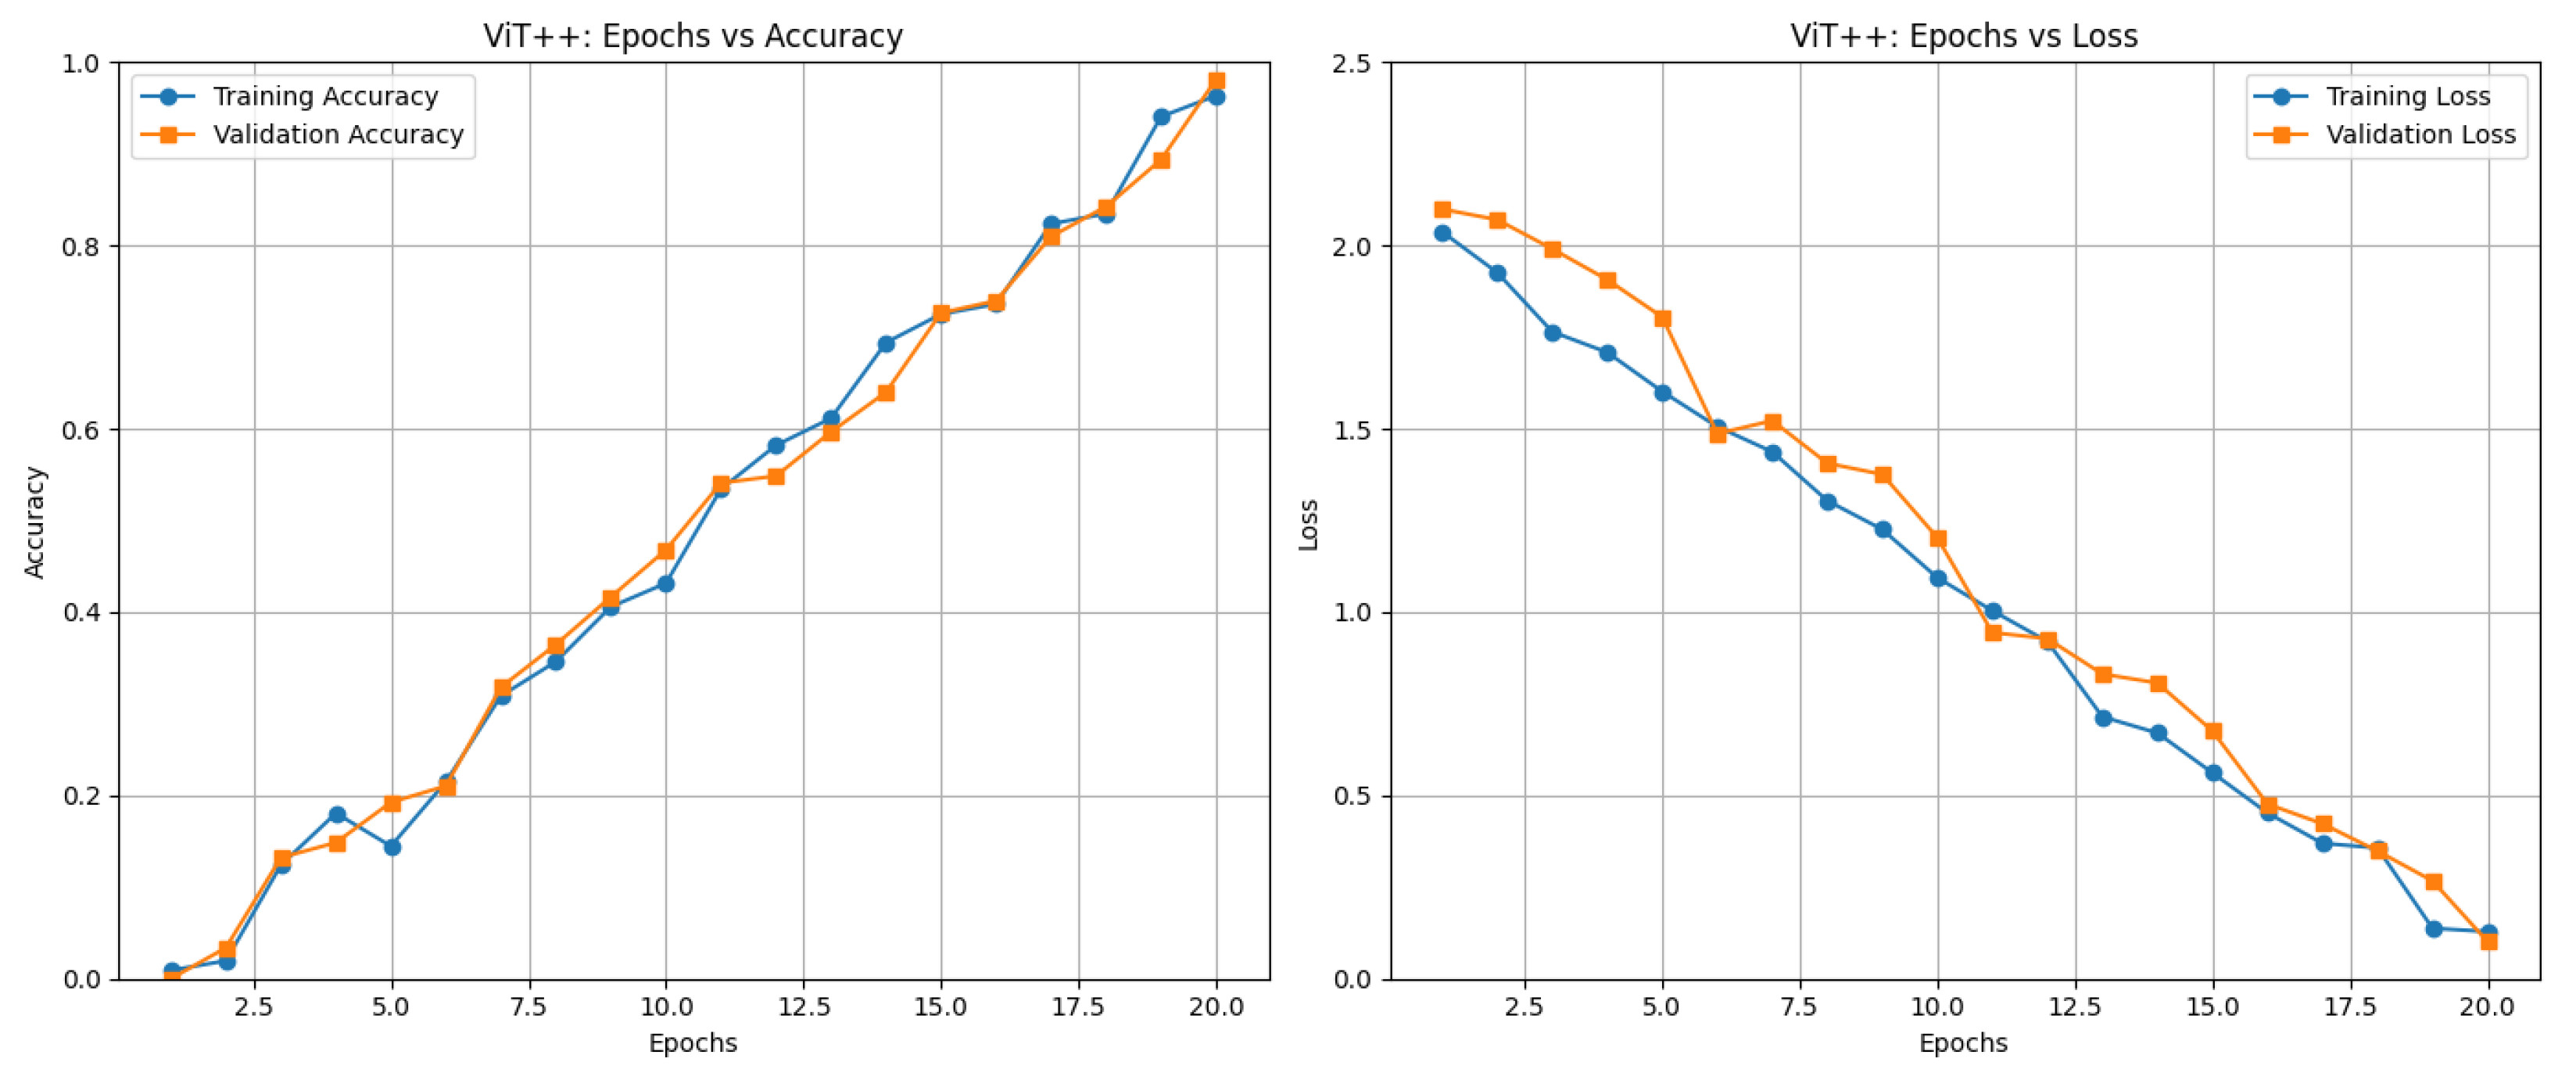
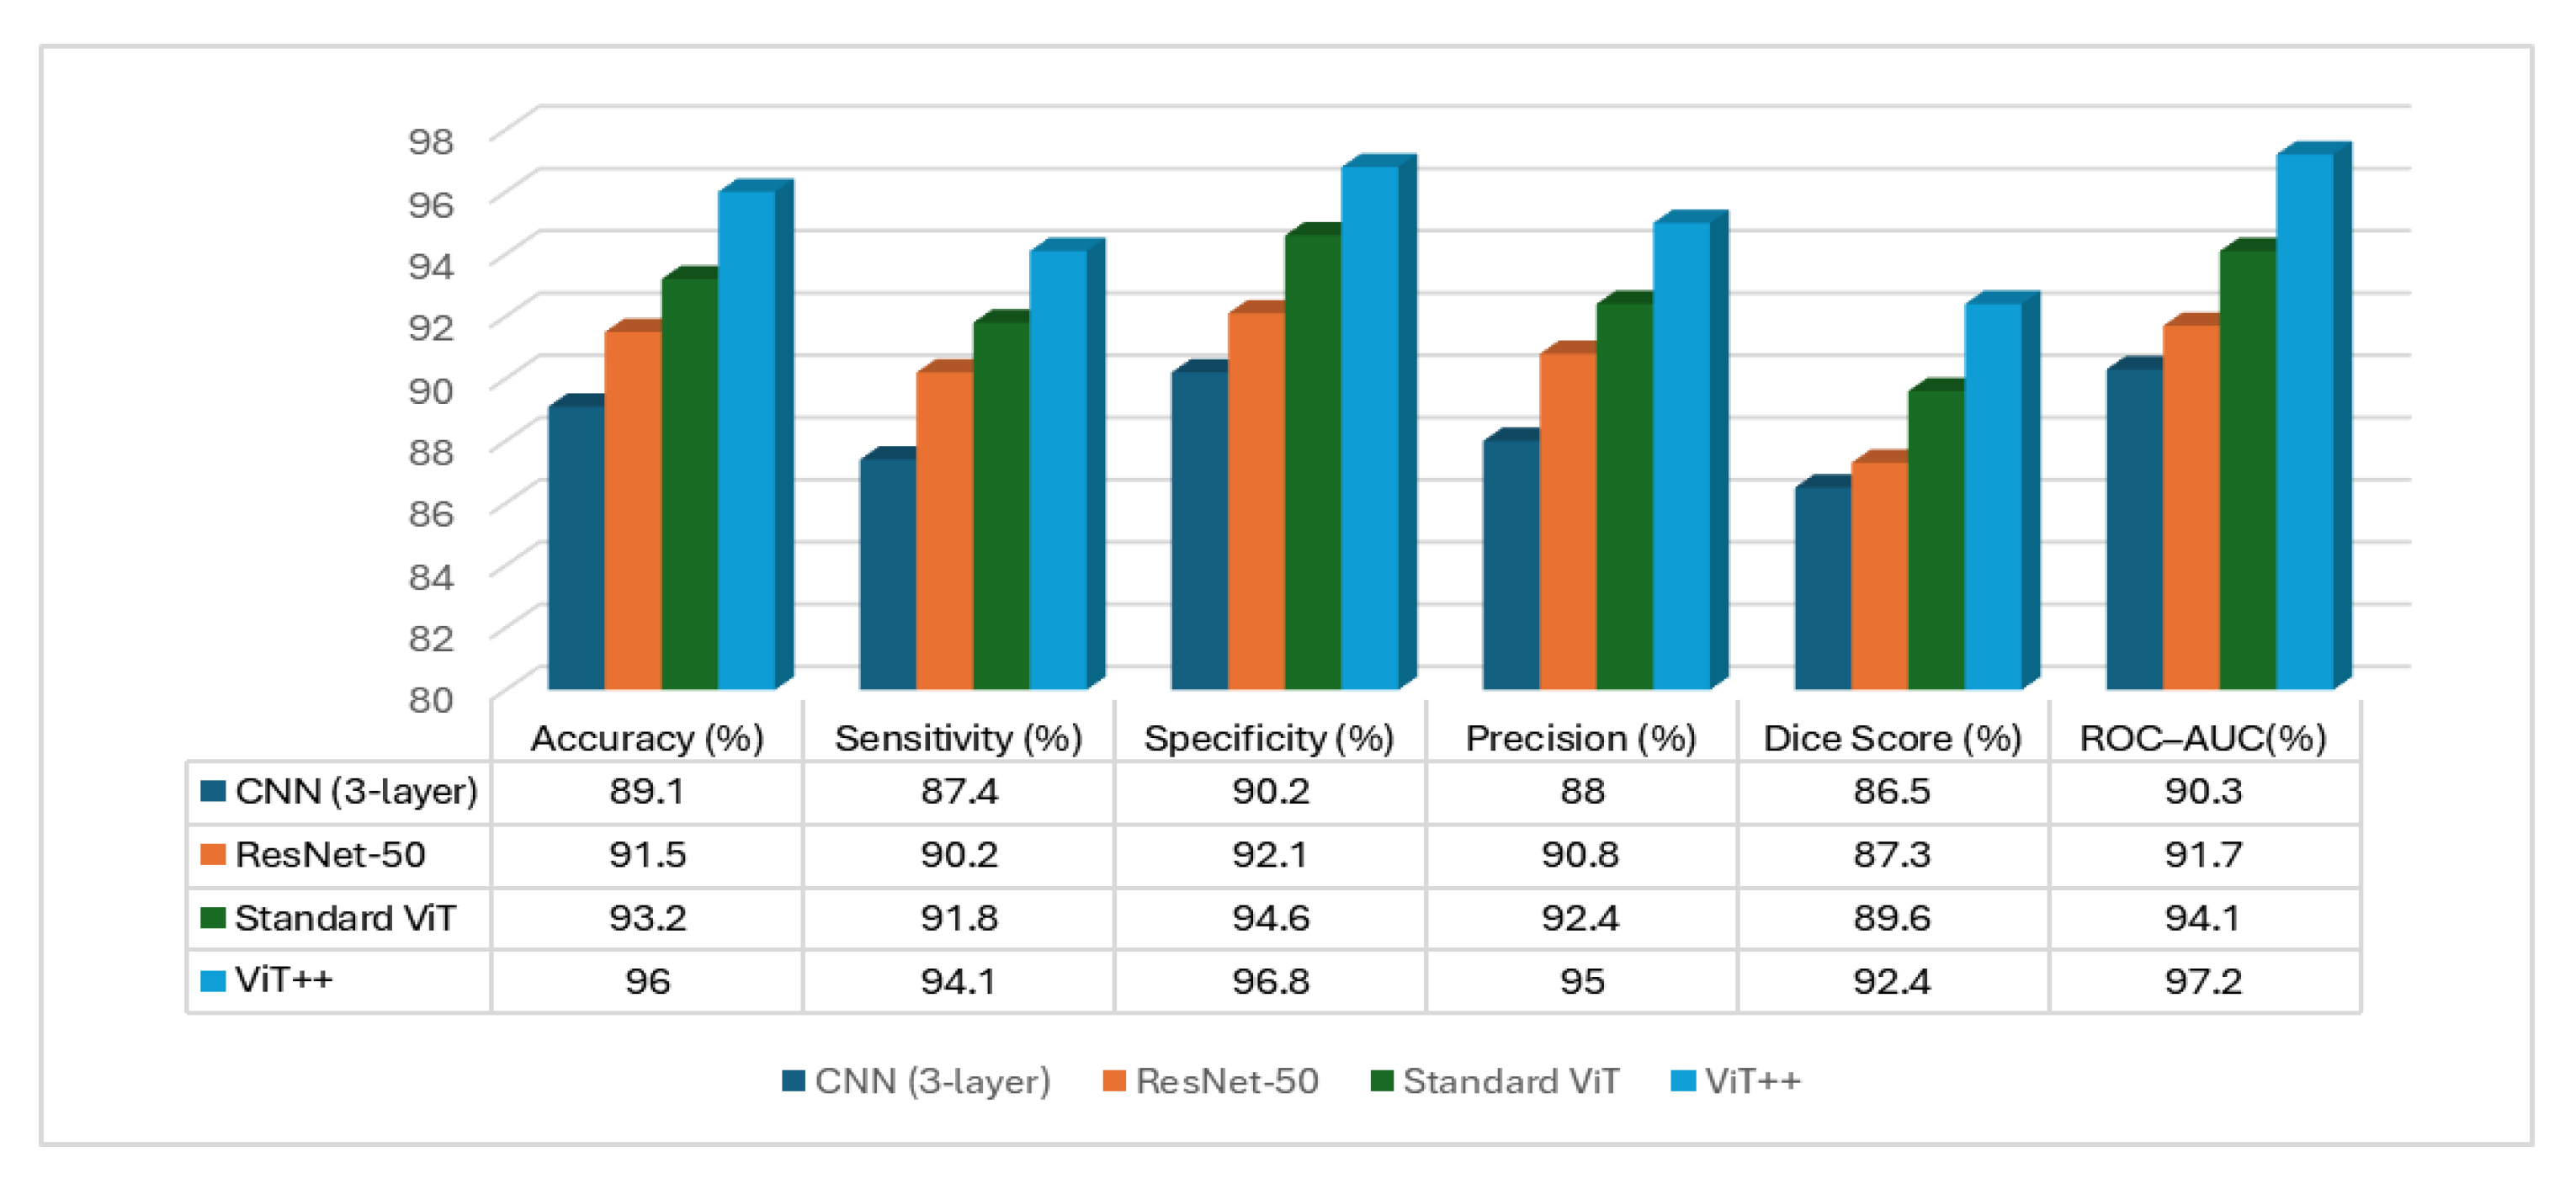
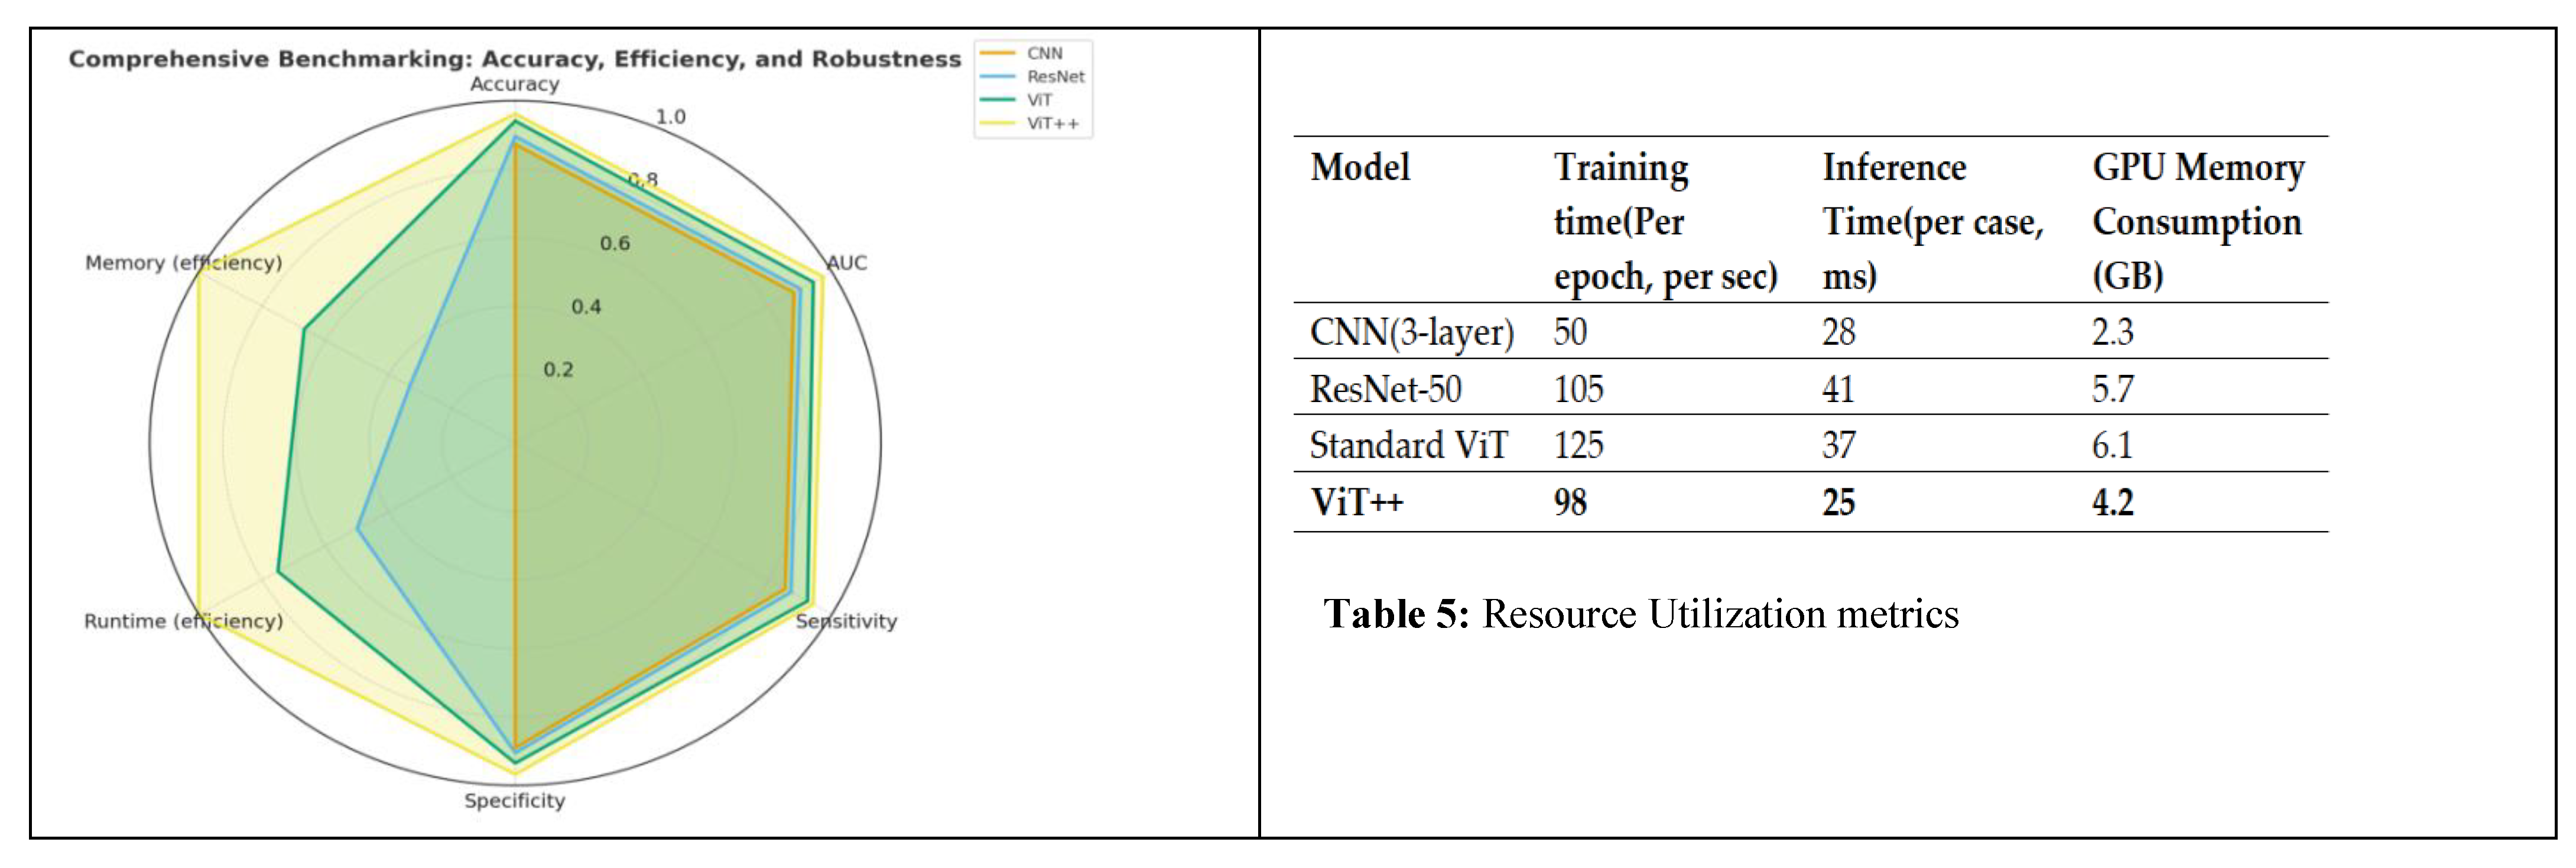
6.3. Performance Evaluation

The interactions and performance assessment of the proposed ViT++ framework during 20 epochs are presented in Figure 6, as accuracy and loss, respectively.The curves of both training and validation outcomes are characterized by a steady increase with a starting point of close to zero, with the curves reaching a stabilization point of approximately 97 per cent accuracy at the 20th epoch. The two curves are closely aligned which is an indication that the model is applicable to unobserved data with almost no trace of overfitting. The almost-linear change is also indicative of the stability of the optimization process through the epochs. Throughout the assessment, the ViT++ model recorded a total classification accuracy of 96, highlighting its. better performance.Training and validation loss curves on the right panel show an opposite downward trend. Both curves start at a loss of about 2.0 and the reduction is smooth and consistent until near the last epoch they converge at less than 0.2. These two plots also support the strength of the training process and lack of divergence between learning and generalization, further supporting the architectural improvements that were implemented into the model.
The results of CNN (3-layer), ResNet-50, Standard ViT, and the proposed ViT++ were compared systematically according to several evaluation metrics in our experimental evaluation as shown in Figure 7. The CNN baseline attained 89.1% accuracy, 87.4% sensitivity, 92.0% specificity, 88% precision, 86.5% Dice score and 90.3% ROC-AUC. ResNet-50 demonstrated a slight better performance with the accuracy of 91.5, 90.2 sensitivity and specificity, 93.5 precision, 87.3 Dice score and ROC-AUC, 91.7. Further improvements were achieved by the standard ViT with the accuracy of 93.2% and 92.4% sensitivity, specificity, 94.6% precision, 89.6% Dice score, and 94.1% ROC-AUC. The proposed ViT++, on the other hand, was significantly better than the rest of the models (96% accuracy, 94.1% sensitivity, 96.8% specificity, 95% precision, 92.4% Dice score, and 97.2% ROC-AUC). Such findings provide a clear evidence of the strength and quality of ViT++ in providing a very strong classification output, especially the significant enhancement of sensitivity and ROC-AUC, which is especially of great importance in clinical use.
Figure 8 displays an overall benchmark comparison between CNN (3-layer), ResNet-50, Standard ViT with the proposed ViT++ based on their accuracy, robustness, and efficiency. The radar plot (left) is used to compare the models on various dimensions of performance, such as accuracy, AUC, sensitivity, specificity, runtime efficiency, and memory efficiency. Whereas CNN has low accuracy and sensitivity, it has better runtime and memory performance since it has a lightweight structure. ResNet-50 and Standard ViT are moderate to high accuracy and robustness at the cost of increased computational requirements. ViT++ is evidently superior to all models in terms of accuracy, AUC, sensitivity, and specificity and, it presents a positive choice between efficiency and robustness. To measure the computational efficiency, each of the models was trained and tested on the same hardware and software specifications on an NVIDIA GeForce RTX 2050 GPU, CUDA 12.1, cuDNN 8.4, and PyTorch 2.2. The relative results of CNN (3-layer), ResNet-50, Standard ViT, and the proposed ViT++ are represented in Table 4 and indicate the high efficiency of the ViT++ model. Although ViT++ is more accurate and robust in multimodal tumor classification, it has a much lower inference time (25 ms per case) and less memory usage (4.2 GB) on a GPU than the Standard ViT and ResNet-50 models. This has come mostly due to the enhanced attention mechanism, adaptive positional embeddings, and lightweight transformer block which minimizes unnecessary calculation. Also, the training time (98 sec/epoch) shows a quicker convergence at the expense of traditional transformer architectures.

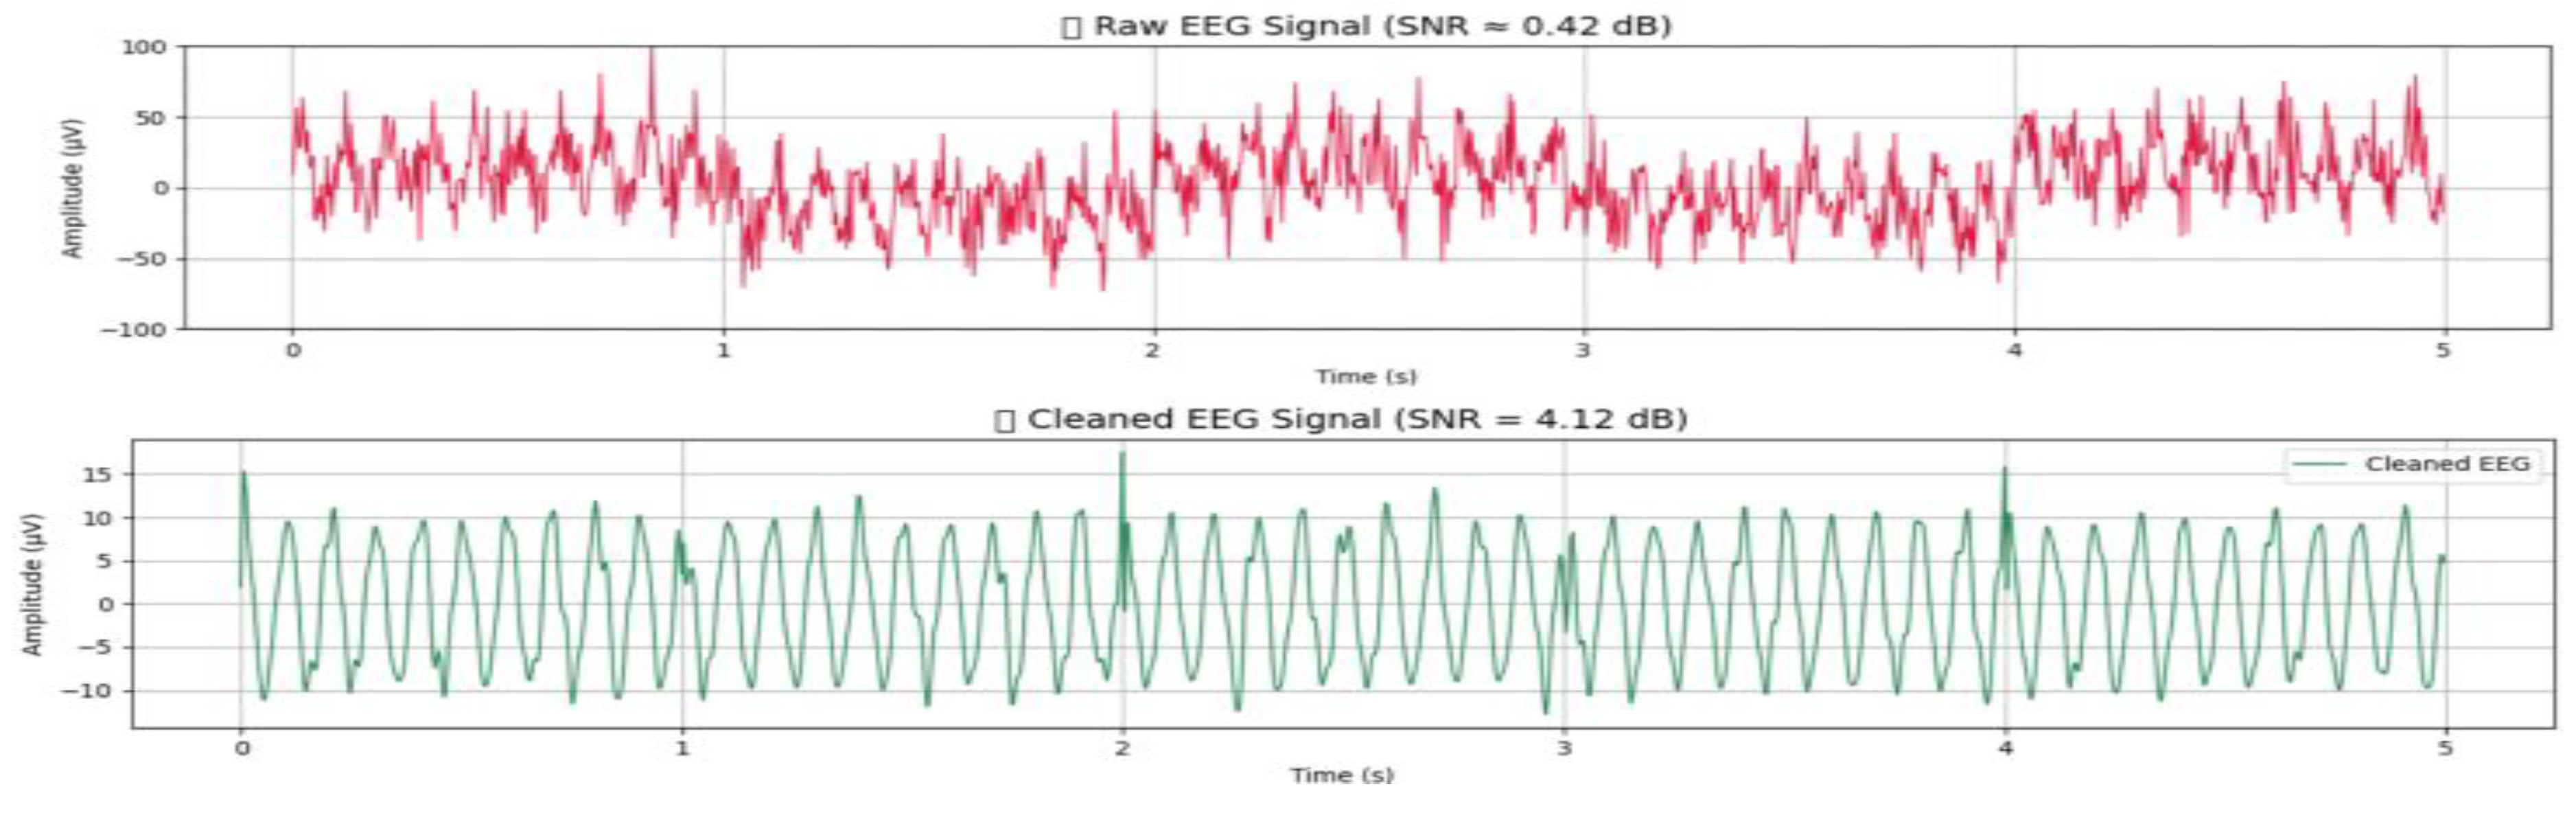
6.4. Denoising and SNR Enhancement

Figure 9 compares the EEG signals pre and post edge-fog processing. The upper subplot shows the raw EEG signal provided by the wearable skullcap that is severely noisy due to power line interference, ocular motion artifacts, and environmental disturbances. This causes a saturated waveform with random spikes and SNR of about 0.42 dB, which is poor quality signal. Conversely, the lower subplot illustrates the final processed EEG signal utilizing bandpass filtering, notch filtering and LMS-based adaptive filtering to eliminate EOG noise. The denoised waveform shows that there is now an alpha rhythm (approximately 10 Hz), the SNR is also much better (4.12 dB) and shows that it can still remove noise without affecting the neurophysiological structure of the signal. This demonstrates the usefulness of the preprocessing architecture in improving the fidelity of the EEG signal, which enables accurate brain wave analysis, including brain state diagnosis and risk assessment.

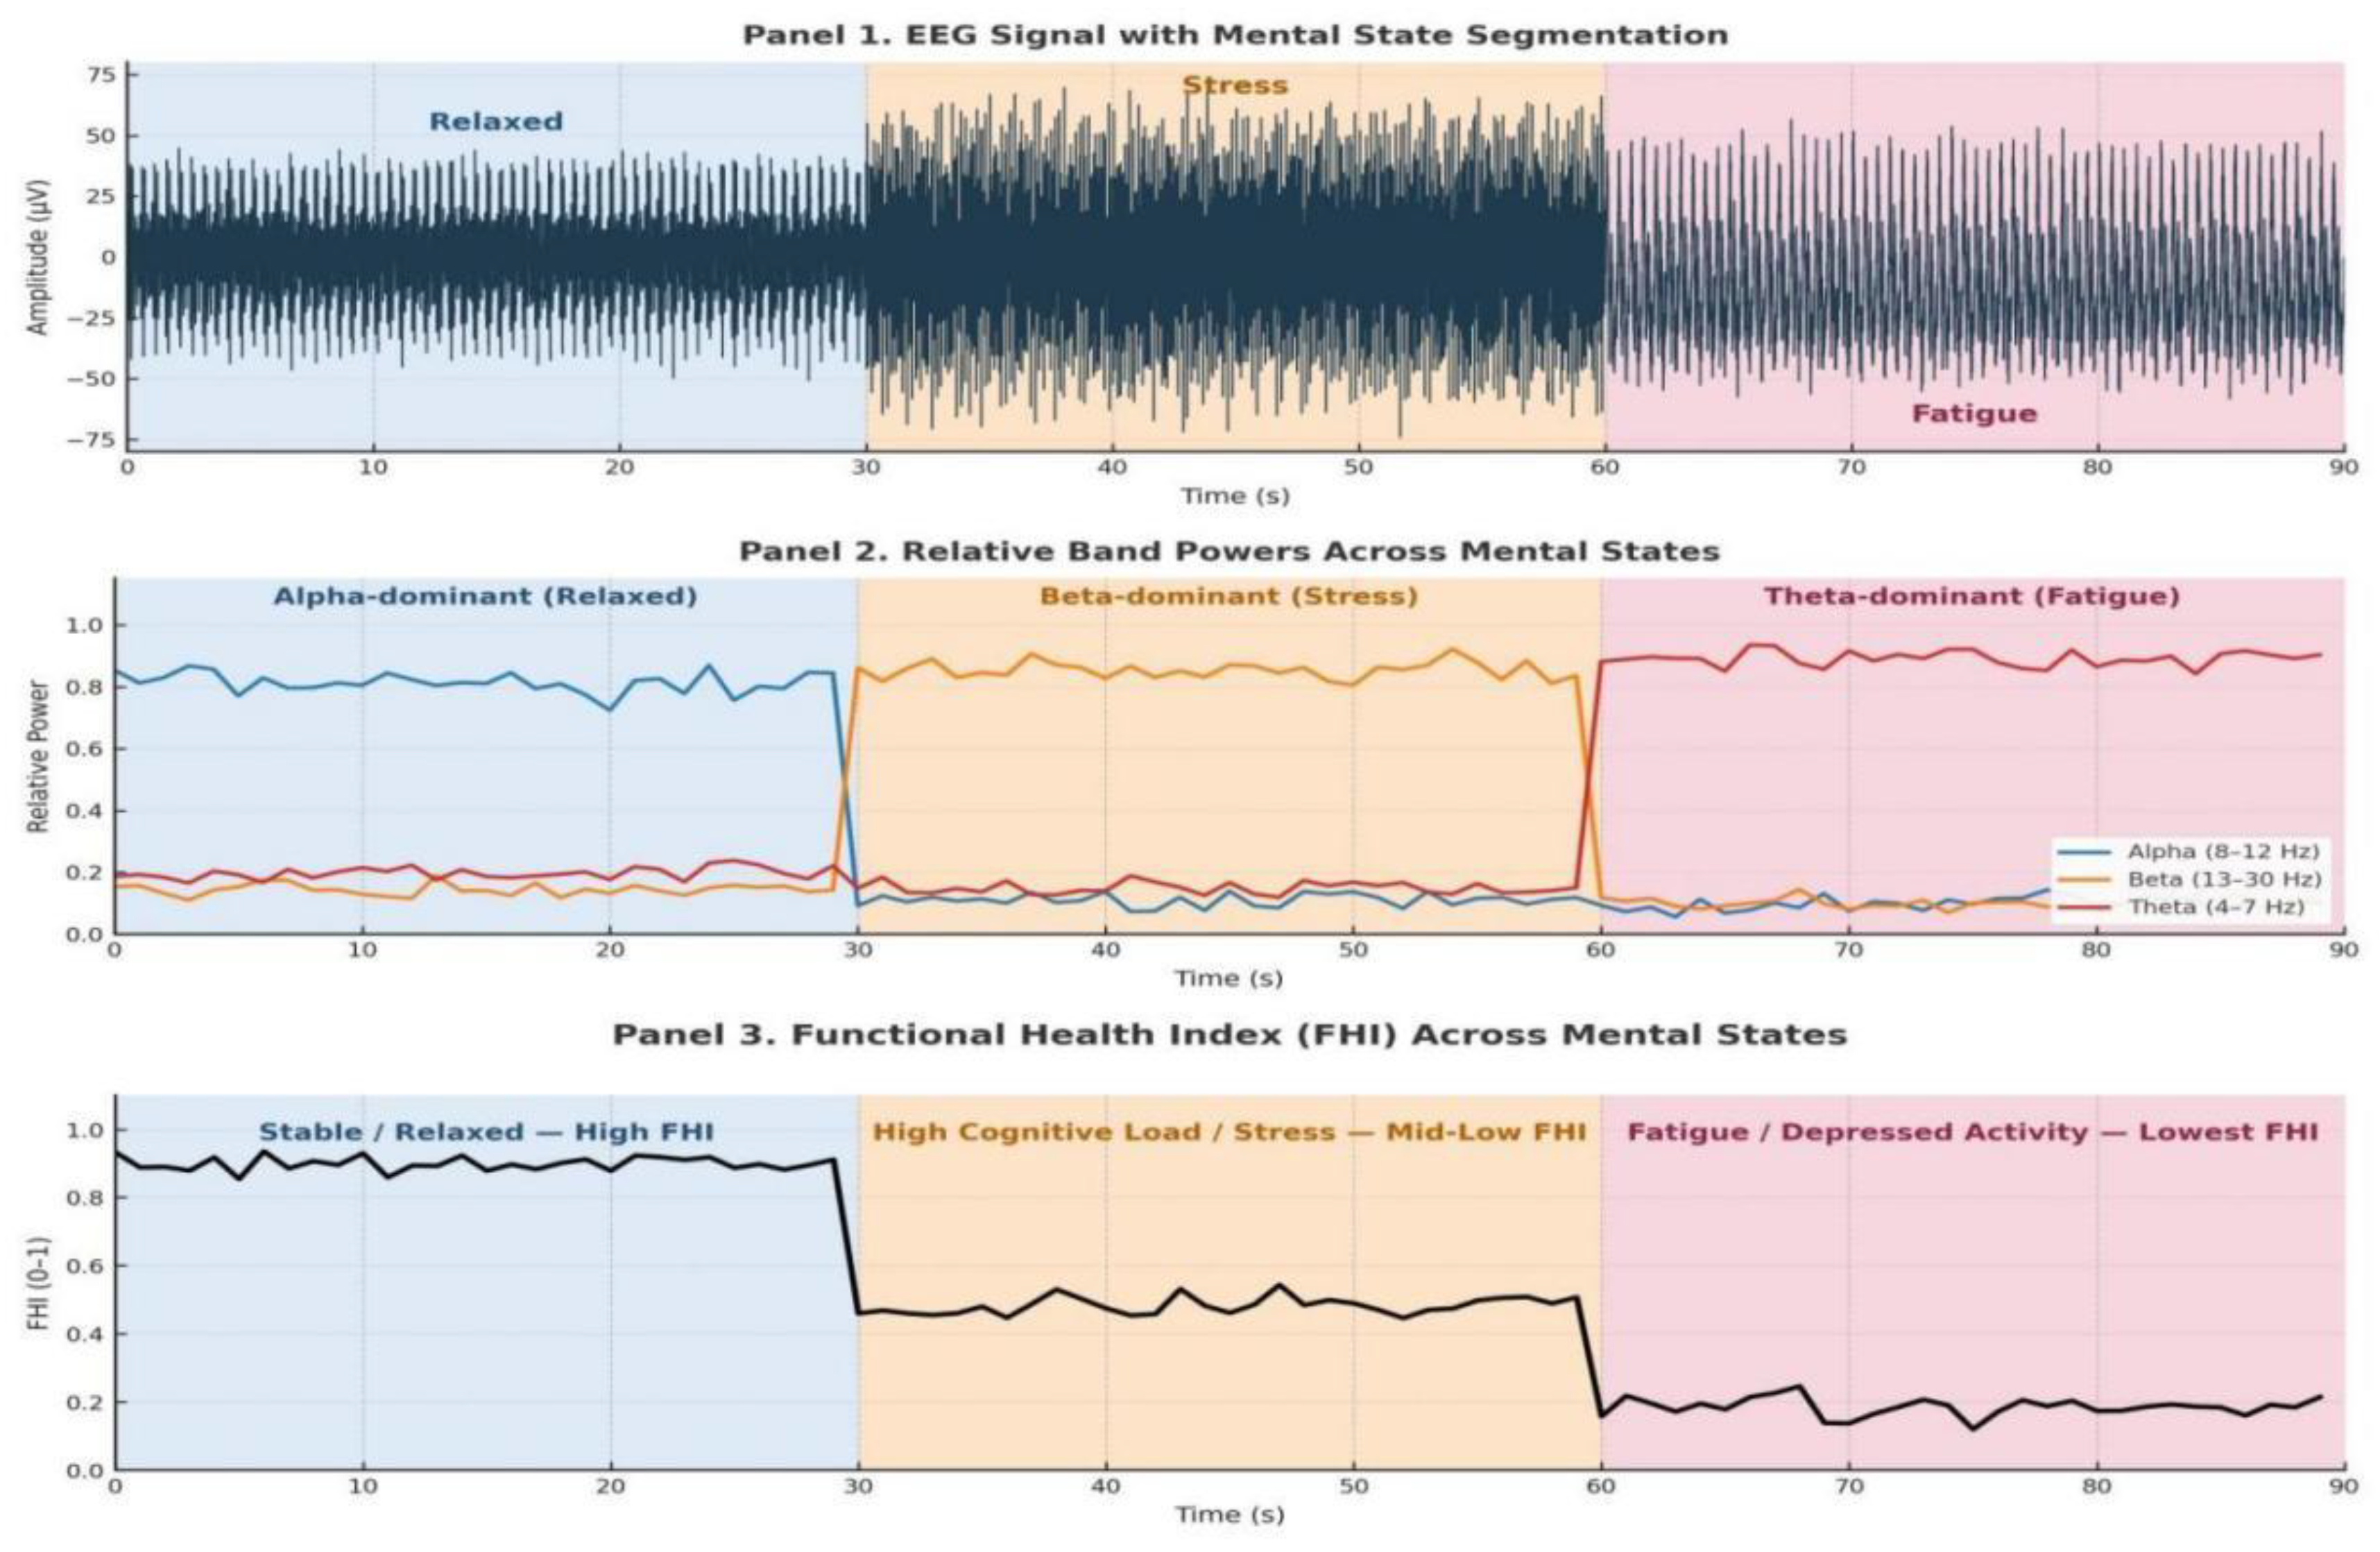
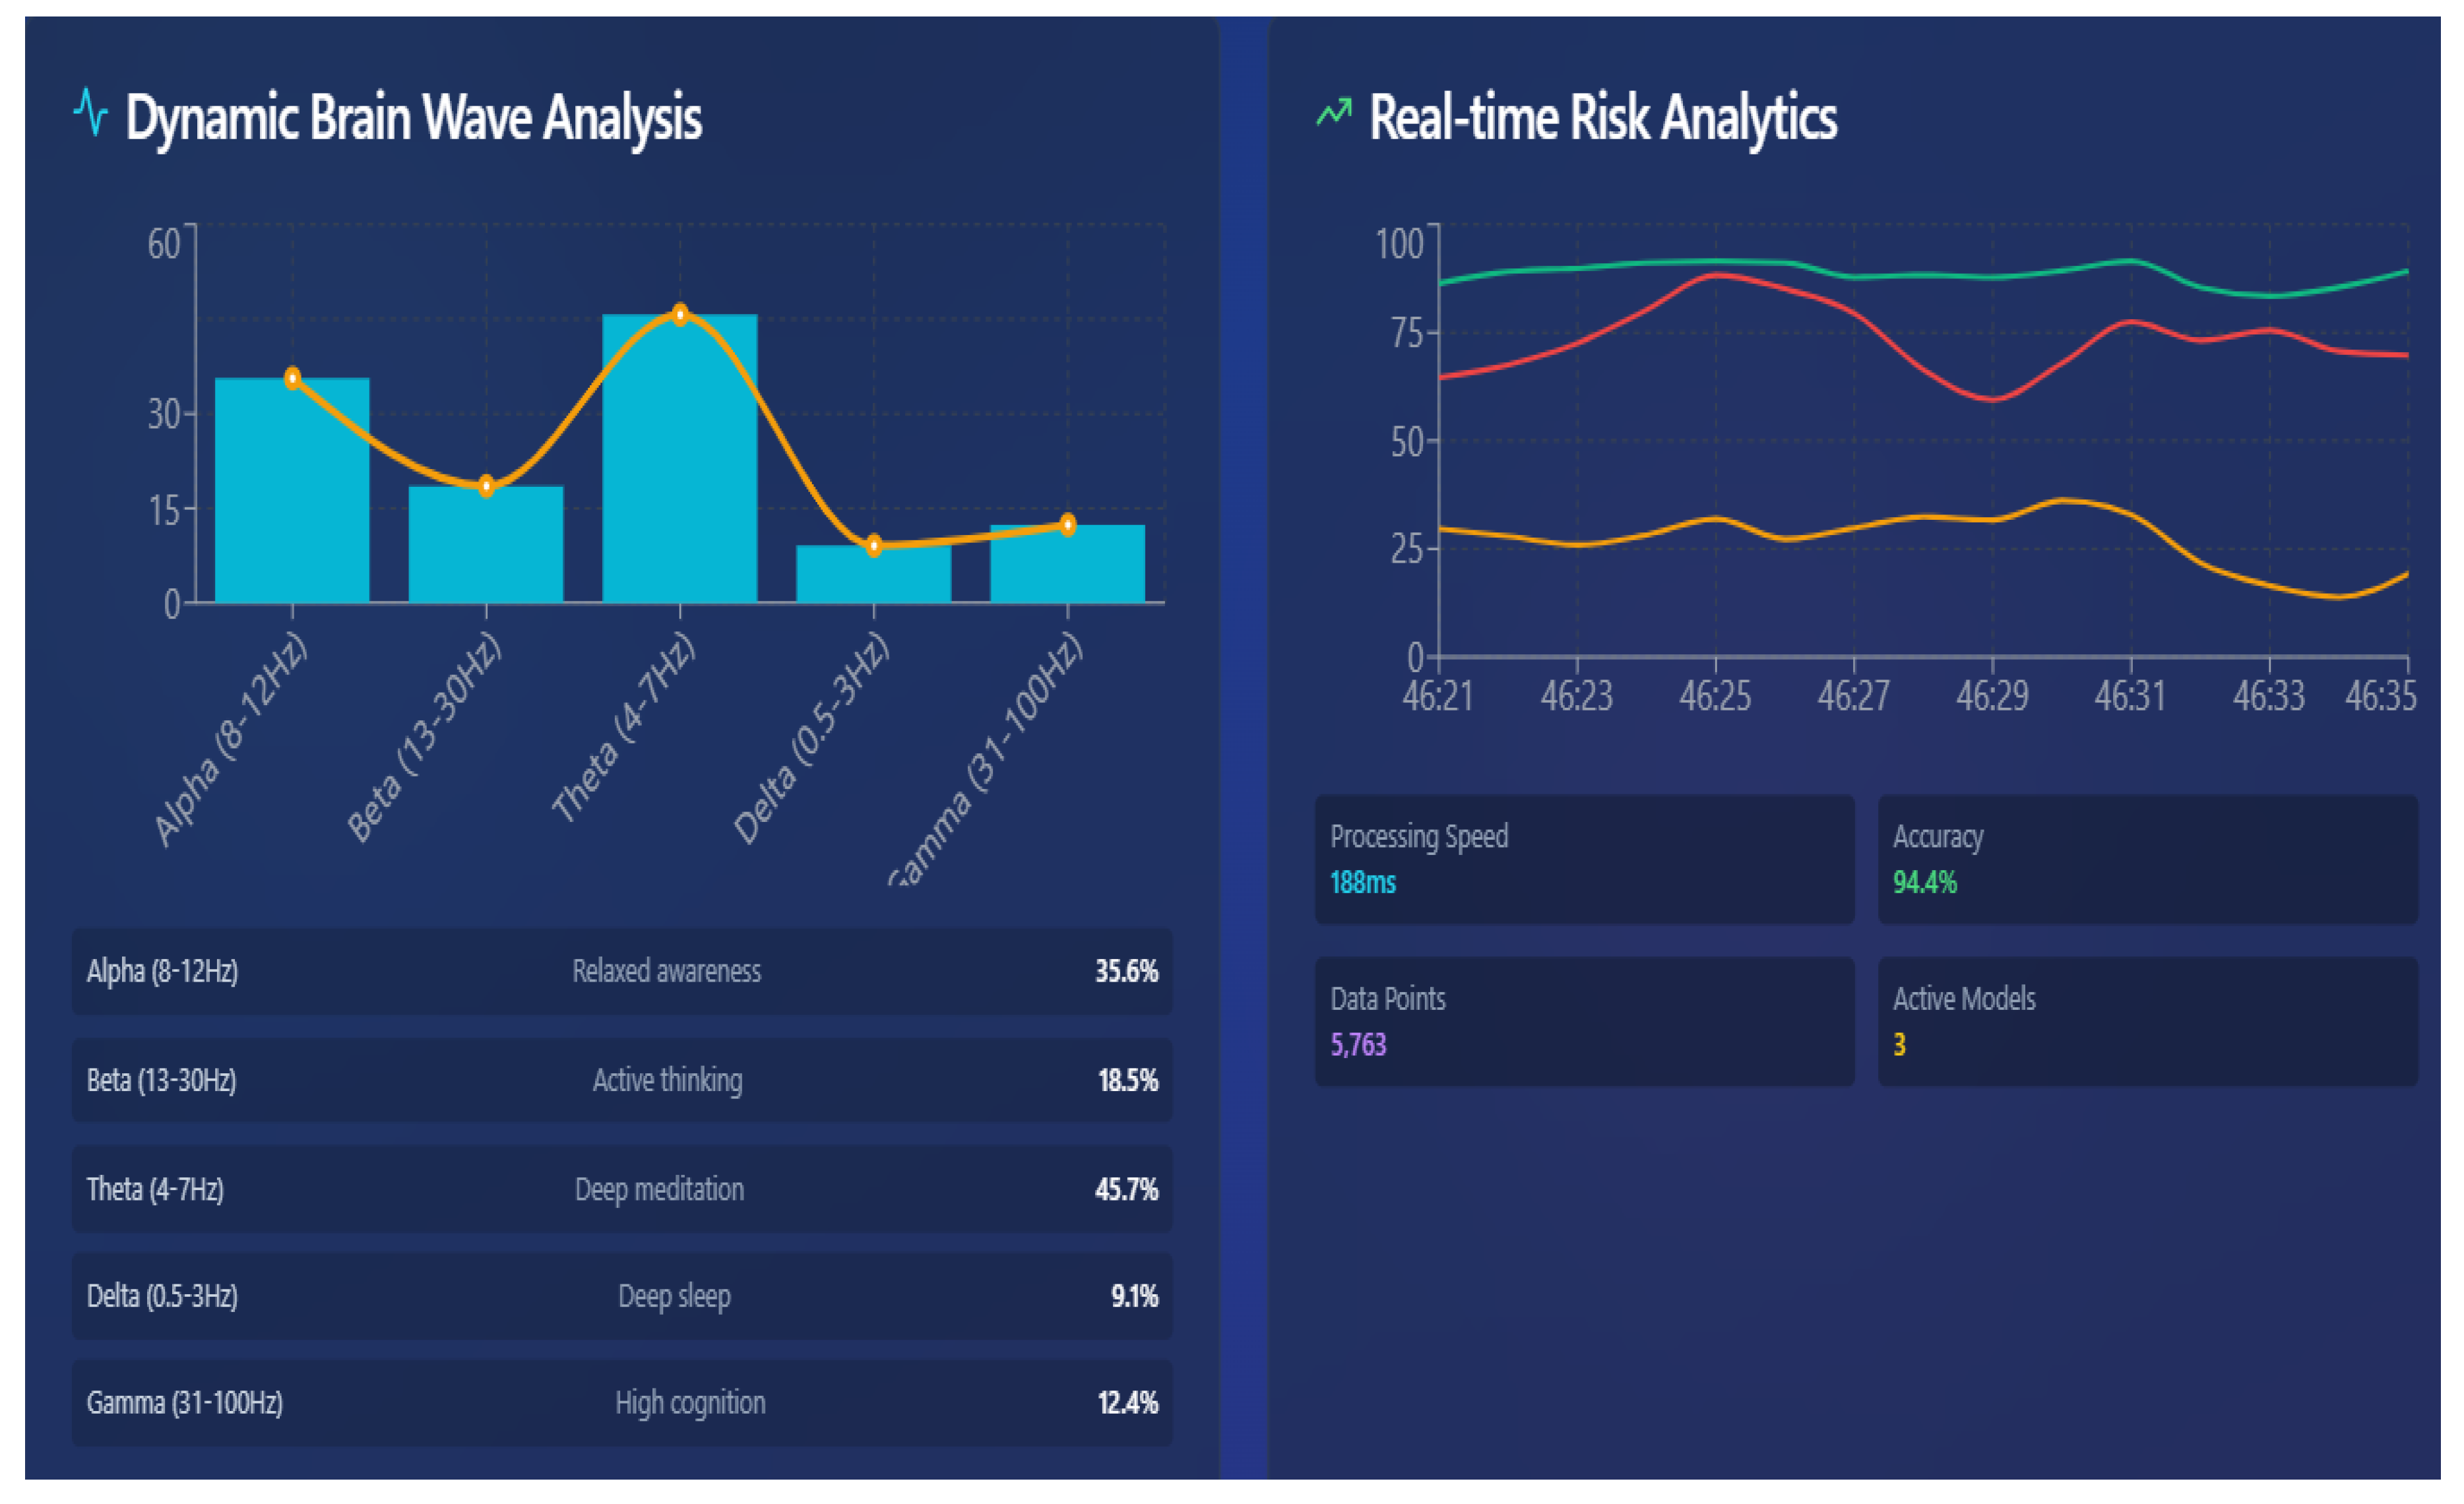
6.4. EEG-Driven Real-Time Brain Wave Analysis

Figure 10 demonstrates the behavior of the proposed EEG-based real-time brain health monitoring system over a controlled Relaxed - Stress - Fatigue progression. The EEG waveform in Panel 1 indicates that the arousal value is declining as the waveform in the relaxation period is stable and of moderate amplitude (0-30 s), the waveform in the stress period is more irregular and has more fluctuations of the amplitude (30-60 s), and the waveform in the fatigue period is of lower strength (60-90 s). This is physiologically supported by panel 2 where Alpha power prevails when one is in the state of relaxation, Beta activity shoots when one is under cognitive load in the state of stress and Theta activity becomes dominant when one gets fatigued. Panel 3 demonstrates that FHI behaves with a similar degradation process as the FHI curve with higher values at relaxed state and decreasing values as stress and fatigue develop (data has been shortened). A combination of these findings shows that the system is sensitive to spectral transitions and functional loss, which confirms the efficacy of the EEG monitoring module in the assessment of the neuro-physiological state continuously.
Figure 10. Real-Time Functional Brain Monitoring across Cognitive States.
Preprints 190429 g010
Figure 11. Normalized BiLSTM Confusion Matrix and Class-Wise Precision, Recall, F1-Score, and Support for BiLSTM-Based Brain State Prediction.
Preprints 190429 g011
The normalized confusion matrix indicates that there is distinct separability of the three EEG-based functional brain states. The most reliable ones were relaxed windows (96%), reflecting strong Alpha-dominant stability easily captured by the BiLSTM. The segments with high recall were stress segments (93%), with little misclassification (mainly into the Fatigue class) as is expected with the beta-theta overlap during cognitive overload. Fatigue showed the most transitional variability (92% recall), sometimes confused with stress at the onset of its initial stage, when spectral suppressions have not yet been firmly developed. Generally, the diagonal-dominant form of the confusion matrix points to the fact that the model has manageable accuracy in distinguishing neurofunctional states, and only a slight confusion in the conditional states that are biologically close. These findings confirm that temporal modeling is a powerful method that could be used to assess the real-time brain state in the Digital Twin system using the BiLSTM-based functional state prediction model. Table 4 reveals the classification performance of the BiLSTM-based functional state prediction model. The network captures high levels of discrimination between Relaxed, Stress, and Fatigue states with the most separability in Alpha-dominant relaxed segments and mild bilateral confusion between Stress and Fatigue in the transitional states. The macro-averaged F1 score of 0.94 testifies to the strength of the temporal modelling as compared to the inference of the latter that is temporal but does not assume any feature movement.

6.5. Tumor Localization Using GRAD-CAM

Figure 12 demonstrates an improved tumor detection pipeline in a digital twin setup which demonstrates the combination of the Vision Transformer (ViT++) and Grad-CAM explainability. The heatmaps superimposed on the MRI image identify four different areas of tumor with different degrees of red color indicating the varying risks of malignancy. The system confirms a positive tumor detection, having large confidence values: 92% in the MRI, 96.9% in the ViT++, and 78.9% in the Grad-CAM alignment metrics.The spatial precision of this model is not only shown by this visualization but, by mapping model attention directly onto the anatomical picture, it is made more clinically interpretable.

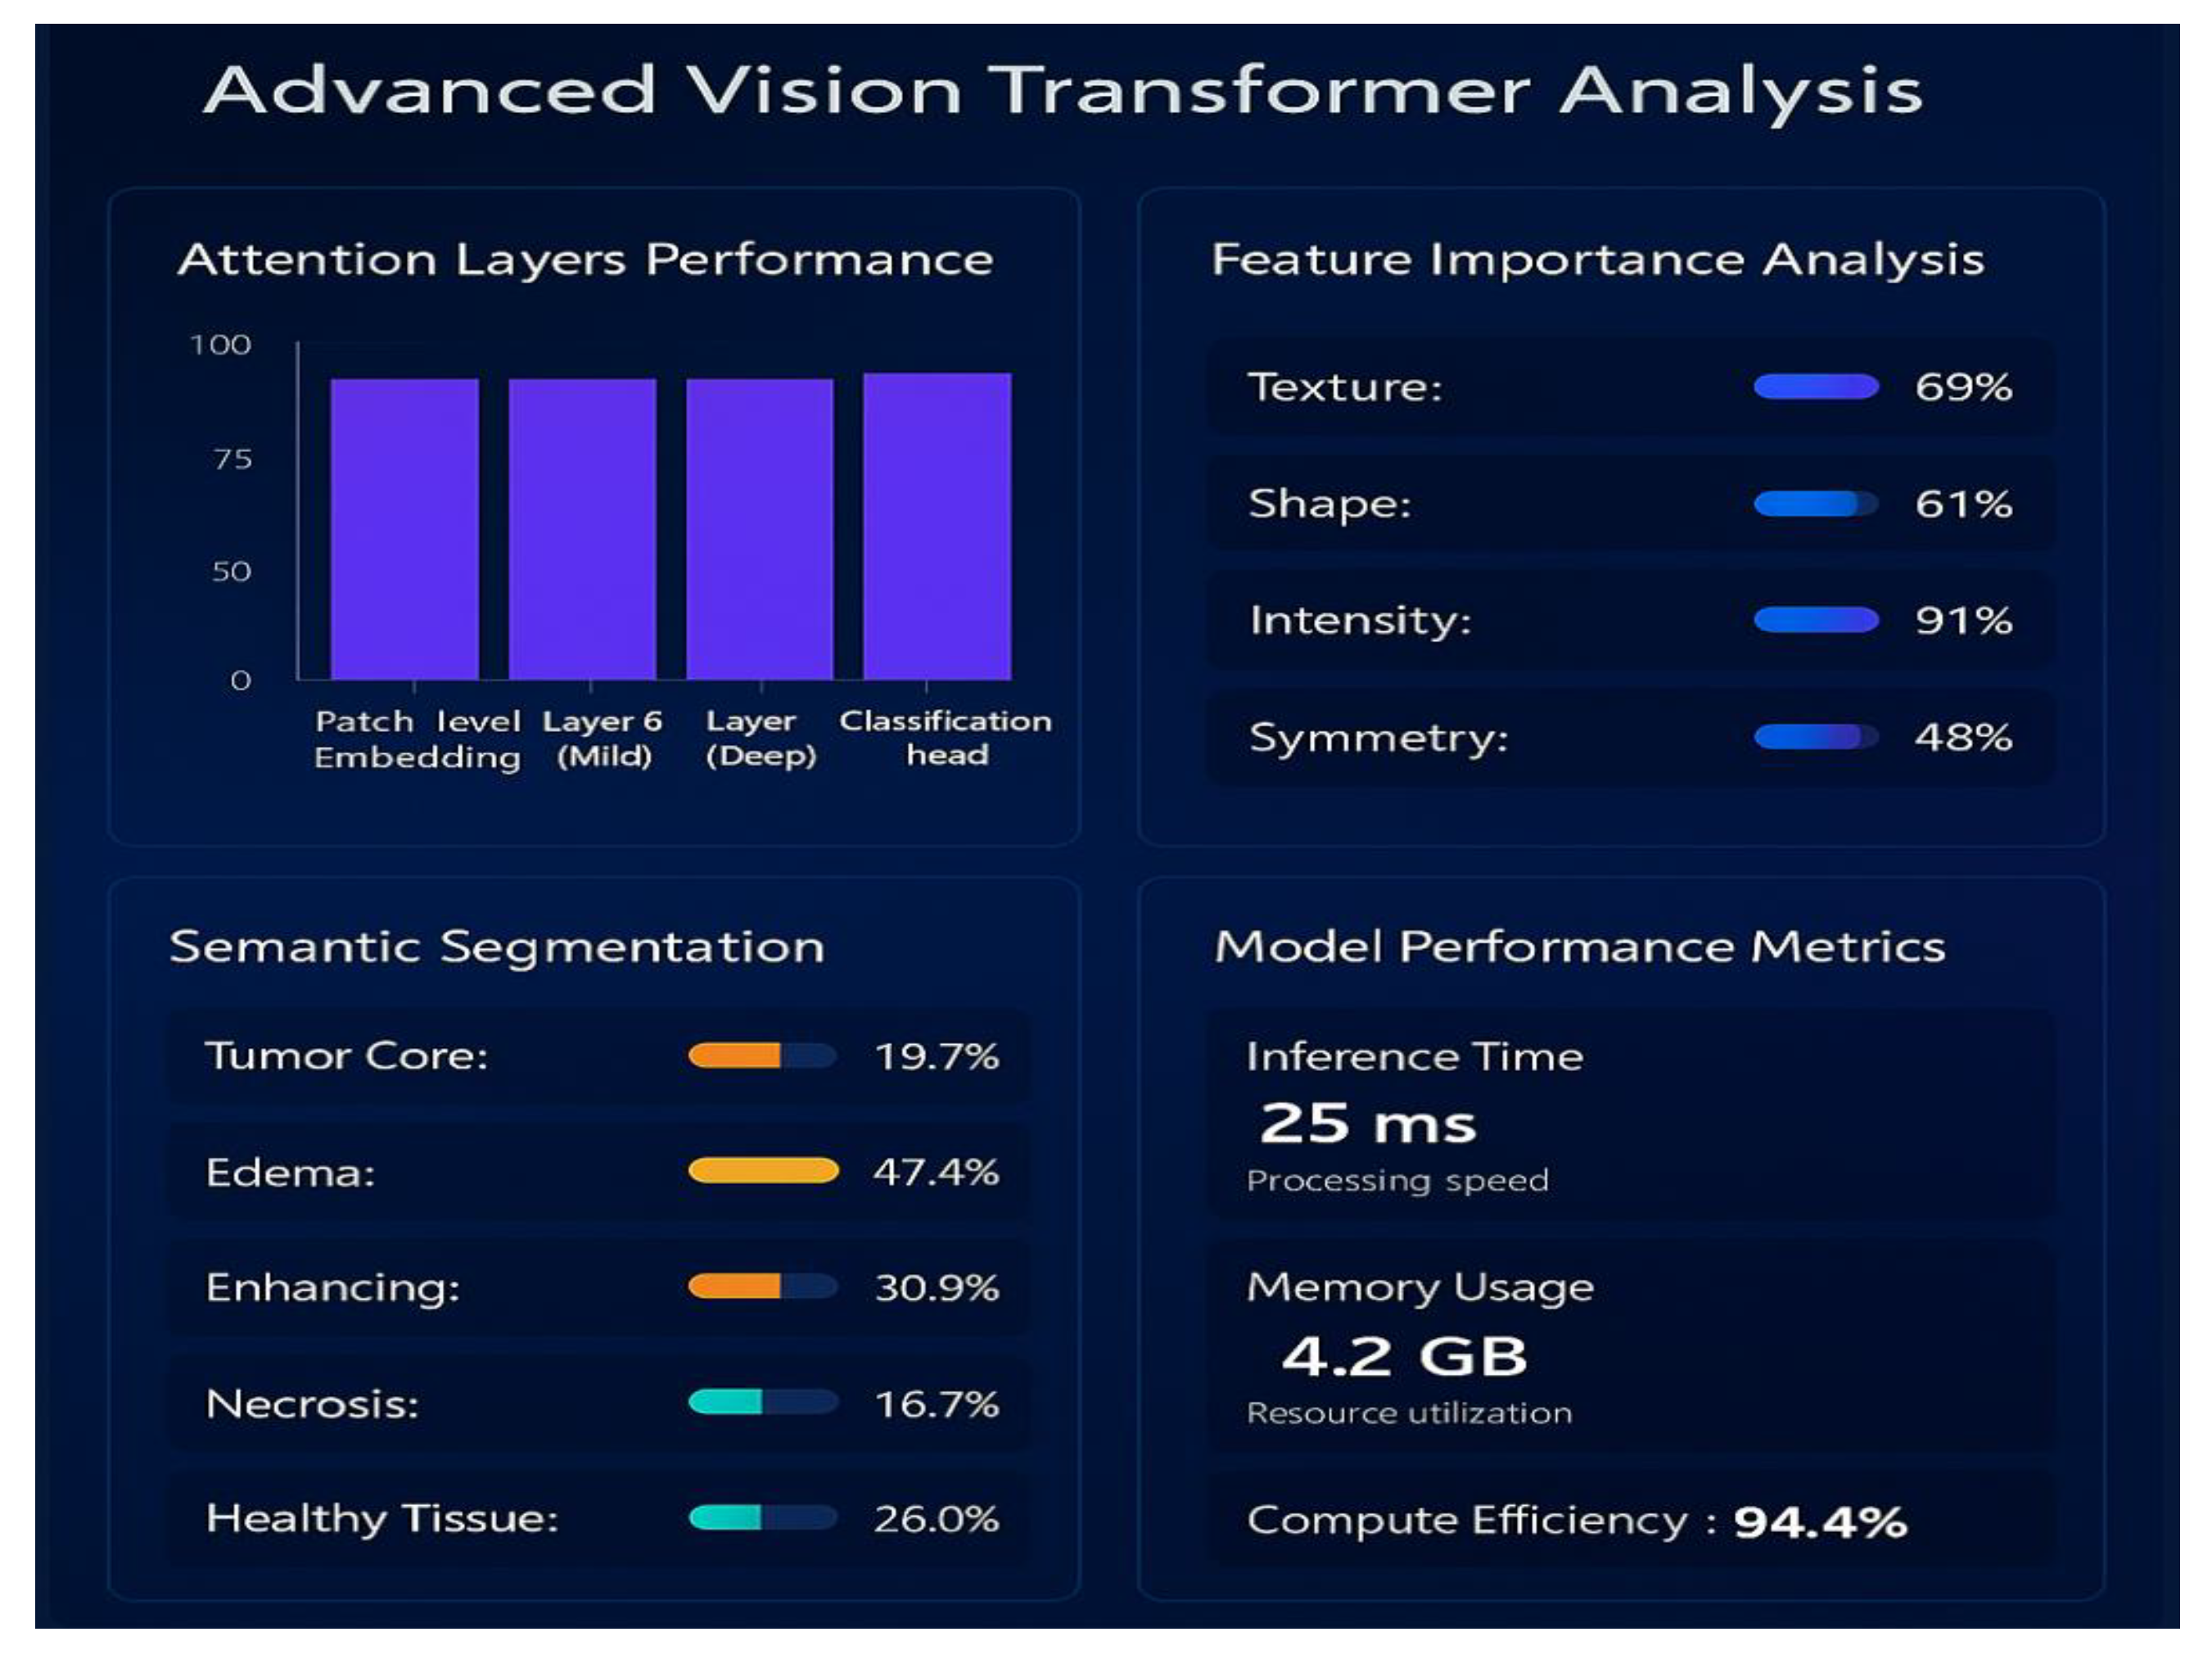
6.6. Predictive Insights Obtained from ViT++

Figure 13 shows the inside functioning of the ViT++ model which gives the detailed analysis of its performance. The attention layer graph indicates the uniform feature retention in the patch embedding, intermediate, and deep transformer layers. The analysis of feature importance shows that the key variables in the classification are intensity and vascular patterns, which confirms the fact that the model is focused on clinically significant imaging features. The output of semantic segmentation measures the morphology of the tumor, and it displays the relative distribution of the tumor core, edema, enhancing tissue, and necrosis, which are essential in planning the treatment. The computational efficiency of the model is pointed at in performance measurements, inference time 25 ms, 4.2 GB memory and 94.4% GPU utilisation. This renders the model highly appropriate in real-time and scalable implementation in a digital twin framework.

6.7. Real-Time Neuro Analytics Captured Through EEG

Figure 14 is a real-time study of the brainwave dynamics and risk prediction in a cloud-integrated digital twin framework. This representation is produced on the basis of real time EEG metrics recorded through a wearable skullcap, and also, it is combined with contextual data provided by MRI. The analysis proves that the system can understand current neural conditions and constantly evaluates the risks of neurological danger based on an automated pipeline. The left panel displays Dynamic Brain Wave Analysis which categorizes the incoming EEG into the standard frequency bands; Alpha (812 Hz), Beta (13-30 Hz), Theta (47 Hz), Delta (.53 Hz), and Gamma (31100 Hz). Every band is plotted in a bar chart having superimposed line plot of their power distributions during the past analysis period. The most prominent in this case is Theta activity which has a value of 45.7. This means that the brain activity is typical of deep meditation or relaxation preceded by Alpha with 35.6 percent and Gamma with 12.4 percent.
Figure 15 presents a pie-chart visualization of brain tissue distribution as computed by the digital twin system using MRI data processed through the Enhanced Vision Transformer. The analysis identifies gray matter (43.4%) and white matter (40.8%) as the dominant components, the rest of the composition was made up of with CSF (6.1%) and tumor tissue (3.5%). This segmentation is real time and it helps in anatomical mapping of tumors, planning of treatment as well as tracking structural changes with time in the brain.

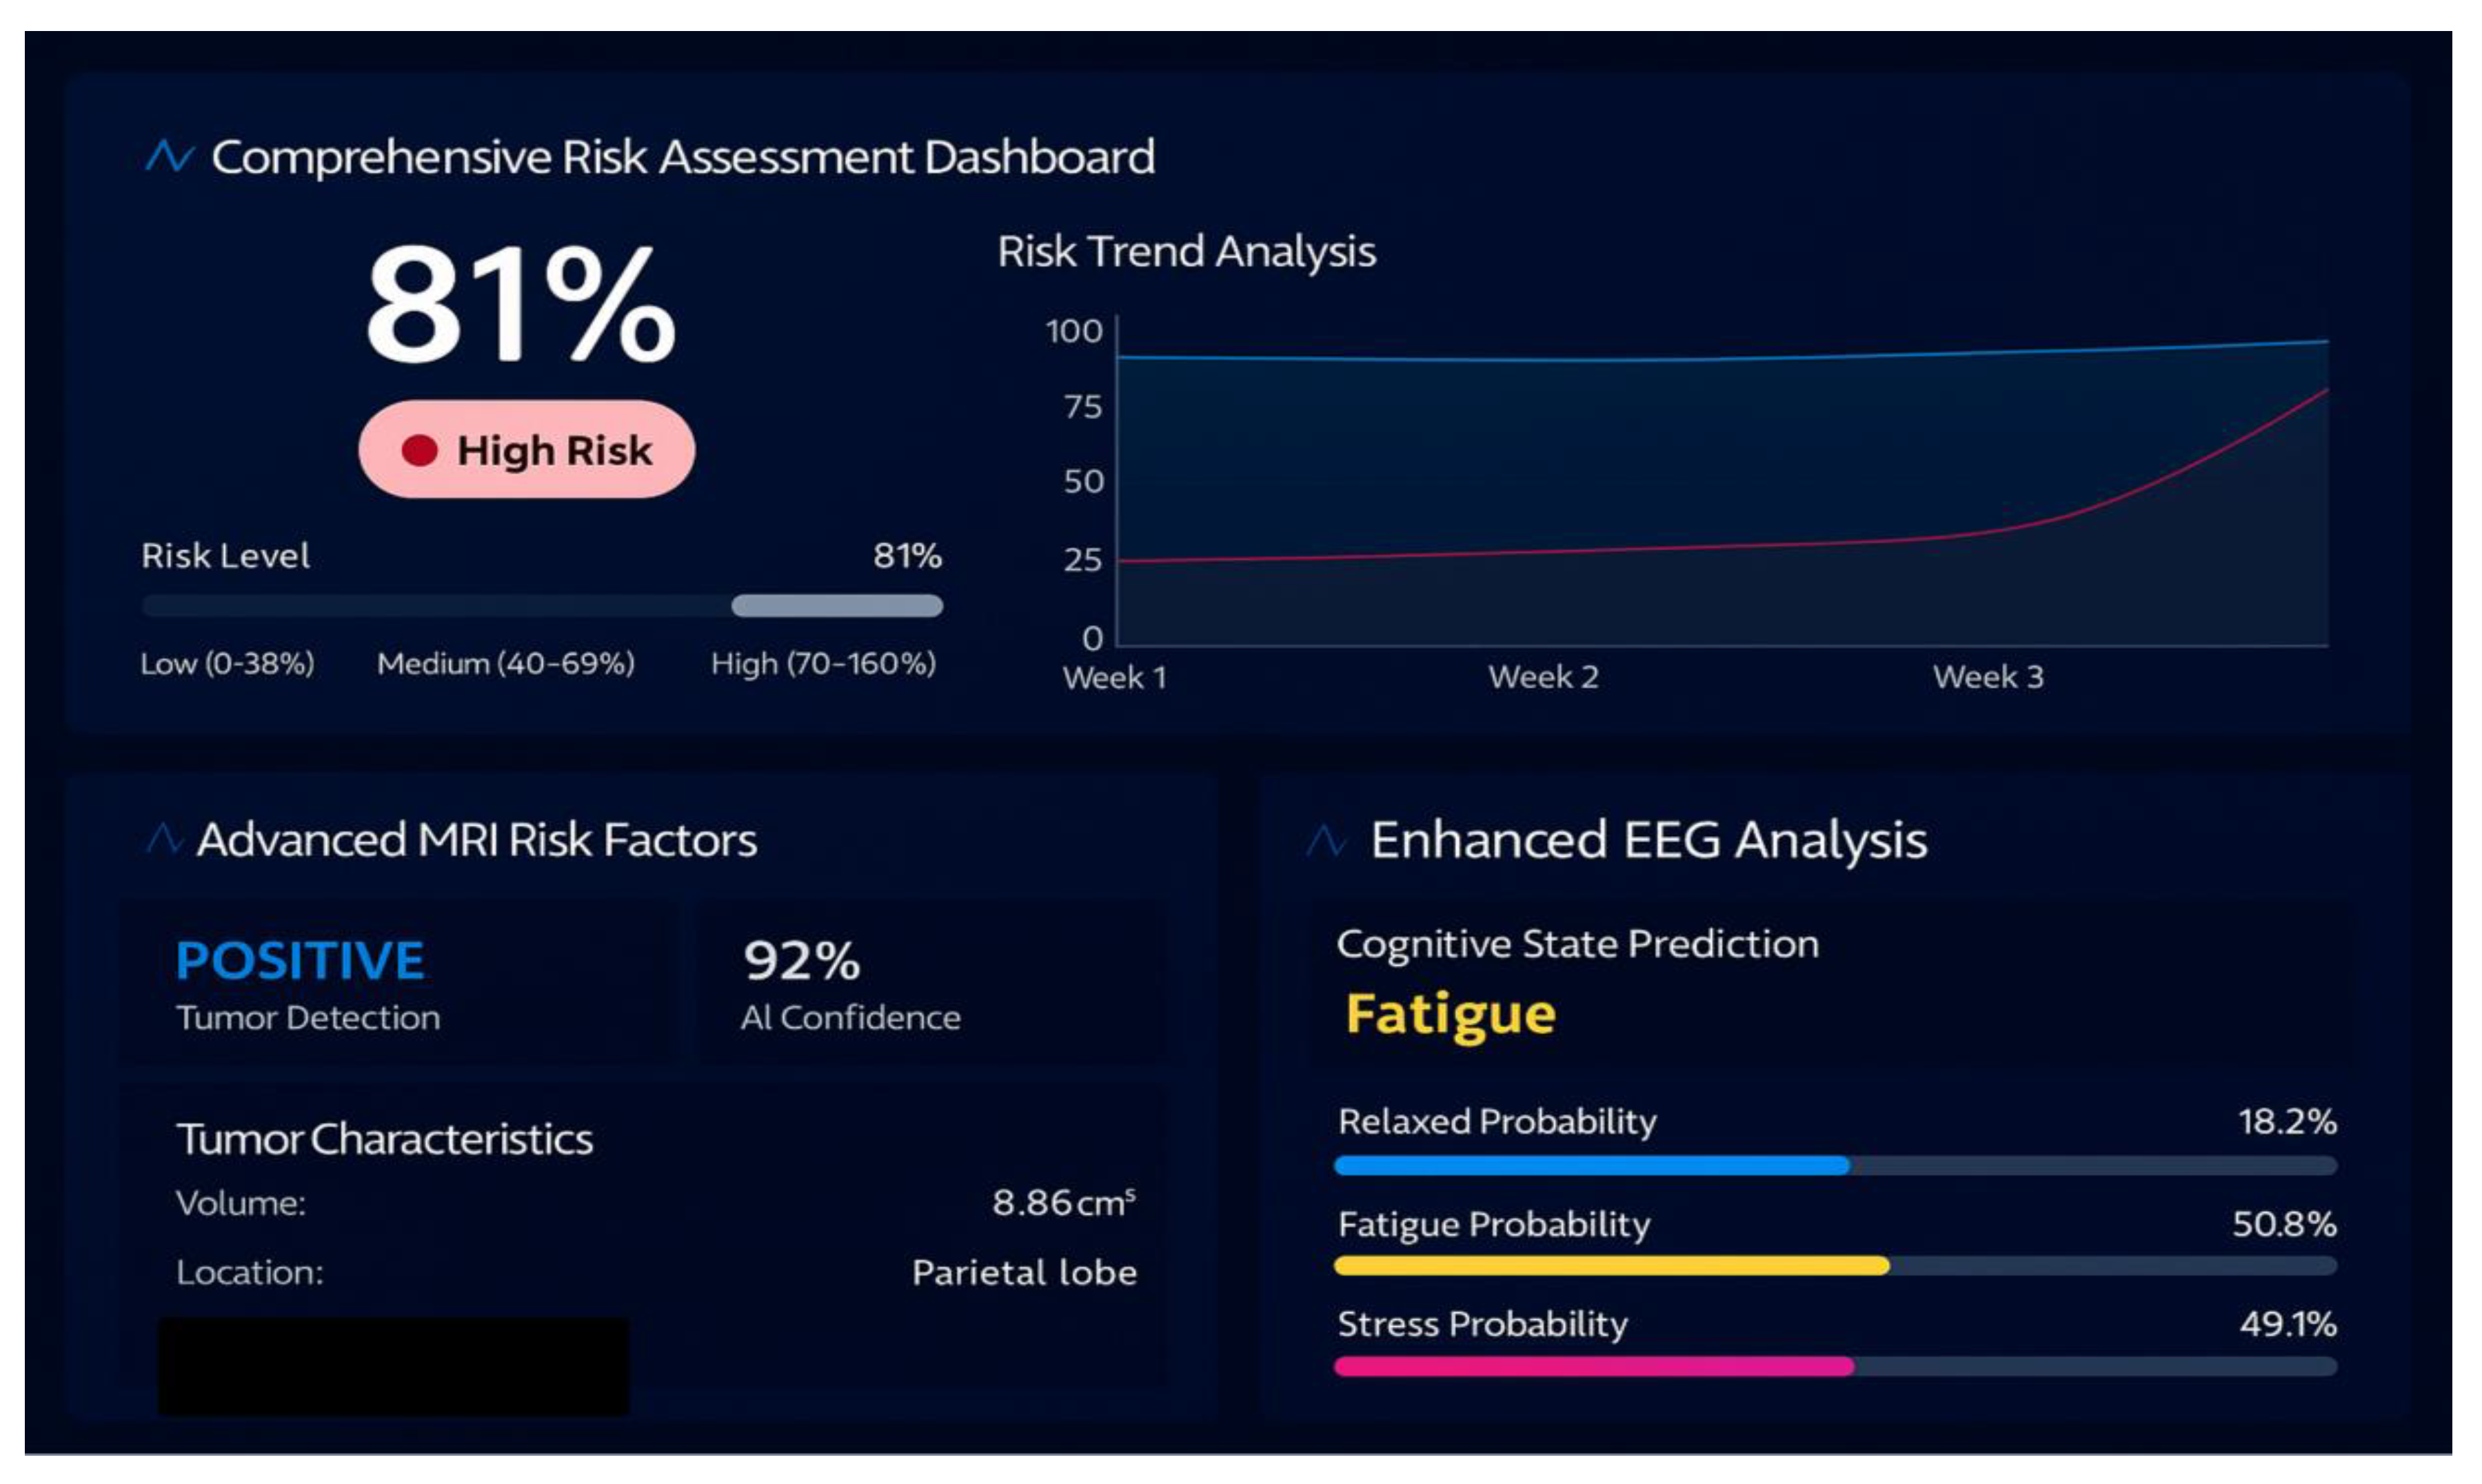
6.8. Unified Risk and Cognitive Brain State Prediction

Figure 16 contains a complete risk analysis dashboard developed in the digital twin environment. It offers a multi-layered and real-time depiction of the neurological health condition of a subject on the basis of MRI and EEG discoveries. As shown in the top section, the total calculated risk score is 81% which is a high risk as revealed in the visual gauge. This is a risk level that is a synthesis of MRI-based tumor results in conjunction with EEG-based neurological results. The risk trend analysis graph on the right graphically depicts the movement of the risk in a period of four weeks, which has been on a consistent rise.This trend may indicate tumor growth, neural deterioration, or heightened electrophysiological anomalies thereby providing an analogy in brain’s vulnerability to future diseases. In the bottom left, advanced MRI risk factors confirm the presence of a tumor with 92% AI confidence. The tumor is located in the cerebellum and has an approximate volume of 8.86 cm³. These spatial and volumetric details are computed using segmentation algorithms within the ViT++ framework and directly contribute to the risk scoring engine.The right panel provides insights derived from the EEG-based real time brain health monitoring. The system has identified the brain’s current state as Fatigue, which is commonly found in patients with underlying neurological disorders. The EEG model assigns probabilities to each possible neural state: 50.9% Fatigue, 18.2% Relaxed , and 49.1% Stressed, with Fatigue representing the highest likelihood. These values are computed from real-time EEG features processed through the edge and fog layers, which are then computed and analysed inside the Digital Twin using BiLSTM.

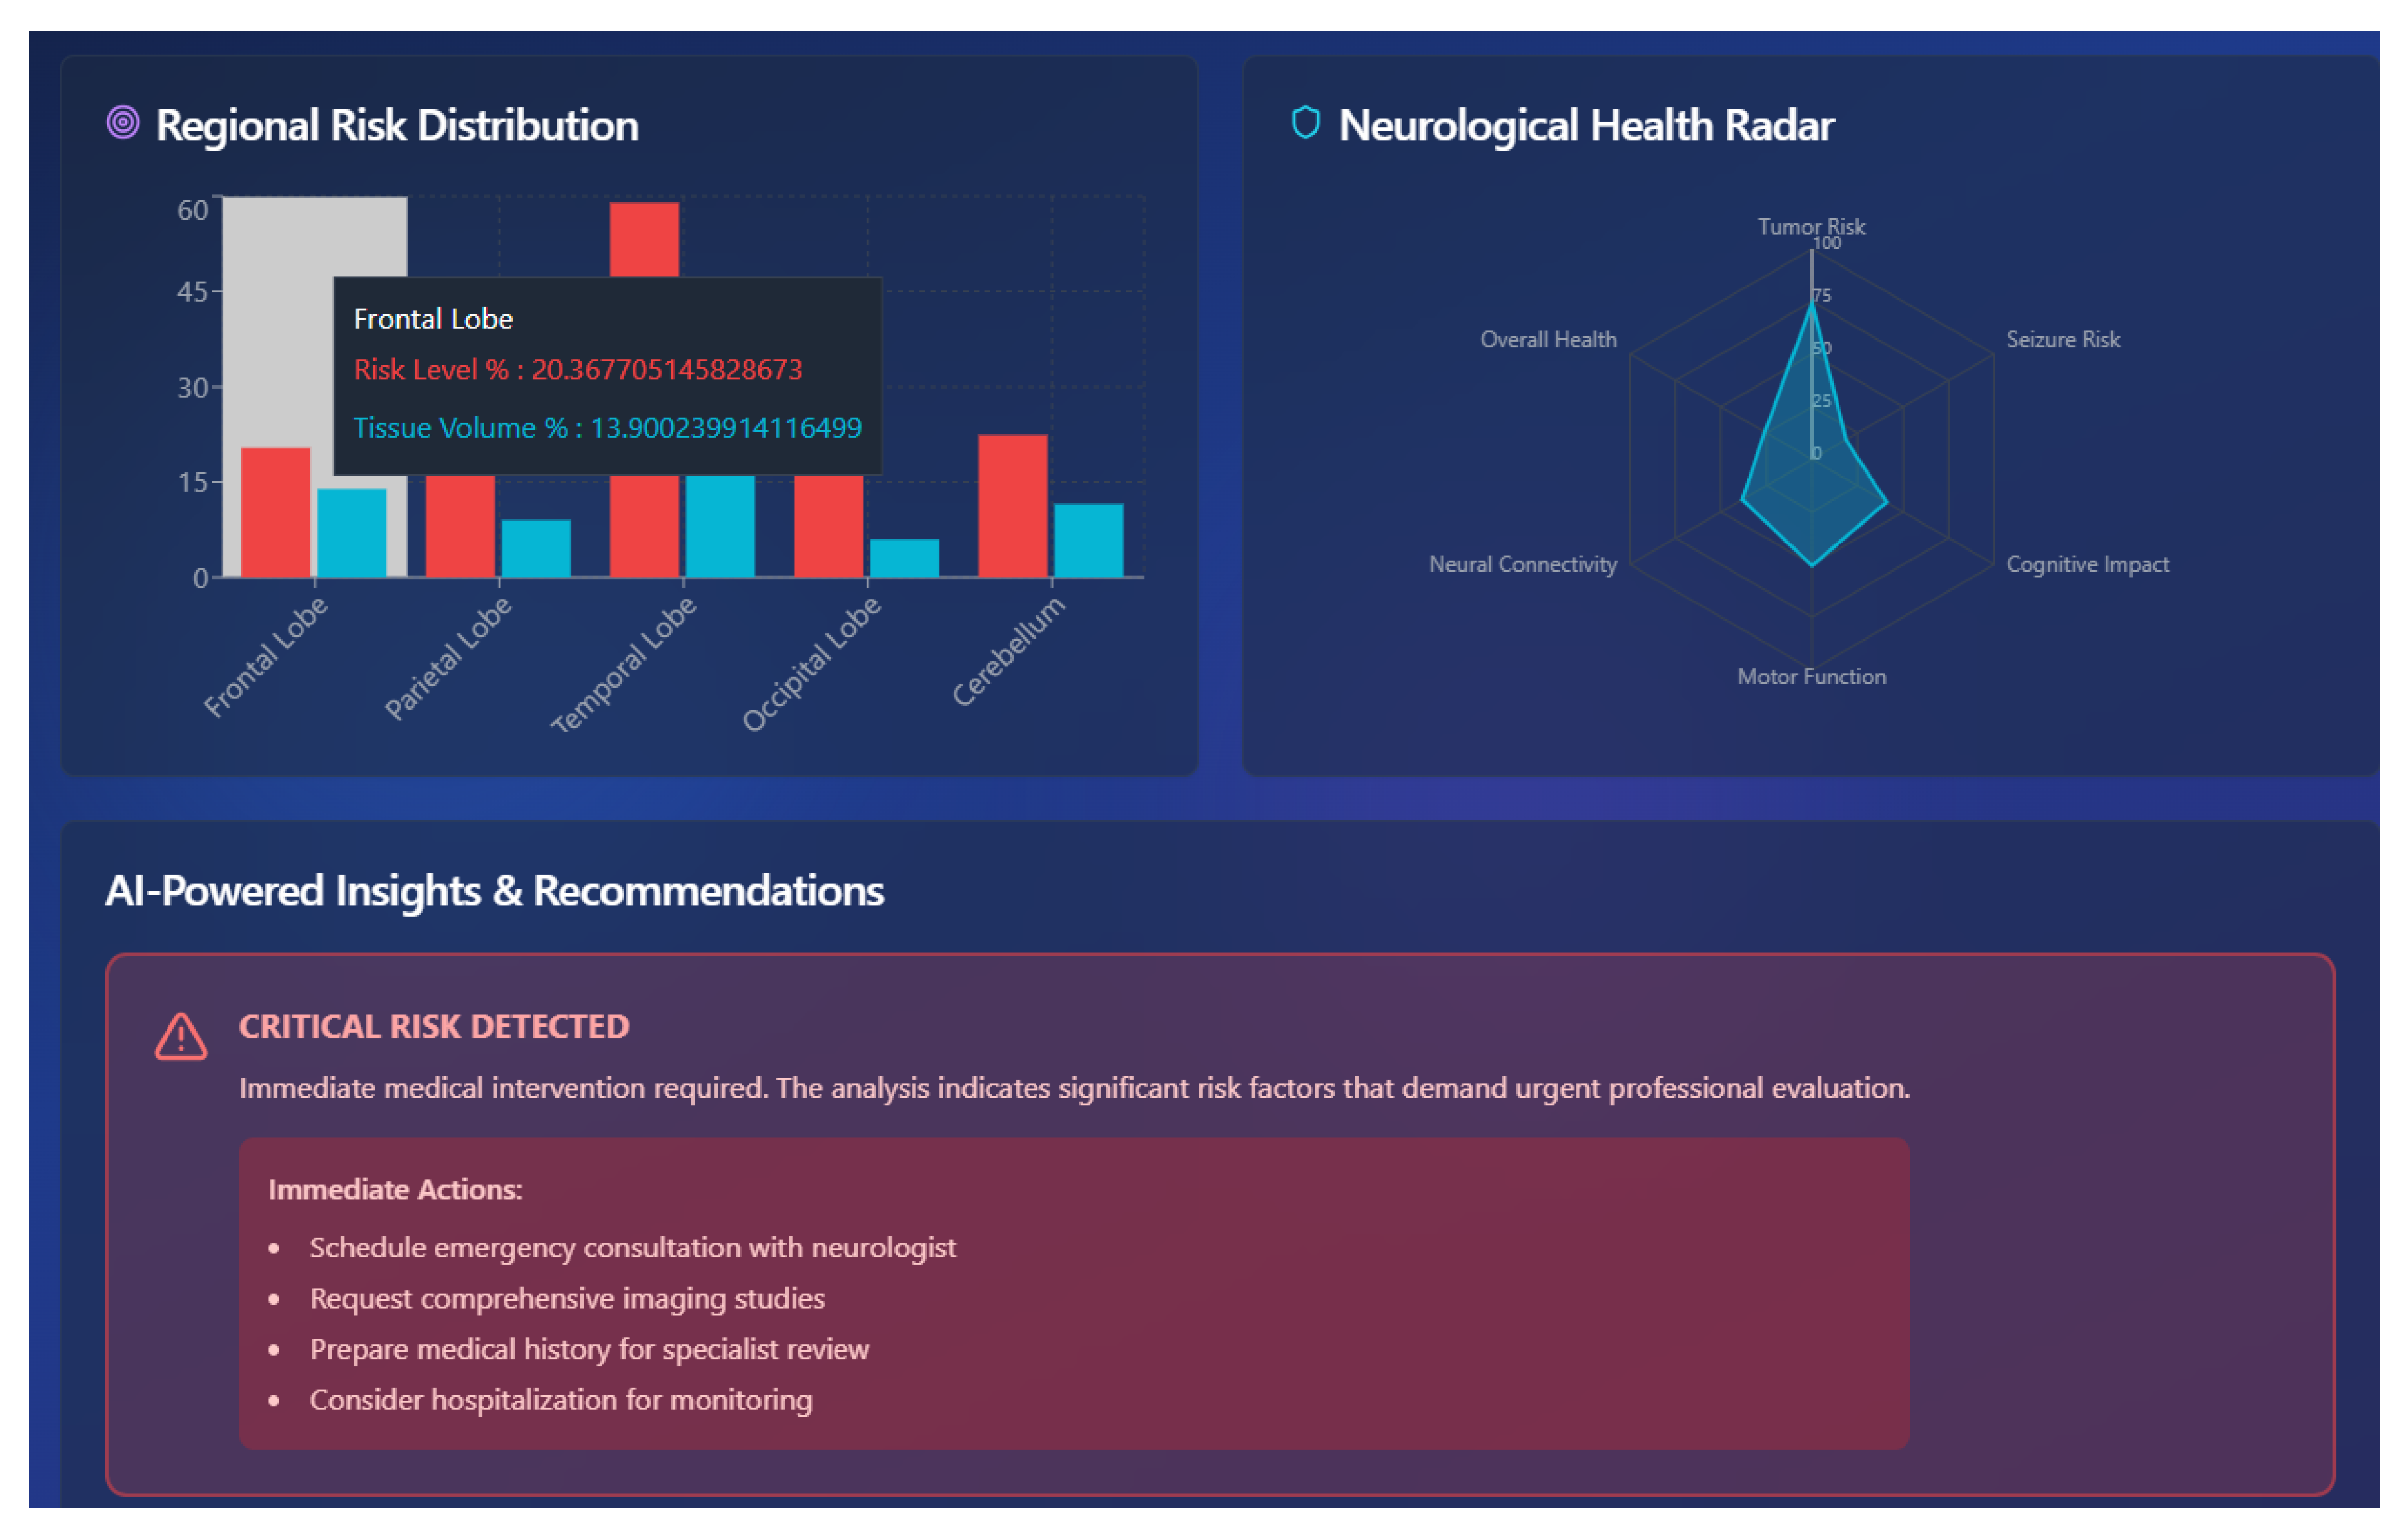
6.9. AI Powered Insights

Figure 17 summarizes the final layer of the digital twin’s diagnostic intelligence by combining regional brain risk visualization, neurological health metrics, and AI-generated clinical guidance. The Regional Risk Distribution chart reveals elevated abnormalities along with risk levels and tissue volume ranging from the frontal lobe to the cerebellum. The Neurological Health Radar indicates that the risk of tumors and seizures is high, and the cognitive and motor functions are moderately impaired. According to this examination, the AI module will raise a Critical Risk Detected notification and suggest urgent treatment, such as consultation with specialists and additional imaging. This module closes the pipeline by transforming complex neuro-data into some targeted and actionable information on clinical decision-making.

6.10. 3D Brain Interface

Figure 18 demonstrates a step-wise 3D brain model developed on Three.js framework. This enables the user to move around in the layers of the brain in a dynamic way. This is the perspective of the skull layer that allows clinicians to search the possible abnormalities at the surface of the brain. The interactive model allows the users to toggle between layers with the cortex, white matter and ventricles. This assists in scrutinizing the extent of intrusion of a tumor and the neurological damage it can bring about. Red spherical markers determine areas that have high risk of tumors in this perspective. The orange spheres represent the medium-risk regions that may have any pathological activity. The blue vertical lines are taken to be inferred neural pathways. This helps in measuring signal disruption and its effect on the brain structure. The digital twin in the system has detected a tumor at the Parietal Lobe, and the level of confidence is 92. This is a result of an integration of MRI and EEG results. This provides the visualization to be anatomic and functional.

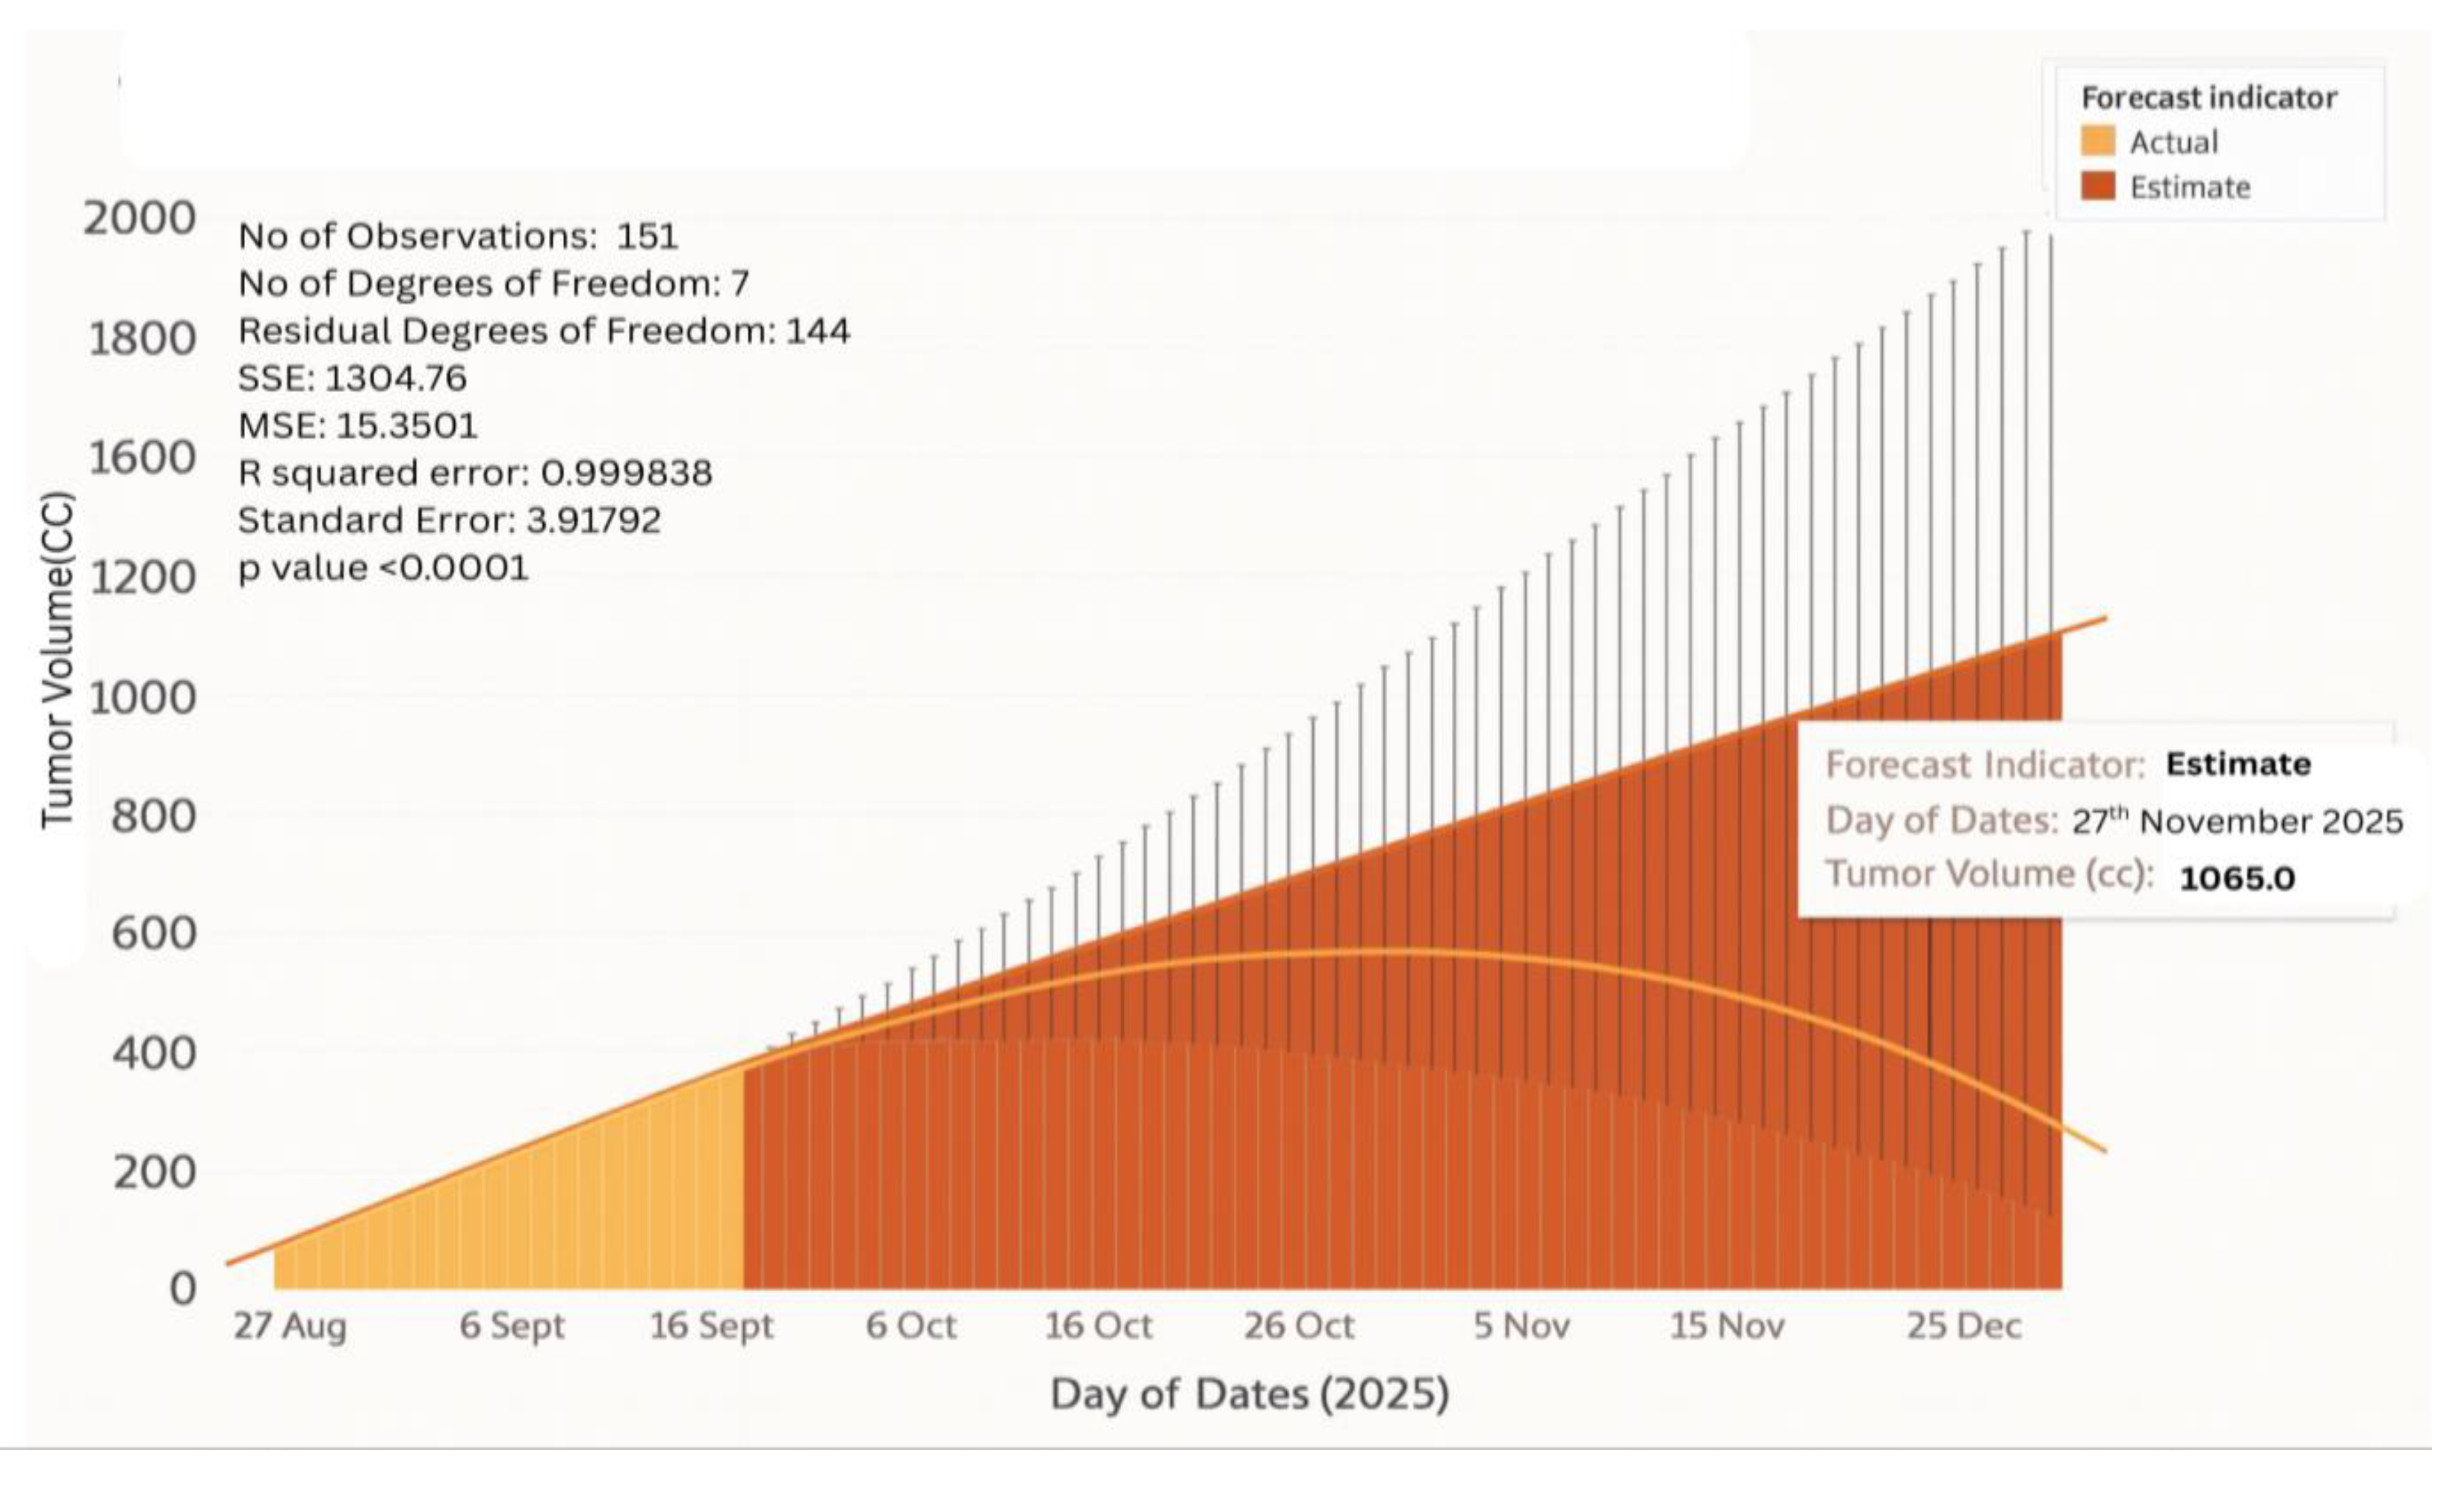
6.11. Tumor Growth Monitoring

BrainTwin unveils a Tumor Kinetics Engine to simulate future volumetric dynamics entirely using structural data derived from the MRI analysis after tumor segmentation and volumetric extraction via the Enhanced Vision Transformer (ViT++). The engine uses the Specific Growth Rate (SGR) of glioblastoma that is clinically proven (1.4% per day). https://pmc.ncbi.nlm.nih.gov/articles/PMC4578579/#:~:text=The%20median%20specific%20growth%20rate,doubling%20time%20was%2049.6%20days.
The volume of any tumor at any given time t is estimated by:
Preprints 190429 i016
where V0 is the MRI-derived baseline volume. This expression represents the hyperplastic nature of high grade gliomas which are exponential in nature and allows the digital twin to model tumor growth. The Tumor Kinetics Engine creates a continuous progression curve with uncertainty bands, which measures biological variability and enables clinicians to see initial expansion phases, acceleration points and potential, as well as the possibility of a rapid volumetric growth. It is stressed that this kinetic model does not purport to predict tumor behaviour but instead is a physiologically-relevant forward prediction model, which is fuelled by existing MRI-validated tumor burden and literature-based growth physiology. The system envisioned as future work will utilize multi-timepoint MRI scans to individually calibrate the system, and combine EEG-based functional decline measures to match neurological impairment with volumetric expansion.
  • Stage I Glioblastoma
Figure 19 demonstrates the predicted tumor-volume curve of Stage I glioblastoma as a result of 151 synchronous MRI measurements over the period of June 2025 through October 2025. The fit model had SSE = 1577.04, MSE = 10.95, RMSE = 3.31 cc, R2 = 0.999, and p = 0.0001 which indicates that it fitted very well with little residual variance, and the predicted tumor volume on 21 October 2025 will be 386 cc. The low cubic coefficient indicates a small but uniform acceleration and the low error values indicate the same thing with volume measurement as uniform tumor kinetics and very small noise. In biological terms, this trend is associated with slow and early-growing glioblastoma that has stable intracranial dynamics and good therapeutic containment. The stippled confidence interval in the plot is the 95% prediction interval, which proves that the vast majority of the measured data points fall in the statistical framework of the model.
  • Stage IV Glioblastoma
Figure 20 shows the tumor-growth prediction of Stage IV glioblastoma, fitted to 151 longitudinal observations between August and December 2025.The regression has SSE = 1304.76, MSE = 15.35, RMSE =3.92 cc, R2 = 0.999, p = 0.0001.As R2 remains same as Stage 1 but larger MSE and larger RMSE than Stage I indicate more biological variability.It is expected to grow to volume of over 1065 cc by 27 November 2025, which would be indicative of a fast rate of cellular proliferation and necrotic growth of end-stage glioblastoma. The broader range of prediction to later dates implies growing uncertainty as a result of uncontrolled and rapid increase in growth and the presence of heterogeneity in changes in the tissue. Although this variance is large, the model is strongly fitted, and this captures the biological instability and loss of therapeutic control in the advanced malignancy.

7. Conclusions

The proposed paper represents a paradigmatic transition of the next-generation neuro-oncological surveillance in proposing a real-time, scalable, and cognitively intelligent digital twin system. The proposed system, its multimodal architecture, provided by edge and fog computing layers, made it possible to implement real-time preprocessing, risk-based filtering, and secure and low-latency data transfer, which were the most severe gaps in the existing diagnostic solutions namely the unavailability of real-time flexibility, structural and functional modalities fusion, and clinical interpretability. It also adds clinically relevant prognostic information systems, such as estimation of tumor growth kinetics and anomaly. detection. Moreover, a combination of explainable decision-making pipelines and intuitive visualization in 3D contributes to increased transparency and usability in the environment of digital twins, allowing a clinician to communicate with the digital twin environment in an informed, significant way. In totality, this work provides a solid ground on the evolution of cognitively conscious digital twin systems in neuro-oncology - providing the possibility to redefine the diagnoses, monitoring, and treatment of brain disorders in contemporary healthcare systems.

7.1. Future Works

Further development of the capabilities of the digital twin should include the simultaneous multi-patient analysis by distributed twin orchestration and cloud-native management systems. Federated learning in a collaborative medical setting that enables decentralized and secure model updates across institutions without direct data sharing can be used to promote security and privacy of the system. The EEG wearable skull cap can be advanced by incorporating different multiple biosensors that can help in measuring the oxygen saturation and blood flow within the brain. Further development can be made in the accuracy of the tumor kinetics engine by including non linear modelling created granularly so as to include the complex tumor growth dynamics.

8. Acknowledgement

The authors state that they highly appreciate the help of the participants and the hardworking staff of the clinic without whom this study could not have taken place. All the procedures were performed in regard to strict institutional ethical standards. The IRB reviewed and fully complied with the Declaration of Helsinki, given that the study protocol was reviewed and approved by the IRB.

References

  1. Hussain, A.; Malik, A.; Bangash, M.N.; Bashir, A.K.; Khan, M.; Kim, K. Deep transfer learning-based multi-modal digital twins for enhancement and diagnostic analysis of brain hemorrhage using attention ResNet and DCGAN. Frontiers in Neuroscience 2023, 17, 705323. [Google Scholar]
  2. Lv, Z.; Liu, J.; Wang, Y. DTBIA: An immersive visual analytics system for brain-inspired research. Scientific Reports 2023, 13, 14770. [Google Scholar] [CrossRef]
  3. Wang, J.; He, X.; Xiong, Y.; Chen, Y. Deep transfer learning framework for multimodal medical image fusion in digital twin-based healthcare. Journal of Cloud Computing: Advances, Systems and Applications 2024, 13, 22. [Google Scholar]
  4. Yao, Y.; Lv, Z.; Song, H. Digital Twin Brain-Immersive Analytics (DTBIA): A real-time VR-enabled visual analytics framework. Sensors 2023, 23, 1729. [Google Scholar]
  5. Khan, S.; Rathore, M.M.; Paul, A.; Hong, W.H. RF-based sensing and AI decision support for stroke patient monitoring: A digital twin approach. Journal of Biomedical Informatics: X 2023, 13, 100214. [Google Scholar] [CrossRef]
  6. Upadrista, R.S.; Subbiah, S.; Sudhakar, R. Blockchain-enabled digital twin framework for secure stroke prediction. In Neural Computing and Applications; 2023. [Google Scholar]
  7. Siyaev, A.; Jo, J. Neuro-symbolic reasoning framework for natural human interaction with digital twins. Frontiers in Neurorobotics 2023, 17, 1196203. [Google Scholar]
  8. Sultanpure, S.; Karthikeyan, R.; Kumari, V. Cloud-integrated digital twin system for brain tumor detection using particle swarm optimization and deep learning. Computers in Biology and Medicine 2023, 155, 106719. [Google Scholar] [CrossRef]
  9. Wan, J.; He, W.; Zhang, X. A hybrid AlexNet-S3VM digital twin model for multimodal brain image fusion and classification. Computers in Biology and Medicine 2023, 152, 106433. [Google Scholar]
  10. Cen, H.; Cai, Q.; Yang, Y.; Wang, Y. A digital twin approach for modeling the onset of thalamic atrophy in multiple sclerosis using MRI and mixed-effect spline regression. Computers in Biology and Medicine 2023, 152, 106419. [Google Scholar]
  11. Liu, X. BTSC-TNAS: A neural architecture search-based transformer for brain tumor segmentation and classification. Computerized Medical Imaging and Graphics 2023, 110, 102307. [Google Scholar] [CrossRef] [PubMed]
  12. Lin, J. CKD-TransBTS: Clinical knowledge-driven hybrid transformer with modality-correlated cross-attention for brain tumor segmentation. IEEE Transactions on Medical Imaging 2023, 42, 2451–2461. [Google Scholar] [CrossRef] [PubMed]
  13. Chauhan, P.; Lunagaria, M.; Verma, D.K.; Vaghela, K.; Tejani, G.G.; Sharma, S.K.; Khan, A.R. PBVit: A patch-based vision transformer for enhanced brain tumor detection. IEEE Access 2024, 13, 13015–13029. [Google Scholar] [CrossRef]
  14. Massaro, A. Electronic Artificial Intelligence–Digital Twin Model for Optimizing Electroencephalogram Signal Detection. Electronics 2025, 14, 1122. [Google Scholar] [CrossRef]
  15. Kuang, Z. Epilepsy EEG Seizure Prediction Based on the Combination of Graph Convolutional Neural Network Combined with Long-and Short-Term Memory Cell Network. Applied Sciences 2024, 14, 11569. [Google Scholar] [CrossRef]
Figure 5. Comparative ROC-AUC Analysis.
Preprints 190429 g005
Figure 6. Training and validation performance of the proposed ViT++.
Preprints 190429 g006
Figure 7. Comparative Analysis of ViT++ vs Other Existing Models.
Preprints 190429 g007
Figure 8. Runtime, Memory and Resource Benchmarking.
Preprints 190429 g008
Figure 9. Raw vs Cleaned EEG Signals.
Preprints 190429 g009
Figure 12. Grad-Cam Visualization.
Preprints 190429 g012
Figure 13. ViT++ Analysis.
Preprints 190429 g013
Figure 14. Dynamic Brain Wave and Realtime Risk Analytics.
Preprints 190429 g014
Figure 15. Dynamic Tissue Analysis.
Preprints 190429 g015
Figure 16. Risk Analysis Dashboard.
Preprints 190429 g016
Figure 17. AI-predicted recommendations.
Preprints 190429 g017
Figure 18. 3D Brain Visualization.
Preprints 190429 g018
Figure 19. 1st Stage Tumor Growth Predictio.
Preprints 190429 g019
Figure 20. 4th Stage Tumor Growth Prediction.
Preprints 190429 g020
Table 4. Comparative analysis of the proposed multi modal framework against pre-existing unimodal baselines.
Study/Approach Data Modality Dataset Sensitivity (%) Specificity (%) AUC
Aftab Hussain et al. [1] MRI (RSNA 2019) 25,000 CT/MRI slices 93.4 91.2 0.932
Zhihan Lv et al. [2] EEG only ~100 subjects 92.9 91.5 0.903
Jinxia Wang et al. [3] MRI + PET/SPECT 120 patients 89.3 90.8 0.917
Yao et al. [4] MRI (fMRI, DTI) ~50 datasets 88.6 89.7 0.905
Sagheer Khan et al. [5] RF signals (UWB) 80 stroke patients 93.4 92.3 0.911
Upadrista et al. (2022) [6] Clinical 200 records 92.8 93.1 0.928
Siyaev et al. [7] Voice + symbolic reasoning 9000 queries 91.2 90.4 0.914
Sultanpure et al. [8] MRI (IoT + Cloud) 300 scans 89.6 93.5 0.941
Wan et al. [9] MRI 400 scans 90.1 93.7 0.946
Cen et al. [10] MRI HCP, ADNI 85.7 90.2 0.902
Liu et al. [11] MRI (CNN + Transformer) BraTS2019 + clinical 91.0 92.0 0.941
Lin et al. [12] MRI (CKD-TransBTS) BraTS2021 89.9 91.3 0.935
Chauhan et al. [13] MRI (ViT) 2,327 MRIs 93.2 95.3 0.958
Massaro [14] EEG (simulated + real) Alcoholic EEG dataset 90.4 89.6 0.921
Kuang et al. [15] EEG (multi-channel) CHB-MIT 99.12 95.72 ≈1.0
Proposed BrainTwin MRI + EEG 500 patients 94.1 96.8 0.972
Disclaimer/Publisher’s Note: The statements, opinions and data contained in all publications are solely those of the individual author(s) and contributor(s) and not of MDPI and/or the editor(s). MDPI and/or the editor(s) disclaim responsibility for any injury to people or property resulting from any ideas, methods, instructions or products referred to in the content.
Copyright: This open access article is published under a Creative Commons CC BY 4.0 license, which permit the free download, distribution, and reuse, provided that the author and preprint are cited in any reuse.
Prerpints.org logo

Preprints.org is a free preprint server supported by MDPI in Basel, Switzerland.

Subscribe

Disclaimer

Terms of Use

Privacy Policy

Privacy Settings

© 2025 MDPI (Basel, Switzerland) unless otherwise stated