
Submitted:
10 March 2025
Posted:
11 March 2025
You are already at the latest version
Abstract
Background/Objectives: The human brain regulates physiological processes, cognitive functions, and emotional responses. Brain-related conditions, such as neurological disorders, strokes, and tumors, are complex and pose significant challenges to medical professionals. Among these, brain tumors are particularly critical due to their impact on essential functions and the difficulty in achieving accurate diagnosis and classification. This study aims to explore the application of deep learning models in brain tumor image classification, focusing on improving diagnostic accuracy through model optimization. Methods: This research conducts a comparative analysis of four deep learning architectures: CNN, VGG-19, Inception V3, and ResNet-10. Each model's performance is evaluated on validation accuracy over ten epochs, both with and without hyper parameter tuning. Key hyper parameters, such as learning rate and optimizer selection, are adjusted to enhance model performance. Results: The CNN achieved a baseline validation accuracy of 77.86%, which improved to 89.31% after hyper parameter tuning. VGG-19, with tuning, reached a validation accuracy of 70.23%. ResNet-10 performed the worst, maintaining an accuracy of 51.91%, even with tuning. Inception V3 showed moderate performance, achieving a validation accuracy of 55.73%. The results highlight the significant impact of hyper parameter optimization on model accuracy. Conclusions: Fine-tuning hyper parameters and selecting appropriate models are critical to improving the accuracy of brain tumor classification. These findings provide insights into developing practical and efficient deep learning models, paving the way for advancements in diagnostic imaging, early detection, and clinical neuroscience.
Keywords:
Brain Tumor
; Hyper parameter
; MRI images
; Tumor Detection
; Convolutional Neural Network
; Precise Tumor Detection
1. Introduction
Brain is the most complex organ that controls the overall function of the human body [1]. The anatomical structure and physiological function of the human brain made it more complex to acquire the complete information of the brain activities[2]. These complexity of the Brain is due to its complex nature of the Cell known as Neurons. The Brain is comprised of gray matter, white matter and CSF (Cerebrospinal Fluid)[3]. The abnormal growth of cells in any of these region may become tumor[4]. The tumor represent one of the most malignant and complicated groups of diseases connected with human health that effects both the cognitive and physical functions of organ. The Tumor associate with the Brain commonly known as Brain Tumor has become one of serious health concern worldwide[5]. The detection of Brain tumor from the high definition Magnetic Resonance Imaging (MRI) is a common practice by medical professionals [6]. Even with the rapid progress of medical research and technology, early and adequate diagnosis of brain tumors remains complicated because of the complexity of brain tissue and Tumor heterogeneity in terms of size, shape, and progression. Even with improvements in medical technologies early and proper diagnosis of brain tumors remains a complex problem due to intricate nature of brain tissue and the size, shape, and speed of the development of tumors[7]. The tumor can occur in any region of the brain irrespective of age, gender. The proper identification of brain tumor from the MRI images is a difficult process to evaluate the patient condition. The conventional practice of detecting brain tumors is based on the physical examination of the MRI images by a doctor or radiologist and making decisions on their experience and knowledge[8]. However, inequalities in their experience levels and also the complexity in the image makes the process of diagnoses more difficult. The manual detection of a brain tumor becomes more time-consuming and costly[9]. Therefore, an automatic computer-aided diagnostic (CAD) system is required to assist the medical professionals and radiologists in the timely detection of these deadly tumors to save precious human lives.
Artificial intelligence (AI) and Deep Learning (DL) is a field of computer science that aims to give computers human-like intelligence, allowing them to learn, think, and resolve issues when confronted with various information[10]. AI and DL techniques are increasingly applied as powerful tools that enhance the capability of making accurate diagnosis. Especially, the application of CNN-based deep learning models has promised impressive results in image classification tasks, medical imaging involved.
Many deep learning applications have been developed, which are used for the tasks such as pattern recognition, object detection, voice recognition, and many decision-making activities [11].Earlier studies were done on the basis of conventional ML algorithms such as SVMs, k-NN, decision trees, and Naive Bayes, whereas DL algorithms are customized CNNs, VGGN, and ResNet approaches. These algorithms have been used to assist the doctor in making an appropriate and precise diagnosis for the brain tumor [12].Furthermore, the healthcare domain always challenges the availability of data for training and machine learning in terms of patients’ privacy concerns towards them. Furthermore, the approach used has less precision and recall, which lead to low efficiency and take up more time when it comes to classifying the images, leading to a further delay in patient’s treatment[13].
Several key advantages make deep learning models a promising approach toward improving outcomes for tumor detection this includes Automated Feature Extraction, High Classification Accuracy, Scalability, Flexibility and Adaptability, and Continuous Learning and Improvement. These features make the deep learning models more versatile and give promising results in accurate brain tumor detection.
This work aims to enhance and investigate CNN-based models in the classification of brain tumors with the help of medical image data based on comparison of several archetypes in deep learning such as standard CNN, VGG-19, Inception V3, and ResNet-10. The training, as well as validation accuracy of every model, is compared over various epochs with as well as without hyper parameter tuning.
Recently, deep learning has been applied in research to enhance the efficiency of computer-assisted medical diagnostics in the investigation of brain cancer. They are indispensable in the health care profession and are also useful tools in a variety of life-threatening diseases, such as diagnosis of brain disease and analysis of images for skin cancer[14]. The study aims to address the following key research areas.
- Comparative Performance of CNNs and Complex Architectures. This main to address the performances of CNNs in architectures such as VGG-19 and Inception V3 vary compared to other CNNs in classifying brain tumors;
- Impact of hyper parameter Tuning on Model Performance which comprises the sensitivity of deep learning model performance to hyper parameter tuning, including learning rate setting and optimizer choice;
Third bullet.
- Impact of hyper parameter Tuning on Model Performance which comprises the sensitivity of deep learning model performance to hyper parameter tuning, including learning rate setting and optimizer choice;
- Clinical Relevance and Real-World Deployment of CNN Models. Shows the impact of hyper parameter tuning on the learning rate and optimizers on the performance of deep learning models.
This paper is sub divided into further more sections. The section 2 presents the Materials and Methods proposed for the research, Section 3 represents the experimental results and comparison of results with and without Hyper tuning of parameters, Section 4 represents the Discussion. In last section 5 provides the conclusion.
2. Materials and Methods
The proposed methodology of the research work has been shown in the Figure 1. It can be illustrated that raw data is processed using preprocessing and data augmentation techniques. After the preprocessing the processed data is split in to test and train sets. Further the machine learning algorithm including CNN, VGG-19, Inception V3 and ResNet-10 has been applied after that the models are trained with and without hyper tuning. In the next step the performance evaluation of each model with and without hyper tuning has been done to evaluate the best performing model. Further details of these steps are elaborate in this section.
2.1. Dataset Collection and Preprocessing
2.1.1. Data Acquisition
These images are derived from MRI scans that captured different types of brain tumors at varying levels of severity. The data set is based on 320 and 320 Non Tumor MRI images. The dataset is partitioned into training and validation sets at 80% and 20% respectively. Images standardized to 224×224 pixels are compatible with deep learning architectures, including CNN, VGG-19, Inception V3, and ResNet-10. Normalization preprocessing involves scaling the pixel values between 0 and 1 for more efficient training of the model while resizing ensures that uniform input size is provided to the neural network models. Noisy images, which could deteriorate the training of the model has been filtered and adjusted to maintain high dataset quality.
2.1.2. Data Augmentation
To overcome the constraints of a small dataset and prevent over-fitting, a series of data augmentation techniques were employed to artificially increase the size of the dataset and improve the model’s ability to generalize[15]. This would let the model learn from different transformations of the original images so that it could generalize over a larger set of patterns and scenarios. This is because the natural spatial variability of tumor orientations was dealt with by applying rotation within the range of 0 to 30 degrees. Flipping was used to provide the model with different views of the tumor, while Zooming incorporated random scaling effects to mimic varying distances from the imaging. Changes in Brightness and Darkness allowed the model to cope with different lighting conditions, which is significant in MRI images where lighting may change drastically[16]. Random horizontal and vertical shifts for minor positional shifts in brain images were used through translation techniques[17]. All these augmentations were important to make the model more resistant to over-fitting and enhance its ability to generalize to a wide range of clinical scenarios, thus enhancing the validation performance of the tumor detector.
2.2. Training and Testing Dataset
The dataset was partitioned into 80:20 ratios of the training and testing subsets to enable 80% for training and 20% for testing purposes. The labeled MRI images in the training dataset will enable the CNN to learn the patterns of the tumor. To increase the model’s generalization capability, several data augmentation techniques were used to increase the diversity of the training set. The testing dataset, which contained images unseen in the training process, was used in this study to evaluate the performance of the model. This split of the data will allow the model’s accuracy and generalization capability to be evaluated on unseen data, thus giving a good and unbiased estimation of its effectiveness.
2.3. Model Archetecture Design
Based on their design principles and suitability for medical image classification, the following models were selected for analyzing and comparing the performance of various deep learning architectures in brain tumor detection.
2.3.1. Convolutional Neural Network (CNN)
CNNs are commonly used to extract basic image features by convolution and pooling layers followed by fully connected layers to classify images[18]. This model was chosen because of its simple architecture, low computational complexity, and earlier strong performances across a range of image classification tasks.
2.3.2. VGG-19
VGG-19 is a deep neural network with a uniform architecture in which several convolutional layers are stacked up in sequence, each with a small receptive field and max-pooling layers[19]. Its depth allows for complex features to be extracted from images, making it suitable for medical imaging. Its computational requirements and sensitivity to hyper parameter tuning were also considered.
2.3.3. Inception V3
The Inception V3 model uses a complex architecture designed for improved efficiency in computation and multi-scale extraction of features. Through its use of inception modules, it captures features that can cover various scales, making its performance significantly improved in the detection of intricate patterns in medical images[20]. Being both efficient and deep, it can be a promising candidate for brain tumor detection.
2.3.4. ResNet-10
ResNet-10 is a relatively shallow residual network. It is specifically designed to tackle the vanishing gradient problem with skip connections[21], which would ensure smoother gradient flow and efficient training even for deeper networks. ResNet-10 is less complex than the deeper ResNet architectures but was used to assess residual learning’s efficiency in a computationally constrained environment[22].
The architectures selected here will provide a variety of models that range from very simple feature extractors to quite complex networks able to learn from multi-scale and residual learning. These selections will thus allow a better evaluation of performance, computational cost, and applicability to the problem of brain tumor classification.
2.4. Hyperparameter Tunning
2.4.1. Learning Rate Adjustment
The learning rate is one of the most important hyper parameters in deep learning-it controls the update performed based on the gradient of loss at each iteration of gradient descent[23]. In this study, different learning rates were experimented upon to find which would have the best effect on the convergence ability of the model to an optimal solution. Employing a relatively high learning rate of 0.1 for the un-tuned CNN then used, increasing learning rates result in a quicker converging process by hopping larger steps along the gradient toward the global minimum of the loss function, however they tend to overshoot the minimum and end up in suboptimal solutions. At the higher learning rate, it resulted in moderate accuracy due to slow convergence. It was because the model could not fine-tune and shape its parameters suitably.
Through hyper parameter tuning, the learning rate was reduced to 0.001, significantly improving model performance, with the increased validation. Lower learning rates ensure that the model makes smaller, more precise adjustments to the weights, which can prevent the model from skipping over optimal solutions.
2.4.2. Optimizer Selection
Optimizer selection significantly influences the effective training of a model from the training data. This paper selects Adam optimizer instead of conventional optimization techniques, such as Stochastic Gradient Descent (SGD), due to its adaptive learning rate and handle of large noisy datasets[24]. Adam is specifically robust in medical image tasks, such as tumor classification where image data might be noisy and sparsely consisting of features of the tumor[25]. While it was possible to converge more rapidly and stably by having the ability to alter its learning rate in real time due to gradients, the effect mattered especially when doing MRI scans where tiny changes in the image could be used in real for diagnostic differences. The SGD introduces uniform learning rate and it becomes slower as well as more difficult to escape the local minima in case of complex and high-dimensional data[26]. In this work Adam performed better than other optimizers such as SGD on validation accuracy and convergence speed and increases the strength of evidence for this algorithm for such complicated medical image data.
2.4.3. Loss Function
The research work is based on the classification of one of two categories such as tumor or non-tumor, determining the appropriate loss function is a pre-requisite for optimization of the performance of the model[27]. The binary cross-entropy was used as the loss function by the network. Binary cross-entropy is made to measure the difference between the probability generated by the model and the actual label it is associated with, for each sample[28]. The comparison between the predicted outputs of the model with an actual label as binary (0) for a non-tumor and (1) for a tumor has been computes for an incorrect prediction to enable the model to minimize this error at training.
The use of binary cross-entropy during this work ensured the output of the model to be fine-tuned to the discrimination of better brain tumor images, hence improving the overall performance of the classification results[29].
2.5. Model Evaluation
2.5.1. Performance Metrics
An analysis of model performance was performed through key metrics that included accuracy, precision, recall, and the F1-score. Accuracy gives the general correctness of the model, while precision measures its correct prediction for the positive case; recall assesses its capacity to identify the real positive cases; and the F1-score, which provides an average of the precision and recall[30]. This analysis ensured a total evaluation of models’ classification capabilities.
2.5.2. Computational Efficiency
Average training time per epoch and total training time were recorded to be able to establish how computationally efficient the models proved to be. These measures informed usability in clinical environments, potentially with resource constraints.
2.5.3. Validation
An independent test dataset comprising unseen images was used to validate the generalization ability of the models. The performance metrics on this dataset include accuracy, precision, recall, and F1-score, to ensure unbiased evaluation and to compare the effectiveness of the models.
2.6. Results Comparison and Analysis
2.6.1. Performance Comparison
The CNN, VGG-19, Inception V3, and ResNet-10 models were compared systematically in terms of validation accuracy, efficiency of computation with training time per epoch, and total execution time. This analysis gives the strengths and weaknesses of the model regarding both classification accuracy and computational requirements as considerations for use in clinical-related applications.
2.6.2. Optimal Model Selection
The selection of the optimum model was done balancing high accuracy and computation efficiency. Among the different models tested, the best suited model for clinical use will be selected based on the accuracy and its lightweight architecture ensures more computationally efficient.
3. Results
3.1. Overview of Model Performance
The performance of the CNN, VGG-19, Inception V3, and ResNet-10 models is compared before and after hyper parameter tuning. Un-tuned models showed only marginal improvements in accuracy, and deeper architectures had difficulties in converging efficiently. After tuning, CNN obtained the best balance between accuracy and speed, pointing out that optimization is important for practical applications in medical imaging.
3.2. Performance Without Hyperparameter Tuning
3.2.1. Baseline CNN Model
The base CNN was trained on the brain tumor dataset without any adjustment of the hyper parameters in the initial training stage. The baseline CNN model is consisted of 10 total layers, which included convolution, pool, and fully connected layers. At the initial stage, the learning rate was set to 0.1, along with the usage of the Adam optimizer. For instant, with 10 epochs of training, the accuracy of the model is increased over time and peaks in the last epoch reaching 76.58% against a starting value of 45.49% in the first epoch. The validation accuracy on the other hand improves very slowly, starting with 57.25% and ending at 77.86%. Figure 2 shows the training and validation accuracy comparison at different epochs.
The more complex architectures, which include VGG-19, Inception V3, and ResNet-10, were also evaluated in un-tuned state to analyze baseline level of performance.
3.2.2. VGG-19 Model
The deep and complex un-tuned VGG-19 model is not significantly improved by training. Starting with a training accuracy of 47.98%, it yielded up to 66.99% in the last epoch, while the validation accuracy fluctuated highly from 52.67% to 54.96% in relation to the epochs. VGG-19 deep architecture is highly effective at the extraction of complex features but relatively did extend training times where every epoch was taking around 140 to 155 seconds. The total runtime for 10 epochs would go up to 26 minutes and 13 seconds. These results indicates that the model would be unable to converge as required if proper hyper parameter tuning has not be done, since it would be too sensitive and high capacity.
3.2.3. Inception V3 Model
The multi-scale feature extraction is carried out by the architectural design of the Inception V3 model which had a starting training accuracy of 51.82% and then steadily increased during all epochs to 62.96% at the end of 10 epochs but was rather modestly validating, first with an accuracy of 47.33% and peaking at 55.73% only. It’s quite observable that Inception V3 had great computational efficiency since epoch to epoch took between 17 and 28 seconds, thus a total cycle training time for 10 epochs will take 3 minutes and 55 seconds. Although the proposed architecture managed to capture features at all possible scales, the output was not satisfactory because further tuning was needed to realize the full potential of the networks
3.2.4. ResNet-10 Model
The un-tuned model of ResNet-10, though to have residual connections so that gradients flow more smoothly through deeper layers and give resolution for the vanishing gradient problem, was very poor. In the early epochs of training both training and validation accuracy is in a plateau; training accuracy stabilizes to about 50.67 percent whereas the validation accuracy is at approximately 51.91 percent. Minimum improvement seen over the 10 epochs shows that it could not learn well in its un-tuned state. Every step took anywhere from 107 to 124 seconds; hence, the total simulation would come out to around 18 minutes and 43 seconds. Of course, those results foretell a pretty clear indication that hyper parameter tuning is quite crucial to unfolding the full potential of residual learning in ResNet-10.
Figure 3 illustrates the comparison of the VGG-19, Inception V3 and ResNet-10 Model based on their accuracy in percentage, and the training time per epochs in second, the comparison of the models has been acquired before the implementation of hyper parameter tuning.
3.3. Performance With Hyperparameter Tuning
3.3.1. CNN Performance Improvement
Hyper parameter tuning has significantly improved the CNN model’s performance in both training and validation accuracy. Starting with the untreated CNN, the accuracy at training was 76.58%, and at validation, it was 77.86%. The whole architecture of the model had to be fine-tuned by adjusting a number of critical hyper parameters significantly to boost the accuracies of the model; this was after lowering the learning rate from 0.1 to 0.001. Final training accuracy reached 95.97%, and validation accuracy improved up to 89.31% at tenth epoch. This improvement can be reflected as owing to better fine-tuning of weights that the model achieves through an optimized learning rate, which converges better and reduces generalization errors. The result thus supports the importance of deep learning hyper parameter optimization in improving classification performance, particularly in complex cases like the detection of brain tumors.
3.4. Model Comparisons
The final comparison of the models was achieved after hyper parameter tuning: CNN, VGG-19, Inception V3, and ResNet-10 models were compared with regard to the validation accuracy, execution time per epoch, and speed of computation. CNN seemed to be the most balanced and efficient with validation accuracy at 89.31% and relatively short execution time of 19-20 seconds per epoch. However, VGG-19 validated at 70.23%, yet with much higher computational resource intake than the models above to such an extent that every epoch took 140-155 seconds. Inception V3 is the computationally efficient model as it took only 17-28 seconds per epoch to train. But, its validation accuracy was low at 62.96%, and there was no significant improvement in performance based on the different tuning settings. Residual connections in ResNet-10 led to only slight improvements, raising the validation accuracy up to 55.73% and requiring 107-124 seconds per epoch. This demonstrates that CNN is good at the trade-off between accuracy and efficiency but is bad for VGG-19 depth and Inception V3’s design under specific computational constraints. Figure 4 illustrates the comparison between validation accuracy before and after the hyper parameter tuning.
3.5. Runtime and Computational Efficiency
The complexity and depth of each architecture led to large variations in the execution time per epoch. In terms of speed and performance, CNN resulted in an excellent balance with an execution time of around 19-20 seconds/epoch post-tuning. VGG-19, with deeper layers and more parameters, took very long times to execute, about 140 to 155 seconds/epoch. Inception V3 was extremely computationally cheap to run, taking just between 17 to 28 seconds to complete an epoch but these computational efficiencies were not reflected similarly in gains in accuracy. ResNet-10 ran a lot more slowly, being only moderately faster than the VGG-19, at 107-124 seconds per epoch, indicating a computational price in residual connections.
3.6. Epoch Execution Time
The execution time for the epoch of all models with respect to the complexity as well as the depth of the architectures was highly variable. Figure 5 illustrates the comparison of execution time per epochs among each model. CNN model has well-balanced speed and performance. It used around 19-20 seconds per epoch after tuning, while VGG-19, which is significantly deeper with a large number of parameters, had much longer execution times with an operational time ranging from 140 to 155 seconds per epoch. Inception V3 remained moderately computationally efficient, taking between 17-28 seconds per epoch, but again did not translate to comparable gains in the level of accuracy. ResNet-10, while faster than VGG-19 at runtime, had mid-execution times of 107-124 seconds per epoch, reflective of its more expensive residual connections.
3.7. Training Efficiency vs Accuracy
The graphs shown in Figure 6 indicate that the efficiency of the trained models varies with respect to the accuracy of the respective models. The CNN model has done the best job in terms of trading off between different models by scoring a high validation accuracy of 89.31% with relatively short times of 19-20 seconds per epoch. Such a combination of high accuracy as well as reasonably short training time makes CNN very effective for practical applications where both accuracy and speed of training are of equal importance. VGG-19, although having a strong validation accuracy of 70.23%, had between 140-155-second training times per epoch, making it infeasible in resource-constrained scenarios. In contrast, the epoch times for Inception V3 were very quick, spanning about 17 to 28 seconds, but at a cost, since the validation accuracy was relatively lower at 62.96%, which provides some space for further optimization to achieve clinically viable performance. Although the intermediate training times of ResNet-10 seem not to benefit considerably in terms of accuracy, while there is still place for improvement. This shows that the most efficient model is CNN while VGG-19 and Inception V3 are those requiring further adjustment in compromising their accuracy and training efficiency.
3.8. Performance Metrics
Multiple performance metrics have been used in this study to give an all-rounded evaluation of the integrated Neuro-Fuzzy K-means model for brain tumor detection. These metrics, apart from accuracy, will serve perfectly for evaluating this model in classifying tumor and non-tumor cases.
3.8.1. Accuracy
Accuracy is defined as the proportion of correctly classified instances, both tumor and non-tumor, compared with the total number of instances. In this study, the model attained an accuracy of 89.31%, which means most of the predictions were true. However, in clinical applications, accuracy itself may not be enough because accuracy cannot make a distinction between the types of errors, namely false positives against false negatives.
3.8.2. Precision
Precision is the number of true positives-over all cases that have been predicted positive. The study suggests precision to be 88.89%, meaning that the model has yielded relatively few false positives. This metric is important in medical diagnosis because, for most cases highlighted as tumors, they turn out to be valid, thereby saving the extra treatment or follow-up for false positives.
3.8.3. Recall
Recall is also known as sensitivity or true positive rate. Recall measures the fraction of actual positive cases, often referred to as a tumor, which the model correctly identified. The recall of the proposed model was 94.12%, meaning that it identified most tumors and consequently reduced the occurrence of false negatives. In the detection of tumors, high recalls are critical due to the implications missed in treatment for the patient.
3.8.4. F1-Score
The F1-score is the harmonic mean of precision and recall, which tries to find the balance between the two metrics. If false positives and false negatives are imbalanced, the F1-score provides a better evaluation that balances the two. A high value for the F1-score means it is most probably close to 91% from the values of the precision and recall, ensuring the reliability of the detection of tumors and a minimal false-positive rate.
The performance metrics-accuracy, precision, recall, and F1-score-provide a generalized overview of effectiveness of the brain tumor detection model as shown in Figure 7. A simple accuracy of 88.0% suggests that the model has good ability to identify both tumor and non-tumor cases with high reliability. Precision stands at 88.89%, meaning that the detected tumor has the least chances of having false positivity, and most of the recognized are real. This is essential in medical diagnostics since false positives would give unnecessarily high interventions, which causes anxiety in patients and extra health care costs. Recall, at 94.12%, indicates that the model performs well on actual cases of the tumor; hence it places emphasis on recall in identifying the tumors that deserve attention. Lastly, the F1-score of 91.0% shows balance between precision and recall, indicating the model has great performance in clinical application. The strengths and weaknesses of the model can be easily assessed at a glance by stakeholders through a collective display of the metrics in a bar graph, hence enabling decision-making about incorporating it into clinical workflows for effective brain tumor diagnosis and management. Table 1 and Table 2 shows the Performance comparison of deep learning models on the tumor dataset without parameter tuning and with parameter tuning respectively.
3.9. Model Performance Visualization
This work demonstrates the whole procedure of detecting a brain tumor using superior imaging methods. As shown in Figure 8, the Input MRI Image gives as the input data, providing an insight view into the anatomical structure of the brain, the Filtered MRI Image is the output after the pre-processing stage on the image has been implemented so as to maximize the detectability of tumors as in the next step. Filtration of the image eliminates the noise and artifacts that help in identifying the abnormal tissues accurately. The image of Tumor Detection with Bounding Box visually points out that the model can specially detect regions of interest in the MRI scan that would immediately indicate where the tumor is located.
Figure 9 shows the further enhanced image by the Isolated Tumor Image, where the tumor is separated from the rest of the tissues for an in-depth examination of its features. The subsequent Tumor Outline Overlay image further cements this model’s accuracy as it superimposes the outline of the tumor against the MRI to make easy comparison with the original anatomical features.
Finally, the Tumor Detection in the Whole MRI Scan image represents a summary of the totality with regard to effectiveness, about how the detection process was carried out. This photograph clearly indicates how the model detects the tumors in the totality of the MRI. The transition from input to final detection reflects the strength of the integrated Neuro-Fuzzy K-means approach in the process for diagnostic accuracy and in clinical decision-making. Taken together, these images make up a visual saga that reinforces the conclusions that have been drawn from this study and emphasizes the utility of the model in concrete tumor detection scenarios in reality.
4. Discussion
The process of hyper parameter tuning had a profound impact on the performance of the models, especially in terms of accuracy. For instance, tuning the learning rate from 0.1 to 0.001 in the CNN resulted in a marked improvement in both training and validation accuracy, with validation accuracy increasing from 77.86% to 89.31%. This gain is due to the more finely tuned model, which happens at a lower learning rate and does not over jump optimal weight values with its ease of convergence. The validation accuracy of the VGG-19 increased from 54.96% to 70.23% after the tuning procedure; however, it increased at the expense of the longer training time due to the depth of the network. In contrast, models like Inception V3 and ResNet-10 demonstrated more moderate gains in accuracy, which remained even after tuning; it could be ascribed to the complexity of their architecture and their sensitivity to the chosen dataset.
The findings of this research validate the previous works, since it has proved that indeed, CNNs and deep learning architectures are capable of attaining great effectiveness in medical image classification, such as the task of detecting brain tumors. For example, the research study by Pereira et al. had manifested CNN’s robust outperformance of many traditional machine learning methodologies, such as SVMs and KNN, finding much more than 90% accuracy in segmenting tumors while using a different method, results confirmed in this research after making parameters adjustments. This performance of VGG-19 also mirrors what has been known to-date that is the talk of the capability of the network to extract deep features but comes with longer training times and greater sensitivity to hyper parameters. This study differs in its novelty because it compares several architectures and focuses on the practical effects of tuning in resource-constrained environments, which is still a less-explored area in literature.
Further work would be through architectures that are possibly much deeper versions of ResNet or hybrid models combining convolutional and recurrent layers towards improved performance in brain tumor detection. Otherwise, deployment on more significant and diverse datasets, containing different types of tumors, or even other medical imaging tasks such as lung or breast cancer, would otherwise provide further insight into their generalizability and robustness. Advanced optimization techniques, for instance, Bayesian optimization or even automated machine learning could probably have been applied to make hyper parameter tuning effective in enhancing further the performance of the model.
5. Conclusions
This study highlights the importance of hyper parameter tuning in improving deep learning models toward better performance on brain tumor classification tasks. Fine-tuning parameters for the learning rate and optimizer improved accuracy significantly for the CNN, which reached a high validation accuracy score of 89.31%. Even though other architectures, such as VGG-19 and ResNet-10, also benefited from tuning, the improvement was not so significant, revealing the difficulties associated with training deeper networks in limited resource environments. Such results validate the applicability of CNNs to medical image classification tasks and resonate with previous research that emphasizes the reliability of deep learning approaches as opposed to machine learning techniques.
Future work will focus on how to address the problems existing in the current architectures. For example, maybe one can be further improved by deeply deepening ResNet or a hybrid architecture which combines convolutional and recurrent layers. Optimization techniques that include Bayesian optimization or automated machine learning could improve upon hyper parameter tuning, further improving model performance. Expanding on the dataset to include diverse tumor types or other medical imaging tasks, such as lung or breast cancer detection may be very capable of boosting the robustness and generalizability of these models. This study provides key insights into deep learning frameworks that are efficient and practical so as to pave the way for diagnostic imaging developments early detection of critical medical conditions.
Data Availability Statement
The data has been taken from the private hospital located in Saudi Arab with permission. Data is unavailable due to privacy or ethical restrictions.
Acknowledgments
We would like to thanks private Hospital located in Saudi Arab for sharing the MRI images for the study.
Conflicts of Interest
The authors declare no conflicts of interest.
Abbreviations
The following abbreviations are used in this manuscript:
| CNN | Convolutional Neural Network |
| VGG-19 | Visual Geometry Group Network-19 |
| ResNet | Residual Networks |
| CSF | Cerebrospinal Fluid |
| SGD | Stochastic Gradient Descent |
| MRI | Magnetic Resonance Imaging |
| VGGN | Visual Geometry Group Network |
| SVM | Support Vector Machine |
| CAD | Computer-Aided Diagnostic |
| AI | Artificial intelligence |
| DL | Deep Learning |
| k-NN | k-nearest neighbor |
References
- Tang, X.Y.; Wu, S.; Wang, D.; Chu, C.; Hong, Y.; Tao, M.; Liu, Y. Human organoids in basic research and clinical applications. Signal Transduct. Target. Ther. 2022, 7(1), 168.
- Amir, M.; Ohra, S.; Kumar, A. General anatomy and physiology of the brain. In Novel Drug Delivery Systems in the Management of CNS Disorders; Academic Press: 2025; pp. 3–14.
- Bigbee, J.W. Cells of the central nervous system: An overview of their structure and function. Glycobiol. Nerv. Syst. 2022, pp. 41–64.
- Biratu, E.S.; Schwenker, F.; Debelee, T.G.; Kebede, S.R.; Negera, W.G.; Molla, H.T. Enhanced region growing for brain tumor MR image segmentation. J. Imaging 2021, 7(2), 22. [Google Scholar] [CrossRef] [PubMed]
- Khan, M.S.I.; Rahman, A.; Debnath, T.; Karim, M.R.; Nasir, M.K.; Band, S.S.; Dehzangi, I. Accurate brain tumor detection using deep convolutional neural network. Comput. Struct. Biotechnol. J. 2022, 20, 4733–4745. [Google Scholar] [PubMed]
- Arabahmadi, M.; Farahbakhsh, R.; Rezazadeh, J. Deep learning for smart Healthcare—A survey on brain tumor detection from medical imaging. Sensors 2022, 22(5), 1960. [Google Scholar] [CrossRef] [PubMed]
- Neamah, K.; Mohamed, F.; Adnan, M.M.; Saba, T.; Bahaj, S.A.; Kadhim, K.A.; Khan, A.R. Brain tumor classification and detection based DL models: A systematic review. IEEE Access, 2023.
- Kumar, P.R.; Bonthu, K.; Meghana, B.; Vani, K.S.; Chakrabarti, P. Multi-class brain tumor classification and segmentation using hybrid deep learning network model. Scalable Comput. Pract. Exp. 2023, 24(1), 69–80. [Google Scholar]
- Maqsood, S.; Damaševičius, R.; Maskeliūnas, R. Multi-modal brain tumor detection using deep neural network and multiclass SVM. Medicina 2022, 58(8), 1090. [Google Scholar] [CrossRef] [PubMed]
- Lepakshi, V.A. Machine learning and deep learning based AI tools for development of diagnostic tools. In Computational Approaches for Novel Therapeutic and Diagnostic Designing to Mitigate SARS-CoV-2 Infection; Academic Press: 2022; pp. 399–420.
- Mohanta, S.K.; Mohapatra, A.G.; Mohanty, A.; Nayak, S. Deep learning is a state-of-the-art approach to artificial intelligence. In Deep Learning Concepts in Operations Research; Auerbach Publications: 2024; pp. 27–43.
- Chakraborty, S.; Banerjee, D.K. A review of brain cancer detection and classification using artificial intelligence and machine learning. J. Artif. Intell. Syst. 2024, 6(1), 146–178. [Google Scholar]
- Li, M.; Jiang, Y.; Zhang, Y.; Zhu, H. Medical image analysis using deep learning algorithms. Front. Public Health 2023, 11, 1273253. [Google Scholar]
- Roy, A.; Roy, P.K.; Mitra, A.; Maji, P.K.; Choudhury, S.R.; Peng, S.L. Enhancing patient care with modality-based image registration in modern healthcare. In Smart Medical Imaging for Diagnosis and Treatment Planning; Chapman and Hall/CRC: 2023; pp. 95–136.
- Maharana, K.; Mondal, S.; Nemade, B. A review: Data pre-processing and data augmentation techniques. Global Transitions Proc. 2022, 3(1), 91–99. [Google Scholar]
- Yan, Q.; Feng, Y.; Zhang, C.; Wang, P.; Wu, P.; Dong, W.; Zhang, Y. You only need one color space: An efficient network for low-light image enhancement. arXiv preprint. arXiv:2402.05809, 2024.
- Bajaj, S.; Bala, M.; Angurala, M. A comparative analysis of different augmentations for brain images. Med. Biol. Eng. Comput. 2024, pp. 1–28.
- Mathew, A.; Grace, K.V.; Preetha, M.M.S.J. An approach for lung cancer detection and classification using LeNet-DenseNet. Biomed. Eng. Appl. Basis Commun. 2025, 37(01), 2450043. [Google Scholar] [CrossRef]
- Reddy, C.K.; Rangarajan, A.; Rangarajan, D.; Shuaib, M.; Jeribi, F.; Alam, S. A transfer learning approach: Early prediction of Alzheimer’s disease on US healthy aging dataset. Mathematics 2024, 12(14), 2204. [Google Scholar] [CrossRef]
- Khalil, I.; Mehmood, A.; Kim, H.; Kim, J. OCTNet: A modified multi-scale attention feature fusion network with InceptionV3 for retinal OCT image classification. Mathematics 2024, 12(19), 3003. [Google Scholar] [CrossRef]
- Cai, W.; Li, M.; Jin, G.; Liu, Q.; Lu, C. Comparison of residual network and other classical models for classification of interlayer distresses in pavement. Appl. Sci. 2024, 14(15), 6568. [Google Scholar] [CrossRef]
- Bunzel, N.; Göller, N.; Frick, R.A. Identifying and generating edge cases. In Proceedings of the 2nd ACM Workshop on Secure and Trustworthy Deep Learning Systems; 2024; pp. 16–23. [Google Scholar]
- Gudla, S.P.K.; Bhoi, S.K. A study on effect of learning rates using Adam optimizer in LSTM deep intelligent model for detection of DDoS attack to support fog-based IoT systems. In Proceedings of the International Conference on Computing, Communication and Learning; Springer Nature Switzerland: Cham, 2022; pp. 27–38. [Google Scholar]
- Reyad, M.; Sarhan, A.M.; Arafa, M. A modified Adam algorithm for deep neural network optimization. Neural Comput. Appl. 2023, 35(23), 17095–17112. [Google Scholar]
- Jiang, X.; Hu, Z.; Wang, S.; Zhang, Y. Deep learning for medical image-based cancer diagnosis. Cancers 2023, 15(14), 3608. [Google Scholar] [CrossRef] [PubMed]
- Zhang, H.; Liu, Y.; Chen, Q.; Fang, C. The optimality of (accelerated) SGD for high-dimensional quadratic optimization. arXiv preprint. arXiv:2409.09745, 2024.
- Fan, A.; Ma, J.; Jiang, X.; Ling, H. Efficient deterministic search with robust loss functions for geometric model fitting. IEEE Trans. Pattern Anal. Mach. Intell. 2021, 44(11), 8212–8229. [Google Scholar] [CrossRef] [PubMed]
- Feng, L.; Shu, S.; Lin, Z.; Lv, F.; Li, L.; An, B. Can cross entropy loss be robust to label noise? In Proceedings of the Twenty-Ninth International Conference on International Joint Conferences on Artificial Intelligence; 2021; pp. 2206–2212. [Google Scholar]
- Berghout, T. The neural frontier of future medical imaging: A review of deep learning for brain tumor detection. J. Imaging 2024, 11(1), 2. [Google Scholar] [CrossRef] [PubMed]
- Naidu, G.; Zuva, T.; Sibanda, E.M. A review of evaluation metrics in machine learning algorithms. In Proceedings of the Computer Science On-line Conference; Springer International Publishing: Cham, 2023; pp. 15–25. [Google Scholar]
Figure 1.
Block diagram of the proposed methodology.
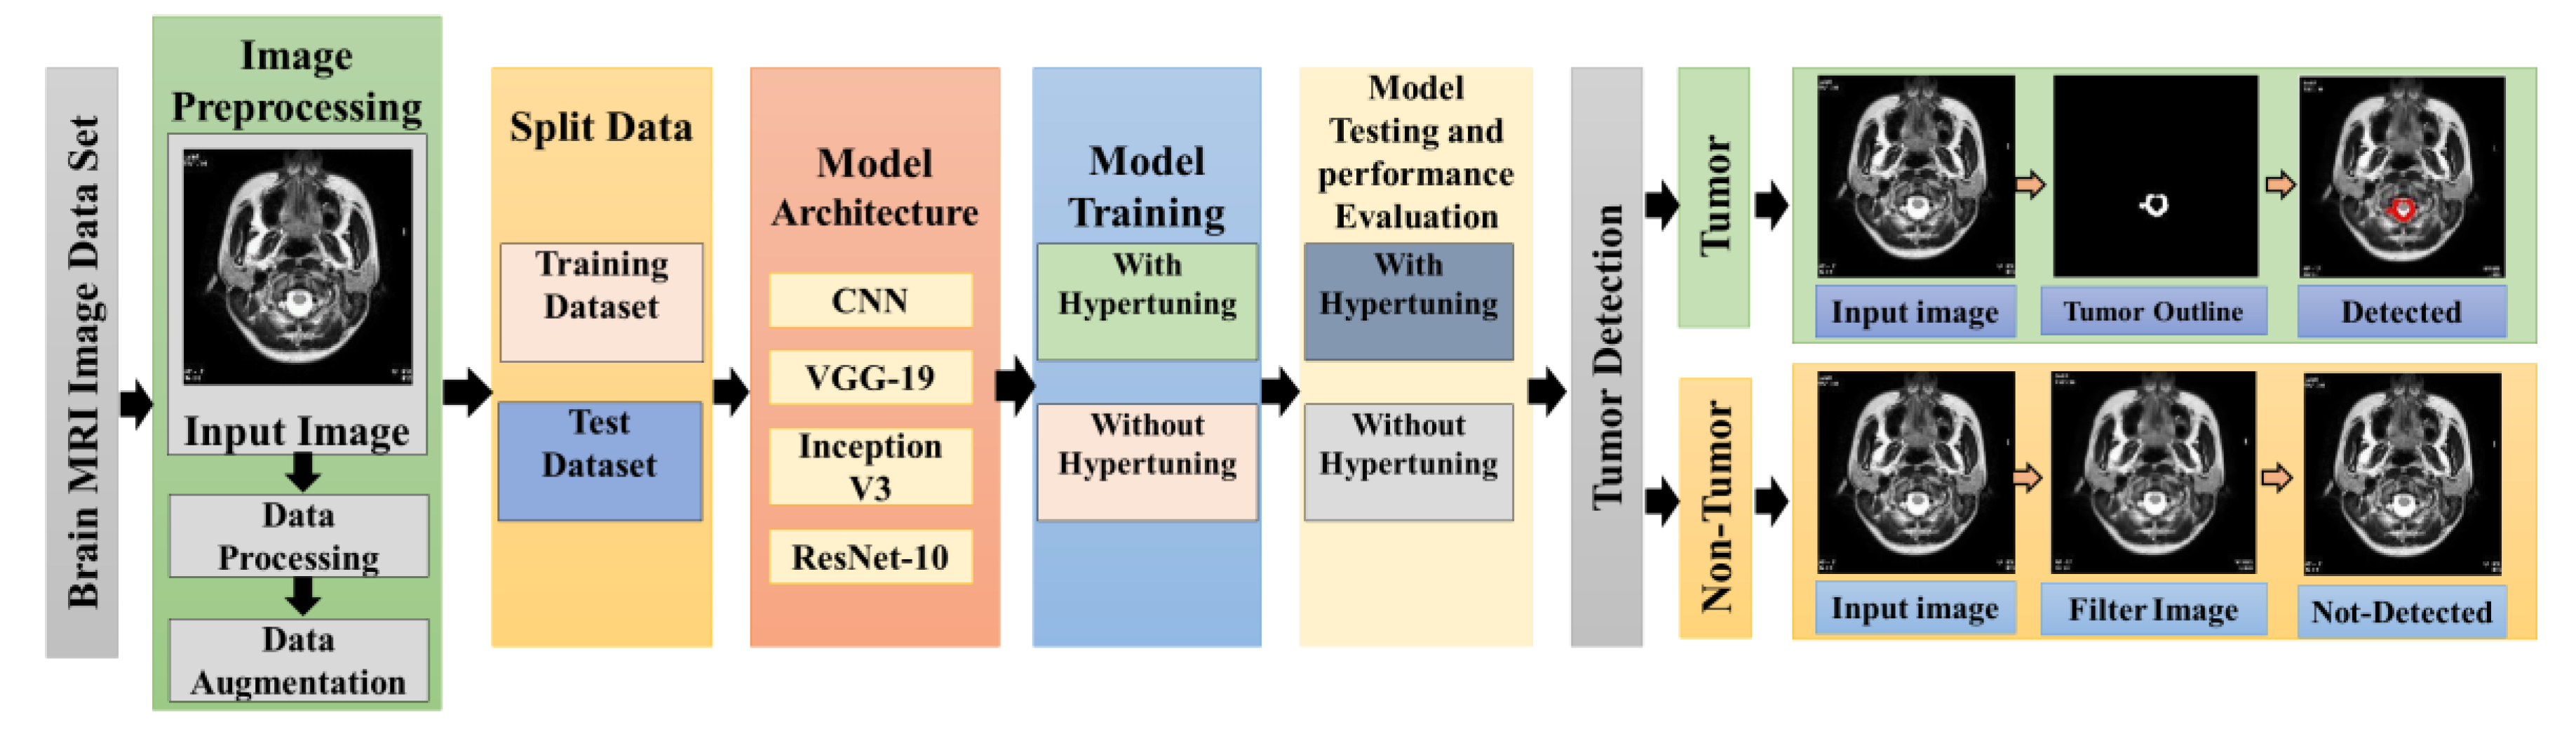
Figure 2.
Comparison of Training Accuracy and Validation Accuracy at different Epoch.
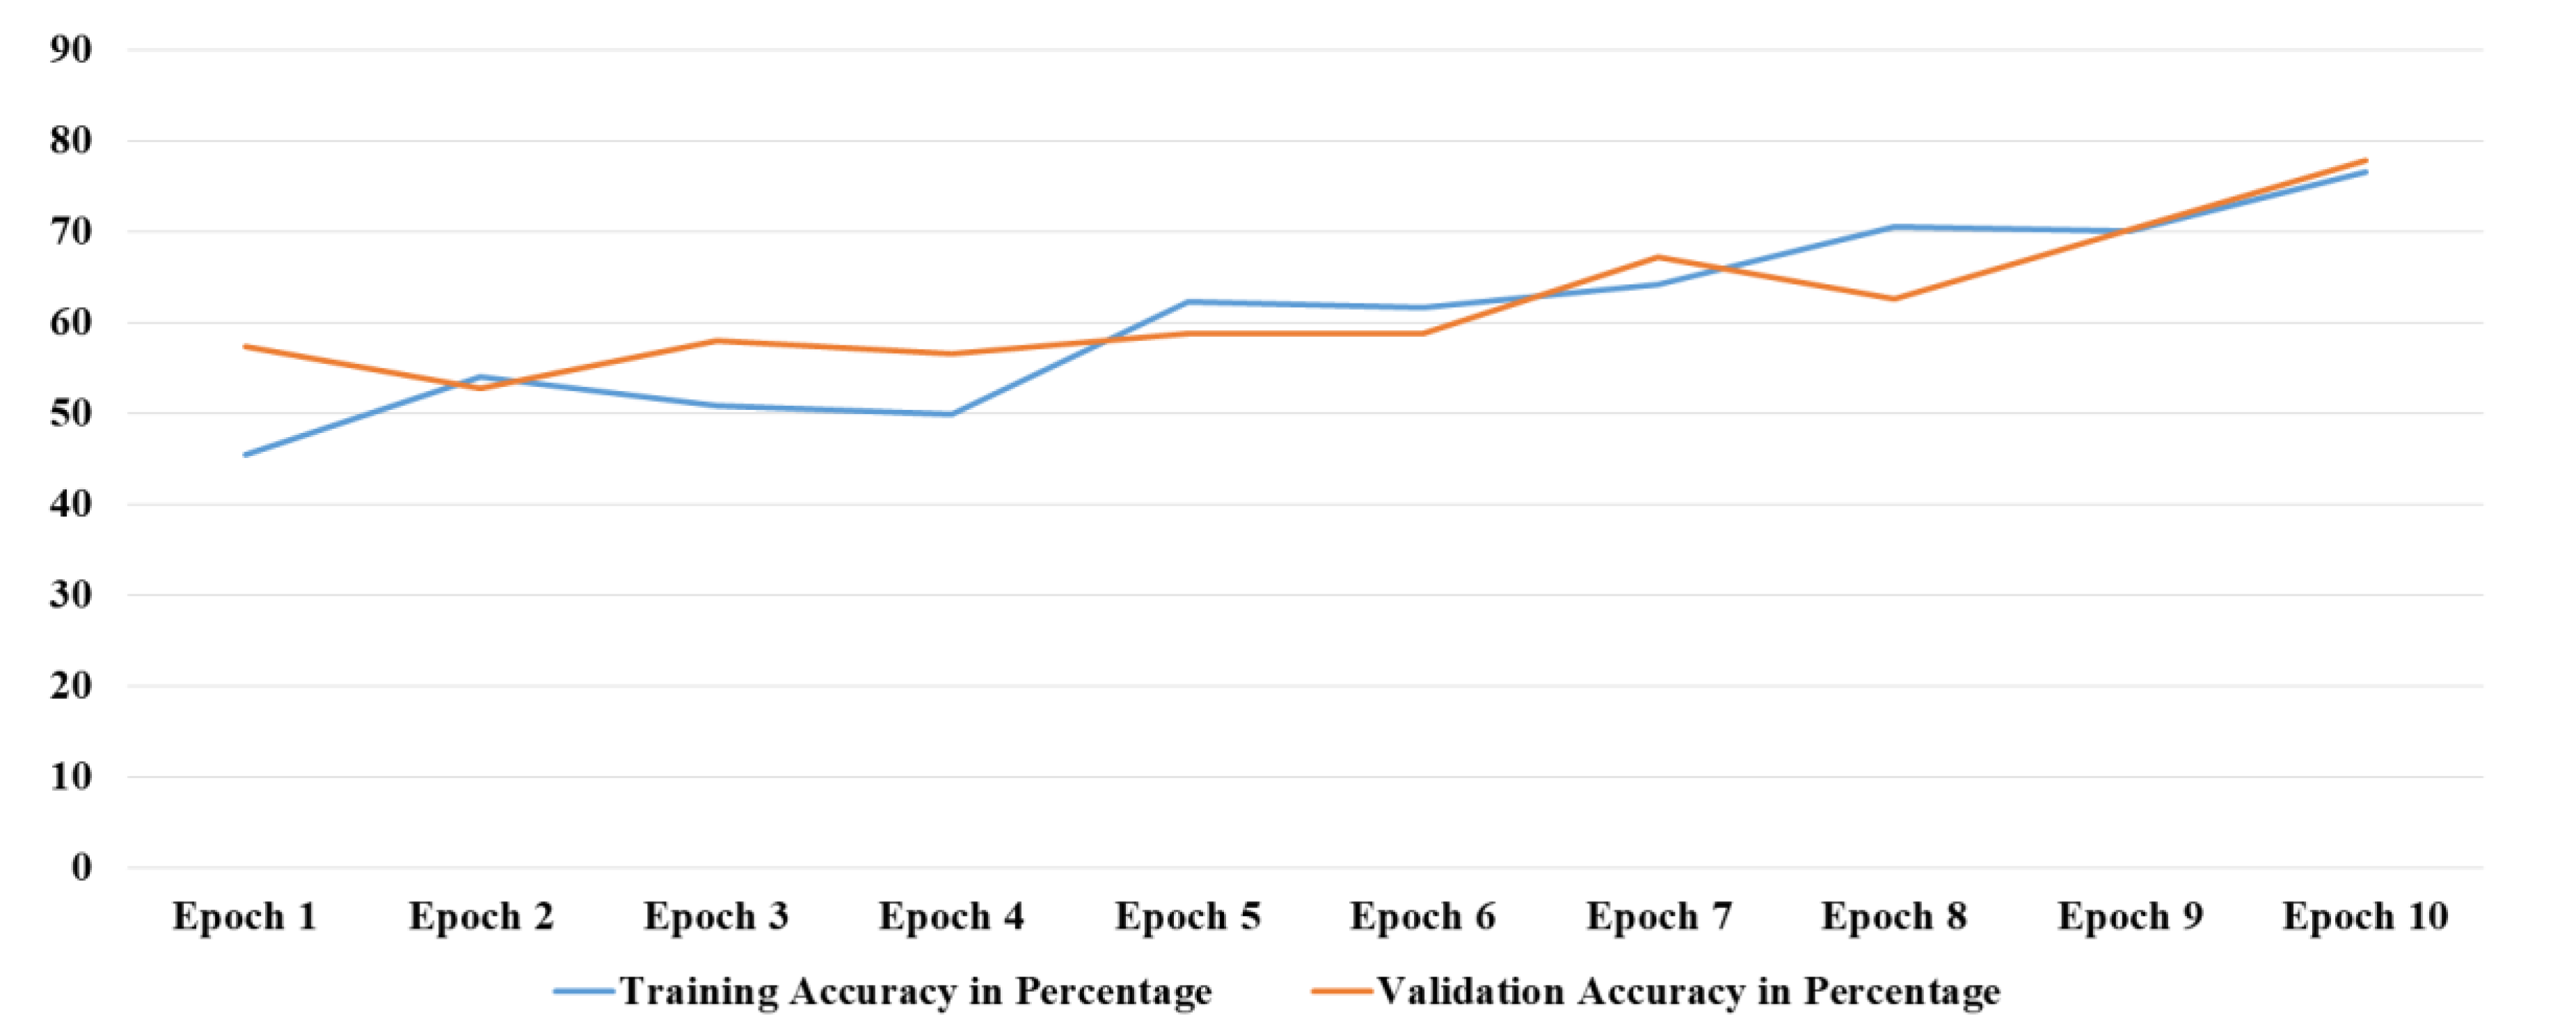
Figure 3.
Comparison of Comparison of Model Performance.
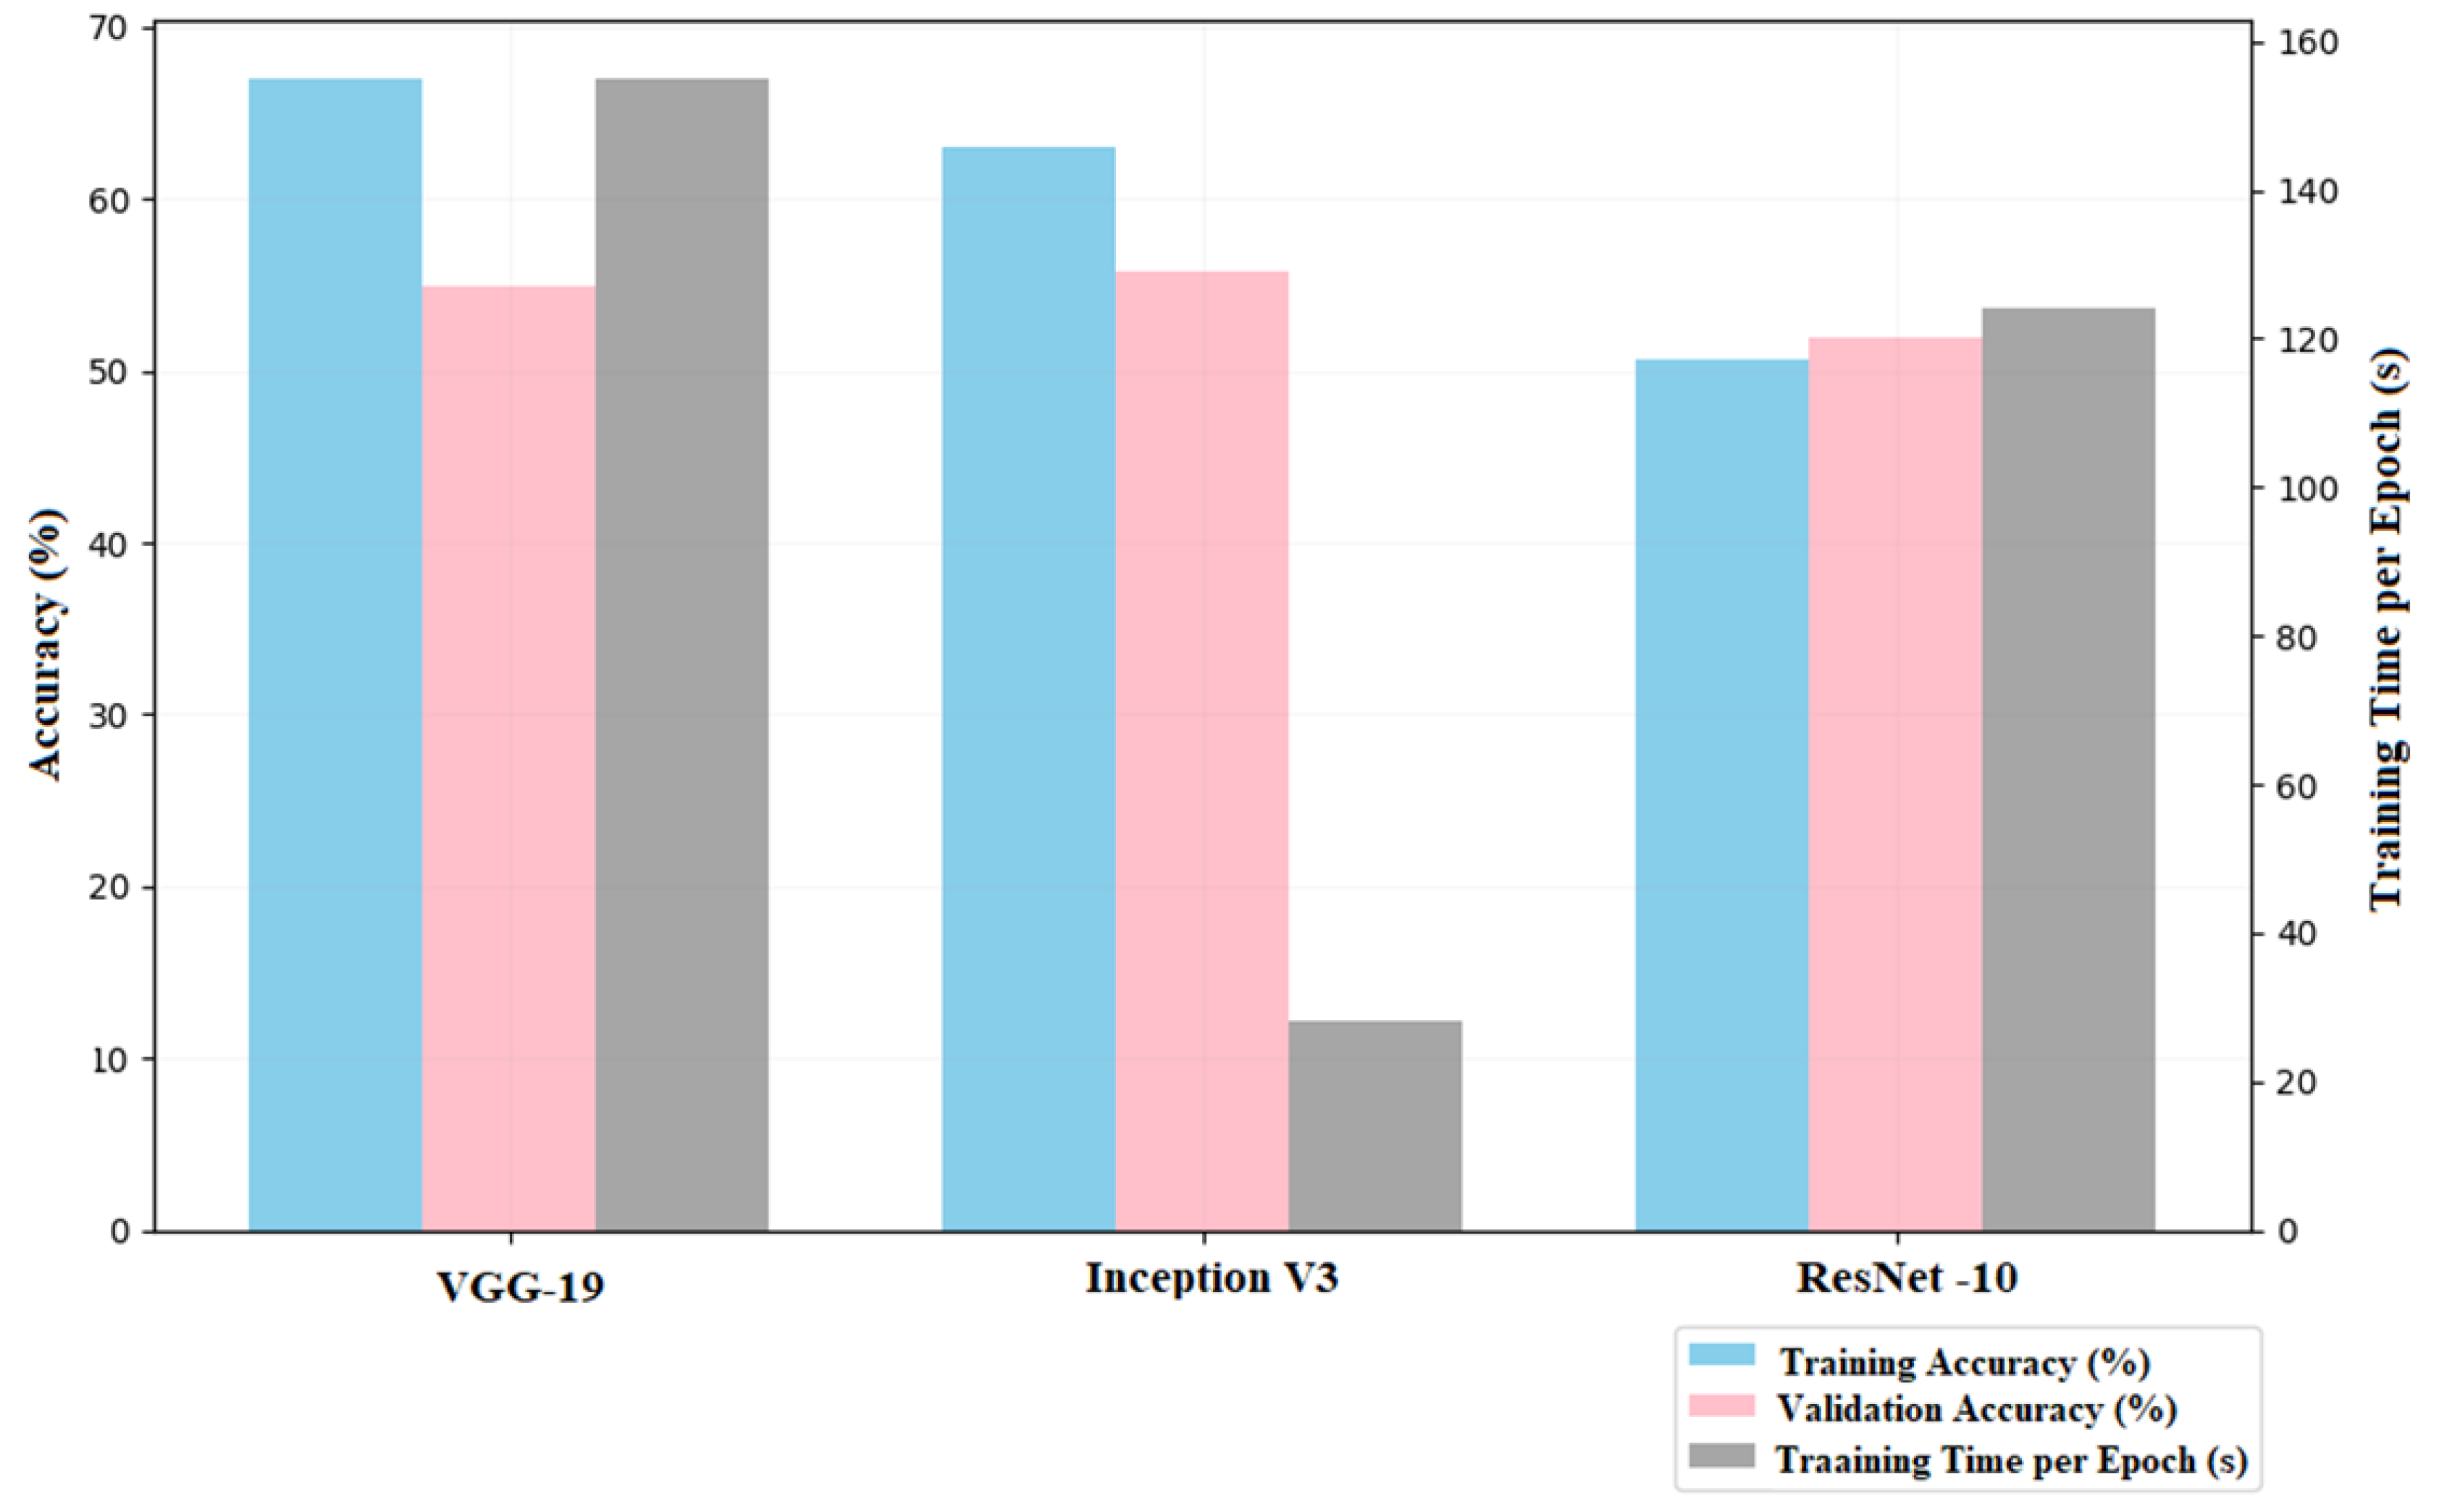
Figure 4.
Validation Accuracy Before and After Tuning.
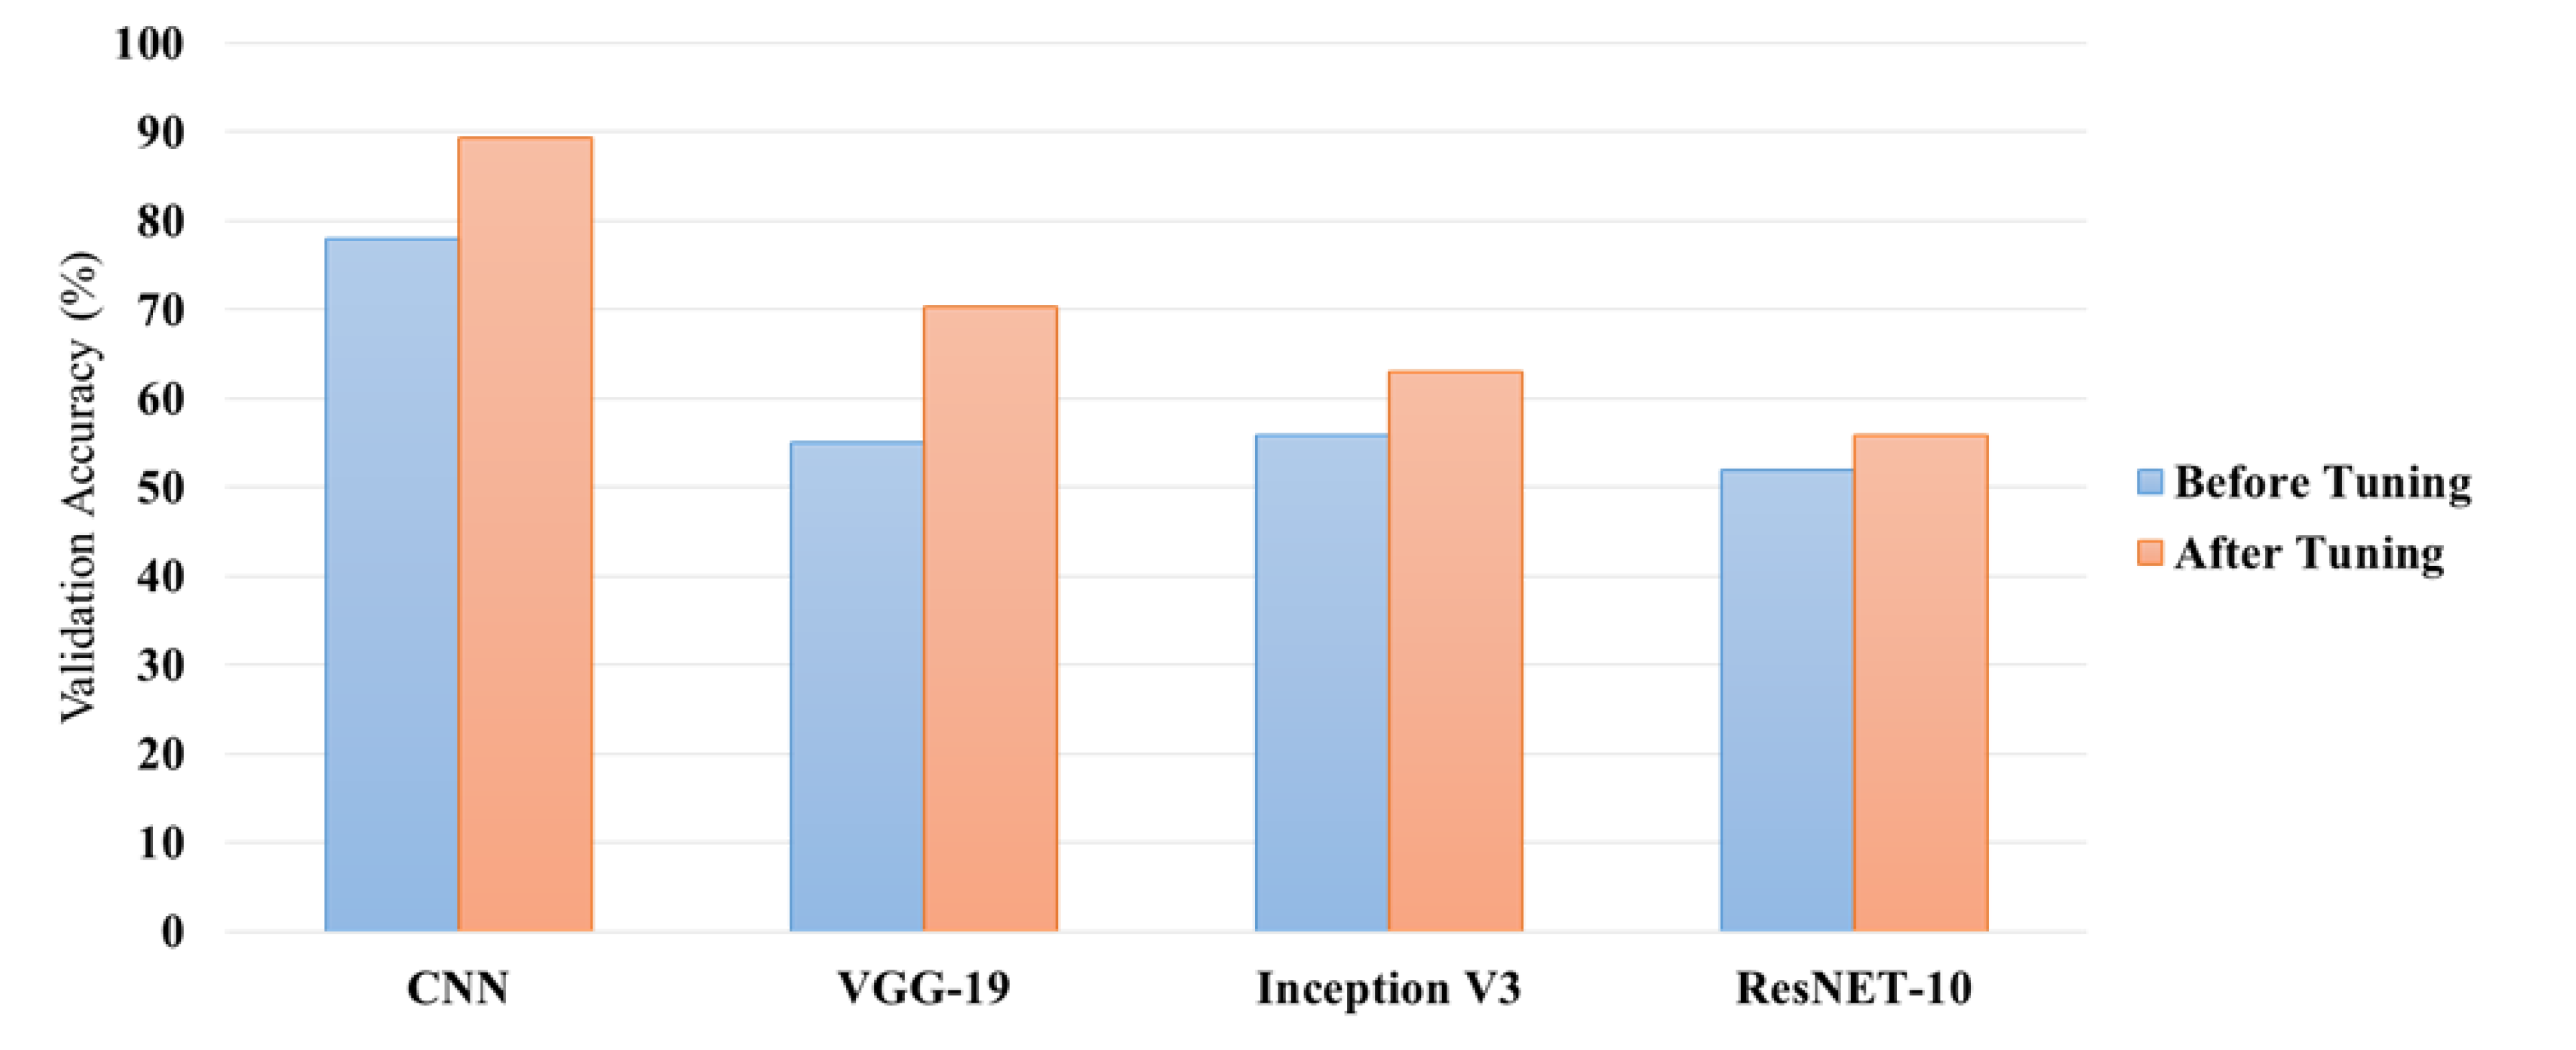
Figure 5.
Execution Time per Epoch for Each Model (Post-Tuning).
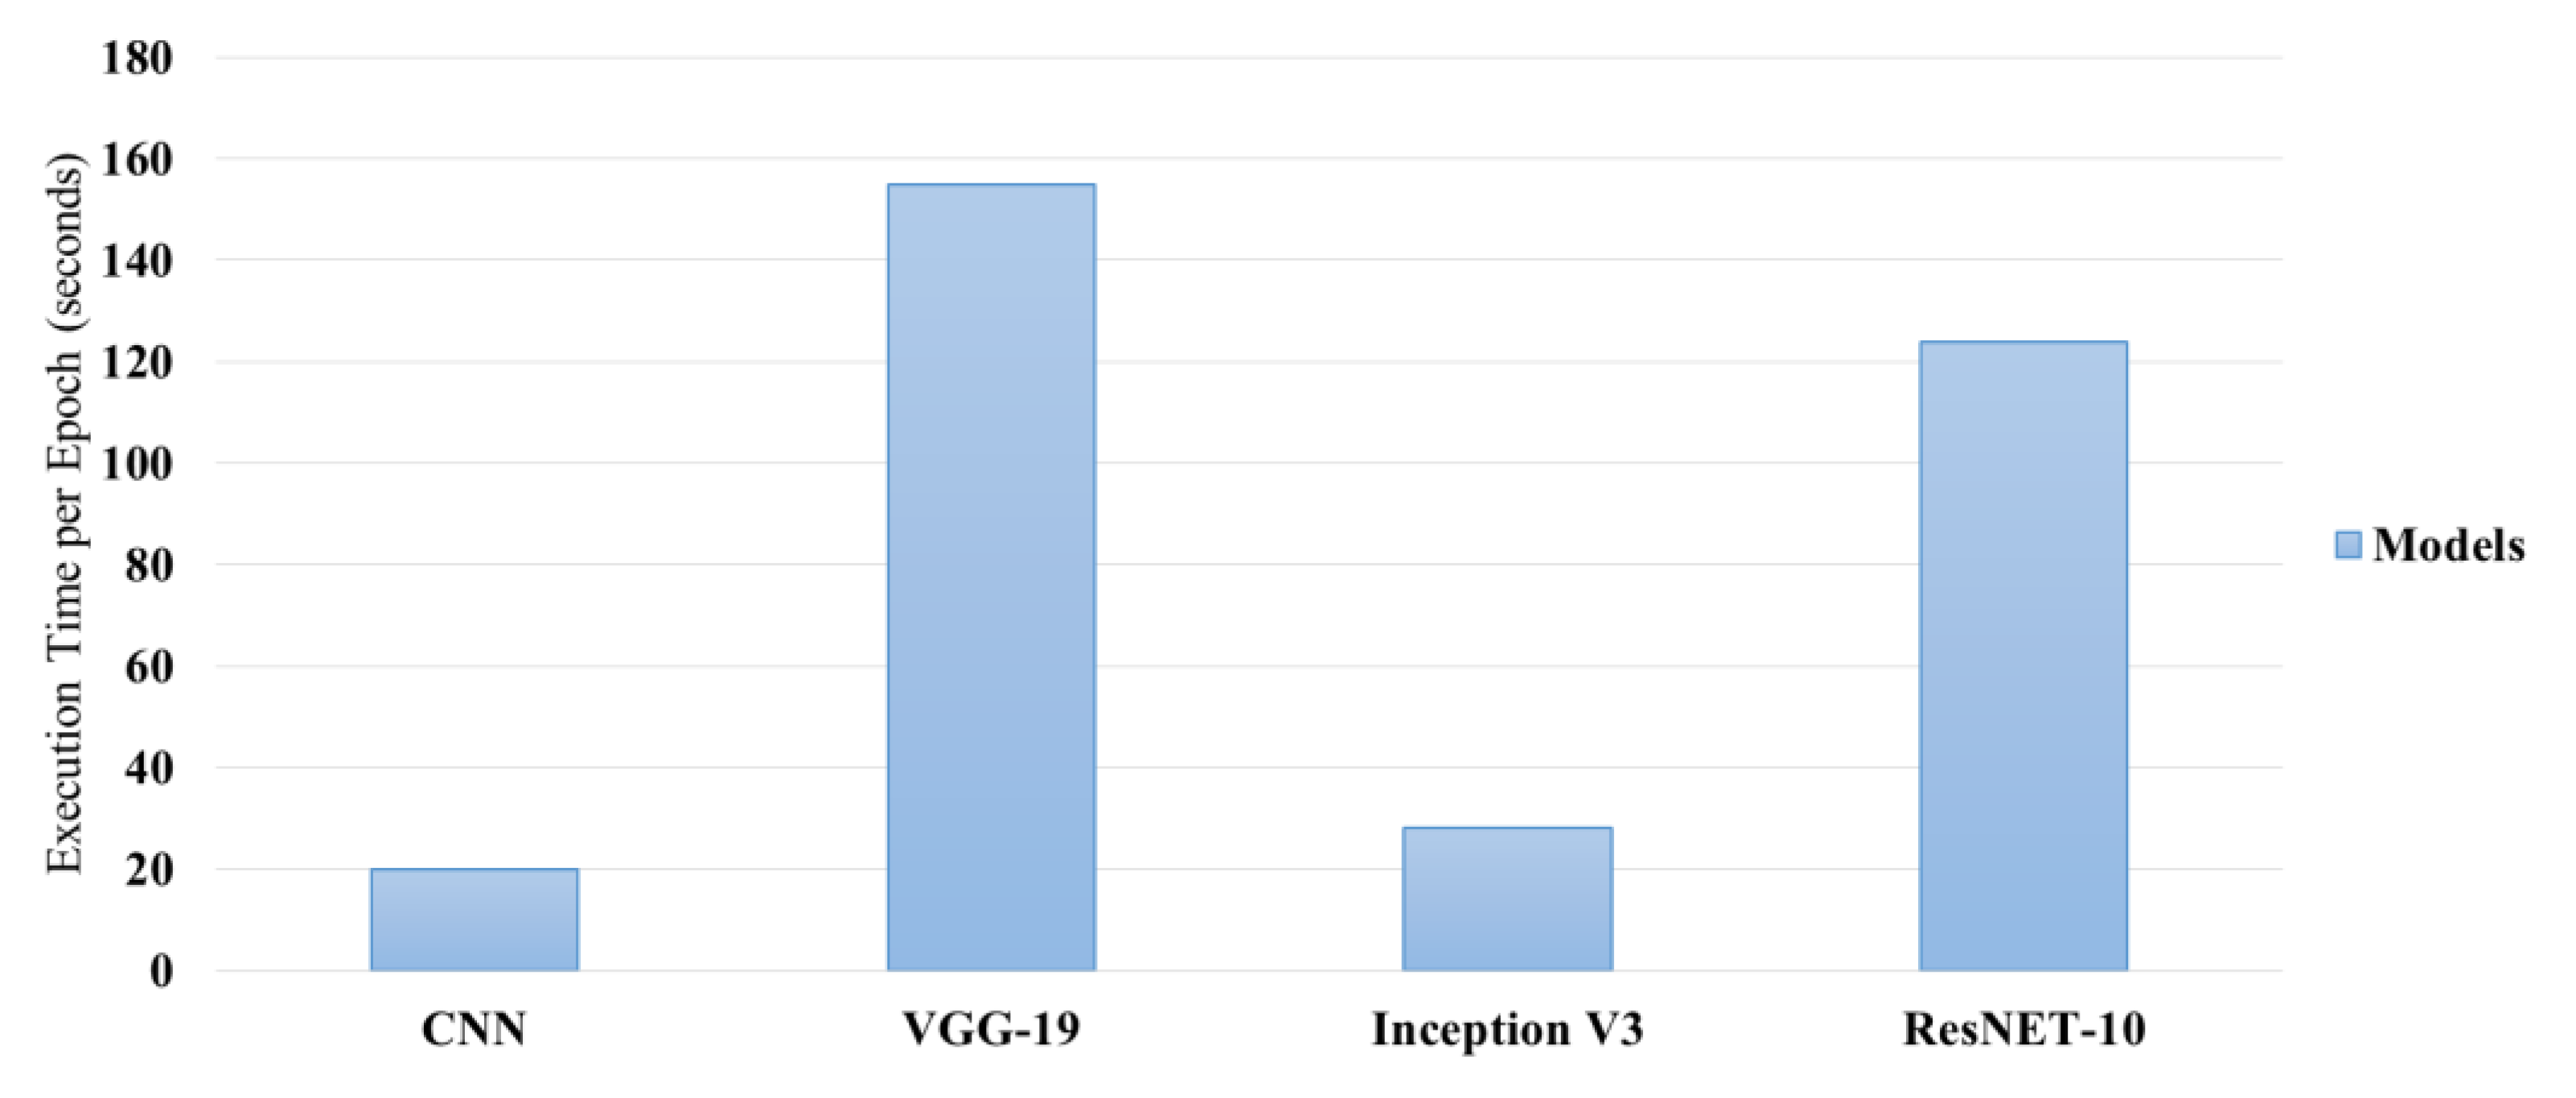
Figure 6.
Training Time vs Validation Accuracy (Post-Tuning).
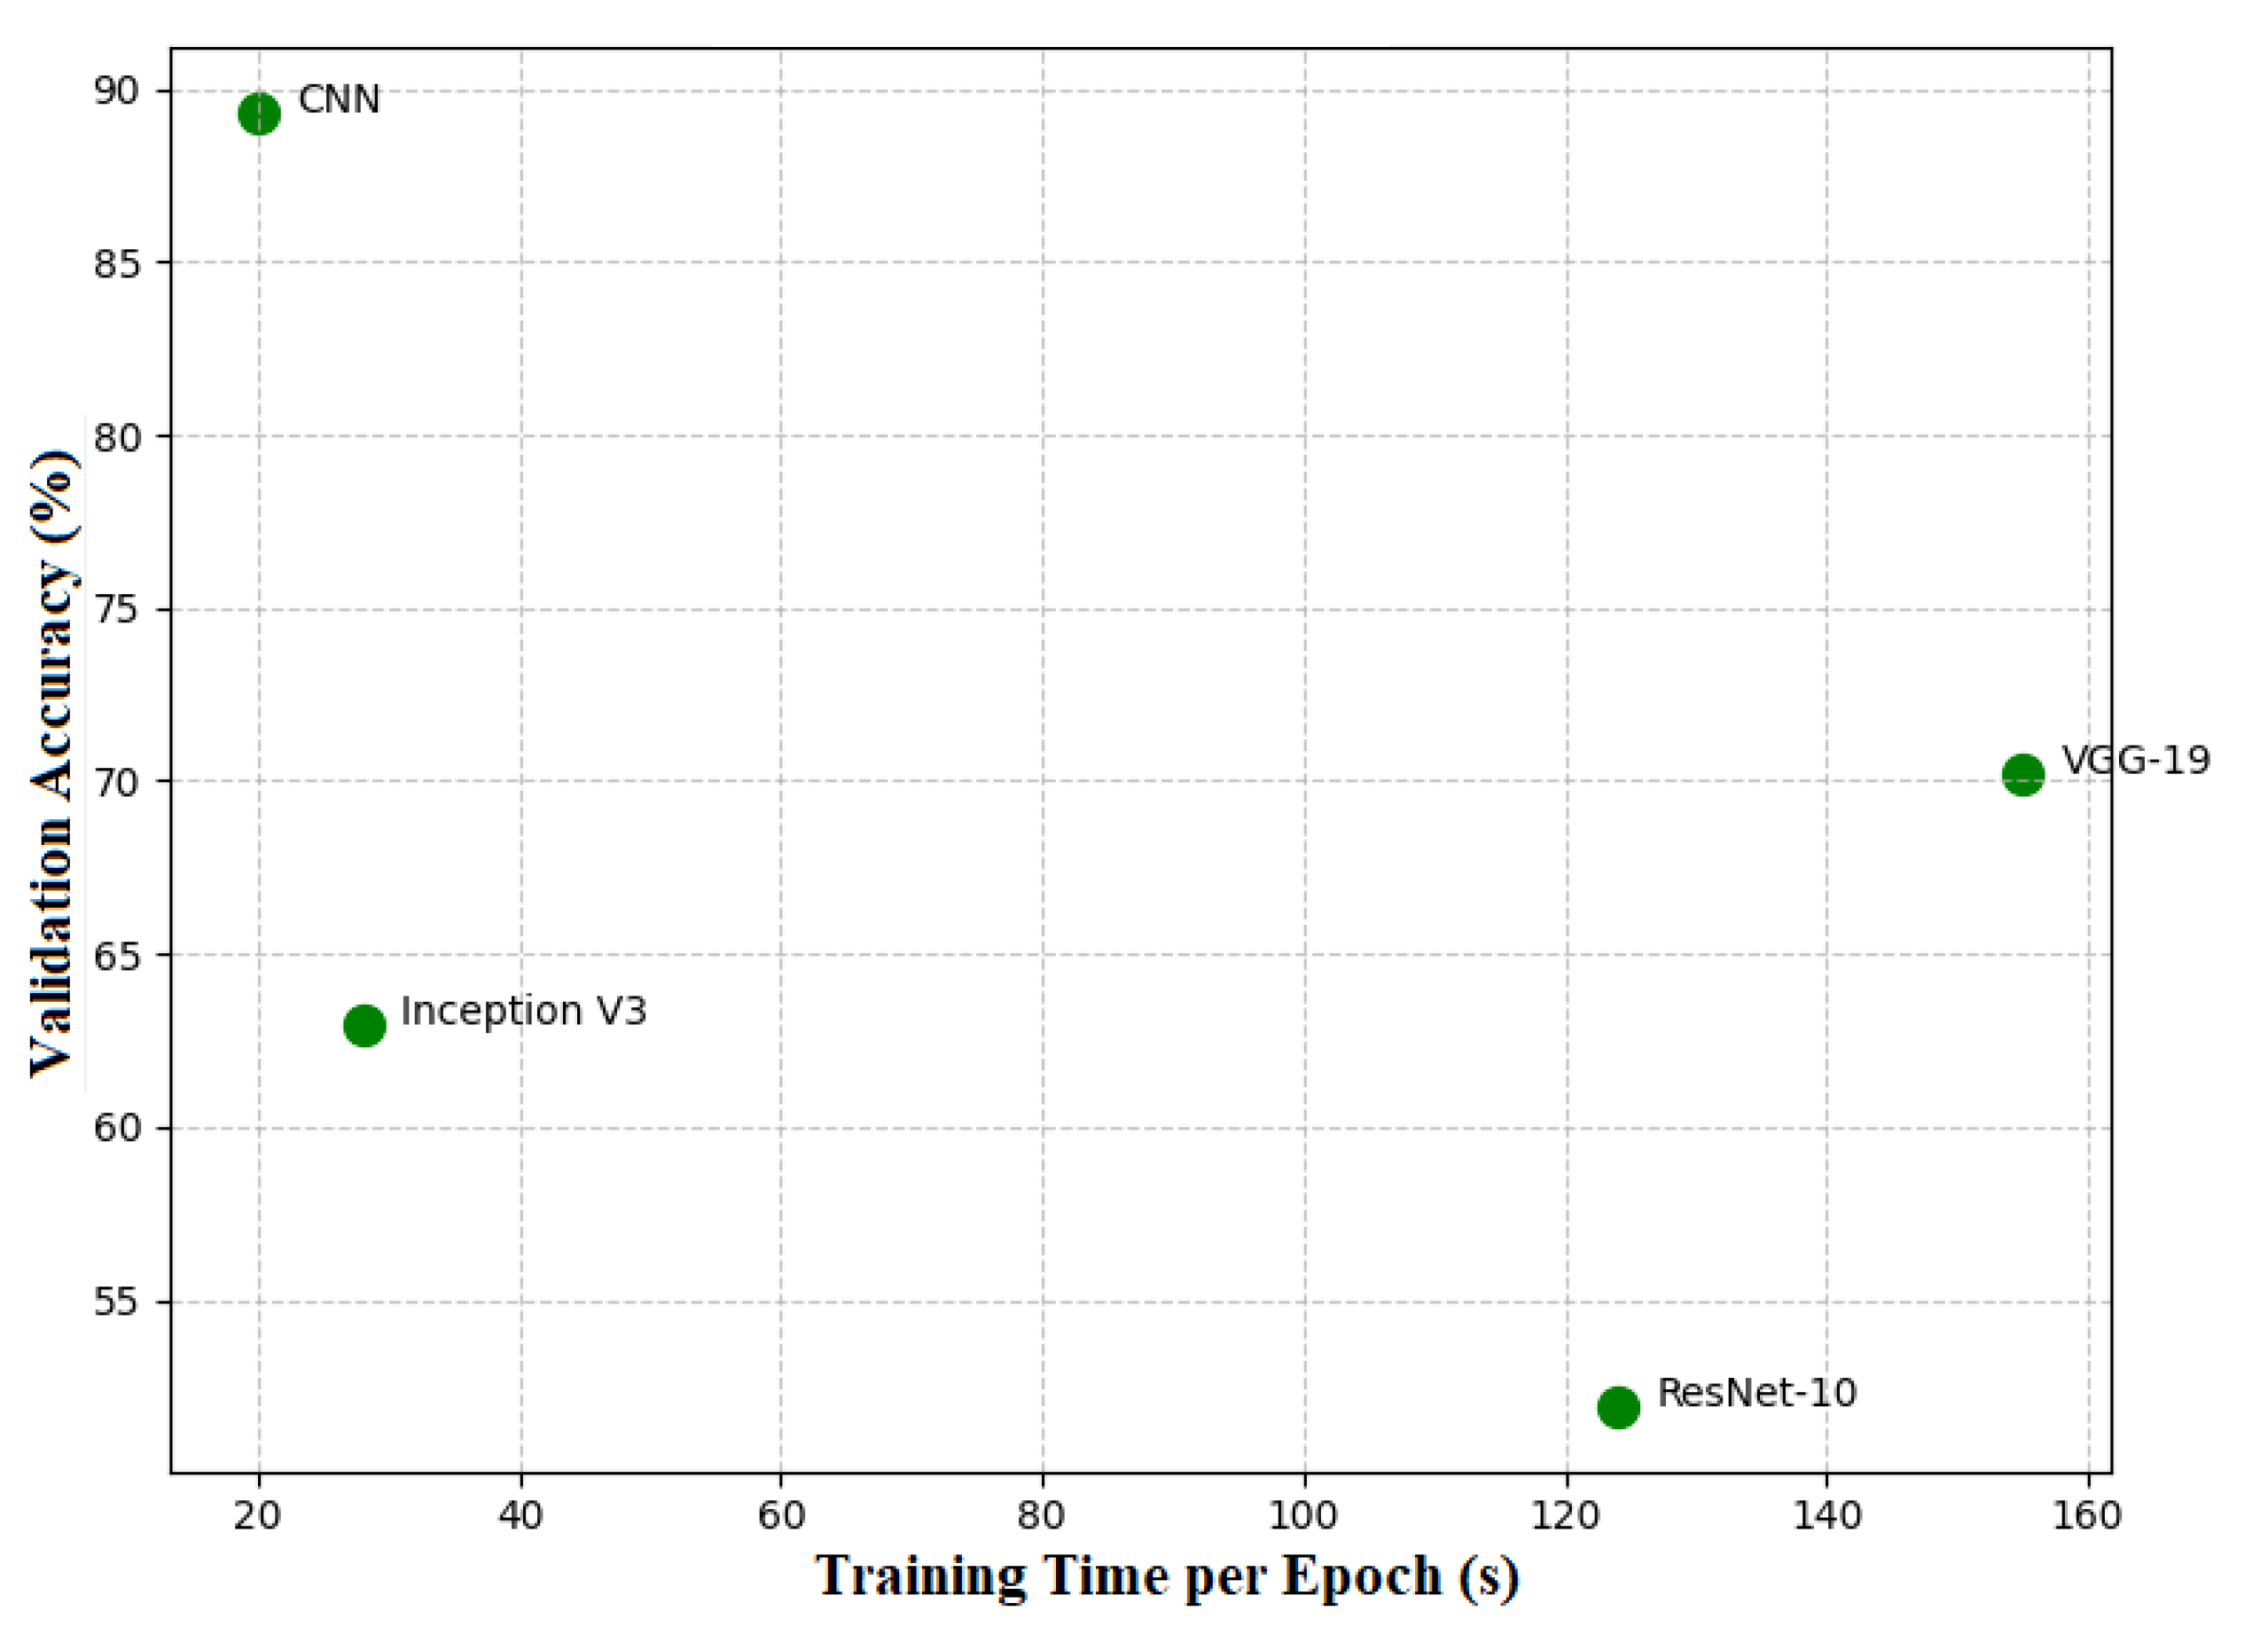
Figure 7.
Performance Metrics for Brain Tumor Detection Model.
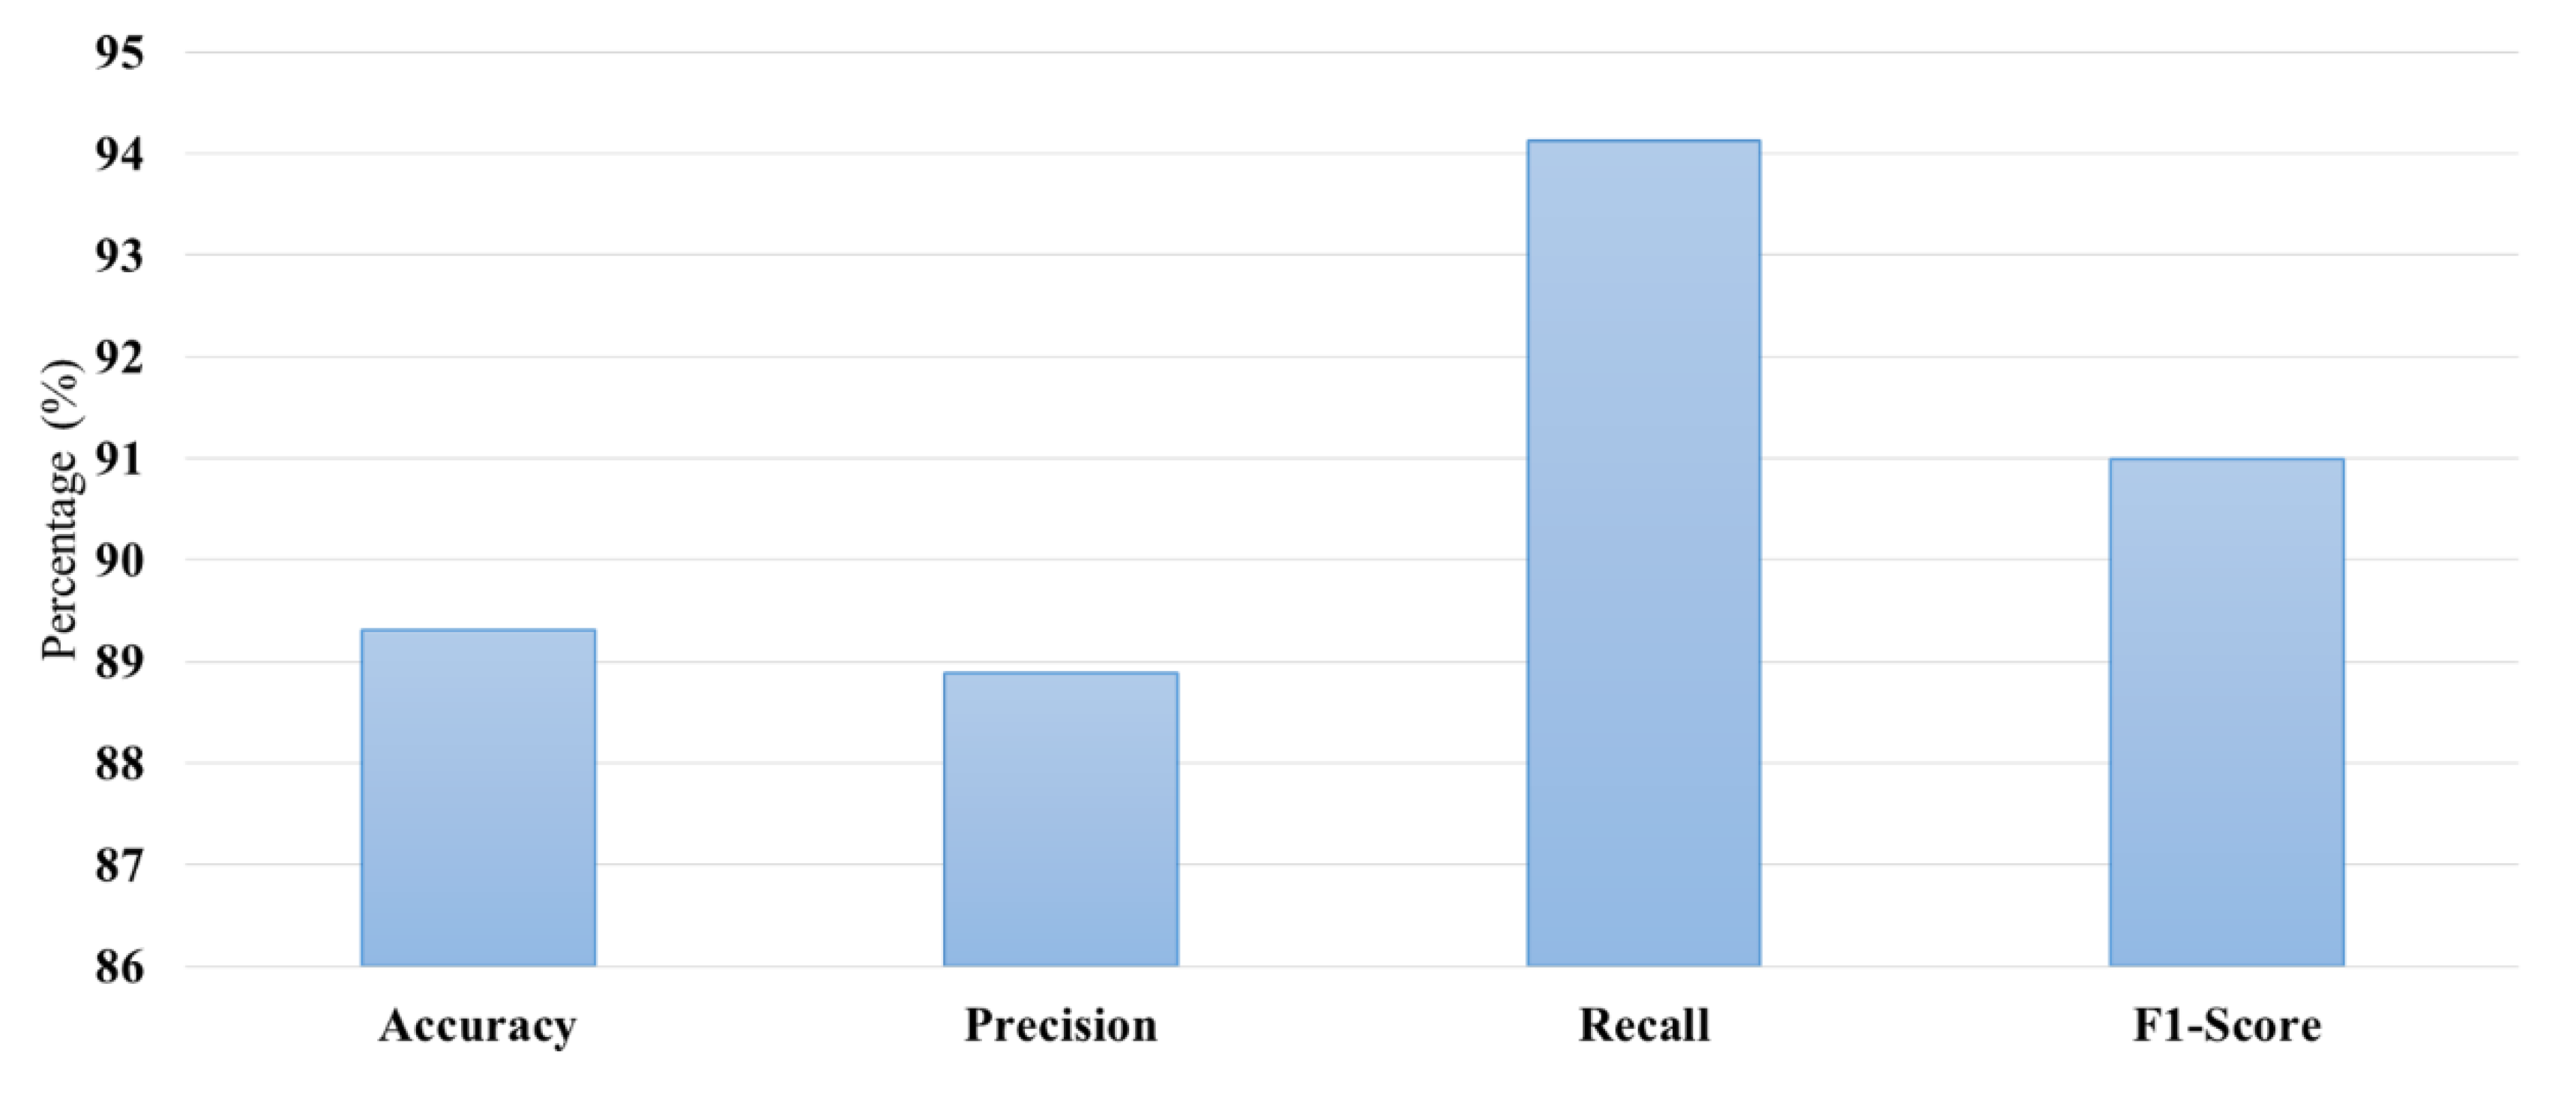
Figure 8.
Illustrated input image, filtered image, and bounding box of tumor image.

Figure 9.
Illustrated only tumor, outline tumor, and Detected tumor.
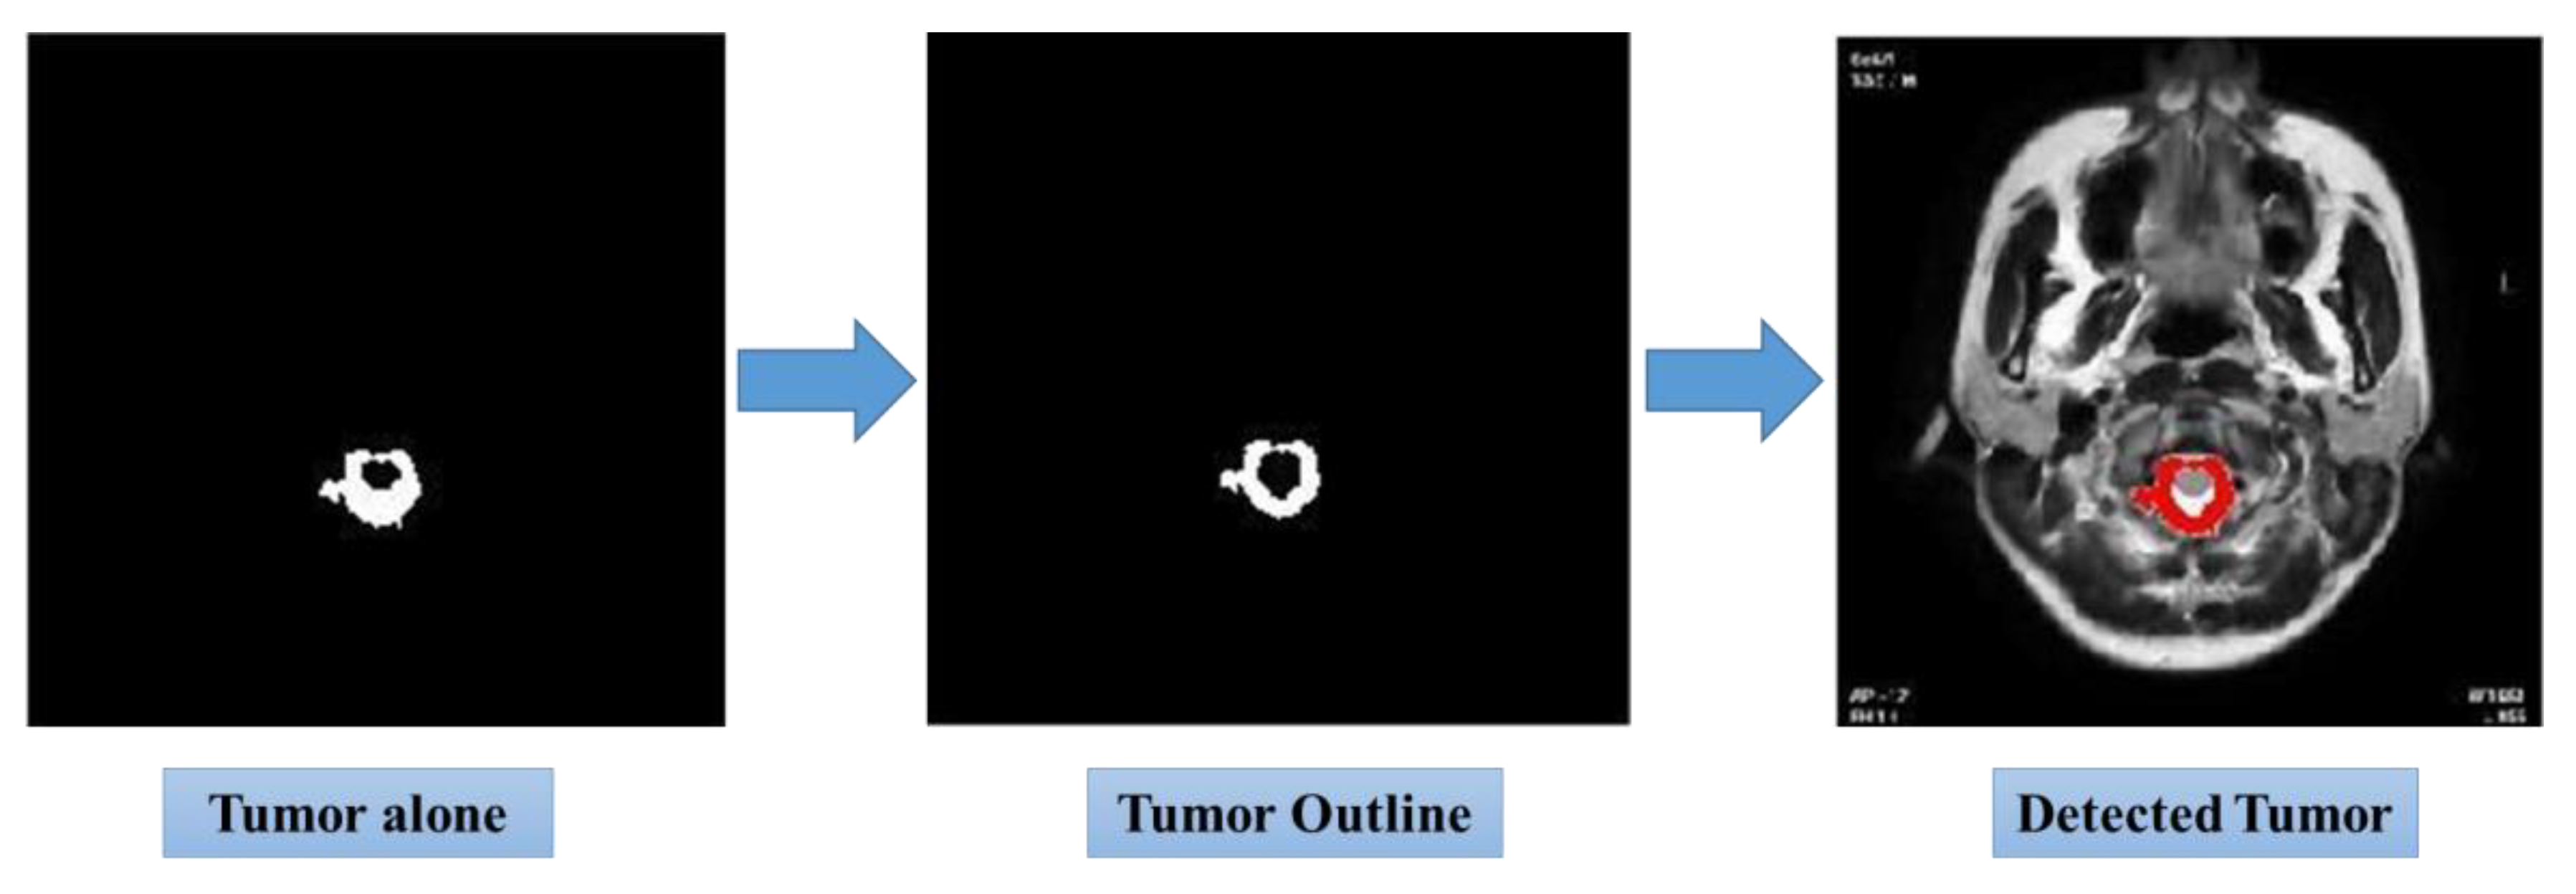

Table 1.
Performance comparison of deep learning models on the tumor dataset without parameter tuning.
Table 1.
Performance comparison of deep learning models on the tumor dataset without parameter tuning.
| Model | Best Learning Rate | Best Optimizer | Best Loss Function | Best Test Accuracy (%) |
|---|---|---|---|---|
| CNN (10 Layers) | 0.001 | Adam | Binary Cross Entropy |
88.55 |
| VGG19 (10 Layers) |
0.001 | Adam | Binary Cross Entropy |
70.22 |
| InceptionV3 (10 Layers) | 0.01 | Adam | Binary Cross Entropy |
55.72 |
| ResNet-10 (10 Layers) |
Not Tuned | Not Tuned | Not Tuned (Excluded) | 51.91 |
Table 2.
Performance comparison of deep learning models after parameter tuning.
| Model | Final Training Accuracy (%) | Final Validation Accuracy (%) | Learning Rate | Optimizer | Runtime |
|---|---|---|---|---|---|
| CNN (10 Layers) |
76.58 | 77.86 | 0.1 | Adam | 3m 26s |
| VGG19 (10 Layers) |
66.99 | 51.91 | 0.01 | Adam | 26m 13s |
| InceptionV3 (10 Layers) | 62.96 | 55.72 | 0.01 | Adam | 3m 55s |
| ResNet-10 (10 Layers) |
50.67 | 51.91 | 0.01 | Adam | 18m 43s |
Disclaimer/Publisher’s Note: The statements, opinions and data contained in all publications are solely those of the individual author(s) and contributor(s) and not of MDPI and/or the editor(s). MDPI and/or the editor(s) disclaim responsibility for any injury to people or property resulting from any ideas, methods, instructions or products referred to in the content. |
© 2025 by the authors. Licensee MDPI, Basel, Switzerland. This article is an open access article distributed under the terms and conditions of the Creative Commons Attribution (CC BY) license (http://creativecommons.org/licenses/by/4.0/).
Copyright: This open access article is published under a Creative Commons CC BY 4.0 license, which permit the free download, distribution, and reuse, provided that the author and preprint are cited in any reuse.


