Submitted:
18 December 2025
Posted:
19 December 2025
You are already at the latest version
Abstract
A nanobioarray (NBA) chip has been developed with the goal of having a high throughput system that analyze proteins of low sample volumes against multiple probes in a short time. A combination of horizontal and vertical channels are produced to create an antigen array on the surface of the NBA chip in one dimension that is probed by flowing protein samples (e.g. antibodies) from biological fluids in the orthogonal dimension. To improve sensitivity, we have tested the NBA chip by immobilizing streptavidin and then biotinylated peptide to detect the presence of a mouse monoclonal antibody (MAb) that is specific for the peptide. Bound antibody is detected by an AlexaFluor 647 labeled goat (anti-mouse IgG) polyclonal antibody. Using this NBA chip, we have successfully detected antibodies in samples in 500 nL containing 50 pM of MAb (or 25 attomoles), and this demonstrates a detection limit below that of a comparable ELISA, utilizing a shorter reaction time. Such a system is intended for assays of protein mixtures in biofluids, even for proteomic studies.
Keywords:
protein bioarray
; influenza A hemagglutinin
; fluorescent immunoassay
; mouse ascites fluid
; enzyme-linked immunosorbent assay (ELISA)
1. Introduction
Analysis of the biomolecules secreted by cells (the secretome) is important for biological research and clinical applications [1,2]. Immunoassays, such as the enzyme-linked immunosorbent assay (ELISA), have been used for analysis of biomolecules secreted by cells, are amenable to this emerging type of assays. However, such assays involve a time-consuming incubation process of 6 hours or more, and sample volumes of 30 μL or more [3]. This limitation on time and sample volume motivated the push for micro- and nanofluidics applications for analysis of secretomes or proteomes [4,5,6,7]. Nanolitre-based fluidic techniques provide a large diffusive interface that is ideal for surface antibody-antigen interactions, and for a low-volume process. To add on to these, the concept of the intersection approach first introduced by Bernard et al. in 2001 can help analyze large sample numbers [8]. This method has been previously used in our group for nucleic acid analysis [9,10], and is now used for protein arrays to assay multiple samples, with each being reacted against multiple probes. This method allows the intersection of each sample line with a row of printed probe lines (Figure 1). In this approach, we lay the groundwork by using a 16x16 test platform, and even to a 96x96 test platform. This means that rather than 96 different tests in 96-well plate, we would have 256 or even 9,216 different tests, respectively.
The chips used in the intersection approach include a substrate upon which a microchip with horizontal channels is applied (Figure 2). Streptavidin followed by biotinylated peptide probe is then printed onto the surface for immobilization. Once completed, the horizontal chip is removed and a vertical chip is applied (Figure 2). The sample solution is then delivered along the vertical channels and at each of the intersections, the presence of a specific compound in the sample is reacted against the probes.
The liquid delivery method for this system uses pressure-driven flow to introduce reagents and remove wastes. While this liquid delivery method works well, centrifugal pumping applied on a circular chip is better because this allows the simultaneous delivery of reagents to a high density of channels, using a simple motor to spin the chip. However, the simple intersection approach is not as easy to apply to a circular chip system as it is to a linear channel system. In our hands, we have successfully combine the intersection approach and simultaneous centrifugal pumping in one system and apply it for nucleic acid analysis [11,12]. In this work, we extend the system for protein assays, i.e. we utilize a chip with radial channels (in place of the horizontal chip) to print peptides, and a chip with spiral channels to flow sample (replacing the vertical chip). By this approach, we have fabricated an 1152 test array system comprising a 48-radial channel chip and a 24-spiral channel chip (Figure 3).
As a proof of concept, we immobilized the peptide probes related to influenza hemagglutinin (HA) on to the glass surface by coupling primary amines groups on the N-terminal of the peptides to the aldehyde groups on the glass surface. This HA peptide probe will bind with the sample that is the anti-HA mouse antibody produced by the mouse 17/9 strain. Various optimization experiments were conducted to improve the detection limit down to 0.05 nM. We envision this fast, sensitive and high throughput method may benefit protein detection in biological applications, even for proteomic studies when the proteins are known.
2. Experimental
2.1. Material
For our tests we utilized 2” x 3” glass slides obtained from Fisher Scientific (Ottawa, ON). The silicon wafers were purchased from University Wafer (Boston, MA). Polydimethylsiloxane (PDMS) slabs were fabricated by utilizing the Sylgard 184 silicone elastomer kit; including both crosslinking silicone polymer and curing agent from Dow Corning (Midland, MI), as previously described [12]. NBA chips were formed by sealing PDMS slab to glass slides.
Cleaning solvents ethanol (EtOH) and isopropanol (IPA) were obtained from Commercial Alcohols (Chatham, ON). The peptides (HA, bioHA and biopVIII) were obtained from GL Biochem (Shanghai). The amino acid sequences of the peptide probes are shown in Figure 4. The HA peptide probe (12 amino-acid residue) was derived from influenza hemagglutinin (HA). Tween-20, Triton X-100, and bovine serum albumin (BSA) were obtained from Sigma (Mississauga, ON). Disodium hydrogen phosphate (Na2HPO4), monopotassium dihydrogen phosphate (KH2PO4), sodium chloride (NaCl), potassium chloride (KCl) and sodium borohydride (NaBH4) utilized in the phosphate buffer saline (PBS) and the reducing solution were obtained from Caledon Labs (Georgetown, ON). The blocking reagent (Blotto) was obtained from BioRad (Mississauga, ON). The (3-aminopropyl)triethoxysilane (APTES) was obtained from MP Biomedicals (Solon, OH). Concentrated sulfuric acid, 30% hydrogen peroxide, and 25% glutaraldehyde was obtained from Caledon Labs (Georgetown, ON). Purified water (18 MΩ∙cm) was obtained from a Waters Millipore filter system (Darmstadt, German). Repel Silane ES was obtained from GE Healthcare Life Sciences (Quebec, CA).
For fluorescent detection, streptavidin-Cy5 was obtained from Invitrogen (Burlington, ON) to detect the presence of biotin. The AF647-labeled detection antibody was obtained from Invitrogen. The fluorescent beads, which were streptavidin-coated polystyrene microspheres (mean diameter of 0.97μm) embedded with a dye called Flash Red were obtained from Bangs Laboratories Inc. (Fishers, IN). The anti-pVIII sera were obtained from the mouse (Mus musculus strain: BALB/c), from Charles River Supplier (Strain code 028).
2.2. Instrumentation
The rotating platform used to spin the circular chips was in-house built, and it has been previously described [11]. The spin speed was confirmed by measurement by a stroboscope [13]. The instrument utilized for the detection of our samples was a flat-bed fluorescent scanner (Typhoon FLA 9000 biomolecular imager, GE Healthcare Life Sciences, Quebec), as reported elsewhere [19,20].
2.3. Glass Slide Modification
The modification of the glass slide to produce the aldehyde-functionalized surface has been previously described [13]. Briefly, the glass slide was cleaned with Liqui-Nox solution followed by washing steps using distilled water, ethanol, and 18MΩ cm-1 deionized water and then dried using nitrogen gas. Then, the substrate was heated in a piranha solution (70% H2SO4:30%H2O2) at 80-90 °C for
15 minutes to create various silanol groups on the surface. The glass plate was then rinsed with deionized water and dried using nitrogen gas. The amine-functionalization of the glass surface was done by placing the substrate in a 2% APTES solution under a nitrogen stream. After the glass slide was removed from the solution and rinsed with 95% ethanol (EtOH), it was then dried with nitrogen gas and placed in an oven at 120 °C for one hour. Subsequently, the glass slide was aldehyde-functionalized by placing it into a 5% glutaraldehyde solution (10mL of 50% glutaraldehyde solution, 90mL of 10X phosphate buffer saline solution) for an hour at -18°C and then rinsed with 18 MΩ∙cm water. Following this, the glass slide was dried with nitrogen gas and stored in a container.
2.4. Protein Detection Based on Fluorescent Immunoassay
In order to determine whether the detection of antibodies would be compatible with the NBA chip platform or not, we immobilized the HA and the bioHA peptides on to the glass surface by coupling primary amine groups on the N-terminal of the peptides to the aldehyde groups on the glass slide surface. The detailed procedures for linear and spiral channel chips are discussed separately below.
2.4.1. Linear Channel Chip
For the linear channel chips, 0.5μL of the peptide was introduced into the PDMS channels and allowed to react within the channels for 15 minutes. Once this was completed, the probe solution was removed and the PDMS chip was removed. The glass slide was then submersed into a solution of sodium borohydride for a reduction reaction for a total of 15 minutes. After the reducing solution was removed, a 5% BSA solution in 1X PBS was applied for 15 minutes to block the surface uncoated with peptides. A wash using 0.1% Tween-20 (in 1X PBS) followed by 1X PBS was applied. The chip was then dried with a stream of nitrogen gas. A second PDMS chip was applied onto the surface with its channels perpendicular to the previous chip. Then, 0.5μL of the antibody solution was flowed into the channels over the probe lines. The solution was removed after 15 minutes and 1.5μL of a wash solution of 1X PBS containing 0.1% Tween-20 was applied into the channels followed by 1.5μL of 1X PBS solution.
2.4.2. Spiral Channel Chip
In the radial/spiral chip system, it consists of a radial channel chip and a spiral chip consecutively sealed to a common glass disk. First, 0.5μL of the peptide solution was applied into the radial PDMS channel chip sealed to a glass disk and spun at 700 rpm for 10 minutes using a rotating platform. The chip was held in place utilizing a magnet and the spinner speed was adjusted using a variable knob, and the speed was confirmed using a stroboscope. Once the solution delivery was completed, the radial chip was removed. The glass disk was then submersed into a reducing solution of sodium borohydride for 15 minutes. The reducing solution was removed and a 5% blocking solution in 1X PBS was applied for 15minutes to block the surface. A wash using 0.1% Tween-20 (in 1X PBS) followed by 1X PBS was applied. The chip was then dried with a stream of nitrogen gas. Second, a spiral PDMS chip was sealed with the glass disk, with the spiral channel perpendicular to the previously printed radial probe lines.
Then, 0.5μL of the antibody solution was flowed over the probes, by spinning the disc at 1250rpm followed immediately with 1.5μL of a wash solution of 1X PBS solution containing 0.1% Tween-20. The secondary antibody solution was introduced, and after 15 minutes 1.5μL of a wash solution of 1X PBS solution containing 0.1% Tween-20 was applied into the channels followed by 1.5μL of 1X PBS solution.
2.5. Fluorescence Measurements
The fluorescent dyes used in this study were AF-647 and Cy-5 (excitation wavelength=650nm, emission wavelength= 670nm). The sample concentrations were measured using the graphical data obtained from the fluorescence detector. In each case, multiple replicates were taken in order to determine an averaged value for one concentration. These values were then compared against the background of the entire channel as well as the chip at various areas, upon which a normalized value could be obtained for comparison.
3. Results and Discussion
3.1. Linear Channel Chip
3.1.1. Antibody Binding to HA Peptide Probe
HA peptide was used as the probe for binding with the mouse anti-HA antibody sample (MAb 17/9). This was revealed using an AlexaFluor 647-labelled anti-mouse detection antibody.
As shown in Figure 5, rectangular patches occurred at the intersections of vertical channels and horizontal peptide probe lines, indicating the binding between the antibody sample and the peptide molecules printed on the chip. The signal was greater when a higher amount of HA was used. Anti-HA MAb from 17/9 mouse weakly bind to bioHA, and this can be attributed to the steric effect of the biotin molecule close to the binding region of the peptide as depicted in Figure 4. This detection was conducted after confirming the successful immobilization of the peptide probes (data not shown).
3.1.2. Reduction of Non-Specific Binding
An issue observed in this experiment was that there were some streakings along the length of the vertical channels. We believe this issue was caused by non-specific binding of AlexaFluor 647-labelled detection antibody on the region not previously immobilized with the peptide probes. It was because streaking also occurred in the control channel using only PBS but not anti-HA. Therefore, the improvement of the blocking step in between the probe immobilization and target binding steps was necessary. Since the milk powder (Blotto) contained various milk proteins including caesin, a more effective blocking solution was obtained. Therefore, the Blotto solution, instead of BSA, was used in the blocking step and the results were improved as shown in Figure 6.
In the experiment shown in Figure 6, we also found that binding by MAb 17/9 is specific to the bioHA peptide, with no binding detected to the biotinylated pVIII peptide, which served as a negative control. To reduce non-specific binding during long antibody incubation time, a non-ionic surfactant was added to the antibody sample solutions to assist in its solubilization of the antibody. Moreover, the surfactant molecules create a protective layer on the surface so that the non-specific binding is reduced [14]. We tested 2 surfactants, Tween-20 and Triton X-100. As shown in Figure 7, Tween-20 had resulted in less streaking than Triton X-100 when added to the antibody samples.
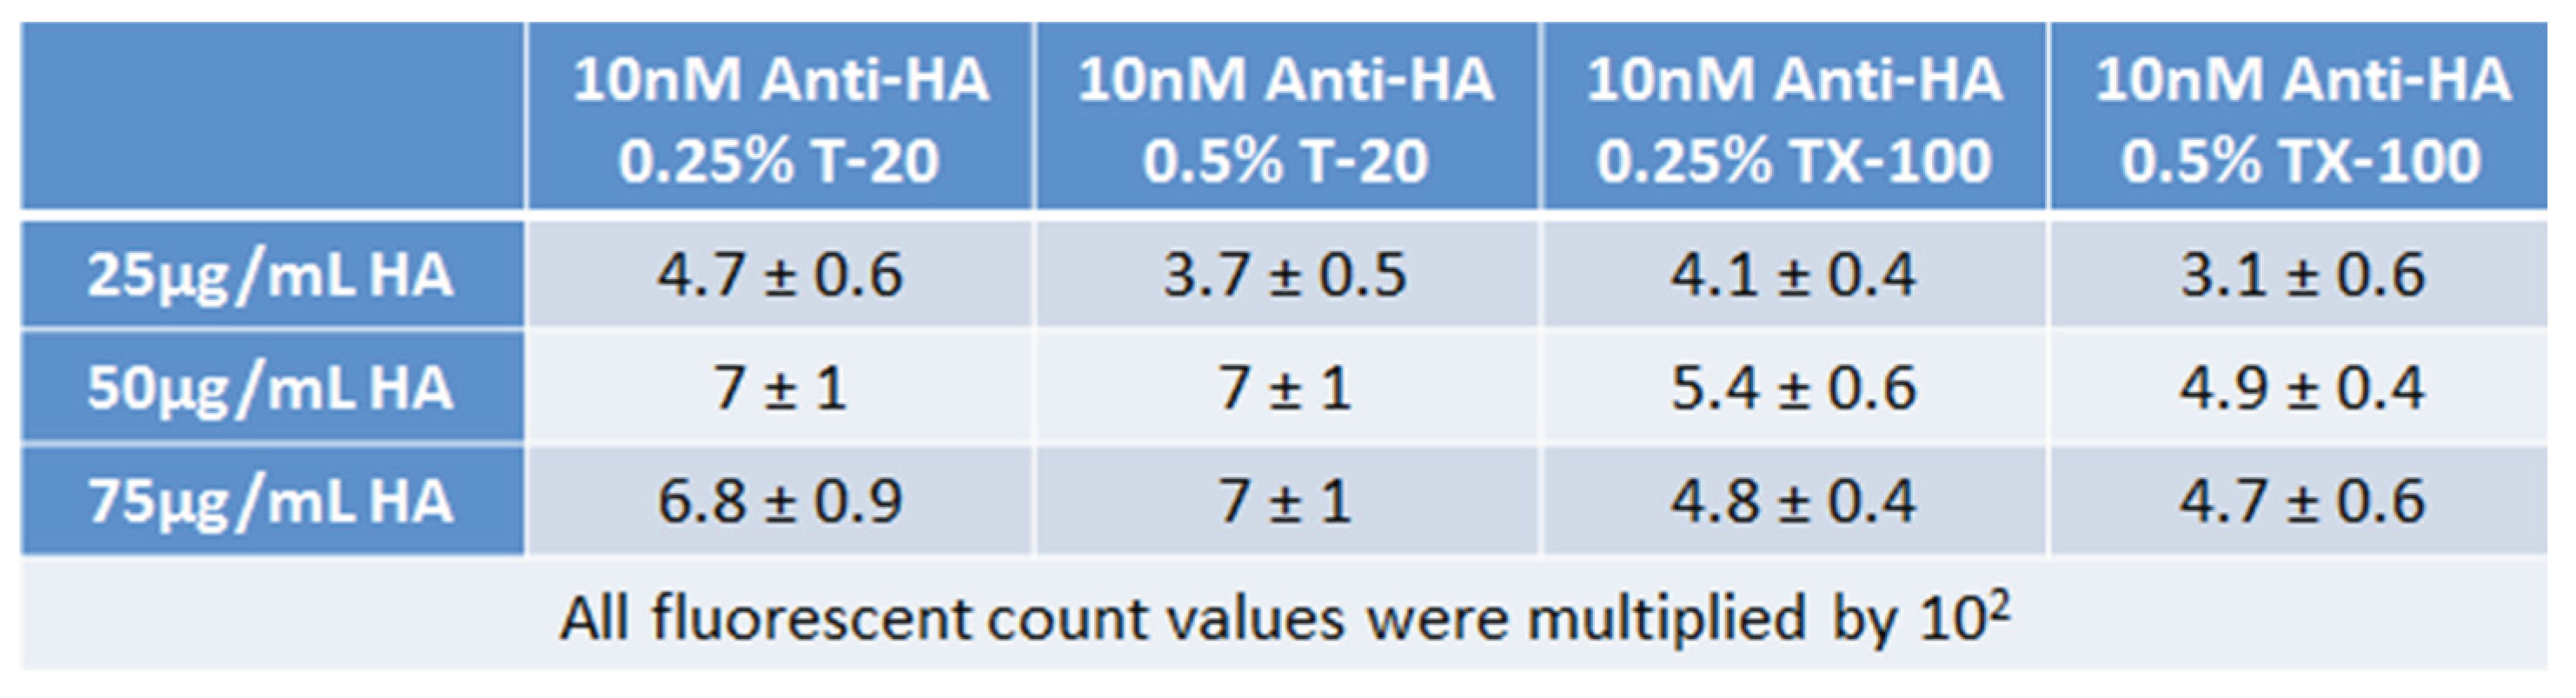
Moreover, Tween-20 had resulted in higher and better signal-to-background ratios, see Table 1. The use of 0.25% Tween-20, which has produced a higher signal-to-background than 0.5%, was adopted for use in subsequent experiments. Although the background streaking was removed by the use of Blotto and surfactants, there was a rather significant reduction of the signal. Thus, the probe immobilization needed to be enhanced.
3.1.3. Signal Enhancement
In addition to reduction of non-specific binding, different factors were studied for enhancing the fluorescence signal. One of which was the reaction time between glutaraldehyde and the APTES on the surface. Initial results demonstrated that overnight reaction time might cause a decrease in free aldehyde groups because more time could have allowed both ends of the glutaraldehyde to react with the APTES modified surface. Thus, 1 hour was chosen as the reaction time to enhance fluorescence signals in subsequent experiments.
Another factor affecting the signal intensity is the antibody incubation time. We have studied the results obtained at two incubation times: 15 min. and 20 min. Since a longer incubation time would also lead to more non-specific binding, we have studied the need to use surfactants in the antibody sample, see section 3.1.2.
The results displayed in Figure 8 indicated that the surfactant Tween-20 performed better than Triton-X under a longer incubation time. The increase in the Tween-20 results, but not in the Triton-X results, suggest that the signal can be enhanced by introducing a longer incubation time when Tween-20 is mixed with the antibody sample. Figure 8 also showed that the results in using 50μg/mL of the peptide probe on the surface were similar to 75μg/mL, suggesting signal saturation.
Since we had the biotinylated version of our HA probe (bioHA), we used the high binding affinity between streptavidin and biotin to increase the peptide probe immobilization on the surface [15,16]. As shown in Figure 9, by using the bioHA immobilized on streptavidin (i.e. SA/BioHA), an increase in the fluorescence intensity was observed when SA-Cy5 was used, as compared to HA immobilized on an aldehyde surface. It is suggested that by utilizing streptavidin to bind with biotin on bioHA, the epitope on the peptide is less hindered (see Figure 4) allowing the probe to bind with the antibody.
3.2. Spiral Channel Chip
A challenge using the linear channel chip is that it is unable to detect any of the fluorescent tags when the antibody concentration is lower than 5 nM, obviously not as good as an equivalent ELISA assay which can detect down to 0.1 nM [20]. In order to increase the signal, dynamic reaction within a spiral chip was utilized, using centrifugal liquid pumping.
For comparing the results of spiral chip to that of the linear chip, the initial experiments were made with probes immobilized on an aldehyde surface, without using a blocking agent. From these results, we were able to obtain a detection of 0.5 nM of anti-HA antibody when the spiral channels were used to immobilize the probe lines (Figure 10). Thus, only switching from the use of the linear chip to the spiral improved our detection limit by 10 times. Another observation was that although the initial test on the spiral chip was done without a blocking reagent, the streaking in the channel was significantly reduced, which is an advantage in dynamic reaction [18,19]. When the radial chip was used to immobilize the probes, followed by the samples flowing in the spiral channels, a detection as low as 0.1 nM was achieved (Figure 10).
More optimization tests were performed, including reduction of spin speed, leading to a better detection limit of 0.05 nM, see Figure 11.
3.3. Multiple Antibody Detection of Mouse Cell Supernatants/Mouse Ascites Samples
In order to test the multiple detection ability of the chip, bioHA and biopVIII were utilized as the probe lines for the detection of various concentrations of the mouse 17/9 anti-HA antibody, and this antibody in 17/9 mouse ascites fluid and 17/9 hybridoma supernatant. Figure 12 demonstrates the fluorescent signals obtained from various concentrations of anti-HA. From this information, the amount of 17/9 antibody in the mouse samples can be estimated.
The serum sample (1/250 dilution) obtained from the mouse immunized with the phage coat protein consisted of anti-pVIII was used to study the selectivity of the NBA chip and no response on intersections with the bioHA probe line was expected. In the biopVIII probe regions, the binding of anti-pVIII in the mouse serum was observed as expected; also, none of the anti-HA antibody binding was detected in this region. The fluorescent signals upon binding with biopVIII are shown in Figure 13. The selective binding of different antibodies in each of the individual channels shows success in selectively identifying multiple antibody samples on the same NBA chip.
4. Conclusion and Future Directions
In this paper, we developed an NBA chip platform that is able to detect antibodies with a detection limit below that of a comparable ELISA while requiring less sample volume (0.5 μL vs. 100 μL). Detection of antibody samples based on dynamic flow using the spiral chip allows the antibody sample to pass the channel continuously, increasing the signal while decreasing the non-specific binding. In addition, this NBA chip has a longer channel offering a longer sample residence time as well as much lower background streaking compared to linear channel chip. Fluorescent imaging showed very specific patches and binding only occurred at the correct probe-sample pair intersects. The obtained results proved acceptable reproducibility and consistency along the channels. We have also demonstrated that for detection of antibodies at low concentrations, a radial-first method gives better results than the spiral-first method. This method was applied to detect antibodies in serum and ascites obtained from immunized mouse samples. In addition, we are able to demonstrate the multiple-probe, multiple sample approach on the NBA chip since detection of 16 samples on 16 probes has been demonstrated in the linear channel chips (see Figure 7), as compared to detection of 16 samples on 6 probes on the 96-well plate platform. The capability of the NBA chip is more, as the detection of 24 samples on 48 probes is feasible on the spiral channel chips.
With the need to rapidly generate monoclonal antibodies, the ability to detect antibodies from a single cell sample allows for quick isolation of the antibody-producing cell for single-cell genetic sequencing. Based on calculations obtained from Corti et al. [21], the average cell secretes 6 attomoles per hour. With the detection limit of 0.05 nM of a 500-nL sample, we will be able to detect 25 attomoles or a secretion from a single B cell over 5 h. Therefore, our future work will include the detection of anti-HA secreted from a single antibody-producing B cell.
Acknowledgements
Funding was generously provided by Natural Sciences and Engineering Research Council (NSERC) of Canada to PCHL, the Canada Research Chairs (JKS), and the Michael Smith Foundation for Health Research (NG).
References
- Oh, S.; Park, A. R.; Bae, M. S.; Kwon, S. J.; Kim, Y. S.; Lee; Kang, J. E.; Lee, N. Y.; Cheong, S.; Parka, H.O. K. Secretome Analysis Reveals an Arabidopsis Lipase Involved in Defense against Alternaria brassicicola. The Plant Cell 2005, 17, 2832–2847. [Google Scholar] [CrossRef]
- Wu, H.; Chung, P.; Shih, H.; Wen, S.; Lai, E. Secretome Analysis Uncovers an Hcp-Family Protein Secreted via a Type VI Secretion System in Agrobacterium tumefaciens. J. Bacteriol. 2008, 190, 2841–2850. [Google Scholar] [CrossRef]
- Blanco-Colio, L. M.; Martín-Ventura, J. L.; Muñóz-García, B.; Orbe, J.; Páramo, J. A.; Michel, J.; Ortiz, A.; Meilhac, O.; Egido, J. Identification of Soluble Tumor Necrosis Factor-Like Weak Inducer of Apoptosis (sTWEAK) as a Possible Biomarker of Subclinical Atherosclerosis. Arteriosclerosis, Thrombosis, and Vascular Biology 2007, 27, 916–922. [Google Scholar] [CrossRef]
- Chu, F. W.; Edwards, P. R.; Ekins, R. P. Microarray-based immunoassays. Immunochemical Technology for Environmental Applications 1997, 657, 170–184. [Google Scholar]
- MacBeath, G.; Schreiber, S. L. Printing proteins as microarrays for high-throughput function determination. Science 2000, 289, 1760–1763. [Google Scholar] [CrossRef]
- Mendoza, L. G.; McQuary, P.; Mongan, P. High-throughput microarray-based enzyme-linked immunosorbent assay (ELISA). Biotechniques 1999, 27, 778–80. [Google Scholar] [CrossRef]
- Hartmann, M.; Roeraade, J.; Stoll, D. Protein microarrays for diagnostic assays. Analytical and Bioanalytical Chemistry 2009, 393, 1407–1416. [Google Scholar] [CrossRef] [PubMed]
- Bernard, A.; Michel, B.; Delamarche, E. Micromosaic immunoassays. Analytical Chemistry 2001, 73, 8–12. [Google Scholar] [CrossRef] [PubMed]
- Wang, L.; Li, P. C. H. Flexible microarray construction and fast DNA hybridization conducted on a microfluidic chip for plant fungal pathogen detection. Journal of Agricultural and Food Chemistry 2007, 55, 10509–10516. [Google Scholar] [CrossRef] [PubMed]
- Wang, L.; Li, P. C. H. Gold nanoparticle-assisted single base-pair mismatch discrimination on a microfluidic microarray device. Biomicrofluidics 2010, 4, 032209. [Google Scholar] [CrossRef]
- Peng, X. Y.; Li, P. C. H.; Yu, H. Z.; Parameswaran, M.; Chou, W. L. Spiral microchannels on a CD for DNA hybridizations. Sensors and Actuators B: Chemical 2007, 128, 64–69. [Google Scholar] [CrossRef]
- Wang, L.; Li, P. C. H.; Yu, H. Z.; Parameswaran, A. M. Fungal pathogenic nucleic acid detection achieved with a microfluidic microarray device. Analytica Chimica Acta 2008, 610, 97–104. [Google Scholar] [CrossRef]
- Chen, H.; Wang, L.; Li, P. C. H. Nucleic acid microarrays created in the double-spiral format on a circular microfluidic disk. Lab Chip 2008, 8, 826–829. [Google Scholar] [CrossRef]
- Batteiger, B.; Newhall V, W. J.; Jones, R. B. The use of tween 20 as a blocking agent in the immunological detection of proteins transferred to nitrocellulose membranes. Journal of Immunological Methods 1982, 55, 297–307. [Google Scholar] [CrossRef]
- Peluso, P.; Wilson, D. S.; Do, D.; Tran, H.; Venkatasubbaiah, M.; Quincy, D.; Heidecker, B.; Poindexter, K.; Tolani, N.; Phelan, M.; Witte, K.; Jung, L. S.; Wagner, P.; Nock, S. Optimizing antibody immobilization strategies for the construction of protein microarrays. Analytical Biochemistry 2003, 312, 113–124. [Google Scholar] [CrossRef]
- Ramachandran, N.; Hainsworth, E.; Bhullar, B.; Eisenstein, S.; Rosen, B.; Lau, A. Y.; Walter, J. C.; LaBaer, J. Self-assembling protein microarrays. Science 2004, 305, 86–90. [Google Scholar] [CrossRef]
- Wang, Lin; Li, Paul C.H. “Optimization of a microfluidic microarray device for the fast discrimination of fungal pathogenic DNA”. Anal. Biochem. 2010, 400, 282–288. [Google Scholar] [CrossRef] [PubMed]
- Wang, L.; Kropinski, M. C.; Li, P. C. H. Analysis and modeling of flow in rotating spiral microchannels: towards math-aided design of microfluidic systems using centrifugal pumping. Lab on a Chip 2011, 11, 2097–2108. [Google Scholar] [CrossRef] [PubMed]
- Sedighi, Abootaleb; Whitehall, Vicki; Li, Paul C.H. Enhanced destabilization of mismatched DNA using gold nanoparticles offers specificity without compromising sensitivity for nucleic acid analyses. Nano Research 2015, 8, 3922–3933. [Google Scholar] [CrossRef]
- Sun, Yue; Marzancola, Mahsa Gharibi; Lee, Jonathan; Li*, Paul C. H.; Gulzar, Naveed; Scott, Jamie K.; Wang, Shumei. Rapid Detection of Antibody in Biological Fluids on a Bioarray Chip. Anal. Lett. 2018, 52, 839–851. [Google Scholar] [CrossRef]
- Corti, D.; Voss, J.; Gamblin, S. J.; Codoni, G.; Macagno, A.; Jarrossay, D.; Vachieri, S. G.; Pinna, D.; Minola, A.; Vanzetta, F.; Silacci, C.; Fernandez-Rodriguez, B. M.; Agatic, G.; Bianchi, S.; Giacchetto Sasselli, I.; Calder, L.; Sallusto, F.; Collins, P.; Haire, L. F.; Temperton, N.; Langedijk, J. P. M.; Skehel, J. J.; Lanzavecchia, A. A Neutralizing Antibody Selected from Plasma Cells That Binds to Group 1 and Group 2 Influenza A Hemagglutinins. Science 2011, 333, 850–856. [Google Scholar] [CrossRef] [PubMed]
Figure 1.
Schematic diagram for the intersection approach: Peptide probes immobilized on the aldehyde-modified glass slide surface. Polydimethylsiloxane (PDMS) Chip 2 is placed with vertically oriented microchannels against the vertical probe lines creating intersections, where reactions occur between antibody sample in the microchannels and immobilized peptide on the chip surface.
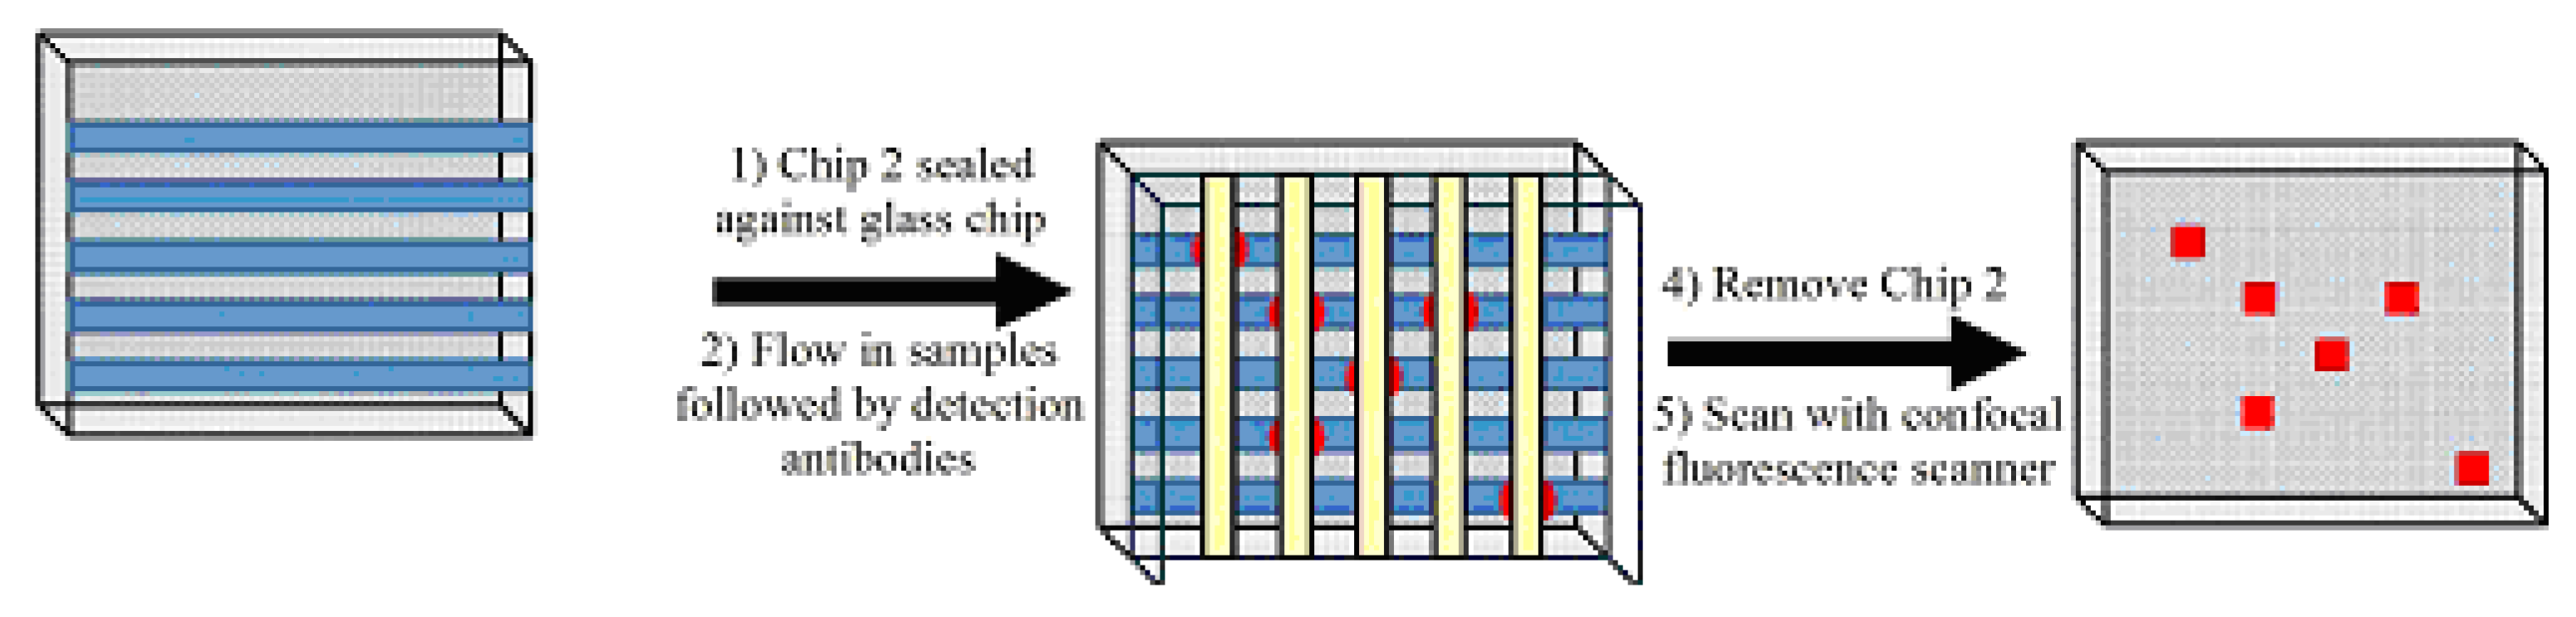
Figure 2.
Linear channel chips. (a) molding master made on SU-8 coated silicon wafer. (b) Molded PDMS chip ( 2” x 3”) with 16 channels filled with blue-dyed solutions. The channel dimensions are 3 cm x 200 μm x 50 μm.
Figure 2.
Linear channel chips. (a) molding master made on SU-8 coated silicon wafer. (b) Molded PDMS chip ( 2” x 3”) with 16 channels filled with blue-dyed solutions. The channel dimensions are 3 cm x 200 μm x 50 μm.
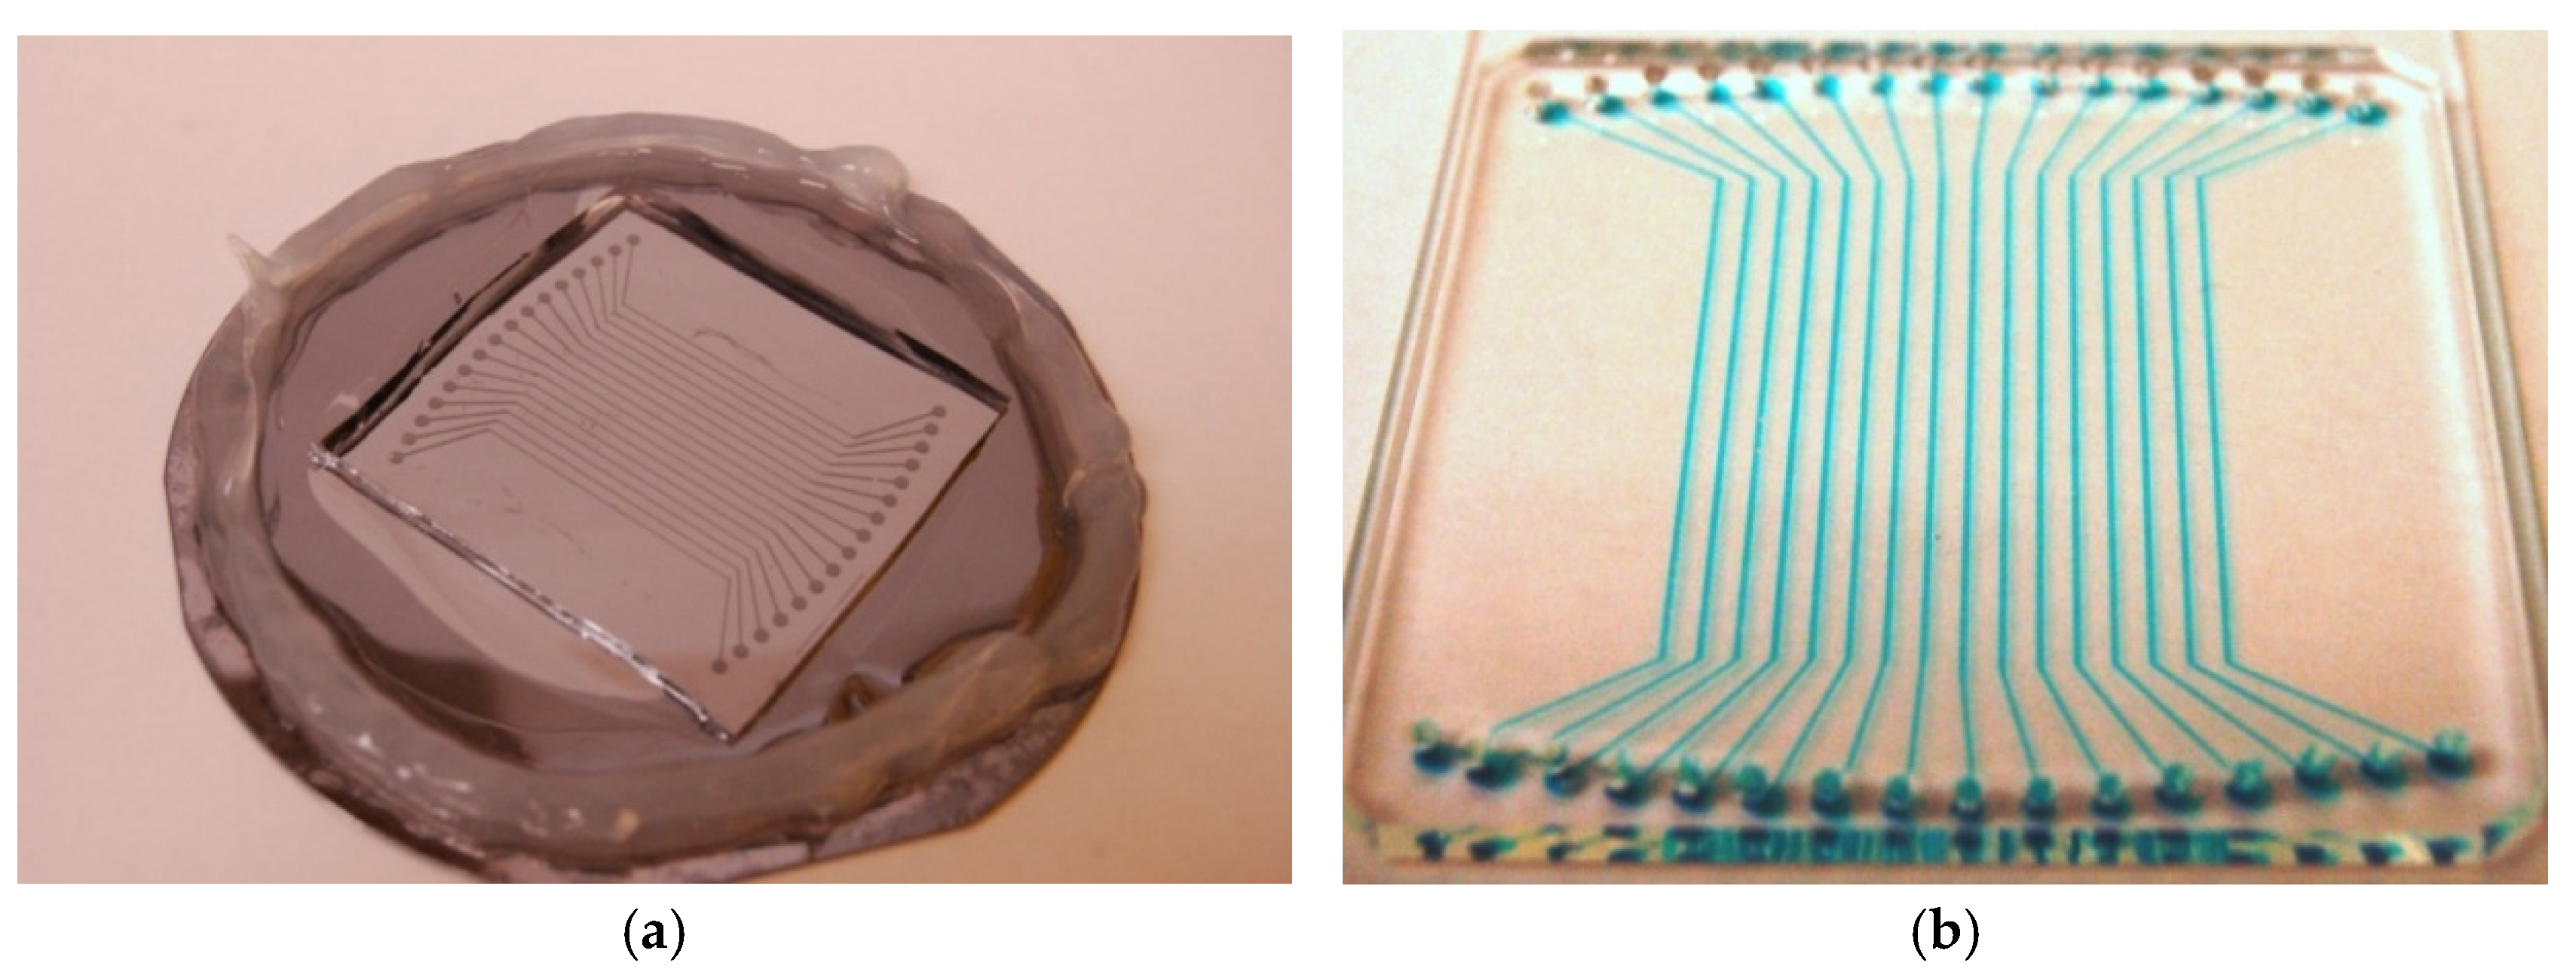
Figure 3.
Molded radial and spiral PDMS chips of 7.5 cm diameter. (a) Radial Chip with 48 channels (4 cm long) and (b) its photomask. (c) Spiral Chip with 24 channels (10 cm long) and (d) its photomask. All channels are of 100 μm width and 35 μm height.
Figure 3.
Molded radial and spiral PDMS chips of 7.5 cm diameter. (a) Radial Chip with 48 channels (4 cm long) and (b) its photomask. (c) Spiral Chip with 24 channels (10 cm long) and (d) its photomask. All channels are of 100 μm width and 35 μm height.
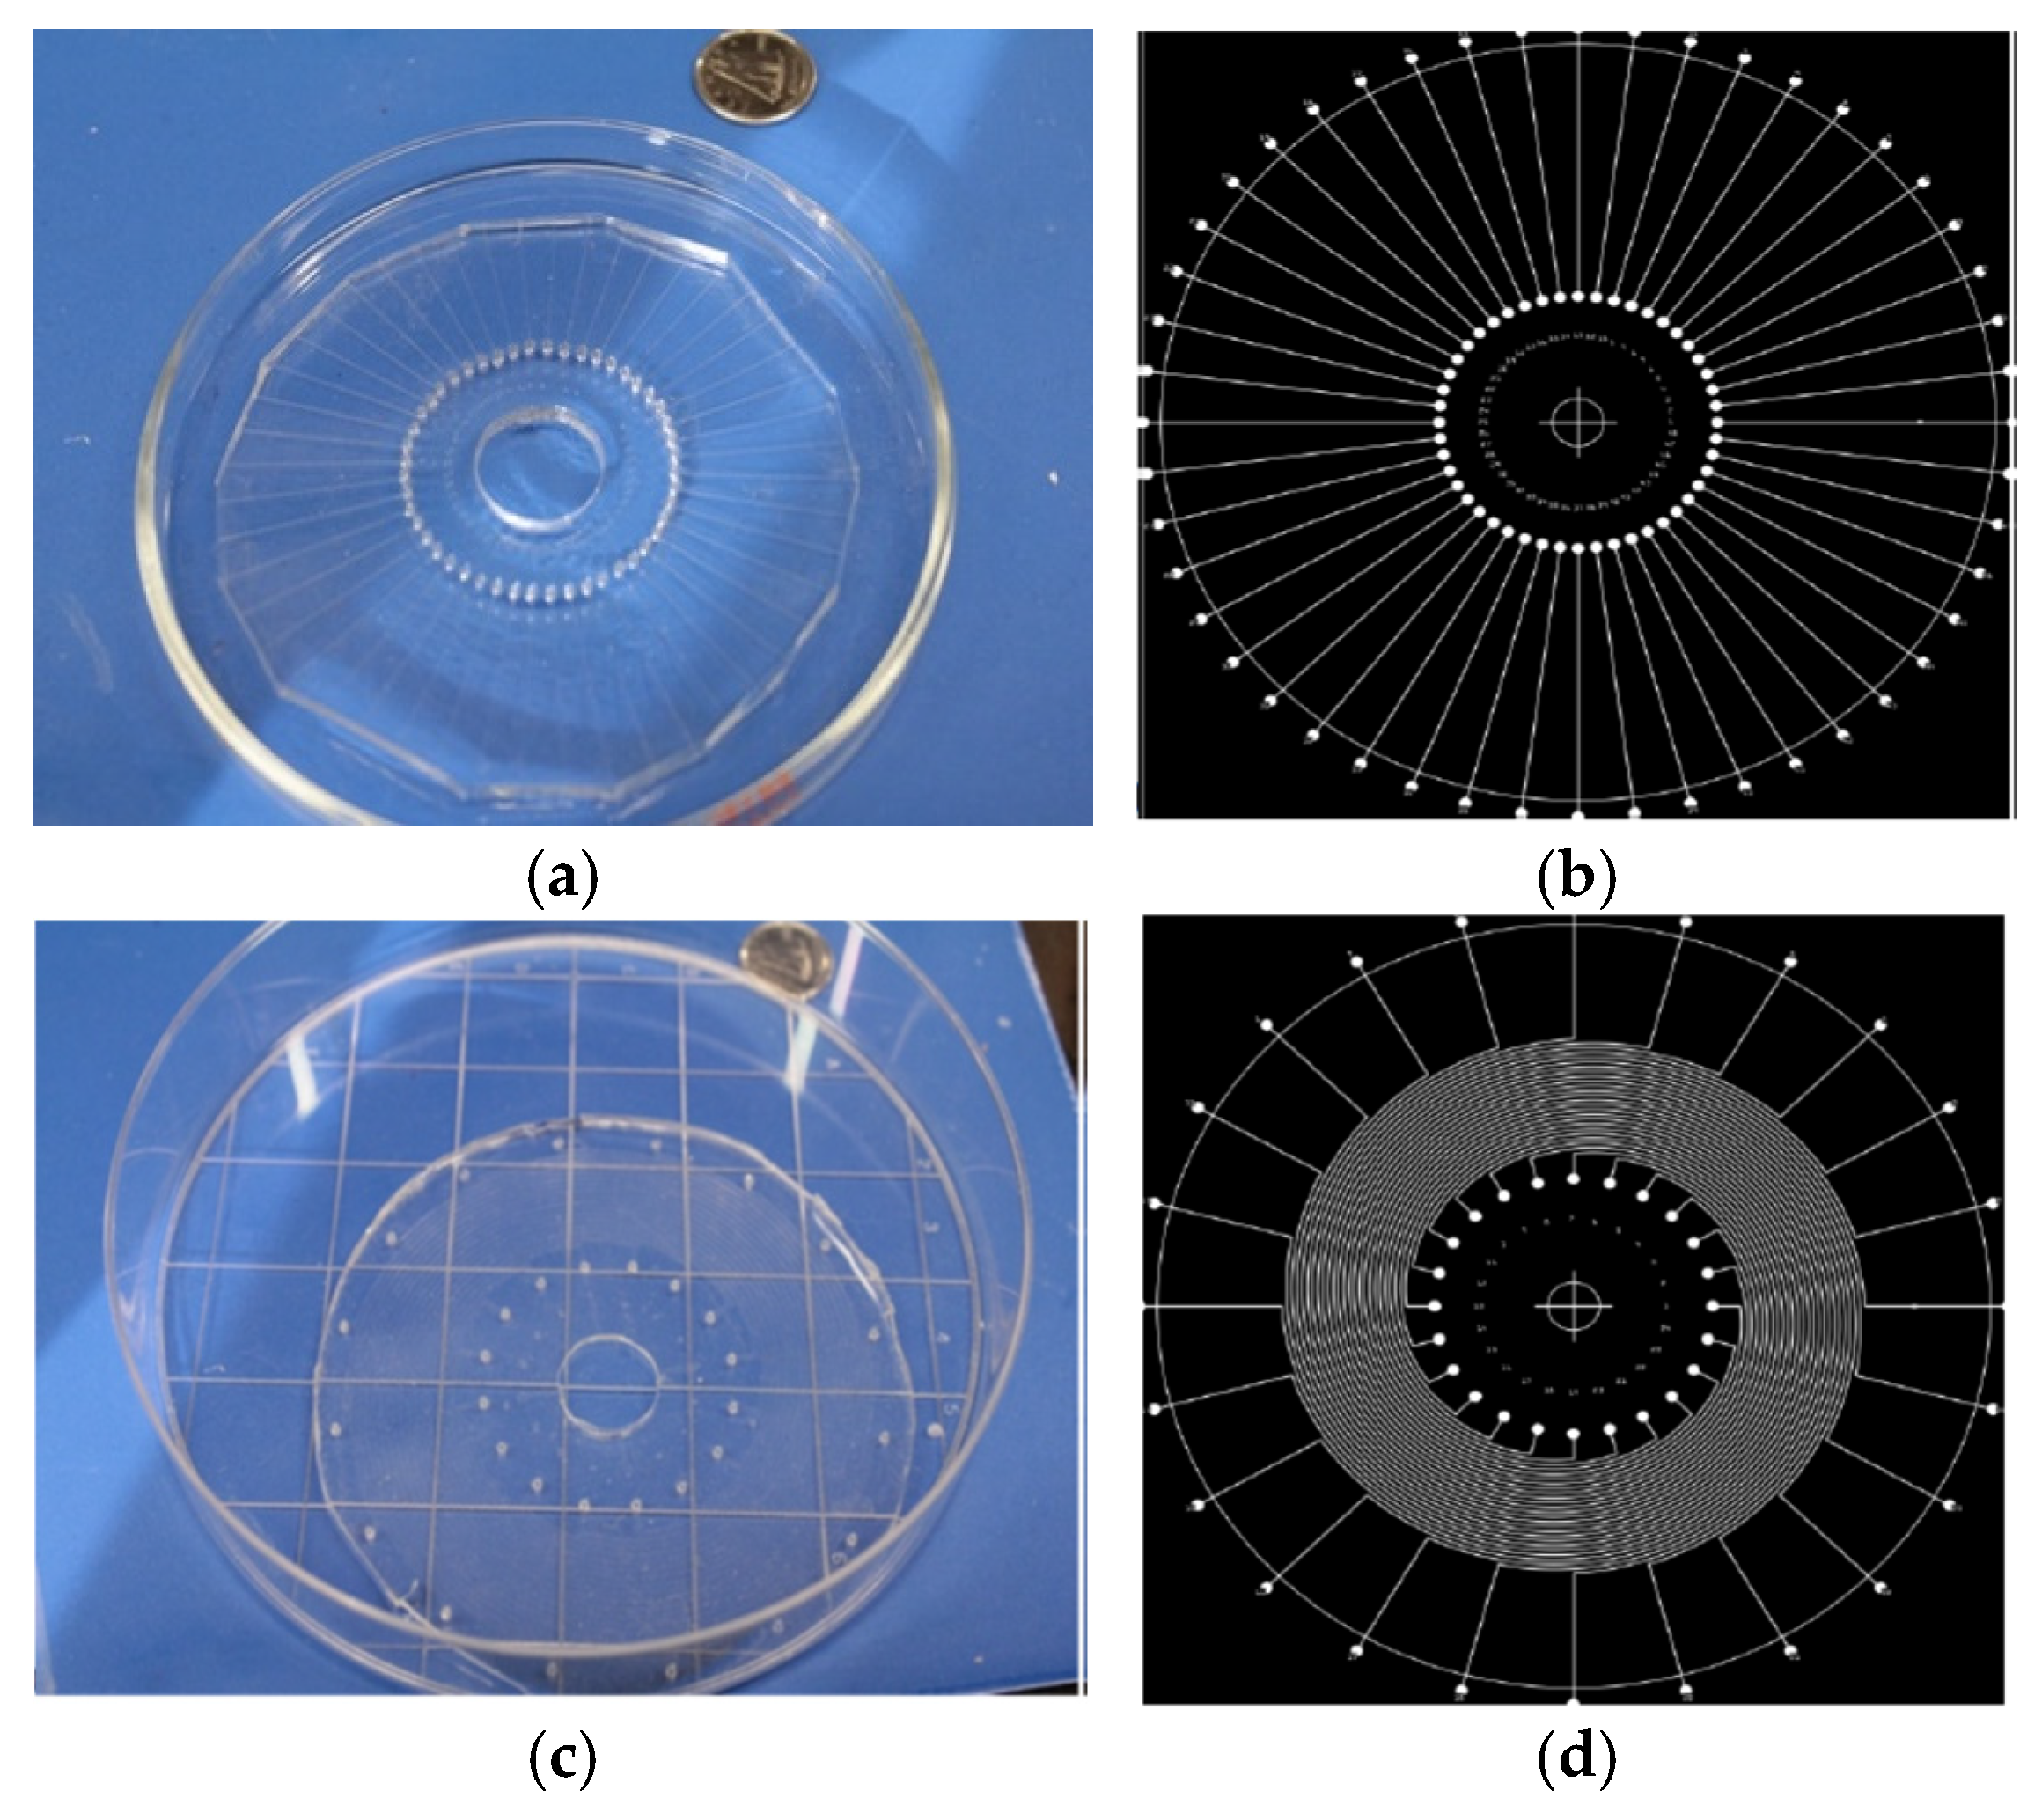
Figure 4.
Amino acid sequences of peptide probes. The left is the N-terminal and the right is the C terminal with the amide. (The red letters represent the amino acids of the binding epitope).
Figure 4.
Amino acid sequences of peptide probes. The left is the N-terminal and the right is the C terminal with the amide. (The red letters represent the amino acids of the binding epitope).
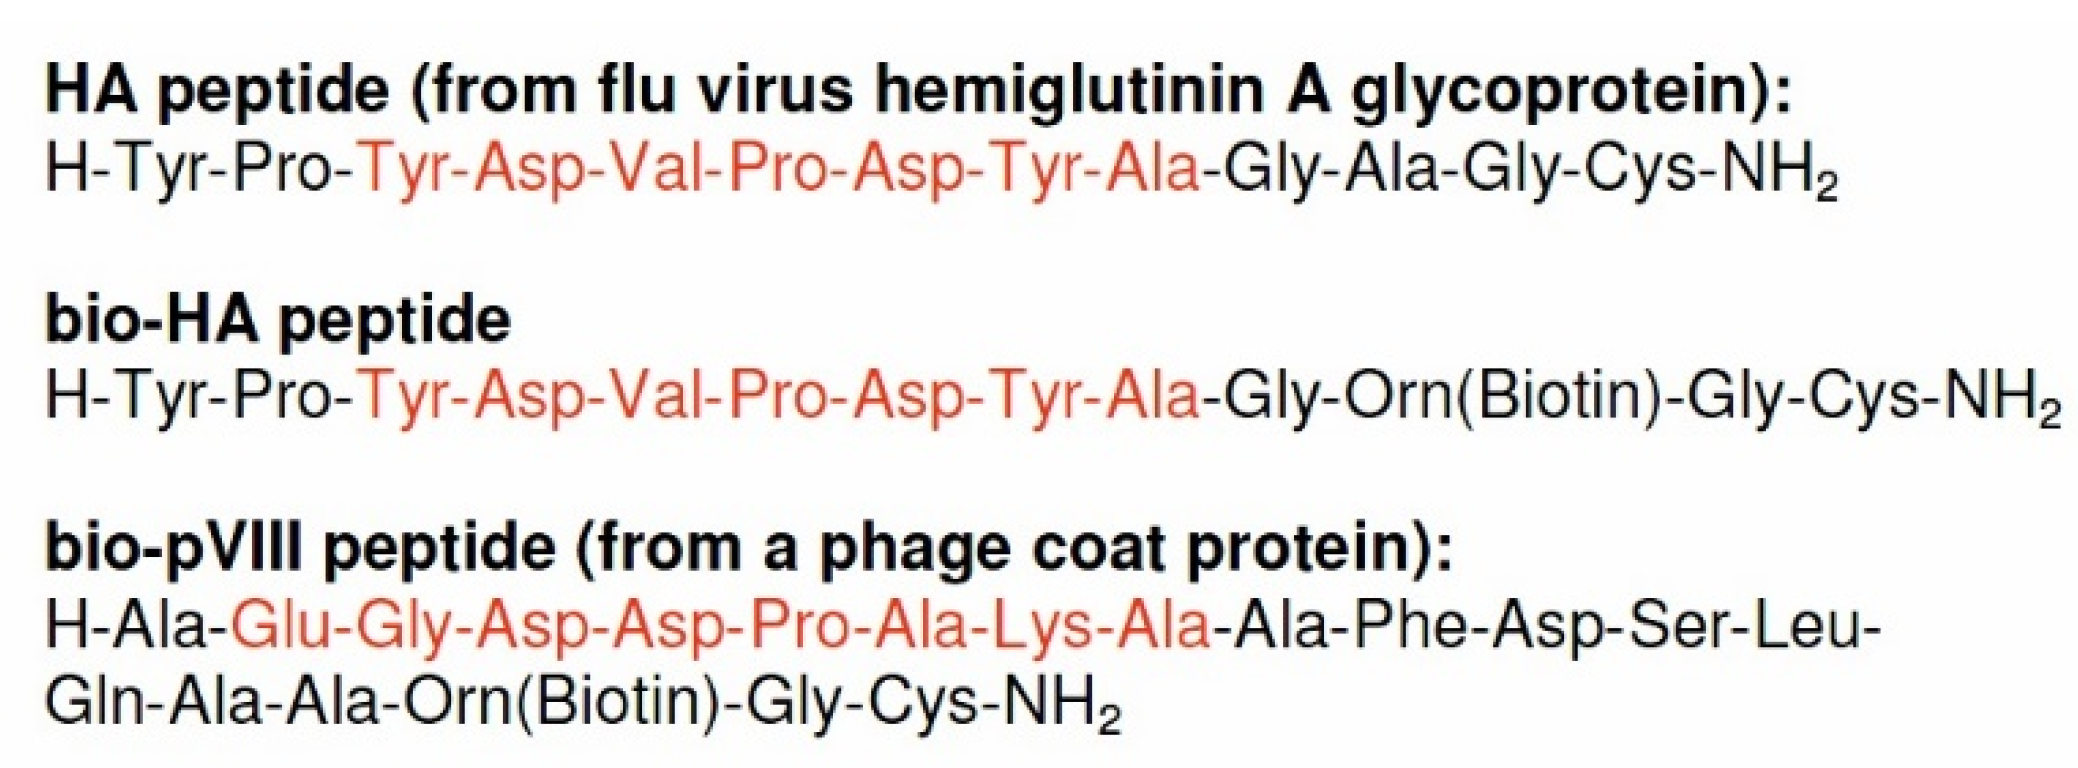
Figure 5.
Binding of anti-HA MAb from mouse 17/9 (10 nM) with peptide probes. BioHA in 50 ug/mL and HA in various concentrations were used. The three left channels were flowed with the antibody sample (MAb 17/9) and the control channel on the right was flowed with PBS. In all cases, AlexaFluor 647-labelled anti-mouse detection antibody (10 nM) was flowed for detection of the presence of MAb 17/9. The spots are 200μm by 200μm in size. The right top inset shows the probe-target arrangement: i.e. horizontal rows of 10- nM anti-HA (in 3 replicates) intersecting with the vertical columns of HA and bioHA peptide probes (in 3 replicates ) The right bottom inset shows the expected results.
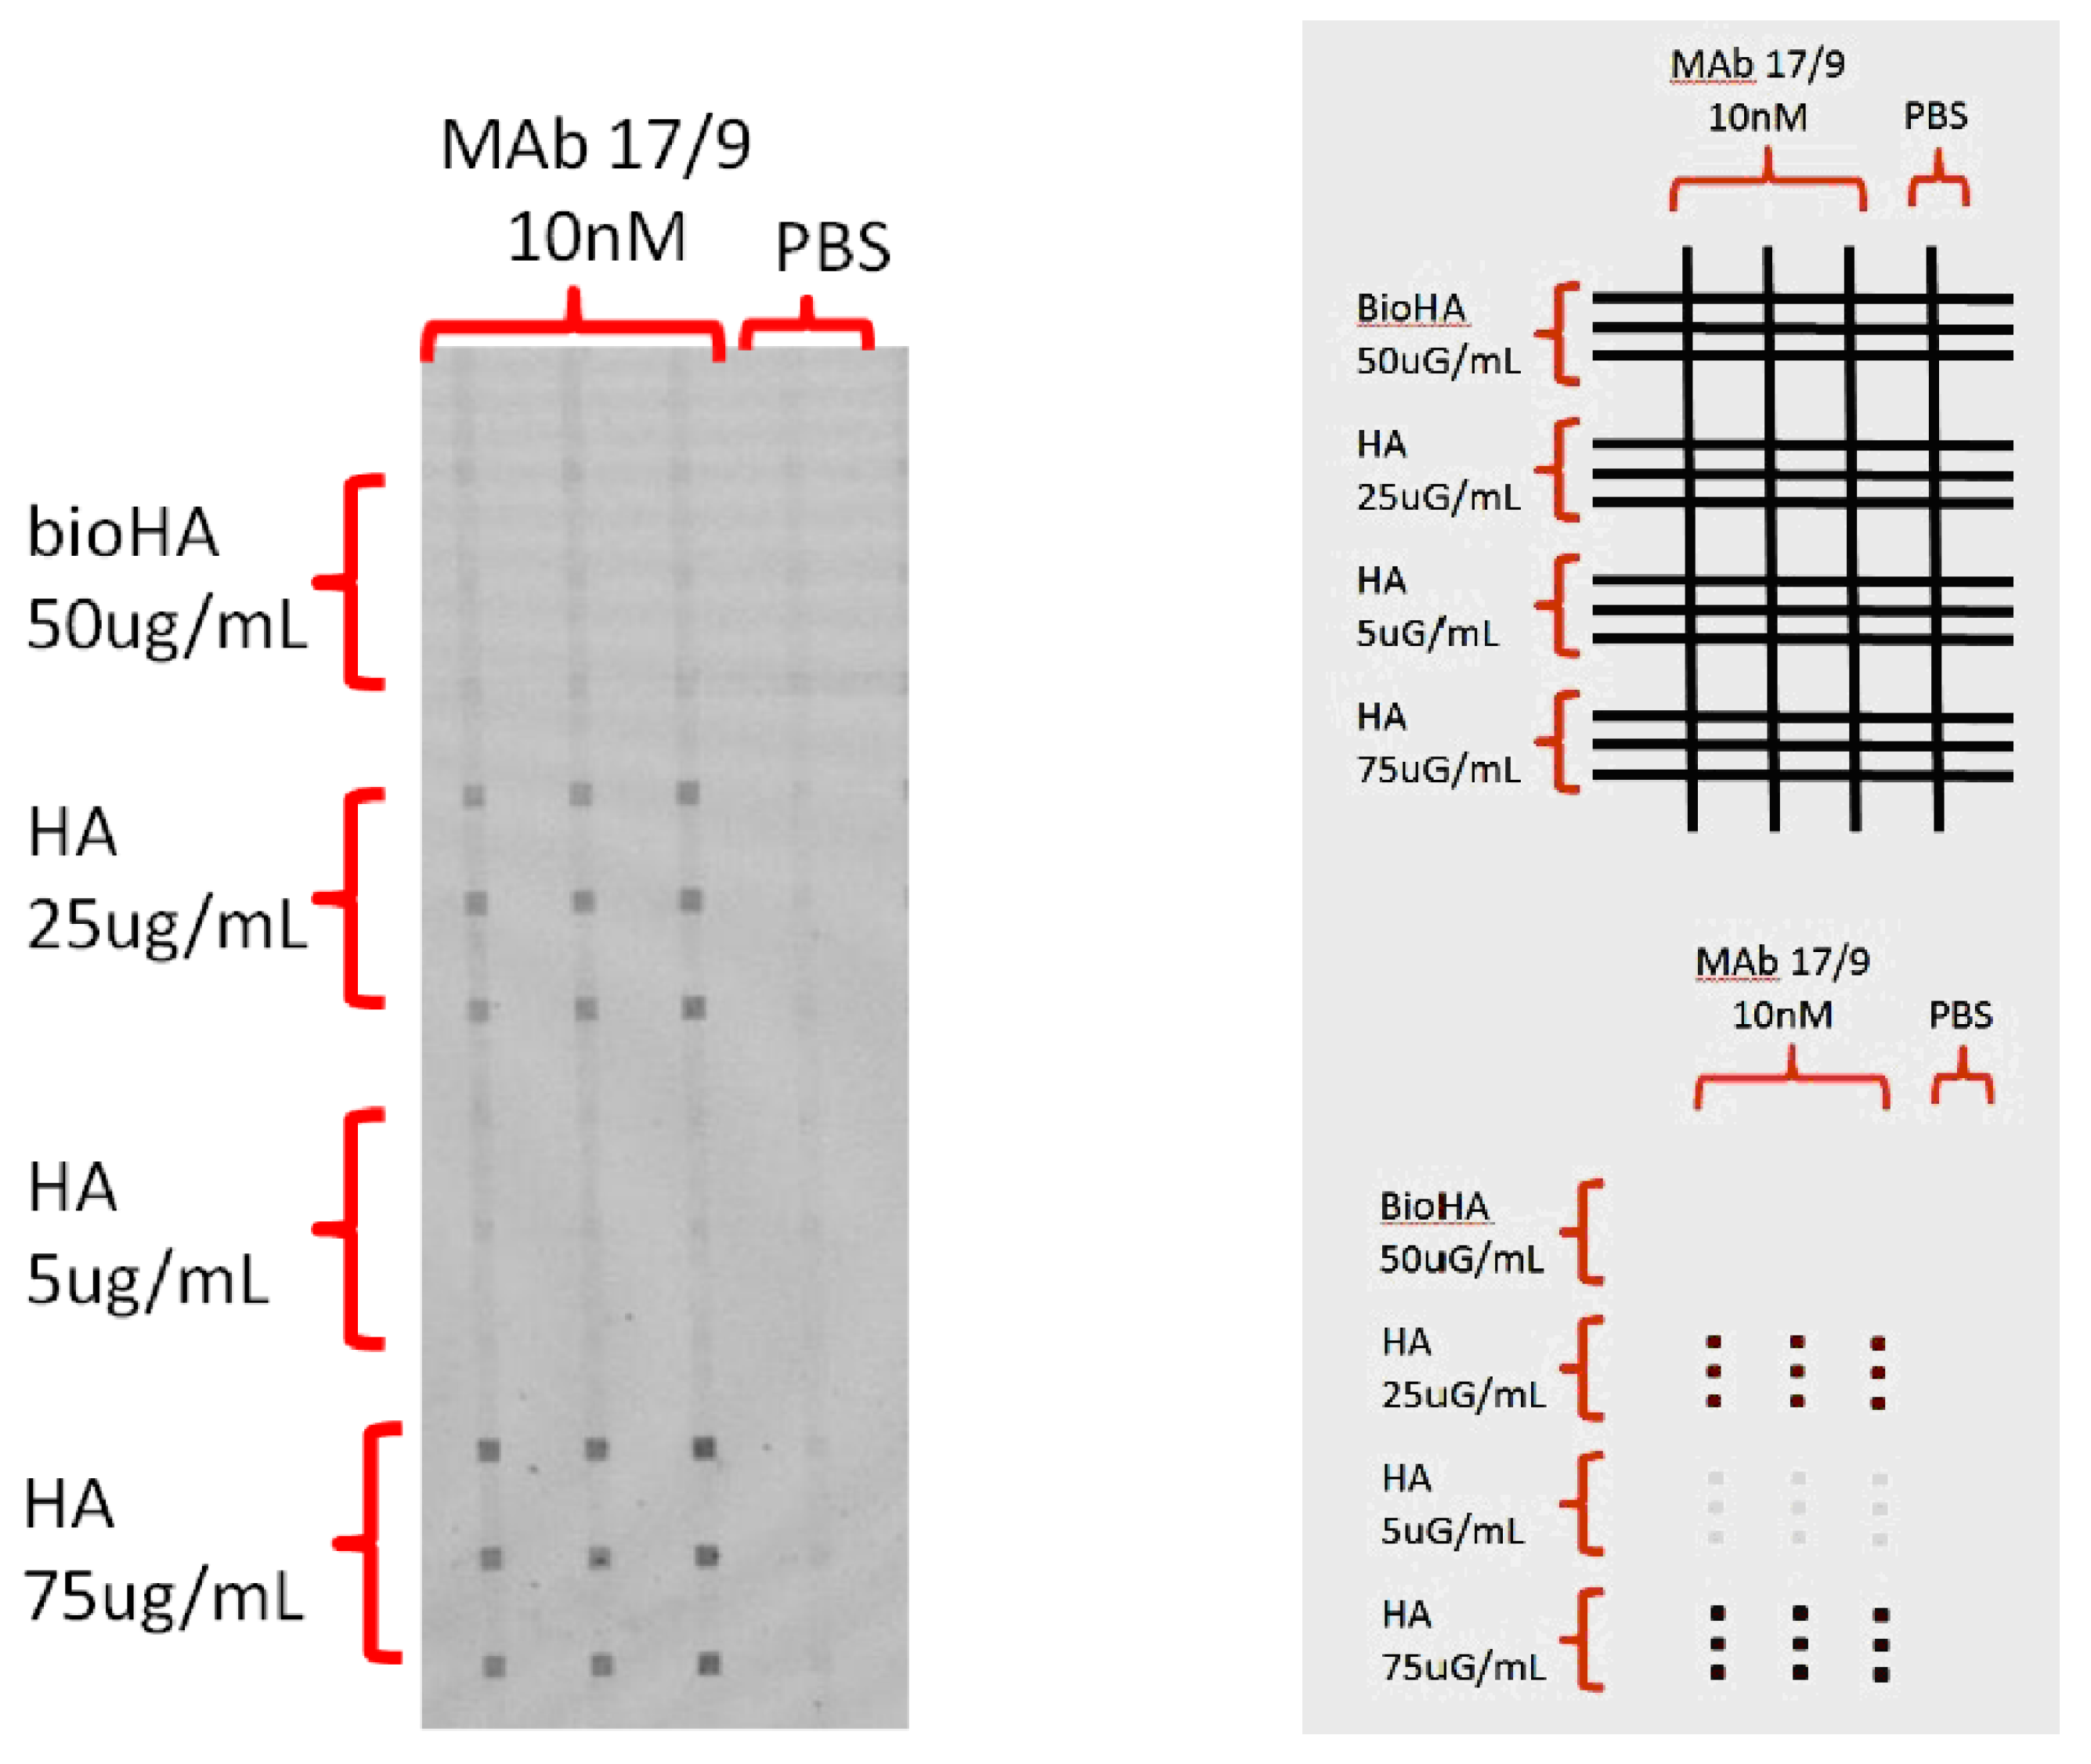
Figure 6.
Elimination of streaking by using a better blocking solution (Blotto). In this case, a concentration of 50ug/mL of Bio peptide solution was used, and a concentration of 10nM of anti-HA monoclonal antibody from mouse 17/9 was used.The peptide biopVIII, not bound to anti-HA but by anti-pVIII, was used too. The spots are of 100μm by 100μm in size.
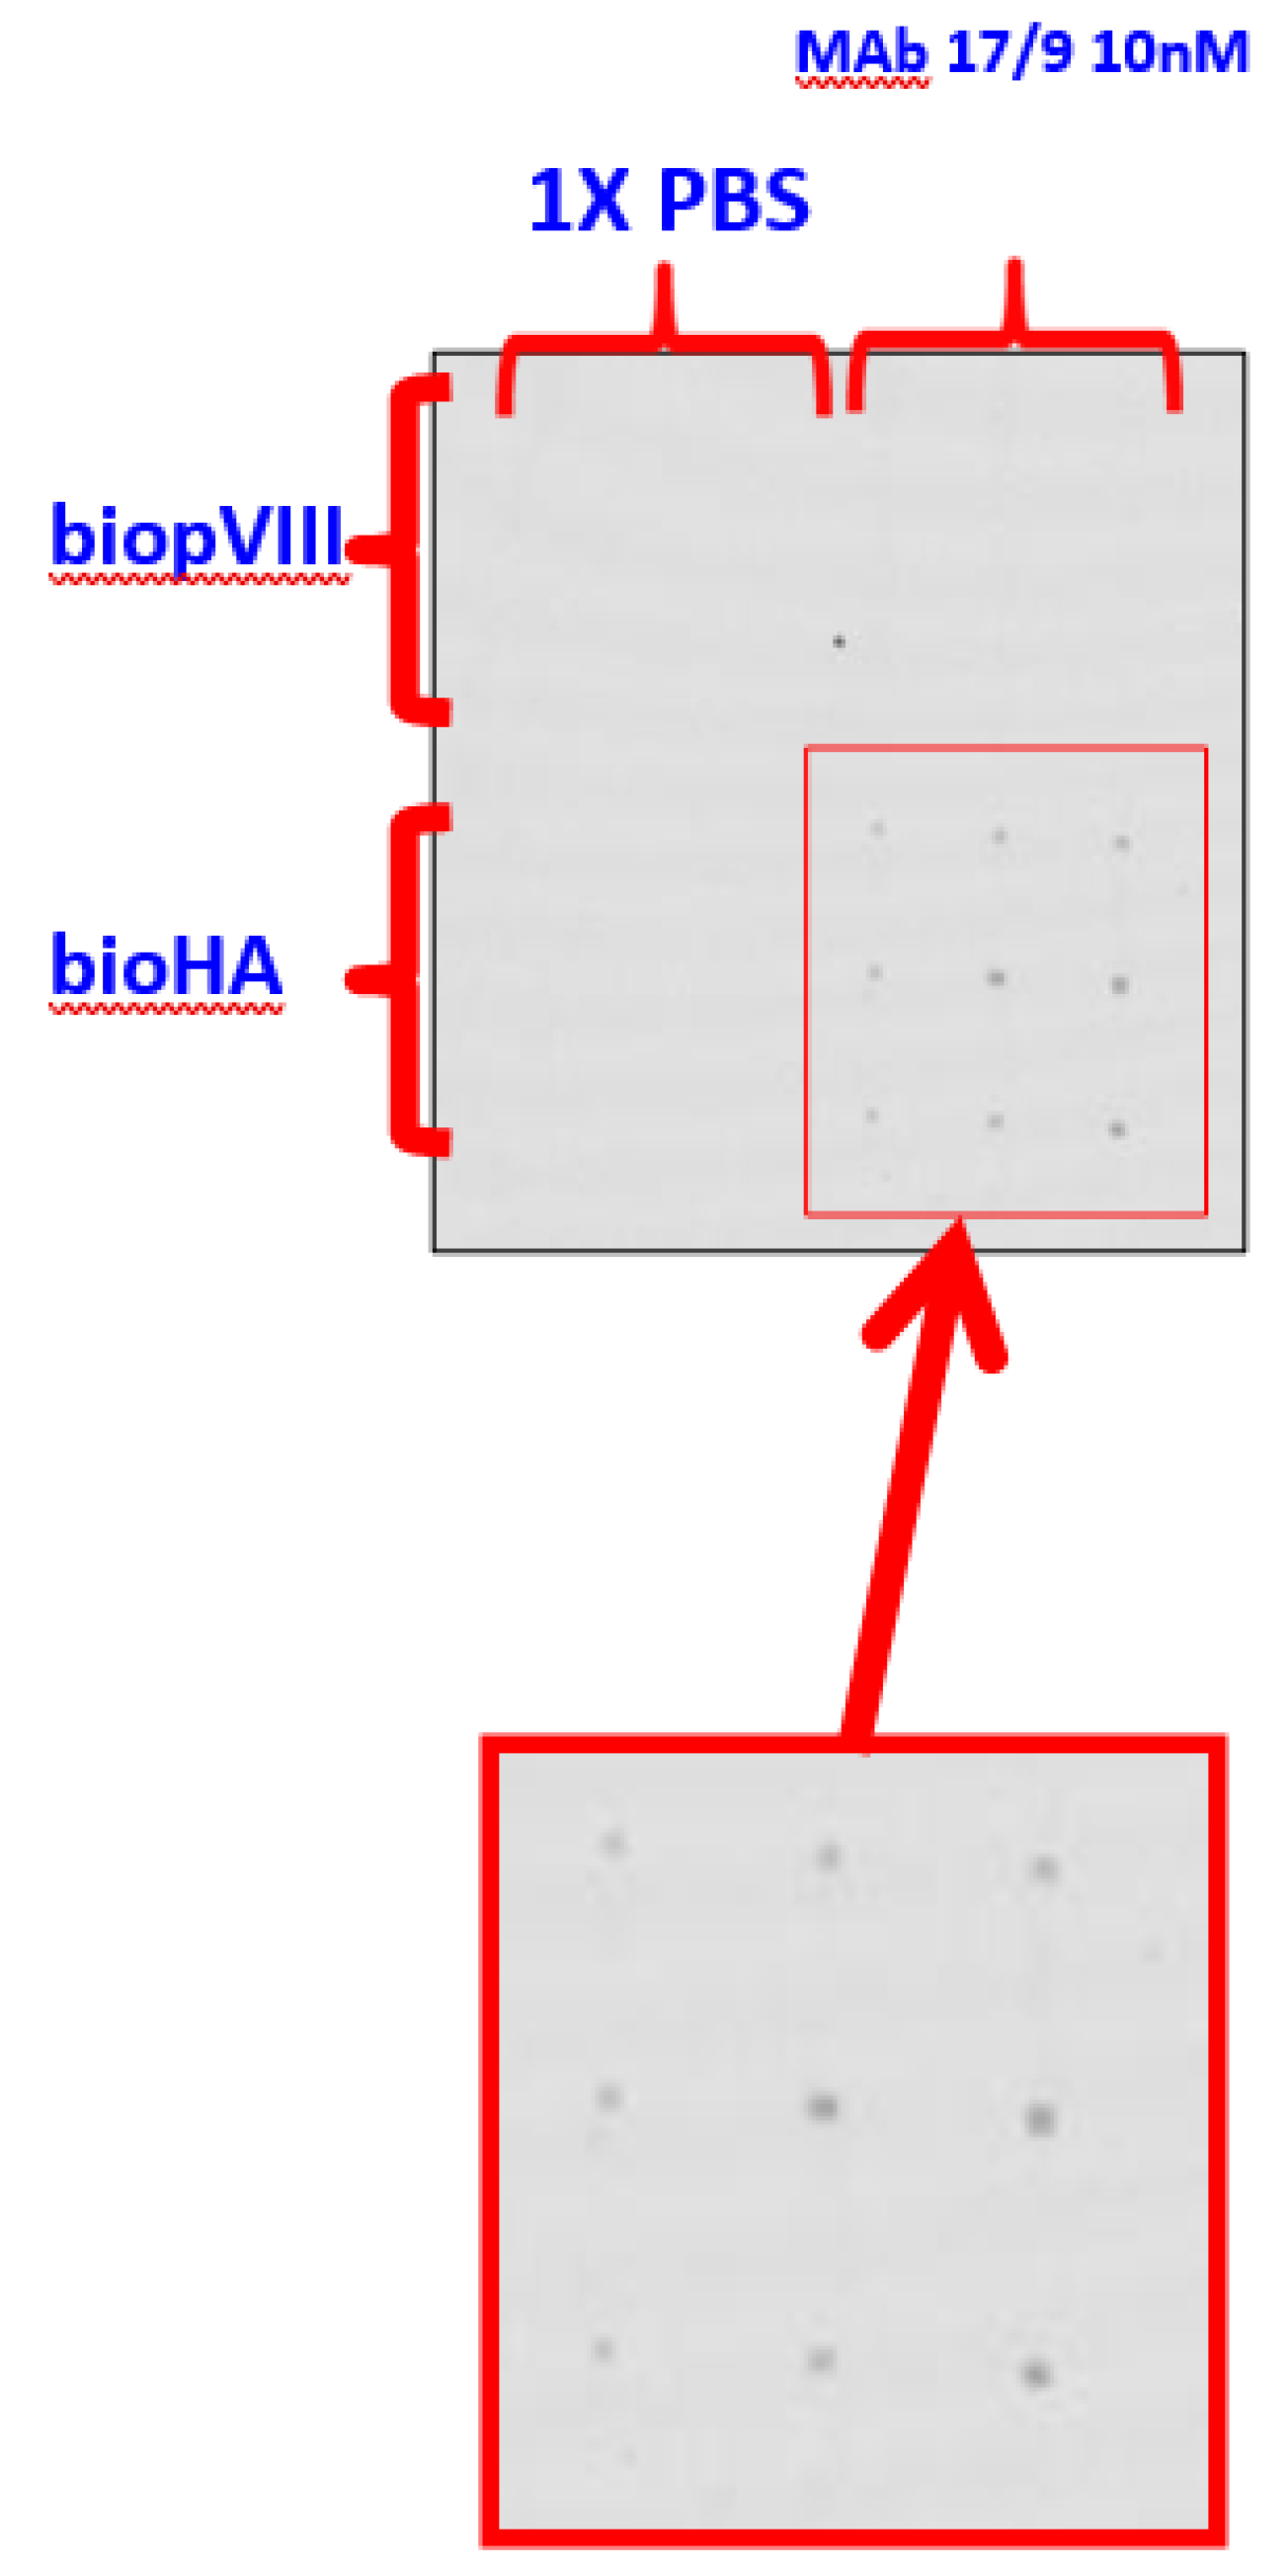
Figure 7.
The effect of various surfactants added to the antibody sample on the streaking effect. Tween-20 and Triton X-100 were tested at various concentrations to test the effect of removal of non-specific binding. The spot sizes are 100μm by 200μm.
Figure 7.
The effect of various surfactants added to the antibody sample on the streaking effect. Tween-20 and Triton X-100 were tested at various concentrations to test the effect of removal of non-specific binding. The spot sizes are 100μm by 200μm.
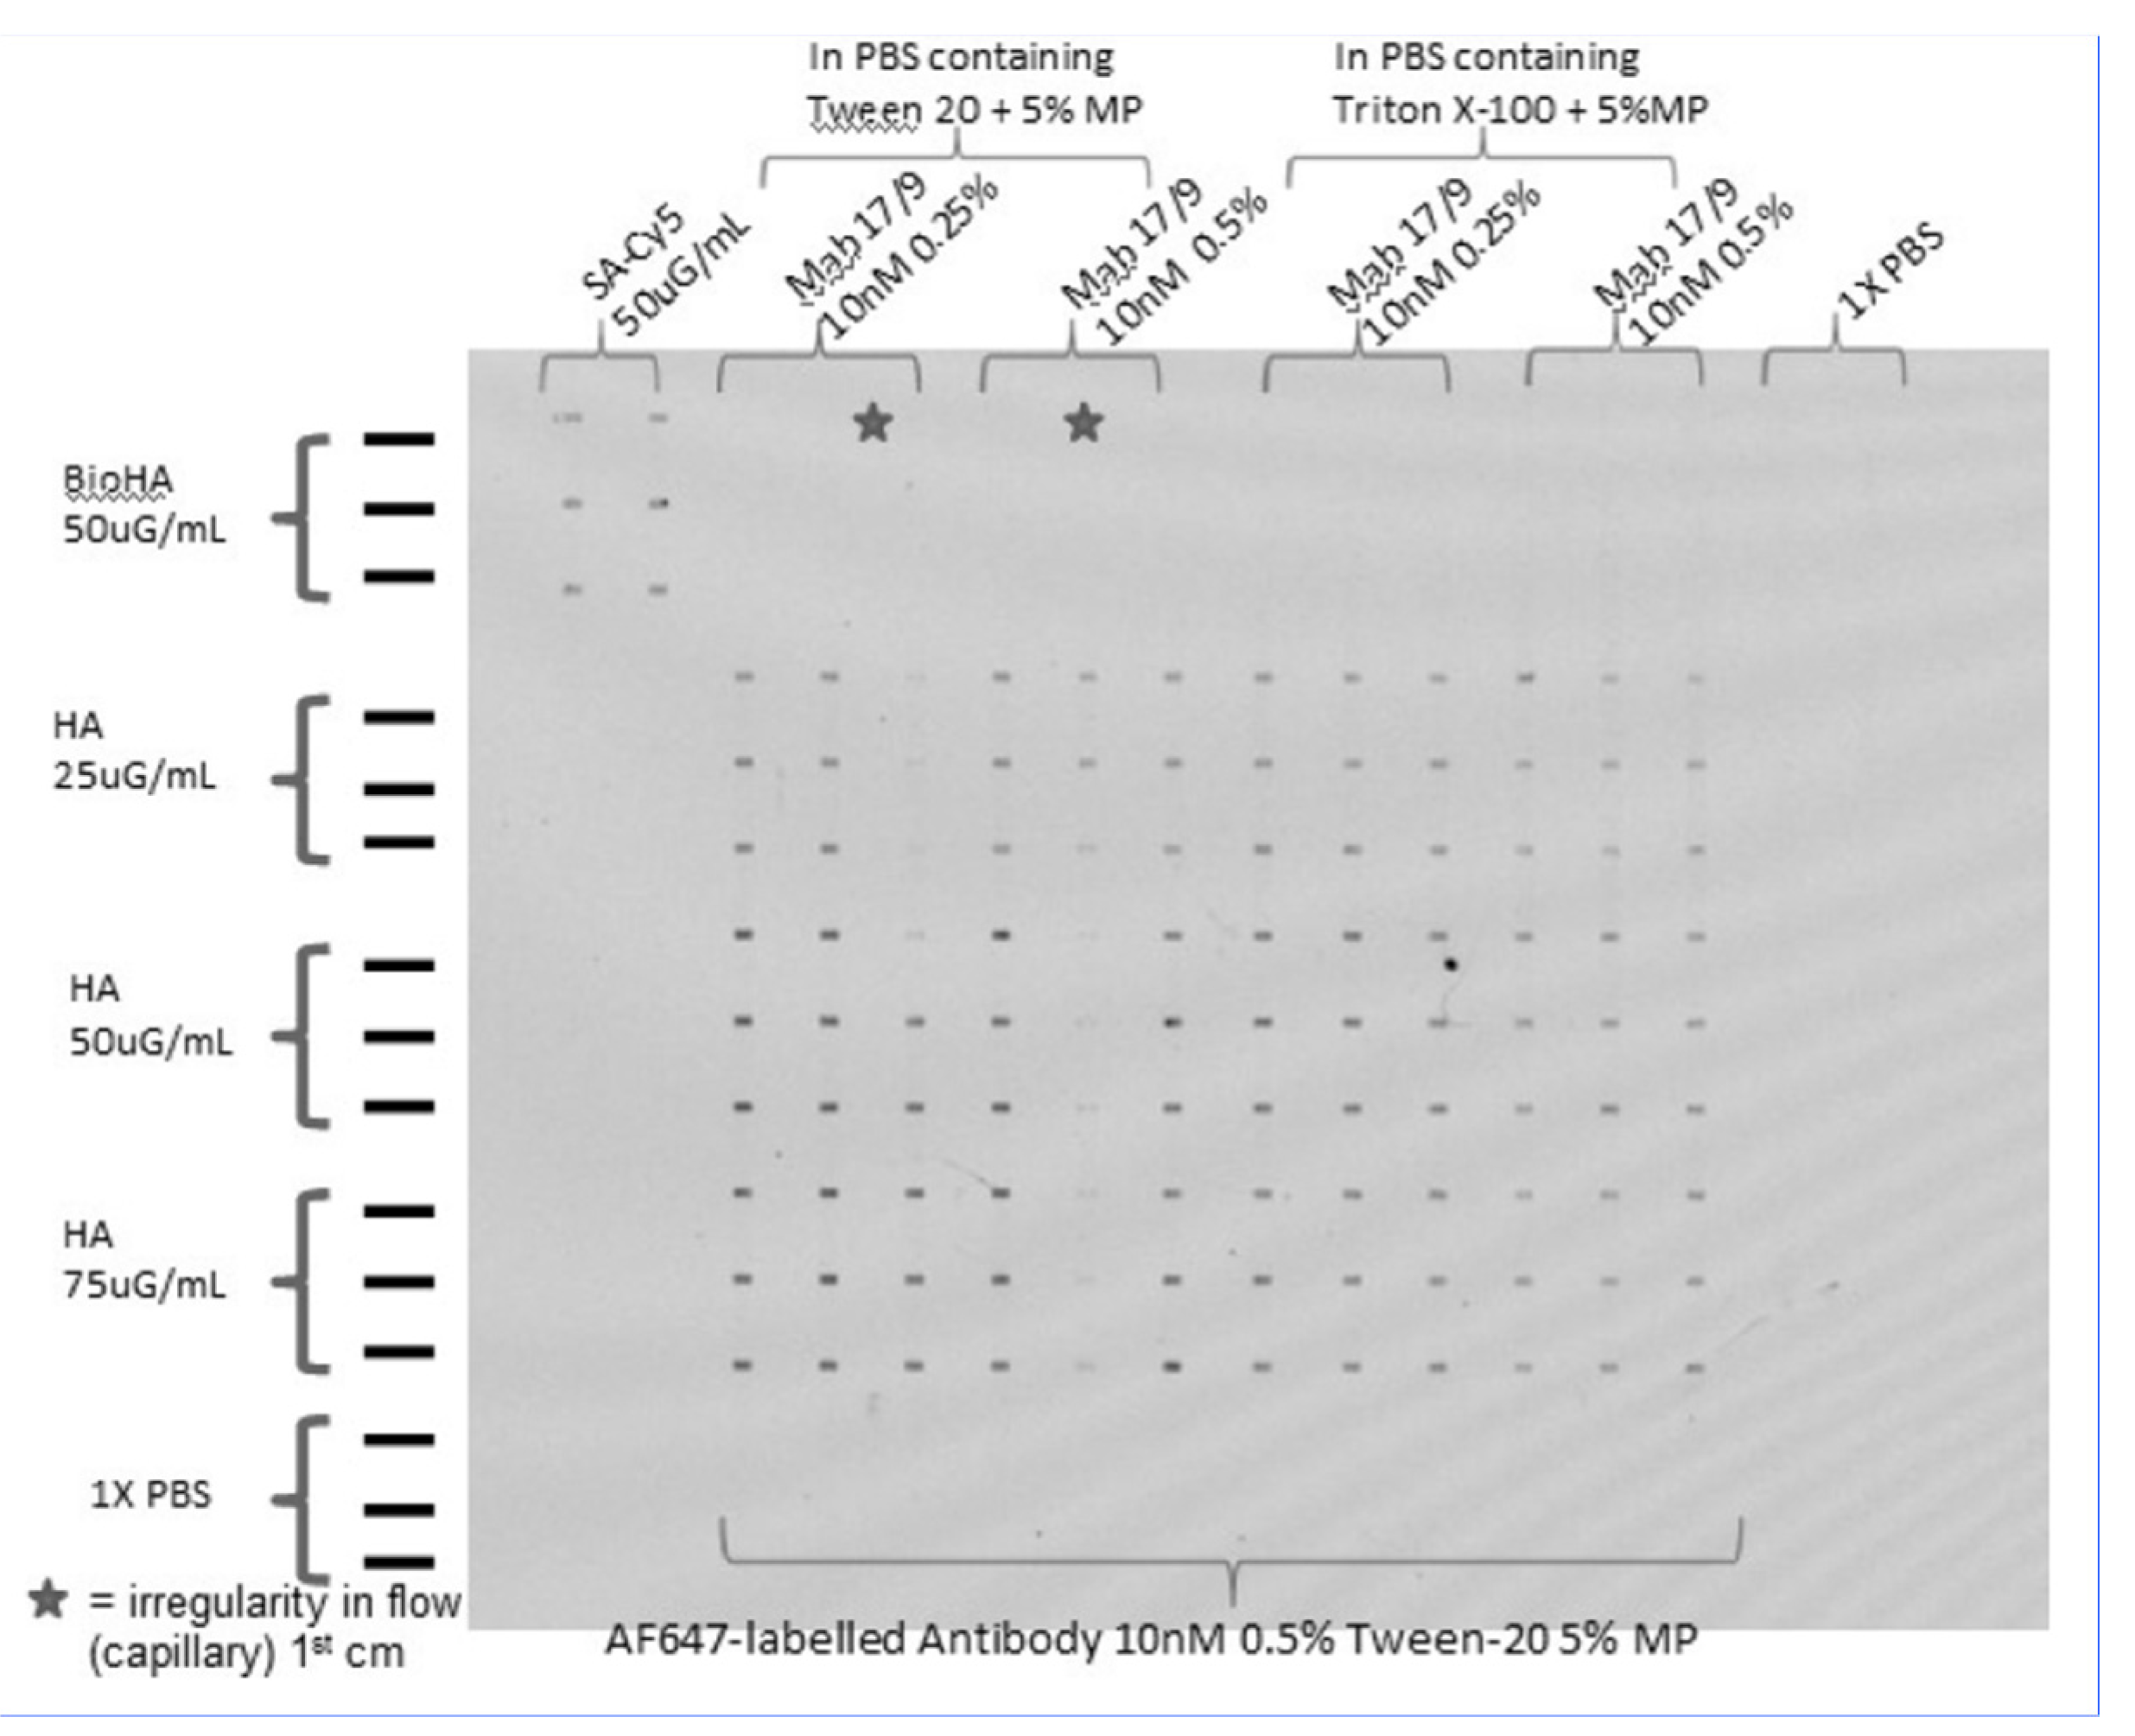
Figure 8.
Effect of sample incubation time on signal. Either Tween-20 or Triton X-100 was used in the antibody sample to find out which surfactant will result in a less signal reduction during a longer incubation time. The left group (L) represents the signals obtained after 20-min incubation, and the right group (R) represents the signals obtained after incubation for 15 min. The rightmost bars represent the background levels. The error bars are standard deviations obtained from 9 replicates.
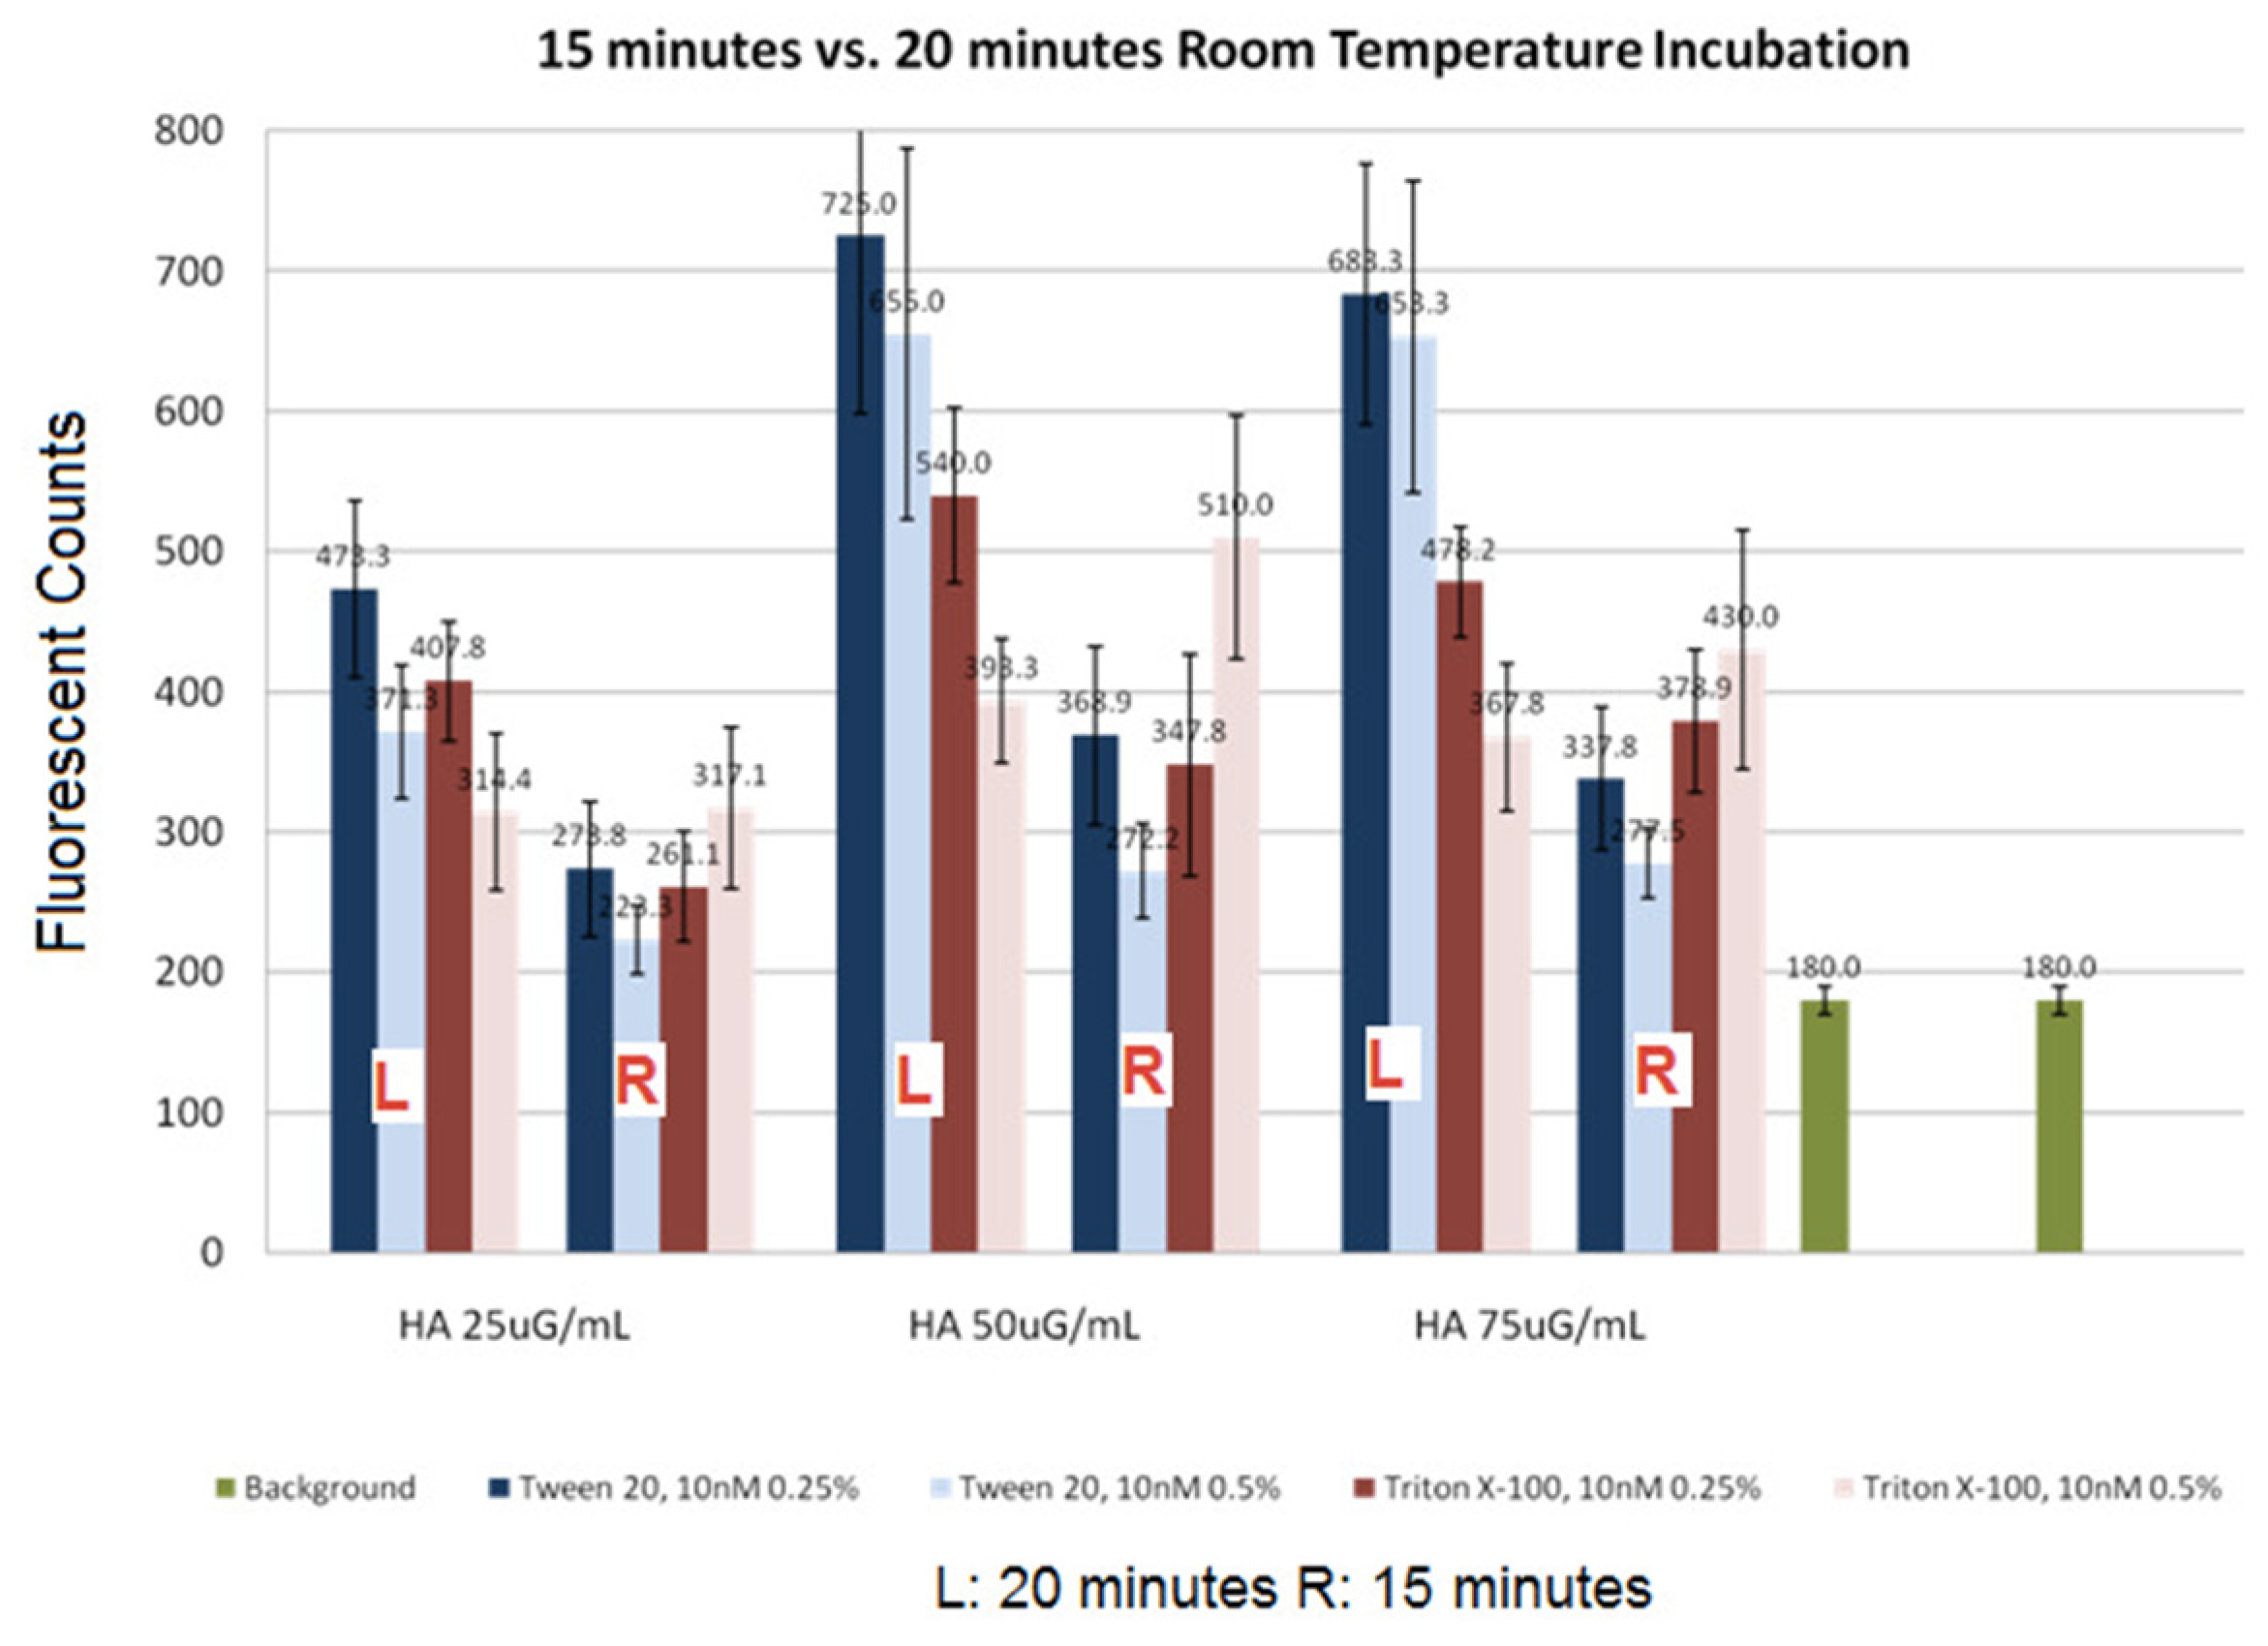
Figure 9.
Enhanced signal detected from specific binding by MAb anti-HA from mouse 17/9 using a streptavidin-coated NBA chip. Binding by anti-HA is specific to the biotinylated HA peptide, with no binding detected to the biotinylated pVIII peptide. The right inset shows the region of anti-HA binding to bioHA. The spots are 100μm by 100μm.
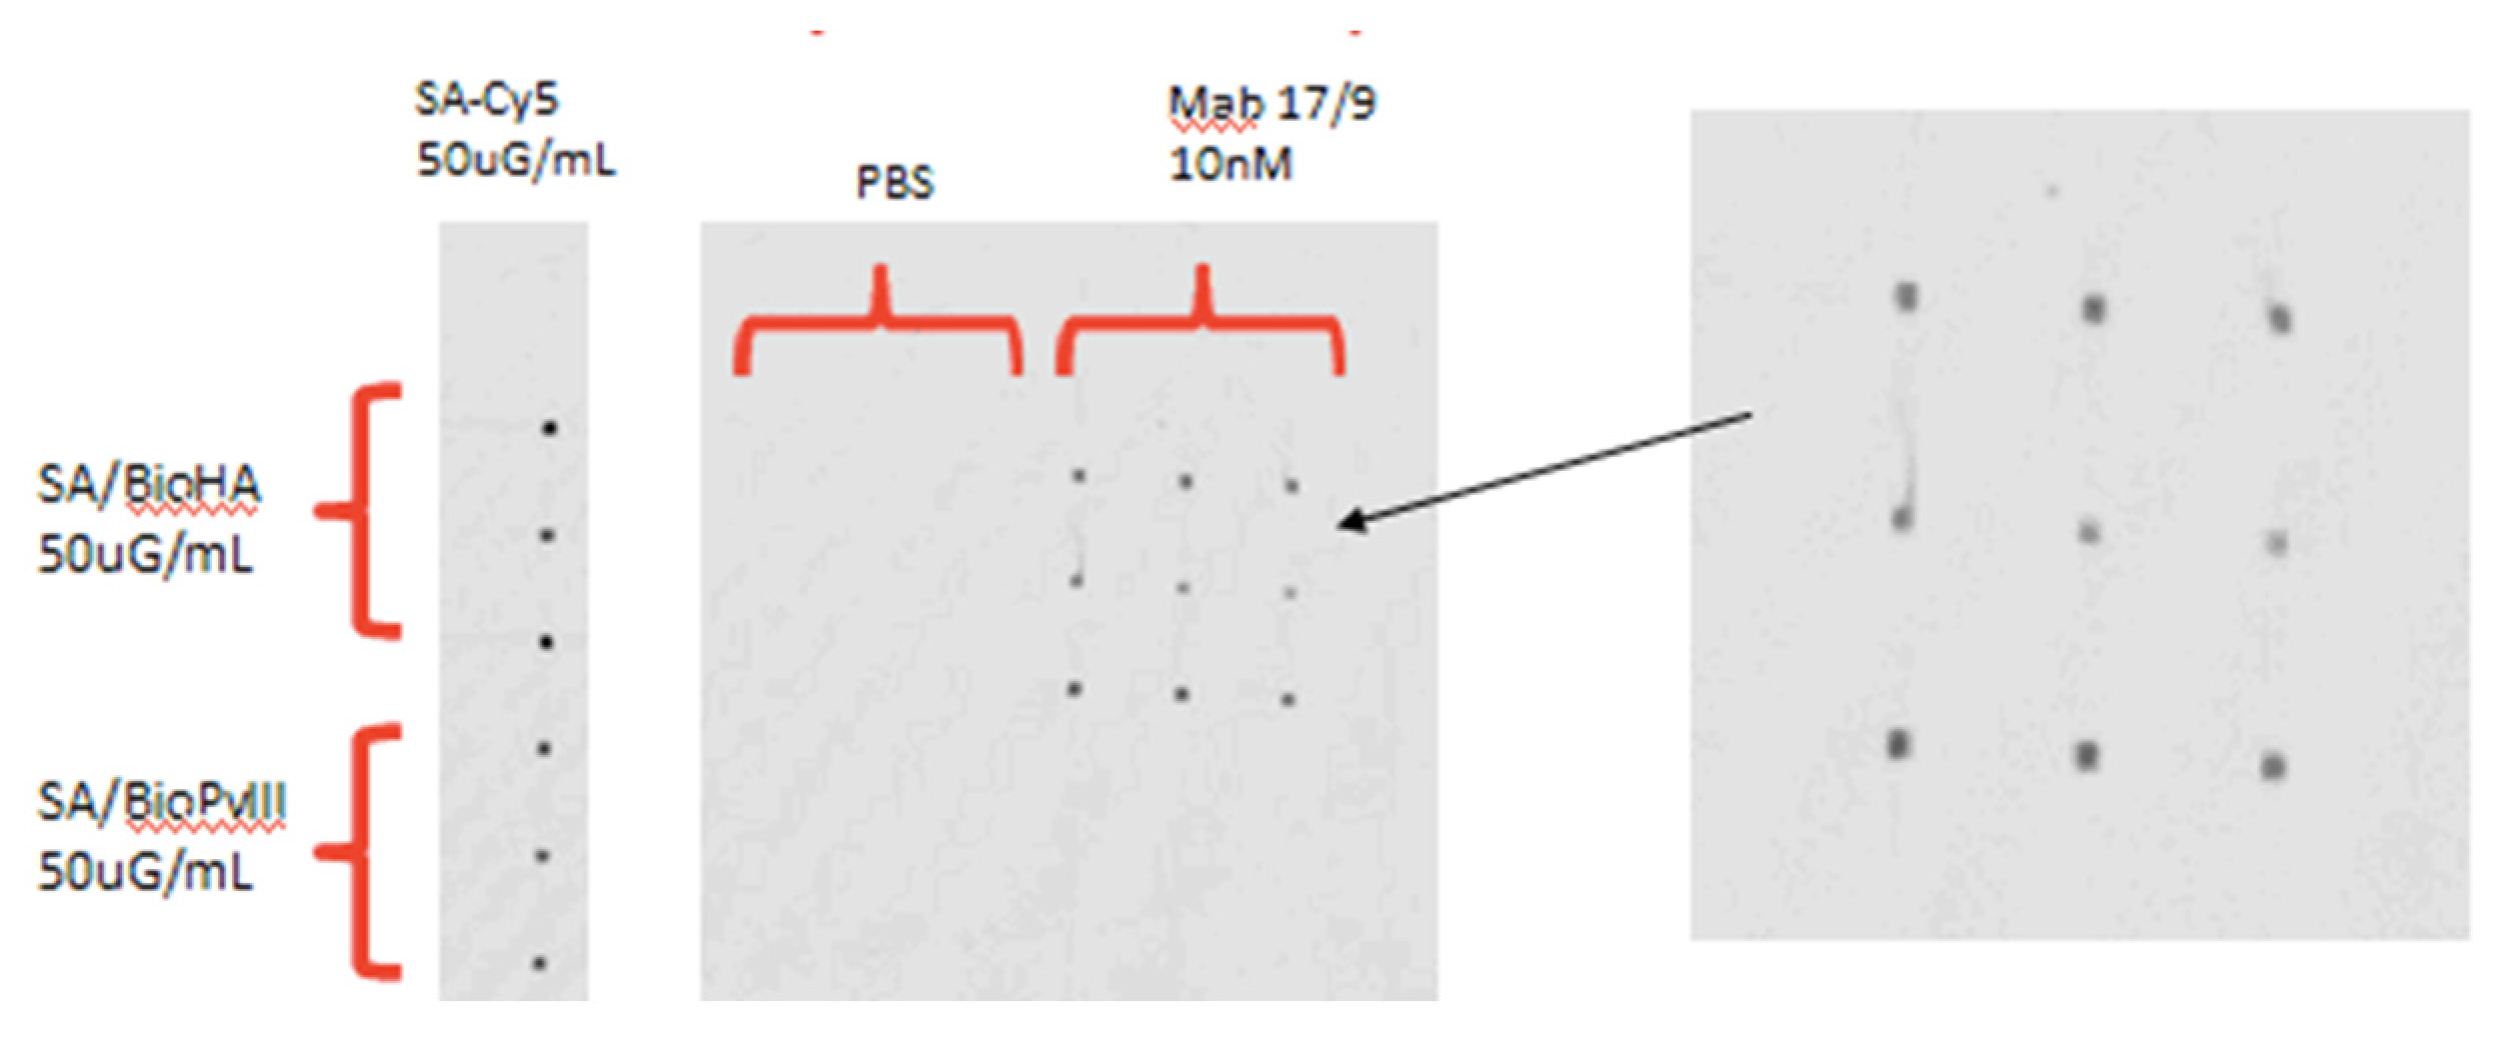
Figure 10.
Comparison of the signal obtained from the radial-first method and the spiral-first method. The spiral-first method shows higher signals at higher antibody concentrations, while the radial-first method shows higher signals at lower concentrations. Spin speed was set to 1300rpm. The error bars were obtained from the standard deviation of 9 replicates.
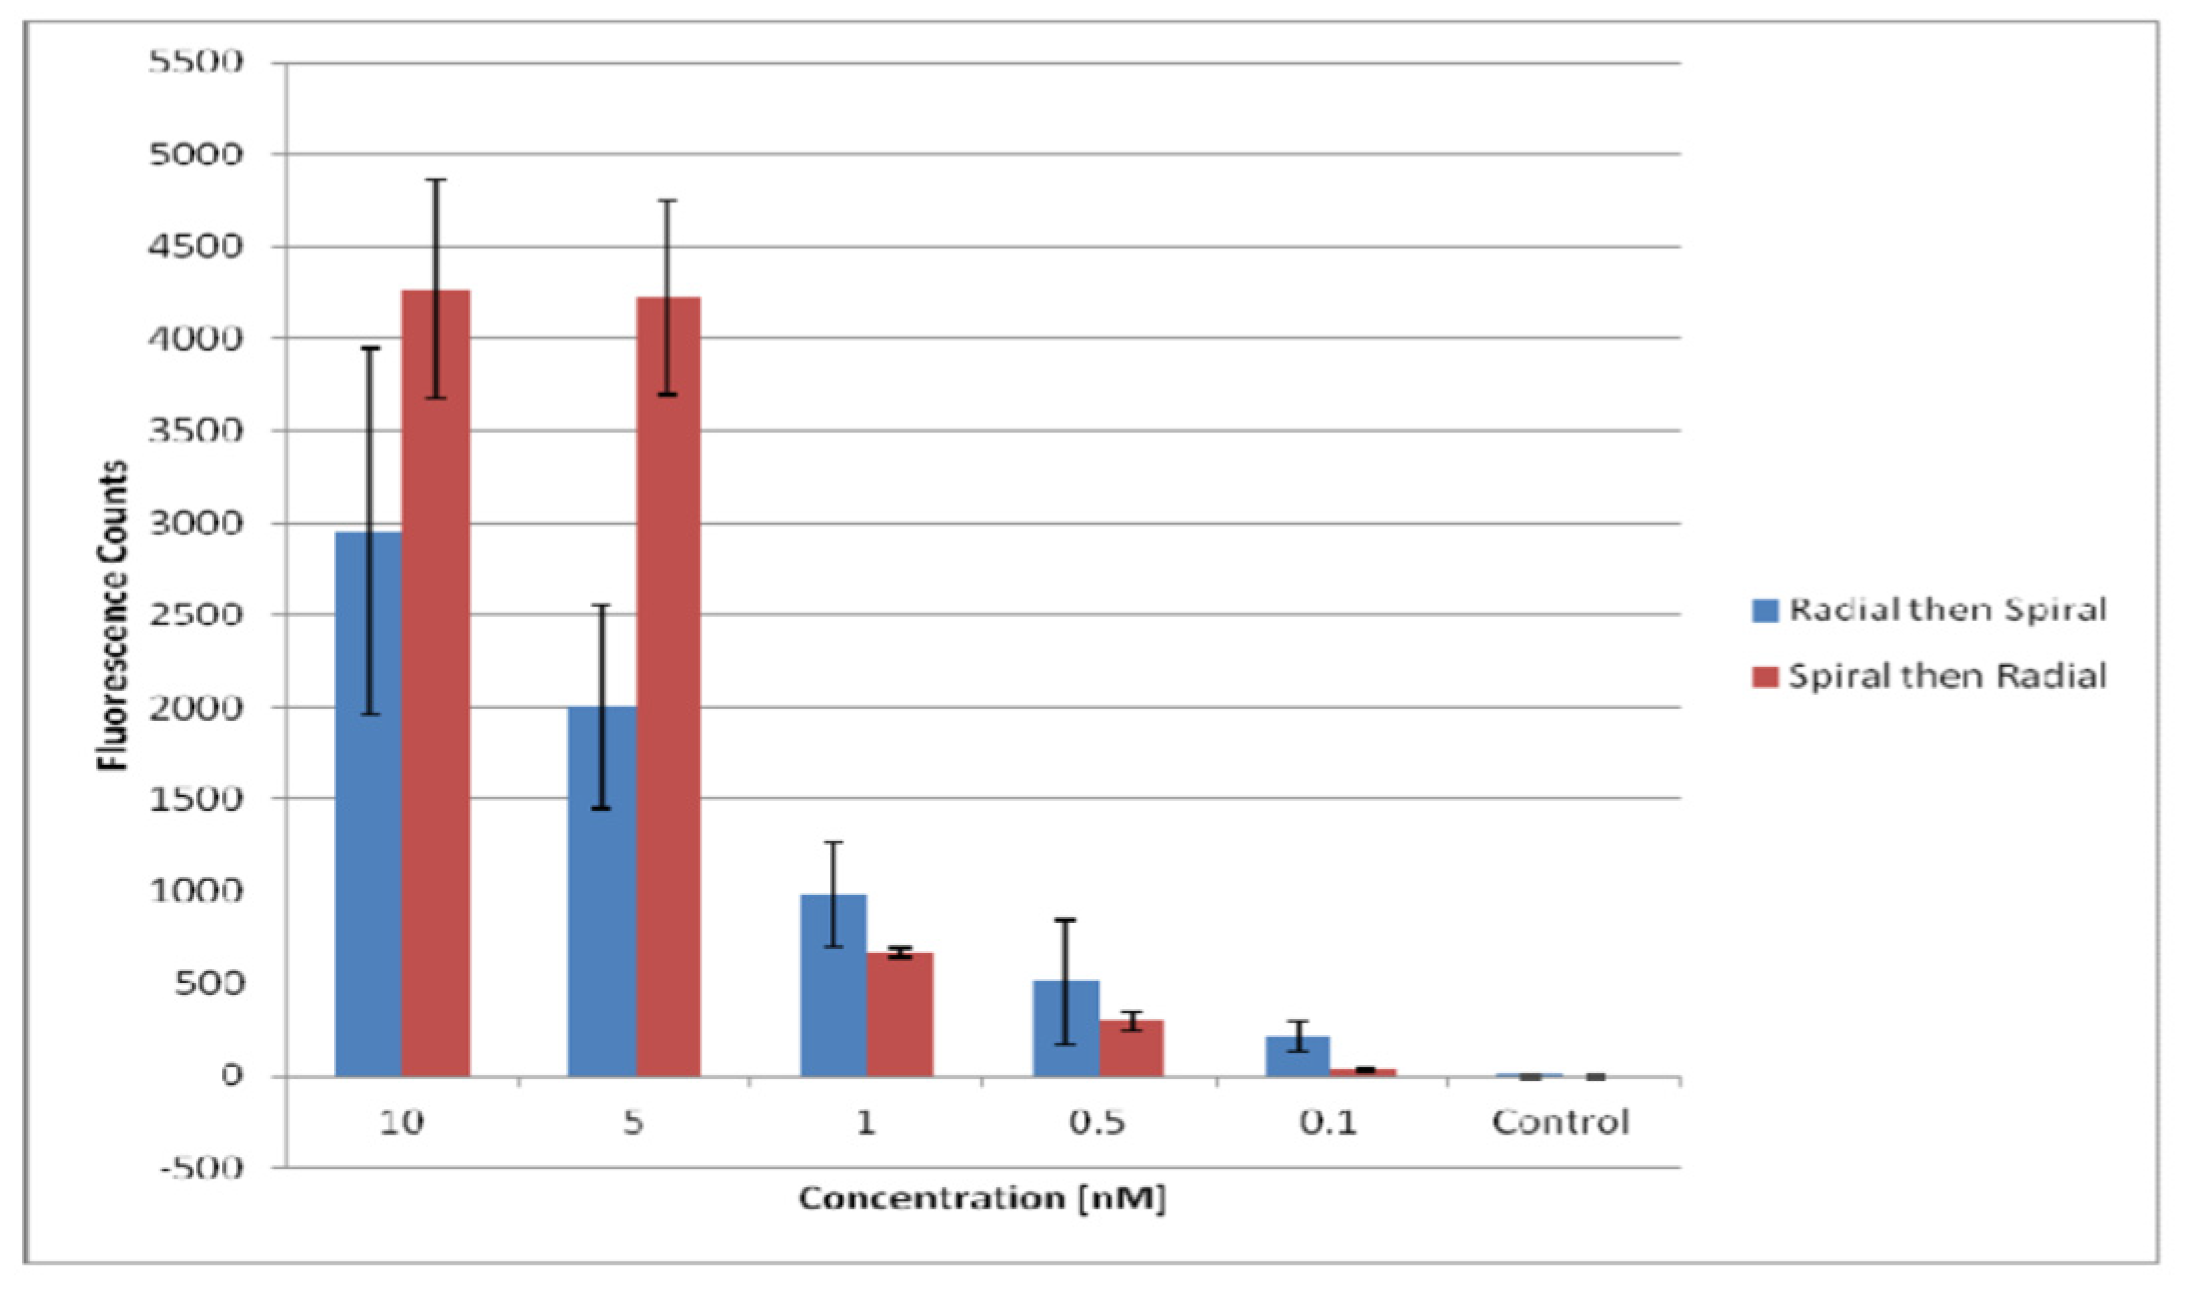
Figure 11.
The signals obtained from the patches near the channel inlet near the chip centre (front) are compared against those near the edge (end) of the spiral chip. Similar signals were obtained from each antibody concentration, showing no sample depletion along the channel. The spin speed for the chip tests acquired was set to 1300rpm. The error bars were obtained from standard deviation of 18 replicates (3x3 replicates from 3 radial probe lines and 3 spiral channels from 2 chips done on the same day).
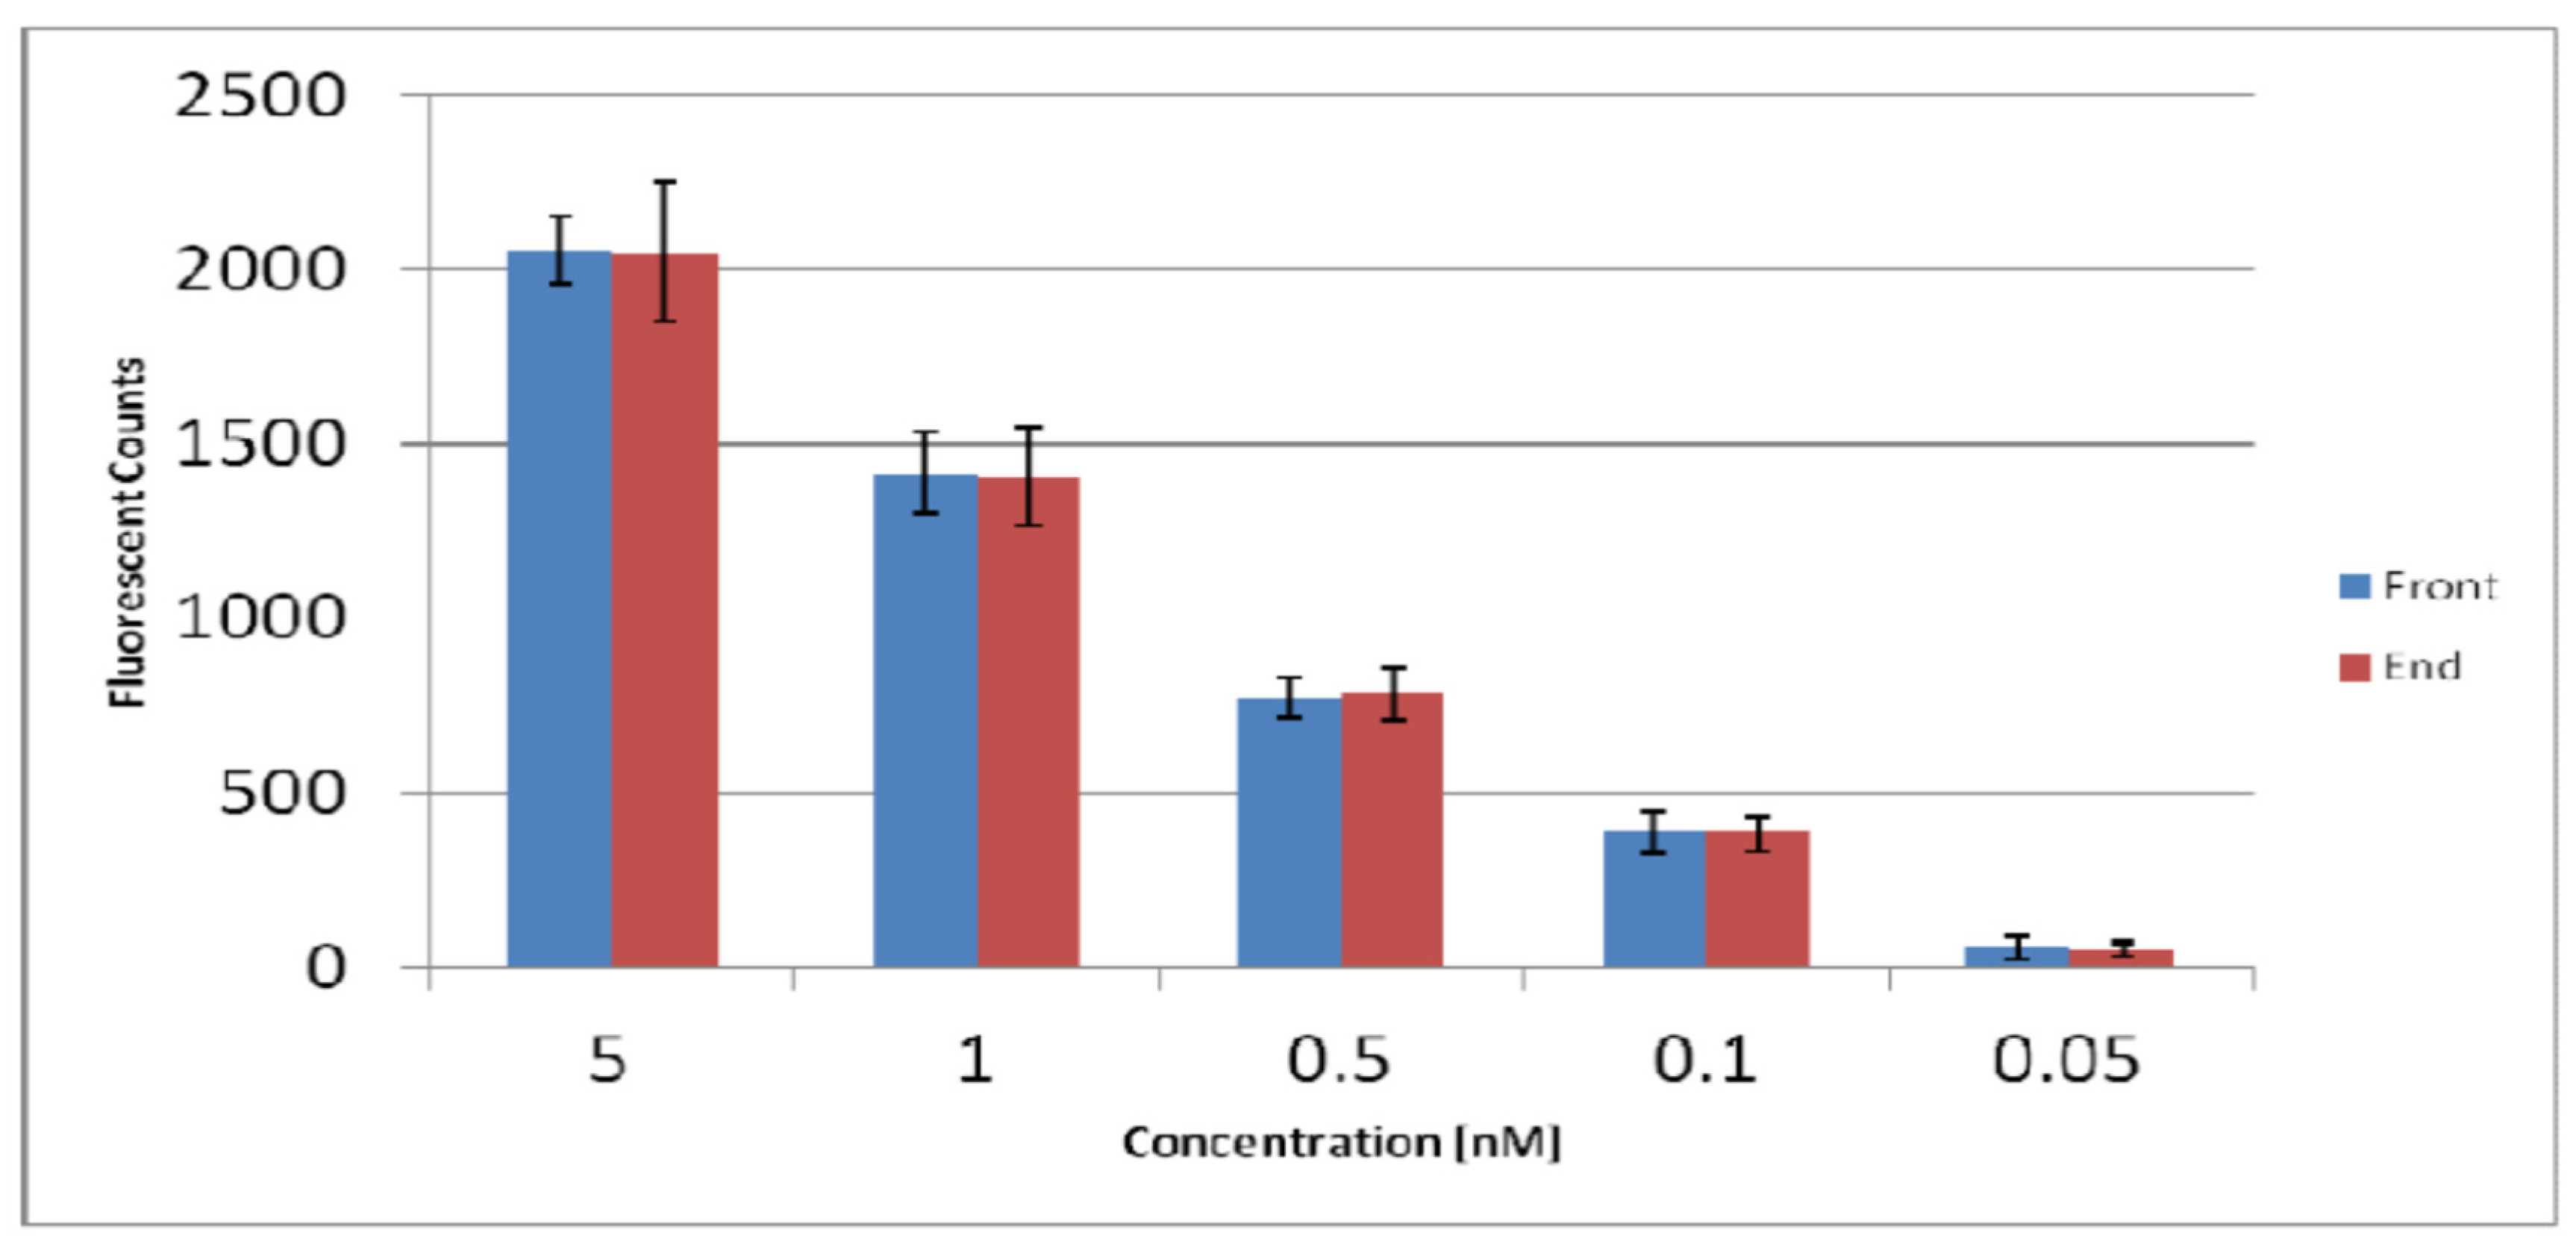
Figure 12.
(a) Results from using bioHA to test samples containing anti-HA MAbs from mouse 17/9 along with ascites (Asc) and supernatant (SN) obtained from immunized 17/9 mice. The serum consisted of anti-pVIII and should not have a response. The error bars were obtained from the standard deviation of 9 replicates. The spots imaged on the spiral chip are 100μm by 100μm in size. (b) The fluorescent counts were plotted against various anti-HA concentrations.
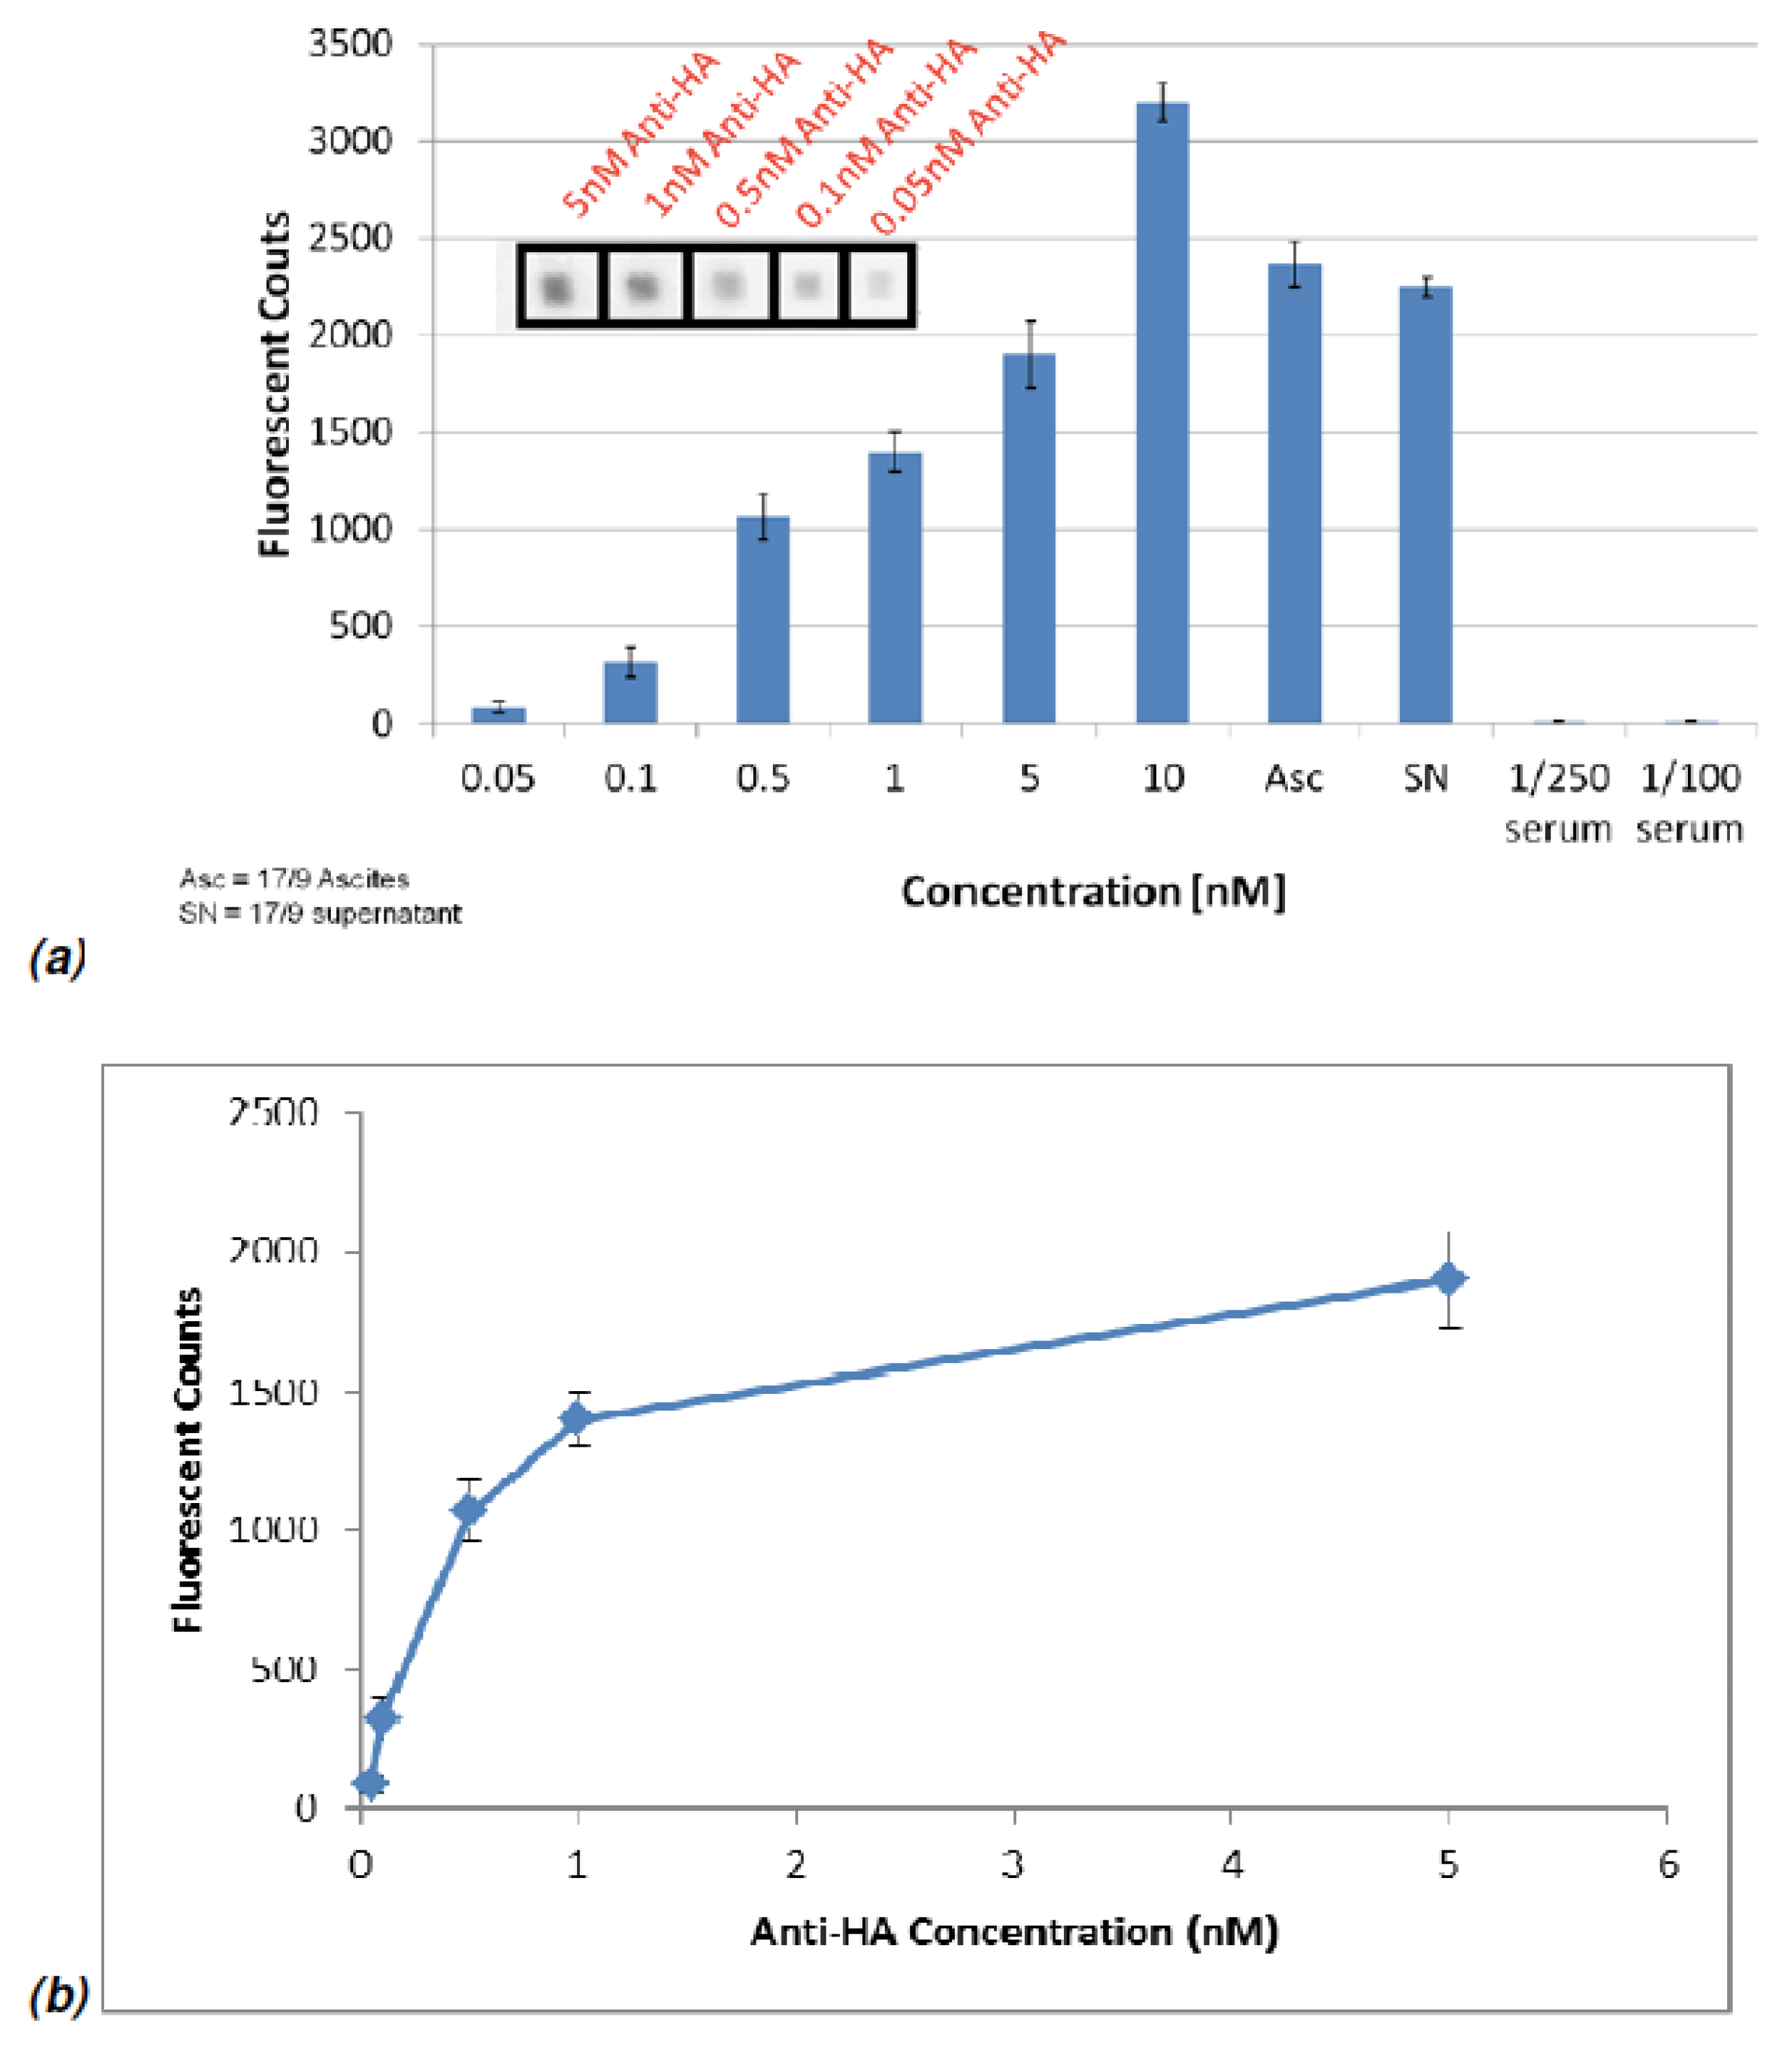
Figure 13.
Detection of samples containing anti-pVIII, which is the mouse serum immunized using the phage coat proteins. BiopVIII (50μg/mL) was used as the peptide probe lines for detection. The spot sizes are 100μm by 100μm.
Figure 13.
Detection of samples containing anti-pVIII, which is the mouse serum immunized using the phage coat proteins. BiopVIII (50μg/mL) was used as the peptide probe lines for detection. The spot sizes are 100μm by 100μm.
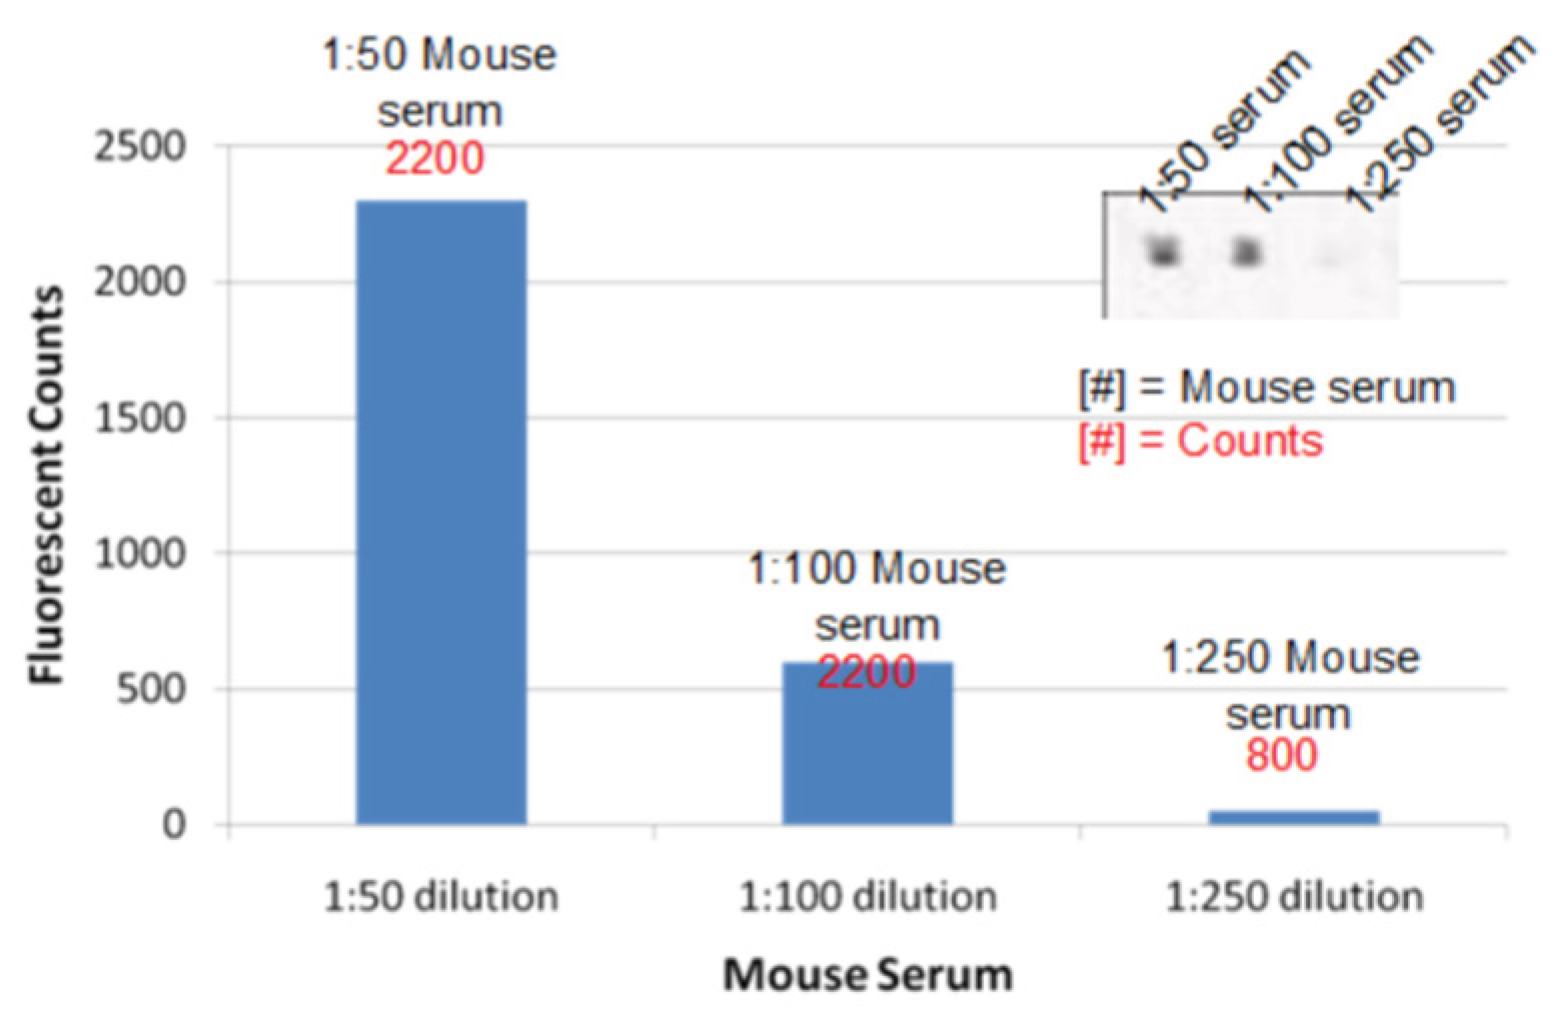

Table 1.
Results of binding of 10 nM of MAb to HA probe using either Triton X-100 (TX-100) or Tween-20 (T-20)
as the surfactant mixed with the antibody sample. Error is standard deviation from 9 replicates.
Table 1.
Results of binding of 10 nM of MAb to HA probe using either Triton X-100 (TX-100) or Tween-20 (T-20)
as the surfactant mixed with the antibody sample. Error is standard deviation from 9 replicates.
 |
Disclaimer/Publisher’s Note: The statements, opinions and data contained in all publications are solely those of the individual author(s) and contributor(s) and not of MDPI and/or the editor(s). MDPI and/or the editor(s) disclaim responsibility for any injury to people or property resulting from any ideas, methods, instructions or products referred to in the content. |
© 2025 by the authors. Licensee MDPI, Basel, Switzerland. This article is an open access article distributed under the terms and conditions of the Creative Commons Attribution (CC BY) license (http://creativecommons.org/licenses/by/4.0/).
Copyright: This open access article is published under a Creative Commons CC BY 4.0 license, which permit the free download, distribution, and reuse, provided that the author and preprint are cited in any reuse.


