
Submitted:
18 December 2025
Posted:
18 December 2025
You are already at the latest version
Abstract
In South Asia, smog has become a serious environmental problem that endangers public health, ecosystems, and the regional climate. To determine the primary causes of smog formation in Lahore in October and November, this study develops a dual analytical framework that combines cutting-edge machine learning with sector- and pollutant-specific emission analysis. To assess their relationship with AQI and create a high-accuracy predictive model, meteorological factors and emission data from key sectors were used to build Random Forest and XGBoost models. The study evaluates the joint effects of weather and emission loads on AQI variability by integrating atmospheric dynamics with comprehensive emission profiles. The XGBoost model forecasts important pollutants from the transportation, industrial, and agricultural sectors, including CO2, NOx, VOCs, and particulate matter, in the second analytical tier. The models consistently identified particulate matter, NOx, and transport-related pollutants as the major determinants of AQI, with high prediction performance (R² > 0.97). The transportation sector accounts for around 90% of Lahore's yearly emissions. These results offer policymakers a useful tool to anticipate air quality, identify important emission sources, and execute targeted initiatives to minimize smog and promote a healthier urban environment. They also clearly demonstrate the causes of atmospheric and sectoral pollution.
Keywords:
air quality prediction
; artificial intelligence
; atmospheric pollution
; environmental sustainability
; smog dynamics
1. Introduction
Urban air quality has declined alarmingly in many parts of the world, with South Asian cities with high population densities continuously ranking among the world’s most polluted. Lahore, Karachi, Kolkata, Dhaka, Delhi and Hanoi regularly rank at the top of global pollution indices, with particulate matter concentrations frequently exceeding World Health Organization (WHO) guidelines, according to annual assessments from international environmental agencies [1]. Lahore is particularly noteworthy among these as a recurrent hotspot, regularly reporting Air Quality Index (AQI) levels in the dangerous range, especially during winter smog seasons. These recurrent trends draw attention to both a local environmental catastrophe and the pressing need to comprehend the fundamental reasons why smog forms in metropolitan areas [2,3]. The cities in East Asia, South Asia, and the Middle East continue to report some of the highest yearly particulate matter concentrations in the world, a concern that is regularly expressed in international literature. Research from Beijing, Shanghai, and Tehran highlights the nonlinear nature of pollution dynamics by highlighting the complicated interplay between anthropogenic emissions and meteorological conditions that drives smog development [4,5,6]. Global assessments collectively indicate that smog rarely comes from a single source, but rather is the result of a complex interaction between meteorological conditions, emission intensities, and occasionally even local topography.
The research interest in South Asia has increased due to the region’s frequent outbreaks of severe air pollution. During peak pollution months, Lahore has consistently recorded PM2.5 levels that are 15–20 times higher than the WHO guidelines [7]. Studies from India (Kolkata and Delhi) identify vehicular emissions, industrial activity, biomass burning, and agricultural residue combustion as major contributors [8,9,10]. The air quality findings have been documented for Lahore, where transportation, industrial estates, brick kilns, and crop stubble burning play significant roles in seasonal pollution spikes [11,12,13]. Furthermore, numerous studies on air transport have shown that the transboundary movement of pollutants across the border between India and Pakistan exacerbates the intensity of smog [14,15]. Figure 1 shows the list of the most polluted cities in the world according to the air quality index [16]. By displaying the AQI measurements recorded in several Lahore locations on November 24, 2025, Figure 2 depicts the regional variations in air quality [17].
Lahore has been selected as the case study for this research due to the city’s significant increase in smog severity over the past decade. Extreme pollution episodes now happen every year, posing serious health concerns to the public. According to recent data, Lahore’s poor air quality causes thousands of premature deaths annually, along with sharp increases in respiratory infections, cardiovascular problems, asthma flare-ups, COPD prevalence, and decreased lung function among vulnerable groups like children, the elderly, and outdoor workers [18]. These results align with epidemiological data from other polluted megacities, including Bangkok, Jakarta, and Delhi [19,20]. In addition to its negative effects on health, smog severely impacts Lahore’s healthcare system and economy, raising socioeconomic vulnerability and causing lost productivity and long-term medical costs. The diseases linked to air pollution exposure in Lahore in 2024 are depicted in Figure 3. It is clear from the data that Lahore’s most often reported illness is respiratory [18]. Given that chronic illness is either directly related to or made worse by extended exposure to particulate matter and other airborne pollutants, this underscores the substantial health burden imposed by declining air quality.
The disease pattern observed in Lahore during the smog season is depicted in Figure 4. According to data from the 2022 smog season, Lahore’s health is significantly impacted by air pollution, with Acute Upper Respiratory Infections (AURI) being the most reported ailment (250,000 cases). Asthma (10,000 instances), pneumonia (5,000 cases), and hypertension (25,000 cases) are also prevalent, indicating the close connection between poor air quality and respiratory or cardiovascular stress. Further evidence that smog has an impact on all facets of health comes from additional incidences of depression (1,000) and pneumonia in children over five (3,000). Overall, the findings verify that the city’s pollution-related disease patterns are dominated by respiratory ailments [21].
The impact of meteorological conditions on smog entrapment is also extensively studied in the literature. Pollutant dispersion is severely restricted both vertically and horizontally by temperature inversions, low wind speeds, high humidity, and little precipitation. Numerous studies attest to the fact that stable air layers that trap pollutants close to the surface cause particulate matter concentrations to rise sharply during the winter. AQI patterns are shaped by the strong interactions between these climatic phenomena and anthropogenic emissions, including traffic density, industrial fuel combustion, urban congestion, and agricultural burning cycles. The process of smog development caused by emissions and meteorology is depicted in Figure 5. Nevertheless, despite the volume of study, most studies only look at emission or meteorological aspects separately rather than understanding them as interrelated components of a single atmospheric system.
Machine learning (ML)-based methods for modeling air quality have been increasingly popular in recent years. Because they can capture nonlinear relationships and high-dimensional interactions, techniques like Random Forest and Gradient Boosting have shown greater prediction performance over traditional statistical methods. While some research concentrates on pollutant-specific prediction frameworks, others show the potential of ML for forecasting AQI using meteorological variables. However, a significant drawback is that many of these models are difficult to understand or do not incorporate meteorological and emission parameters at the same time. These study gaps are particularly noticeable for Lahore, where there are still few thorough, data-driven pollution evaluations. Studies that combine meteorological and emission parameters, use high-accuracy machine learning models, and incorporate interpretability are desperately needed to identify the main sources of pollution. Closing these gaps is essential to creating focused and successful mitigation plans. Driven by these limitations as well as increasing health and environmental problems in Lahore, the current work intends to develop prediction tools to assist evidence-based policymaking while analyzing, modeling, and comprehending thefundamental causes of smog generation. Smog, PM2.5, PM10, NOx, SO₂, ozone, CO, and volatile organic compounds (VOCs) are caused by a variety of emission sources, including burning of agricultural residue, industrial activities, domestic fuel usage, and vehicle activity. Temperature, humidity, wind speed, pressure, and precipitation all influence their atmospheric behavior. Therefore, the combination of climatic conditions and emission inventories is necessary for a thorough assessment. Additionally, this research contributes to SDGs 3 (Good Health and Well-Being) and 11 (Sustainable Cities and Communities), which are worldwide priority for environmental sustainability and public well-being. It aims to assist resilient urban planning and enhance data-driven decision-making by providing analytical tools and prediction models. Table 1 compares the analysis conducted in previous studies on air pollutants and somg.
Recent research that has thoroughly examined the application of machine learning (ML) models for forecasting air quality and determining the main causes of pollution is compiled in Table 1. Models like Random Forest (RF), AdaBoost, Gradient Boosting Regression (GBR), and Artificial Neural Networks (ANN) have been used in India to predict particulate matter (PM2.5 and PM10) and evaluate the effects of stubble burning. AdaBoost achieved the highest accuracy of 98.24%, while RF performed better in PM2.5 prediction [22,25,26,33]. Studies conducted in Pakistan using RF, XGBoost, Logistic Regression, and ANN models to assess pollutants and forecast air quality indices have found that PM2.5 and PM1.0 are major causes of respiratory diseases, with prediction accuracy surpassing 90% [23,24,30]. Like this, ensembles of machine learning models, such as RF, Boosted Regression Trees (BRT), SVM, XGBoost, GAM, Cubist, and recurrent neural networks like RNN, LSTM, and GRU, have been used for daily and street-level air pollutant forecasting in Hong Kong, Kazakhstan, and Macau. Based on cross-validation metrics and correlation coefficients, RF consistently outperforms other models [27,28,32]. Furthermore, the research in Dhaka showed that Random Subspace (RSS) models are very successful for PM2.5 forecasting, while XGBoost and SVR variations have been successfully employed in Eastern China and Lahore for NO₂ and Aerosol Optical Depth (AOD) prediction [29,30,31]. Overall, these investigations demonstrate the adaptability and strong predictive power of both conventional and deep learning-based machine learning models in identifying non-linear connections, temporal patterns, and pollutant-specific impacts in air quality datasets from various geographical locations. All things considered, ensemble models like RF and XGBoost frequently outperformed other machine learning and deep learning techniques in predicting air quality indices and pollutant concentrations, consistently demonstrating higher predictive accuracy across numerous experiments. These models were chosen for the current investigation primarily for this reason.
The innovation of the current study lies in its dual analytical framework. To estimate AQI, it first integrates meteorological and emission factors using sophisticated machine learning models, such as Random Forest and XGBoost, which successfully capture the intricate nonlinear dynamics that drive smog production. Furthermore, by thoroughly analyzing predictor importance and association, the method quantifies each factor’s proportionate contribution to smog levels, offering deeper insights into the main causes of air pollution. Second, the report highlights the industries that contribute most to pollutants that cause smog, highlighting their significant influence on public health and air quality. In addition to improving forecast accuracy, this methodology guarantees interpretability, allowing policymakers to comprehend not just the potential increase in pollution but also its causes and the sectors that need immediate intervention.
2. Materials and Methods
The current study was carried out in two stages to investigate the causes of smog development in Lahore during the winter months of October and November, which have traditionally been linked to significant declines in the region’s air quality. The impact of aggregated emission sources and meteorological factors on AQI variation was investigated in the first phase. To identify the industry and pollutants that most significantly contribute to the creation of smog, the second phase concentrated on the chemical makeup of emissions, specifically CO2, NOx, VOC, and particle matter. Machine learning methods were used for all studies to guarantee interpretability and forecast accuracy. Daily readings of AQI, temperature, wind speed, and total emissions mostly attributable to automobiles and industrial activity were included in the dataset. These observations were gathered from a variety of official repositories and reliable internet sources [17,21,34,35]. Incomplete entries were eliminated, units were confirmed, and variables were aligned to a consistent daily period to clean up the dataset. Correlation matrices and scatter plots were used in feature exploration to find initial connections between AQI and ex-planatory variables. The nonlinear and multidimensional association between the environmental parameters and AQI was modeled using three machine learning models: Random Forest Regressor and XGBoost Regressor. RMSE and R2 were used to assess the model’s performance after the dataset was divided into training (80%) and testing (20%) subsets. The relative contributions of climatic variables and emission sources on smog intensity were ranked using feature relevance ratings and regression coefficients. The model’s generalization and reliability were assessed using residual diagnostics and actual-versus-predicted graphs.Data was examined for smog elements at the next stage. Vehicle emissions, industry emissions, and agriculture emissions were the top three sources of emissions that were examined. Particulate matter (PM), nitrogen oxides (NOx), carbon dioxide (CO₂), and volatile organic compounds (VOC) were calculated for each source. The XGBoost model was trained to accurately predict and capture non-linear correlations in the data. RMSE and R2 measures were used to assess and compare the model’s performance. Google Colab was used to do all analyses in Python. Scikit-learn, XGBoost, Pandas, NumPy, Seaborn, and Matplotlib were among the libraries. In addition to accurately predicting AQI, this two-tiered analytical approach identifies the climatic, source-level, and chemical pollutant components that are mostly to blame for Lahore’s haze. As a result, the study offers a fundamental analytical framework for focused smog reduction tactics, evidence-based policy development, and enhanced urban air quality control. Figure 6 shows the flowchart of the Two-Phase Methodology for analyzing smog formation in Lahore.
2.1. Composition of Smog
Smog is a complicated atmospheric phenomenon that results from the interaction of many emission sources and the current weather. Particulate matter (PM), which includes fine solid or liquid particles like PM2.5 (≤2.5 µm) and PM10 (≤10 µm), is one of its main components. These particles cause smog, respiratory issues, and reduced visibility. Nitrogen oxides (NOx) are mostly released by industrial processes, power plants, and automobile traffic. Equation (1) shows the formation of NO because of the reaction between nitrogen and oxygen. The resulted NO on further reaction with oxygen forms NO2 (see Equation (2)).
When exposed to sunlight, NOx combines with volatile organic compounds (VOCs) to produce secondary particulate matter (see Equation (3)) and ozone (see Equation (4)).
VOCs, which originate from biogenic sources, industrial solvents, and fuel burning, are essential to the development of photochemical smog. While ozone (O₃) develops as a secondary pollutant from the photochemical interaction of NOx and VOCs and frequently dominates the composition of photochemical smog, sulphur dioxide (SO₂), which is mostly generated from the combustion of coal and oil, creates secondary sulphates that contribute to acid smog. The bloodstream’s ability to carry oxygen is hampered by carbon monoxide (CO), a byproduct of incomplete combustion. Other trace gases, including CO₂, methane, and ammonia, also influence atmospheric chemistry (see Equation (5)).
Smog is traditionally divided into two categories: photochemical (Los Angeles-type) smog, which is dominated by NOx, VOCs, and ozone in warm, sunny areas with heavy traffic, and classical (London-type) smog, which is defined by elevated sulphur compounds and PM under cold, humid conditions with coal or industrial emissions. Smog episodes in Lahore are usually a hybrid situation where the main contributors to winter pollution occurrences are PM, NOx, and ozone. Table 2 represents the sources of major smog components.
2.2. Role of Temperature Inversion
A meteorological phenomenon known as temperature inversion occurs when a layer of warm air covers cooler air close to the surface, preventing the typical vertical drop in temperature with altitude that promotes the dispersal of pollutants. Cooler air is trapped beneath the warmer layer during an inversion, which prevents vertical mixing and causes pollutants from burning biomass, industrial activities, and vehicle traffic to build up close to the ground. Due to increased levels of particulate matter (PM), nitrogen oxides (NOx), carbon monoxide (CO), and other smog constituents, the Air Quality Index (AQI) rises noticeably. Long-lasting inversions, which frequently happen on winter mornings and nights, exacerbate smog events, leading to significant decreases in visibility and increased dangers to public health. These inversions are especially noticeable in Lahore between October and November, when calm winds, high emissions, and low nighttime temperatures all combine to create continuous, dense smog. As supported by the results of the current study, these dynamics highlight the crucial role that meteorological variables, such as wind speed, temperature, and humidity, play as important predictors in machine learning models for AQI.
2.3. Experimental Set-up
Two different datasets representing smog drivers in Lahore in October and November were used in the study: (i) meteorological parameters combined with total emissions from vehicles and industry, and (ii) chemical composition of vehicular, industrial, and agricultural emissions, including CO₂, NOx, VOC, and particulate matter (PM). Weather information, emission inventories, and official air quality monitoring stations were the sources of the data. When necessary, features were standardized, especially for the machine learning models, and all datasets were pre-processed to eliminate missing or unusual values. Correlation matrices, scatter plots, and pairwise distributions were used in exploratory data analysis to find early correlations and possible multicollinearity among variables.
The dataset was divided into training (80%) and testing (20%) subsets for predictive modeling using random sampling and a fixed seed to guarantee reproducibility. Two tree-based modeling techniques were used: XGBoost and Random Forest Regressor. The Random Forest models were set up with 100 decision trees, a random seed of 42, and the default mean squared error threshold for node splitting. To reduce overfitting, XGBoost models were trained with 100 estimators, a learning rate of 0.1, a maximum tree depth of 3, and a subsample fraction of 1. To increase prediction performance while maintaining generalization capabilities, preliminary grid searches were used to adjust the hyperparameters for both models. Several measures, such as Root Mean Squared Error (RMSE), Mean Absolute Error (MAE), and coefficient of determination (R2), were used to evaluate the model. The proportionate contribution of each parameter to AQI variability for tree-based models was determined by extracting feature importance scores. To evaluate model fit and identify potential biases, residual analysis and actual versus projected plots were created. To provide insights for focused smog mitigation methods, scenario studies were also conducted in which specific pollutants (such as NOx, CO, VOC, and PM) affected emission type and AQI. Table 3 shows the model configuration and hyperparameters.
3. Results and Discussion
3.1. Influence of Weather and Emissions on AQI
The link between AQI and environmental factors, such as temperature, wind speed, and total emissions from vehicles and industries, was examined in the first phase. The AQI varied significantly between October and November, with daily averages ranging from moderate to extremely hazardous levels, according to descriptive statistics. A comparison of machine learning models for AQI prediction based on emissions and meteorological data is presented in Figure 7. The close alignment of data points along the 1:1 line in the scatter plot indicates that the XGBoost model’s predictive performance for estimating the Air Quality Index (AQI) shows a significant agreement between anticipated and observed values. The model’s low Root Mean Square Error (RMSE = 4.5) and high coefficient of determination (R² = 0.987) show that the model explains around 98.7% of the variance in AQI and that projected AQI values differ very little from actual measurements. This high degree of precision is a result of XGBoost’s capacity to capture intricate nonlinear correlations between anthropogenic emissions, such as those from vehicles and industry, and meteorological data, such as temperature and wind speed. Overall, the model offers solid and trustworthy AQI estimation for the dataset, while slight departures from the ideal line point to localized prediction errors that might result from temporal variations in emissions or unmodeled environmental conditions. With a reduced RMSE of 3.3 and a R² of 0.988, the Random Forest (RF) model performs similarly to XGBoost, suggesting a little better fit in terms of variance explanation and smaller total prediction errors. Based on meteorological and emission data, the RF model successfully captures the overall patterns in AQI, indicating its applicability for predictive tasks requiring nonlinear and multivariate inputs. However, where precise capture of variability and rare events is crucial, small variations in scatter patterns and sensitivity to extreme AQI values may favor XGBoost. Both models show good predictive ability when combined, with Random Forest delivering somewhat lower RMSE and XGBoost enabling robust modeling of complex interactions. This highlights the significance of model selection based on AQI prediction targets and data features.
The Random Forest (RF) and XGBoost models’ variable importance analysis reveal variations in the relative contributions of meteorological and emission parameters to AQI prediction. Vehicle emissions had the largest coefficient value (0.46) in the RF model, as seen in Figure 8, showing a dominant influence on AQI fluctuation. Wind (0.31) and temperature (0.27) follow, while industrial emissions contribute the least (0.22). This indicates that while meteorological factors have a moderate impact on air quality, the RF model prioritizes direct anthropogenic causes, especially automobile activity. The XGBoost model, on the other hand, displays a somewhat different distribution of coefficients, as seen in Figure 9. The most significant predictor is still vehicle emissions (0.32), but industrial pollutants (0.15) have a somewhat smaller effect than in RF, while wind (0.31) and temperature (0.25) contribute more evenly. This suggests that XGBoost’s gradient boosting technique, which can model nonlinear dependencies and inter-variable effects, captures more complex relationships between meteorological variables and emissions. In contrast, XGBoost distributes impact more evenly among contributing parameters, indicating increased sensitivity to environmental modulators like temperature and wind, whereas RF gives more weight to the major source of pollution (vehicle emissions). Together, these findings highlight the fact that, although both models acknowledge vehicle emissions as the primary cause of AQI, XGBoost provides a more thorough depiction of the combined effects of anthropogenic activities and meteorology, potentially increasing prediction accuracy for complicated or variable air quality scenarios.
3.2. Effect of Emission Composition
Phase 2 used the XGBoost regression model to examine the impact of individual emission elements on the production of smog. The four main pollutants that contribute to emissions, NOx, CO, VOC, and PM, were the focus of the analysis. Because of its superior predictive ability in structured datasets, its gradient-boosting mechanism that gradually improves model accuracy, its capacity to capture subtle nonlinear pollutant interactions, and its improved performance in handling imbalanced or noisy data through built-in regularization, as confirmed by prior research, XGBoost was selected [36,37,38]. The government organization’s disclosed data on real pollutant concentrations made up the dataset [21,35].
A sector-by-sector breakdown of Lahore’s total annual emissions is shown in Figure 10, which also shows the relative contributions of industry, transportation, agriculture, and other smaller sources. According to the pie chart, transportation emissions account for around 90% of the city’s annual emissions, with the industrial, agricultural, and miscellaneous sectors contributing only 4%, 4%, and 2%, respectively. This unequal distribution emphasizes how crucial vehicle activity is in determining Lahore’s air pollution environment.
Pie charts in Figure 11 further break down emissions by pollutant type, including NOx, CO, VOC, and PM, within each sector. Due to the combustion inefficiency of older cars and two-stroke engines that are frequently employed in the area, transportation emissions show a clear dominance of PM and CO. The distribution of vehicle-related emissions in Lahore is depicted in Figure 12’s log-scaled bar chart, which reveals a clear dominance of motorbikes, which significantly contribute the biggest pollution load. Auto-rickshaws, which also have significant emissions because of their frequent use and comparatively inefficient engines, are the second-largest source after cars. Two-wheelers and small personal vehicles are the main sources of emissions in the city’s transportation sector, as the logarithmic scale emphasizes. The larger percentage of NOx in industrial emissions, as depicted in Figure 11, is indicative of fuel-intensive thermal processes, boiler operations, and manufacturing activities. On the other hand, agricultural emissions exhibit a higher percentage of PM and VOCs, which is consistent with soil-based volatilization processes, residue burning, and open-field biomass combustion. Collectively, this multi-layered representation demonstrates not only the overwhelming contribution of the transport sector but also the pollutant-specific signatures of each emission source, thereby offering critical insights for designing targeted mitigation strategies.
A thorough XGBoost model-performance evaluation for forecasting pollutant concentrations (NOx, VOCs, CO, and PM) across three key emission sectors—transportation, industry, and agriculture are shown in Figure 13 and Figure 14, and 15 below. Each subplot shows the accuracy and resilience of the used machine learning model by comparing predicted versus real values along with the coefficient of determination (R²) and the Root Mean Square Error (RMSE). For all four pollutants, NOx, VOCs, CO, and PM, the transport emission results in Figure 13 show extremely dependable forecast performance. Strong agreement between expected and observed values is shown by the scatter plots, which show a close clustering of data points around the 1:1 reference line. The high R2 values (0.986–0.991), which verify that the model accounts for nearly all the variability in emissions due to transportation, further support this. The model’s ability to capture the nonlinear features of vehicle emissions is confirmed by the comparably low RMSE values, which imply minimal prediction error. These results undervalue the model’s ability to accurately depict fuel combustion patterns, vehicle fleets, and traffic dynamics.
The model continues to provide high predictive capability across NOx, VOCs, CO, and PM for industrial emissions, as illustrated in Figure 14. The model well captures the emission behaviour related to industrial operations, such as fuel combustion, chemical processing, and manufacturing activities, as seen by the R2 values, which vary from 0.953 to 0.987. The predictions are still well aligned with the 1:1 line, and the RMSE values are still rather low, indicating controlled error margins, despite a small dispersion when compared to transport emissions. The model’s capacity to manage the variability seen in industrial sources where emission rates frequently vary on operational schedules, process loads, and combustion efficiency is demonstrated by this result. Overall, the findings support the model’s ability to accurately measure emissions in intricate industrial settings.
With R2 values ranging from 0.985 to 0.989, the agricultural emission plots shown in Figure 15 likewise demonstrate great predictive accuracy, confirming the robust linear relationship between actual and expected pollutant concentrations. The model effectively replicates the emission patterns linked to agricultural operations such as residue burning, soil emissions, and fertilizer-induced volatilization, as evidenced by the low RMSE values. The model maintains a nearly perfect alignment of data points around the ideal prediction line despite the seasonal and spatial variability typical of agricultural activities. This consistency shows how well the model captures intermittent and diffuse agricultural emission sources. Overall, the findings confirm that the model is appropriate for accurately estimating the contributions of pollutants resulting from agricultural operations.
4. Mitigation Strategies and Solutions
According to the investigation, the main causes of Lahore’s haze are industrial and vehicle emissions, with particulate matter (PM) and nitrogen oxides (NOx) being the most dangerous pollutants. Specific mitigation techniques are suggested to deal with these sources. In addition to strict emission testing and regulatory compliance, the promotion of cleaner fuels, such as compressed natural gas (CNG), electric, and hybrid vehicles, can help control vehicle emissions. When paired with the growth of reasonably priced and effective public transportation, traffic management strategies including odd-even plans, dedicated public transportation lanes, and intelligent traffic signal systems can further lower emissions from private vehicles. Real-time pollutant monitoring, the use of cleaner production technologies like low-NOx burners and particulate filters, and stringent regulatory compliance with emission reduction incentives are all examples of industrial emission reduction measures. In addition to dust management techniques including road sweeping, water sprinkling, and construction site regulations, NOx and PM reduction should be the top priorities in pollution control initiatives. Increasing urban green spaces and scheduling high-emission activities during windy periods are two examples of meteorology-based initiatives that can help disperse pollutants and serve as natural air filters.
Reducing exposure and encouraging behavioral change need public awareness and health interventions, such as real-time AQI notifications, the use of protective masks and interior air purifiers, and citizen education programs. For proactive smog mitigation, policy recommendations prioritize integrated air quality management, incentives for low-emission technologies, and data-driven decision-making using predictive machine learning models. It is anticipated that putting these methods into practice will lower AQI levels, minimize hazards to cardiovascular and respiratory health, and support Sustainable Development Goals 11 (Sustainable Cities and Communities) and 3 (Good Health and Well-being). By utilizing a machine learning model to integrate emission sources, pollutant content, and meteorological conditions, this study takes a thorough, multi-layered approach. While the second phase identifies NOx, CO, VOC, and PM as the primary contributors to hazardous smog, in line with regional health impact studies, the first phase emphasizes the substantial impact of vehicular emissions, industrial output, and climatic circumstances on daily AQI. The largest source of carbon monoxide (CO) emissions was found to be vehicles. Subsequent investigation reveals that outdated automobiles and two-stroke motorcycles are the main culprits because incomplete combustion in these engines raises CO levels. Furthermore, high particulate matter (PM) concentrations are linked to both agricultural practices and vehicle emissions, especially in the winter when atmospheric conditions encourage pollutant deposition.
Prioritizing the most effective interventions is made possible by the deployment of machine learning models, which also provide accurate AQI prediction and interpretability through feature importance assessment. Ensemble modeling improves the findings’ dependability and policy relevance by capturing non-linear relationships between emissions and weather. While highlighting real-time AQI monitoring and public awareness as essential elements for proactive response, the study’s findings guide focused mitigation techniques, such as emission control, dust suppression, industry regulation, and public transportation augmentation. The research shows wider socioeconomic and health advantages by connecting interventions to SDGs. The innovative two-phase approach, which combines source attribution and pollutant-level analysis, offers a practical framework for managing urban air quality in megacities in South Asia. It may also be applied to other high-pollution metropolitan areas. To further improve policy impact and public health outcomes, future research should include scenario-based simulations, interactive dashboards, long-term, multi-seasonal datasets, high-resolution real-time monitoring, and sophisticated causal and predictive analyses using techniques like SHAP or LSTM models.
5. Conclusions
The current study presents a rigorous, data-driven assessment of smog formation in Lahore by integrating meteorological variables, pollutant profiles, emission inventories, pollutant profiles, and advanced machine learning models. The two-phase analytical framework evaluates total emissions and weather influences, followed by pollutant-specific toxicity that provides clear evidence that vehicular emissions, industrial activities, and adverse meteorological conditions are the primary drivers of elevated AQI levels. Both Random Forest and XGBoost models exhibited excellent predictive capability, with RF achieving an R² of 0.988 and RMSE of 3.25, while XGBoost consistently maintained high accuracy across all emission categories. Feature-importance analysis further identified CO, NOx, VOCs, and particulate matter as the most critical contributors to smog severity.
The findings not only permit accurate short-term AQI forecasting but also propose actionable guidance for emission reduction policies, prioritizing vehicular regulation, industrial control, and targeted mitigation of high-toxicity pollutants. By linking emission dynamics with public health risks, visibility deterioration, and relevant Sustainable Development Goals (SDG 3 and SDG 11), the research provides a practical and policy-oriented framework for improving urban air quality.
Generally, the current study demonstrates that integrating machine learning–based prediction with holistic emission and meteorological analysis yields a robust, scalable model for evidence-based smog mitigation. The methodology establishes a transferable template for other megacities confronting similar air quality challenges and strengthens the scientific foundation for sustainable urban environmental management.
Author Contributions
Conceptualization, S.Z. and M.A.I.M.; methodology, S.Z. and M.A.I.M.; software, S.Z. and M.A.I.M.; validation, S.Z. and M.A.I.M.; formal analysis, S.Z. and M.A.I.M.; investigation, S.Z. and M.A.I.M.; data curation, S.Z. and M.A.I.M.; project administration, M.A.I.M.; writing original draft preparation, S.Z. and M.A.I.M.; writing review and editing, S.Z. and M.A.I.M.
Funding
This research received no external funding.
Data Availability Statement
The data supporting this study can be accessed from the authors upon reasonable request.
Acknowledgments
The authors gratefully acknowledge the University of Central Punjab, Lahore and the University of Technology Sydney for supporting the study.
Conflicts of Interest
The authors declare no conflicts of interest.
Abbreviations
The following abbreviations are used in this manuscript:
| ANN | Artificial Neural Network |
| AQI | Air Quality Index |
| AR | Additive Regression |
| AURI | Acute Upper Respiratory Infections |
| BRT | Boosted Regression Trees |
| GAM | Generalized Additive Model |
| GBR | Gradient Boosting Regression |
| GRU | Gated Recurrent Unit Network |
| GWO | Grey Wolf Optimizer |
| LSTM | Long Short-Term Memory Network |
| REPT | Reduced Error Pruning Tree, |
| RF | Random Forest |
| RNN | Recurrent Neural Network |
| RT | Random Tree |
| RSS | Random Subspace |
| SVM | Support Vector Machine |
| SVR | Support Vector Regression |
References
- World Air Quality Report. 2024.
- Abhranil, B., et al., Assessing AQI of air pollution crisis 2024 in Delhi: its health risks and nationwide impact. Discover Atmosphere, 2025. 3(13). [CrossRef]
- Abdul, R., et al., Smog: Lahore needs global attention to fix it. Environmental Challenges, 2024. 16: p. 100999. [CrossRef]
- Ying, Z., C. Song Xi, and B. Le, Air pollution estimation under air stagnation—A case study of Beijing. Environmetrics, 2023. 34(6): p. e2819. [CrossRef]
- Zheng, X., et al., Characterization and sources of volatile organic compounds (VOCs) during 2022 summer ozone pollution control in Shanghai, China. Atmospheric Environment, 2024. 327(15): p. 120464. [CrossRef]
- Amir, G. and G. Davoud, Identifying the Causes of Air Pollution in the Tehran Metropolis-Iran and Policy Recommendations for Sustainability. Aerosol Science and Engineering, 2025. [CrossRef]
- Rabia, M., et al., Solving the mysteries of Lahore smog: the fifth season in the country. Frontiers in Sustainable Cities, 2024. 5: p. 1314426. [CrossRef]
- Prakash Chand, K., Air Pollution in Delhi: Causes and Consequences, in Combating Air Pollution 2024, Springer, Cham. p. 61-75.
- Kinjal, B. and S. Vishal. Sustainable Solutions for Delhi’s Air Pollution: A Data Driven Approach. in 1st International Conference on Advanced Materials for Sustainable Innovation. 2025. New Delhi, India: Springer, Singapore.
- Ashima, S. and M. Renu, Rising Extreme Event of Smog in Northern India: Problems and Challenges, in Extremes in Atmospheric Processes and Phenomenon: Assessment, Impacts and Mitigation 2022, Springer, Singapore. p. 205-236.
- Muhammad, N.-u.-M., Z. Masooma, and J. Muhammad, Exploring mitigation strategies for smog crisis in Lahore: a review for environmental health, and policy implications. Environmental Monitoring and Assessment, 2024. 196: p. 1296.
- Shazia, I., et al., Impact of Air Pollution and Smog on Human Health in Pakistan: A Systematic Review. Environments, 2025. 12(2): p. 46. [CrossRef]
- Aiman, F. and B. Derk, Assessment of Brick Kilns’ contribution to the air pollution of Lahore using air quality dispersion modeling. Environmental Monitoring and Assessment, 2025. 197: p. 318. [CrossRef]
- Uzma, N. and I. Muhammad, Smog diplomacy: Strengthening Pakistan-India cooperation for transboundary air pollution. Journal of Climate and Community Development, 2025. 4(1): p. 55-65.
- Muhammad, Z., Spatiotemporal analysis of tropospheric nitrogen dioxide hotspot over Lahore Division in Pakistan. Discover Environment 2025. 3: p. 113.
- IQAir. Live most polluted major city ranking. 2025; Available from: https://www.iqair.com/us/world-air-quality-ranking.
- Agency, E.P. and P. Government of Punjab. AQI Punjab. 2025; Available from: https://aqi.punjab.gov.pk/.
- System, D.H.I. Disease Wise Analytics. 2024 [cited November, 2024; Available from: https://dhispb.com/.
- Rachna, A., et al., Assessing Respiratory Morbidity Through Pollution Status and Meteorological Conditions for Delhi. Environmental Monitoring and Assessment, 2006. 114: p. 489-504. [CrossRef]
- Mario J., M. and M. Luisa T., Megacities and Atmospheric Pollution. Journal of the Air & Waste Management Association 2004. 54: p. 644-680.
- The Urban Unit Government Office, P. The Urban Unit. 2022 [cited November, 2024; Available from: https://urbanunit.gov.pk/.
- Siddiqui, S.A., F. Neda, and A. Anwar, Smart air pollution monitoring system with smog prediction model using machine learning. International Journal of Advanced Computer Science and Applications 2021. 12(8): p. 401-409.
- Pervaiz, Z., et al., Predictive Analysis of Smog Exposure and Its Impact on Human Health Outcomes. Journal of Computing & Biomedical Informatics, 2025. 9(2).
- Muhammad Fahad, M., et al., Predicting Air Quality in Pakistan with a Focus on Smog Formation: A Machine Learning Approach, in International Conference on Engineering and Emerging Technologies (ICEET). 2024, IEEE: Dubai, UAE.
- Sandhya, S. and S. Arun, Machine learning approach to PM2.5 forecasting and health risk assessment during stubble burning period in Delhi. Aerosol Science and Technology, 2025. 59(11): p. 1385-1404. [CrossRef]
- R, A. and B. M, Stubble Burning and Its Impact in Delhi’s Air Pollution of india: Predictive Approach Using Machine Learning Applied Ecology & Environmental Research, 2025. 23(4).
- Zhiyuan, L., Y. Steve Hung-Lam, and H. Kin-Fai, High temporal resolution prediction of street-level PM2.5 and NOx concentrations using machine learning approach. Journal of Cleaner Production, 2020. 268: p. 121975.
- Thomas M. T., L., et al., Evaluation of Machine Learning Models in Air Pollution Prediction for a Case Study of Macau as an Effort to Comply with UN Sustainable Development Goals. Sustainability, 2024. 16(17): p. 7477.
- Yanchuan, S., et al., Estimation of daily NO2 with explainable machine learning model in China, 2007–2020. Atmospheric Environment, 2023. 314: p. 120111. [CrossRef]
- Komal, Z., S. Sana, and T. Salman, Prediction of aerosol optical depth over Pakistan using novel hybrid machine learning model. Acta Geophysica, 2023. 71: p. 2009-2029.
- Abu Reza Md. Towfiqul, I., et al., Estimating ground-level PM2.5 using subset regression model and machine learning algorithms in Asian megacity, Dhaka, Bangladesh. Air Quality, Atmosphere & Health 2023. 16: p. 1117-1139.
- Alibek, I., R. Nurtugan, and A. Aizhan, Predicting particulate matter (PM2.5) air pollution levels in Almaty city using machine learning techniques. Modeling Earth Systems and Environment, 2025. 11: p. 236.
- Gokulan, R., et al., Air quality prediction by machine learning models: A predictive study on the indian coastal city of Visakhapatnam. Chemosphere, 2023. 338: p. 139518. [CrossRef]
- AccuWeather, Lahore, Pakistan. 2025 [cited 2025; Available from: https://www.accuweather.com/en/pk/lahore/260622/weather-forecast/260622.
- Punjab Development Statistics. 2021 [cited November, 2024; Available from: https://bos.punjab.gov.pk/sites/bos.punjab.gov.pk/files/PDS%202021.pdf.
- Sevtap, T., Machine learning-based forecasting of air quality index under long-term environmental patterns: A comparative approach with XGBoost, LightGBM, and SVM. PLoS One, 2025. 20(10): p. e0334252.
- Rudy, W., P. Mauridhi Hery, and A. Wiwik. Enhancing Predictive Emissions Monitoring Performance: Data Preprocessing for XGBoost-Based Model Algorithm. in 17th International Conference on Knowledge and Smart Technology. 2025. Bangkok, Thailand: IEEE.
- Stefan, W., et al., Hourly Particulate Matter (PM10) Concentration Forecast in Germany Using Extreme Gradient Boosting. Atmosphere 2024. 15(5): p. 252. [CrossRef]
Figure 1.
Most polluted cities as per 10th December 2025 statistics.
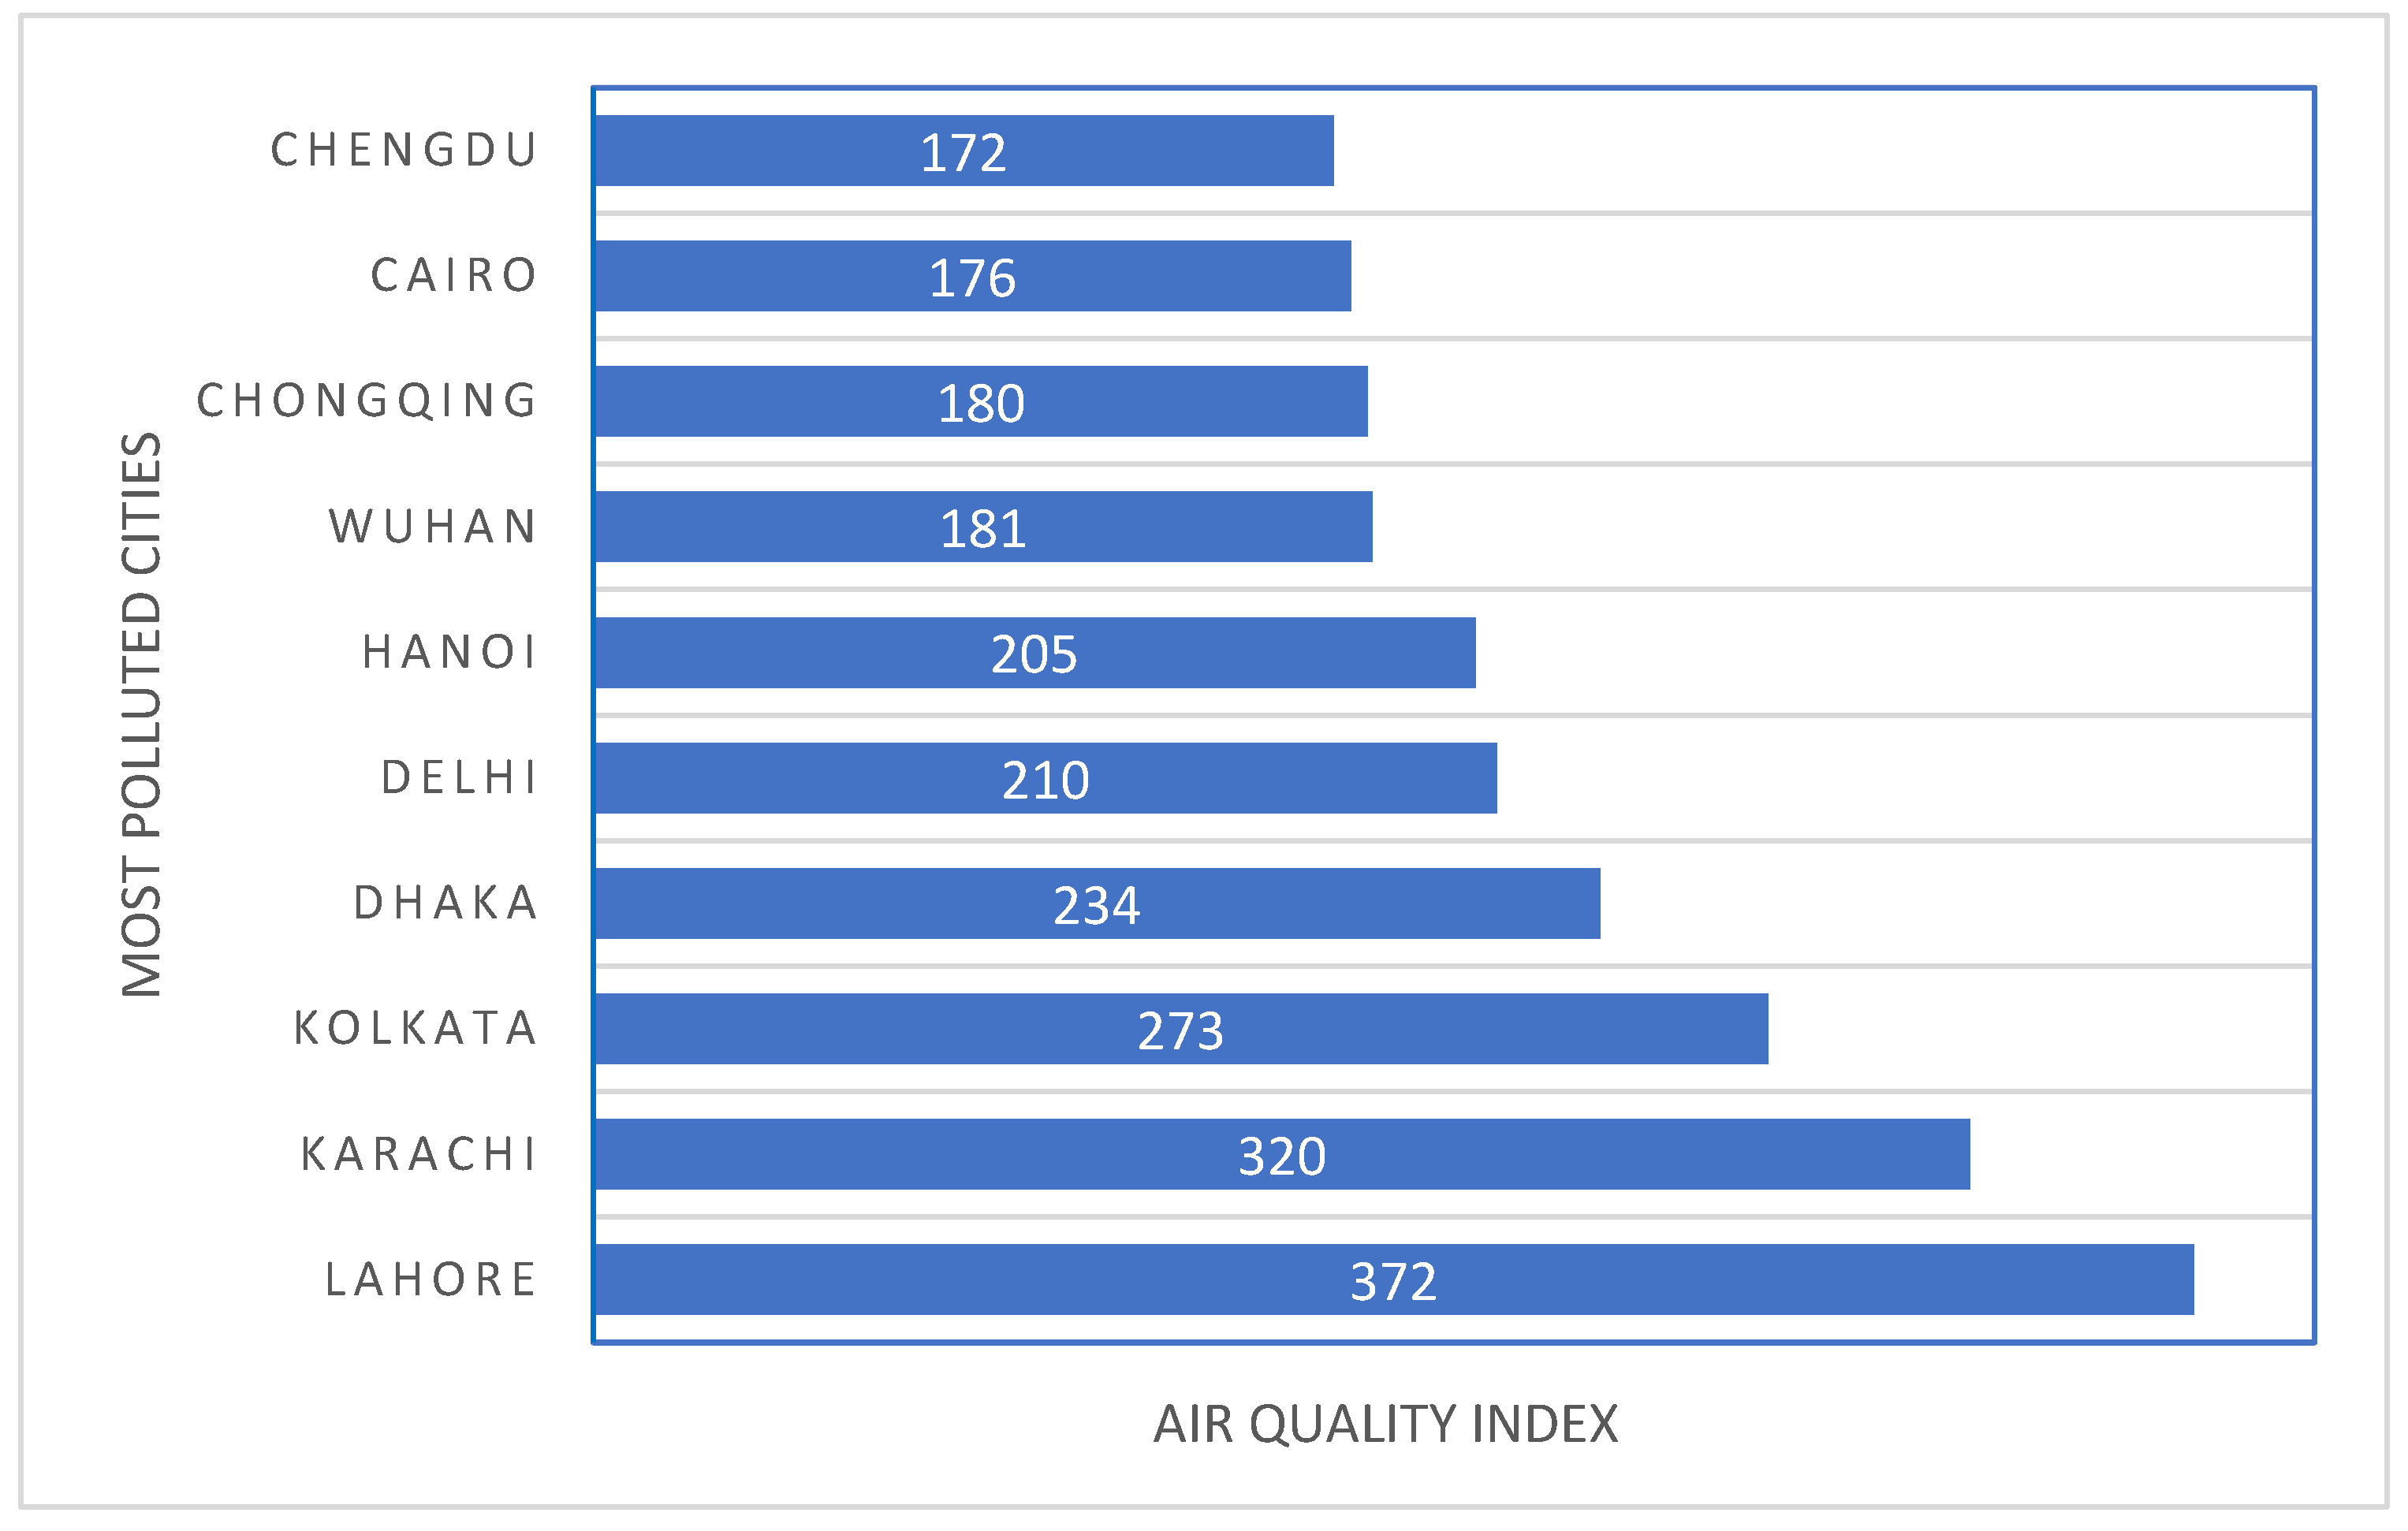
Figure 2.
AQI levels in different parts of Lahore on 24th November, 2025 [17].
Figure 2.
AQI levels in different parts of Lahore on 24th November, 2025 [17].

Figure 3.
Diseases reported in Lahore credited to air pollution [18].
Figure 3.
Diseases reported in Lahore credited to air pollution [18].
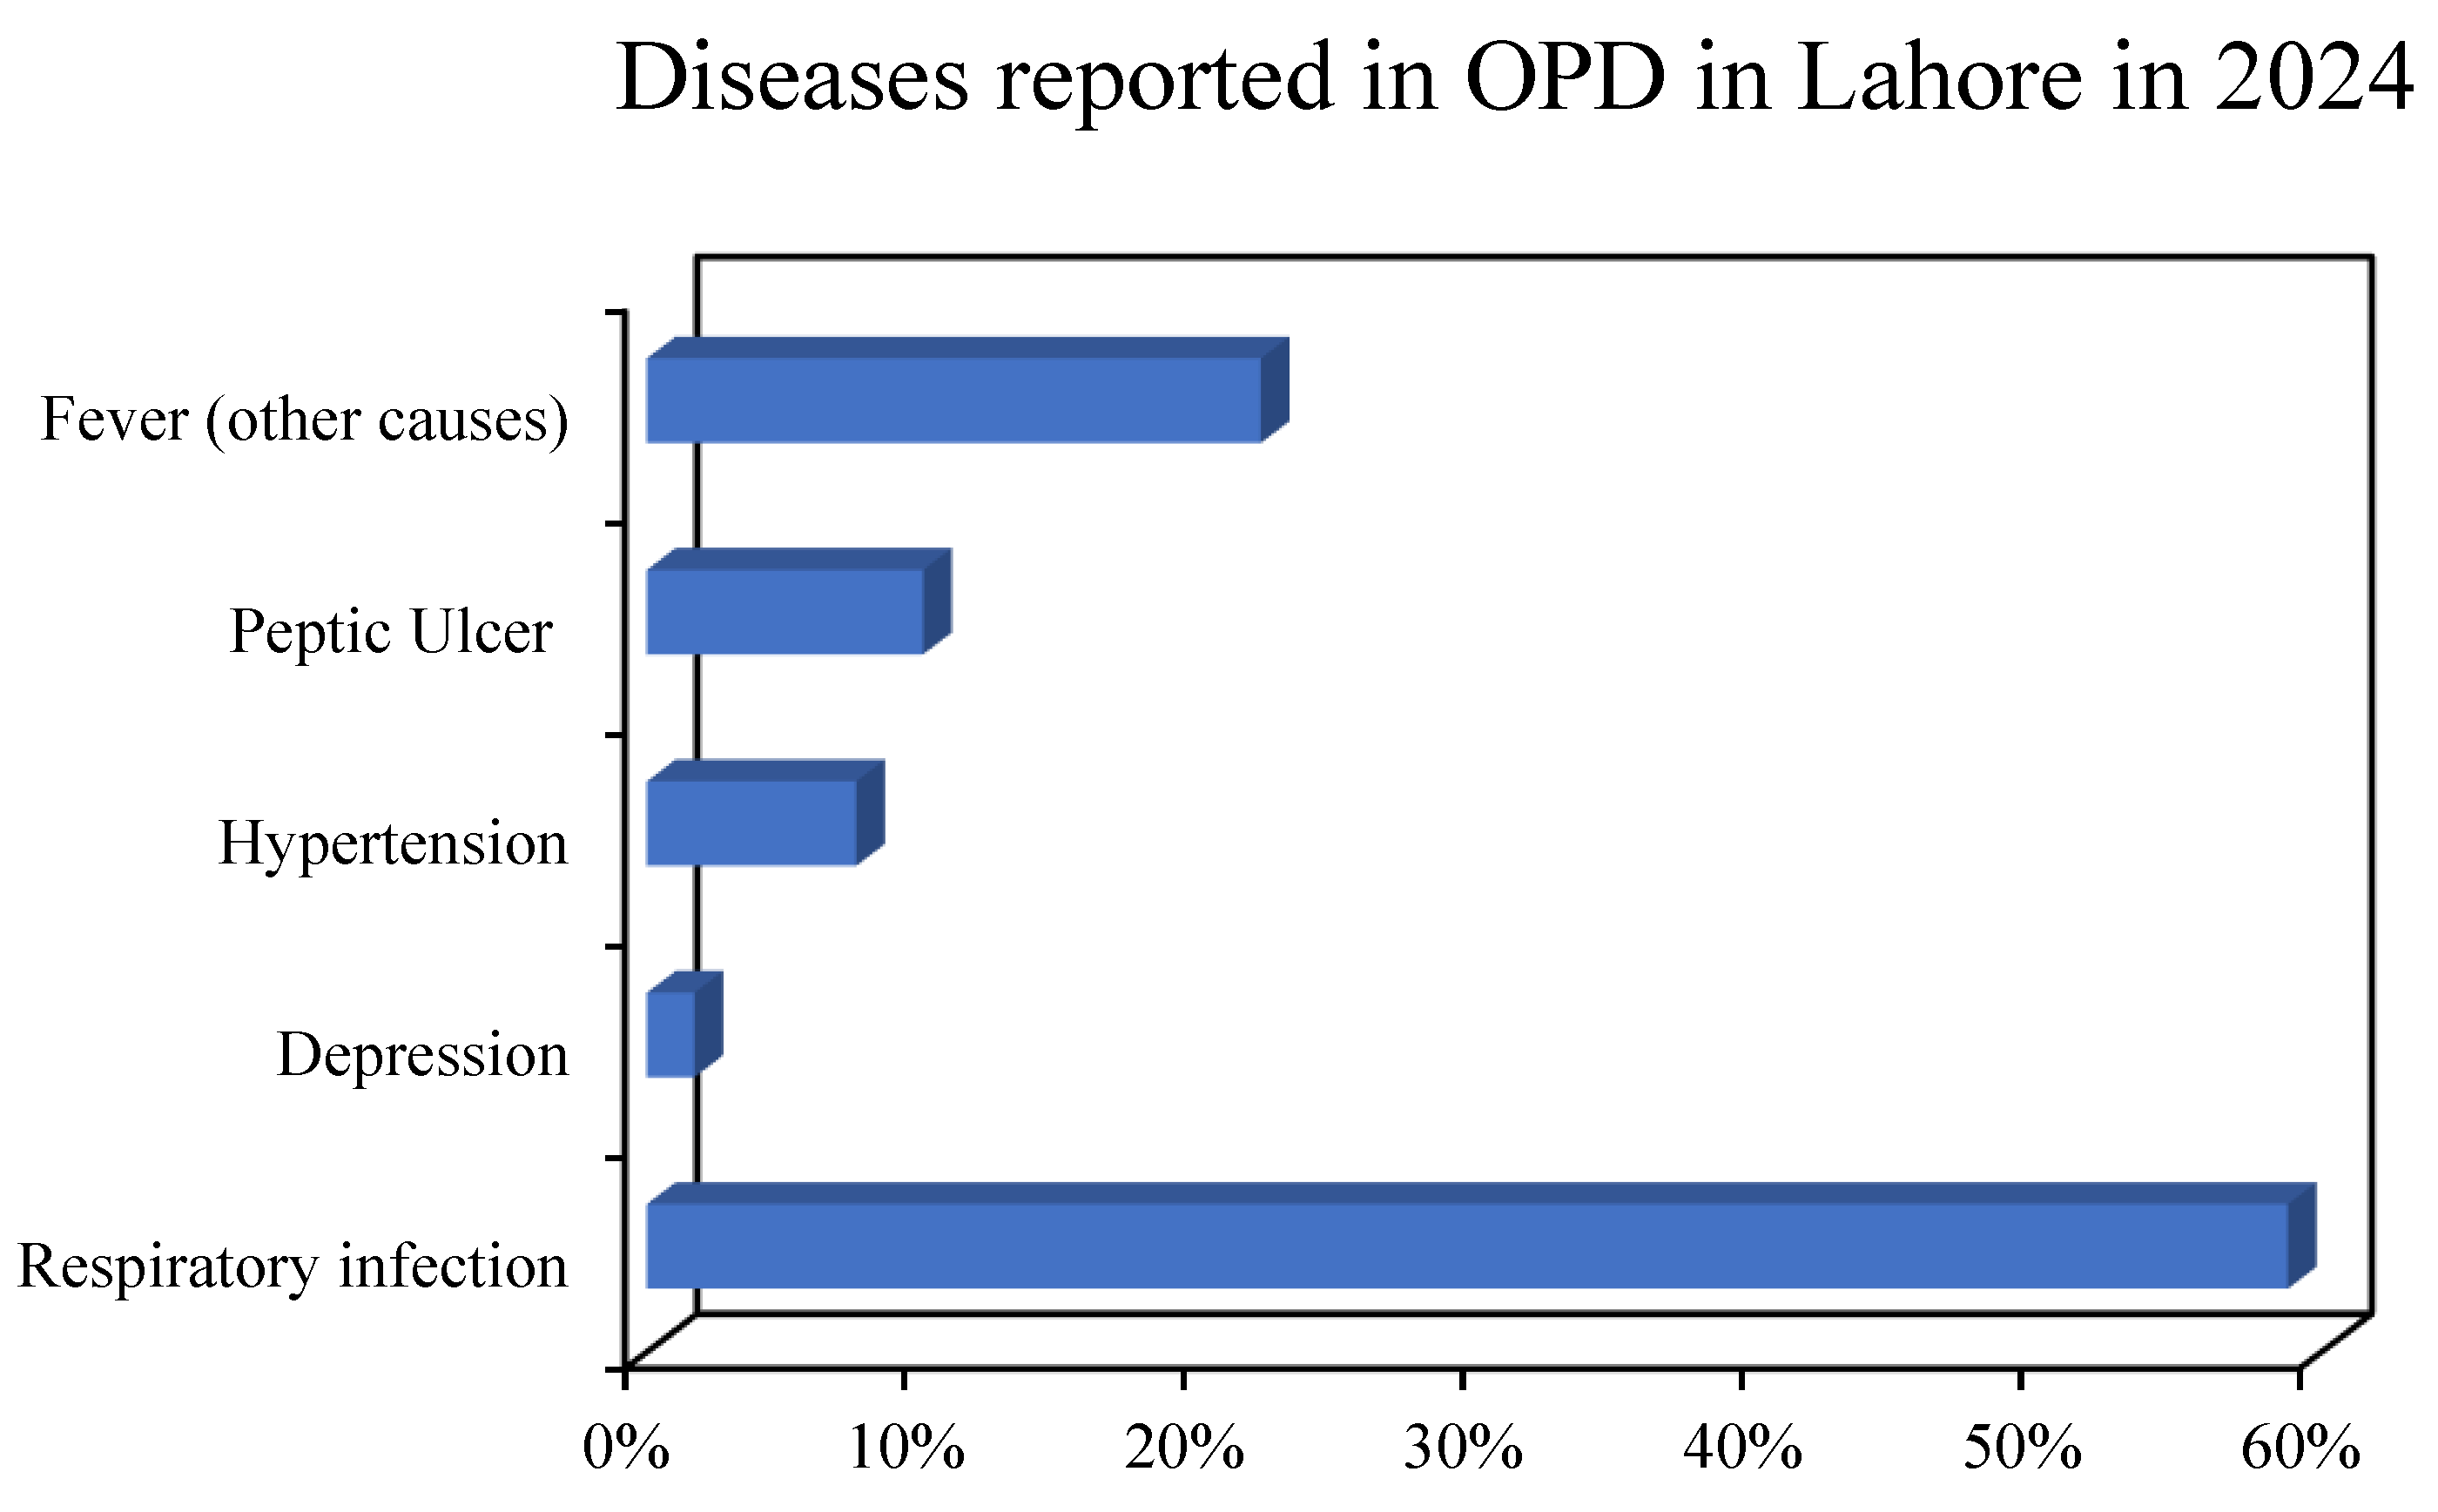
Figure 4.
Disease pattern reported in the smog season in Lahore during 2022.
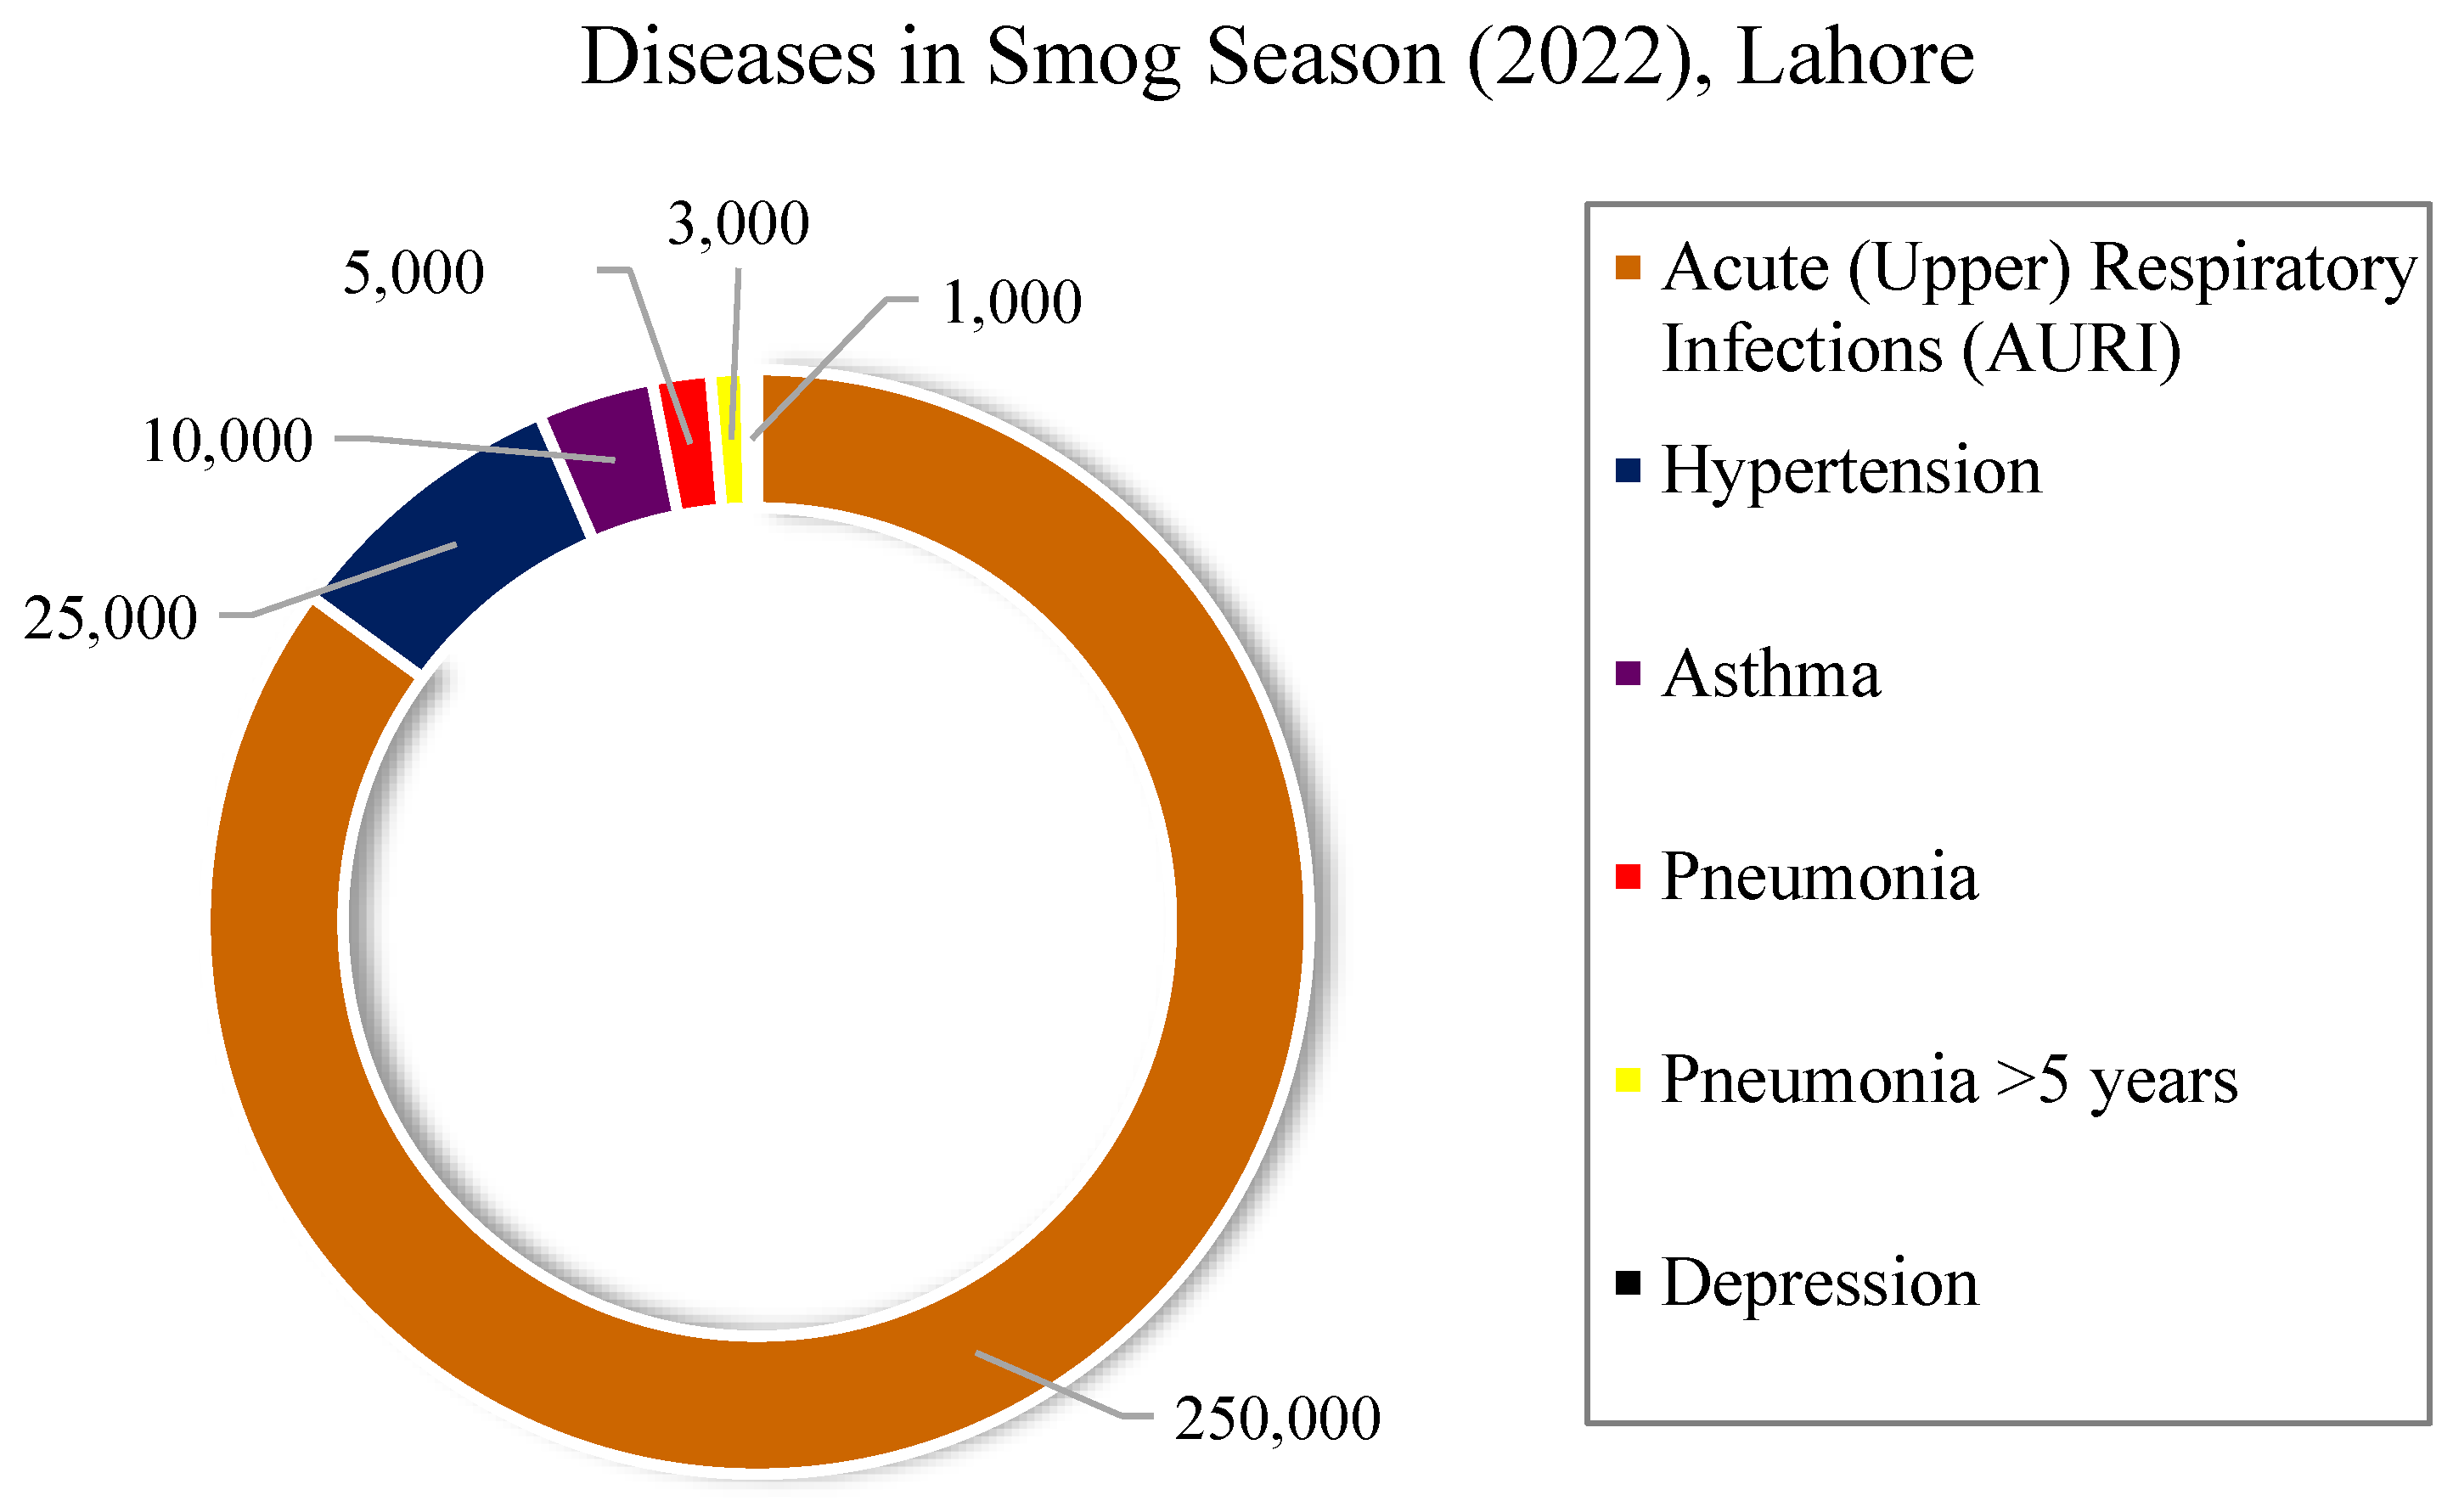
Figure 5.
Smog formation process diagram.
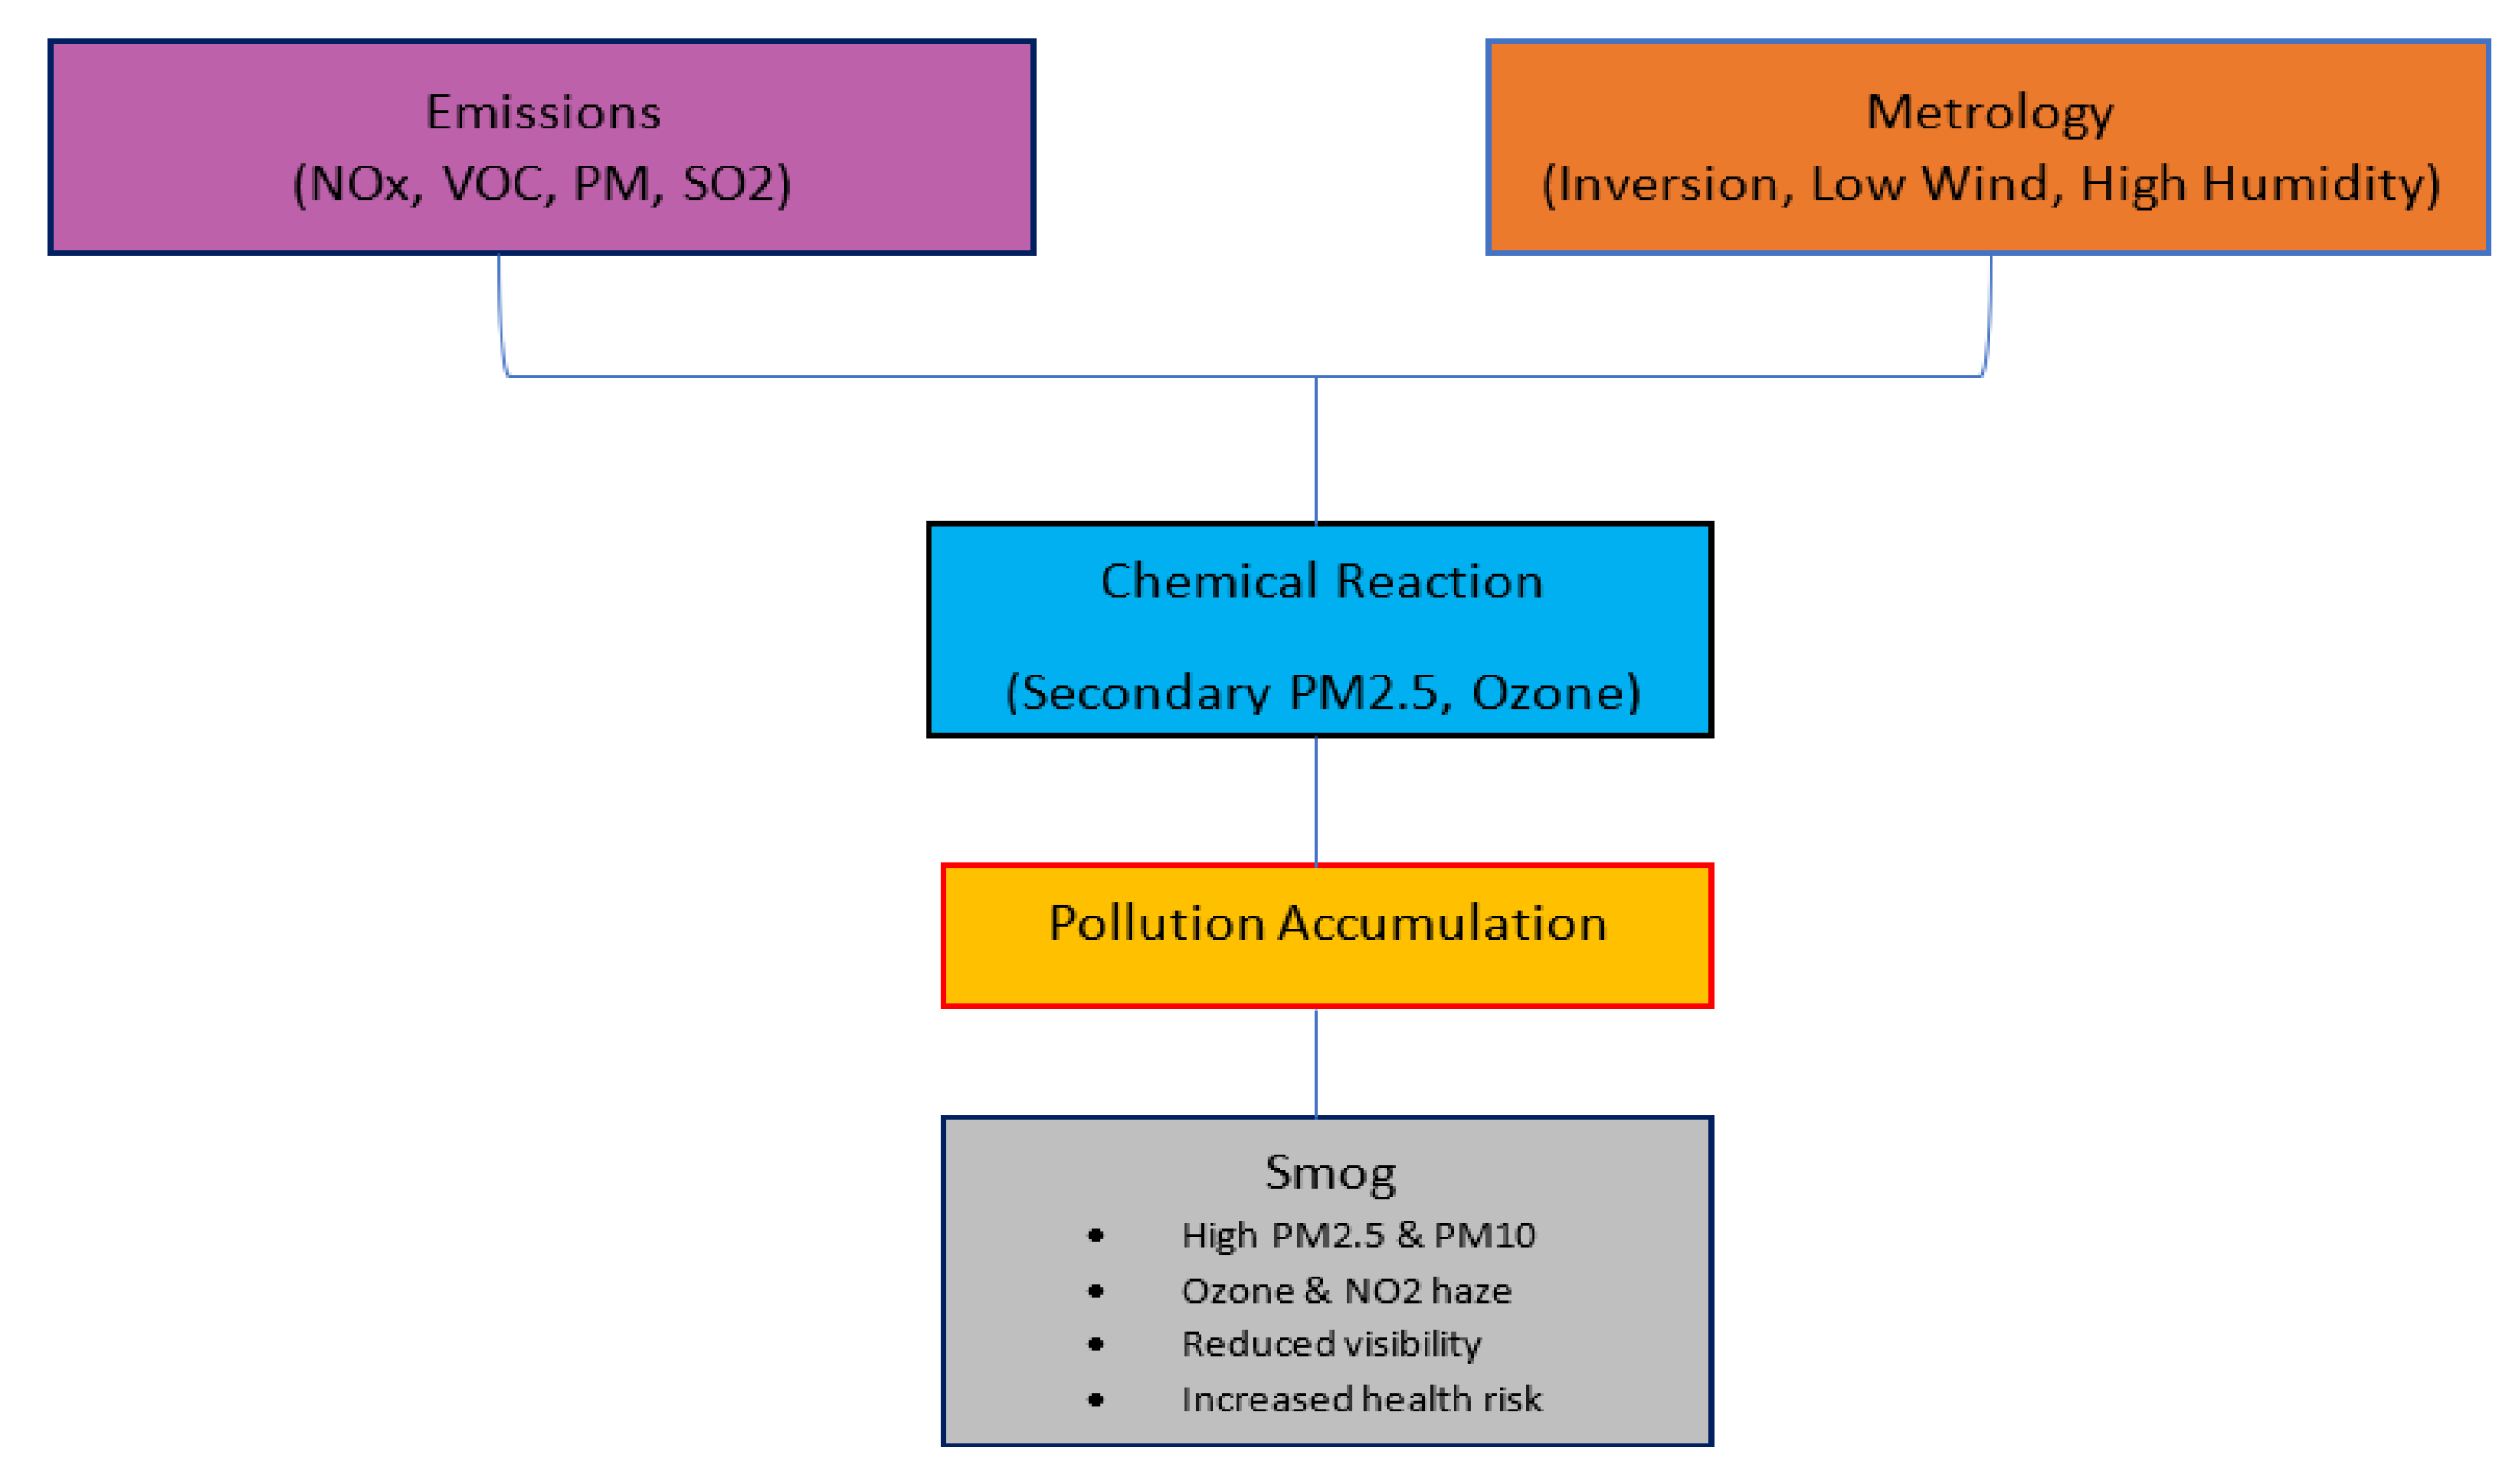
Figure 6.
Flowchart of the Two-Phase Methodology for analyzing smog formation in Lahore.
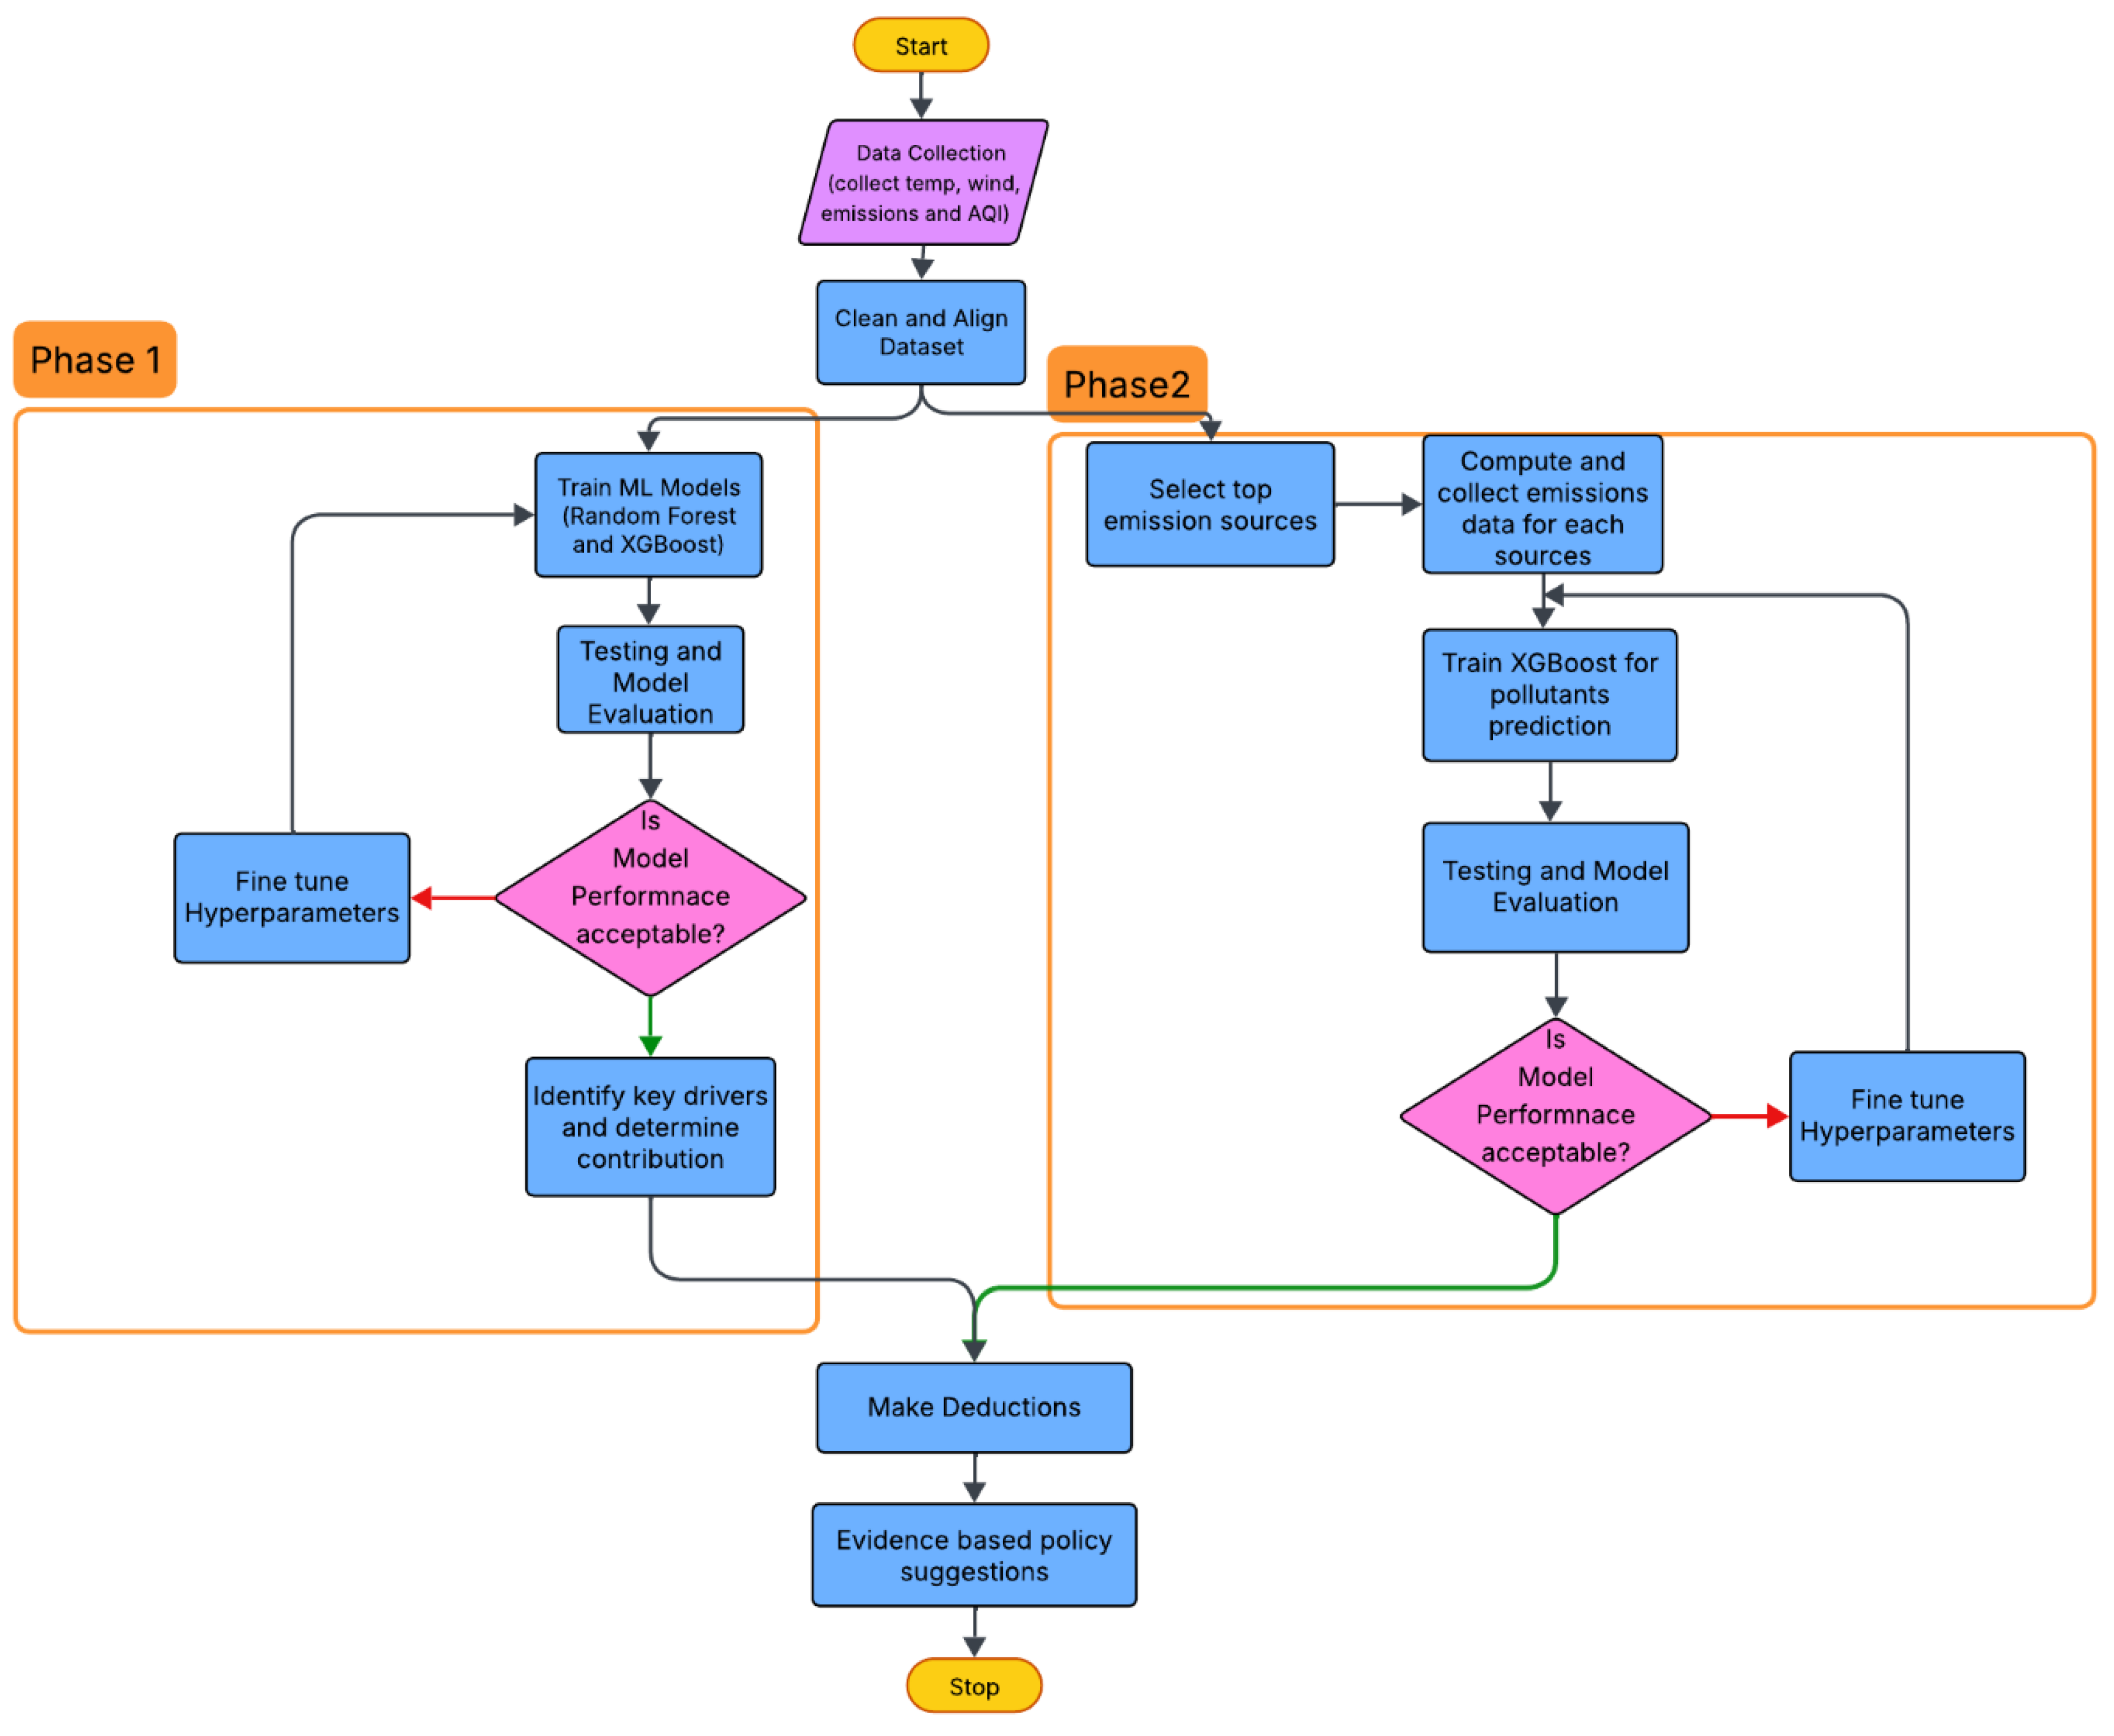
Figure 7.
Comparison of XGBoost and Random Forest Model for predicting AQI.
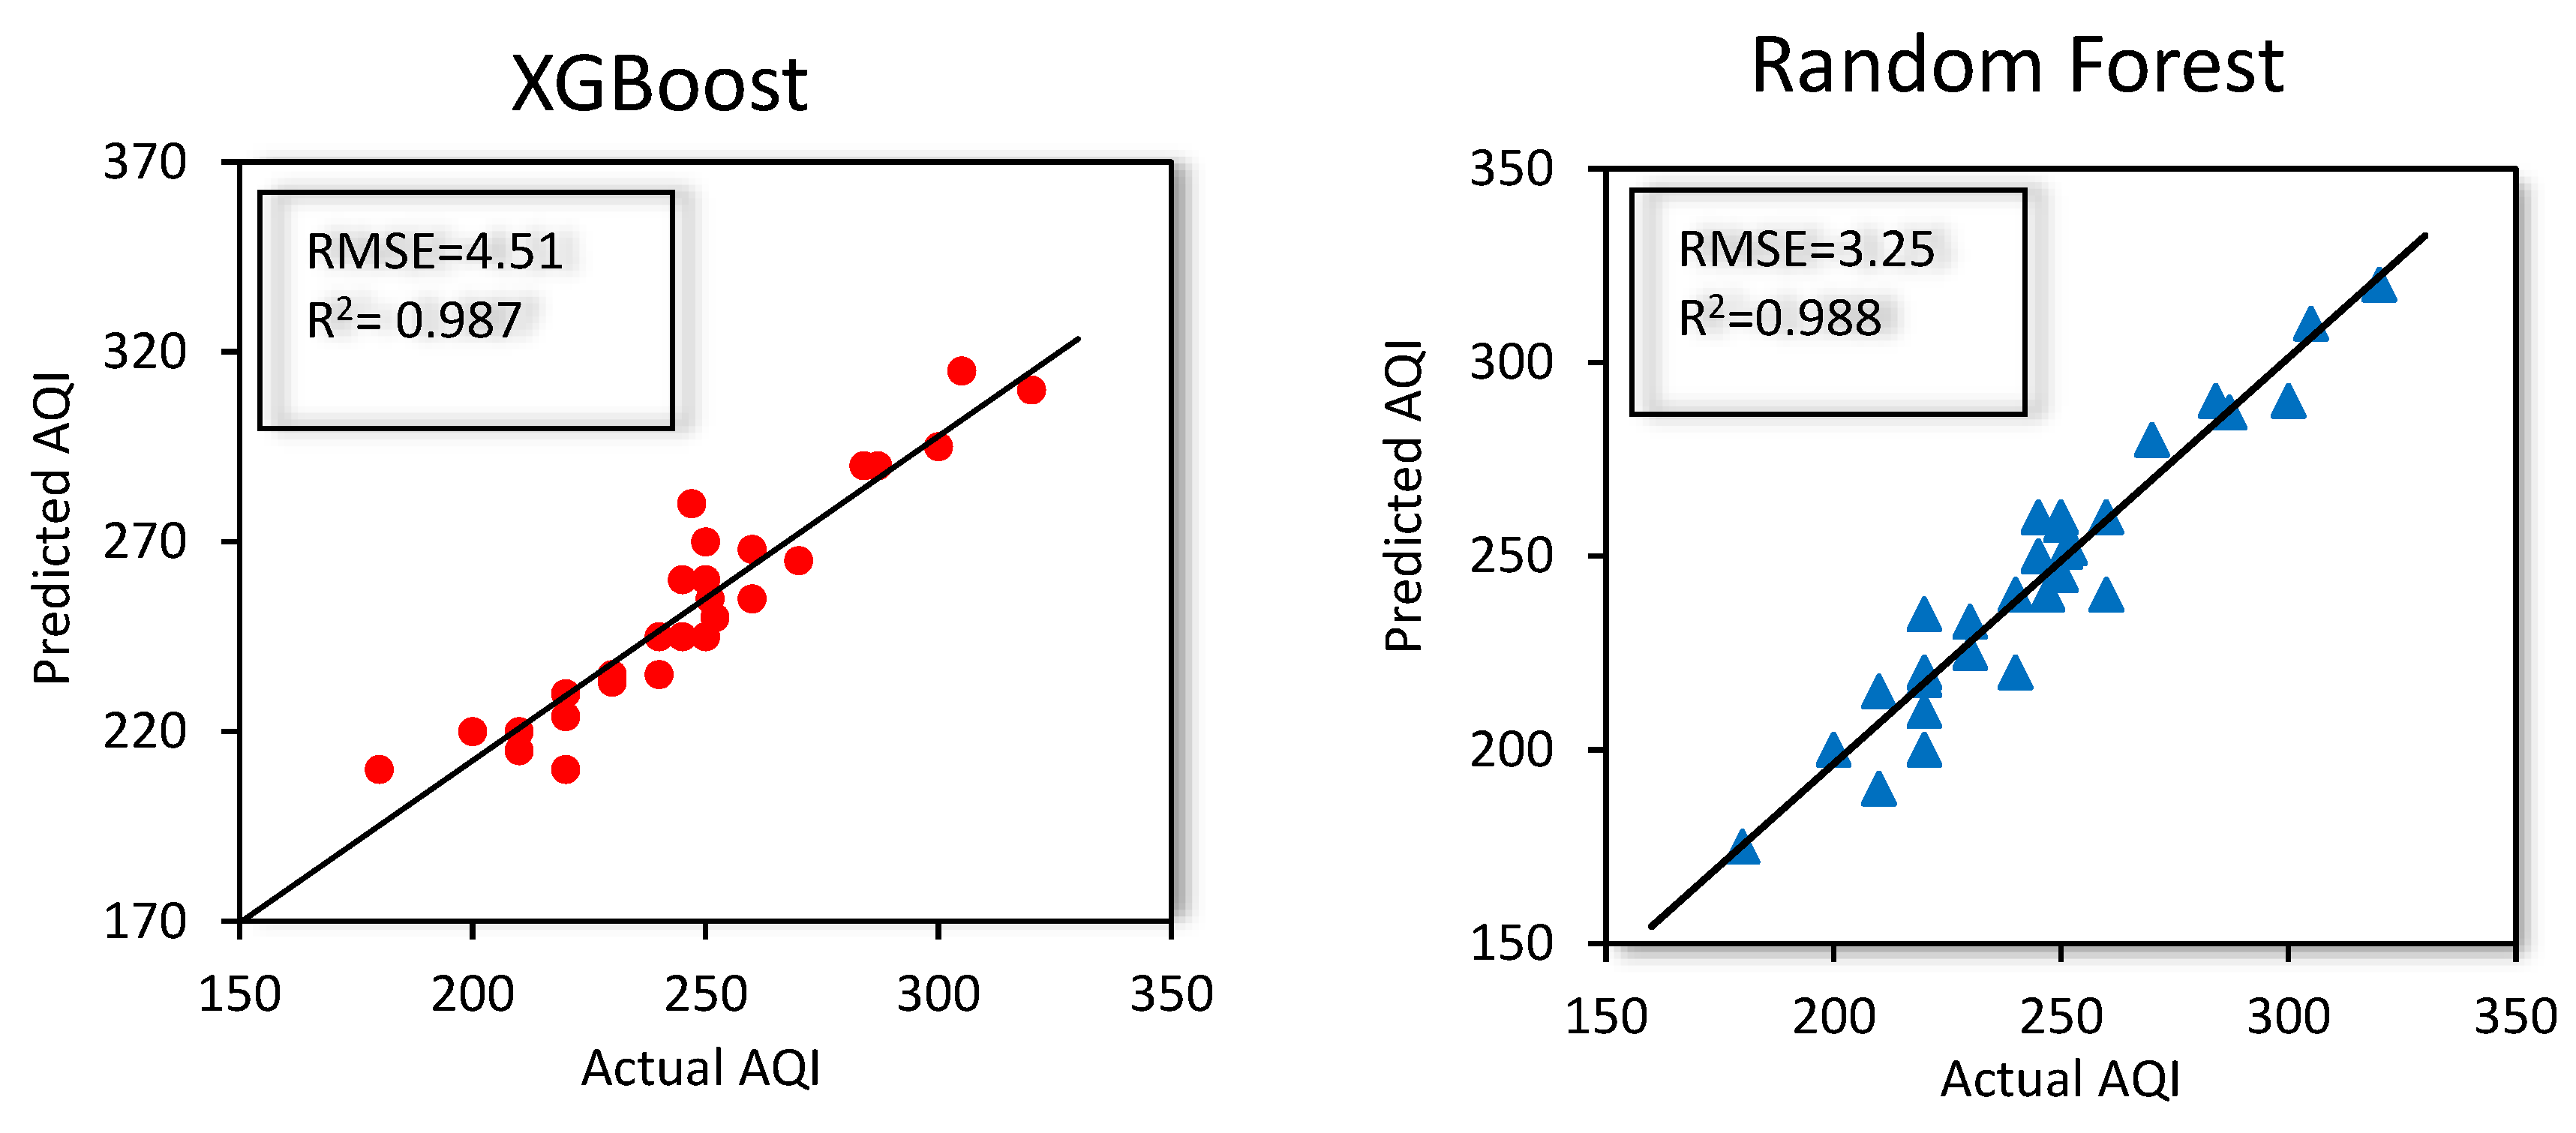
Figure 8.
Variable Importance Coefficients for AQI Prediction Using Random Forest Model.
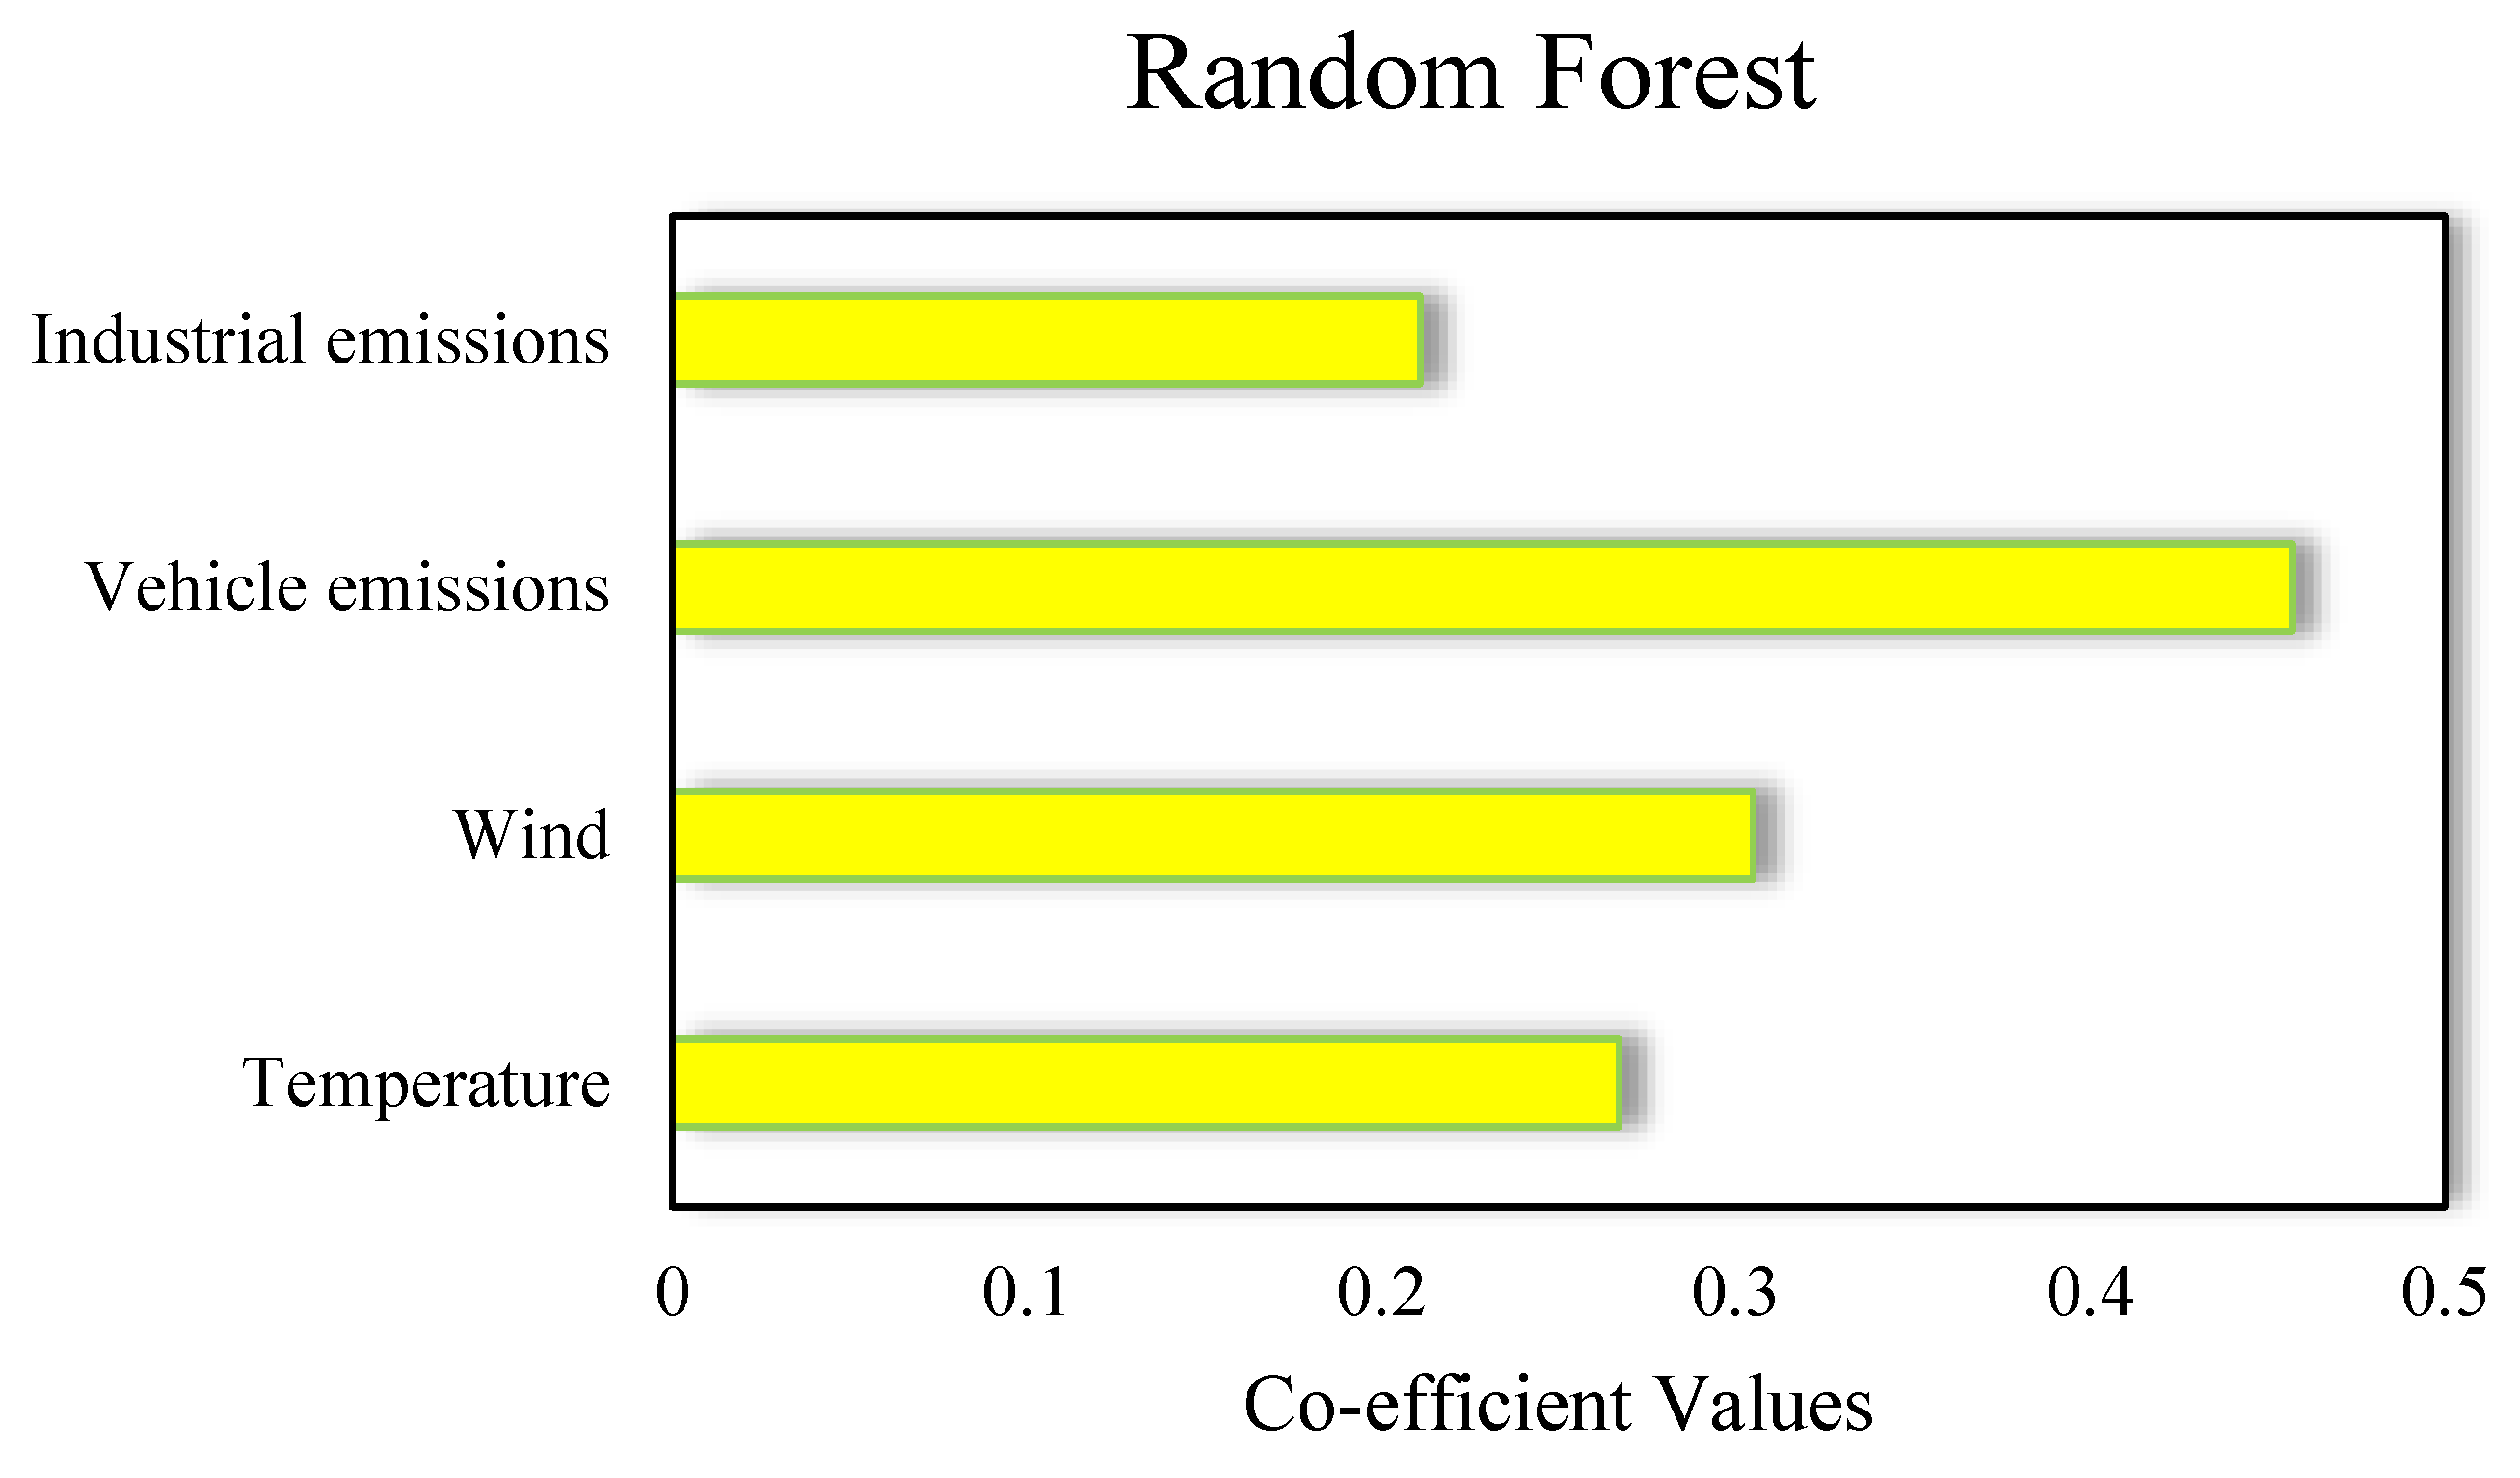
Figure 9.
Variable Importance Coefficients for AQI Prediction Using XGBoost Model.
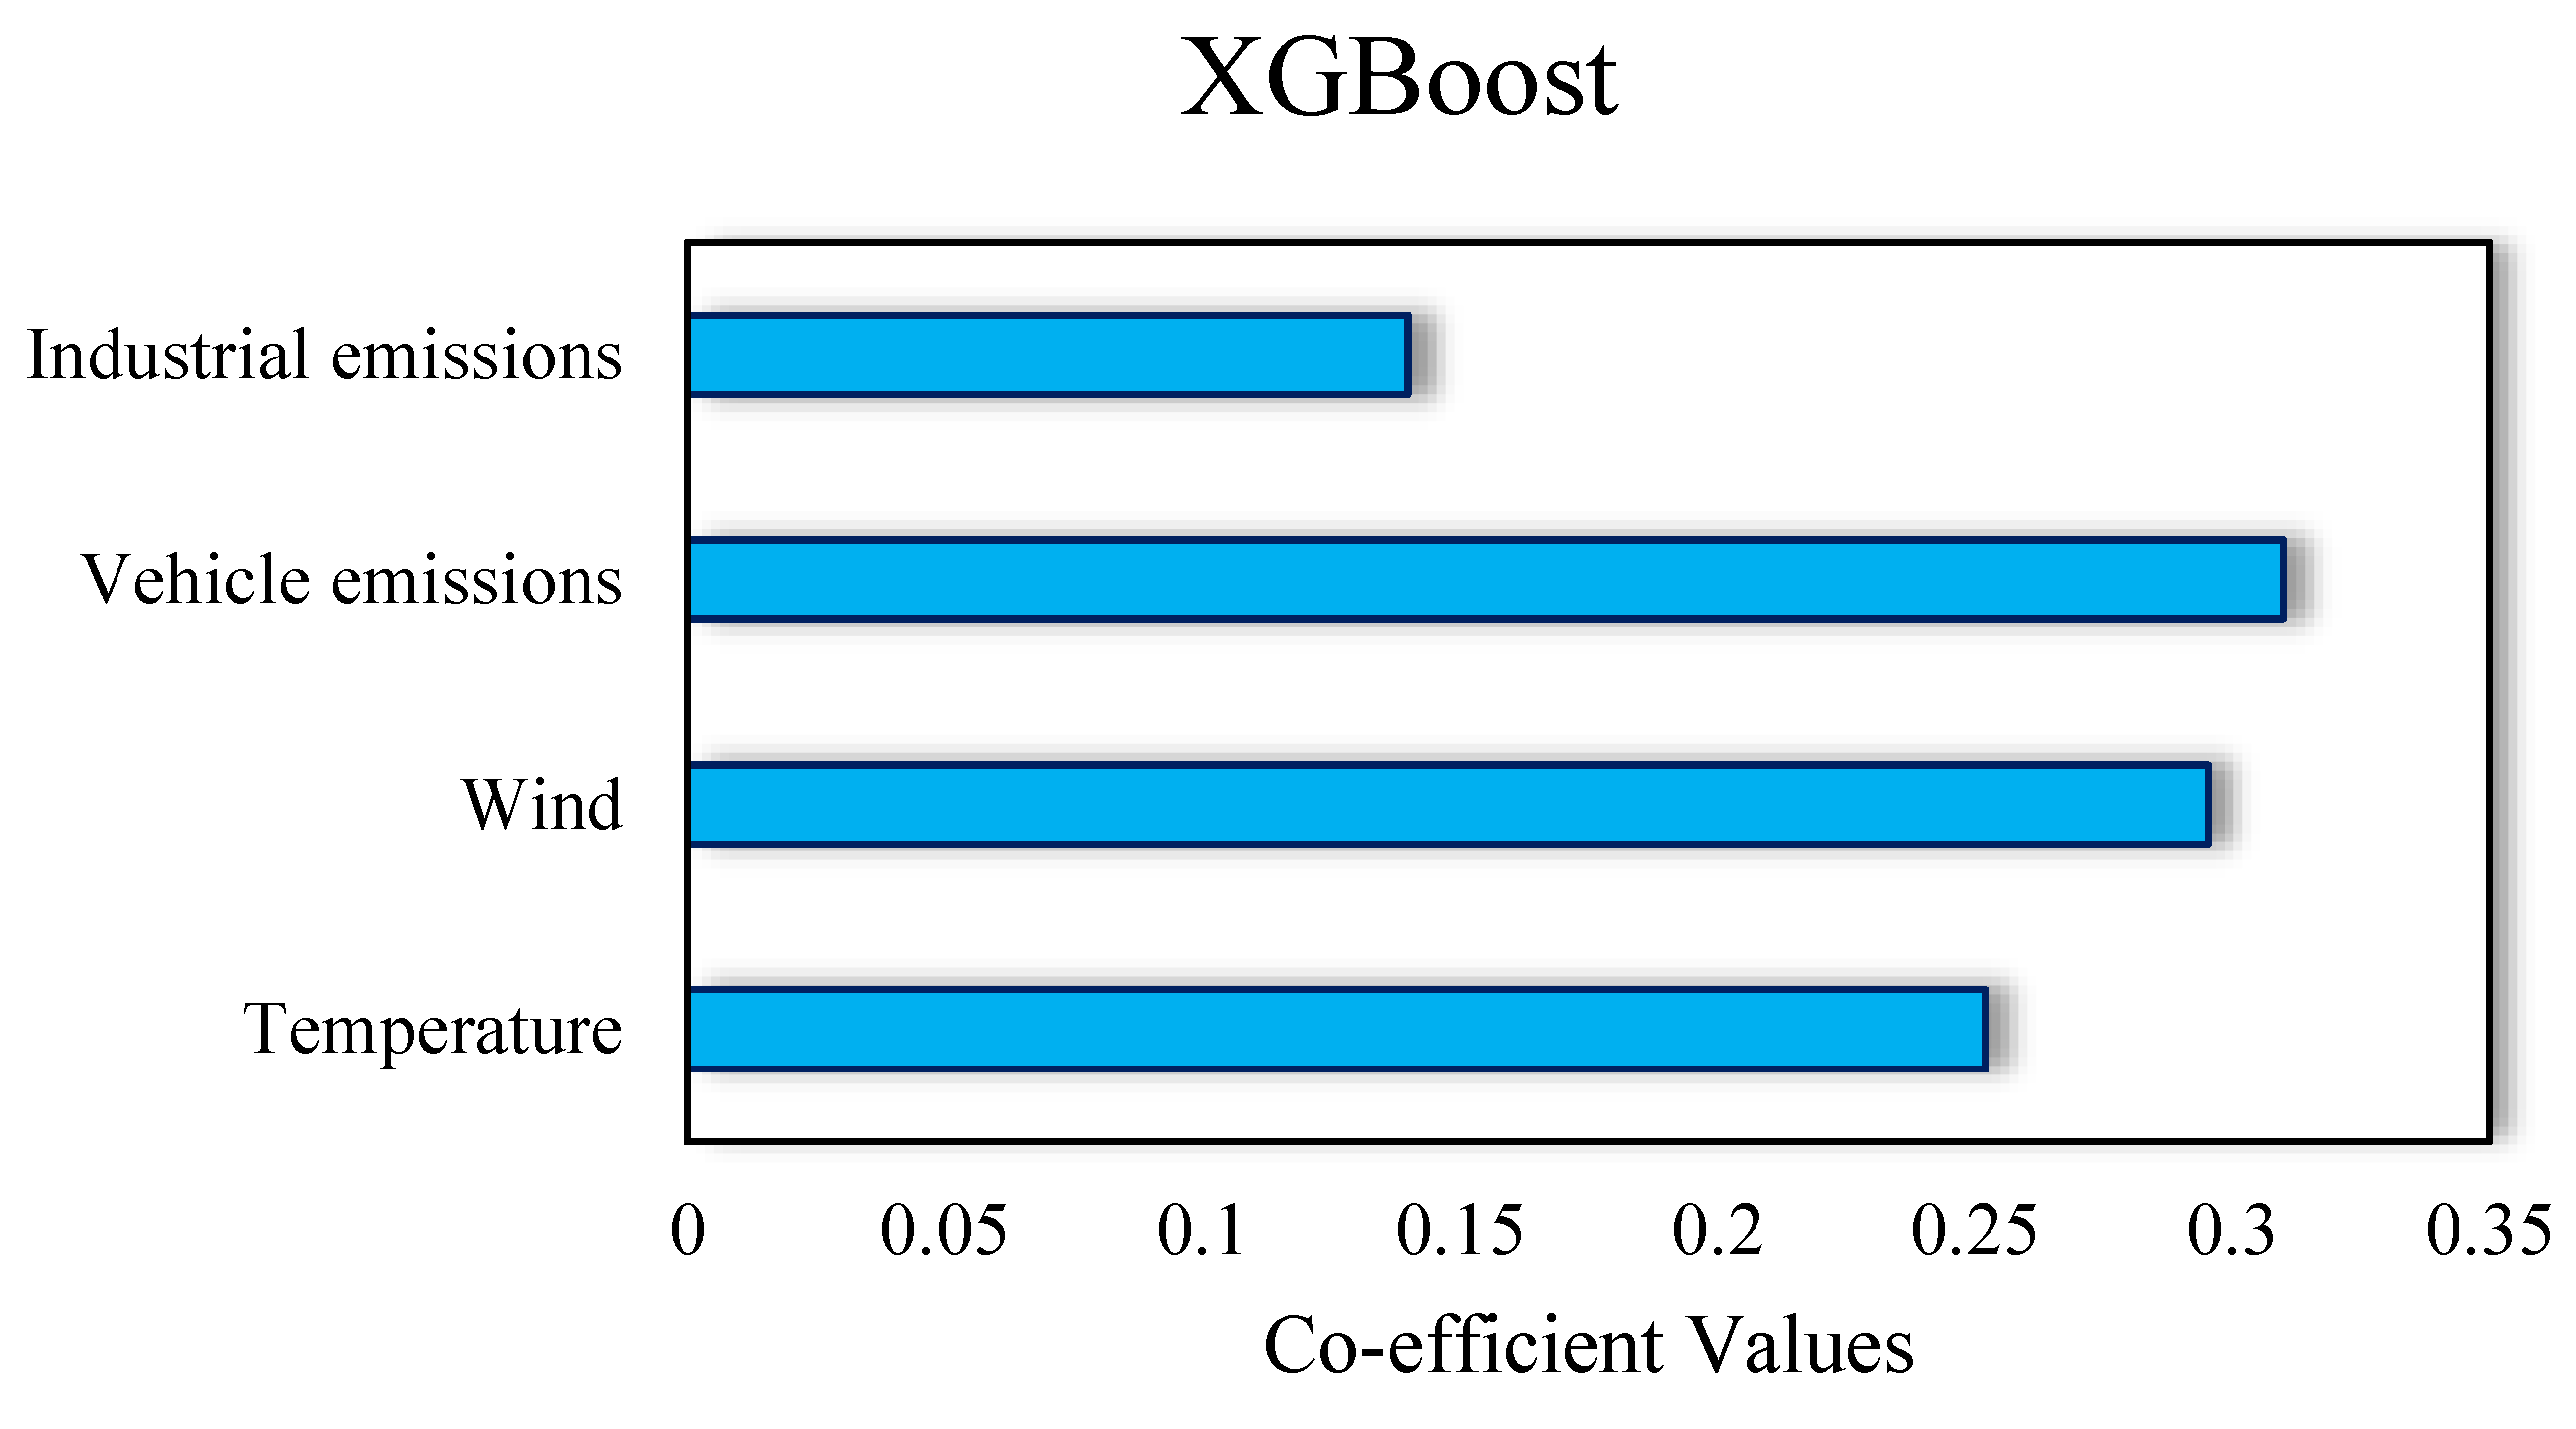
Figure 10.
Sector-wise breakdown of total annual emissions in Lahore.
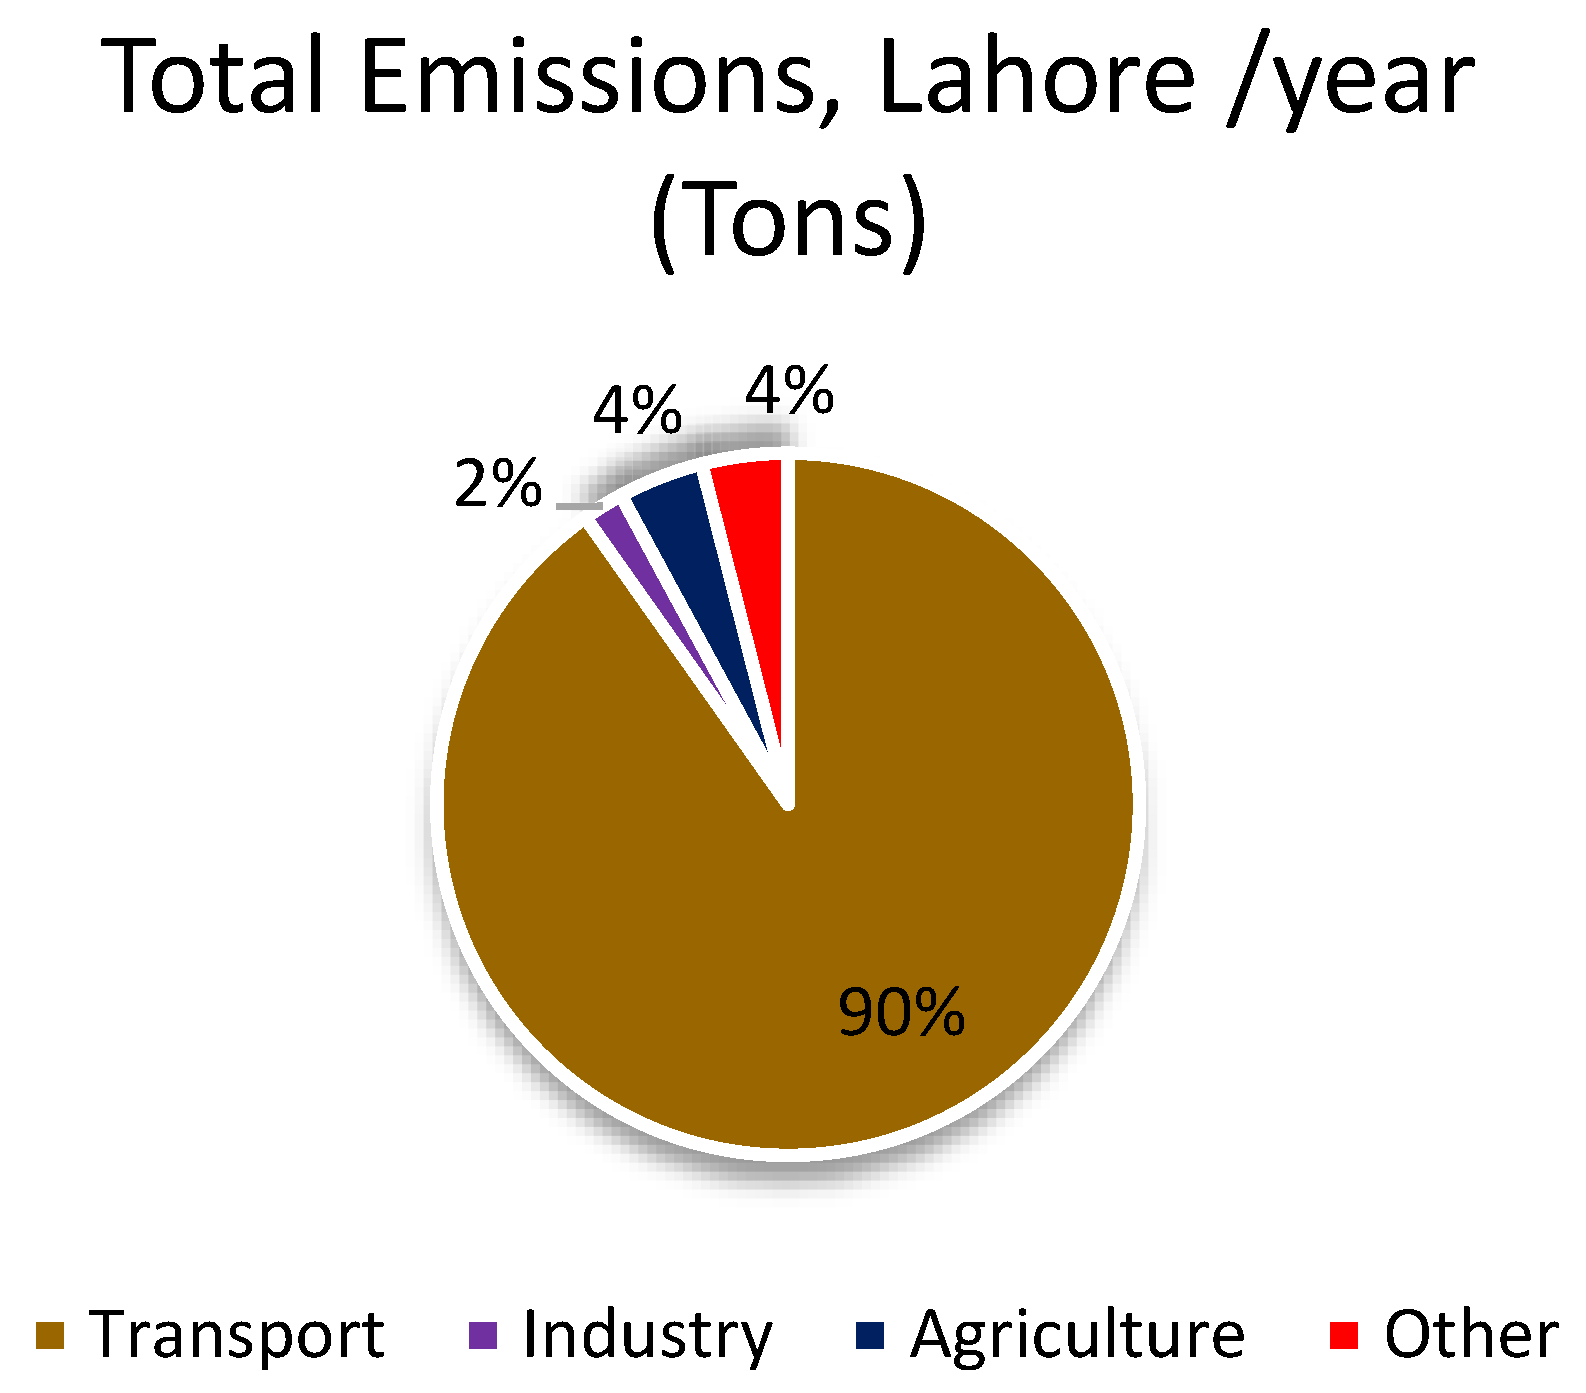
Figure 11.
Emissions within each sector of the four major pollutant types: NOx, CO, VOC and PM.
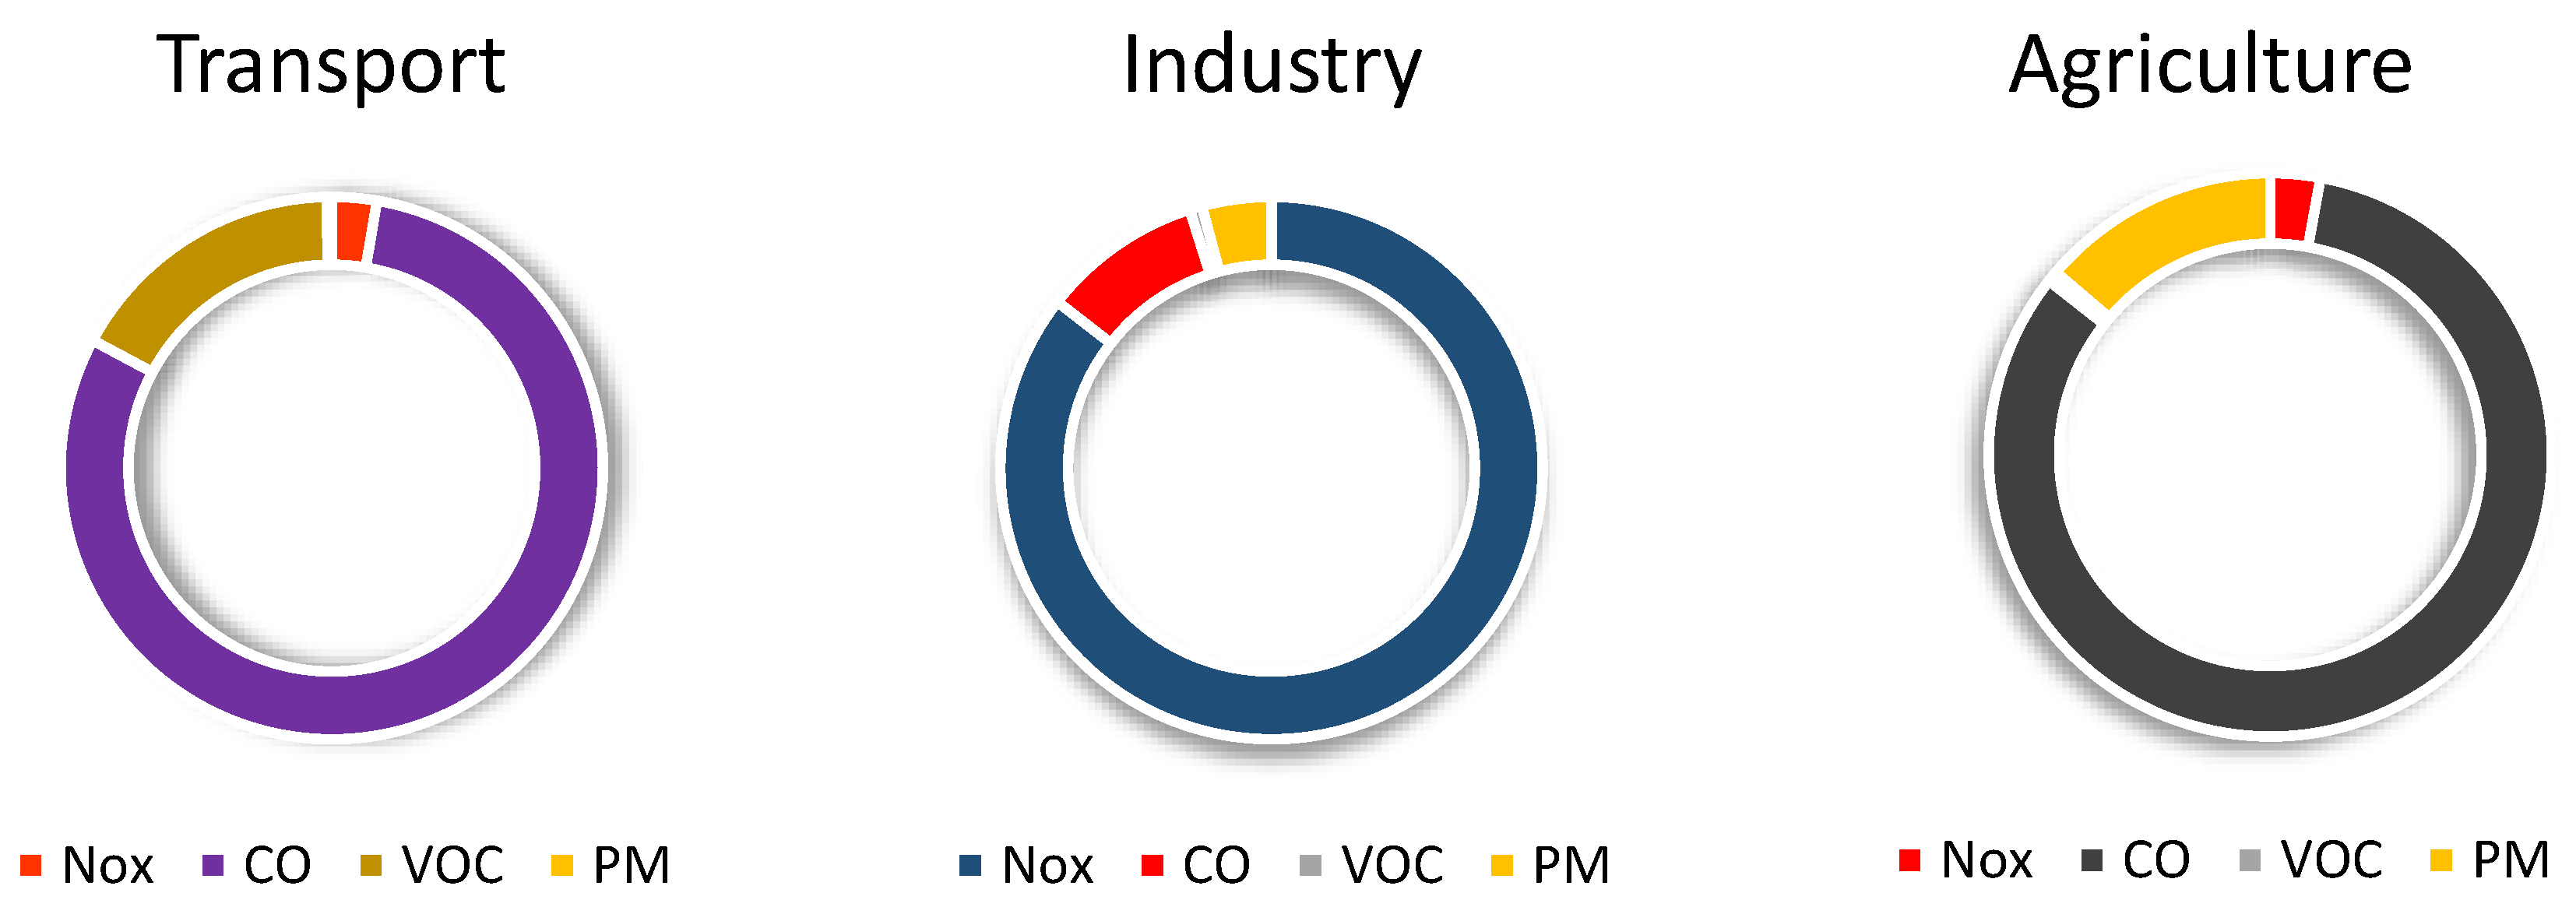
Figure 12.
Vehicle emissions in Lahore are categorized by transport type.
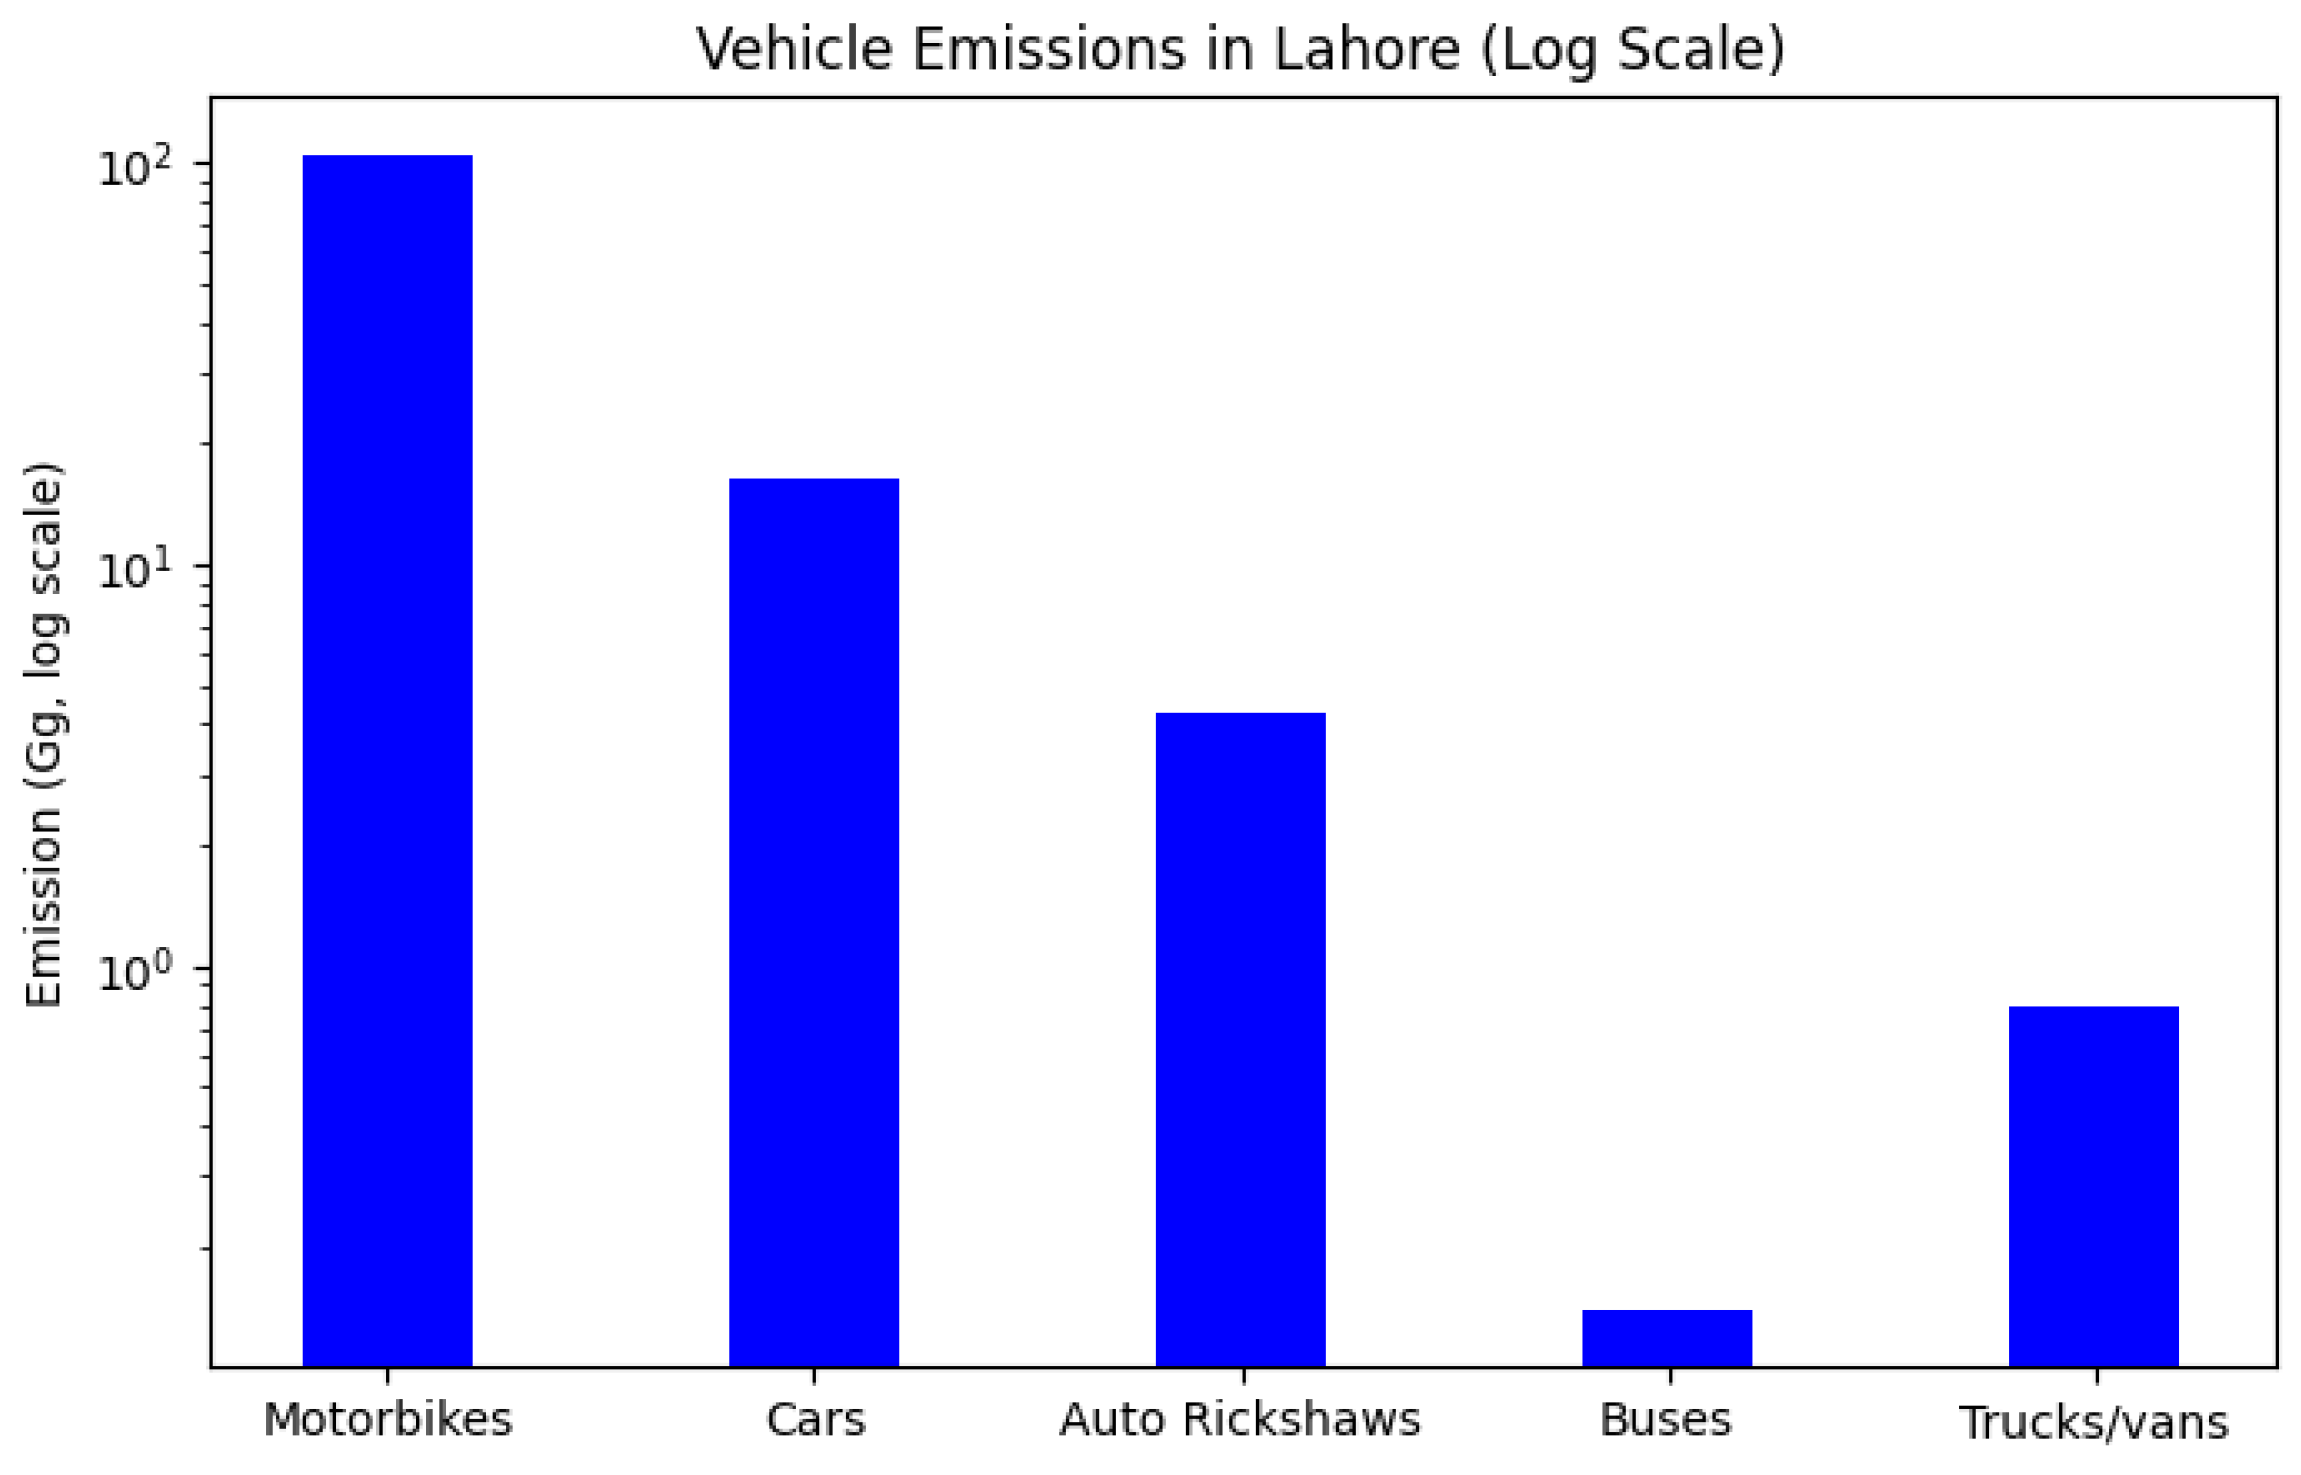
Figure 13.
Model predictions for Transport Emissions in tons.
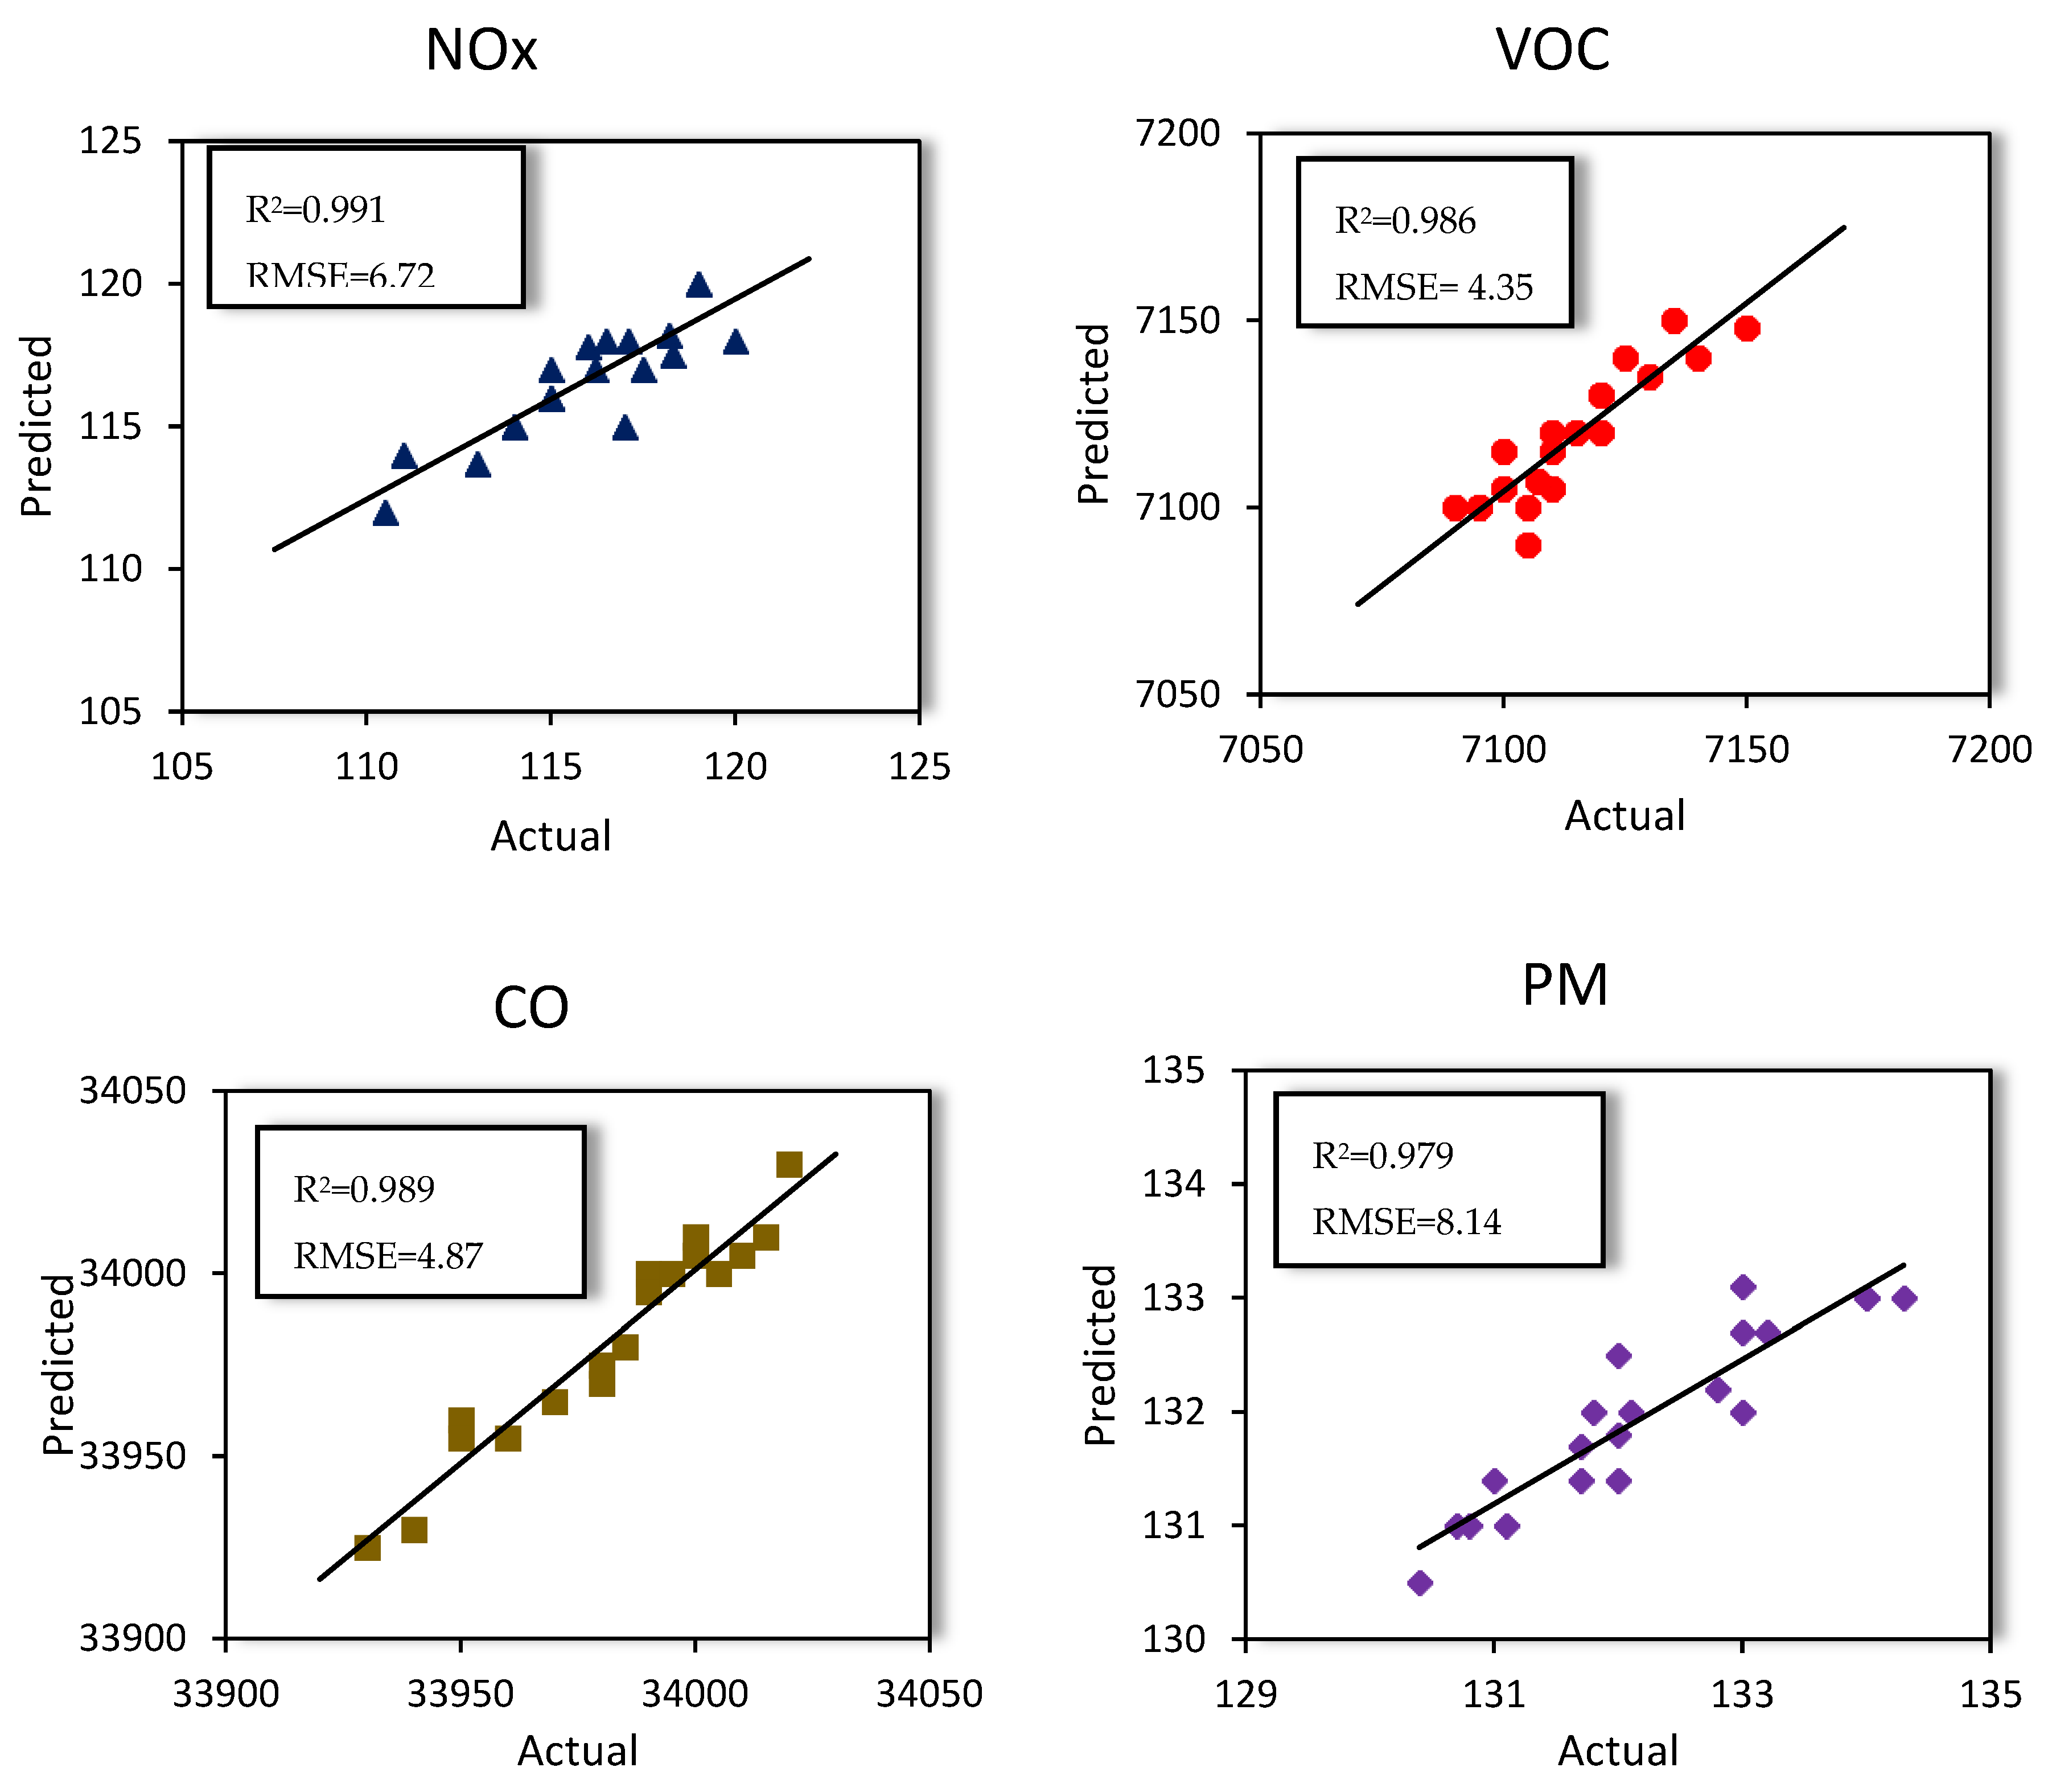
Figure 14.
Model predictions for Industry Emissions in Tons.
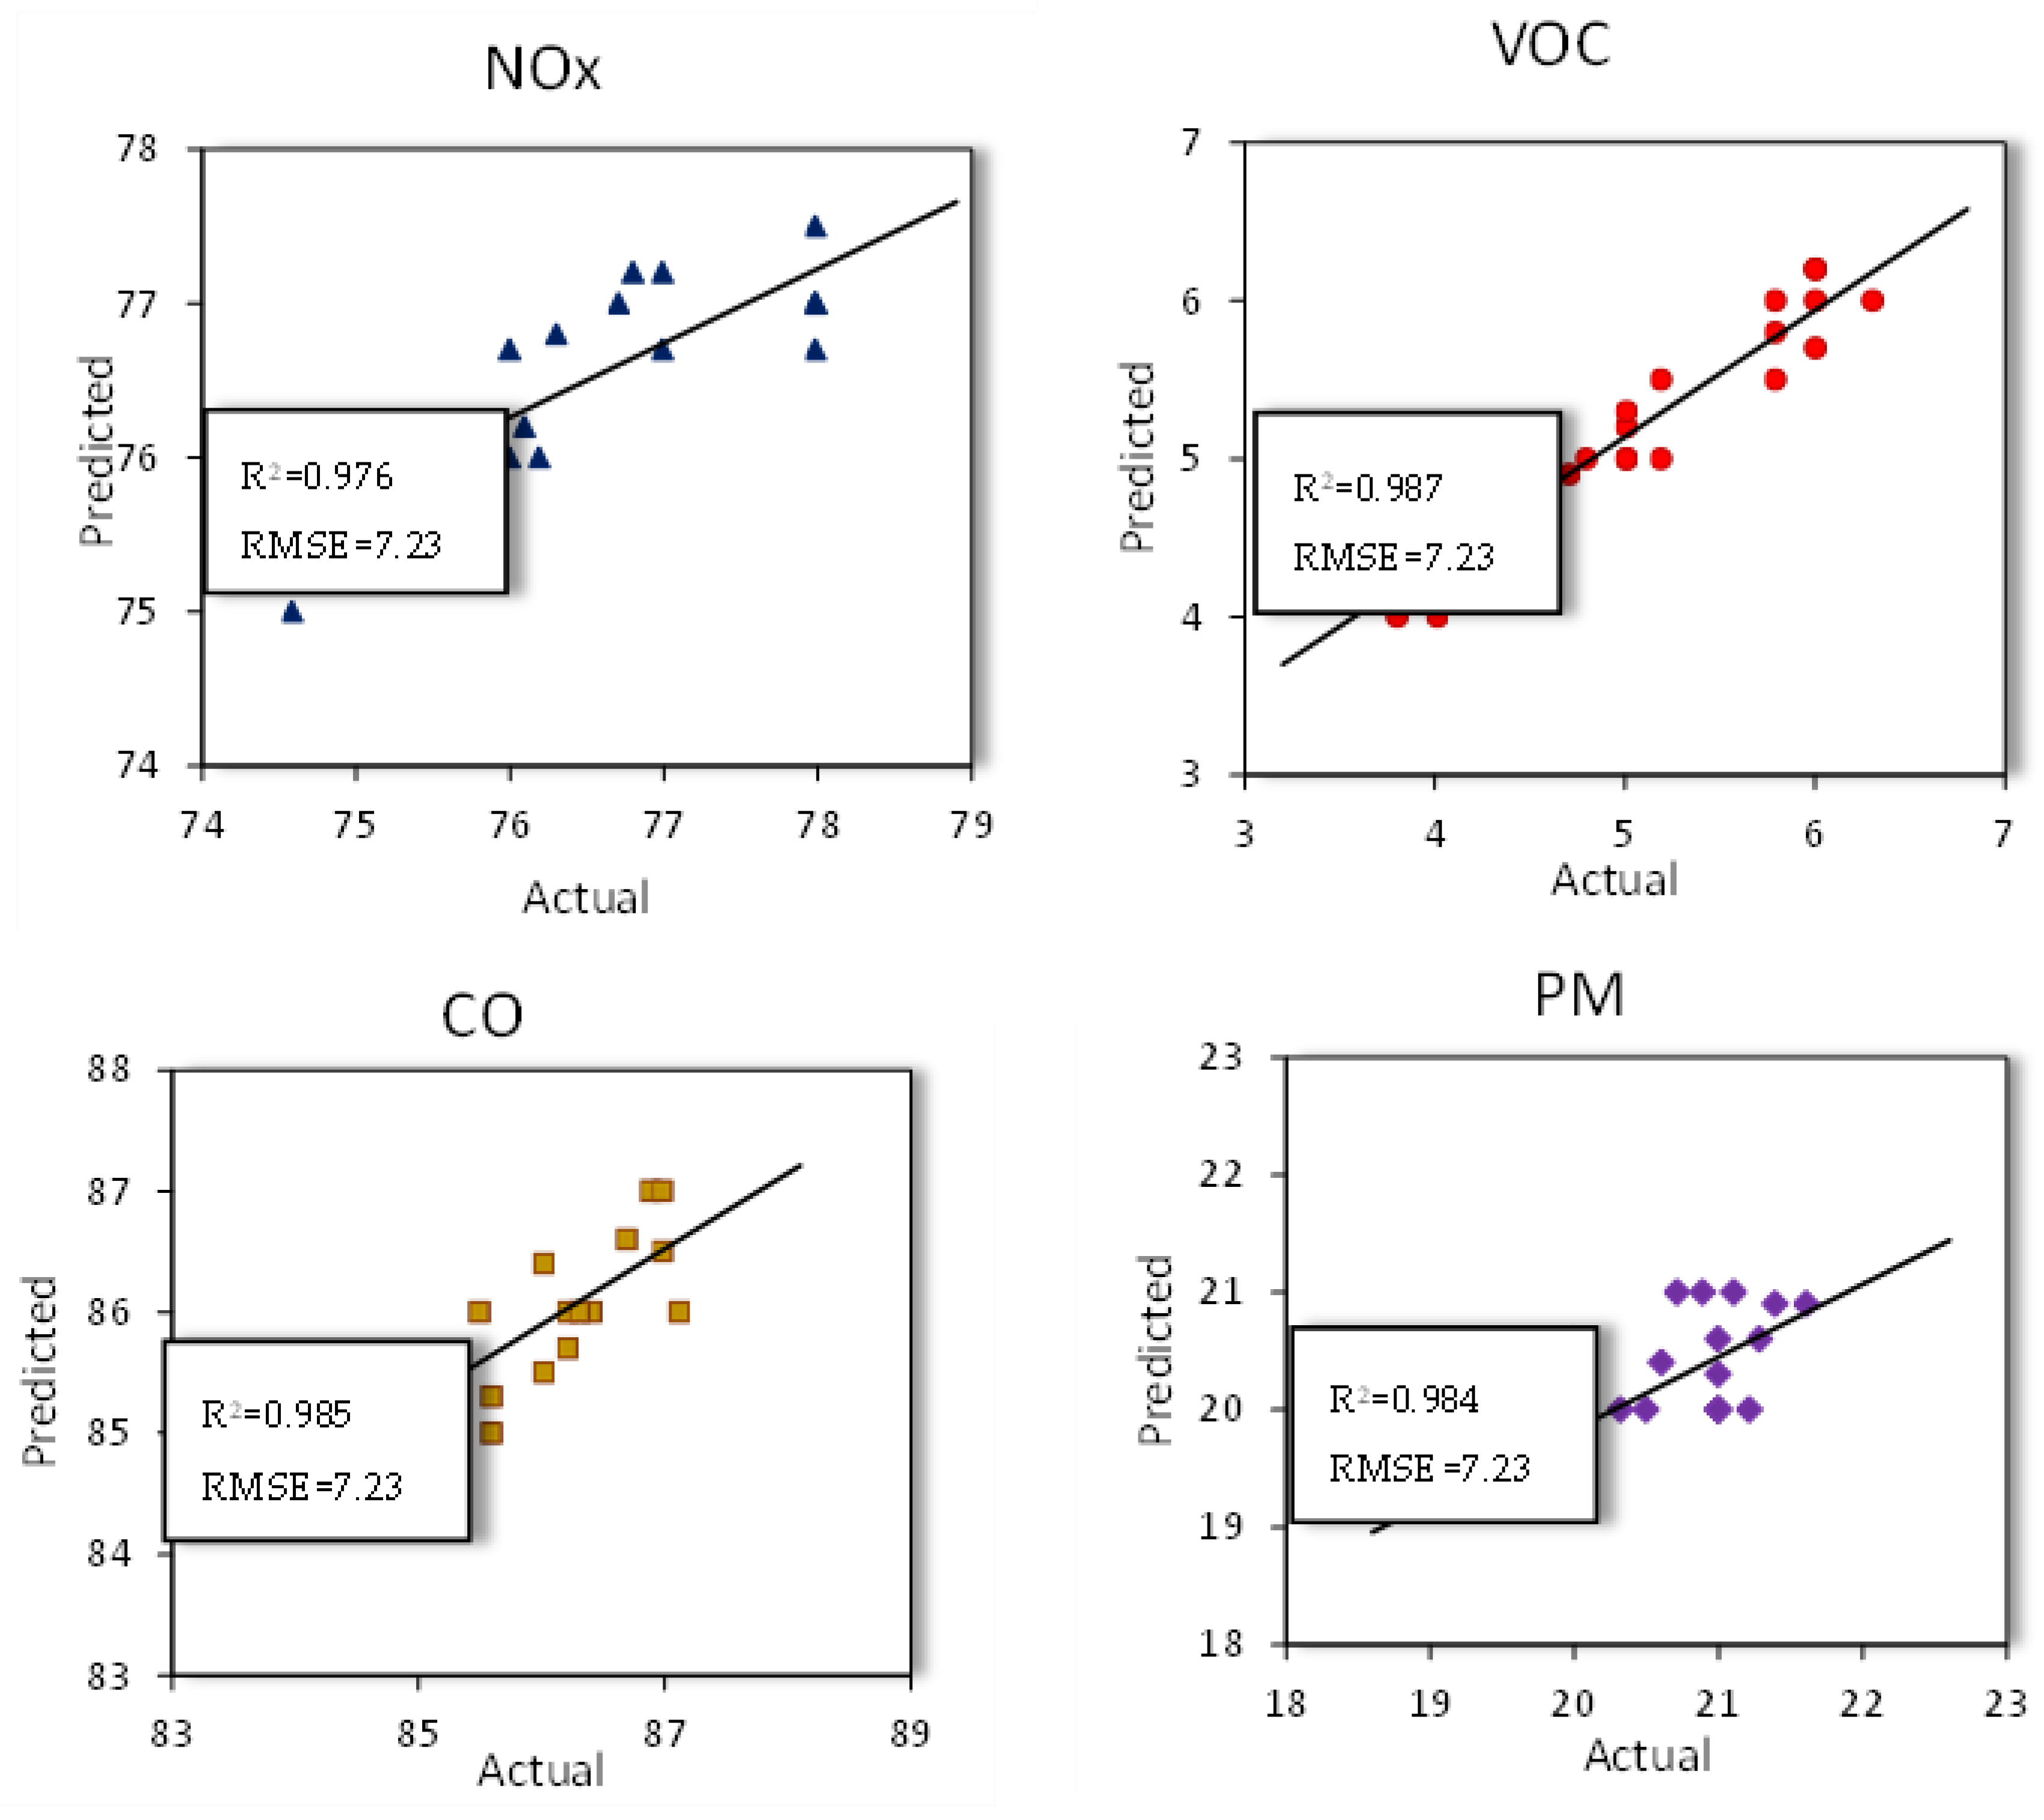
Figure 15.
Model predictions for Agricultural Emissions in Tons.
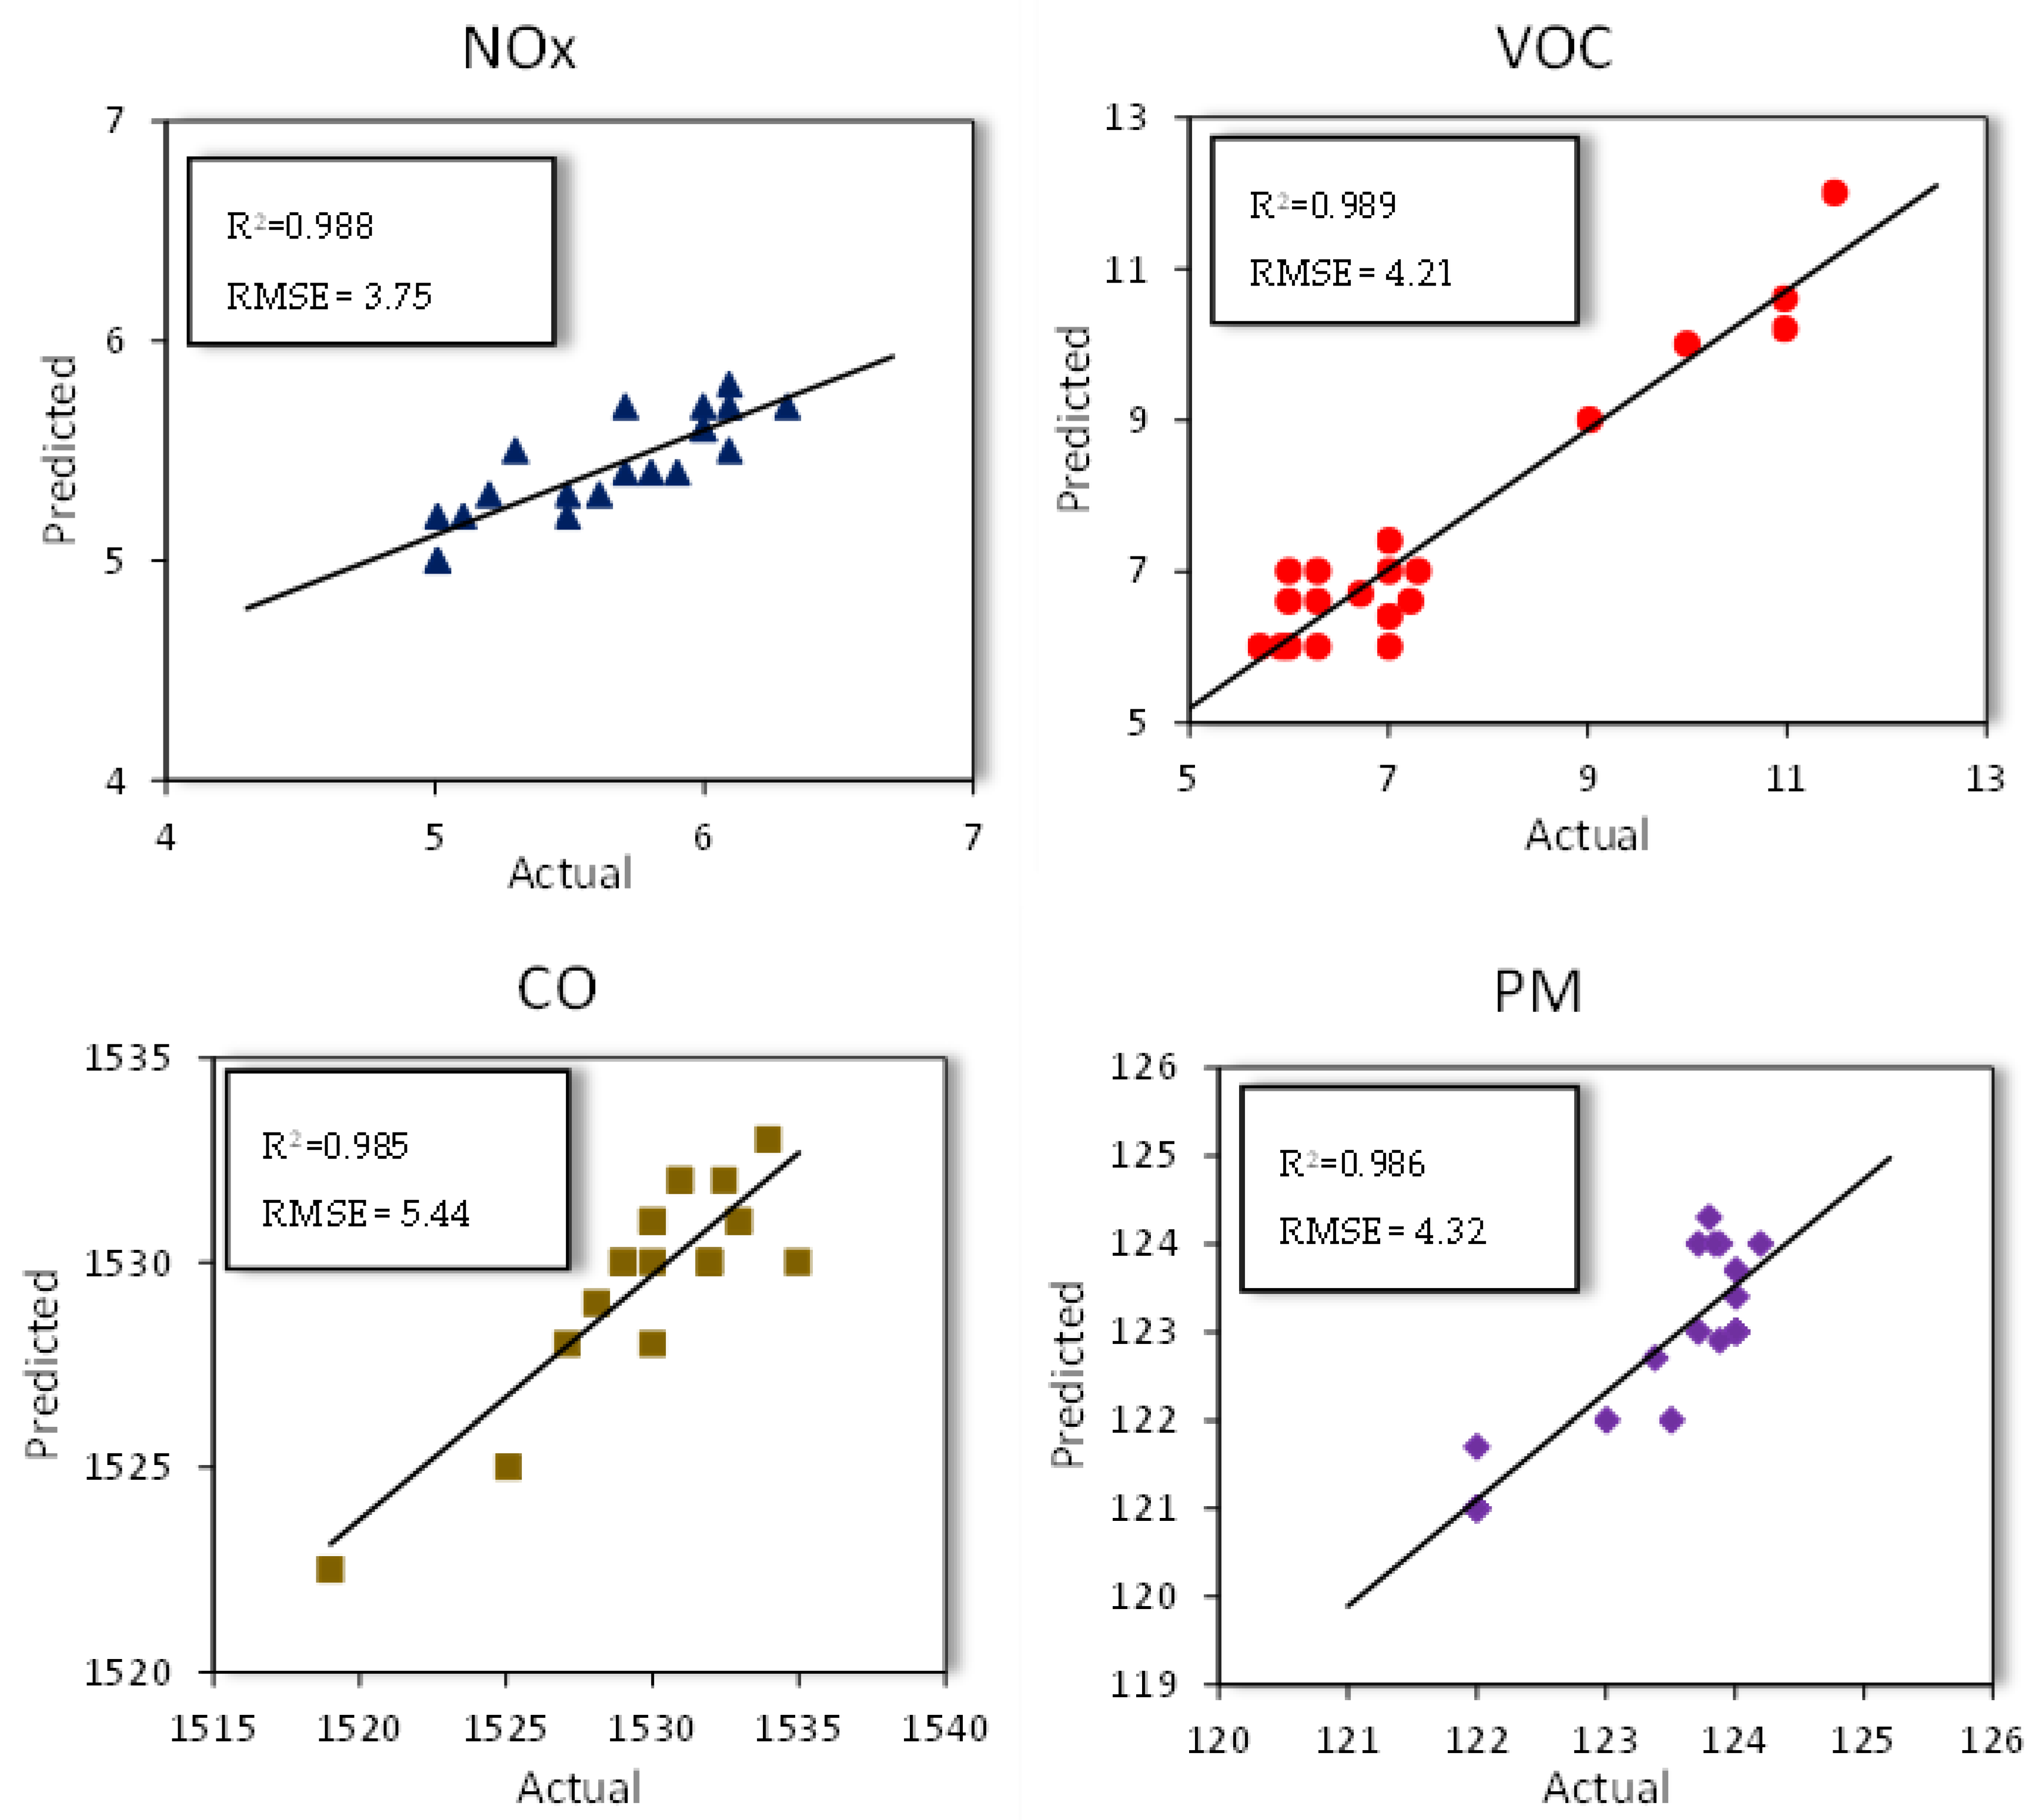

Table 1.
Recent analysis on air pollutants and smog through machine learning models.
| Reference | Location | Scope | ML Model used | Findings |
|---|---|---|---|---|
| [22] | Delhi, India | Air quality monitoring using temp, humidity , wind for PM only | RF and Adaboost Models | Accuracy for Adaboost reaches 98.24% which is highest among all the models |
| [23] |
Lahore, Pakistan | Analyze pollutants to determine main cause for respiratory diseases | RF, XGBoost, Logistic Regression Models | The models had been identified to be very accurate, F1-score, and ROC-AUC measures. PM 2.5 and PM 1.0 found to be main cause of respiratory and other health problems |
| [24] | Punjab, Pakistan | Predictive model to forecast PM 2.5 and PM10 | ANN Model | Model’s high accuracy (> 90%) in predicting air quality indices and identifying critical thresholds for smog |
| [25] | Delhi, India | Predictive model for PM 2.5 forecast | RF, ANN, SVM Models | RF gave the best results for both training and testing. Testing accuracy (R2 = 0.842, RMSE = 0.06, and MAE = 0.045) |
| [26] | Delhi, India | Predictive method to examine and measure how stubble burning affects air pollution | Gradient Boosting Regression Model | AQI change per 1% fire count increase varies between 0.08% and 0.38%, showing a consistent but varying impact. |
| [27] | Hong Kong | Develop machine learning-based models for predicting hourly street-level PM2.5 and NOx concentrations | RF, BRT, SVM, XGBoost, GAM, and Cubist Models | RF outperformed other MLAs with ten-fold cross validation (CV) R2 values higher than 0.81 and 0.62 for PM2.5 and NOx predictions, respectively. |
| [28] | Macau | Develop a dependable air pollution prediction model for Macau | RF, SVR, ANN, RNN, LSTM, GRU Models | The RF model best predicted PM10, PM2.5, NO2, and CO concentrations with the highest PCC and KTC in a daily air pollution prediction |
| [29] | Eastern China | Predictive model for daily NO2 concentrations | XGBoost Model | R2 of 0.75 and root-mean-square error (RMSE) of 9.11 μg/m3 |
| [30] | Lahore, Pakistan | Predictive model for Aerosol optical depth (AOD) used to estimate the extent of air pollution | SVR and SVR-GWO Models | SVR-GWO model (RMSE = 0.07, MAE = 0.06, R2=0.6) performed better than others |
| [31] | Dhaka, Bangladesh | Prediction model for the ground-level PM2.5 concentrations | RT, AR, REPT, RSS Models | The RSS model is the most suitable model for PM2.5 prediction, as shown by the lower MAE and RMSE values and a higher R2 value |
| [32] | Almaty, Kazakhstan | Prediction model for the ground-level PM2.5 concentrations | RNN, LSTM Models | LSTM is better at forecasting for 90 days (MAE = 2.0,MAPE = 11.57, RMSE = 2.18) |
| [33] | Visakhapatnam, India, | Prediction model for AQI | RF, Catboost, Adaboost, and XGBoost Models | Catboost and RF models performed best, howing maximum correlations of 0.9998 and 0.9936 |
Table 2.
Sources of Major Smog Components.
| Pollutant | Primary Sources | Contribution to Smog |
|---|---|---|
| Nitrogen Oxides (NOx) | - Vehicle exhaust (cars, trucks, buses) - Power plants and thermal electricity generation - Industrial combustion processes |
NOx reacts with volatile organic compounds (VOCs) under sunlight to form ozone and secondary PM. Major contributor to photochemical smog. |
| Particulate Matter (PM2.5, PM10) | - Vehicle exhaust (especially diesel) - Industrial emissions (cement, brick kilns, steel) - Construction dust and road dust - Biomass burning (wood, crop residue) |
Causes haze, reduced visibility, and respiratory diseases. PM2.5 penetrates deep into the lungs. |
| Volatile Organic Compounds (VOCs) | - Fuel evaporation and incomplete combustion from vehicles - Industrial solvents and chemical processes - Biomass burning |
VOCs react with NOx in sunlight to produce ozone and secondary organic aerosols, contributing to photochemical smog. |
| Sulfur Oxides (SO₂, SOₓ) |
- Coal and oil combustion in power plants - Industrial furnaces - Refineries |
Reacts in the atmosphere to form sulphate aerosols, contributing to acid smog and haze. |
| Ozone (O₃) | - Secondary pollutant formed by NOx + VOCs under sunlight | Not emitted directly, forms in the troposphere during photochemical reactions. High ozone concentrations irritate eyes, lungs, and worsen respiratory diseases. |
| Carbon Monoxide (CO) | - Incomplete combustion from vehicles, industries, and biomass burning | Reduces oxygen delivery in the body; indirectly contributes to photochemical smog formation. |
| Carbon Dioxide (CO₂) | - Fossil fuel combustion - Industrial processes |
Weak direct contribution to smog, but important greenhouse gas; acts as a tracer for emissions. |
Table 3.
Model Configurations and Hyperparameters.
| Model | Key Hyperparameters / Architecture | Values / Settings |
|---|---|---|
| Random Forest Regressor | Number of Trees (n_estimators) | 100 |
| Minimum Samples per Leaf (min_samples_leaf) | 1 | |
| Splitting Criterion | Mean Squared Error | |
| Random Seed | 42 | |
| XGBoost Regressor | Number of Trees (n_estimators) | 100 |
| Learning Rate (eta) | 0.1 | |
| Maximum Depth (max_depth) | 3 | |
| Subsample Fraction (subsample) | 1 | |
| Random Seed | 42 |
Disclaimer/Publisher’s Note: The statements, opinions and data contained in all publications are solely those of the individual author(s) and contributor(s) and not of MDPI and/or the editor(s). MDPI and/or the editor(s) disclaim responsibility for any injury to people or property resulting from any ideas, methods, instructions or products referred to in the content. |
© 2025 by the authors. Licensee MDPI, Basel, Switzerland. This article is an open access article distributed under the terms and conditions of the Creative Commons Attribution (CC BY) license (http://creativecommons.org/licenses/by/4.0/).
Copyright: This open access article is published under a Creative Commons CC BY 4.0 license, which permit the free download, distribution, and reuse, provided that the author and preprint are cited in any reuse.


