Submitted:
17 December 2025
Posted:
18 December 2025
You are already at the latest version
Abstract
Over the last decade, bark beetle outbreaks have significantly impacted forests in Central Europe, causing extensive loss of forest cover. We evaluated the impact of partial deforestation in three mountain forest catchments in the Jeseníky Mountains, comparing them with the unaffected Červík catchment (Beskydy Mountains) and the severely affected Pekelský stream catchment (Czech-Moravian Highlands). Atmospheric deposition in the catchments was similar, with total element input driven primarily by precipitation volumes rather than ion concentrations. We did not observe the hypothesized increase in DOC and nitrogen export, although nitrate outflow was slightly higher than atmospheric input in two cases. Significant export of calcium, magnesium, and bicarbonates was driven mainly by the geology of the individual catchments. The limited impact of bark beetle outbreaks on DOC dynamics can be attributed to the relatively low proportion of clear-cut areas and the rapid development of ground vegetation on impacted sites.
Keywords:
small forest catchment
; bark beetle outbreak
; elemental budget
; nitrogen leaching
; dissolved organic carbon
1. Introduction
Forest catchments play a key role in the hydrological cycle [1,2] and serve as a crucial source of high-quality drinking water for the human population in many regions. The chemical composition of surface waters draining from these catchments is a sensitive indicator of overall ecosystem health and its responses to external pressures [3,4,5,6,7]. Traditionally, the hydrochemistry of forest catchments has been understood as the outcome of a complex interplay of several factors, including the geological bedrock determining the baseline mineralization, soil processes, climatic conditions, forest management, and long-term inputs of atmospheric deposition.
Climate change, manifested mainly through more frequent and intense droughts [8,9,10], has weakened forest vitality [11,12,13] thereby creating conditions for massive outbreaks of the bark beetle (Ips typographus) [14,15,16]. Especially in Central Europe, where Norway spruce (Picea abies) was planted as the major productive species in even-aged monocultures, these outbreaks have led to devastating disturbances over large areas since 2018 [17]. In the Czech Republic, salvage logging peaked in the years 2018–2022, when the total amount of wood felled due to bark beetle infestation was nearly double the normal logging volume [18,19]. The total area of salvage clear-cuts created in 2018–2023exceeded 200,000 ha [20]. Significant loss of forest canopy cover was also reported from other Central European countries, e.g. 501,000 ha in Germany during the period 2018–2020 [21]. Unprecedented damage by bark beetle was reported by Hallas et al. [22] for Austria and by Carr et al. [23] for Poland, which led to justified concerns about the impact on ecosystem services, specifically regarding the capacity of forests to fulfill their ecological functions.
The loss of forest cover over large areas represents an abrupt change in site conditions and poses significant environmental risks connected with changes in micro-climatic conditions [24], soil erosion [25,26], increased decomposition of organic matter, nutrient leaching and carbon loss [27,28,29], and shifts in bacterial, fungal, vascular plants and insect populations [30,31,32,33]. The consequences of large-scale disturbances on the hydrological cycle [34,35], water quality and elemental cycling are not yet fully understood. Deforestation and soil surface disruption can accelerate the mineralization of organic matter, intensify nitrification, and lead to increased nutrient leaching, especially of nitrogen, into surface waters [36,37,38,39]. It remains an open question to what extent these new drivers override or modify traditional controlling factors, such as geology or the hydrological regime, and how catchments with different levels of disturbance respond.
In 2020, three small research catchments were established in the Jeseníky Mountains in the northeastern part of the Czech Republic (Central Europe) to study changes in the hydrological regime of forests affected by bark beetles [40]. In addition to detailed monitoring of meteorological and hydrological parameters [41], the chemical composition of atmospheric deposition and runoff water was measured to evaluate changes in the elemental balance of disturbed ecosystems. Given that the study in the Jeseníky Mountains is relatively short-term and data before the start of salvage logging are missing, we compare the results with two other long-term monitored forested catchments – i) the Pekelský stream in the Bohemian-Moravian Highlands at a lower altitude, which has also been strongly influenced by deforestation in the last decade, and ii) the Červík stream – a mountain catchment in the Beskydy Mountains with still intact forest cover.
The objectives of this study are to compare the input (atmospheric deposition) and output (runoff) of elements in individual catchments, discuss their relation to the clear-cut area, and evaluate their potential effect on ecological processes and water quality. We hypothesized that the intensity of recent disturbance would be the dominant factor explaining the differences in catchment functioning, and that its influence would outweigh traditional controls such as geology.
2. Materials and Methods
2.1. Study Area
In 2020, experimental monitoring was established in the Hrubý Jeseník Mts. within the catchments of three right-hand tributaries of the Černá Opava River: the Slučí (SL), Sokolí (SO) and Suchý (SU) streams (hereafter referred to collectively as the ‘3S’ catchments) (Figure 1). The aim was to assess the impact of the advancing bark beetle outbreak on hydrological conditions in mountain catchments.
The management strategies regarding the bark beetle outbreak differ among the catchments. While typical forest protection measures, involving salvage logging of infested stands, were applied in the SO catchment, the SU catchment includes a nature reserve (48.8 ha) where bark beetle control is prohibited and dead trees are left to decay. Part of the SL catchment falls within a Natura 2000 site (Birds Directive); here, felling of infested trees is permitted, but high stumps (~2 m) must be retained along the stream. All catchments are fully forested, with elevation ranging from 630 to 1216 m a.s.l. The parent material consists of igneous and metamorphic rocks (meta-granitoids, blastomylonites and quartzites), with fluvial sediments in the lower reaches. The most common soil types are Cambisols, Podzols and, at higher elevations, Leptosols. All the catchments belong to the cold climatic region C6-C7 according to Quitt’s classification [42].
The Pekelský stream (ZE) is a right-hand tributary of the Švihov (Želivka) drinking water reservoir in the Bohemian-Moravian Highlands and has been monitored since the 1970s [43]. The catchment covers an area of 124 ha, comprising 122 ha of forest land and 2 ha of agricultural (arable) land. The elevation ranges from 374 to 470 m a.s.l. The soil cover consists of deep Cambisols and Stagnosols of various subtypes, with moder humus forms developed on loams, slope debris, eluvium, and isolated Neogene clays and gravels. The geological bedrock consists of Moldanubian rocks, specifically medium- to coarse-grained biotite paragneisses. The area belongs to the moderately warm climatic region MW7 according to Quitt’s classification.
The Červík (CE) stream is located in the Moravian-Silesian Beskydy Mts. and has been monitored for more than 70 years [44]. The catchment has an area of 185 ha and is fully forested. The elevation ranges from 696 to 958 m a.s.l. The Červík stream flows into the Šance reservoir; the experimental catchment is situated in the upper headwaters. The bedrock is formed by sandstone and shale (flysch), overlain by Cambisols approximately 1 m deep. The lower part of the catchment belongs to the moderately warm region MW1 and the upper part to the cold climatic region C7 according to Quitt’s classification. Basic characteristics of each catchment are shown in Table 1.
2.2. Identification of Clear-Cut Areas
To quantify the area and development of clear-cuts in each catchment, georeferenced aerial imagery provided by the Czech Office for Surveying, Mapping and Cadastre (ČÚZK) was used. Orthophotos were acquired at three-year intervals until 2012, and subsequently at two-year intervals; these data are publicly available for download or via WMS services. The areas of newly created clearings were manually vectorized using ArcMap 10.5 software for the period 2006–2024.
2.3. Sampling of Atmospheric Deposition and Stream Water; Analytical Methods
Precipitation for chemical analyses was sampled in an open area (bulk deposition = wet + dry deposition) according to ICP Forests methods [45] using three funnels with a collection area of 500 cm2; water was collected in polyethylene vessels placed in soil pits to shield them from temperature fluctuations and sunlight. Samples were collected three times per month and subsequently pooled into volume-weighted composite samples on a monthly basis for chemical analysis.
Stream water samples were collected in polyethylene bottles on the same days as atmospheric deposition, at the respective catchment outlets (discharge measurement profiles). They were also pooled into monthly samples for chemical analysis.
The following parameters were analyzed: pH (potentiometrically) and alkalinity (titrimetrically) using a pH meter (798 MPT Titrino, Metrohm); conductivity (conductimetrically) using a conductometer (Orion 3 Star, Thermo Scientific); total nitrogen (TN) and dissolved organic carbon (DOC) by elemental analysis (TOC/TN analyzer Formacs, Skalar); anions (S-SO42-, N-NO3-, F-, Cl-) by ion chromatography (EcoIC, Metrohm); cations (Al, Ca, Cu, Fe, K, Mg, Mn, Na, Zn) by optical emission spectrometry (ICP OES 5110 VDV, Agilent Technologies) and N-NH4+ and P-PO43- by automated spectrometry (SANPlus, Skalar). The concentrations were expressed in mg·l−1; for statistical analysis, these concentrations were converted into meq·l−1.
The study is based on a two-year dataset from June 2022 to May 2024, which allows for comparison across all monitored catchments.
2.4. Hydrological Data
As previously mentioned, hydrological monitoring in the Hrubý Jeseník Mts. began in 2020. In contrast, the Červík and Pekelský stream catchments are among the longest-monitored small forested catchments in the Czech Republic, with records dating back to 1954 and 1976, respectively.
Precipitation in the Hrubý Jeseník catchments was monitored by three automatic meteorological stations (one in each catchment) and nine totalizers (three in each catchment). The meteorological stations measured air temperature, air humidity, global solar radiation, and precipitation continuously at 10-minute intervals. Precipitation was measured using a Pronamic Pro (Skjern, DK) rain gauge with a 200 cm2 collection area and 0.2-mm resolution. Data were stored on a Greybox N2N datalogger (EMS Brno, Czech Republic), powered by a solar panel and a battery system. Since the rain gauges were unheated, precipitation measurements during the winter season relied on totalizers, which were measured manually every three months, starting at the beginning of the hydrological year (1 November). The areal precipitation for each catchment was calculated using the Horton method [46]. Water levels in the Hrubý Jeseník Mts. were measured using LMP307 hydrostatic submersible pressure sensors (FIEDLER AMS, Czech Republic) installed in natural, unmodified stream beds [40].
Precipitation in the Červík and Pekelský stream catchments was monitored using the same instrumentation as in the Hrubý Jeseník Mts., i.e., rain gauges and four totalizers per catchment. Discharge was measured in open rectangular flumes, with water levels converted to discharge using rating curves. Water levels were monitored using PSH-30 float gauges and TSH22 pressure and temperature sensors (both FIEDLER AMS), with data managed via Fiedler M4016 control units.
2.5. Elemental Budgets of the Catchments
Annual elemental budgets for the individual catchments were determined based on a two-year monitoring period (June 2022–May 2024). The budget was defined as the difference between elemental input via atmospheric deposition and output via runoff. Input was quantified based on the chemical analysis of bulk deposition and monthly precipitation volumes in each catchment. Output was determined from stream discharge and monthly chemical analyses (see Section 2.3). The mean annual values were derived by averaging the data from the two monitored years, with the net balance calculated as the difference between annual input and annual output. The resulting values are expressed in kg·ha−1·yr−1.
2.6. Statistical Methods
All statistical analyses were performed using the open-source software R, version 4.5.1 [47].
2.6.1. Compositional Data Analysis (CoDa)
In numerous studies, hydrochemical data are treated as compositional data, represented by a matrix of non-negative relative values constrained by a constant sum [48,49,50,51,52,53]. The application of standard statistical methods to such data can lead to misleading inferences and spurious correlations [48,54,55]. To analyze these data correctly, transformations such as log-ratios are employed to map the compositions into (standard) Euclidean space, enabling the use of conventional multivariate techniques. Alternatively, methods that operate directly within the simplex geometry of compositional data can be applied.
The ILR-ION plot was used as a visualization tool derived from Compositional Data Analysis (CoDA), specifically using isometric log-ratio (ilr) transformations to represent major ion composition in water samples. This approach mitigates the limitations of traditional plots like the Piper diagram, such as data compression and overlap at plot boundaries, by expanding edge data and clustering central data for clearer interpretation [52,56,57]. Four coordinates convert the compositional data from the simplex to real space [49]:
2.6.2. Principal Component Analysis (PCA) on Isometric Log-Ratio (Ilr) Transformed Data
Principal Component Analysis (PCA) was applied to the isometric log-ratio transformed data.
The initial matrix containing eight compositional variables (Ca2+, Mg2+, Na+, K+, Cl− , SO42− , HCO3-, NO3-) was transformed into seven orthogonal ilr variables. These transformed variables were then merged with standardized supplementary variables (EC, pH, DOC, TN), and the combined dataset was subjected to PCA. The ilr transformation and PCA were performed in the R environment [47], utilizing the ‘compositions’ package [58]. Samples were visualized in a biplot based on their PC scores, and their grouping was highlighted using 95% confidence ellipses.
3. Results
3.1. Spatiotemporal Dynamics of Clear-Cuts
The intensity and timing of disturbances in the respective catchments were quantified by analyzing the area of new clear-cuts (ha) within defined time intervals, determined by the availability of aerial imagery (Table 2). Data for the reference catchment CE are not presented, as no significant logging occurred there during the study period. Between 2003 and 2016, logging activity in all monitored catchments was minimal, with clear-cut areas generally not exceeding 1.5 ha per interval. A marked increase in logging, indicating the onset of the bark beetle outbreak, was recorded in the period 2016–2018.
This escalation continued in the subsequent intervals (2018–2020 and 2020–2022), representing the peak of the disturbances. The intensity of disturbance differed substantially among the catchments. The highest and most sustained disturbance occurred in the ZE catchment, where 39.9 ha (32.1% of the catchment area) was logged during the critical four-year period 2018–2022. Catchments in the Jeseníky Mountains were also significantly affected, mainly at lower elevations (up to 800 m a.s.l.); however, the relative extent of the disturbance was lower. In SO, the clear-cut area in 2018–2022 reached 26.5 ha (6.7% of the area), while in SL it was 24.5 ha (6.2%) and in SU 13.3 ha (6.5%). During the period of hydrochemical data collection (2022–2024), logging activity nearly ceased in SL and SU, while in SO and ZE it persisted (6.1 ha and 7.1 ha, respectively).
3.2. Precipitation and Stream Water Chemistry
The chemistry of precipitation is summarized in Table 3. In the Jeseníky Mts., precipitation was monitored at a single site due to the close proximity of the individual catchments. Although there were no pronounced differences in the chemical composition of precipitation among the three regions, the Jeseníky Mts. exhibited the lowest concentrations of potassium (K+) and magnesium (Mg2+) ions (0.29 mg·l−1 and 0.06 mg·l−1, respectively). Calcium concentrations (Ca2+) were also slightly lower (0.28 mg·l−1) compared to CE (0.31 mg·l−1) and ZE (0.35 mg·l−1). Concentrations of nitrate (NO3−), total nitrogen (TN), and ammonium (NH4+) were lowest in the Jeseníky Mts. and highest in the CE catchment. In contrast, dissolved organic carbon (DOC) was highest in the Jeseníky Mts (3.02 mg·l−1, compared to 2.20 mg·l−1 in CE and 2.65 mg·l−1 in ZE).
Table 4 summarizes the runoff chemistry in the monitored streams. The pH of runoff (7.0–7.8) was uniformly higher than the pH of precipitation water (5.4–5.7) in all catchments. The electrical conductivity (EC) of runoff was several times higher than that of precipitation; values in the Jeseníky Mts. (61.84 μS·cm−1 – 87.04 μS·cm−1) were slightly higher than in CE (60.83 μS·cm−1) but lower than in ZE (144.7 μS·cm−1). This reflects the concentration of base cations and sulfates, which were distinctly higher in ZE than in the other catchments. Ammonium concentrations were very low in all catchments (0.01-0.02 mg·l−1), whereas nitrate concentrations were consistently higher than in precipitation. The highest nitrate levels were observed in ZE (3.80 mg·l−1), followed by intermediate levels in the Jeseníky Mts. catchments (2.32-3.52 mg·l−1) and the lowest in CE (1.32 mg·l−1).
Differences in runoff chemistry among the studied catchments are clearly illustrated in Figure 2. The Slučí stream (SL) exhibits significantly lower concentrations of calcium, magnesium, and sulfates compared to the other Jeseníky Mts. catchments. The elevated values of most parameters in the ZE catchment, including pH and electrical conductivity, are also notable.
3.3. Retention and Export of Elements
To assess the function of the individual catchments as sources or sinks of elements, net annual budgets (output via runoff minus input via precipitation) were calculated (Figure 3, Table 5). All catchments functioned as net sources of weathering products, especially calcium (Ca2+) with a mean export of over 21 kg·ha−1·yr−1 and bicarbonates (HCO3−), reflecting the dominance of chemical weathering processes over atmospheric deposition. The ZE catchment exhibited the highest release of HCO3− (70.68 kg·ha−1·yr−1) and Na+ (15.02 kg·ha−1·yr−1). This confirms that the gneissic crystalline bedrock (paragneiss) with a rich feldspar content undergoes intense weathering, which releases large amounts of Na+ and Ca2+. The Jeseníky catchments (SL, SO, SU) showed the lowest net release of HCO3− (mean 39 kg·ha−1·yr−1), which is consistent with the low absolute concentrations of HCO3− in these waters and their lower buffering capacity compared to CE and ZE.
All catchments acted as significant sinks for total nitrogen, with CE showing the highest retention (-8.25 kg·ha−1·yr−1), indicating intense biological consumption or accumulation of nitrogen in soils. All catchments were also net sources of chloride Cl- (except SL), with the ZE catchment being the largest source (6.37 kg·ha−1·yr−1).
All catchments acted as sinks for DOC, with the ZE showing the lowest retention (-4.24 kg·ha−1·yr−1).
3.4. Hydrochemical Characteristics of Catchments
The hydrochemical characteristics of the catchments, based on the analysis of isometric log-ratios of major ions, are presented in the ILR-ION plot (Figure 4). The upper left panel shows the balance between Ca2+ and Mg2+ (x-axis) and the balance between Cl− and SO42− (y-axis). Data for all monitored streams plot on the positive side of the x-axis, indicating that Ca2+ concentrations are generally higher than those of Mg2+. Concurrently, all samples exhibit negative y-coordinates, indicating higher concentrations of SO42− compared to Cl-.
Despite these common features, significant differences can be observed among the catchments. The CE catchment is clearly distinct, primarily due to a very low Ca2+ to Mg2+ ratio. The ZE catchment is characterized by the highest ratio of chlorides to sulfates. The values from the three Jeseníky Mts. catchments also differ, although SL and SO are clustered closer to each other than to SU.
The upper right panel (Figure 4B) displays the balance between Cl−/SO42− and HCO3- (x-axis) versus Cl− and SO42− (y-axis). The negative coordinate on the x-axis indicates that HCO3- is the dominant anion. Bicarbonates in natural surface waters originate mainly from the weathering of geological bedrock.
The lower left panel (Figure 4C), where the y-axis represents the balance between alkaline earth metals (Ca2+, Mg2+) and the alkali metals (Na+ + K+), allows for the classification of waters based on their compositional type. While the SU, SL, and SO catchments belong to the Ca-dominant type (Ca2+ cations predominate), the ZE and CE catchments are classified as a mixed cation type, falling between the Ca, Mg, and Na+K categories. The mean values of isometric log-ratio coordinates z1, z2, z3, and z4 for the studied catchments are presented in Table 6.
The chemical composition of the three Jeseníky catchments corresponds to the classic calcium-bicarbonate type. This composition is primarily influenced by silicate weathering of the bedrock [59], which predominantly includes silicate metamorphic rocks (phyllites, schists, metagranitoids) and, locally, metabasites (amphibolites). Positive z1 values (ranging from 0.48 to 0.67) indicate that the weathering of minerals supplying divalent cations is the main source of dissolved ions, a feature typical of environments containing metabasites and metagranitoids.
Furthermore, high positive z2 values (0.94 to 1.11) demonstrate that the weathering of Ca-silicates (plagioclase, amphibole) is the dominant cation release mechanism. The z3 values confirm that water composition is primarily governed by natural weathering processes. Negative z3 values (ranging from -1.13 to -0.84) reflect the dominance of weathering-derived bicarbonate over the input of strong acid anions (Cl− and SO42−). Negative z4 values (ranging from -1.49 to -1.29) indicate that sulfate (SO42−) prevails over chloride (Cl−). This suggests a minor but discernible influence of atmospheric sulfur deposition or sulfide weathering in the bedrock.
The SO catchment exhibits the greatest dominance of weathering-derived HCO3-. In contrast, the SU catchment displays the relatively highest proportion of Cl−/SO42−. Notably, this catchment also has the lowest z2 value (0.94), indicating a relatively higher magnesium content in relation to calcium. This distinction is strongly associated with the presence of metabasites (greenschist/amphibolite) in the bedrock, making the SU catchment unique among the three.
The CE catchment serves as a reference for waters whose chemistry is controlled by flysch sedimentary bedrock. The waters are of the calcium-bicarbonate type; however, the relatively low z2 value (0.18) indicates that Ca2+, Mg2+ concentrations are comparable. This higher relative proportion of magnesium is characteristic of the weathering of dolomitic cements or clay minerals within the flysch strata. The negative z3 value (-0.80) confirms that the water composition is dominated by weathering-derived bicarbonate (HCO3-), with minimal influence from acid anion input. Nevertheless, the negative z4 value (-1.54) points to a strong dominance of sulfate (SO42−) over chloride (Cl−) among external anions. This suggests that, despite the generally pristine character of the catchment, the chemical balance is affected by regional atmospheric sulfur deposition and/or the oxidation of sulfides (e.g., pyrite) within the claystone components of the flysch.
The ZE catchment, characterized by a geological setting dominated by paragneiss rich in biotite and feldspars, exhibits a distinct hydrochemical signature of highly weathered crystalline bedrock. The water is of a mixed bicarbonate type with a high proportion of alkali metals. The low mean z1 value (0.05) indicates that divalent cations (Ca2+, Mg2+) are almost equally represented in the composition relative to monovalent cations (Na+, K+). The high concentration of bicarbonates (38.47 mg·l−1) reflects intense chemical weathering of the bedrock, providing the water with a high buffering capacity against acidification. The z3 value (-0.78) demonstrates that, despite the high mean concentration of sulfates (22.94 mg·l−1), bicarbonate remains the dominant anion. However, the high absolute concentration of sulfates and the z4 value (-0.96) indicate a strong regional influence of both sulfates and chlorides.
3.5. Principal Component Analysis (PCA)
Principal Component Analysis (PCA) was performed on a data matrix consisting of seven ilr-transformed compositional variables (ilr1 to ilr7) representing the ratios of major ions, and four standardized supplementary variables (EC, pH, DOC, TN). The first three principal components (PCs) cumulatively explained 92.63% of the total variance in the data. Consequently, the first three components were retained for interpretation and visualization, providing a robust description of the main patterns in the dataset.
The correlations between the Principal Components (PC1, PC2, PC3), the ilr-transformed compositional variables and the standardized supplementary variables are shown in Table 7. The correlations between the ilr vectors and the original, untransformed variables are presented in Table 8.
The first principal component (PC1) accounts for a dominant share of the variance (59.44%) and is interpreted as the main gradient of total mineralization and dissolved substance content. The strongest and most statistically significant positive correlations with PC1 were observed for electrical conductivity (EC; r = 0.960, p < 0.001), dissolved organic carbon (DOC; r = 0.856, p < 0.001), and pH (r = 0.810, p < 0.001). Among the ilr variables, ilr3 (representing total ionic enrichment excluding Ca2+) and ilr7 (representing the influence of salts, especially NaCl), also showed strong positive correlations. Consequently, waters with high positive PC1 scores are characterized by high total mineralization, elevated pH, and high organic matter content. Conversely, negative PC1 scores indicate dilute, nutrient-poor, and more acidic waters.
The second principal component (PC2) accounts for an additional 21.53% of the variance and is interpreted as a contrast between the influence of nitrogenous substances and weathering and leaching processes. Its negative pole is defined by two key, strongly correlated indicators: total nitrogen (TN; r = -0.805, p < 0.001) and ilr1 (r = -0.754, p < 0.001), which represents the ratio of nitrates to base cations and buffering capacity. Conversely, several variables are positively correlated, most notably ilr6 (r = 0.764, p < 0.001), representing the ratio of base cations to nitrates, and dissolved organic carbon (DOC; r = 0.302, p < 0.001). A negative score on PC2 therefore represents a strong influence of nitrogen, both in terms of its total amount and its relative dominance, while a positive score is associated with water chemistry dominated by the products of bedrock weathering and organic matter leaching from soil horizons.
The third principal component (PC3) accounts for an additional 11.96% of the variance and is interpreted as an acidity gradient, contrasting waters with higher pH against those acidified by organic matter decomposition. The positive pole of this axis shows a strong, significant correlation with pH (r = 0.559, p < 0.001). The negative pole is defined by a significant negative correlation with dissolved organic carbon (DOC; r = -0.378, p < 0.001) and several ilr variables associated with acid leaching (ilr6, ilr4). A positive score on PC3 thus indicates waters that are less acidic, while a negative score indicates waters where acidity is strongly influenced by organic acids.
The projection of the individual catchments into the space defined by the first two components (Figure 5) revealed a clustering into three distinct hydrochemical types. The ZE catchment formed a separate, clearly demarcated group with high positive values on the PC1 axis, which confirms its character as a catchment with highly mineralized and organic-rich waters. Its most striking feature is the broad scatter of values along the PC2 axis, ranging from strongly positive to strongly negative. This high variability suggests that the catchment functions as a dynamic and potentially unstable system. It likely alternates between periods when water chemistry is dominated by weathering products (positive PC2 scores, e.g., during baseflow) and episodes of nitrogen leaching (negative PC2 scores), which are typical of disturbed ecosystems following rainfall events.
At the opposite end of the PC1 gradient were the CE and SL catchments, which formed a second distinct cluster. Their strong negative scores on PC1 characterize them as catchments with dilute, nutrient-poor, and more acidic waters. However, these two catchments differ along the PC2 axis. The CE catchment (Beskydy) shows a predominantly positive score on PC2, which corresponds to its character as the least disturbed catchment, where water chemistry is controlled primarily by natural weathering and leaching processes. In contrast, the SL catchment (Jeseníky) is shifted toward lower PC2 values, indicating a slightly higher relative influence of nitrogen.
The SO and SU catchments are located in the center of the ordination diagram with PC1 values close to zero, characterizing them as transitional catchments. However, a key feature is their significant scatter along the PC2 axis, ranging from positive to strongly negative values. This confirms that in these moderately mineralized catchments, the primary driver of internal variability is the dynamics of nitrogen, where conditions dominated by natural leaching processes alternate with periods under the strong influence of nitrogen.
The biplot of PC1 vs. PC3 (Figure 6) provides a complementary view, separating the catchments based on mineralization and the nature of acidity. This visualization highlights a key distinction within the group of mountain catchments. The CE catchment is not only the most dilute (low PC1 scores) but is also characterized by negative scores on PC3, identifying it as a system where acidity is governed by organic matter. In contrast, the Jeseníky catchments (SL, SO, SU), while also dilute, exhibit positive scores on PC3, indicating that their chemistry is less influenced by organic acids. The ZE catchment, due to its high buffering capacity, generally maintains a relatively high pH (positive PC3 scores) despite its high DOC content.
4. Discussion
4.1. Atmospheric Deposition
The input of elements via atmospheric deposition can substantially influence the chemistry of surface waters in catchments. The strong impact on forest ecosystems and stream water quality resulting from high loads of sulfates and nitrates during the late 20th century in Central and Northern Europe is well documented [60,61]. Our data confirm the currently relatively low input of these acidifying compounds in all three studied regions, which is consistent with trends in air pollution observed over the last three decades [62,63]. The positive effect of decreased pollution on stream water chemistry has been observed throughout Europe [64,65,66]. The total input of sulfates, nitrates and ammonium is driven primarily by precipitation volumes rather than by the differences in ion concentrations across the respective regions.
It should be acknowledged that our data represent bulk deposition, which includes wet deposition and the part of dry deposition accumulated on the collectors. However, actual dry deposition in forested areas is higher because of the high surface roughness of tree crowns, especially in coniferous species [67,68]. Throughfall deposition (collected beneath the tree crown) corrected by the appropriate canopy exchange model [69] would be more precise, although even this procedure can underestimate the input of some nitrogenous compounds in mountain areas [70]. On the other hand, we were looking for enhanced export of organic compounds from catchments. If we cannot detect this even with slightly underestimated inputs, the result should be reliable.
4.2. Disturbance Effect on Runoff Chemistry
We hypothesized that the intensity of the recent bark beetle outbreak would be reflected in the chemical composition of stream water. Although this study is limited to only two years of hydrological monitoring in the Jeseníky Mountains, we expected an effect on the dynamics of dissolved organic carbon (DOC) and nitrate [71,72] compared to the undisturbed CE catchment. While there are differences in ion balance among the studied catchments, we observed net retention of DOC and total nitrogen. This pattern suggests that the ecosystem is still capable of retaining organic carbon released in clear-cuts and that nitrogen saturation has not yet been reached. The rapid development of ground vegetation (Calamagrostis villosa, Rubus idaeus) on clear-cuts likely acts as a temporary nitrogen sink, compensating for the loss of uptake by mature trees [73].
However, the high variability of nitrate and total nitrogen concentrations in the ZE catchment, as revealed by the PCA and boxplots, shows that this retention is less stable than in the undisturbed CE catchment. This is even more evident if we compare current nitrate concentrations in the runoff water of Pekelský stream (4.27 mg·l−1) with those reported by Lochman [74] or Vícha et al. [75] for the period before the bark beetle outbreak (around 2.00 mg.l−1). Episodic leaching events, likely driven by hydrological flushes or droughts [76,77], are highly probable in Pekelský stream, even if the annual budget remains negative. In contrast, the higher-elevation mountain catchments (SO, SL) exhibited slight nitrate leaching, despite receiving lower inputs, although the overall nitrogen balance remained negative. The comparison between ZE on one hand and SO, SL, and SU on the other indicates that environmental conditions favourable for vegetation growth (warmer climate, lower altitude) can enhance the resilience of the nitrogen cycle following disturbance [78].
Other studies also document a short-term increase in the concentrations of Ca2+, Mg2+, and Na+ cations after logging, followed by a relatively rapid return to pre-logging levels. For example, Oda et al. [79] reported a short-term increase in Ca2+, Mg2+, and Na+ concentrations in an experiment with paired catchments in the period up to one year after clear-cutting. Similar observations were made by Swank et al. [80]. Webster et al. [81] recorded an initial increase in Ca2+, Mg2+, and Na+ concentrations in waters from clear-cut, selective, and shelterwood cut catchments compared to control catchments, followed by a return to pre-harvest conditions approximately 4–6 years after harvesting. This is attributed to reduced plant uptake following logging, increased decomposition and mineralization rates of litter, and increased runoff generation due to limited evapotranspiration [82,83]. In our specific case, given the net retention of DOC and nitrogen, we do not attribute the relatively high export of base cations to the recent clear-cutting. Instead, this process is likely determined by local geology and the release of sulfates and associated cations—a legacy of the significant acidification period that affected these sites in the second half of the 20th century [84,85].
Mikkelson et al. [83] suggest that the effects of bark beetle outbreaks on water quality cannot be generalized, as they are difficult to predict and potentially regionally distinct. Schmidt et al. [38] found that several stream water parameters, including DOC and nitrate, responded in a catchment-specific manner and with varying lag times following forest disturbance. In the present study, the lack of a clear effect of the outbreak on DOC and nitrate release can be attributed to the short time elapsed since the disturbance, but mainly to the relatively small extent of the affected area in the Jeseníky catchments compared to other studies [86].
4.3. The Dominant Role of Geology in Individual Catchments
The geological bedrock remains the primary determinant of the hydrochemical baseline, particularly for major base cations (Ca2+, Mg2+, Na+) [87]. The distinct separation of the ZE catchment from the Jeseníky (SL, SO, SU) and Beskydy (CE) catchments in the PCA analysis underscores the importance of the mineralogical composition of the bedrock [88]. The paragneiss underlying ZE is generally is expected to be more susceptible to weathering than the phyllites and quartzites of the Jeseníky catchments and the flysch of the Beskydy Mountains [89,90]. This is evidenced by the significantly higher concentrations of base cations and alkalinity in ZE, despite it being the most disturbed catchment. These results suggest that while deforestation may increase runoff and leaching potential, the reservoir of available elements in the soil and bedrock dictates the magnitude of these fluxes [91].
A notable feature demonstrating the sensitivity of stream chemistry to local lithology is the magnesium (Mg) anomaly in the SU catchment. The presence of metabasite intercalations (rich in Mg-silicates) resulted in elevated Mg concentrations compared to the nearby SL and SO catchments, despite similar climatic conditions and disturbance levels [92]. This confirms that even in small headwater catchments, fine-scale geological heterogeneity plays a crucial role that cannot be ignored when assessing disturbance effects.
5. Conclusions
The results obtained do not indicate a clear influence of the bark beetle outbreak in the Jeseníky Mts. on the chemistry of outflow from the forest catchments. The DOC export is significantly lower than the atmospheric input and also lower than export from the undisturbed catchment of the Červík stream (CE) in the Moravian-Silesian Beskydy Mts. or the disturbed Pekelský stream (ZE) in the lower-elevation Czech-Moravian Highlands. Nitrogen export was higher than atmospheric input in two catchments (SL and SO), but only by 0.24 and 0.61 kg·ha−1·yr−1, respectively. Nitrate concentrations in runoff were relatively low (2.82 and 3.52 mg·l−1), and the net total nitrogen export was negative. We conclude that the relatively limited extent of clear-cuts and the rapid development of ground vegetation prevented more distinct changes in the elemental balance of the Jeseníky Mts. catchments.
In contrast, stream water chemistry is primarily driven by geological conditions. Compositional Data Analysis (CoDa) revealed distinct hydrochemical signatures governed by the mineralogical composition of the bedrock, distinguishing the Jeseníky Mts. catchments from both the Pekelský and Červík catchments.
Our findings confirm that geological heterogeneity, such as the specific mineral composition of metamorphic rocks, determines the baseline mineralization and buffering capacity of individual catchments. Consequently, local lithology acts as the dominant factor that can override or mask the hydrochemical signals of forest disturbances. The relatively high export of basic cations and bicarbonates suggests active weathering and raises the question of the extent to which soil Ca and Mg reserves are being further depleted. Assessing the balance between weathering rates and elemental export is therefore crucial for predicting the future health of these forest ecosystems.
Author Contributions
Conceptualization, Kateřina Neudertová Hellebrandová, Vít Šrámek, Věra Fadrhonsová; Methodology, Kateřina Neudertová Hellebrandová, Vít Šrámek, Věra Fadrhonsová; Formal analysis and investigation, Kateřina Neudertová Hellebrandová, Vít Šrámek, Věra Fadrhonsová; Writing - original draft preparation, Kateřina Neudertová Hellebrandová, Vít Šrámek, Writing - review and editing: Vít Šrámek, Věra Fadrhonsová; Software, Kateřina Neudertová Hellebrandová; Validation, Kateřina Neudertová Hellebrandová, Vít Šrámek; Supervision, Vít Šrámek. All authors have read and agreed to the published version of the manuscript.
Funding
This research was funded by National Agency for Agricultural Research, Czech Republic, project No. QK22010189.
Data Availability Statement
The datasets presented in this article are not readily available because the data are part of an ongoing study and further analysis is planned. Requests to access the datasets should be directed to Kateřina Hellebrandová (hellebrandova@vulhm.cz).
Acknowledgments
We would like to thank the Bishopric of Ostrava-Opava, on whose forest property the Slučí, Sokolí, and Suchý (3S) catchments are located, for their technical cooperation in field measurements and data collection. We also thank the Czech Hydrometeorological Institute for their assistance with discharge measurements and hydrological data processing in these catchments.
Conflicts of Interest
The authors declare no conflicts of interest.
References
- Zhang, M.; Wei, X. Deforestation, Forestation, and Water Supply. Science 2021, 371, 990–991. [Google Scholar] [CrossRef] [PubMed]
- Filoso, S.; Bezerra, M.O.; Weiss, K.C.B.; Palmer, M.A. Impacts of Forest Restoration on Water Yield: A Systematic Review. PLoS ONE 2017, 12, e0183210. [Google Scholar] [CrossRef] [PubMed]
- Carvalho-Santos, C.; Honrado, J.P.; Hein, L. Hydrological Services and the Role of Forests: Conceptualization and Indicator-Based Analysis with an Illustration at a Regional Scale. Ecological Complexity 2014, 20, 69–80. [Google Scholar] [CrossRef]
- Neary, D. Long-Term Forest Paired Catchment Studies: What Do They Tell Us That Landscape-Level Monitoring Does Not? Forests 2016, 7, 164. [Google Scholar] [CrossRef]
- Caldwell, P.V.; Martin, K.L.; Vose, J.M.; Baker, J.S.; Warziniack, T.W.; Costanza, J.K.; Frey, G.E.; Nehra, A.; Mihiar, C.M. Forested Watersheds Provide the Highest Water Quality among All Land Cover Types, but the Benefit of This Ecosystem Service Depends on Landscape Context. Science of The Total Environment 2023, 882, 163550. [Google Scholar] [CrossRef]
- Meli, P.; Ellison, D.; Ferraz, S.F.D.B.; Filoso, S.; Brancalion, P.H.S. On the Unique Value of Forests for Water: Hydrologic Impacts of Forest Disturbances, Conversion, and Restoration. Global Change Biology 2024, 30, e17162. [Google Scholar] [CrossRef]
- Cui, X.; Ouyang, W.; Wang, J.; Tulcan, R.X.S.; Zhu, W. The Neglected Role of Forest Eco-Hydrological Process Representation in Regulating Watershed Nitrogen Loss. Water Research 2025, 282, 123735. [Google Scholar] [CrossRef]
- Fernández, F.J.; Vásquez-Lavín, F.; Ponce, R.D.; Garreaud, R.; Hernández, F.; Link, O.; Zambrano, F.; Hanemann, M. The Economics Impacts of Long-Run Droughts: Challenges, Gaps, and Way Forward. Journal of Environmental Management 2023, 344, 118726. [Google Scholar] [CrossRef]
- Szejner, P.; Belmecheri, S.; Ehleringer, J.R.; Monson, R.K. Recent Increases in Drought Frequency Cause Observed Multi-Year Drought Legacies in the Tree Rings of Semi-Arid Forests. Oecologia 2020, 192, 241–259. [Google Scholar] [CrossRef]
- Spinoni, J.; Vogt, J.V.; Naumann, G.; Barbosa, P.; Dosio, A. Will Drought Events Become More Frequent and Severe in Europe? Intl Journal of Climatology 2018, 38, 1718–1736. [Google Scholar] [CrossRef]
- Grieger, S.; Kappas, M.; Karel, S.; Koal, P.; Koukal, T.; Löw, M.; Zwanzig, M.; Putzenlechner, B. Impact of Forest Disturbance Derived from Sentinel-2 Time Series on Landsat 8/9 Land Surface Temperature: The Case of Norway Spruce in Central Germany. ISPRS Journal of Photogrammetry and Remote Sensing 2025, 228, 388–407. [Google Scholar] [CrossRef]
- Rukh, S.; Sanders, T.G.M.; Krüger, I.; Schad, T.; Bolte, A. Distinct Responses of European Beech (Fagus Sylvatica L.) to Drought Intensity and Length—A Review of the Impacts of the 2003 and 2018–2019 Drought Events in Central Europe. Forests 2023, 14, 248. [Google Scholar] [CrossRef]
- Schuldt, B.; Buras, A.; Arend, M.; Vitasse, Y.; Beierkuhnlein, C.; Damm, A.; Gharun, M.; Grams, T.E.E.; Hauck, M.; Hajek, P.; et al. A First Assessment of the Impact of the Extreme 2018 Summer Drought on Central European Forests. Basic and Applied Ecology 2020, 45, 86–103. [Google Scholar] [CrossRef]
- Lukeš, P. Monitoring of Bark Beetle Forest Damages. In Big Data in Bioeconomy; Södergård, C., Mildorf, T., Habyarimana, E., Berre, A.J., Fernandes, J.A., Zinke-Wehlmann, C., Eds.; Springer International Publishing: Cham, 2021; pp. 351–361. ISBN 978-3-030-71068-2. [Google Scholar]
- Das, A.K.; Baldo, M.; Dobor, L.; Seidl, R.; Rammer, W.; Modlinger, R.; Washaya, P.; Merganičová, K.; Hlásny, T. The Increasing Role of Drought as an Inciting Factor of Bark Beetle Outbreaks Can Cause Large-Scale Transformation of Central European Forests. Landsc Ecol 2025, 40, 108. [Google Scholar] [CrossRef]
- Brázdil, R.; Zahradník, P.; Szabó, P.; Chromá, K.; Dobrovolný, P.; Dolák, L.; Trnka, M.; Řehoř, J.; Suchánková, S. Meteorological and Climatological Triggers of Notable Past and Present Bark Beetle Outbreaks in the Czech Republic. Clim. Past 2022, 18, 2155–2180. [Google Scholar] [CrossRef]
- Hlásny, T.; König, L.; Krokene, P.; Lindner, M.; Montagné-Huck, C.; Müller, J.; Qin, H.; Raffa, K.F.; Schelhaas, M.-J.; Svoboda, M.; et al. Bark Beetle Outbreaks in Europe: State of Knowledge and Ways Forward for Management. Curr Forestry Rep 2021, 7, 138–165. [Google Scholar] [CrossRef]
- Zahradník, P.; Zahradníková, M. Salvage Felling in the Czech Republic‘s Forests during the Last Twenty Years. Central European Forestry Journal 2019, 65, 12–20. [Google Scholar] [CrossRef]
- Lubojacký, J.; Véle, A.; Samek, M.; Lorenc, F.; Knížek, M. Hlavní Problémy v Ochraně Lesa v Česku v Roce 2024 a Prognóza Na Rok 2025. In Proceedings of the Škodliví činitelé v lesích Česka 2024/2025, Ochrana lesa a ochrana přírody; Lorenc, F., Véle, A., Knížek, M., Eds.; Zpravodaj ochrany lesa: Průhonice, 2025; Volume 28, pp. 18–25. [Google Scholar]
- Křístek, Š.; Apltauer, J.; Dušek, D.; Kačmařík, V.; Leugner, Jan; Mlčoušek, Marek; Pařízková, Alžběta; Souček, Jiří; Špulák, Ondřej; Válek, Miroslav. Generel Obnovy Lesních Porostů Po Kalamitě 2024.
- Thonfeld, F.; Gessner, U.; Holzwarth, S.; Kriese, J.; Da Ponte, E.; Huth, J.; Kuenzer, C. A First Assessment of Canopy Cover Loss in Germany’s Forests after the 2018–2020 Drought Years. Remote Sensing 2022, 14, 562. [Google Scholar] [CrossRef]
- Hallas, T.; Steyrer, G.; Laaha, G.; Hoch, G. Two Unprecedented Outbreaks of the European Spruce Bark Beetle, Ips Typographus L. (Col., Scolytinae) in Austria since 2015: Different Causes and Different Impacts on Forests. Central European Forestry Journal 2024, 70, 263–274. [Google Scholar] [CrossRef]
- Carr, A.; Apoznański, G.; Dobrowolska, D.; Rachwald, A. Outbreaks of European Spruce Bark Beetle Dramatically Altered Norway Spruce-Dominated Stands with Implications for Volant Wildlife in the Białowieża Forest, Poland. Annals of Forest Science 2025, 82, 29. [Google Scholar] [CrossRef]
- Starck, I.; Aalto, J.; Hancock, S.; Valkonen, S.; Kalliovirta, L.; Maeda, E. Slow Recovery of Microclimate Temperature Buffering Capacity after Clear-Cuts in Boreal Forests. Agricultural and Forest Meteorology 2025, 363, 110434. [Google Scholar] [CrossRef]
- Falťan, V.; Petrovič, F.; Gábor, M.; Šagát, V.; Hruška, M. Mountain Landscape Dynamics after Large Wind and Bark Beetle Disasters and Subsequent Logging—Case Studies from the Carpathians. Remote Sensing 2021, 13, 3873. [Google Scholar] [CrossRef]
- Alaniz, A.J.; Abarzúa, A.M.; Martel-Cea, A.; Jarpa, L.; Hernández, M.; Aquino-López, M.A.; Smith-Ramírez, C. Linking Sedimentological and Spatial Analysis to Assess the Impact of the Forestry Industry on Soil Loss: The Case of Lanalhue Basin, Chile. CATENA 2021, 207, 105660. [Google Scholar] [CrossRef]
- Kalbitz, K.; Glaser, B.; Bol, R. Clear-cutting of a Norway Spruce Stand: Implications for Controls on the Dynamics of Dissolved Organic Matter in the Forest Floor. European J Soil Science 2004, 55, 401–413. [Google Scholar] [CrossRef]
- Jerabkova, L.; Prescott, C.E. Post-Harvest Soil Nitrate Dynamics in Aspen- and Spruce-Dominated Boreal Forests. Forest Ecology and Management 2007, 242, 209–216. [Google Scholar] [CrossRef]
- Muraškiene, M.; Varnagiryte-Kabašinskiene, I.; Stakenas, V. The Effect of Clear-Cut Age on Soil Organic Carbon and Nitrogen Indices in Scots Pine (Pinus Sylvestris L.) Stands. iForest 2025, 18, 146–153. [Google Scholar] [CrossRef]
- Blixt, T.; Bergman, K.-O.; Milberg, P.; Westerberg, L.; Jonason, D. Clear-Cuts in Production Forests: From Matrix to Neo-Habitat for Butterflies. Acta Oecologica 2015, 69, 71–77. [Google Scholar] [CrossRef]
- Lee, B.-J.; Eo, S.H. Comparison of Soil Bacterial Diversity and Community Composition between Clear-Cut Logging and Control Sites in a Temperate Deciduous Broad-Leaved Forest in Mt. Sambong, South Korea. J. For. Res. 2020, 31, 2367–2375. [Google Scholar] [CrossRef]
- Gustienė, D.; Varnagirytė-Kabašinskienė, I. Changes in Ground Cover Layers, Biomass and Diversity of Vascular Plants/Mosses in the Clear-Cuts Followed by Reforested Scots Pine until Maturity Age. Land 2024, 13, 1477. [Google Scholar] [CrossRef]
- Centenaro, G.; de-Miguel, S.; Bonet, J.A.; Martínez Peña, F.; De Gomez, R.E.G.; Ponce, Á.; Dashevskaya, S.; Alday, J.G. Spatially-Explicit Effects of Small-Scale Clear-Cutting on Soil Fungal Communities in Pinus Sylvestris Stands. Science of The Total Environment 2024, 909, 168628. [Google Scholar] [CrossRef] [PubMed]
- Schelker, J.; Kuglerová, L.; Eklöf, K.; Bishop, K.; Laudon, H. Hydrological Effects of Clear-Cutting in a Boreal Forest – Snowpack Dynamics, Snowmelt and Streamflow Responses. Journal of Hydrology 2013, 484, 105–114. [Google Scholar] [CrossRef]
- Wei, X.; Giles-Hansen, K.; Spencer, S.A.; Ge, X.; Onuchin, A.; Li, Q.; Burenina, T.; Ilintsev, A.; Hou, Y. Forest Harvesting and Hydrology in Boreal Forests: Under an Increased and Cumulative Disturbance Context. Forest Ecology and Management 2022, 522, 120468. [Google Scholar] [CrossRef]
- Vitousek, P.M.; Gosz, J.R.; Grier, C.C.; Melillo, J.M.; Reiners, W.A.; Todd, R.L. Nitrate Losses from Disturbed Ecosystems: Interregional Comparative Studies Show Mechanisms Underlying Forest Ecosystem Response to Disturbance. Science 1979, 204, 469–474. [Google Scholar] [CrossRef]
- Oulehle, F.; Wright, R.F.; Svoboda, M.; Bače, R.; Matějka, K.; Kaňa, J.; Hruška, J.; Couture, R.-M.; Kopáček, J. Effects of Bark Beetle Disturbance on Soil Nutrient Retention and Lake Chemistry in Glacial Catchment. Ecosystems 2019, 22, 725–741. [Google Scholar] [CrossRef]
- Schmidt, S.I.; Hejzlar, J.; Kopáček, J.; Paule-Mercado, Ma.C.; Porcal, P.; Vystavna, Y.; Lanta, V. Forest Damage and Subsequent Recovery Alter the Water Composition in Mountain Lake Catchments. Science of The Total Environment 2022, 827, 154293. [Google Scholar] [CrossRef]
- Vystavna, Y.; Paule-Mercado, M.C.; Schmidt, S.I.; Hejzlar, J.; Porcal, P.; Matiatos, I. Nutrient Dynamics in Temperate European Catchments of Different Land Use under Changing Climate. Journal of Hydrology: Regional Studies 2023, 45, 101288. [Google Scholar] [CrossRef]
- Unucka, J.; Adamecínský, M.; Pavlíková, I.; Špulák, O.; Šrámek, V.; Hellebrandová, K. Measurement and Modelling of Changes in the Runoff Regime Following Calamitous Decay and Regeneration of Forest Stands in Small Catchments in the Jeseníky Mountains. VTEI 2025, 67, 30. [Google Scholar] [CrossRef]
- Šrámek, V.; Fadrhonsová, V.; Neudertová Hellebrandová, K. Rainfall Variability in the Mountain Forest Catchments of Černá Opava Tributaries in the Jeseníky Mountains. J. For. Sci. 2025, 71, 138–148. [Google Scholar] [CrossRef]
- Vondráková, A.; Vávra, A.; Voženílek, V. Climatic Regions of the Czech Republic. Journal of Maps 2013, 9, 425–430. [Google Scholar] [CrossRef]
- Lochman, V.; Maxa, M.; Bíba, M. Development of soil chemistry on FGMRI research plots during reduction of air pollution fallout. Reports of Forestry Research - Zprávy Lesnického Výzkumu 2006, 51, 106–120. [Google Scholar]
- Bíba, M.; Vícha, Z.; Janová, K.; Jařabáč, M. Forest regeneration in experimental catchment Červík and its influence on run-off process. Reports of Forestry Research - Zprávy Lesnického Výzkumu 2010, 55, 126–132. [Google Scholar]
- Clarke, N.; Žlindra, D.; Erwin, U.; Mosello, R.; Derome, J.; Derome, K.; König, N.; Geppert, F.; Lövblad, G.; Draaijers, G.P.J.; et al. Part XIV: Sampling and Analysis of Deposition. In Manual on methods and criteria for harmonized sampling, assessment, monitoring and analysis of the effects of air pollution on forests; Thünen Institute of Forest Ecosystems: Eberswalde, Germany, 2022; p. 34 p. [Google Scholar]
- Green, I.R.A. An Explicit Solution of the Modified Horton Equation. Journal of Hydrology 1986, 83, 23–27. [Google Scholar] [CrossRef]
- R Core Team. R: A Language and Environment for Statistical Computing 2024.
- Greenacre, M. Compositional Data Analysis in Practice, 0 ed.; Chapman and Hall/CRC, 2018; ISBN 978-0-429-45553-7. [Google Scholar]
- Shelton, J.L.; Engle, M.A.; Buccianti, A.; Blondes, M.S. The Isometric Log-Ratio (Ilr)-Ion Plot: A Proposed Alternative to the Piper Diagram. Journal of Geochemical Exploration 2018, 190, 130–141. [Google Scholar] [CrossRef]
- Blake, S.; Henry, T.; Murray, J.; Flood, R.; Muller, M.R.; Jones, A.G.; Rath, V. Compositional Multivariate Statistical Analysis of Thermal Groundwater Provenance: A Hydrogeochemical Case Study from Ireland. Applied Geochemistry 2016, 75, 171–188. [Google Scholar] [CrossRef]
- Abdelmalek, D.; Azzeddine, R.; Mohamed, A.; Faouzi, Z.; Galal, W.F.; Alarifi, S.S.; Mohammed, M.A.A. Groundwater Quality Assessment Using Revised Classical Diagrams and Compositional Data Analysis (CoDa): Case Study of Wadi Ranyah, Saudi Arabia. Journal of King Saud University - Science 2024, 36, 103463. [Google Scholar] [CrossRef]
- Azzeddine, R.; Abdelmalek, D.; Ewuzie, U.; Faouzi, Z.; Taha-Hocine, D. Compositional Data Analysis (CoDA) and Geochemical Signatures of the Terminal Complex Aquifer in an Arid Zone (Northeastern Algeria). Journal of African Earth Sciences 2024, 210, 105162. [Google Scholar] [CrossRef]
- Oh, J.; Kim, K.-H.; Kim, H.-R.; Park, S.; Yun, S.-T. Using Isometric Log-Ratio in Compositional Data Analysis for Developing a Groundwater Pollution Index. Sci Rep 2024, 14, 12196. [Google Scholar] [CrossRef]
- Aitchison, J. The Statistical Analysis of Compositional Data. Journal of the Royal Statistical Society Series B: Statistical Methodology 1982, 44, 139–160. [Google Scholar] [CrossRef]
- Egozcue, J.J.; Pawlowsky-Glahn, V.; Mateu-Figueras, G.; Barceló-Vidal, C. Isometric Logratio Transformations for Compositional Data Analysis. Mathematical Geology 2003, 35, 279–300. [Google Scholar] [CrossRef]
- Ewuzie, U.; Nnorom, I.C.; Ugbogu, O.; Onwuka, C.V. Hydrogeochemical, Microbial and Compositional Analysis of Data from Surface and Groundwater Sources in Southeastern Nigeria. Journal of Geochemical Exploration 2021, 224, 106737. [Google Scholar] [CrossRef]
- Engle, M.A.; Rowan, E.L. Geochemical Evolution of Produced Waters from Hydraulic Fracturing of the Marcellus Shale, Northern Appalachian Basin: A Multivariate Compositional Data Analysis Approach. International Journal of Coal Geology 2014, 126, 45–56. [Google Scholar] [CrossRef]
- Van Den Boogaart, K.G.; Tolosana-Delgado, R. Analyzing Compositional Data with R; Springer Berlin Heidelberg: Berlin, Heidelberg, 2013; ISBN 978-3-642-36808-0. [Google Scholar]
- Campodonico, V.A.; Pasquini, A.I.; Lecomte, K.L.; Alvarez, B.Y.; García, M.G. Hydrochemistry and Surface Water - Groundwater Interactions in an Anthropically Disturbed Mountain River (Sierras Pampeanas, Central Argentina). Journal of South American Earth Sciences 2024, 150, 105251. [Google Scholar] [CrossRef]
- De Vries, W.; Van Der Salm, C.; Reinds, G.J.; Erisman, J.W. Element Fluxes through European Forest Ecosystems and Their Relationships with Stand and Site Characteristics. Environmental Pollution 2007, 148, 501–513. [Google Scholar] [CrossRef]
- Kopáček, J.; Hejzlar, J.; Porcal, P.; Posch, M. Trends in Riverine Element Fluxes: A Chronicle of Regional Socio-Economic Changes. Water Research 2017, 125, 374–383. [Google Scholar] [CrossRef]
- Hůnová, I.; Maznová, J.; Kurfürst, P. Trends in Atmospheric Deposition Fluxes of Sulphur and Nitrogen in Czech Forests. Environmental Pollution 2014, 184, 668–675. [Google Scholar] [CrossRef]
- Hůnová, I. Ambient Air Quality in the Czech Republic: Past and Present. Atmosphere 2020, 11, 214. [Google Scholar] [CrossRef]
- Rogora, M.; Marchetto, A.; Mosello, R. Trends in the Chemistry of Atmospheric Deposition and Surface Waters in the Lake Maggiore Catchment. Hydrol. Earth Syst. Sci. 2001, 5, 379–390. [Google Scholar] [CrossRef]
- Vuorenmaa, J.; Augustaitis, A.; Beudert, B.; Bochenek, W.; Clarke, N.; De Wit, H.A.; Dirnböck, T.; Frey, J.; Hakola, H.; Kleemola, S.; et al. Long-Term Changes (1990–2015) in the Atmospheric Deposition and Runoff Water Chemistry of Sulphate, Inorganic Nitrogen and Acidity for Forested Catchments in Europe in Relation to Changes in Emissions and Hydrometeorological Conditions. Science of The Total Environment 2018, 625, 1129–1145. [Google Scholar] [CrossRef]
- Kaste, Ø.; Austnes, K.; De Wit, H.A. Streamwater Responses to Reduced Nitrogen Deposition at Four Small Upland Catchments in Norway. Ambio 2020, 49, 1759–1770. [Google Scholar] [CrossRef]
- Lovett, G.M.; Lindberg, S.E. Dry Deposition and Canopy Exchange in a Mixed Oak Forest as Determined by Analysis of Throughfall. The Journal of Applied Ecology 1984, 21, 1013. [Google Scholar] [CrossRef]
- Butler, T.J.; Likens, G.E. A Direct Comparison of Throughfall plus Stemflow to Estimates of Dry and Total Deposition for Sulfur and Nitrogen. Atmospheric Environment 1995, 29, 1253–1265. [Google Scholar] [CrossRef]
- Thimonier, A.; Schmitt, M.; Waldner, P.; Rihm, B. Atmospheric Deposition on Swiss Long-Term Forest Ecosystem Research (LWF) Plots. Environ Monit Assess 2005, 104, 81–118. [Google Scholar] [CrossRef]
- Hůnová, I.; Novák, M.; Kurfürst, P.; Škáchová, H.; Štěpánová, M.; Přechová, E.; Veselovský, F.; Čuřík, J.; Bohdálková, L.; Komárek, A. Comparison of Vertical and Horizontal Atmospheric Deposition of Nitrate at Central European Mountain-Top Sites during Three Consecutive Winters. Science of The Total Environment 2023, 869, 161697. [Google Scholar] [CrossRef] [PubMed]
- Musolff, A.; Tarasova, L.; Rinke, K.; Ledesma, J.L.J. Forest Dieback Alters Nutrient Pathways in a Temperate Headwater Catchment. Hydrological Processes 2024, 38, e15308. [Google Scholar] [CrossRef]
- Bohdálková, L.; Lamačová, A.; Hruška, J.; Svoboda, J.; Krám, P.; Oulehle, F. Impact of Environmental Disturbances on Hydrology and Nitrogen Cycling in Central European Forest Catchments. Biogeochemistry 2025, 168, 34. [Google Scholar] [CrossRef]
- Hedwall, P.-O.; Bergh, J.; Nordin, A. Nitrogen-Retention Capacity in a Fertilized Forest after Clear-Cutting — the Effect of Forest-Floor Vegetation. Can. J. For. Res. 2015, 45, 130–134. [Google Scholar] [CrossRef]
- Lochman, V. Vývoj zatížení lesních ekosystémů na povodí Pekelského potoka (objekt Želivka) a jeho vliv na změny v půdě a ve vodě povrchového zdroje. Lesnictví-Forestry 1997, 43, 529–546. [Google Scholar]
- Vícha, Z.; Lachmanová, Z.; Fadrhonsová, V.; Lochman, V.; Bíba, M. Air pollutants deposition development and their input into runoff water in the region of Bohemian-Moravian Highland. Reports of Forestry Research - Zprávy lesnického výzkumu 2013, 58, 158–166. [Google Scholar]
- Cooper, R.; Thoss, V.; Watson, H. Factors Influencing the Release of Dissolved Organic Carbon and Dissolved Forms of Nitrogen from a Small Upland Headwater during Autumn Runoff Events. Hydrological Processes 2007, 21, 622–633. [Google Scholar] [CrossRef]
- Jost, G.; Dirnböck, T.; Grabner, M.-T.; Mirtl, M. Nitrogen Leaching of Two Forest Ecosystems in a Karst Watershed. Water Air Soil Pollut 2011, 218, 633–649. [Google Scholar] [CrossRef]
- Yang, Y.; Luo, Y.; Finzi, A.C. Carbon and Nitrogen Dynamics during Forest Stand Development: A Global Synthesis. New Phytologist 2011, 190, 977–989. [Google Scholar] [CrossRef]
- Oda, T.; Ohte, N.; Suzuki, M. Importance of Frequent Storm Flow Data for Evaluating Changes in Stream Water Chemistry Following Clear-Cutting in Japanese Headwater Catchments. Forest Ecology and Management 2011, 262, 1305–1317. [Google Scholar] [CrossRef]
- Swank, W.T. Long-Term Response of a Forest Watershed Ecosystem: Clearcutting in the Southern Appalachians; Long-Term Ecological Research Network Ser; Oxford University Press, Incorporated: New York, 2014; ISBN 978-0-19-970840-6. [Google Scholar]
- Webster, K.L.; Leach, J.A.; Hazlett, P.W.; Buttle, J.M.; Emilson, E.J.S.; Creed, I.F. Long-Term Stream Chemistry Response to Harvesting in a Northern Hardwood Forest Watershed Experiencing Environmental Change. Forest Ecology and Management 2022, 519, 120345. [Google Scholar] [CrossRef]
- Kreutzweiser, D.P.; Hazlett, P.W.; Gunn, J.M. Logging Impacts on the Biogeochemistry of Boreal Forest Soils and Nutrient Export to Aquatic Systems: A Review. Environ. Rev. 2008, 16, 157–179. [Google Scholar] [CrossRef]
- Mikkelson, K.M.; Bearup, L.A.; Maxwell, R.M.; Stednick, J.D.; McCray, J.E.; Sharp, J.O. Bark Beetle Infestation Impacts on Nutrient Cycling, Water Quality and Interdependent Hydrological Effects. Biogeochemistry 2013, 115, 1–21. [Google Scholar] [CrossRef]
- Alewell, C.; Armbruster, M.; Bittersohl, J.; Evans, C.D.; Meesenburg, H.; Moritz, K.; Prechtel, A. Are There Signs of Acidification Reversal in Freshwaters of the Low Mountain Ranges in Germany? Hydrol. Earth Syst. Sci. 2001, 5, 367–378. [Google Scholar] [CrossRef]
- Sajdak, M.; Siwek, J.P.; Wasak-Sęk, K.; Kosmowska, A.; Stańczyk, T.; Małek, S.; Żelazny, M.; Woźniak, G.; Jelonkiewicz, Ł.; Żelazny, M. Stream Water Chemistry Changes in Response to Deforestation of Variable Origin (Case Study from the Carpathians, Southern Poland). CATENA 2021, 202, 105237. [Google Scholar] [CrossRef]
- Kopáček, J.; Fluksová, H.; Hejzlar, J.; Kaňa, J.; Porcal, P.; Turek, J. Changes in Surface Water Chemistry Caused by Natural Forest Dieback in an Unmanaged Mountain Catchment. Science of The Total Environment 2017, 584–585, 971–981. [Google Scholar] [CrossRef]
- Bucher, K.; Zhou, W.; Stober, I. Rocks control the chemical composition of surface water from the high Alpine Zermatt area (Swiss Alps). Swiss Journal of Geosciences 2017, 110, 811–831. [Google Scholar] [CrossRef]
- Krám, P.; Hruška, J.; Wenner, B.S.; Driscoll, C.T.; Johnson, C.E. Streamwater chemistry in three contrasting monolithologic Czech catchments. Applied Geochemistry 2012, 27, 1854–1863. [Google Scholar] [CrossRef]
- Hosein, R.; Arn, K.; Steinmann, P.; Adatte, T.; Föllmi, K.B. Carbonate and silicate weathering in two presently glaciated, crystalline catchments in the Swiss Alps. Geochimica et Cosmochimica Acta 2004, 68, 1021–1033. [Google Scholar] [CrossRef]
- Harmon, R.S.; Wörner, G.; Goldsmith, S.T.; Lyons, W.B.; Ogden, F.L.; Mitasova, H.; Kirby, C.S.; Asbury, R. Linking silicate weathering to riverine geochemistry—A case study from a mountainous tropical setting in west-central Panama. Geological Society of America Bulletin 2016, 128, 1780–1799. [Google Scholar] [CrossRef]
- Novák, M.; Andronikov, A.V.; Holmden, C.; Erban Kochergina, Y.V.; Veselovský, F.; Pačes, T.; Vítková, M.; Kachlík, V.; Šebek, O.; Hruška, J.; et al. δ26Mg, δ44Ca and 87Sr/86Sr Isotope Differences among Bedrock Minerals Constrain Runoff Generation in Headwater Catchments: An Acidified Granitic Site in Central Europe as an Example. CATENA 2023, 221, 106780. [Google Scholar] [CrossRef]
- Novak, M.; Holmden, C.; Farkas, J.; Andronikov, A.V.; Kram, P.; Hruska, J.; Curik, J.; Veselovsky, F.; Stepanova, M.; Prechova, E.; et al. Magnesium and calcium isotope systematics in a headwater catchment underlain by amphibolite: Constraints on Mg–Ca biogeochemistry in an atmospherically polluted but well-buffered spruce ecosystem (Czech Republic, Central Europe). Catena 2020, 194, 104637. [Google Scholar] [CrossRef]
Figure 1.
Location of study sites. ZE – Pekelský stream catchment, SL – Slučí stream catchment, SO – Sokolí stream catchment, SU – Suchý stream catchment, CE – Červík stream catchment.
Figure 1.
Location of study sites. ZE – Pekelský stream catchment, SL – Slučí stream catchment, SO – Sokolí stream catchment, SU – Suchý stream catchment, CE – Červík stream catchment.
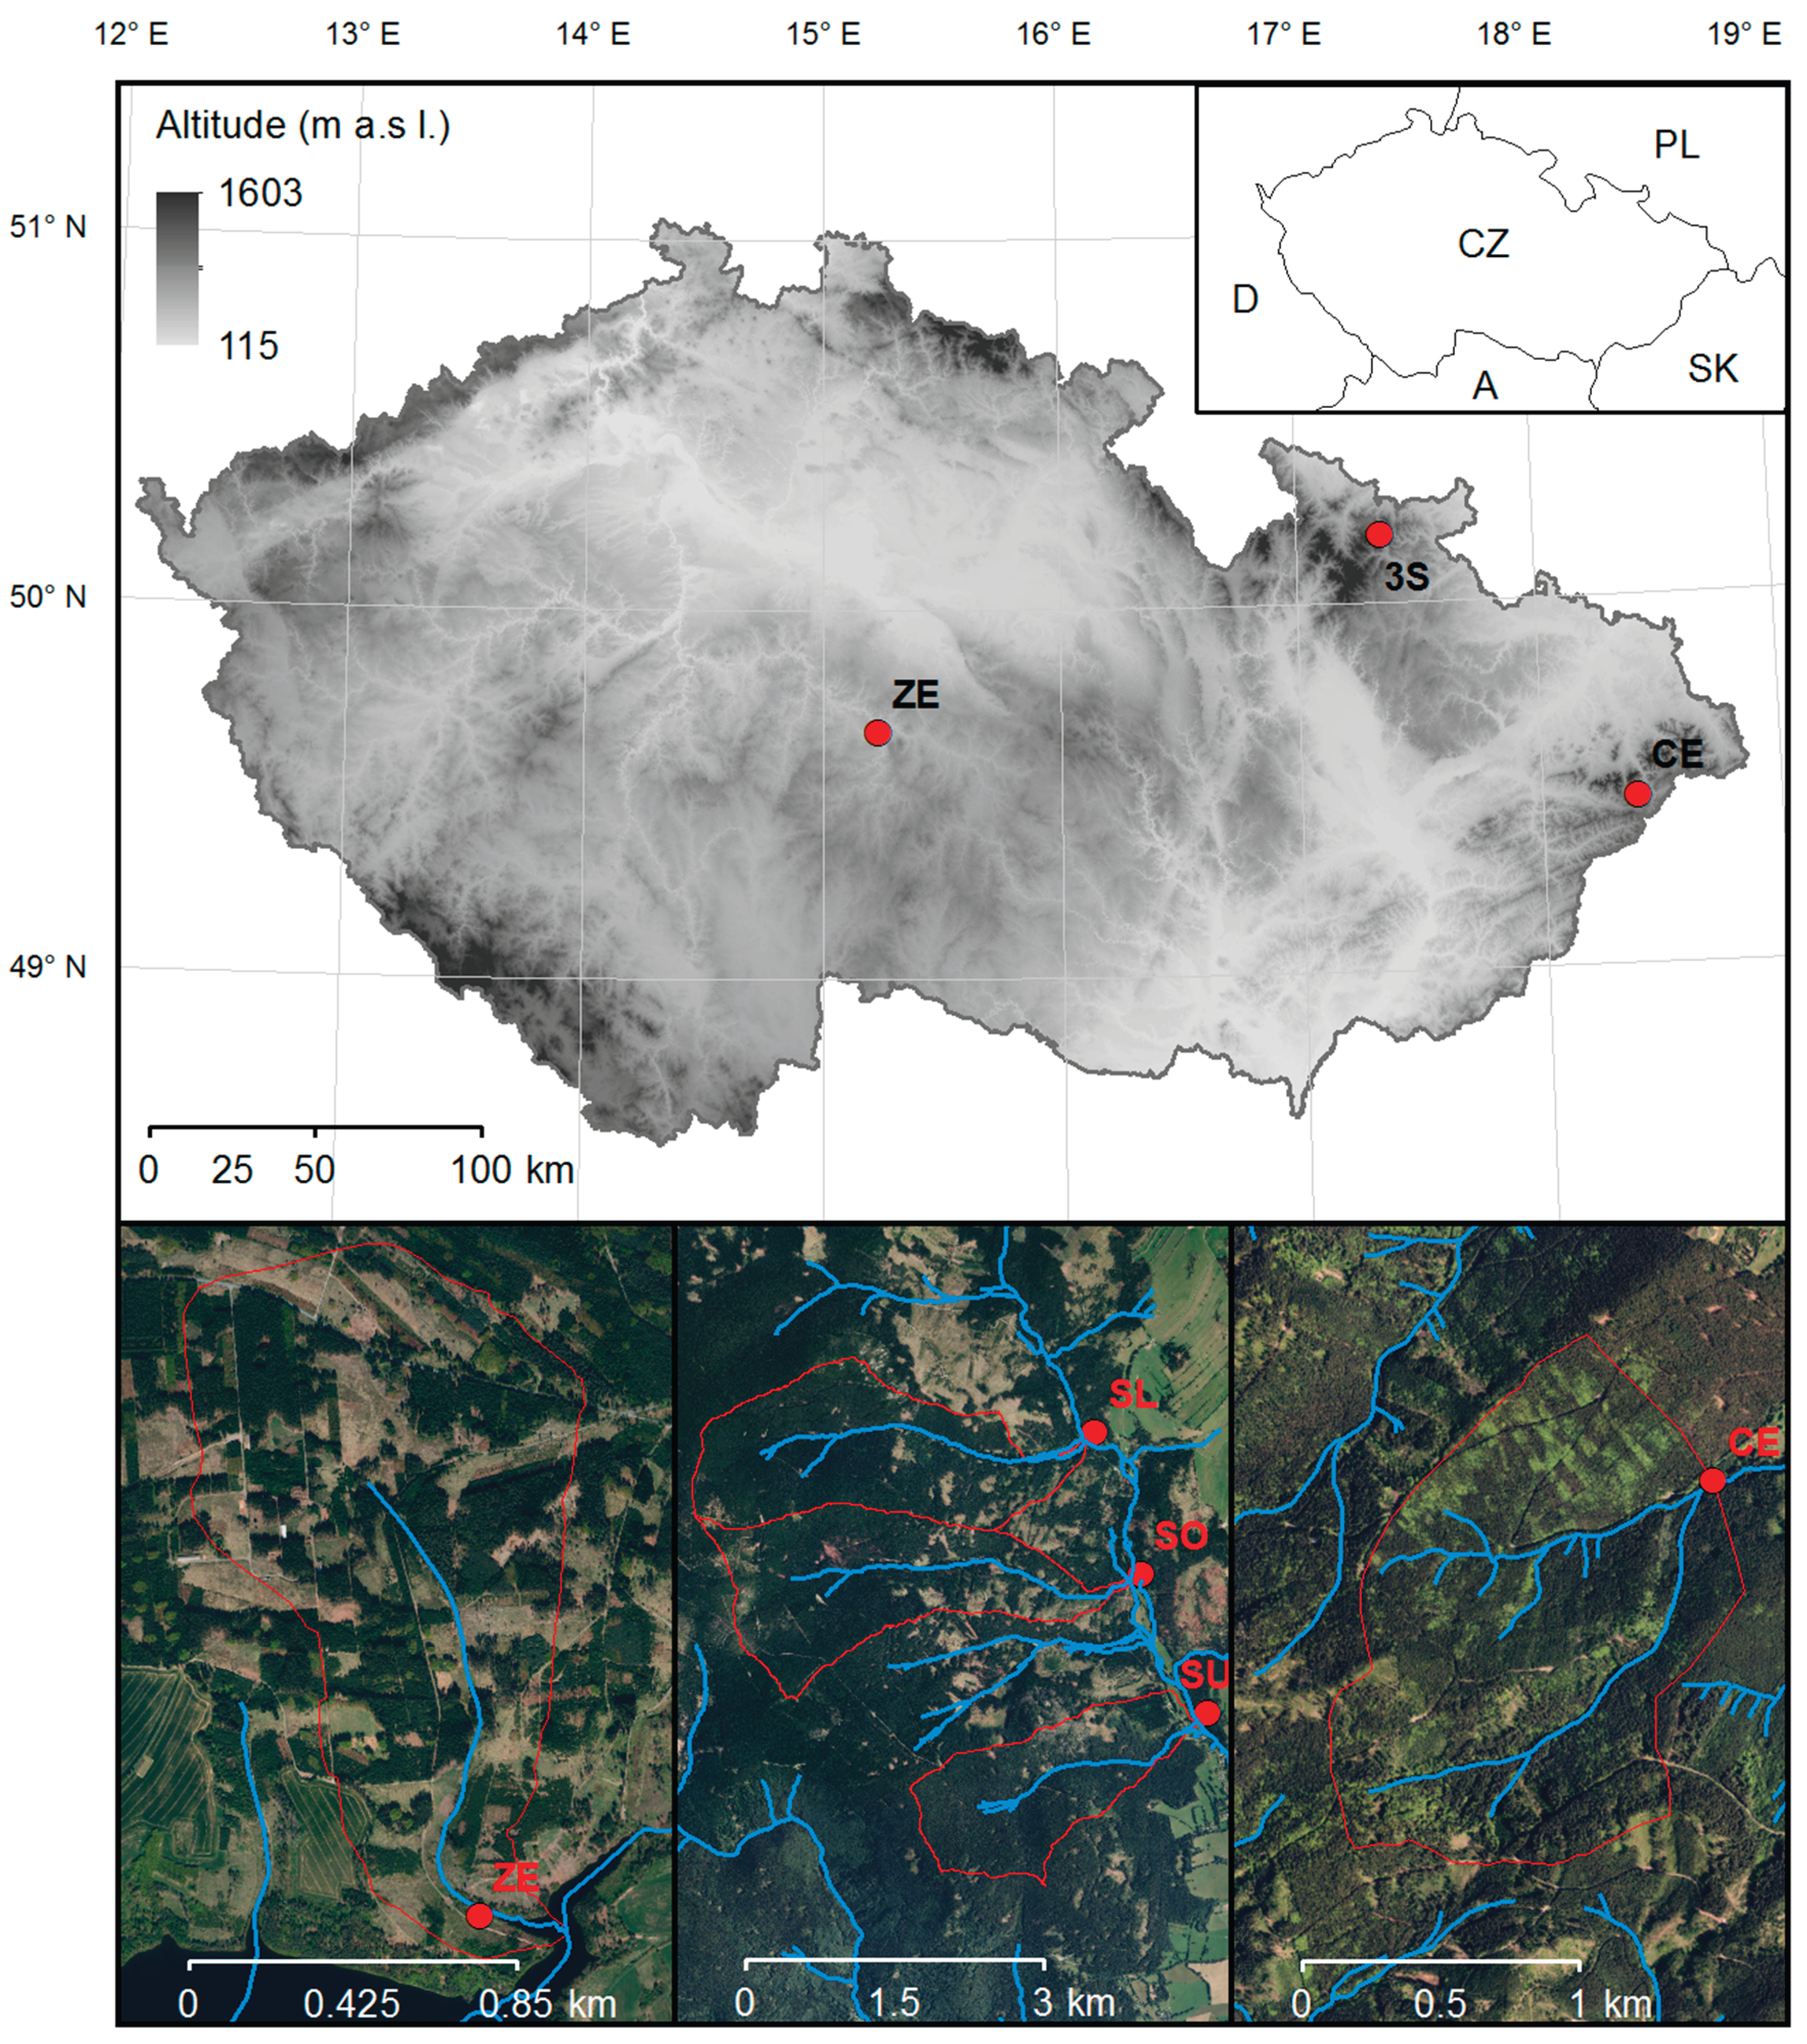
Figure 2.
Box plot representation of the hydrochemical composition of water samples from five catchments. SL – Slučí stream, SO – Sokolí stream, SU – Suchý stream, CE – Červík stream, ZE – Pekelský stream. DOC – dissolved organic carbon, TN – total nitrogen, EC – electrical conductivity.
Figure 2.
Box plot representation of the hydrochemical composition of water samples from five catchments. SL – Slučí stream, SO – Sokolí stream, SU – Suchý stream, CE – Červík stream, ZE – Pekelský stream. DOC – dissolved organic carbon, TN – total nitrogen, EC – electrical conductivity.
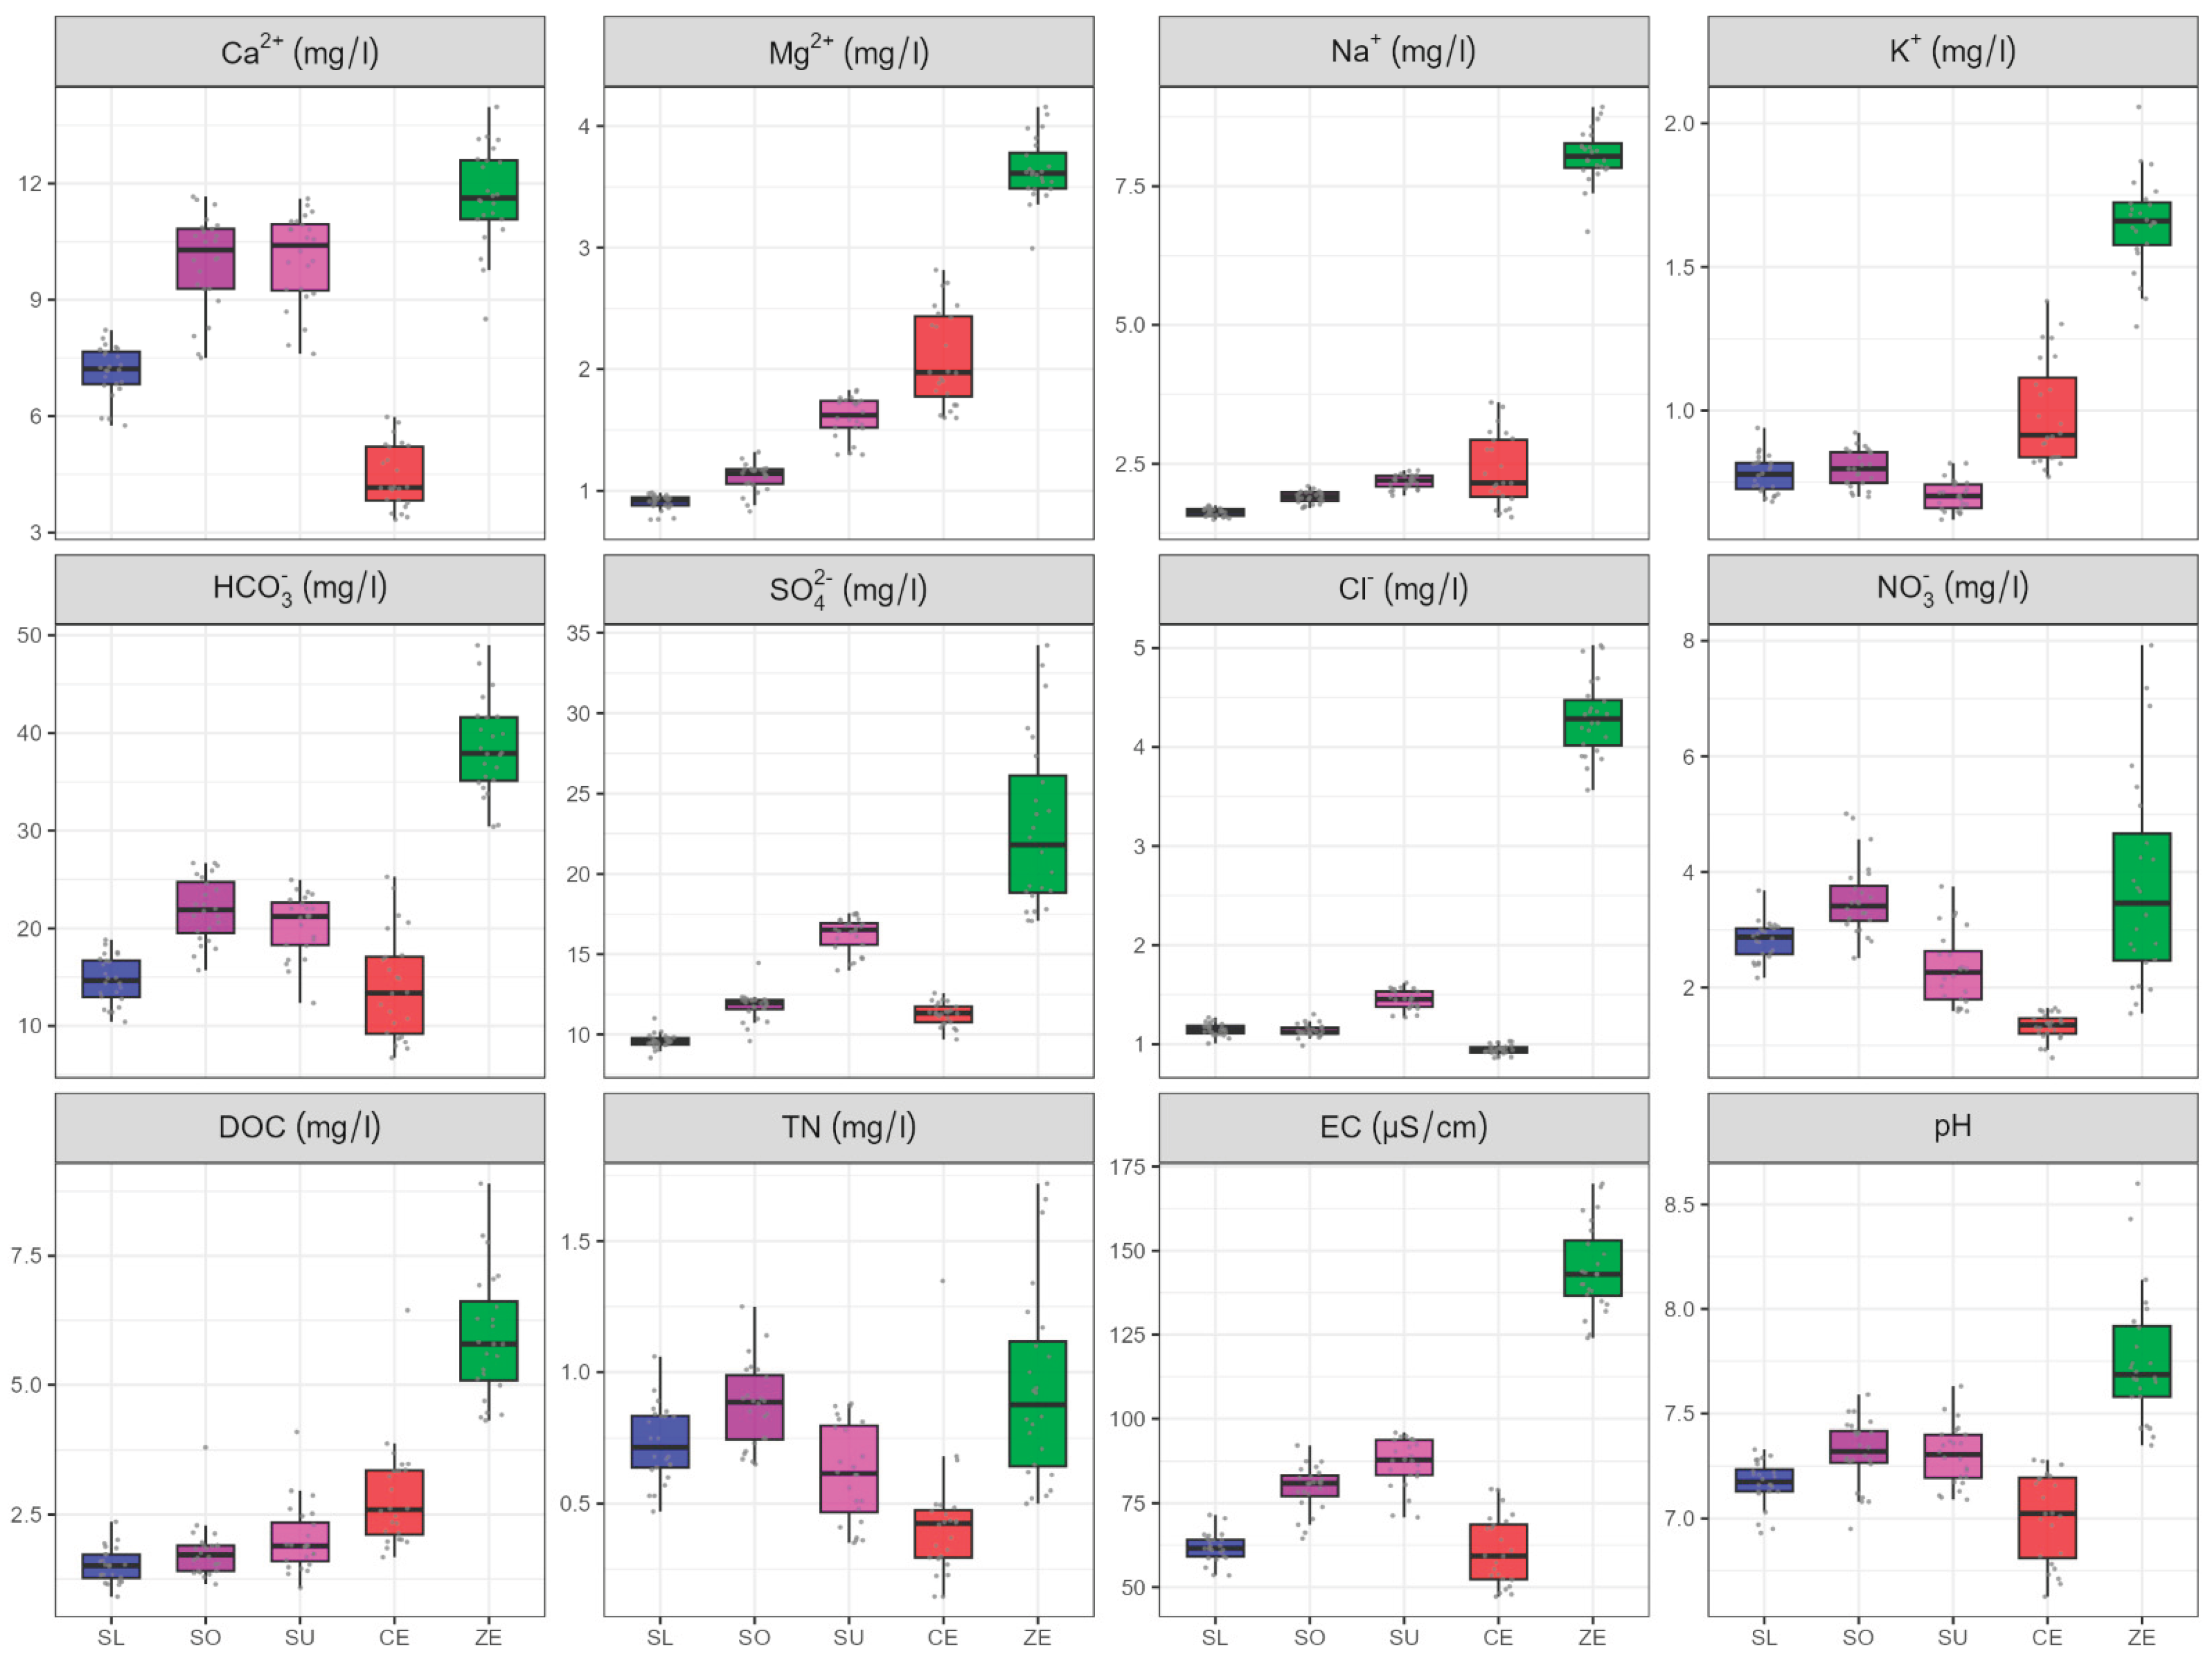
Figure 3.
Mean annual inputs (precipitation, blue) versus outputs (stream water, orange) for selected chemical parameters. All fluxes are in kg·ha−1·yr−1. SL – Slučí stream, SO – Sokolí stream, SU – Suchý stream, CE –Červík stream, ZE – Pekelský stream.
Figure 3.
Mean annual inputs (precipitation, blue) versus outputs (stream water, orange) for selected chemical parameters. All fluxes are in kg·ha−1·yr−1. SL – Slučí stream, SO – Sokolí stream, SU – Suchý stream, CE –Červík stream, ZE – Pekelský stream.
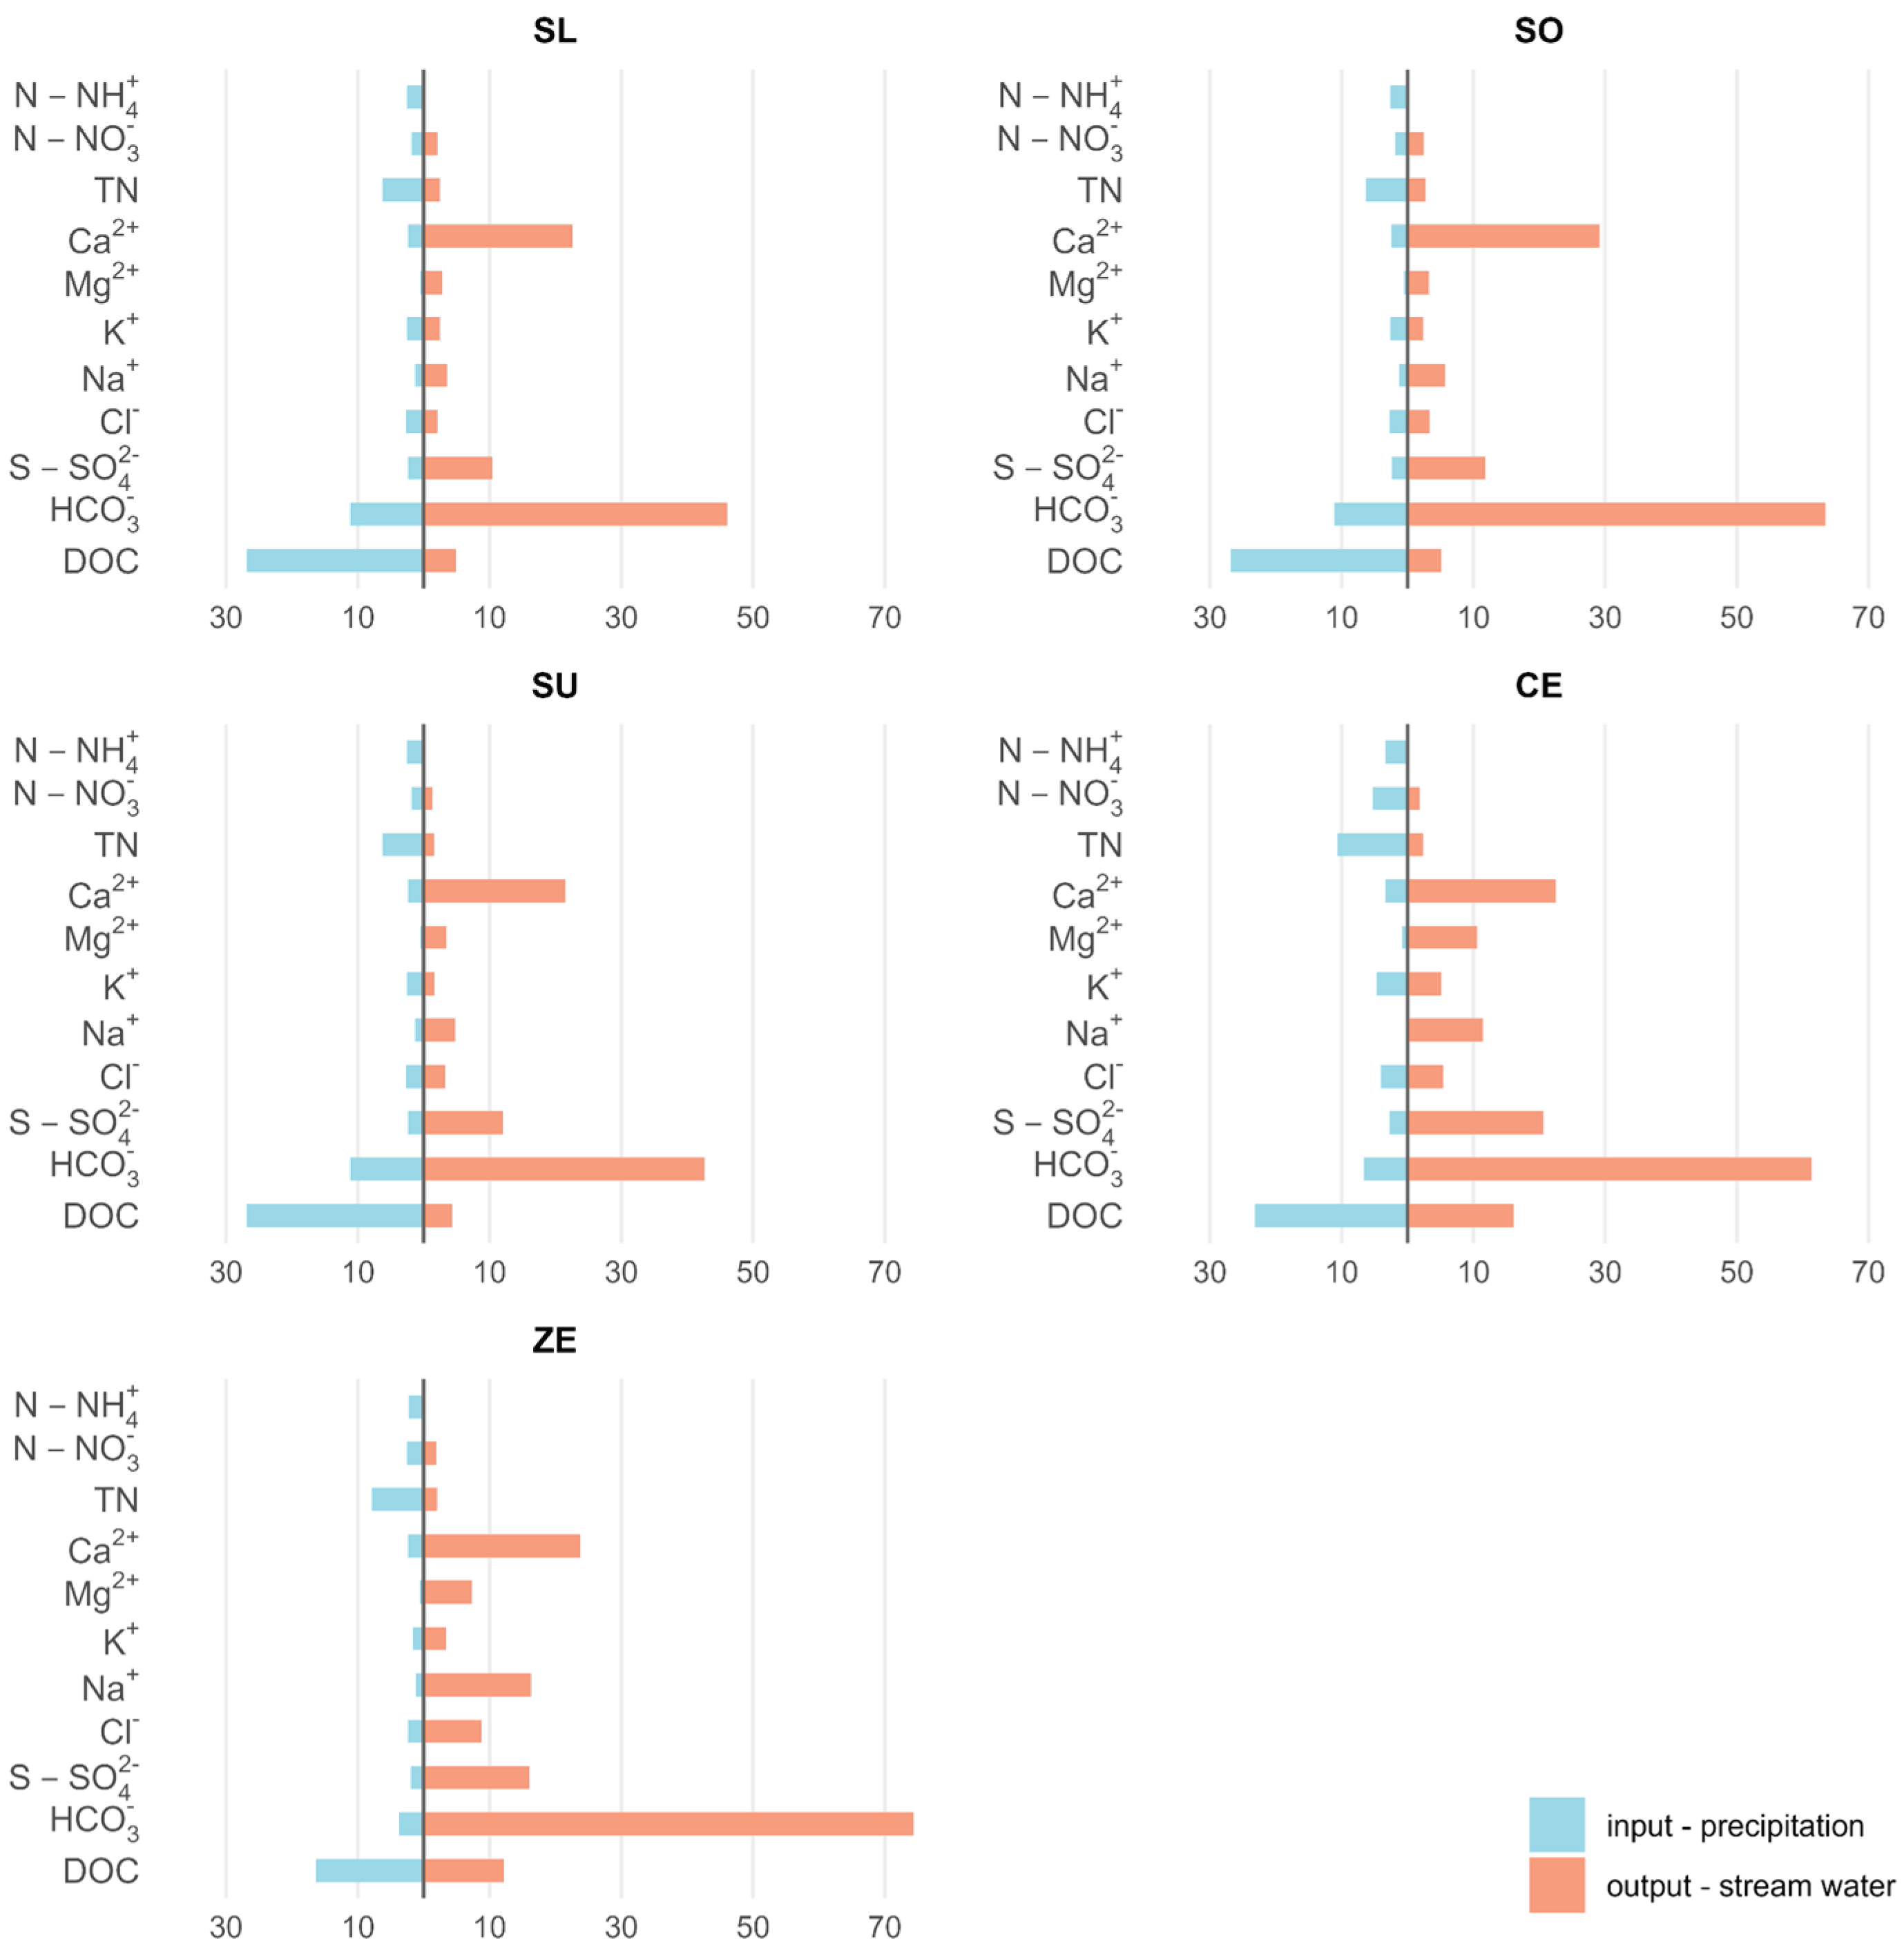
Figure 4.
Isometric log-ratio-ion plot for surface water samples. SL – Slučí stream, SO – Sokolí stream, SU – Suchý stream, CE – Červík stream, ZE – Pekelský stream.
Figure 4.
Isometric log-ratio-ion plot for surface water samples. SL – Slučí stream, SO – Sokolí stream, SU – Suchý stream, CE – Červík stream, ZE – Pekelský stream.
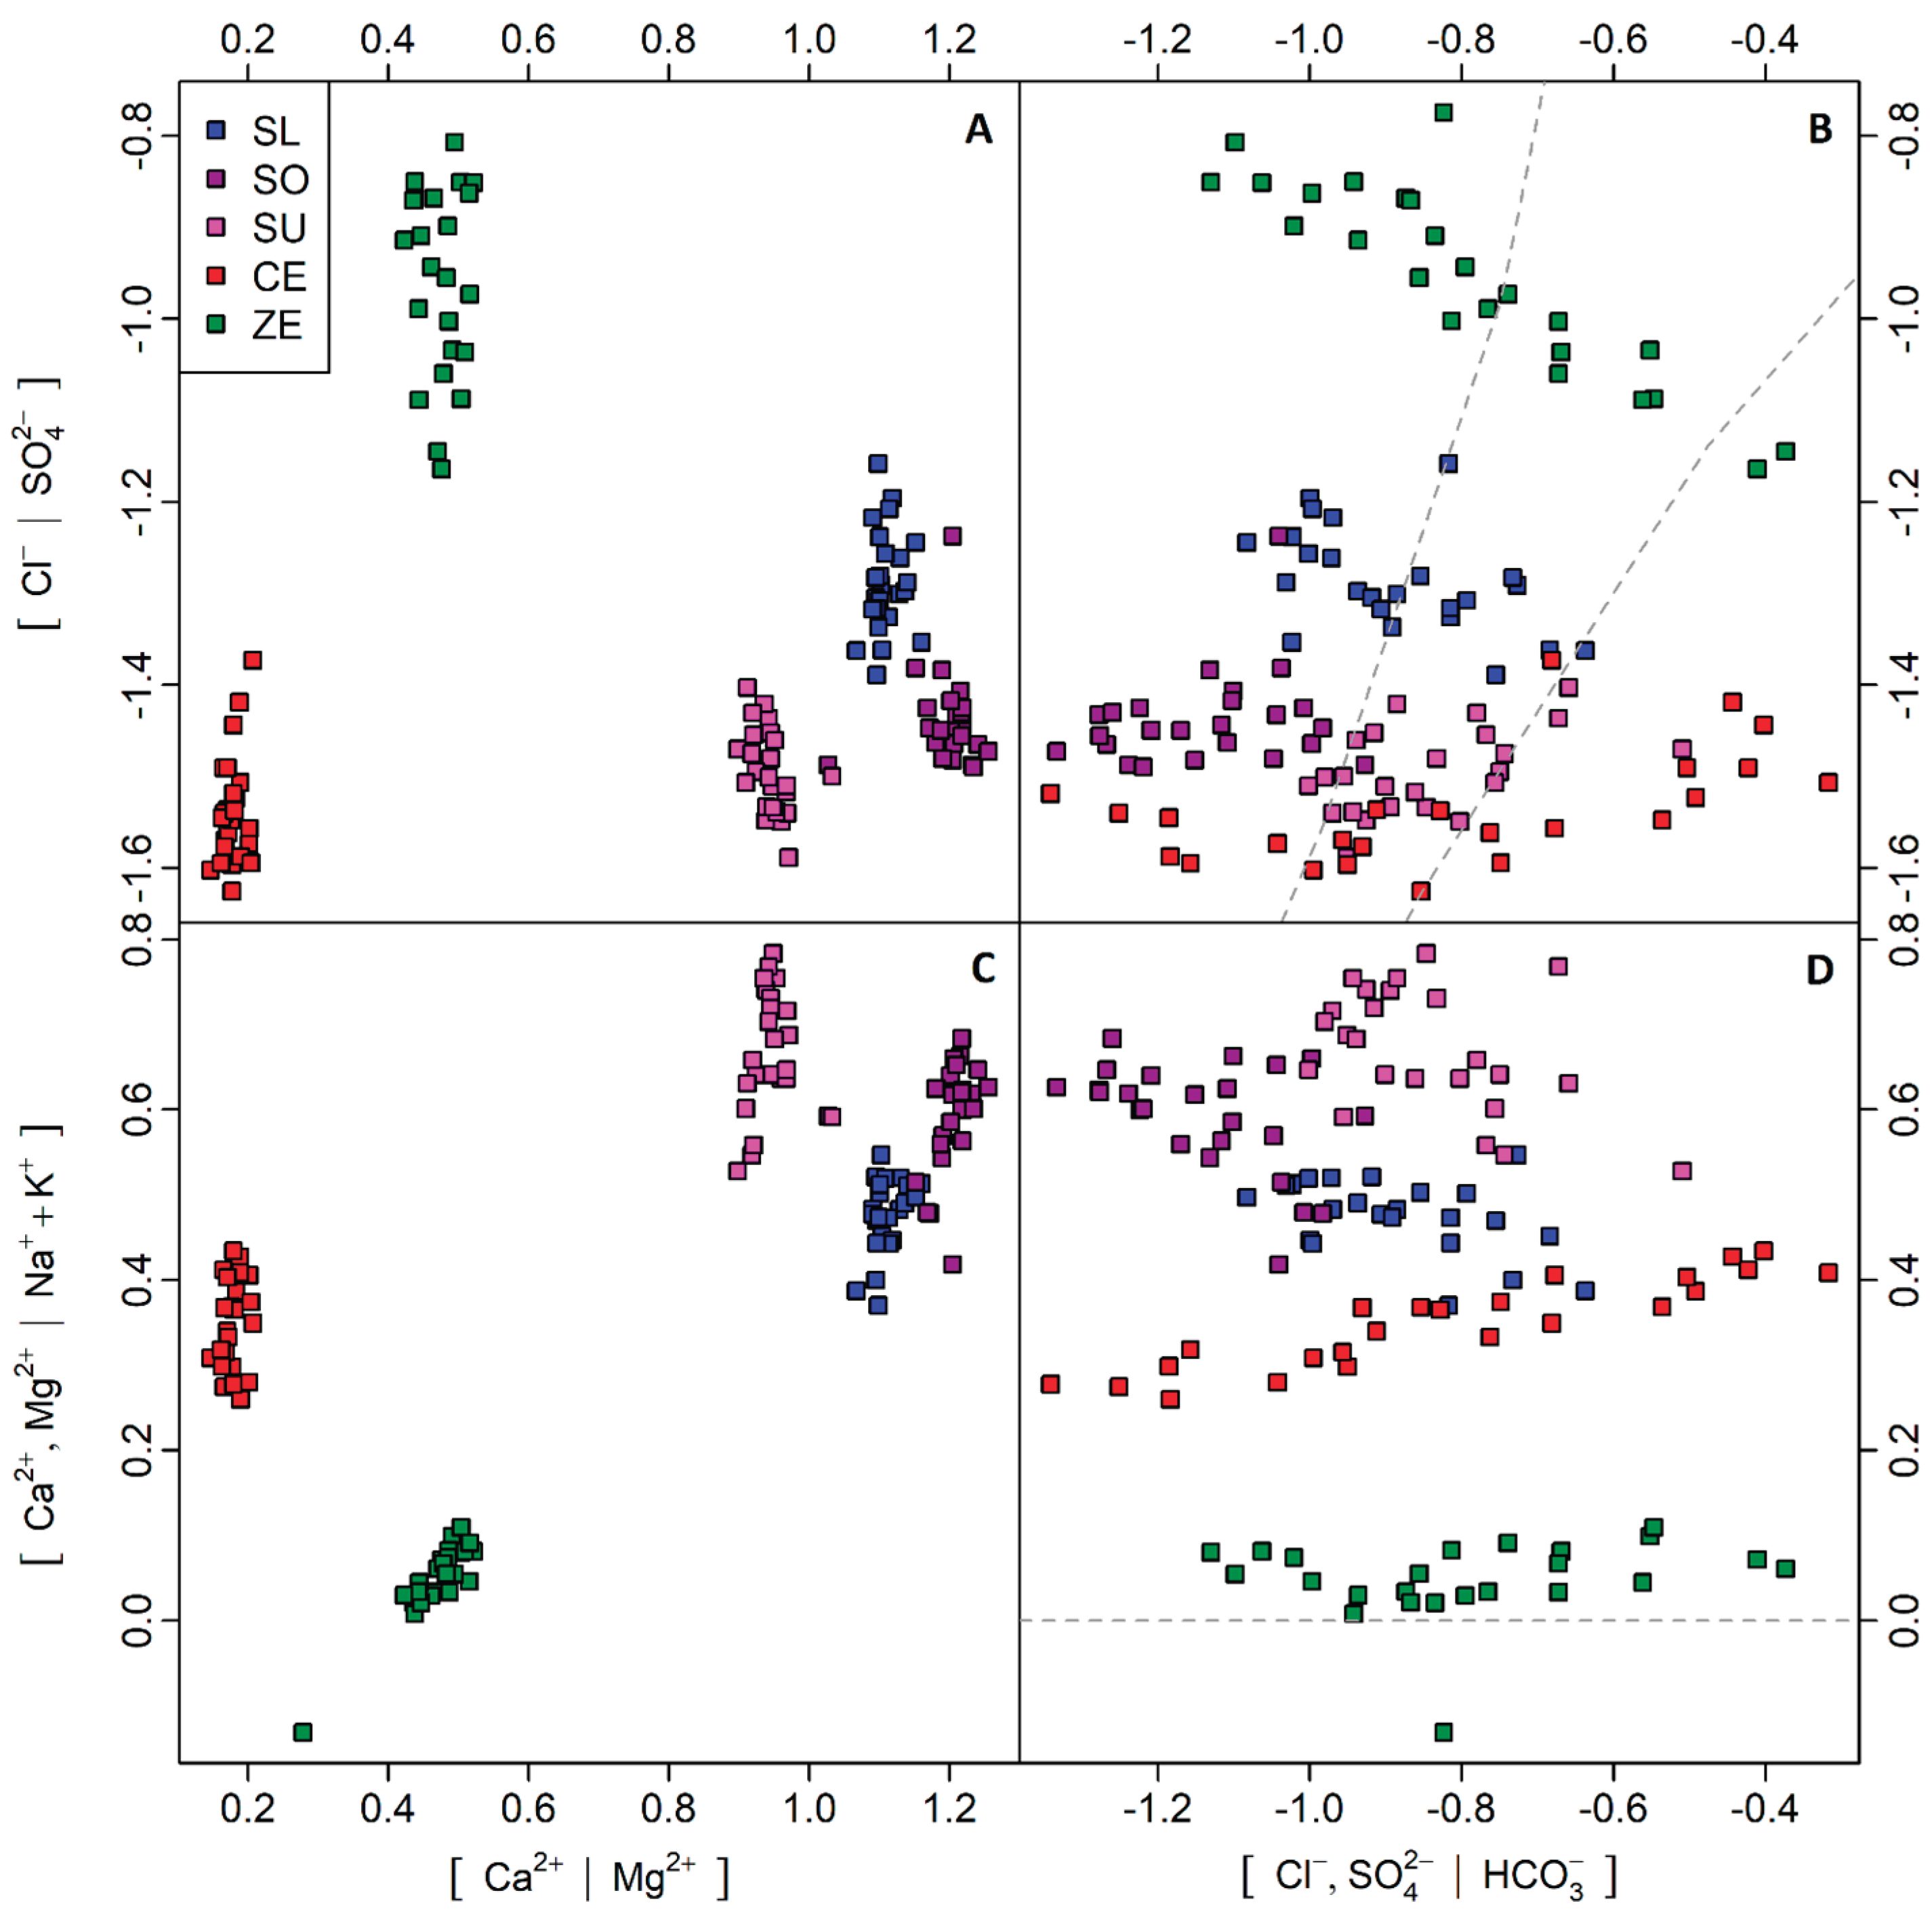
Figure 5.
Principal component analysis of ilr-transformed data: Biplot of the PC1 versus PC2 factors.
Figure 5.
Principal component analysis of ilr-transformed data: Biplot of the PC1 versus PC2 factors.
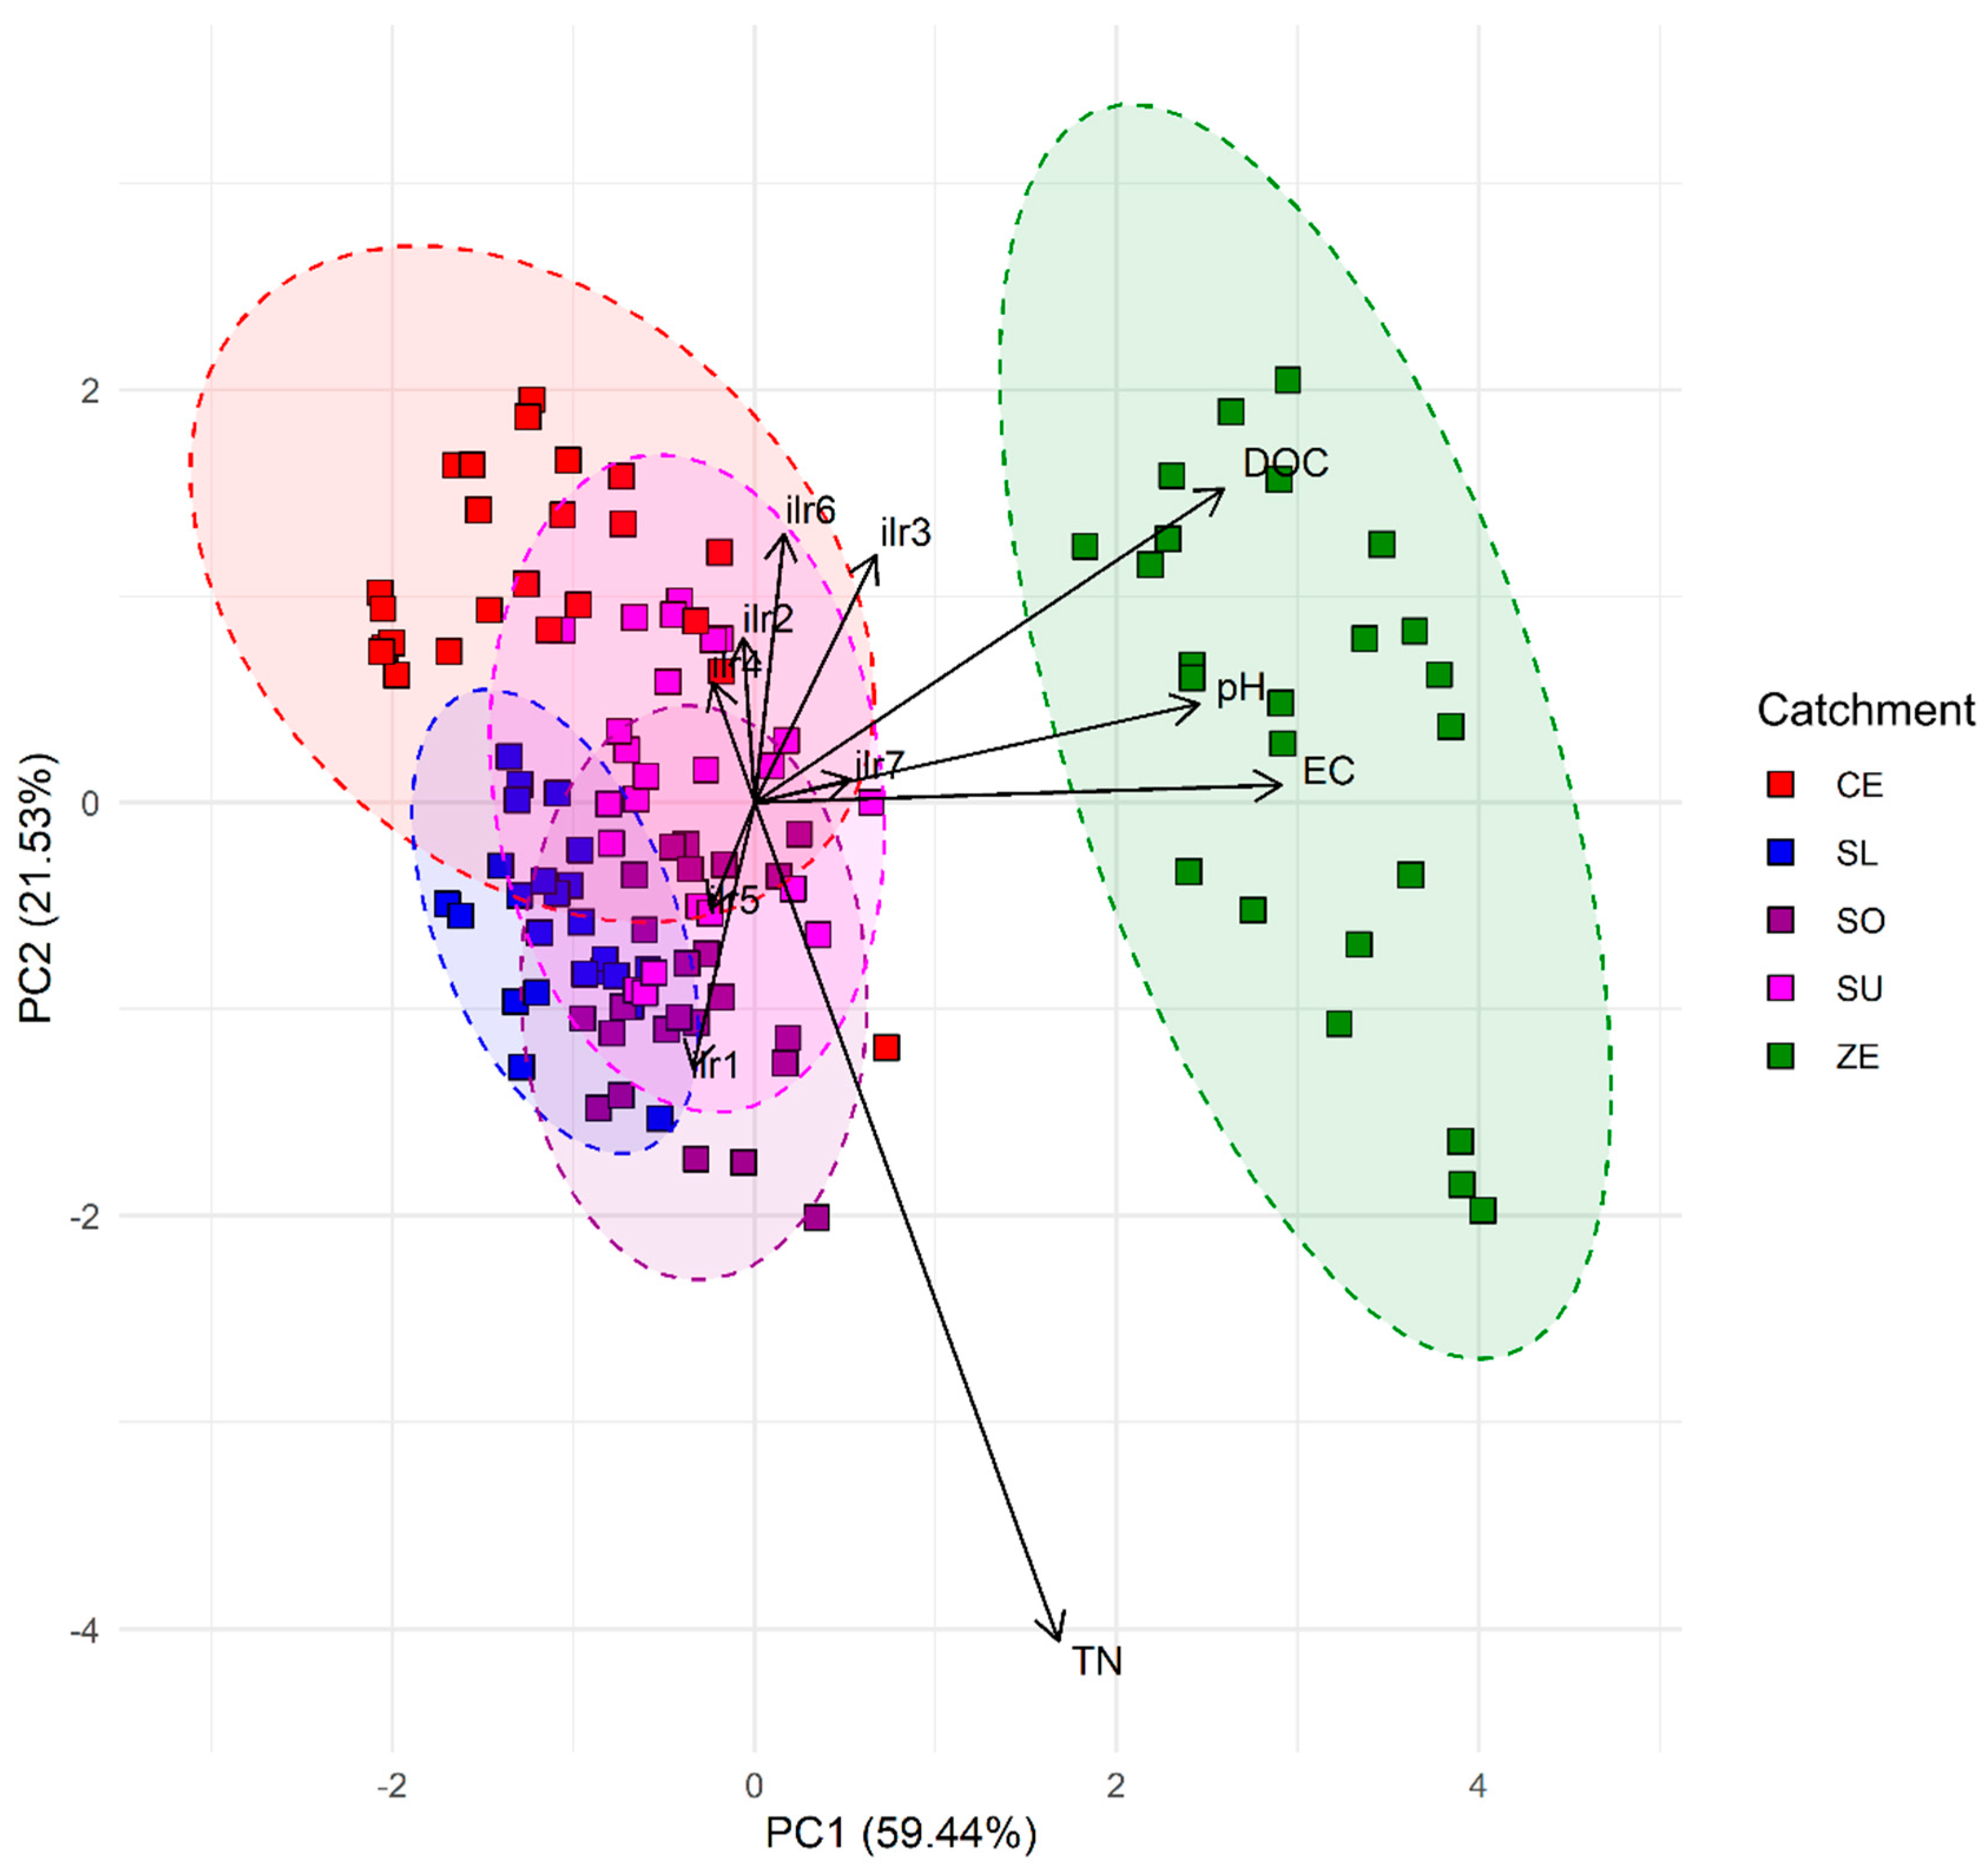
Figure 6.
Principal component analysis of ilr-transformed data: Biplot of the PC1 versus PC3 factors.
Figure 6.
Principal component analysis of ilr-transformed data: Biplot of the PC1 versus PC3 factors.
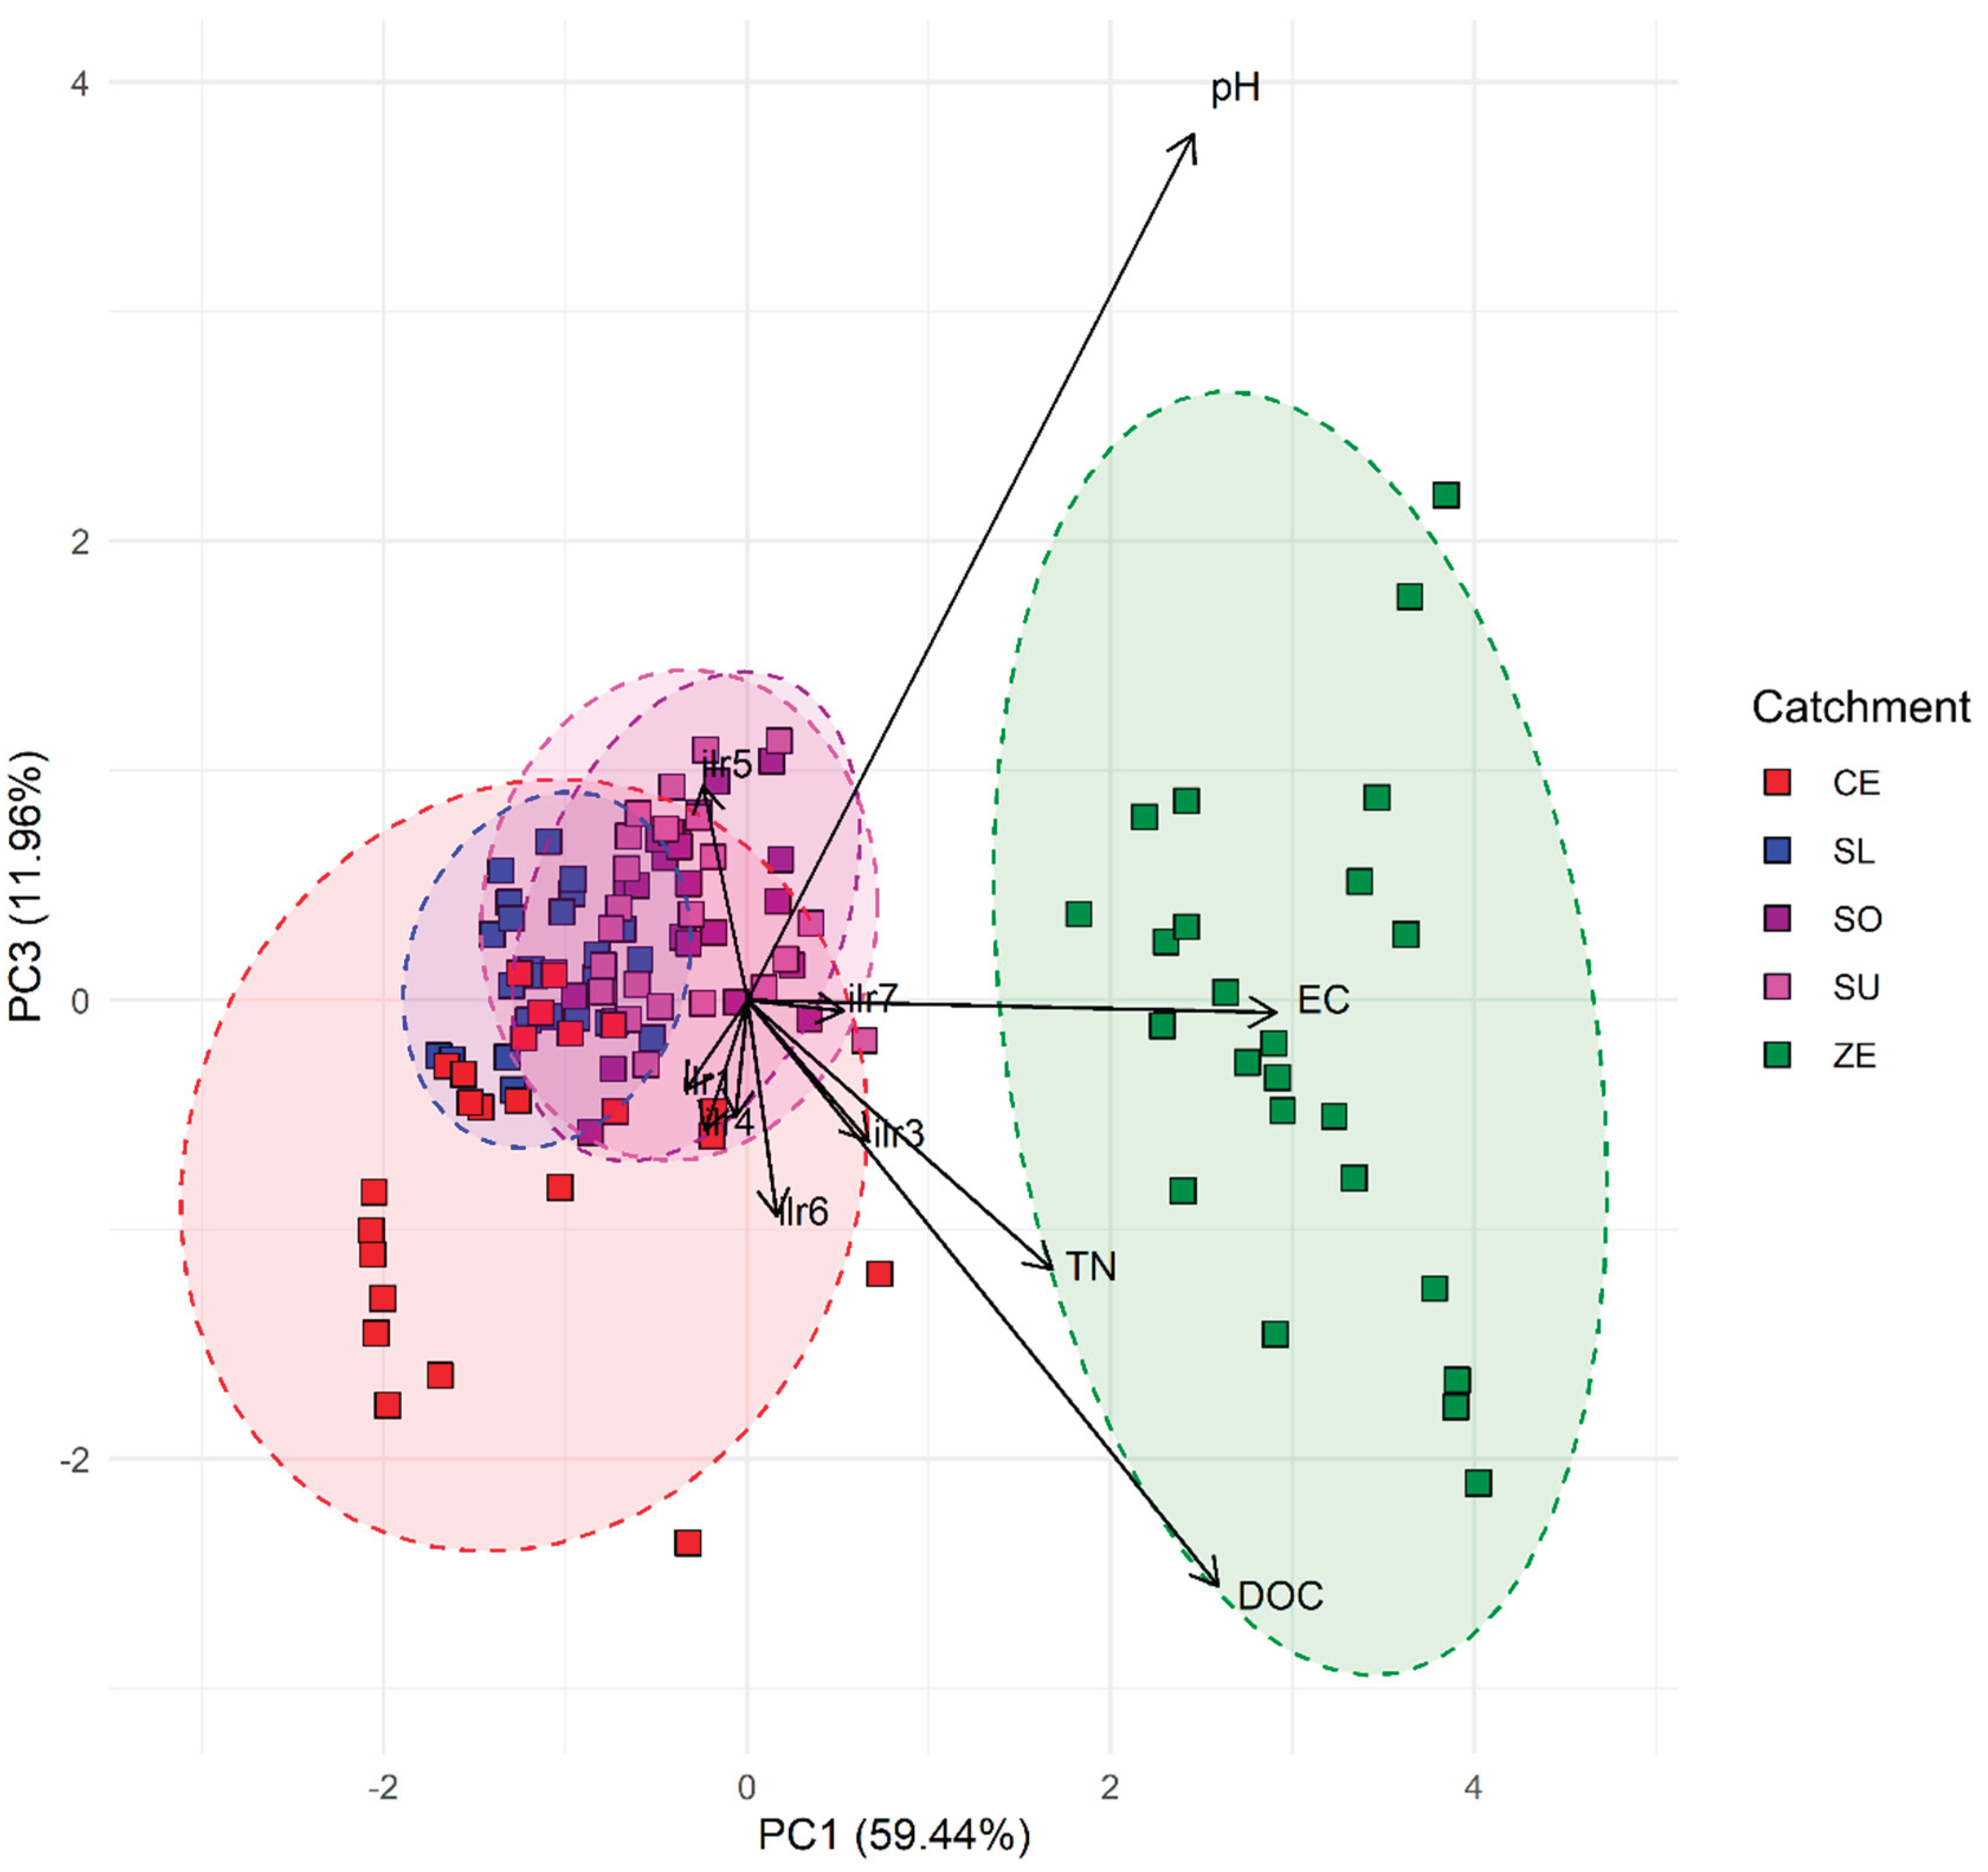

Table 1.
Catchment characteristics.
| Stream | Slučí (SL) | Sokolí (SO) | Suchý (SU) | Červík (CE) | Pekelský (ZE) |
|---|---|---|---|---|---|
| Catchment area (km2) | 3.98 | 3.99 | 2.05 | 1.85 | 1.24 |
| Stream length (m) | 3436 | 3632 | 1680 | 5426 | 1671 |
| Minimum catchment elevation (m a.s.l.) | 649 | 614 | 646 | 505 | 374 |
| Maximum catchment elevation (m a.s.l.) | 1202 | 1215 | 1058 | 958 | 470 |
| Mean catchment elevation (m a.s.l.) | 914 | 919 | 892 | 696 | 445 |
| Forest area (km2)* | 3.98 | 3.99 | 2.05 | 1.85 | 1.22 |
| Forest cover (%)* | 100 | 100 | 100 | 100 | 98 |
| Mean annual precipitation (mm)** | 984 | 947 | 866 | 1071 | 676 |
| Mean runoff (l·s−1·km−2)** | 9.96 | 9.60 | 7.16 | 18.18 | 6.35 |
* Relates to areas classified under Czech forestry law (Act No. 289/1995 Coll.) as “land designated for forestry purposes”. ** For the period from June 2022 to May 2024.
Table 2.
Quantification of disturbance: Area of clear-cuts (ha) in the monitored catchments from 2003 to 2024.
Table 2.
Quantification of disturbance: Area of clear-cuts (ha) in the monitored catchments from 2003 to 2024.
| Period | SL | SO | SU | ZE |
|---|---|---|---|---|
| 2003–2006 | 1.33 | 1.32 | 0.00 | 8.40 |
| 2006–2009 | 0.22 | 0.00 | 0.82 | 4.08 |
| 2009–2012 | 1.17 | 1.37 | 0.66 | 5.54 |
| 2012–2014 | 0.20 | 0.00 | 0.00 | 1.06 |
| 2014–2016 | 1.03 | 0.48 | 0.02 | 3.73 |
| 2016–2018 | 3.88 | 9.22 | 2.49 | 6.28 |
| 2018–2020 | 8.73 | 18.81 | 5.81 | 21.86 |
| 2020–2022 | 15.81 | 7.73 | 7.46 | 18.00 |
| 2022–2024 | 0.24 | 6.08 | 0.00 | 7.06 |
Table 3.
Chemical composition of precipitation in the monitored localities.
| Locality* | pH | NH4+ (mg·l−1) |
Ca2+ (mg·l−1) |
K+ (mg·l−1) |
Mg2+ (mg·l−1) |
Na+ (mg·l−1) |
Cl− (mg·l−1) |
NO3− (mg·l−1) |
SO42− (mg·l−1) |
HCO3− (mg·l−1) |
DOC (mg·l−1) | TN (mg·l−1) |
EC (μS·cm−1) |
|
|---|---|---|---|---|---|---|---|---|---|---|---|---|---|---|
| SL+SO+SU | Mean | 5.56 | 0.34 | 0.28 | 0.29 | 0.06 | 0.17 | 0.34 | 0.91 | 0.78 | 1.15 | 3.02 | 0.67 | 10.06 |
| STD | 0.38 | 0.32 | 0.18 | 0.19 | 0.02 | 0.11 | 0.20 | 0.53 | 0.32 | 1.13 | 1.04 | 0.34 | 2.94 | |
| CE | Mean | 5.40 | 0.51 | 0.31 | 0.49 | 0.09 | 0.01 | 0.35 | 2.32 | 0.79 | 0.87 | 2.20 | 1.13 | 14.77 |
| STD | 0.48 | 0.45 | 0.17 | 0.45 | 0.05 | 0.02 | 0.17 | 1.98 | 0.38 | 1.50 | 0.86 | 0.78 | 7.10 | |
| ZE | Mean | 5.67 | 0.47 | 0.35 | 0.34 | 0.11 | 0.21 | 0.41 | 1.83 | 0.94 | 0.41 | 2.65 | 1.16 | 20.05 |
| STD | 0.51 | 0.27 | 0.20 | 0.49 | 0.10 | 0.11 | 0.19 | 1.35 | 0.57 | 1.01 | 1.49 | 1.49 | 23.38 |
*SL – Slučí stream catchment, SO – Sokolí stream catchment, SU – Suchý stream catchment, CE – Červík stream catchment, ZE – Pekelský stream catchment. DOC – dissolved organic carbon, TN – total nitrogen, EC – electrical conductivity.
Table 4.
Chemical composition of runoff in the individual streams.
| Locality* | pH | NH4+ (mg·l−1) |
Ca2+ (mg·l−1) |
K+ (mg·l−1) |
Mg2+ (mg·l−1) |
Na+ (mg·l−1) |
Cl− (mg·l−1) |
NO3− (mg·l−1) |
SO42− (mg·l−1) |
HCO3− (mg·l−1) |
DOC (mg·l−1) |
TN (mg·l−1) |
EC (μS·cm−1) |
|
|---|---|---|---|---|---|---|---|---|---|---|---|---|---|---|
| SL | Mean | 7.17 | 0.01 | 7.16 | 0.78 | 0.90 | 1.63 | 1.15 | 2.82 | 9.60 | 14.71 | 1.51 | 0.73 | 61.84 |
| STD | 0.11 | 0.00 | 0.65 | 0.07 | 0.06 | 0.07 | 0.06 | 0.33 | 0.47 | 2.43 | 0.34 | 0.15 | 4.40 | |
| SO | Mean | 7.32 | 0.01 | 9.99 | 0.80 | 1.11 | 1.90 | 1.14 | 3.52 | 11.77 | 21.94 | 1.78 | 0.87 | 79.48 |
| STD | 0.16 | 0.01 | 1.22 | 0.06 | 0.12 | 0.11 | 0.07 | 0.63 | 0.90 | 3.24 | 0.52 | 0.16 | 6.85 | |
| SU | Mean | 7.30 | 0.01 | 10.05 | 0.70 | 1.60 | 2.17 | 1.45 | 2.32 | 16.22 | 20.34 | 2.02 | 0.62 | 87.04 |
| STD | 0.14 | 0.01 | 1.16 | 0.05 | 0.17 | 0.12 | 0.10 | 0.63 | 1.07 | 3.14 | 0.66 | 0.18 | 7.32 | |
| CE | Mean | 7.01 | 0.02 | 4.43 | 0.99 | 2.09 | 2.38 | 0.94 | 1.32 | 11.27 | 14.04 | 2.83 | 0.42 | 60.83 |
| STD | 0.21 | 0.05 | 0.81 | 0.18 | 0.39 | 0.64 | 0.05 | 0.23 | 0.69 | 5.38 | 1.01 | 0.24 | 10.20 | |
| ZE | Mean | 7.76 | 0.01 | 11.69 | 1.66 | 3.64 | 8.06 | 4.29 | 3.80 | 22.94 | 38.47 | 5.93 | 0.94 | 144.70 |
| STD | 0.31 | 0.00 | 1.25 | 0.16 | 0.26 | 0.48 | 0.38 | 1.80 | 5.30 | 4.77 | 1.22 | 0.36 | 13.00 |
*SL – Slučí stream catchment, SO – Sokolí stream catchment, SU – Suchý stream catchment, CE – Červík stream catchment, ZE – Pekelský stream catchment. DOC – dissolved organic carbon, TN – total nitrogen, EC – electrical conductivity.
Table 5.
Net annual elemental budget (kg·ha−1·yr−1): Negative values indicate net retention (sink), while positive values indicate net release (source) of substances from the catchment.
Table 5.
Net annual elemental budget (kg·ha−1·yr−1): Negative values indicate net retention (sink), while positive values indicate net release (source) of substances from the catchment.
| SL | SO | SU | CE | ZE | |
|---|---|---|---|---|---|
| N-NH4+ | -2.54 | -2.54 | -2.55 | -3.25 | -2.27 |
| N-NO3− | 0.24 | 0.61 | -0.56 | -3.48 | -0.63 |
| TN | -3.89 | -3.59 | -4.77 | -8.25 | -5.89 |
| Ca2+ | 20.15 | 26.67 | 19.03 | 19.14 | 21.33 |
| Mg2+ | 2.33 | 2.76 | 2.94 | 9.69 | 6.76 |
| K+ | -0.08 | -0.17 | -0.95 | 0.40 | 1.72 |
| Na+ | 2.26 | 4.35 | 3.50 | 11.27 | 15.02 |
| Cl− | -0.66 | 0.68 | 0.59 | 1.41 | 6.37 |
| S-SO42− | 8.03 | 9.39 | 9.60 | 17.96 | 14.18 |
| HCO3− | 34.85 | 52.30 | 31.42 | 54.78 | 70.68 |
| DOC | -22.01 | -21.75 | -22.55 | -7.12 | -4.24 |
Table 6.
The mean values of isometric log-ratio coordinates z1, z2, z3, and z4.
| catchment | z1 | z2 | z3 | z4 |
|---|---|---|---|---|
| CE | 0.35 | 0.18 | -1.26 | -0.76 |
| SL | 0.46 | 1.11 | -1.31 | -0.48 |
| SO | 0.59 | 1.20 | -1.58 | -0.66 |
| SU | 0.67 | 0.94 | -1.29 | -0.72 |
| ZE | 0.05 | 0.47 | -1.24 | -0.1 |
Table 7.
Pearson's correlation coefficients (r) and corresponding p-values calculated between the Principal Components (PC1, PC2, PC3) and the ilr-transformed compositional variables (ilr1 to ilr7) and the standardized supplementary variables (EC, pH, DOC, TN).
Table 7.
Pearson's correlation coefficients (r) and corresponding p-values calculated between the Principal Components (PC1, PC2, PC3) and the ilr-transformed compositional variables (ilr1 to ilr7) and the standardized supplementary variables (EC, pH, DOC, TN).
| PC1 | PC2 | PC3 | |||||||
|---|---|---|---|---|---|---|---|---|---|
| r | p-value | r | p-value | r | p-value | Correlation | |||
| ilr1 | -0.331 | <0.001 | -0.754 | <0.001 | -0.172 | 0.060 | Strong + | ||
| ilr2 | -0.090 | 0.326 | 0.662 | <0.001 | -0.315 | <0.001 | Moderate + | ||
| ilr3 | 0.613 | <0.001 | 0.662 | <0.001 | -0.254 | 0.005 | Weak + | ||
| ilr4 | -0.343 | <0.001 | 0.521 | <0.001 | -0.381 | <0.001 | Weak - | ||
| ilr5 | -0.318 | <0.001 | -0.404 | <0.001 | 0.546 | <0.001 | Moderate - | ||
| ilr6 | 0.157 | 0.086 | 0.764 | <0.001 | -0.412 | <0.001 | Strong - | ||
| ilr7 | 0.729 | <0.001 | 0.093 | 0.313 | -0.030 | 0.746 | Non significant | ||
| EC | 0.960 | <0.001 | 0.017 | 0.852 | -0.008 | 0.929 | |||
| pH | 0.810 | <0.001 | 0.095 | 0.303 | 0.559 | <0.001 | |||
| DOC | 0.856 | <0.001 | 0.302 | <0.001 | -0.378 | <0.001 | |||
| TN | 0.555 | <0.001 | -0.805 | <0.001 | -0.174 | 0.058 | |||
Table 8.
Pearson's correlation coefficients (r) and p-values quantifying the relationship between the PCA input variables (ilr vectors) and the original, untransformed variables.
Table 8.
Pearson's correlation coefficients (r) and p-values quantifying the relationship between the PCA input variables (ilr vectors) and the original, untransformed variables.
| ilr1 | ilr2 | ilr3 | ilr4 | |||||||
|---|---|---|---|---|---|---|---|---|---|---|
| r | p-value | r | p-value | r | p-value | r | p-value | Correlation | ||
| HCO3- | -0.544 | <0.001 | -0.162 | 0.077 | 0.584 | <0.001 | -0.349 | <0.001 | Strong + | |
| NO3- | 0.520 | <0.001 | -0.512 | <0.001 | -0.153 | 0.096 | -0.608 | <0.001 | Moderate + | |
| SO42- | -0.208 | 0.022 | 0.229 | 0.012 | 0.525 | < 0.001 | -0.473 | < 0.001 | Weak + | |
| Na+ | -0.421 | <0.001 | 0.097 | 0.290 | 0.810 | <0.001 | -0.128 | 0.164 | Weak - | |
| K+ | -0.446 | <0.001 | 0.067 | 0.466 | 0.848 | <0.001 | 0.127 | 0.167 | Moderate - | |
| Ca2+ | -0.141 | 0.123 | -0.339 | <0.001 | 0.040 | 0.664 | -0.800 | <0.001 | Strong - | |
| Mg2+ | -0.550 | <0.001 | 0.347 | <0.001 | 0.897 | <0.001 | 0.019 | 0.837 | Non significant | |
| Cl- | -0.285 | 0.002 | 0.032 | 0.726 | 0.691 | < 0.001 | -0.273 | 0.003 | ||
| ilr5 | ilr6 | ilr7 | ||||||||
| r | p-value | r | p-value | r | p-value | |||||
| HCO3- | -0.161 | 0.080 | 0.129 | 0.160 | 0.622 | <0.001 | ||||
| NO3- | 0.073 | 0.430 | -0.459 | <0.001 | 0.330 | <0.001 | ||||
| SO42- | -0.280 | 0.002 | 0.272 | 0.003 | 0.664 | < 0.001 | ||||
| Na+ | -0.534 | <0.001 | 0.374 | <0.001 | 0.776 | <0.001 | ||||
| K+ | -0.665 | <0.001 | 0.437 | <0.001 | 0.639 | <0.001 | ||||
| Ca2+ | 0.380 | <0.001 | -0.317 | <0.001 | 0.449 | <0.001 | ||||
| Mg2+ | -0.657 | <0.001 | 0.639 | <0.001 | 0.623 | <0.001 | ||||
| Cl- | -0.420 | < 0.001 | 0.231 | 0.011 | 0.864 | < 0.001 | ||||
Disclaimer/Publisher’s Note: The statements, opinions and data contained in all publications are solely those of the individual author(s) and contributor(s) and not of MDPI and/or the editor(s). MDPI and/or the editor(s) disclaim responsibility for any injury to people or property resulting from any ideas, methods, instructions or products referred to in the content. |
© 2025 by the authors. Licensee MDPI, Basel, Switzerland. This article is an open access article distributed under the terms and conditions of the Creative Commons Attribution (CC BY) license (http://creativecommons.org/licenses/by/4.0/).
Copyright: This open access article is published under a Creative Commons CC BY 4.0 license, which permit the free download, distribution, and reuse, provided that the author and preprint are cited in any reuse.


