
Submitted:
17 December 2025
Posted:
18 December 2025
You are already at the latest version
Abstract
Medium-sized cities are increasingly affected by processes of urban fragmentation and residential segregation, despite having traditionally been perceived as more socially cohesive and territorially balanced than large metropolitan areas. These cities often act as functional connectors between metropolitan hubs and rural regions, yet they are particularly vulnerable to unplanned suburban growth, housing market polarization and uneven access to urban opportunities. This study develops and applies a multidimensional Urban Territorial Index (UTI) to assess socio-spatial inequality in Ciudad Real, a medium-sized city in central Spain, and its functional urban area. The UTI integrates six indicators across three analytical dimensions—socioeconomic, sociodemographic and housing—using a weighted composite approach informed by principal component analysis and implemented through GIS-based spatial analysis. The index is calculated at census-section and neighborhood scales and externally validated against a local Human Development Index, showing a strong correlation (r = 0.87; p < 0.001). The results reveal a pronounced core–periphery polarization. Central and southern neighborhoods associated with strategic infrastructures—such as the university, high-speed rail station and hospital—concentrate higher income levels, educational attainment and land values, while peripheral municipalities and disadvantaged neighborhoods exhibit higher unemployment, lower rents and greater concentrations of migrant populations. The analysis also identifies suburban municipalities with intense housing construction but demographic stagnation, leading to population–housing mismatches, underutilized developments and service provision deficits. Methodologically, the UTI proves to be a robust and replicable tool for capturing multidimensional urban vulnerability in medium-sized cities, where metropolitan-scale indices often fail to detect fine-grained socio-spatial disparities. Substantively, the findings demonstrate that infrastructure-led development and suburban expansion can reinforce fragmentation and segregation in non-metropolitan contexts when not accompanied by integrative planning strategies. The study contributes to ongoing debates on spatial justice, urban governance and sustainable development, offering policy-relevant insights for medium-sized cities across Southern Europe and comparable urban regions.
Keywords:
urban fragmentation
; residential segregation
; Urban Territorial Index (UTI)
; medium-sized cities
; socio-spatial inequality
; suburbanization
; Ciudad Real
1. Introduction
Urban fragmentation and residential segregation represent growing concerns for social sustainability in contemporary urban systems, particularly in medium-sized cities that act as strategic connectors between metropolitan hubs and rural hinterlands. Although these cities have traditionally been perceived as more socially cohesive and territorially balanced than large metropolitan areas, recent research demonstrates that they are increasingly exposed to processes of spatial inequality, socio-demographic polarization and functional disconnection [1,2]. Their intermediate position within national urban hierarchies makes them especially vulnerable to unplanned suburban growth, selective migration and infrastructure-led development, often occurring without sufficient governance coordination or long-term territorial vision.
Medium-sized cities play a key role in regional cohesion by concentrating public services, educational institutions, healthcare facilities and administrative functions. However, their capacity to absorb growth and redistribute opportunities is frequently constrained by limited institutional resources and fragmented planning frameworks. In many European contexts—particularly in Southern Europe—these constraints have coincided with urban development models that prioritize land consumption and residential expansion over compact and integrated growth. As a result, dispersed urban forms, low-density peripheral developments and growing functional dependence on central cities have become increasingly common [1,3].
In Spain, expansive urban development since the 1990s has intensified peripheral residential growth, frequently disconnected from historical urban cores. Local planning instruments, speculative housing dynamics and expectations of sustained demographic growth facilitated the rapid urbanization of peripheral land, often decoupled from actual population demand. This process has led to pronounced disparities in access to services, infrastructure and urban opportunities, particularly evident in medium-sized cities such as Burgos and Ciudad Real [3,4]. At the same time, historic centers and consolidated neighborhoods have experienced processes of demographic ageing, social selection and, in some cases, incipient gentrification, further accentuating intra-urban contrasts.
These dynamics are not unique to the Spanish context. Similar patterns have been documented in medium-sized cities across Europe and Latin America, where suburbanization processes have contributed to urban sprawl, car dependency and socio-spatial segregation [5,6]. Comparative studies highlight that, in low-density regions and non-metropolitan contexts, surrounding municipalities often absorb residential growth without equivalent gains in employment, services or urban centrality. This mismatch generates structural inefficiencies, reinforces daily commuting flows and increases the financial and environmental costs of urban management [19,32,33].
Ciudad Real, located in the autonomous community of Castilla-La Mancha, exemplifies many of these challenges. Since the mid-1980s, its urban trajectory has been shaped by major structural transformations, notably the establishment of a university and the arrival of high-speed rail (AVE). These developments have enhanced the city’s regional accessibility and attractiveness, but have also fueled population growth in peripheral municipalities and contributed to a polarized spatial structure. Central and southern neighborhoods increasingly concentrate higher income levels, higher educational attainment and ageing populations, while suburban and peripheral areas present lower rental values, higher unemployment rates and a greater presence of migrant populations [7,8,9,23]. This pattern reflects a broader process of socio-spatial sorting associated with housing market segmentation and uneven accessibility to urban amenities.
Urban fragmentation in this context is not limited to morphological discontinuities, but also manifests through functional, social and economic dimensions. Peripheral residential expansion, often characterized by low-density housing typologies, has not been accompanied by equivalent employment opportunities or service provision, reinforcing dependence on the central city. At the same time, strategic infrastructures and tertiary-sector facilities—such as the university campus, the AVE station and the new hospital—have acted as spatial anchors that concentrate high-value residential development in specific areas, intensifying socio-spatial differentiation within the urban fabric [4,23].
Despite the growing body of literature on urban inequality, segregation and vulnerability, most existing research and methodological tools have focused on large metropolitan areas. There remains a significant gap in the development of integrated, multidimensional indices specifically designed to assess urban vulnerability in medium-sized European cities [10,11]. Many available approaches rely on unidimensional indicators or composite measures tailored to metropolitan contexts, which often fail to capture the interdependent nature of social, economic and housing variables in smaller and more fragmented urban systems.
Addressing this gap is particularly relevant for medium-sized cities, where administrative averages tend to mask sharp neighborhood-level disparities and where planning decisions can have long-lasting impacts on territorial cohesion. Robust diagnostic tools capable of operating at fine spatial scales are therefore essential to inform evidence-based urban policy and to support strategies aimed at reducing segregation and promoting social sustainability.
Against this background, the present study proposes and validates a weighted Urban Territorial Index (UTI) that integrates six indicators across three key dimensions—sociodemographic, socioeconomic and housing. Using census-section data and spatial analysis tools (QGIS), the study assesses patterns of socio-spatial fragmentation in Ciudad Real and its functional urban area. The UTI is externally validated against a local Human Development Index (HDI), showing a strong correlation (r = 0.87), and provides a transparent and reproducible framework for diagnosing urban vulnerability and supporting planning interventions in medium-sized cities facing similar challenges.
2. Theoretical Framework: Urban Fragmentation, Residential Segregation and Medium-Sized Citie
Urban fragmentation and residential segregation have become central concepts in contemporary urban studies, particularly in the context of medium-sized cities undergoing accelerated but uneven transformation. While early urban theory focused predominantly on metropolitan agglomerations, recent scholarship highlights that medium-sized cities experience similar—yet distinct—processes of socio-spatial differentiation, often with fewer institutional and fiscal capacities to mitigate their effects [1,2,3].
2.1. Urban Fragmentation: From Morphology to Socio-Spatial Processes
Urban fragmentation was initially conceptualized as a morphological phenomenon, linked to the physical discontinuity of urban fabrics produced by sprawl, zoning practices and infrastructure-led development [4]. However, more recent approaches emphasize its multidimensional character, integrating functional, social, economic and symbolic dimensions [5,6,7]. Fragmentation thus refers not only to spatial discontinuity, but also to the weakening of social cohesion, unequal access to urban services, and differentiated opportunities across neighborhoods.
In Southern European contexts, fragmentation has been strongly associated with the transition from compact urban forms to dispersed and low-density development patterns since the 1990s [8,9]. Liberalized land markets, speculative housing production and infrastructure investments—often disconnected from demographic demand—have generated peripheral growth areas characterized by functional dependence on the core and limited urban centrality [10,11]. This process has been particularly intense in medium-sized cities, where new residential enclaves coexist with aging historic centers, producing hybrid urban morphologies and reinforcing spatial inequalities [12].
2.2. Residential Segregation and Socio-Spatial Inequality
Residential segregation refers to the uneven spatial distribution of social groups within urban space, commonly structured along socioeconomic, demographic and ethnic lines [13]. Classical approaches, rooted in the Chicago School, interpreted segregation as an ecological outcome of market dynamics [14]. Contemporary perspectives, however, stress the role of institutional factors, housing policies, labor markets and planning decisions in shaping segregation patterns [15,16,17].
In European cities, segregation tends to be less extreme than in North American contexts, yet it has intensified in recent decades due to rising income inequality, migration flows and housing market polarization [18,19]. Studies on Spanish cities reveal growing contrasts between high-income, well-serviced neighborhoods and peripheral or inner-city areas with higher unemployment, lower educational attainment and greater concentrations of migrant populations [20,21,22]. Medium-sized cities exhibit a specific form of segregation, often characterized by a combination of suburban affluence and peripheral vulnerability rather than large-scale inner-city deprivation [23].
2.3. Medium-Sized Cities, Functional Urban Areas and Peripheralization
Medium-sized cities play a strategic role in territorial cohesion, acting as intermediaries between metropolitan regions and rural hinterlands [24]. Nevertheless, they are increasingly affected by processes of peripheralization, understood as the cumulative socio-economic disadvantages experienced by certain territories within broader urban systems [25]. Peripheralization in functional urban areas (FUAs) is often linked to commuting dependency, demographic stagnation, limited service provision and weak governance coordination [26].
The functional urban area approach has been widely adopted to capture these dynamics, emphasizing flows of mobility, labor and services beyond administrative boundaries [27]. In low-density regions, such as central Spain, FUAs tend to display monocentric structures, with strong core dominance and limited polycentric integration [28]. This configuration reinforces socio-spatial disparities, as surrounding municipalities absorb housing growth without corresponding employment or service functions, generating mismatches between residential expansion and urban vitality [29].
2.4. Measuring Urban Vulnerability: From Single Indicators to Composite Indices
The growing complexity of urban fragmentation and segregation has prompted the development of composite indices aimed at capturing multidimensional vulnerability [30]. While single indicators (e.g., income or unemployment) provide valuable insights, they often fail to reflect the interdependencies between social, economic and housing dimensions [31]. Composite indices, when transparently constructed, allow for a more integrated diagnosis of urban inequality and support spatially targeted policy interventions [32].
Recent contributions advocate for PCA-informed weighting schemes to reduce arbitrariness and enhance empirical robustness in synthetic indices [33]. Such approaches have been applied to urban vulnerability, peripheralization risk and social deprivation, particularly in European and Latin American contexts [34,35,36]. However, most existing indices are tailored to large metropolitan areas, limiting their applicability to medium-sized cities with different spatial scales, data availability and urban dynamics [37].
Within this framework, the Urban Territorial Index (UTI) proposed in this study responds to the need for a multidimensional, scalable and replicable tool specifically designed for medium-sized functional urban areas. By integrating socioeconomic, sociodemographic and housing dimensions, and by validating the composite against independent development indicators, the UTI contributes to ongoing debates on spatial justice, urban governance and sustainable urban development in non-metropolitan contexts [38,39].
3. Materials and Methods
3.1. Study Area and Territorial Delimitation
Ciudad Real, a provincial capital in Castilla-La Mancha, Spain, has undergone significant transformation since the 1980s due to the establishment of a university (1985) and the arrival of high-speed rail (AVE, 1992). The urban expansion resulting from these catalysts has contributed to a fragmented and polarized spatial structure [4].
This study adopts a functional urban area (FUA) approach to delineate the spatial scope of analysis. The delimitation follows the Urban Transformation Index (UTI) methodology, incorporating criteria such as demographic density (>100 inhabitants/km²), urban continuity, and functional connectivity. The resulting FUA includes Ciudad Real and six surrounding municipalities: Miguelturra, Poblete, Carrión de Calatrava, Ballesteros de Calatrava, Pozuelo de Calatrava, and Torralba de Calatrava. The analysis is conducted at three spatial scales: the FUA, 73 census tracts [7], and intra-urban neighborhoods.
This spatial definition is informed by previous studies on Functional Urban Areas in low-density regions, which use criteria based on linked population (mobility, commuting, and service accessibility) to define urban influence zones [12]. This approach is aligned with the European Spatial Development Perspective (ESDP), emphasizing polycentricity and the role of secondary urban nodes in regional cohesion.
3.2. Data Sources and Variables
Urban vulnerability is approached as a multidimensional construct, integrating sociodemographic, socioeconomic and housing-related dimensions, in line with previous work on composite indices and socio-spatial inequalities [5,10]. Two main methodological traditions converge here: the use of disaggregated indicators, which allows detailed diagnosis of specific vulnerability dimensions but often fails to capture interactions between them, and synthetic indices, which integrate multiple variables at the cost of reduced transparency in individual contributions [11,13].
To balance these perspectives, a weighted synthetic indicator is constructed from six indicators organised into three dimensions:
Sociodemographic: Percentage of population aged 25 or over with tertiary education; percentage of foreign-born population (considering the nine most frequent nationalities).
Socioeconomic: Average household income per consumption unit; unemployment rate of the working-age population.
Housing: Cadastral reference value of residential properties (€/m²); average rental price (€/m²), distinguishing between apartment blocks and single-family houses when possible.
All indicators were obtained from official Spanish sources for the most recent year with complete coverage [7,8,9]: INE Population and Housing Census 2021 [7], INE Experimental Statistics [7], the General Directorate for Cadastre [8] and the Ministry of Transport, Mobility and Urban Agenda for rental prices [9]. This ensures internal temporal consistency across the dataset.
3.3. Construction of the Urban Territorial Index (UTI)
The Urban Territorial Index (UTI) summarises the relative socio-spatial position of each census section in Ciudad Real’s functional urban area. The construction process comprises four steps and was implemented using a geographic information system. (Table 1).
First, each indicator was mapped at census-section level and classified into four categories using the Natural Breaks (Jenks) method, which groups values into internally homogeneous intervals and maximizes between-class differences, following previous applications of urban vulnerability indices in Spanish medium-sized cities [6]. An ordinal score from 1 to 4 was assigned to each class, with 4 representing the most favorable situation and 1 the least favorable; in the case of unemployment, the scale was inverted so that higher unemployment rates corresponded to lower scores.
Second, partial scores were calculated for each dimension by summing the scores of their respective indicators. The sociodemographic score combines education and foreign-born population; the socioeconomic score combines income and (inverted) unemployment; and the housing score combines cadastral value and rental prices. Each partial score therefore ranges between 2 and 8, preserving direct interpretability while reducing dimensionality.
Third, the three partial scores were integrated into a single composite value using a weighted linear combination. The weighting scheme was informed by both the literature on synthetic indices and an exploratory principal component analysis, which showed a stronger contribution of the socioeconomic dimension to overall variance, followed by housing and sociodemographic [5,15]. The final formulation of the UTI is: , where is the socioeconomic score, the housing score and the sociodemographic score. The index is then normalised to a 0–8 theoretical range, although empirical values concentrate in intermediate ranges.
UTI values were classified into four levels—very low, low, medium and high—using again the Natural Breaks method. These classes allow the identification of clusters of relative advantage and disadvantage and provide a basis for mapping patterns of fragmentation and segregation.
3.4. Validation and Analytical Strategy
The robustness of the UTI was assessed through internal and external validation. Internal consistency was evaluated using standard reliability statistics and correlations between the partial scores and the global index, confirming that each dimension contributes coherently to the composite measure. External validation was performed by comparing UTI values with independent indicators of social development and deprivation available at municipal and neighborhood scale, including human development measures, and by contrasting the resulting spatial patterns with previous work on Castilla-La Mancha’s urban systems [4,16,17].
The analytical strategy combined cartographic visualization of UTI scores at census-section and neighborhood levels with descriptive statistics and bivariate correlations between the index and key demographic and housing variables (e.g., population growth 2001–2011 and 2011–2021, changes in housing stock, age structure). This made it possible to interpret patterns of urban fragmentation in relation to both long-term urbanization dynamics and current socio-economic conditions.
4. Results
Ciudad Real has undergone significant transformations in recent decades, characterized by uneven growth between the capital and its urban area, a process of suburbanization, and the emergence of new socio-spatial dynamics. The data reveals more dynamic growth in peripheral municipalities compared to stabilization in the capital, alongside significant residential expansion in specific areas. Moreover, socioeconomic indicators highlight notable inequalities between neighborhoods, reflected in patterns of urban fragmentation and residential segregation. These processes underscore both the opportunities and the challenges the city faces in terms of urban planning and social cohesion.
4.1. Demographic Dynamics and Suburbanization (2001–2021)
Ciudad Real and its functional urban area (FUA) exhibit a two-phase demographic trajectory. During 2001–2011, the capital grew by +22.06% (61,280 → 74,798), while the urban area increased by +33.15% (19,847 → 26,427). In contrast, 2011–2021 shows a marked deceleration in the capital (+0.41%, to 75,104) and a more moderate expansion in the urban area (+8.00%, to 28,542). These figures confirm a redistribution of population consistent with suburbanization patterns (Figure 1; Table 2).
Within the ring of surrounding municipalities, Pozuelo de Calatrava and Ballesteros de Calatrava stand out for strong relative growth over the two decades (+116.39% and +106.34%, respectively), while Miguelturra consolidates its role as the main expansion pole in the FUA (Figure 1; Table 3).

Table 3.
Demographic change in Ciudad Real and the FUA.
| Spatial unit | 2001–2011 | 2011–2021 | Notes |
| Ciudad Real (capital) | +22.06% | +0.41% | 61,280→74,798; then stabilization around 75,104 |
| FUA (aggregate) | +33.15% | +8.00% | 19,847→26,427; then 28,542 |
| Pozuelo de Calatrava | — | +116.39% (cum.) | Strong suburban growth |
| Ballesteros de Calatrava | — | +106.34% (cum.) | Strong suburban growth |
| Miguelturra | +41.2% (2001–2011) | — | Main expansion pole |
| Selected satellites (Poblete, Torralba, Carrión) | — | +8.0% (aggregate) | Consolidation as residential extensions |
Source: Own elaboration.
Figure 1.
Relative Growth of Population and Housing in Ciudad Real and Its Urban Area.
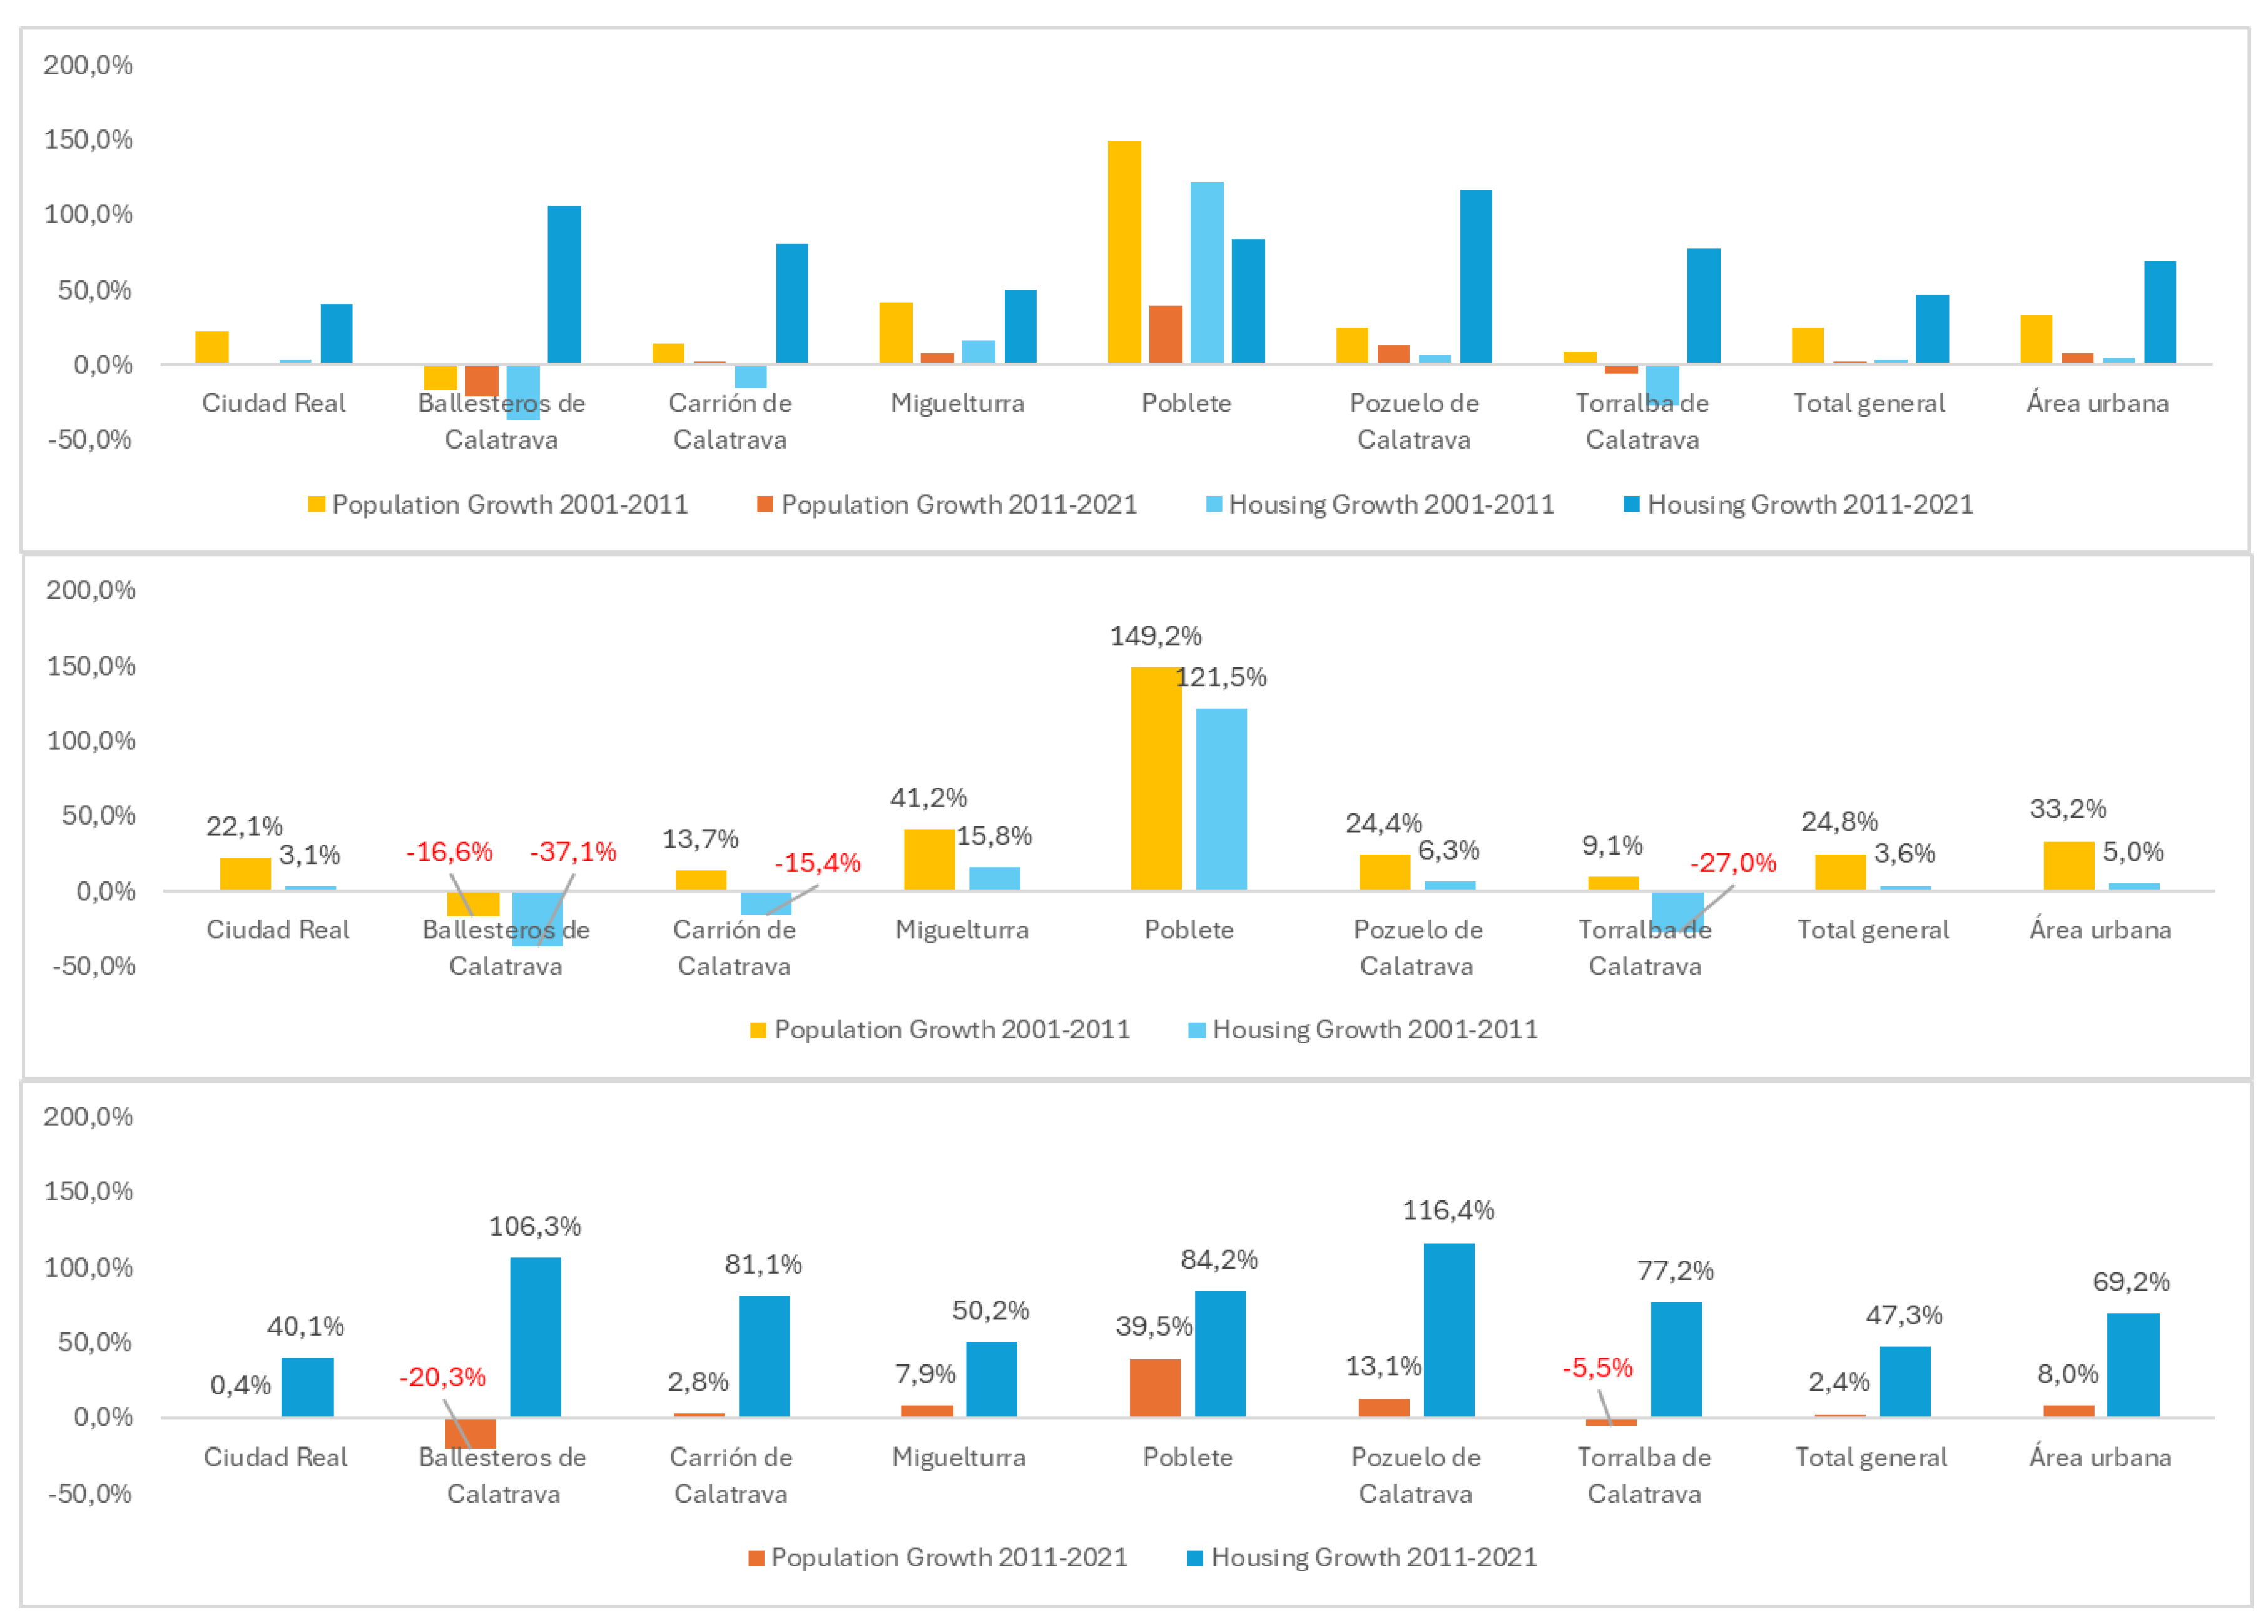
4.2. Housing Stock Dynamics and the Population–Housing Mismatch
Between 2000 and 2023, more than 20,000 new dwellings were added in the capital and its urban area, with peripheral municipalities (e.g., Miguelturra, Poblete, Pozuelo de Calatrava) absorbing a large share of new supply. The 2008 financial crisis generated partially unoccupied developments (“ghost urbanizations”), especially in low-density expansions. In 2011–2021, the capital shows very low population growth (+0.4%) while housing construction accelerates in satellites (e.g., Pozuelo +116.4%, Ballesteros +106.3%, Poblete +84.2% in stock growth terms reported), widening the population–housing gap typical of suburbanization cycles Table 4).
Table 4.
Housing development signals by municipality (2011–2021).
| Municipality | Reported housing stock growth | Salient features |
| Pozuelo de Calatrava | +116.4% | High construction intensity; demand partly decoupled from population |
| Ballesteros de Calatrava | +106.3% | Stock growth with population decline (−20.3%) |
| Poblete | +84.2% | Strong expansion in low-density formats |
| Ciudad Real (capital) | — | New large projects outside the Rondas; concentration near AVE, University, Hospital |
Source: Own elaboration.
4.3. Morphological Change and Peripheral Expansion
Building age mapping (Figure 2) documents successive waves of outward growth: consolidation beyond the Rondas in 1940–1960; accelerated dispersion in 1960–2000; and from 2000 onwards, a shift to southern and peripheral sectors—Nuevo Hospital, Larache, Las Vías, Estación de Autobuses, Vía Verde—with Miguelturra and Poblete becoming functionally integrated extensions. The AVE station (1992), university campus (1985) and new General Hospital acted as spatial catalysts for second-ring development.
This building age mapping (Figure 2) visually supports the narrative of progressive outward growth:
- Pre-1900: Historic compact city.
- 1940–1980: Expansion beyond the Rondas.
- 1980–2000: Dispersed suburbanization.
- 2000 onwards: Peripheral developments linked to AVE station, University, and Hospital, creating a dual morphology (compact core vs. low-density periphery).
The building age mapping (Figure 2) provides a diachronic visualization of Ciudad Real’s urban growth, revealing distinct morphological phases and spatial logics. The historical core, characterized by pre-1900 structures (in red), forms a compact nucleus around which subsequent development radiates.
The first significant outward consolidation occurred between 1940 and 1960 (blue tones), extending beyond the Rondas and reinforcing a monocentric pattern. This stage corresponds to post-war urban densification and the stabilization of the primary road network.
From 1960 to 2000 (light green), the city experienced accelerated peripheral dispersion, particularly toward the northern and eastern sectors. This expansion coincides with the emergence of new residential enclaves and improved vehicular accessibility, marking a transition from compact growth to semi-dispersed suburbanization. The spatial footprint during this period evidences the fragmentation of the urban fabric, with isolated clusters progressively integrated through infrastructural corridors.
Post-2000 dynamics (dark green) indicate a pronounced shift toward southern and peripheral sectors, including Larache, Las Vías, the Bus Station area, and the Vía Verde corridor. Strategic facilities acted as catalysts for this second-ring development: the University Campus (1985), the AVE high-speed rail station (1992), and the new General Hospital. These nodes introduced functional polarity, fostering a polycentric tendency and redefining accessibility hierarchies. The integration of Miguelturra and, to a lesser extent, Poblete, reflects an incipient metropolitan configuration, where administrative boundaries become increasingly permeable due to continuous built-up areas and intermunicipal connectivity.
The morphological trajectory (Figure 2) encapsulates a structural transition: from a compact, monocentric city to a dispersed, multi-nodal system driven by infrastructural investments and tertiary-sector facilities. This evolution anticipates metropolitan dynamics within the framework of a medium-sized city, raising questions about sustainability, mobility, and governance in future urban planning.
4.4. Synthetic Indicator (UTI) and Patterns of Fragmentation
The Urban Territorial Index (UTI) aggregates six standardized indicators across three analytical dimensions—socioeconomic, housing and sociodemographic—through a weighted linear combination. Specifically, the socioeconomic dimension includes average household income per consumption unit and the inverted unemployment rate; the housing dimension incorporates cadastral reference values (€/m²) and average rental prices (€/m²); and the sociodemographic dimension is represented by the share of population with tertiary education and the proportion of foreign-born residents. The weighting scheme assigns greater importance to the socioeconomic dimension (0.40), followed by housing (0.30) and sociodemographic characteristics (0.30), reflecting both theoretical assumptions and the results of the principal component analysis, which identified socioeconomic variables as the main contributors to overall variance.
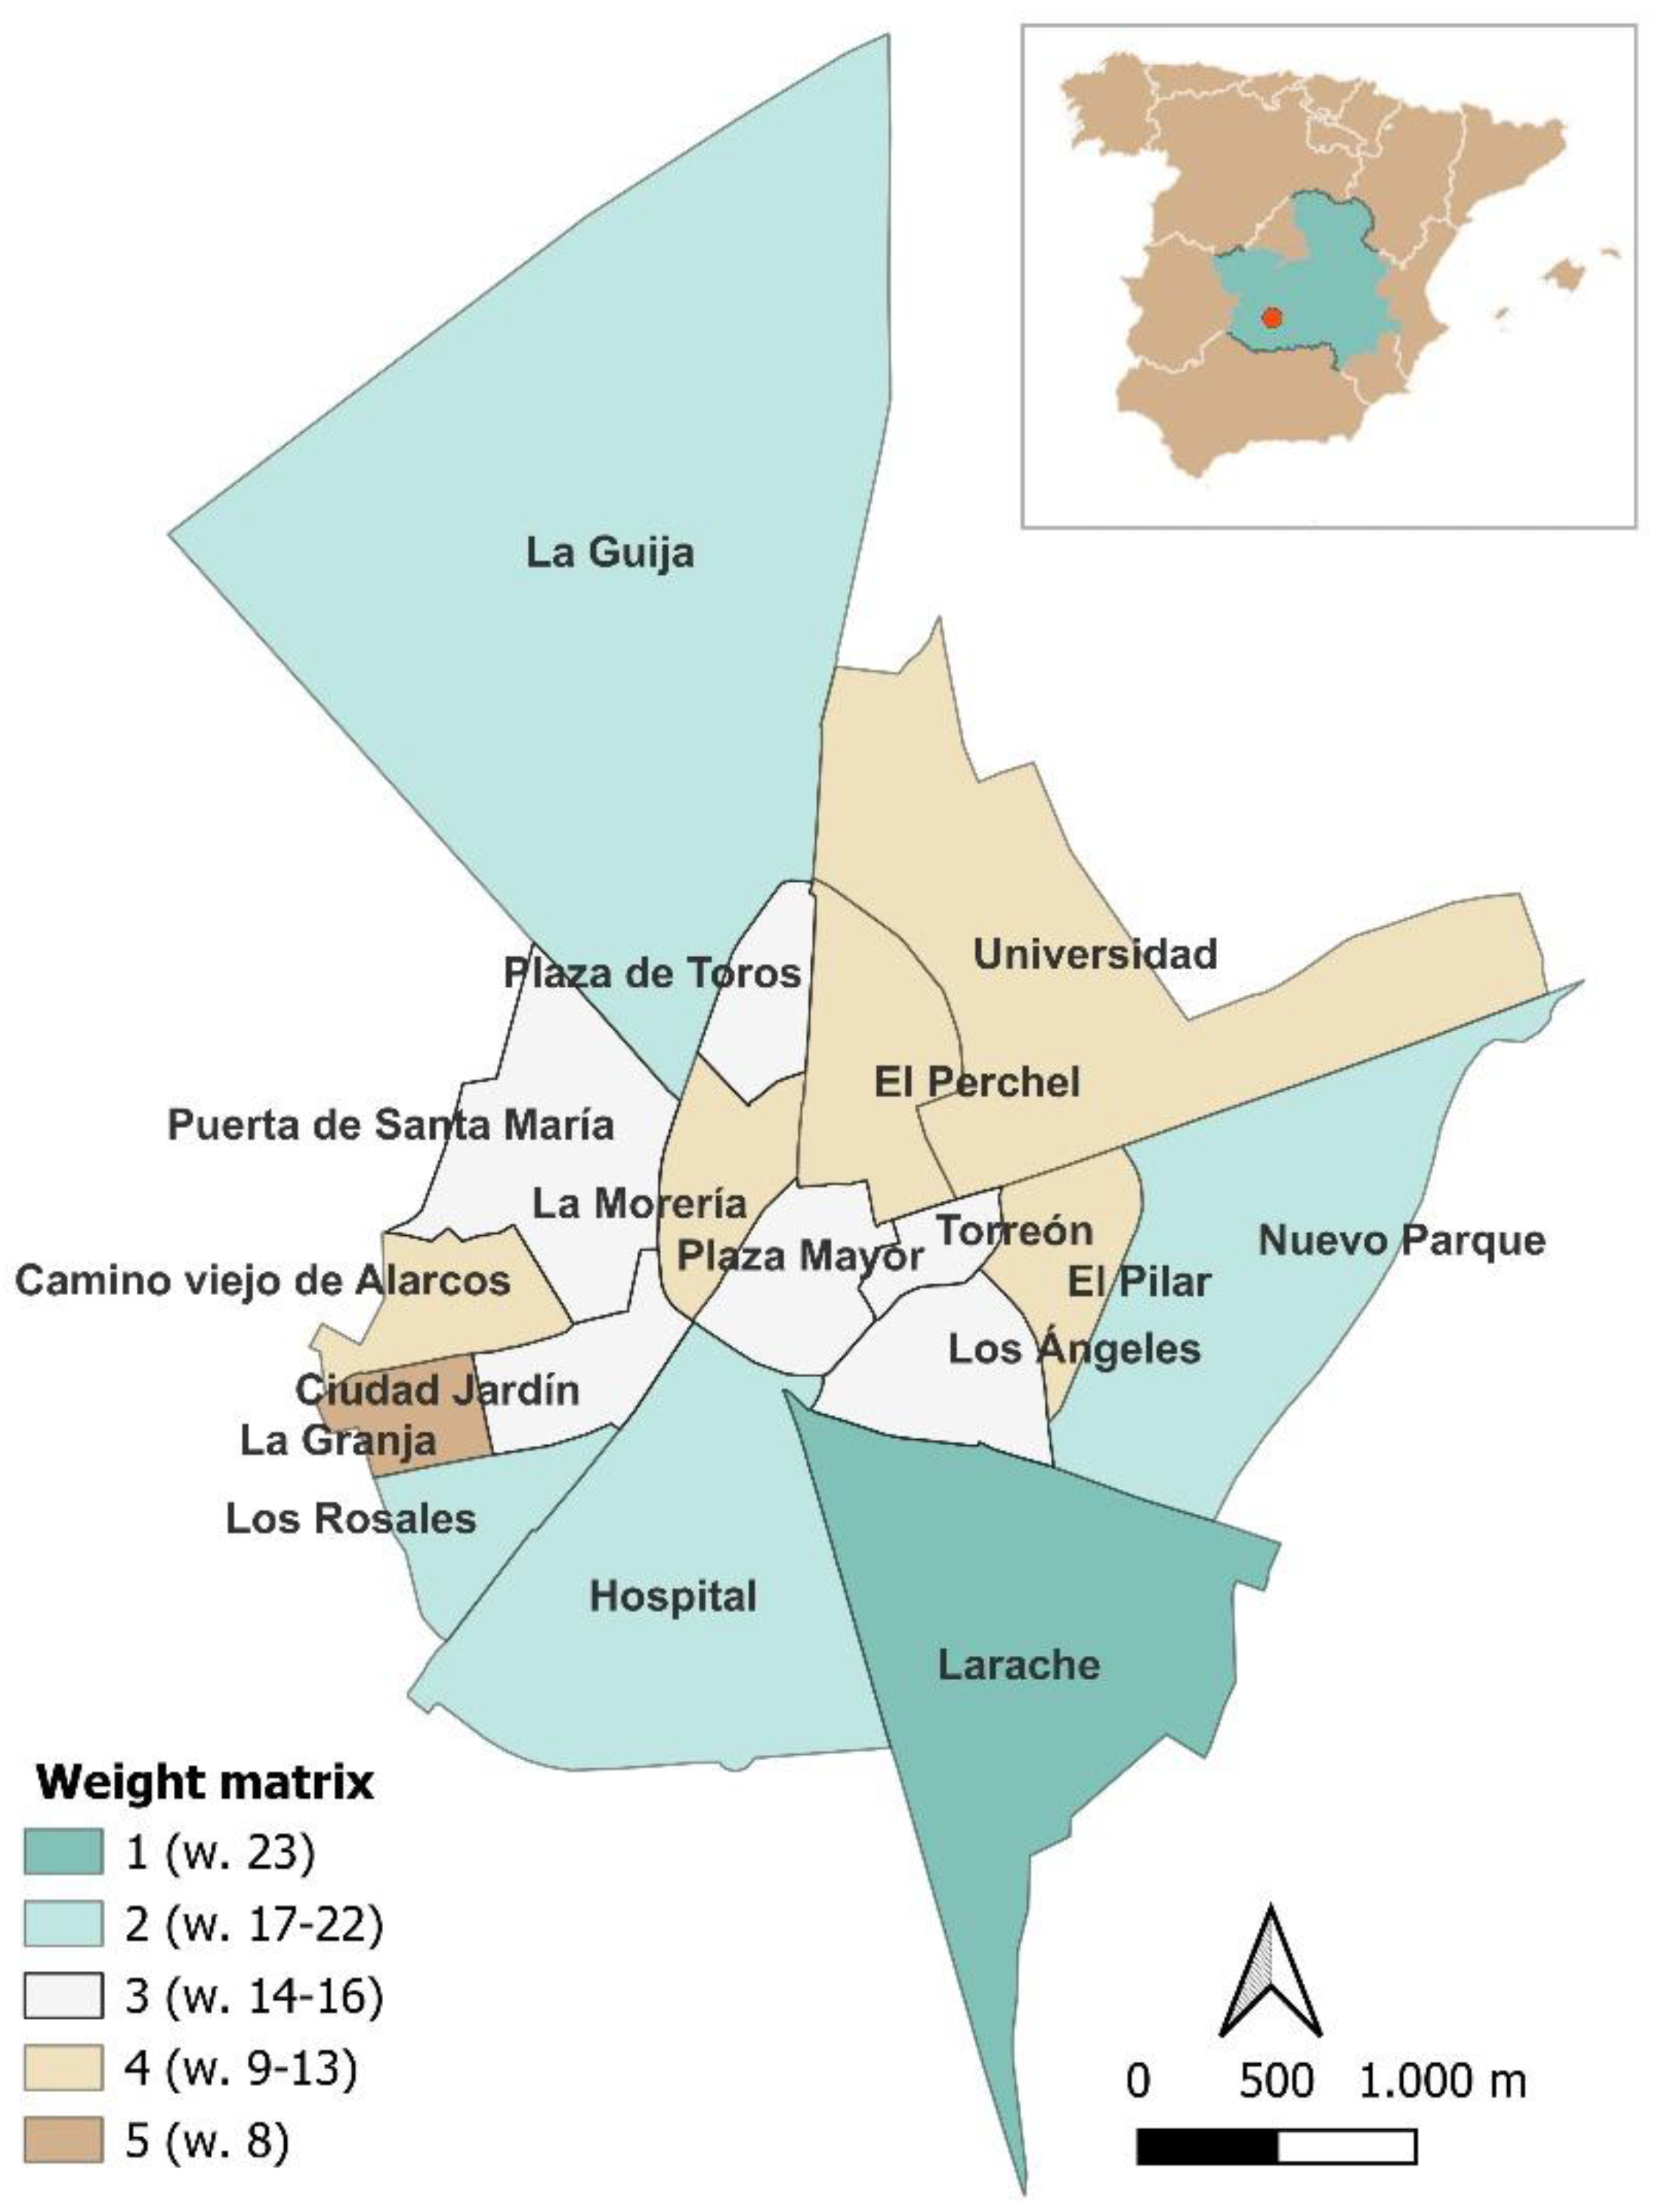
A Synthetic Indicator has been created, categorized according to a “weight matrix” for the neighborhoods of Ciudad Real and its urban area, following the methodology of [6].
UTI values were classified into four categories—very low, low, medium and high—using the Jenks natural breaks method. This classification maximizes intra-class homogeneity while enhancing inter-class differentiation, making it particularly suitable for identifying spatial clusters of relative advantage and disadvantage in heterogeneous urban contexts. The resulting spatial distribution of the index reveals a clear pattern of core–periphery polarization. Higher UTI values concentrate in the central city and in specific southern sectors associated with recent high-value residential development, whereas low and very low values dominate in peripheral municipalities and disadvantaged intra-urban areas (Table 3).
Table 5.
Municipal weight matrix and indicative attributes.
| Municipality | Weight | Indicative attributes (from mapped indicators) |
| Ciudad Real | 23 | Highest cadastral values (€422–€1,291/m²) and income (€11,618–€27,813); high tertiary education |
| Miguelturra | 17–22 | Moderate rents (€351–€410); unemployment 10.3–27.7%; mid income (€11,618–€15,416) |
| Poblete | 14–16 | Low rents (€291–€351); unemployment 10.3–27.7%; low–mid income |
| Carrión de Calatrava | 9–13 | Low foreign-born (1.9–5.9%); unemployment 10.3–27.7% |
| Torralba de Calatrava | 9–13 | Similar to Carrión; moderate economic constraints |
| Ballesteros Calatrava | 9–13 | Low income; high unemployment; stock growth outpaces population |
| Pozuelo de Calatrava | 8 | Low rents (€291–€351); unemployment 10.3–27.7%; accessibility with labor-market constraints |
Source: Own elaboration.
At the municipal scale, Ciudad Real concentrates the highest overall UTI weight (23), reflecting its role as the economic, administrative and service core of the functional urban area. As shown in Table 3, the capital combines the highest cadastral values (€422–€1,291/m²), the highest income levels (€11,618–€27,813) and a greater proportion of residents with tertiary education. This profile contrasts sharply with that of surrounding municipalities, highlighting the asymmetric distribution of resources and opportunities within the functional urban area.
Miguelturra occupies an intermediate position in the UTI hierarchy (weights between 17 and 22), characterized by moderate rental prices (€351–€410), mid-range income levels (€11,618–€15,416) and unemployment rates ranging from 10.3% to 27.7%. Its position reflects a partial functional integration with the capital, combining residential growth with some degree of local employment and service provision. By contrast, municipalities such as Poblete and Ballesteros de Calatrava display lower UTI values (14–16 and 9–13, respectively), despite having experienced strong construction momentum. In these cases, low income levels and high unemployment persist alongside residential expansion, indicating a mismatch between housing supply and socioeconomic demand.
Carrión de Calatrava and Torralba de Calatrava also fall within the lower–middle range of the UTI distribution (weights between 9 and 13). Their profiles are marked by moderate economic constraints, relatively low shares of foreign-born population (1.9–5.9%) and limited housing market dynamism. While these municipalities do not exhibit extreme vulnerability, their position within the index suggests a fragile equilibrium that could be adversely affected by demographic stagnation or further labor-market polarization.
Pozuelo de Calatrava records the lowest UTI value (8), reflecting low rental prices (€291–€351), unemployment rates between 10.3% and 27.7%, and significant accessibility constraints linked to limited local labor-market opportunities. This situation exemplifies the risks of peripheralization within medium-sized functional urban areas, where residential expansion is not matched by sufficient economic diversification or service provision.
Overall, the municipal weight matrix presented in Table 3 confirms that urban fragmentation in Ciudad Real is not solely an intra-urban phenomenon but also operates at the inter-municipal scale. The UTI highlights how peripheral municipalities absorb residential growth under less favorable socioeconomic conditions, reinforcing a center–periphery structure typical of medium-sized cities in low-density regions. By integrating housing, labor-market and sociodemographic variables, the index provides a nuanced understanding of multi-scalar socio-spatial inequality and offers a robust basis for interpreting the patterns of fragmentation depicted in Table 3 and Figure 3.
4.5. Intra-Urban Results by Neighborhood Groups
The intra-urban application of the Urban Territorial Index (UTI) reveals a pronounced socio-spatial hierarchy within Ciudad Real, structured into five neighborhood groups corresponding to distinct levels of relative advantage and vulnerability (Table 4 and Figure 3). This grouping highlights not only sharp contrasts between neighborhoods, but also the existence of transitional zones that articulate the city’s fragmented urban structure.
At the top of the hierarchy, Group G1 (high UTI) is represented exclusively by the Larache–Nuevo Hospital area, which concentrates the highest land values in the city (€927–€1,291/m²) and the highest income levels (€22,362–€27,813), combined with very low unemployment rates. This neighborhood constitutes a consolidated enclave of affluence strongly linked to strategic infrastructures such as the new General Hospital, the AVE high-speed rail station and recent high-quality residential developments. Its spatial configuration and socioeconomic profile illustrate how infrastructure-led development can generate highly selective residential spaces, reinforcing socio-spatial polarization within medium-sized cities.
Group G2 (upper-middle UTI) includes the neighborhoods of Los Rosales and Nuevo Parque, which function as an intermediate belt between the most affluent southern sectors and more heterogeneous central and peripheral areas. These neighborhoods exhibit relatively stable rental markets, with prices ranging from €480–€580 in Hospital, €410–€480 in Los Rosales and €351–€410 in Nuevo Parque, alongside low to moderate unemployment levels. Their position within the UTI hierarchy reflects balanced socioeconomic conditions and relatively good access to services, making them attractive to middle-income households and contributing to their role as stabilizing areas within the urban system.
Figure 3.
Urban Territorial Index (UTI) of Ciudad Real.
Group G3 (medium or mixed UTI) encompasses several central and semi-central districts, including Ciudad Jardín, Plaza Mayor, Torreón, Los Ángeles, Plaza de Toros and Puerta de Santa María. These neighborhoods display heterogeneous socioeconomic profiles, combining moderate income levels with varying degrees of social diversity. In particular, Plaza de Toros stands out for its higher proportion of foreign-born residents (12.2–17.8%), indicating a concentration of migrant populations within otherwise central urban spaces. This group illustrates the coexistence of social diversity and moderate vulnerability, characteristic of transitional areas where residential functions, commercial activity and historical urban fabric intersect.
In contrast, Group G4 (lower-middle UTI) comprises neighborhoods such as La Granja, La Morería, El Perchel, El Pilar and Puerta de Toledo–Atalaya. These areas are characterized by lower rental prices (€291–€351), reduced educational attainment and lower income levels, combined with higher levels of social vulnerability. Although they maintain relatively good physical accessibility to the city center, their socioeconomic indicators reveal persistent disadvantages, reflecting long-term processes of residential sorting and limited upward mobility. These neighborhoods represent a critical target for urban policy interventions aimed at preventing further decline and reinforcing social cohesion.
At the bottom of the hierarchy, Group G5 (very low UTI) is represented by Camino de Alarcos, which concentrates the most severe socio-spatial disadvantages in the city. This neighborhood exhibits extremely high unemployment rates (ranging from 28.6% to 44.6%), a significant presence of foreign-born population (12.2–17.8%), and very low income and educational levels. The concentration of multiple vulnerability factors within a single urban space underscores the cumulative nature of socio-spatial disadvantage and highlights the risk of entrenched segregation in medium-sized cities when targeted policies are absent.
The stratification identified in Table 4 confirms the existence of a dual urban model in Ciudad Real, structured around affluent southern nodes and marginalized peripheral or semi-peripheral neighborhoods. This pattern is consistent with fragmentation dynamics documented in other Spanish medium-sized cities, where suburban expansion, infrastructure-led development and housing market segmentation interact to produce sharp intra-urban inequalities [1,6]. The UTI-based neighborhood grouping thus provides a clear and operational framework for identifying priority areas for intervention, underscoring the urgency of place-based strategies aimed at reducing segregation, improving access to opportunities and fostering territorial cohesion.
Table 6.
Neighborhood groups by UTI class.
| Group (UTI class) | Neighborhoods | Key mapped indicators (ranges) |
| G1 – High | Larache-Hospital | Highest land prices (€927–€1,291/m²); income €22,362–€27,813; low unemployment |
| G2 – Upper-middle | Los Rosales; Nuevo Parque | Rents: €480–€580 (Hospital), €410–€480 (Los Rosales), €351–€410 (Nuevo Parque); low–moderate unemployment |
| G3 – Middle / mixed | Ciudad Jardín; Plaza Mayor; Torreón; Los Ángeles; Plaza de Toros; Puerta de Santa María | Higher foreign-born in Plaza de Toros (12.2–17.8%); otherwise mixed socioeconomic profile |
| G4 – Lower-middle | La Granja; La Morería; El Perchel; El Pilar; Puerta de Toledo–Atalaya | Low–moderate rents (€291–€351); higher diversity; lower income/education |
| G5 – Very low | Camino de Alarcos | High unemployment (28.6–44.6%); high foreign-born (12.2–17.8%); low income/education |
Source: Own elaboration.
4.6. Validation
The UTI demonstrates strong external validity against a local Human Development Index proxy (r = 0.87; p < 0.001), confirming internal coherence across dimensions and the composite’s ability to capture socio-spatial disparities at census-section scale. Internal consistency checks (dimension–global correlations) indicate aligned contributions of socioeconomic, housing, and sociodemographic scores to overall variance (see Methods).
5. Discussion
5.1. Urban Fragmentation and Segregation in Medium-Sized Cities: Beyond the Metropolitan Bias
The results obtained for Ciudad Real confirm that urban fragmentation and residential segregation are no longer processes exclusive to large metropolitan regions but are increasingly structuring medium-sized cities and their functional urban areas. The UTI reveals a clear core–periphery polarization, where high-income, highly educated populations concentrate in central and strategically located southern sectors, while peripheral neighbourhoods and surrounding municipalities accumulate socioeconomic and housing disadvantages. This finding aligns with recent international literature emphasizing that medium-sized cities experience accelerated differentiation despite their smaller scale and traditionally higher levels of social cohesion.
Unlike metropolitan contexts, where segregation often manifests through extensive inner-city deprivation or large ethnic enclaves, medium-sized cities tend to display more fragmented and discontinuous patterns. In Ciudad Real, fragmentation is expressed through the juxtaposition of affluent enclaves linked to strategic facilities (hospital, university, AVE station) and vulnerable peripheral neighbourhoods characterized by unemployment, lower educational attainment, and lower housing values. Similar configurations have been identified in other Spanish and Southern European medium-sized cities, where suburban expansion has not been accompanied by equivalent functional integration or social mixing.
5.2. The Role of Housing Markets and Infrastructural
One of the key mechanisms underpinning fragmentation in Ciudad Real is the mismatch between housing production and demographic demand. The analysis shows that peripheral municipalities absorbed substantial residential growth despite modest or even negative population dynamics, producing partially occupied developments and inefficient land use. This pattern reflects a broader post-2008 trajectory in Southern Europe, where speculative housing cycles and planning permissiveness generated excess supply in suburban locations.
Strategic infrastructures and tertiary-sector anchors—such as the university, the AVE station and the new hospital—have acted as powerful drivers of spatial restructuring. While these facilities enhance accessibility and urban attractiveness, their impacts are unevenly distributed. In Ciudad Real, they have reinforced the socio-spatial hierarchy by concentrating high-value residential development in their vicinity, without generating equivalent spillovers toward disadvantaged neighbourhoods or surrounding municipalities. This confirms that infrastructure-led development, in the absence of redistributive planning instruments, may intensify rather than reduce segregation.
5.3. Methodological Contribution of the Urban Territorial Index
From a methodological perspective, the Urban Territorial Index represents a significant contribution to the study of urban inequality in medium-sized cities. By integrating socioeconomic, sociodemographic and housing dimensions through a PCA-informed weighting scheme, the UTI overcomes the limitations of unidimensional indicators and equal-weight composites. The strong external validation against a local Human Development Index proxy (r = 0.87) confirms its robustness and internal coherence.
Importantly, the index is sensitive to intra-urban variation at census-section level, enabling the identification of micro-spatial patterns of vulnerability that would remain invisible at municipal scale. This is particularly relevant for medium-sized cities, where administrative averages tend to mask sharp neighborhood contrasts. The transparency and replicability of the UTI also make it suitable for comparative applications across similar urban contexts in Southern Europe and beyond.
5.4. Implications for Urban Policy and Governance
The findings have direct implications for urban policy in medium-sized cities. First, they highlight the need to move beyond growth-oriented planning strategies and toward integrated approaches that explicitly address socio-spatial inequality. Targeted densification and mixed-income infill in low-UTI neighborhoods could mitigate segregation while making more efficient use of existing infrastructure.
Second, improving functional integration within the functional urban area is crucial. Enhanced public transport, cycling infrastructure and inter-municipal coordination could reduce dependency on private vehicles and improve access to employment and services for residents of peripheral municipalities. Third, housing policy instruments—such as inclusionary zoning, affordable rental housing and vacancy management—are essential to counteract market-driven polarization.
The UTI can serve as a decision-support tool for place-based policies, enabling local governments to prioritize interventions, monitor outcomes and align urban planning with the objectives of social cohesion and spatial justice.
5.5. Contribution
Methodologically, the paper contributes a replicable, PCA-informed composite for medium-sized cities, bridging a gap in indices often tailored to metropolitan scales. Substantively, it shows how university–hospital–transport anchors can reshape intra-urban hierarchies and fragmentation if not accompanied by integration policies [1,6].
6. Conclusions
This paper demonstrates how a multidimensional, PCA-informed Urban Territorial Index (UTI) can diagnose socio-spatial fragmentation and residential segregation in a medium-sized European city. The results for Ciudad Real reveal a core–periphery polarization: central and near-south neighborhoods concentrate higher incomes, education, and land/rent values, while peripheral tracts display higher unemployment and greater migrant shares. The population–housing mismatch—stagnant population alongside accelerated peripheral housing supply—further intensifies spatial sorting and service provision costs.
Methodologically, the UTI integrates socioeconomic, housing, and sociodemographic dimensions into a transparent composite that is externally validated (r = 0.87 with a local HDI). This provides a replicable framework for medium-sized cities where metropolitan indices underperform. Substantively, the findings show that transport and knowledge anchors (AVE, university, hospital) can reconfigure intra-urban hierarchies without necessarily producing functional integration, unless accompanied by proactive planning.
Policy implications are clear. First, targeted densification and mixed-income infill in very low/low-UTI areas should reduce segregation and improve accessibility. Second, transit-oriented integration of satellites (frequent inter-municipal transit, cycling corridors, last-mile connections) can curb peripheralization risks. Third, amenity equalization—co-locating schools, health, childcare, and sport facilities in disadvantaged neighborhoods—should address capability deficits. Fourth, vacancy management/adaptive reuse of under-occupied developments and 15-minute standards can lower car dependency. Finally, land-value capture around hospital/AVE/university axes can finance public realm upgrades and affordable housing.
Limitations include the temporal alignment of indicators (2021–2023), the omission of environmental/mobility variables, and the observational nature of the analysis. Future work should extend the UTI with environmental exposure and transport performance, build multi-year panels for nowcasting rents/values, and employ quasi-experimental designs (e.g., difference-in-differences) to strengthen causal inference.
Overall, the paper contributes a robust, reproducible diagnostic tool tailored to medium-sized cities, and a place-based policy agenda to tackle fragmentation and segregation while advancing sustainable, inclusive urban development.
Top of Form
Funding
Project (2021/24): “Fragmentation and Socio-Spatial Segregation in Medium-Sized Spanish Cities and Their Urban Areas (2001-2021)” within the 2021 Call of the State Programme for Research, Development, and Innovation Oriented Towards Societal Challenges, Ministry of Economy and Competitiveness. National R&D&I Plan. The principal investigator is Carmen Bellet Sanfeliu. Ref. (PID2021124511NB C21-C22). And This work was carried out within the framework of the project “School Citizen Science and Service-Learning for Participatory Urban Regeneration in Medium-Sized Cities: Education, Territory and Sustainability” (2025-GRIN-38407), funded by the University of Castilla-La Mancha (UCLM) and the European Regional Development Fund (ERDF).
Data Availability Statement
These studies are available within Web of Science and Scopus.
Acknowledgments
During the preparation of this manuscript, the authors used artificial intelligence tools to improve the English writing. The authors have reviewed and edited the results and assume full responsibility for the content of this publication.
Conflicts of Interest
The authors declare no conflicts of interest.
References
- Bellet, C. (2020). Transformaciones recientes de las ciudades medias en España. Revista de Geografía Norte Grande, 75, 9–36. [CrossRef]
- Bellet, C., & Olazabal, E. (2019). De la ciudad compacta a la ciudad extensa: Procesos de urbanización recientes en áreas urbanas españolas articuladas por ciudades medias. Anales de Geografía de la Universidad Complutense, 39(1), 149–175. [CrossRef]
- Andrés, G. (2022). La planificación urbanística y el modelo de crecimiento en las ciudades medias españolas: El área urbana de Burgos (1981–2021). Ciudad y Territorio. Estudios Territoriales, 54(212), 899–920.
- Rodríguez-Domenech, M. Á. (2022). Dinámicas y transformaciones urbanas recientes en Ciudad Real: De los PGOU al urbanismo de los proyectos estratégicos. En C. Bellet & F. Cebrián (Eds.), Ciudades medias en España: Urbanización y políticas urbanísticas (1979–2019) (pp. 293–325). Edicions de la Universitat de Lleida.
- Gerundo, R., Marra, A., & De Salvatore, V. (2020). Construction of a composite vulnerability index to map peripheralization risk in urban and metropolitan areas. Sustainability, 12(11), 4641. [CrossRef]
- Cebrián-Abellán, F., Andrés-López, G., & Bellet-Sanfeliu, C. (2023). The use of GIS and multicriteria techniques for the socio-spatial analysis of urban areas in medium-sized Spanish cities. Land, 12(6), 1115. [CrossRef]
- Instituto Nacional de Estadística. (2021). Censo de población y viviendas 2021. https://www.ine.es.
- Dirección General del Catastro. (2023). Valores catastrales de referencia. https://www.sedecatastro.gob.es.
- Ministerio de Transportes, Movilidad y Agenda Urbana. (2022). Índice de precios del alquiler de vivienda. https://www.mitma.gob.es.
- Schumann, L. R. M. A., & Moura, L. B. A. (2015). Vulnerability synthetic indices: A literature integrative review. Ciência & Saúde Coletiva, 20(7), 2105–2120.
- Rashed, T., & Weeks, J. (2003). Assessing vulnerability to earthquake hazards through spatial multicriteria analysis of urban areas. International Journal of Geographical Information Science, 17(6), 547–576. [CrossRef]
- Pillet, F., Cañizares, M. C., Ruiz, A. R., Martínez, H. S., Plaza, J., & Santos, J. F. (2011). Mobility patterns, commuting and functional urban areas characterization in low-density regions: Castilla-La Mancha (Spain). ERSA Conference Papers.
- Carmichael, H., Moore, A., Steward, L. T., & Velopulos, C. (2020). Disparities in emergent versus elective surgery: Comparing measures of neighborhood social vulnerability. Journal of Surgical Research, 256, 397–403. [CrossRef]
- QGIS Development Team. (2023). QGIS Geographic Information System. Open Source Geospatial Foundation. https://qgis.org.
- Jolliffe, I. T., & Cadima, J. (2016). Principal component analysis: A review and recent developments. Philosophical Transactions of the Royal Society A, 374(2065), 20150202. [CrossRef]
- Rodríguez-Domenech, M. Á., & Cañizares, M. (2023). Urban planning and sustainability in the cities of Castilla-La Mancha (Spain): Current challenges. Land, 12(8), 1540. [CrossRef]
- Sánchez, R., & Cebrián, F. (2022). Delimitación territorial en áreas urbanas medias. Geografía y Sociedad, 14, 119–144.
- Brezzi, M., & Veneri, P. (2015). Assessing polycentric urban systems in the OECD: Country, regional and metropolitan perspectives. European Planning Studies, 23(6), 1128–1145. [CrossRef]
- Escolano-Utrilla, S., López-Escolano, C., & Pueyo-Campos, Á. (2018). Urbanismo neoliberal y fragmentación urbana: El caso de Zaragoza. EURE, 44(132), 185–212. [CrossRef]
- Gehl, J. (2010). Cities for people. Island Press.
- Knox, P. L., & Mayer, H. (2013). Small town sustainability: Economic, social, and environmental innovation. Birkhäuser.
- Rodríguez-Domenech, M. Á., & Cañizares, M. (2022). Medium-sized cities facing the demographic challenge in Spain: The case of Castilla-La Mancha. Urban Sciences, 6(2), 34. [CrossRef]
- Cebrián-Abellán, F., Andrés-López, G., & Bellet-Sanfeliu, C. (2025). Significant correlations in residential segregation patterns: Medium-sized cities in Spain (2001–2021). Ciudad y Territorio. Estudios Territoriales, 57(2), e36868.
- UN-Habitat. (2022). World cities report 2022: Envisioning the future of cities. United Nations Human Settlements Programme.
- Marcuse, P. (2005). Enclaves yes, ghettos no: Segregation and the state. Urban Studies, 42(1), 15–29. [CrossRef]
- Musterd, S., & Ostendorf, W. (1998). Urban segregation and the welfare state. Routledge.
- Tammaru, T., Marcinczak, S., van Ham, M., & Musterd, S. (Eds.). (2016). Socio-economic segregation in European capital cities. Routledge. [CrossRef]
- Soja, E. W. (2010). Seeking spatial justice. University of Minnesota Press.
- Brenner, N. (2014). Implosions/explosions: Towards a study of planetary urbanization. Jovis.
- Keil, R. (2018). Suburban planet: Making the world urban from the outside in. Polity Press.
- Kühn, M. (2015). Peripheralization: Theoretical concepts explaining socio-spatial inequalities. European Planning Studies, 23(2), 367–378. [CrossRef]
- Lang, T. (2012). Shrinkage, metropolization and peripheralization in Europe. European Planning Studies, 20(10), 1747–1754. [CrossRef]
- OECD. (2019). Urban policy reviews: Spain. OECD Publishing.
- UN-Habitat. (2022). SDG 11 synthesis report: A better urban future. United Nations.
- Harvey, D. (2008). The right to the city. New Left Review, 53, 23–40.
- Massey, D. (1994). Space, place and gender. Polity Press.
- Castells, M. (1996). The rise of the network society. Blackwell.
- Jacobs, J. (1961). The death and life of great American cities. Random House.
Figure 2.
Evolution of Housing Construction in Ciudad Real (1900–2022).
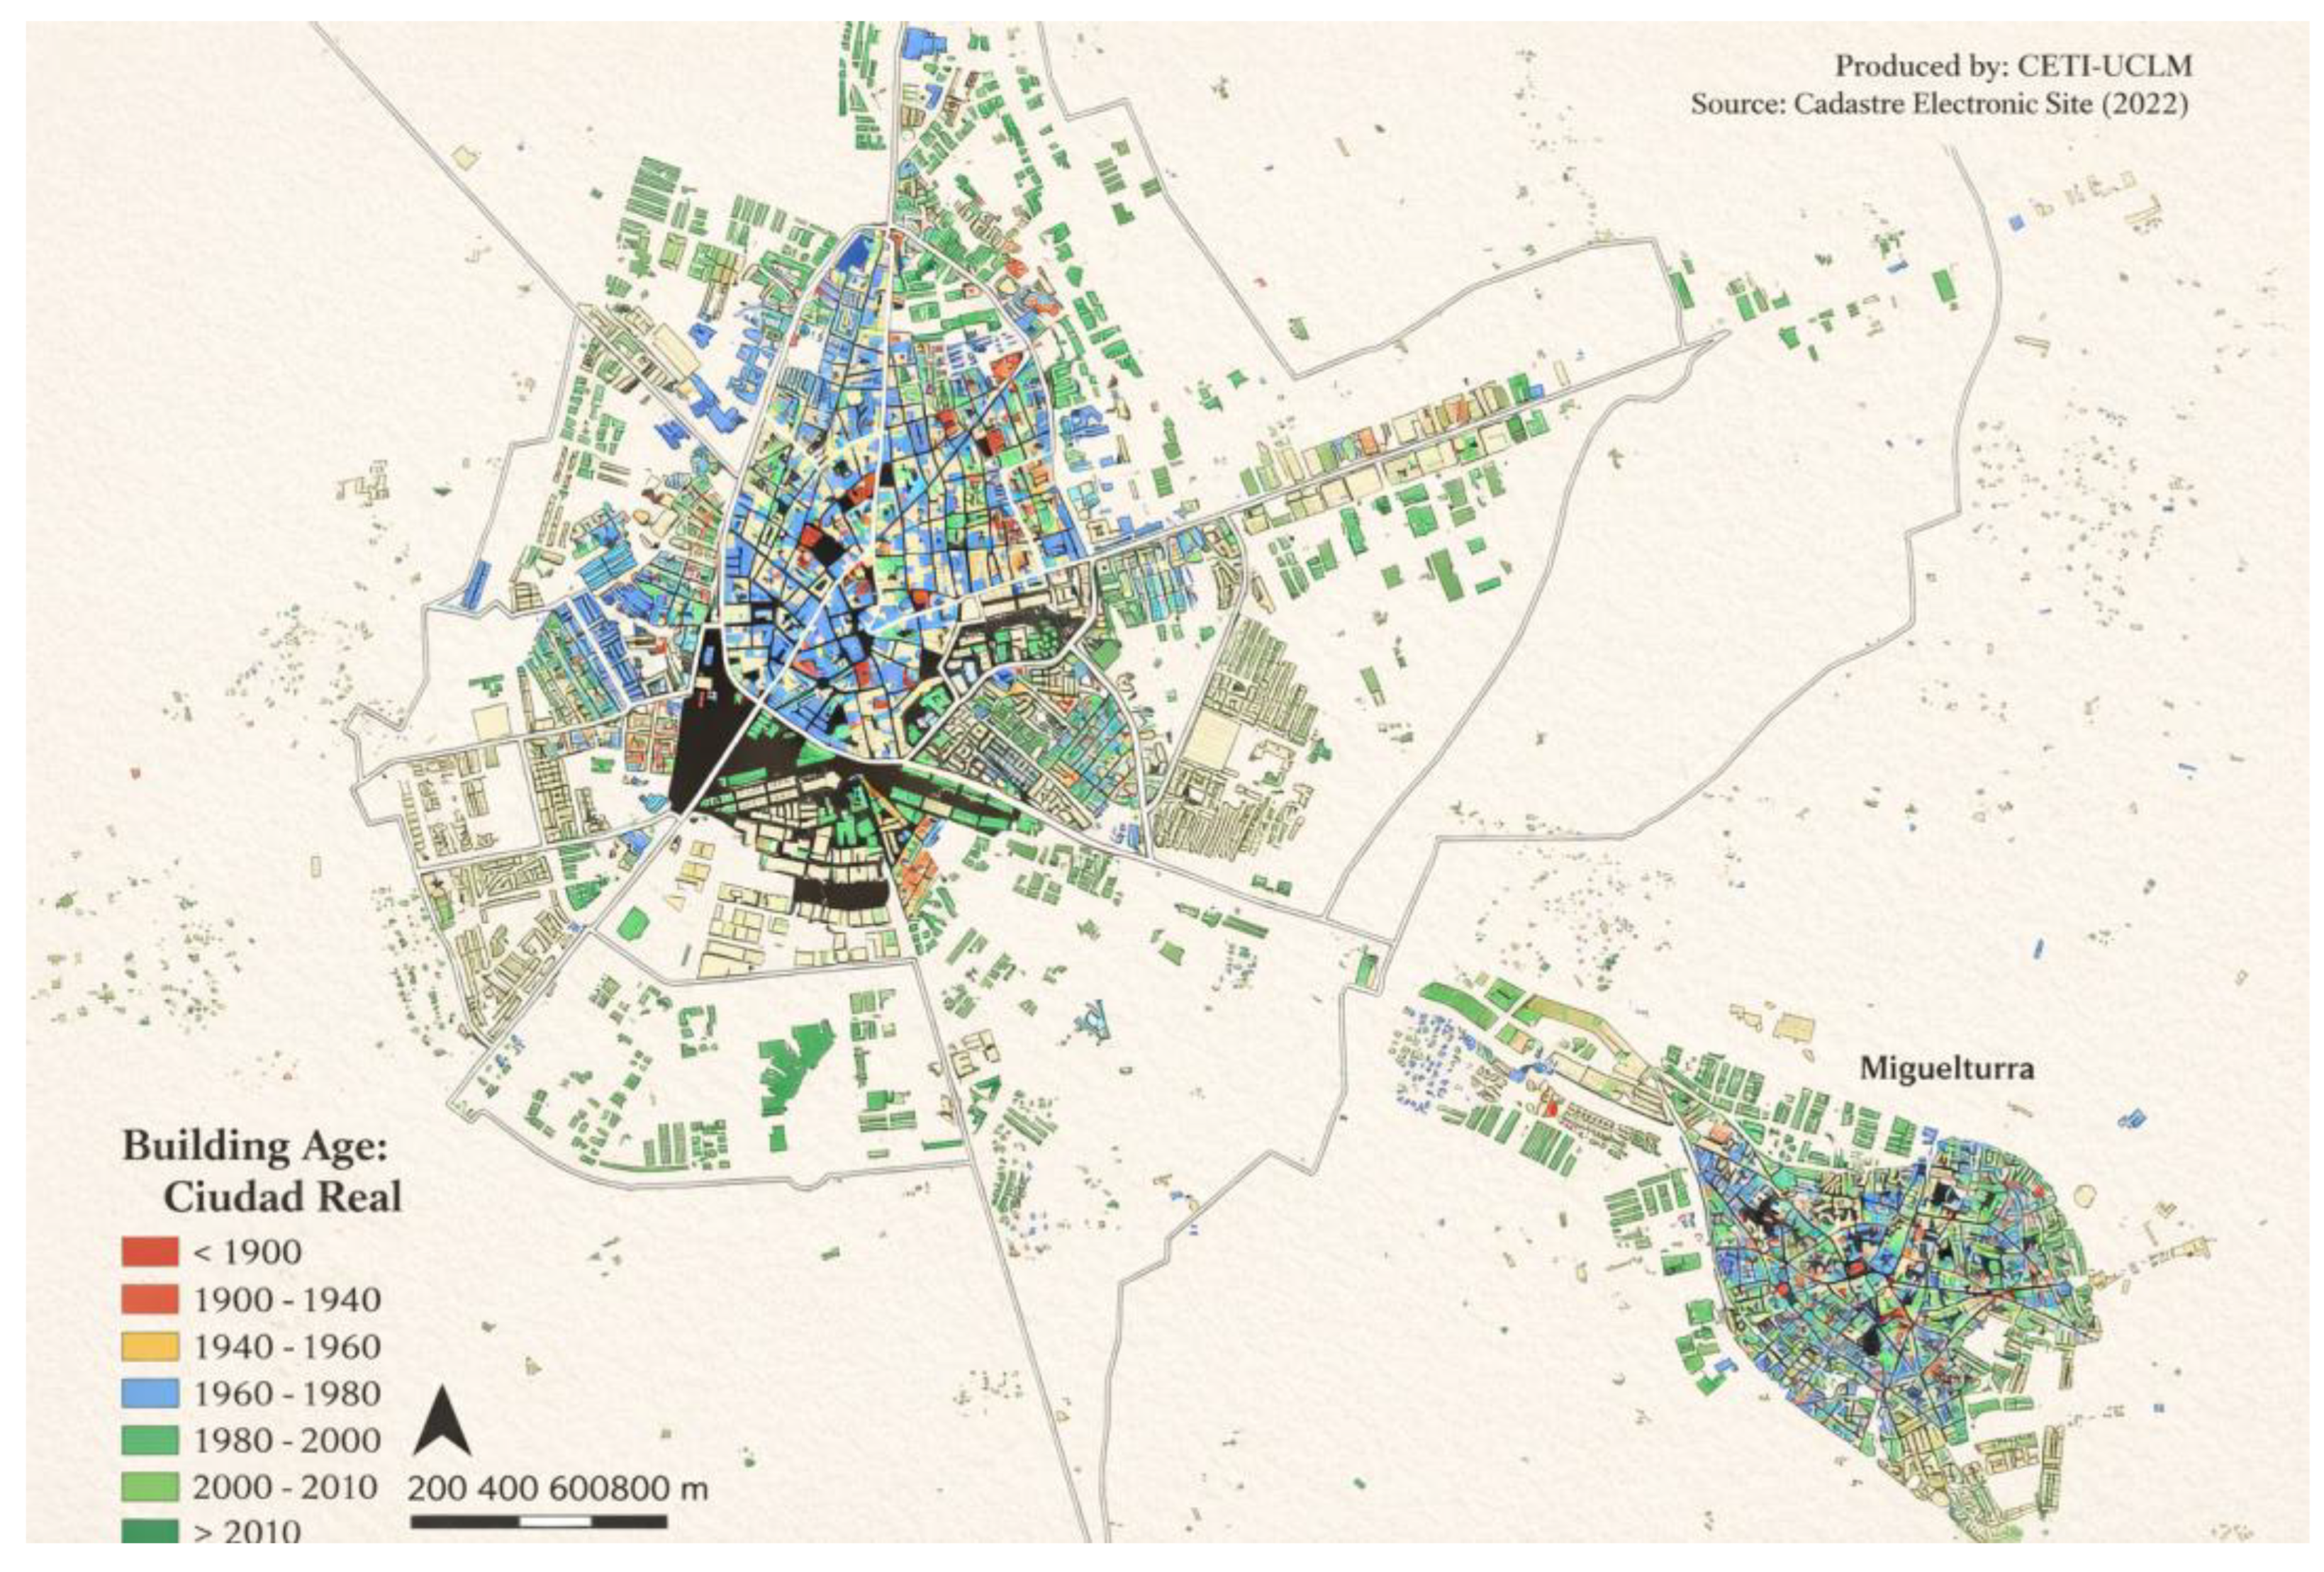
Table 1.
Construction of the Urban Territorial Index (UTI).
| Steps | Methods |
| Step 1: Natural Breaks |
Natural Breaks (Jenks) classification into 4 classes per variable in QGIS 3.28 (20). |
| Step 2: Dimensional scores (0-8): |
S_sd=Education+Foreign-born S_se=Income+Unemployment_inv S_h=Cadastral+Rental |
| Step 3: Weighted UTI |
UTI=0.40⋅S_se+0.30⋅S_h+0.30⋅S_sd (Weights from PCA: PC1 eigenvalue=6.2 explains 62%; socioeconomic dominates (22). Range: 0-8.) |
| Step 4: Final UTI classified |
Very Low (0-2), Low (2.1-4), Medium (4.1-6), High (6.1-8). |
Source: Own elaboration.
Table 2.
Weight Matrix of Ciudad Real and Its Urban Area.
| Municipalities of Its Urban Area | Weight Matrix | Indicative attributes |
| Ciudad Real | 23 | Highest cadastral values (€422–€1,291/m²) and income (€11,618–€27,813); high tertiary education |
| Miguelturra | 17-22 | Moderate rents (€351–€410); unemployment 10.3–27.7%; mid income (€11,618–€15,416) |
| Poblete | 14-16 | Low rents (€291–€351); unemployment 10.3–27.7%; low–mid income |
| Carrión de Calatrava | 9-13 | Low foreign-born (1.9–5.9%); unemployment 10.3–27.7% |
| Torralba de Calatrava | 9-13 | Similar to Carrión; moderate economic constraints |
| Ballesteros Calatrava | 9-13 | Low income; high unemployment; stock growth outpaces population |
| Pozuelo de Calatrava | 8 | Low rents (€291–€351); unemployment 10.3–27.7%; accessibility with labor-market constraints |
Source: Own elaboration.
Disclaimer/Publisher’s Note: The statements, opinions and data contained in all publications are solely those of the individual author(s) and contributor(s) and not of MDPI and/or the editor(s). MDPI and/or the editor(s) disclaim responsibility for any injury to people or property resulting from any ideas, methods, instructions or products referred to in the content. |
© 2025 by the authors. Licensee MDPI, Basel, Switzerland. This article is an open access article distributed under the terms and conditions of the Creative Commons Attribution (CC BY) license (http://creativecommons.org/licenses/by/4.0/).
Copyright: This open access article is published under a Creative Commons CC BY 4.0 license, which permit the free download, distribution, and reuse, provided that the author and preprint are cited in any reuse.


