Submitted:
16 December 2025
Posted:
18 December 2025
You are already at the latest version
Abstract
Background: Oxidative stress contributes to the development and progression of epilepsy and is connected with neuroinflammation during epileptic seizures. Cholinesterase has a modulatory role, and oxytocin has antiepileptic properties. The purpose of this study was to assess selective inflammatory (CRP) and oxidative stress markers (PON1, CUPRAC, FRAP), cholinesterase, and oxytocin in serum and CSF samples of dogs with different types of epilepsy. Methods: There were four groups of dogs; A: healthy controls; B: idiopathic epilepsy receiving antiepileptic medication; C: idiopathic epilepsy without antiepileptic medication; and D: structural epilepsy. CRP, PON1, CUPRAC, and cholinesterase were evaluated in serum and PON1, CUPRAC, FRAP, cholinesterase and oxytocin were evaluated in CSF samples. Group differences were evaluated using ANOVA or Kruskal–Wallis tests, followed by post-hoc analyses. Results: Fifty-one serum and 26 CSF samples were analyzed. CSF PON1 was significantly different in group D compared to groups A and C (p=0.044 and p=0.008, respectively). CSF cholinesterase was significantly different in group D compared to groups A, B and C (p=0.003, p=0.025, p=0.033, respectively). Conclusions: Structural epilepsy may influence PON1, CUPRAC and cholinesterase levels in CSF samples. Compared to CSF, serum was not the most suitable biological material to investigate oxidative stress and inflammatory markers.
Keywords:
cerebrospinal fluid
; C-reactive protein
; cholinesterase
; dogs
; epilepsy
; oxidative stress markers
; oxytocin
; serum
1. Introduction
Epilepsy is a brain disease clinically manifested by epileptic seizures in both humans and animals [1,2]. The International League against Epilepsy (ILAE) has introduced a system to classify epileptic seizures according to their etiology in metabolic epileptic seizures, structural epilepsy, idiopathic epilepsy and genetic epilepsy [3]. Idiopathic epilepsy is most commonly diagnosed in young purebred or mixed-breed dogs and can be compared to human temporal lobe epilepsy or human idiopathic generalized epilepsy [4,5,6,7,8]. Structural epilepsy is mainly diagnosed in adult and aged dogs; in these aged groups, the inflammatory encephalopathies are being diagnosed most frequently in small-breed and extra-axial neoplasia in large-breed dogs [9,10]. Diagnosis of the different types of epilepsy is based on advanced diagnostic imaging and/ or cerebrospinal fluid (CSF) analysis [11]. The application of magnetic resonance imaging (MRI) in veterinary medicine has revealed many brain structural and functional abnormalities, however it cannot identify and explain the molecular basis of the spontaneous abnormal electrical discharge of neurons, which causes the epileptic seizures in idiopathic epilepsy [9,10,12,13,14,15,16]. Electroencephalography (EEG), a routine diagnostic test in human epileptic patients, can identify the locus of the abnormal electrical discharge in the specific lobe of the brain; however, its use is limited in veterinary medicine [17].
Regarding epileptogenesis, while significant progress has been recorded in recent years, many aspects of the underlying mechanisms remain unclear [18,19]. Oxidative stress occurs when there is an imbalance between the reactive oxygen species (ROS) or reactive nitrogen species (RNS) and the brain’s antioxidant defenses [20,21]. In the brain, which has high oxygen consumption and relatively low antioxidant capacity, oxidative stress is especially damaging. Therefore, oxidative stress has a significant role in the development and progression of epilepsy, particularly in the process of epileptogenesis and seizure-induced brain damage [22]. Oxidative stress has been assessed with specific biomarkers in many studies in blood or brain tissue from epileptic patients or from animal models exhibiting status epilepticus [22,23,24,25,26,27,28]. However, the bibliography is limited regarding the assessment of oxidative stress markers in the cerebrospinal fluid (CSF) which could be the ideal material to study through its direct contact with the brain [29]. Oxidative stress is strongly connected with neuroinflammation during epileptic seizures and epilepsy. They form a vicious cycle, where each process amplifies the other and contributes to neuronal damage, epileptogenesis and seizure recurrence [22,30,31]. Many studies have evaluated inflammatory markers and particularly C-reactive protein (CRP) in blood and CSF samples of humans and animals with neurological disorders including epilepsy [32,33,34,35,36,37,38,39,40,41,42,43,44,45,46]. Blood CRP is found elevated in epileptic patients compared to controls and antiepileptic medication can reduce CSF and blood CRP levels [24,32,33,35,36,38,40,41,42,43]. Elevated CRP levels are found in CSF of dogs affected with distemper and in serum samples of dogs with status epilepticus due to idiopathic epilepsy [44,45,46].
Cholinesterase does not play a primary active role in epilepsy; it can have an indirect/ modulatory role through its impact on acetylcholine (AChE) levels, which affect neuronal excitability. Therefore, if cholinesterase activity is inhibited, AChE accumulates, leading to neuronal overexcitation, triggering epileptic seizures or status epilepticus [47,48]. The bibliography is limited regarding the assessment of cholinesterase in human epileptic patients, probably because of its indirect association with epilepsy. There is a paper indicating elevated cholinesterase activity in epileptic patients and decreased cholinesterase levels in the blood and CSF of epileptic patients after surgical treatment [47].
Oxytocin has been evaluated for its antiepileptic properties mostly in experimental studies of epileptic patients, as well as in patients with other mental co-morbidities [49,50,51,52,53]. In veterinary medicine, research regarding oxytocin has been performed in mice and no published data in dogs has been identified [51,53]. Canine epilepsy shares many clinical and pathophysiological similarities with human epilepsy, therefore canine model should be considered ideal to study the therapeutic potential of oxytocin in canine epileptic patients.
The current study aimed to assess oxidative stress and inflammatory markers in serum and cerebrospinal fluid (CSF) samples of dogs naturally affected by idiopathic epilepsy. In addition, oxytocin was measured and a new assay for its quantification in CSF was validated.
2. Materials and Methods
2.1. Ethical Approval
This was a prospective, cross-sectional study involving canine patients admitted to the Companion Animal Clinic from March 2018 until November 2018. Dogs were divided into four groups. All dogs were treated according to European legislation on animal handling and experiments (86/609/EU). The study was approved by the Ethical Committee of the School of Veterinary Medicine, Aristotle University of Thessaloniki, Greece (Prot. No. 567/13/03/2018). The owners of the epileptic dogs were briefed about the proposed diagnostic plan (clinicopathological and diagnostic imaging testing) and signed a statement of informed consent for participation in the study.
2.2. Study Population
Group A consisted of healthy dogs (control group) with no history of seizures or any other disease. The dogs were recruited from the stray animal spraying/neutering program, run at the School of Veterinary Medicine in cooperation with the local municipality, following a written agreement. Blood sampling and brain imaging were performed at the time before spraying/ neutering surgery.
The other three groups (groups B, C, and D) consisted of dogs that were admitted with a history of recurrent epileptic seizures or as emergency cases due to status epilepticus. The dogs were allocated into the three groups after a detailed diagnostic investigation was completed. When the diagnostic investigation did not reveal any structural abnormality, the age of the dog was compatible (> 6 months and < 5 years old) with seizure onset and a history of recurrent epileptic seizures; diagnosis of idiopathic epilepsy was strongly suggestive [54]. Group B included dogs with idiopathic epilepsy receiving antiepileptic medication, and group C included dogs with idiopathic epilepsy without antiepileptic medication on admission. Group D consisted of dogs with structural epilepsy. The age of seizure onset ranged from 6 months to 5 years in group B and in group C dogs. There was no limitation on age for group D dogs. Prior administration of antiepileptic medication (AEM) was not an exclusion criterion for the study population. The antiepileptic medication and the duration of therapy were recorded. Some dogs that belong in group D underwent AEM on admission as well. Not only the onset of AEM but also the duration of therapy was important and thus it was set as an exclusion criterion. Therefore, dogs that were on AEM on admission were included in the study if the AEM was used in appropriate dose regimen and for a prolonged period to ensure adequate therapeutic serum concentrations. For AEM used in the study population [phenobarbital (PB), levetiracetam (LEV), bromide (Br)], the treatment duration should have been at least 1 month (for PB and LEV), except for bromide which should have been at least 3 months [55,56]. Serum drug concentrations were monitored in group B and D dogs in order to assess therapeutic efficacy. Drug measurements were performed in an external collaborating laboratory (IDEXX Laboratories, Kornwestheim, Germany).
Epidemiological data, age of seizure onset, frequency, and type of seizures were also recorded. For dogs receiving AEM, the response to therapy, the frequency, and the type of seizures were included in the database. Dogs that weighed less than 2 kg and dogs with reactive seizures (seizures that are caused by systemic metabolic or exogenous toxic disorder detected either during history taking or during clinicopathological testing), acute/history of head trauma, and congenital diseases (hydrocephalus), and any other concurrent disease (identified during diagnostic work-up) were excluded from the study. A detailed history (age of seizure onset, frequency, type, and duration of seizures, onset of antiepileptic medication, previous laboratory investigation, previous brain diagnostic imaging) was taken, combined with visual proof of the episode using video footage brought by the owner of the epileptic dog to distinguish epileptic seizure from other paroxysmal disorders that can mimic epileptic seizure.
Clinicopathological evaluation included complete blood counts (CBC), serum biochemistry profile, and urinalysis. Complete blood counts and serum biochemistry were performed using ADVIA 120 Hematology System (Bayer Diagnostics, Dublin, Ireland) and Vital Lab Flexor E (Spankeren, Netherlands), respectively.
Diagnostic imaging investigation included thoracic radiographs and abdominal ultrasound. Dogs with any concurrent systemic disease revealed during diagnostic investigation were excluded from the study. Brain diagnostic imaging involved computed tomography (CT) (Optima 16 slices, GEHEALTHCARE, Germany) or/and magnetic resonance imaging (MRI) (SignaHDe 1,5T, GE-e, Canada) under general anesthesia, propofol induced, and isoflurane maintained.
2.3. Sampling
2.3.1. Blood Sampling
Blood samples were collected from either the cephalic or the jugular vein and stored in serum separator tubes (Eurotubo, Deltalab, 0819, Rubi, Spain) before separation. After centrifugating (3000 x 8 min), serum samples (1ml for each dog) were separated in aliquots and stored in Eppendorf vials (Hamburg, Germany), frozen at -80oC for forthcoming analysis. Frozen samples were shipped for analysis as a single batch using special courier services and transport in containers with card ice.
2.3.2. Cerebrospinal Fluid (CSF)
Cerebrospinal fluid (CSF) samples were collected via cisternal tap under general anesthesia and after confirmation from computed tomography (CT) or/and MRI brain imaging for the safety of the procedure. The collected amount of CSF was 1mL/5 kg of body weight. CSF samples with iatrogenic blood contamination were excluded from the study. CSF analysis was performed within 30 min after collection and included total cell counts, measurements of total protein, and cytological examination. The cytological examination of CSF was performed in stained slides obtained using a cytocentrifuge (Aerospray Pro slide stainer/ cytocentrifuge ELI Tech Droup WESCOR) and the cell counts were performed microscopically using a haemocytometer (BLAUBRAND Neubauer improved). CSF total proteins were measured in an automated biochemistry analyzer (FLEXOR Vitalab, The Netherlands) using the pyrogallol red method (Dia Sys Diagnostic Systems, France). The remaining CSF samples were centrifuged to remove cells and the supernatants were frozen at -80o C for forthcoming analysis. Frozen samples were shipped for analysis as a single batch using special courier services and transport in containers with dry ice.
2.4. Sample Analysis
2.4.1. Serum Sample Analysis
Paraoxonase 1 (PON1), cupric reducing antioxidant capacity (CUPRAC), cholinesterase and C-reactive protein (CRP) were assessed in serum samples in all 4 groups of dogs.
2.4.2. CSF Sample Analysis
Paraoxonase 1 (PON1), CUPRAC, ferric reducing antioxidant power (FRAP), cholinesterase, and oxytocin were assessed in CSF samples. The limited volume of CSF collection was not sufficient for all five markers measurement therefore, some data are missing.
2.4.3. Methods
Serum and CSF Paraoxonase 1 (PON1) activity assays were assessed based on the hydrolytic activity of the enzyme in 4-nitrophenyl acetate substrate as previously described [57].
CUPRAC is a laboratory method that evaluates the reduction in cupric ions (Cu+2) to cuprous ions (Cu+) by antioxidant agents in the serum and CSF samples using a validated automated assay [58].
FRAP assay in CSF assessed the reduction of ferric-tripyridyltriazine (Fe3+-TPTZ) to the ferrous (Fe2+) following previously described methods [59,60].
The activity of cholinesterase was measured in serum and CSF samples using butyrylthiocholine as previously described [61].
CRP was measured with an immunoturbidimetric assay previously validated in dogs [62].
All the previous assays showed inter and intra-assay imprecision values lower than 15 and linearity after serial sample dilution.
For oxytocin measurement, a direct competition assay based on AlphaLISA (PerkinElmer, MA, USA) technology in which acceptor beads coated to a monoclonal anti-oxytocin antibody were used. The monoclonal antibody used for assay development is previously described in a previous report about oxytocin measurement in pigs [63].
For analytical validation of the assay, imprecision was calculated as inter- and intra-assay variations and expressed as coefficients of variation(CVs). Five replicates of two samples with different concentrations (2443.68 and 485.31pg/ mL) were analyzed at the same time to determine the intra-assay precision of the method. Five aliquots of each sample were stored in plastic vials at -80oC. These aliquots were measured in duplicate five times over five different days using freshly prepared calibration curves for inter-assay precision.
The accuracy was evaluated by an assessment of linearity under dilution and recovery experiments. For the linearity evaluation, two samples (2443.68 and 485.31pg/ mL) were serially diluted from 1:2 to 1:256) with AlphaLISA universal buffer.
The detection limit (LD) and lower limit of quantification (LLQ) were obtained to evaluate the sensitivity of the method. The LD was calculated as the mean of 10 replicate measurements of the assay buffer plus three standard deviations. For the LLQ, a serial dilution (from 1:2 to 1:256) of the cerebrospinal fluid sample (384.66 pg/ mL) was performed, analyzing 5 replicates of each dilution in the same run. The CV was calculated for each dilution, establishing the LLQ as the lowest dilution that could be measured with <20% imprecision.
2.5. Statistical Analysis
2.5.1. Serum Samples
Descriptive statistics were produced using SPSS 19.0. ANOVA test was used to determine whether there was a significant difference of PON1, CUPRAC, cholinesterase and CRP among the 4 groups of dogs in serum samples. Post-Hoc comparisons were performed in parameters among the four groups. Kruskal-Wallis test was also performed to assess significance among medians of the parameters (PON1, CUPRAC, cholinesterase and CRP) of the four groups. Dunn’s test which followed the Kruskal-Wallis test was also used to assess the significance of the parameters (PON1, CUPRAC, cholinesterase and CRP) among the four groups.
2.5.2. CSF Samples
Descriptive statistics were produced using SPSS 19.0. ANOVA test was used to determine whether there was a significant difference of PON1, CUPRAC, cholinesterase FRAP and oxytocin among the 4 groups of dogs in CSF samples. Post-Hoc comparisons were performed in parameters between the groups. Kruskal-Wallis test was also performed to assess significance among medians of the parameters (PON1, CUPRAC, cholinesterase, FRAP and oxytocin) of the four groups. Dunn’s test which followed the Kruskal-Wallis test was also used to assess the significance of the parameters (PON1, CUPRAC, cholinesterase, FRAP and oxytocin) among the four groups.
3. Results
3.1. Serum Samples
In total, 51 serum samples were analyzed for oxidative stress and inflammatory markers. Forty-three serum samples were collected from epileptic dogs; 15 serum samples from group B, 11 serum samples from group C, and 17 samples from group D dogs. The remaining 8 serum samples were collected from healthy controls (group A).
3.1.1. Serum Oxidative Stress Markers
Paraoxonase 1 (PON1) and cupric reducing antioxidant capacity (CUPRAC) were assessed in serum samples of the four groups of dogs as markers of oxidative stress. Table 1 included the mean, minimum and maximum values of PON 1 and CUPRAC in the four groups. Boxplots depict the activity of PON1 and the concentration of CUPRAC in the four groups (Figure 1). ANOVA test did not reveal any significance of PON1 and CUPRAC among the four groups of dogs (p=0.719 and p=0.602, respectively). Post Hoc comparisons performed between the groups did not reveal any significance either for PON1 or for CUPRAC (Table 2). Kruskal-Wallis and Dunn’s Post Hoc comparisons did not reveal any significance (Table 3 and Table 4, respectively).
3.1.2. Cholinesterase
Cholinesterase was assessed in serum samples of the four groups of dogs. Table 1 included the descriptive statistics of cholinesterase. Boxplots illustrated the concentration of cholinesterase in the four groups of dogs (Figure 2). ANOVA test did not reveal any significance of cholinesterase among the four groups of dogs (p=0.321). Post-Hoc comparisons between the groups did not reveal any significance for cholinesterase (Table 2). Kruskal-Wallis and Dunn’s Post-Hoc comparisons did not reveal any significance (, ).
3.1.3. C-Reactive Protein (CRP)
C-reactive protein (CRP) was assessed in serum samples of the four groups of dogs. Table 1 includes the descriptive statistics of CRP. Boxplots illustrated the concentration of CRP in the four groups of dogs (Figure 3).ANOVA test did not reveal any significance of CRP among the four groups of dogs (p=0.558). Post-Hoc comparisons between the groups did not reveal any significance for CRP (Table 2). Kruskal-Wallis and Dunn’s Post-Hoc comparisons did not reveal any significance (, ).
3.2. Cerebrospinal Fluid (CSF) Samples
In total, 26 cerebrospinal fluid (CSF) samples were analyzed for oxidative stress and inflammatory markers. There was inadequate CSF sample volume for all measurement assessments in some cases. Therefore, in the control group of dogs (group A) PON1, FRAP, cholinesterase, CUPRAC and oxytocin were assessed in 5 samples. In idiopathic epilepsy dogs undergoing antiepileptic medication (group B) PON1 and cholinesterase were assessed in 4 samples, and FRAP, CUPRAC and oxytocin in 6 samples. In idiopathic epilepsy dogs that did not receive any antiepileptic medication (group C), PON 1 was assessed in 5 samples, FRAP and cholinesterase in 6 samples, CUPRAC and oxytocin in 7 samples. In structural epilepsy cases (group D) PON1 and cholinesterase was assessed in 7 samples, FRAP, CUPRAC and oxytocin in 8 samples (Table 5).
3.2.1. CSF Oxidative Stress Markers
CSF oxidative stress markers’ (PON1, FRAP and CUPRAC) mean, minimum and maximum values were included in Table 5. Boxplots depict PON1 activity, FRAP and CUPRAC concentrations in the four groups (Figure 4). ANOVA test did not reveal any significance of PON1, FRAP or CUPRAC among the four groups of dogs (p= 0.275, p=0.469 and p=0.095, respectively). Post Hoc comparisons performed between the groups did not reveal any significance for any of the three oxidative stress parameters (PON1, FRAP, CUPRAC) (Table 6). Kruskal Wallis test revealed a significant difference of PON1 between groups (p=0.037) (Table 7) and Dunn’s test for PON1 that followed indicated significant differences between groups A and D and between groups C and D (p=0.044 and p=0.008, respectively) (Table 8). Neither Kruskal-Wallis test nor Dunn’s test for FRAP revealed any significance among the four groups (Table 7 and Table 8, respectively). Kruskal-Wallis test for CUPRAC was close to significance (p= 0.066) and Dunn’s test indicated a strong significance when group A was compared with group D (p=0.010) (Table 7 and Table 8, respectively).
3.2.2. Cholinesterase
Cholinesterase was assessed in CSF samples of the four groups of dogs. Table 5 included the descriptive statistics of cholinesterase. Boxplots illustrated the concentration of cholinesterase in the four groups of dogs (Figure 5).ANOVA test did not reveal any significance of cholinesterase among the four groups of dogs (p=0.146). Post-Hoc comparisons between the groups did not reveal any significance for cholinesterase (Table 6). Kruskal-Wallis revealed significance of cholinesterase among groups (p=0.013) and Dunn’s Post-Hoc comparisons revealed significance between groups A and D, groups B and D and between groups C and D(p=0.003, p=0.025, p=0.033, respectively) (Table 7 and Table 8, respectively).
3.2.3. Oxytocin
In the analytical validation, the method for measurement of oxytocin showed intra-assay CVs of 1.41-2.31% and inter-assay CVs of 3.19-4.60%. Dilution of CSF samples resulted in linear regression equations with a correlation coefficient of 0.99. The assay LD and LLQ were 2.14 and 39.27 pg/mL, respectively.
Oxytocin was assessed in 26 CSF samples. Table 5 included the descriptive statistics of oxytocin. Boxplot depicted the concentration of oxytocin in the four groups (Figure 6). ANOVA test did not reveal any significance of oxytocin among the four groups of dogs (p=0.117).Post-Hoc comparisons between the groups did not reveal any significance for oxytocin (Table 6). Kruskal-Wallis revealed the significance of oxytocin among groups (p=0.046) and Dunn’s Post-Hoc comparisons revealed significance between groups B and D and between groups C and D (Table 7 and Table 8, respectively).
4. Discussion
Epilepsy is a complex disease entity that involves inflammatory and oxidative stress processes in addition to abnormal electrical activity [31]. In the current study, inflammatory markers (CRP), oxidative stress markers (PON1, CUPRAC, FRAP), cholinesterase and oxytocin were assessed in serum and CSF samples of epileptic dogs with different types of epilepsy.
Serum CRP can be temporarily increased in patients exhibiting generalized tonic-clonic seizures, status epilepticus, or prolonged seizures. This increase is modest unless there is another underlying condition [33,38]. Most patients with epilepsy have normal CRP, especially between seizures [38]. In the current study, CRP was assessed in serum samples of epileptic dogs. Median values were 5.55 μg/ml for group A (control group), 4.1 μg/ml for group B, 3.4μg/ml for group C, and 3.8 μg/ml for group D. None of the median values exceeded the reference range for CRP in serum samples (< 10 μg/ml). All comparisons among the four groups did not reveal any significant differences. Multiple human studies have indicated increased serum CRP values in epileptic patients compared to controls [41,42]. In particular, despite the increased serum CRP concentration in refractory epilepsy cases, CRP values were decreased when patients received antiepileptic medication, but still remained increased compared to controls [33,35,37]. Levetiracetam antiepileptic treatment decreased serum CRP concentration compared to other antiepileptics [40,43]. In an experimental rat model assessing CRP at different time points after electrically induced-status epilepticus, there were no concentration changes identified [34]. In contrast to this study, other studies involving epileptic dogs indicated increased serum CRP levels in dogs diagnosed with structural epilepsy compared to idiopathic epilepsy dogs and in dogs exhibiting status epilepticus [44,45]. In the current study, there was no significant difference in CRP levels among the three groups of epileptic dogs compared to controls. The time elapsing from the last seizure till serum sampling and the different antiepileptic medications administered (group B and group D dogs) could have influence results. In particular, concerning the time interval between the last seizure and serum sampling, it was not standardized for the study population; therefore, sampling was performed regardless of the time the last epileptic seizure occurred. Furthermore, no inflammatory encephalopathy cases were included in the structural epilepsy group D). In a previously published study, including dogs diagnosed with distemper encephalitis, serum CRP levels were elevated compared to controls [46]. The results of the current study supported evidence from human patients; CRP had been within reference ranges in epileptic patients suffering from tonic-clonic epileptic seizures [38]. Results from the current study indicated that CRP was not a reliable inflammatory marker for either idiopathic or structural epilepsy in dogs.
Oxidative stress has been associated with epilepsy in both human and canine patients [24,25,27,46]. Although there are multiple studies assessing oxidative stress in human neurological diseases, including epilepsy, the bibliography is limited in canine epilepsy [26,28,64,65]. In the current study, selective oxidative stress markers had been evaluated in both serum (PON1 and CUPRAC) and CSF (PON1, CUPRAC, FRAP) samples of three groups of dogs diagnosed with different types of epilepsy and a control group (group A). Paraoxonase 1 (PON1) has an important anti-inflammatory and antioxidant role; it protects lipids and lipoproteins from oxidative damage by preventing lipid peroxidation in cell membranes and lipoproteins [66,67]. In general, PON1 concentration was decreased in oxidative stress [66,67]. Overall assessment of median values of PON1of the current study indicated that serum concentrations were much lower compared to CSF concentrations. To the author’s knowledge, there is no available literature indicating the reference range of PON1 in serum or CSF in dogs with epilepsy. In the study of Radamovik et al (2023), where antioxidant markers, including PON1, in dogs with idiopathic epilepsy were assessed, it was concluded that serum PON1 was lower compared to healthy controls, but no reference ranges were provided. Contrary to the results of comparisons of the serum PON1 values among the four study groups, there was a statistically significant difference in CSF PON1 when healthy controls (group A) and dogs with idiopathic epilepsy that did not receive antiepileptic medication (group C) were compared with structural epilepsy (group D). A possible explanation for this finding could be the severity of brain damage in group D cases (structural epilepsy) and the demand for further antioxidant protection of the nervous tissue from further damage. Since PON1 cannot cross blood-brain barrier (BBB), even if it is impaired [68], the results of the current study are an important finding that requires further investigation. The same research group mentioned that despite the fact that there is no documented gene expression in mouse or human brain tissue, a hypothesis of transport of PON1 via “discoidal HDL” with unspecified mechanisms could not be excluded [68]. There were additional studies of PON1 identification in CSF samples of patients suffering from neurodegenerative diseases and they speculate that CSF PON1 originated from the periphery [69,70]. Therefore, CSF PON1 identification, origin and mechanism of action in epilepsy need further investigation.
CUPRAC measurement is a reliable method for assessing the antioxidant capacity of a sample by reducing Cu2+ to Cu1+ [58]. Therefore, decreased CUPRAC values may indicate reduced antioxidant defense in multiple diseases [58]. Limited data are available regarding the assessment of CUPRAC in human and canine epilepsy. Overall assessment of median CUPRAC values between the two different sample types (serum and CSF) indicates a tendency of higher CUPRAC values in serum compared to CSF (except for group D). Although there was no significance identified in serum CUPRAC among the four groups, CSF CUPRAC was statistically significant when group A was compared with group D dogs. This could indicate that more severe brain pathologies (structural epilepsy) were associated with an increased demand for antioxidant protection of the tissue. To the author’s knowledge, there are no other previously published papers assessing CUPRAC in epileptic patients.
FRAP (Ferric reducing ability) is a method that assesses the antioxidant capacity of a sample by reducing the ferric ion (Fe3+) to ferrous ion (Fe2+) [59]. In the current study FRAP was evaluated in CSF. Statistical analysis did not reveal any significance of FRAP among the four groups. Previous studies reported increased serum and CSF FRAP values in canine patients with distemper encephalitis and decreased values in human patients diagnosed with Fabry disease [46,64]. Since published literature is limited and involves different species (human vs canine) and/or different disease entities, secure conclusions could not be extrapolated regarding FRAP in canine epilepsy.
Cholinesterase activity (acetylcholinesterase and butyrylcholinesterase) is correlated with epilepsy through cholinergic neurotransmission, which is closely linked to neuronal excitability and seizure activity [47,65]. In this study cholinesterase was assessed in both serum and CSF samples of epileptic dogs and healthy controls. Serum cholinesterase activity was not significant among the four study groups. On the contrary, CSF cholinesterase activity was significant when group D dogs (structural epilepsy) were compared with the other two groups of idiopathic epilepsy (groups B and C) and the control group (group A). CSF cholinesterase activity is altered (increased) probably through a localized release in the brain, as a compensatory mechanism [71]. In this study, both serum and CSF median cholinesterase values are increased, but the increase in CSF is more prominent. Interestingly, an increase was also recorded in group A (control group). A possible explanation could be that stress may be responsible since these dogs were thoroughly investigated and no abnormalities were identified during routine physical examination and clinicopathological testing. Bibliography supports the influence of acute stress episode on cholinesterase by increasing its activity in the brain and peripheral nervous system [72].
In this report an AlphaLISA assay for the measurement of oxytocin in CSF of dogs was analytically validated given adequate values of precision and accuracy and indicating that this assay can be applied for oxytocin CSF quantification. In humans and rats exogenous oxytocin administration (intranasally, intra-hippocampal microinjection) may reduce seizure severity and frequency in a long-term basis [49,50,51,52,53]. In this study, CSF endogenous oxytocin levels were evaluated in the four groups of dogs. There was a statistically significant increase in CSF oxytocin between group D dogs compared to the other two groups of idiopathic epilepsy dogs (groups B and C). This increase in group D could be due to the presence of more severe brain lesions when structural epilepsy is suspected, and could increase to compensate for the damage since it produces neuroprotection [53]. However, the small sample size of group D dogs (8 dogs) necessitates further investigation in a larger animal population.
The limitations of the current study originated from the retrospective nature of the study, with some missing data. The volume of CSF that may safely be collected from the patients was small and inadequate to evaluate all parameters in all dogs. The small sample size of each group may impact statistical analysis results. The heterogeneity of the antiepileptic medication of groups B and D dogs, the variable frequency of epileptic seizures, and the poorly defined time interval from the last epileptic seizure until sampling may have had an impact on results. Additional research is required to evaluate cholinesterase, oxytocin and oxidative stress, and inflammatory markers in larger groups of epileptic dogs. Homogeneity is quite difficult to obtain in naturally-occurring animal studies since each individual requires specific antiepileptic medication and seizure frequency is unique and unpredictable for every case.
5. Conclusions
The current study assessed oxidative stress (PON1, CUPRAC and FRAP) and inflammatory (CRP) markers alongside cholinesterase and oxytocin in serum and CSF samples of dogs diagnosed with different types of epilepsy. Structural epilepsy may alter paraoxonase (PON1),CUPRACand cholinesterase levels in CSF samples. Serum was not the optimal biological material as CSF in the investigation of oxidative stress and inflammatory markers in epileptic patients, as indicated by the results of this study.
Author Contributions
Conceptualization, Z.P.; methodology, R.B., A.G., M.B., J.D.M.G. and D.G.; software, I.S.; validation, R.B., A.G., M.B., J.D.M.G. and I.S.; formal analysis, R.B.; investigation, R.B. and A.G.; resources, R.B. M.B., J.D.M.G., and A.G.; data curation, R.B., M.B., J.D.M.G. and D.G.; writing—original draft preparation, R.B.; writing—review and editing, Z.P., M.B., J.D.M.G.; visualization, Z.P.; supervision, Z.P. All authors have read and agreed to the published version of the manuscript.
Funding
This research received no external funding.
Institutional Review Board Statement
The animal study protocol was approved by the Institutional Review Board of Veterinary School, Faculty of Health Sciences, Aristotle University of Thessaloniki(protocol number 567/13/03/2018 on March 13th 2018).
Data Availability Statement
Additional data are unavailable due to privacy and ethical restrictions.
Conflicts of Interest
The authors declare no conflicts of interest.
Abbreviations
The following abbreviations are used in this manuscript:
| AChE | Acetylocholine |
| AEM | Antiepileptic Medication |
| ANOVA | Analysis of Variance |
| BBB | Blood Brain Barrier |
| Br | Bromide |
| CBC | Complete Blood Count |
| CNS | Central Nervous System |
| CRP | C-reactive protein |
| CSF | Cerebrospinal Fluid |
| CT | Computed Tomography |
| CVs | Coefficients of variations |
| CUPRAC | Cupric reducing antioxidant capacity |
| EEG | Electroencephalography |
| FRAP | Ferric reducing antioxidant power |
| HDL | High-density lipoprotein |
| ILAE | International League Against Epilepsy |
| LD | Detection limit |
| LEV | Levetiracetam |
| LLQ | Lower limit of quantification |
| MRI | Magnetic Resonance Imaging |
| PB | Phenobarbital |
| PON1 | Paraoxonase 1 |
| RNS | Reactive Nitrogen Species |
| ROS | Reactive Oxygen Species |
References
- Blume, W.T.; Luders, H.O.; Mizrahi, E.; Tassinari, C.; van Emde Boas, W.; Engel, J. Glossary of ictal semiology. Epilepsia 2001, 42, 1212–1218. [Google Scholar] [CrossRef]
- Fisher, R.S.; van Emde Boas, W.; Blume, W.; Elger, C.; Genton, P.; Lee, P.; Engel, J.J. Epileptic seizures and epilepsy: definitions proposed by the International League against Epilepsy (ILAE) and the International Bureau foe Epilepsy (IBE). Epilepsia 2005, 46, 470–472. [Google Scholar] [CrossRef]
- Berendt, M.; Farquhar, R.G.; Mandigers, P.J.J.; Pakozdy, A; Bhatti, S.F.M.; De Risio, L.; Fischer, A.; Long, S.; Matiasek, K.; Munana, K.; Patterson, E.E.; Penderis, J.; Platt, S.; Podell, M.; Potschka, H.; Pumarola, M.B.; Rusbridge, C.; Stein, V.M.; Tipold, A.; Volk, H.A. International Veterinary Task Force Consensus Report on epilepsy definition, classification and terminology in companion animals. Vet. Res. 2015, 182, 1–11. [Google Scholar] [CrossRef]
- Schwartz-Porsche, D. Epidemiological, clinical and pharmacokinetic studies in spontaneously epileptic dogs and cats. Proc. Am. Coll. Vet. Intern. Med. 1986, 1161–1163. [Google Scholar]
- Podell, M.; Hadjiconstantinou, M. Cerebrospinal fluid gamma-aminobutyric acid and glutamate values in dogs with epilepsy. Am. J. Vet. Res. 1997, 58, 451–456. [Google Scholar] [CrossRef]
- Kearsley Fleet, L.O.; Neill, D.G.; Volk, H.A.; Church, D.B.; Broadbelt, D.C. Prevalence and risk factors for canine epilepsy of unknown origin in the UK. Vet. Rec. 2013, 172, 338. [Google Scholar] [CrossRef]
- Asadi-Pooya, A.A.; Malekpour, M.; Taherifard, E.; Mallahzadeh, A.; Farjoud Kouhanjani, M. Coexistence of temporal lobe epilepsy and idiopathic generalized epilepsy. Epilepsy Behav. 2024, 151, 109602. [Google Scholar] [CrossRef] [PubMed]
- Ashjazadeh, N.; Namjoo-Moghadam, A.; Mani, A.; Doostmohammadi, N.; Bayat, M.; Salehi, M.S.; Rafiei, E.; Rostamihosseinkhani, M.; Khani-Robati, A.; Hooshmandi, E. Comparison of executive function in idiopathic generalized epilepsy versus temporal lobe epilepsy. Neurocase. 2024, 30(5), 167–173. [Google Scholar] [CrossRef]
- Steinmetz, S.; Tipold, A.; Loscher, W. Epilepsy after head injury in dogs: a natural model of posttraumatic epilepsy. Epilepsia 2013, 54, 580–588. [Google Scholar] [CrossRef] [PubMed]
- Hall, R.; Labruyere, J.; Volk, H.; Cardy, T.J. Estimation of the prevalence of idiopathic epilepsy and structural epilepsy in a general population of 900 dogs undergoing MRI for epileptic seizures. Vet Rec. 2020, 187(10), e 89. [Google Scholar] [CrossRef]
- De Risio, L.; Bhatti, S.; Munana, K.; Penderis, J.; Stein, V.; Tipold, A.; Brendt, M.; Farqhuar, R.; Fischer, A.; Long, S.; Mandigers, P.J.J.; Matiasek, K.; Packer, R.M.A.; Pakozdy, A.; Patterson, N.; Platt, S.; Podell, M.; Potschka, H.; Batlle, M.P.; Rusbridge, C.; Volk, H.A. International veterinary epilepsy task force consensus proposal: diagnostic approach to epilepsy in dogs. BMC Vet Res 2015, 11, 148. [Google Scholar] [CrossRef] [PubMed]
- Estey, C.M.; Dewey, C.W.; Rishniw, M.; Lin, D.M.; Bouma, J.; Sackman, J. A subset of dogs with presumptive idiopathic epilepsy show hippocampal asymmetry: a volumetric comparison with non-epileptic dogs using MRI. Front. Vet. Sci. 2017, 4, 183. [Google Scholar] [CrossRef] [PubMed]
- Czerwik, A.; Plonek, M.; Podgσrski, P.; Wrzosek, M. Comparison of electroencephalographic findings with hippocampal magnetic resonance imaging volumetry in dogs with idiopathic epilepsy. J.Vet.Intern.Med. 2018, 32, 2037–2044. [Google Scholar] [CrossRef]
- Huaijantug, S.; Yatmark, P.; Chinnabrut, P.; Rueangsawat, N.; Wongkumlue, A.; Teerapan, W. Quantitative brain histogram of canine epilepsy using magnetic resonance imaging. Acta Radiol. 2021, 62, 93–101. [Google Scholar] [CrossRef]
- Nagendran, A.; McConnell, J.F.; De Risio, L.; Jose-Lopez, R.; Quintana, R.G.; Robinson, K.; Platt, S.R.; Masian, D.S.; Maddox, T.; Concalves, R. Peri-ictal magnetic resonance imaging characteristics in dogs with suspected idiopathic epilepsy. J.Vet Intern.Med. 2021, 35(2), 1008–1017. [Google Scholar] [CrossRef] [PubMed]
- Maeso, C.; Sanchez-Masian, D.; Rodenas, S.; Font, C.; Morales, C.; Domνnguez, E. Prevalence, distribution, and clinical associations of suspected postictal changes on brain magnetic resonance imaging in epileptic dogs. J.Am.Vet.Med. Assoc. 2021, 260, 71–81. [Google Scholar] [CrossRef]
- Wirrell, E.C.; Nabbout, R.; Scheffer, I.E.; Alsaadi, T.; Bogacz, A.; French, J.A. Methodology for classification and definition of epilepsy syndromes with list of syndromes: report of the ILAE Task Force on Nosology and Definitions. Epilepsia 2022, 63(6), 1333–1348. [Google Scholar] [CrossRef] [PubMed]
- Li, W.; Wu, J.; Zeng, Y.; Zheng, W. Neuroinflammation in epileptogenesis: from pathophysiology to therapeutic strategies. Front Immunol. 2023, 14, 1269241. [Google Scholar] [CrossRef]
- Zhao, P.; Ding, X.; Li, L.; Jiang, G. A review of cell-type specific circuit mechanisms underlying epilepsy. Acta Epileptol. 2024, 6(1), 18. [Google Scholar] [CrossRef]
- Birben, E.; Sahiner, U.M.; Sackesen, C.; Erzurum, S.; Kalayci, O. Oxidative stress and antioxidant defense. World Allergy Organ J. 2012, 5(1), 9–19. [Google Scholar] [CrossRef]
- Sies, H. Oxidative Stress: Concept and Some Practical Aspects. Antioxidants (Basel) 2020, 9(9), 852. [Google Scholar] [CrossRef]
- Łukawski, K.; Czuczwar, S.J. Oxidative Stress and Neurodegeneration in Animal Models of Seizures and Epilepsy. Antioxidants (Basel) 2023, 12(5), 1049. [Google Scholar] [CrossRef]
- Rumià, J.; Marmol, F.; Sanchez, J.; Giménez-Crouseilles, J.; Carreño, M.; Bargalló, N.; Boget, T.; Pintor, L.; Setoain, X.; Donaire, A.; Saez, G.T.; Ribalta, T.; Ferrer, E.; Puig-Parellada, P. Oxidative stress markers in the neocortex of drug-resistant epilepsy patients submitted to epilepsy surgery. Epilepsy Res. 2013, 107(1-2), 75–81. [Google Scholar] [CrossRef]
- Işık, M.; Demir, Y.; Kırıcı, M.; Demir, R.; Şimşek, F.; Beydemir, Ş. Changes in the anti-oxidant system in adult epilepsy patients receiving anti-epileptic drugs. Arch Physiol Biochem. 2015, 121(3), 97–102. [Google Scholar] [CrossRef] [PubMed]
- Dönmezdil, N.; Çevik, M.U.; Özdemir, H.H.; Taşin, M. Investigation of PON1 activity and MDA levels in patients with epilepsy not receiving antiepileptic treatment. Neuropsychiatr Dis Treat. 2016, 12, 1013–1017. [Google Scholar] [CrossRef] [PubMed]
- Petrillo, S.; Pietrafusa, N.; Trivisano, M.; Calabrese, C.; Saura, F.; Gallo, M.G.; Bertini, E.S.; Vigevano, F.; Specchio, N.; Piemonte, F. Imbalance of Systemic Redox Biomarkers in Children with Epilepsy: Role of Ferroptosis. Antioxidants (Basel). 2021, 10(8), 1267. [Google Scholar] [CrossRef]
- Michelin, A.P.; Maes, M.H.J.; Supasitthumrong, T.; Limotai, C.; Matsumoto, A.K.; de Oliveira Semeão, L.; de Lima Pedrão, J.V.; Moreira, E.G.; Kanchanatawan, B.; Barbosa, D.S. Reduced paraoxonase 1 activities may explain the comorbidities between temporal lobe epilepsy and depression, anxiety and psychosis. World J Psychiatry. 2022, 12(2), 308–322. [Google Scholar] [CrossRef] [PubMed]
- Korczowska-Łącka, I.; Hurła, M.; Banaszek, N.; Kobylarek, D.; Szymanowicz, O.; Kozubski, W.; Dorszewska, J. Selected Biomarkers of Oxidative Stress and Energy Metabolism Disorders in Neurological Diseases. Mol Neurobiol. 2023, 60(7), 4132–4149. [Google Scholar] [CrossRef]
- Langenbruch, L.; Wiendl, H.; Groß, C.; Kovac, S. Diagnostic utility of cerebrospinal fluid (CSF) findings in seizures and epilepsy with and without autoimmune-associated disease. Seizure. 2021, 91, 233–243. [Google Scholar] [CrossRef]
- Fabisiak, T.; Patel, M. Crosstalk between neuroinflammation and oxidative stress in epilepsy. Front Cell Dev Biol. 2022, 10, 976953. [Google Scholar] [CrossRef]
- Parsons, A.L.M.; Bucknor, E.M.V.; Castroflorio, E.; Soares, T.R.; Oliver, P.L.; Rial, D. The Interconnected Mechanisms of Oxidative Stress and Neuroinflammation in Epilepsy. Antioxidants (Basel). 2022, 11(1), 157. [Google Scholar] [CrossRef]
- Yuen, A.W.; Bell, G.S.; Peacock, J.L.; Koepp, M.M.; Patsalos, P.N.; Sander, J.W. Effects of AEDs on biomarkers in people with epilepsy: CRP, HbA1c and eGFR. Epilepsy Res. 2010, 91(2-3), 187–192. [Google Scholar] [CrossRef]
- Alapirtti, T.; Waris, M.; Fallah, M.; Soilu-Hänninen, M.; Mäkinen, R.; Kharazmi, E.; Peltola, J. C-reactive protein and seizures in focal epilepsy: a video-electroencephalographic study. Epilepsia. 2012, 53(5), 790–796. [Google Scholar] [CrossRef] [PubMed]
- Holtman, L.; van Vliet, E.A.; Aronica, E.; Wouters, D.; Wadman, W.J.; Gorter, J.A. Blood plasma inflammation markers during epileptogenesis in post-status epilepticus rat model for temporal lobe epilepsy. Epilepsia. 2013, 54(4), 589–595. [Google Scholar] [CrossRef]
- Chen, W.; Tan, Y.; Ge, Y.; Chen, Y.; Liu, X. The Effects of Levetiracetam on Cerebrospinal Fluid and Plasma NPY and GAL, and on the Components of Stress Response System, hs-CRP, and S100B Protein in Serum of Patients with Refractory Epilepsy. Cell Biochem Biophys. 2015, 73(2), 489–494. [Google Scholar] [CrossRef]
- Hermann, B.P.; Sager, M.A.; Koscik, R.L.; Young, K.; Nakamura, K. Vascular, inflammatory, and metabolic factors associated with cognition in aging persons with chronic epilepsy. Epilepsia. 2017, 58(11), e152–e156. [Google Scholar] [CrossRef]
- Zhou, T.; Wang, N.; Xu, L.; Huang, H.; Yu, C.; Zhou, H. Effects of carbamazepine combined with vitamin B12 on levels of plasma homocysteine, hs-CRP and TNF-α in patients with epilepsy. Exp Ther Med. 2018, 15(3), 2327–2332. [Google Scholar] [CrossRef] [PubMed]
- Zhong, R.; Chen, Q.; Li, M.; Zhang, X.; Lin, W. Elevated Blood C-Reactive Protein Levels in Patients With Epilepsy: A Systematic Review and Meta-Analysis. Front Neurol. 2019, 10, 974. [Google Scholar] [CrossRef]
- Faria, M.T.; Rego, R.; Rocha, H.; Sá, F.; Farinha, R.; Oliveira, A.; Barata, P.; Alves, D.; Pereira, J.; Rocha-Gonçalves, F.; Gonçalves, H.; Martins, E. cTnI, BNP and CRP profiling after seizures in patients with drug-resistant epilepsy. Seizure. 2020, 80, 100–108. [Google Scholar] [CrossRef]
- Liu, Z.; Li, J.; Yang, F.; Hu, Y.; Liu, J.; Hu, H.; Su, W. Sodium valproate combined with levetiracetam in pediatric epilepsy and its influence on NSE, IL-6, hs-CRP and electroencephalogram improvement. Exp Ther Med. 2020, 20(3), 2043–2048. [Google Scholar] [CrossRef] [PubMed]
- Tao, H.; Gong, Y.; Yu, Q.; Zhou, H.; Liu, Y. Elevated Serum Matrix Metalloproteinase-9, Interleukin-6, Hypersensitive C-Reactive Protein, and Homocysteine Levels in Patients with Epilepsy. J Interferon Cytokine Res. 2020, 40(3), 152–158. [Google Scholar] [CrossRef]
- Wei, H.; Liu, D.; Geng, L.; Liu, Y.; Wang, H.; Yan, F. Application Value of Serum Metabolic Markers for Cognitive Prediction in Elderly Epilepsy. Neuropsychiatr Dis Treat. 2022, 18, 2133–2140. [Google Scholar] [CrossRef]
- Zhou, Y.F.; Huang, Y.; Liu, G.H. Effects of Levetiracetam on the Serum C - reactive protein in Children With Epilepsy: A Meta-Analysis. Front Pharmacol. 2022, 13, 810617. [Google Scholar] [CrossRef]
- Mahon, E.K.; Williams, T.L.; Alves, L. Serum C-reactive protein concentrations in dogs with structural and idiopathic epilepsy. Vet Rec. 2023, 193(12), e3211. [Google Scholar] [CrossRef] [PubMed]
- Despa, A.; Musteata, M.; Solcan, G. Evaluation of Blood C Reactive Protein (CRP) and Neutrophil-to-Lymphocyte Ratio (NLR) Utility in Canine Epilepsy. Vet Sci. 2024, 11(9), 408. [Google Scholar] [CrossRef]
- Kocatürk, M.; Öz, A.D.; Muñoz, A.; Martinez, J.D.; Ceron, J.J.; Yilmaz, Z. Changes in immuno-inflammatory and antioxidant biomarkers in serum and cerebrospinal fluid of dogs with distemper. Microb Pathog. 2025, 198, 107160. [Google Scholar] [CrossRef]
- Sergienko, N.G.; Gonzalez-Quevedo, A.; Gonzalez, N.; Simon y Canon, L.; Marin, G. Role of the acetylocholine—cholinesterase system in the development of epilepsy. ZhNevropatolPsikhiatrIm S S Korsakova 1979, 6, 698–704. [Google Scholar]
- Zimmerman, G.; Njunting, M.; Ivens, S.; Tolner, E.A.; Behrens, C.J.; Gross, M.; Soreq, H.; Heinemann, U.; Friedman, A. Acetylocholin-induced seizure-like activity and modified cholinergic expression in chronically epileptic rats. Eur J Neurosci 2008, 27(4), 965–975. [Google Scholar] [CrossRef] [PubMed]
- Erfanparast, A.; Tamaddonfard, E.; Henareh-Chareh, F. Intra-hippocampal microinjection of oxytocin produced antiepileptic effect on the pentylenetetrazol-induced epilepsy in rats. Pharmacol Rep. 2017, 69(4), 757–763. [Google Scholar] [CrossRef]
- Higashida, H.; Munesue, T.; Kosaka, H.; Yamasue, H.; Yokoyama, S.; Kikuchi, M. Social Interaction Improved by Oxytocin in the Subclass of Autism with Comorbid Intellectual Disabilities. Diseases. 2019, 7(1), 24. [Google Scholar] [CrossRef] [PubMed]
- Wong, J.C.; Shapiro, L.; Thelin, J.T.; Heaton, E.C.; Zaman, R.U.; D'Souza, M.J.; Murnane, K.S.; Escayg, A. Nanoparticle encapsulated oxytocin increases resistance to induced seizures and restores social behavior in Scn1a-derived epilepsy. Neurobiol Dis. 2021, 147, 105147. [Google Scholar] [CrossRef]
- Sahin, H.; Yucel, O.; Emik, S.; Senturk, G.E. Protective Effects of Intranasally Administrated Oxytocin-Loaded Nanoparticles on Pentylenetetrazole-Kindling Epilepsy in Terms of Seizure Severity, Memory, Neurogenesis, and Neuronal Damage. ACS Chem Neurosci. 2022, 13(13), 1923–1937. [Google Scholar] [CrossRef]
- Chen, W.; Man, X.; Zhang, Y.; Yao, G.; Chen, J. Medial prefrontal cortex oxytocin mitigates epilepsy and cognitive impairments induced by traumatic brain injury through reducing neuroinflammation in mice. Sci Rep. 2023, 13(1), 5214. [Google Scholar] [CrossRef]
- De Risio, L.; Platt, S.; De Risio, L.; Platt, S. Idiopathic Epilepsy and Genetics. In BookCanine and Feline Epilepsy: Diagnosis and management; Cabi: Oxfordshire, 2014; pp. 207–218. [Google Scholar]
- Bhatti, F.M.; De Risio, L.; Muñana, K.; Penderis, J.; Stein, V.M.; Tipold, A.; Berendt, M.; Farquhar, R.G.; Fischer, A.; Long, S.; Löscher, W.; Mandigers, P.J.J.; Matiasek, K.; Pakozdy, A.; Patterson, E.E.; Platt, S.; Podell, M.; Potschka, H.; Rusbridge, C.; Volk, H.A. International Veterinary Epilepsy Task Force consensus proposal: medical treatment of canine epilepsy in Europe. Vet Res 2015, 11, 176. [Google Scholar] [CrossRef]
- Charalambous, M.; Shivapour, S.K.; Brodbelt, D.C.; Volk, H.A. Antiepileptic drugs' tolerability and safety--a systematic review and meta-analysis of adverse effects in dogs. BMC Vet Res. 2016, 12, 79. [Google Scholar] [CrossRef]
- Ceron, J.J.; Tecles, F.; Tvarijonaviciute, A. Serum paraoxonase 1 (PON1) measurement: An update. BMC Vet. Res. 2014, 10, 74. [Google Scholar] [CrossRef] [PubMed]
- Rubio, C.P.; Tvarijonaviciute, A.; Martinez-Subiela, S.; Hernández-Ruiz, J.; Cerón, J.J. Validation of an automated assay for the measurement of cupric reducing antioxidant capacity in serum of dogs. BMC Vet. Res. 2016, 12, 137. [Google Scholar] [CrossRef] [PubMed]
- Benzie, I.F.F.; Strain, J.J. The Ferric Reducing Ability of Plasma (FRAP) as a Measure of “Antioxidant Power”: The FRAP Assay. Anal. Biochem. 1996, 239, 70–76. [Google Scholar] [CrossRef]
- Rubio, C.P.; Martinez-Subiela, S.; Hernández-Ruiz, J.; Tvarijonaviciute, A.; Ceron, J.J. Analytical validation of an automated assay for ferric-reducing ability of plasma in dog serum. J. Vet. Diagnostic Investig. 2017, 29, 574–578. [Google Scholar] [CrossRef] [PubMed]
- Ginoudis, A.; Pardali, D.; Mylonakis, M.E.; Tamvakis, A.; Tvarijonaviciute, A.; Lymperaki, E.; Ceron, J.J.; Polizopoulou, Z. Oxidative Status and Lipid Metabolism Analytes in Dogs with Mast Cell Tumors: A Preliminary Study. Antioxidants 2024, 13, 1473. [Google Scholar] [CrossRef]
- Muñoz-Prieto, A.; Tvarijonaviciute, A.; Escribano, D.; Martínez-Subiela, S.; Cerón, J.J. Use of heterologous immunoassays for quantification of serum proteins: The case of canine C-reactive protein. PLoS One. 2017, 12(2), e0172188. [Google Scholar] [CrossRef]
- López-Arjona, M.; Mateo, S.V.; Manteca, X.; Escribano, D.; Cerón, J.J.; Martínez-Subiela, S. Oxytocin in saliva of pigs: an assay for its measurement and changes after farrowing. Domest Anim Endocrinol 2020, 70, 106384. [Google Scholar] [CrossRef]
- Simoncini, C.; Torri, S.; Montano, V.; Chico, L.; Gruosso, F.; Tuttolomondo, A.; Pinto, A.; Simonetta, I.; Cianci, V.; Salviati, A.; Vicenzi, V.; Marchi, G.; Girelli, D.; Concolino, D.; Sestito, S.; Zedde, M.; Siciliano, G.; Mancuso, M. Oxidative stress biomarkers in Fabry disease: is there a room for them? J Neurol. 2020, 267(12), 3741–3752. [Google Scholar] [CrossRef]
- Radaković, M.; Andrić, J.F.; Spariosu, K.; Vejnović, B.; Filipović, M.K.; Andrić, N. Serum oxidant-antioxidant status and butyrylcholinesterase activity in dogs with idiopathic epilepsy - A pilot study. Res Vet Sci. 2023, 165, 105076. [Google Scholar] [CrossRef]
- Aviram, M.; Rosenblat, M. Paraoxonases and cardiovascular diseases: pharmacological and nutritional influences. Curr Opin Lipidol. 2005, 16(4), 393–399. [Google Scholar] [CrossRef] [PubMed]
- Costa, L.G.; Furlong, C.E. Paraoxonase (PON1): genetics, enzymatic activity, and role in detoxificationa and oxidative stress. Annual Review of Pharmacology and Toxicology 2014, 54, 371–396. [Google Scholar]
- Beggiato, S.; Ferrara, F.; Romani, A.; Cassano, T.; Trentini, A.; Valacchi, G.; Cervellati, C.; Ferraro, L. Signature of paraoxonases in the altered redox homeostasis in Alzheimer's disease. Chem Biol Interact. 2024, 388, 110839. [Google Scholar] [CrossRef]
- Romani, A.; Trentini, A.; Flier, W.M.V.; Bellini, T.; Zuliani, G.; Cervellati, C.; Teunissen, C.E. Arylesterase Activity of Paraoxonase-1 in Serum and Cerebrospinal Fluid of Patients with Alzheimer's Disease and Vascular Dementia. Antioxidants (Basel) 2020, 9(5), 456. [Google Scholar] [CrossRef] [PubMed]
- Marsillach, J.; Cervellati, C. Paraoxonase-1 and Other HDL Accessory Proteins in Neurological Diseases. Antioxidants (Basel). 2021, 10(3), 454. [Google Scholar] [CrossRef]
- Karami, A.; Eriksdotter, M.; Kadir, A.; Almkvist, O.; Nordberg, A.; Darreh-Shori, T. CSF Cholinergic Index, a New Biomeasure of Treatment Effect in Patients With Alzheimer's Disease. Front Mol Neurosci. 2019, 12, 239. [Google Scholar] [CrossRef]
- Sailaja, B.S.; Cohen-Carmon, D.; Zimmerman, G.; Soreq, H.; Meshorer, E. Stress-induced epigenetic transcriptional memory of acetylcholinesterase by HDAC4. ProcNatl Acad Sci U S A 2012, 109(52), E3687–E3695. [Google Scholar] [CrossRef]
Figure 1.
Boxplots of the concentration of the oxidative stress parameters (PON1 and CUPRAC) in serum samples.
Figure 1.
Boxplots of the concentration of the oxidative stress parameters (PON1 and CUPRAC) in serum samples.
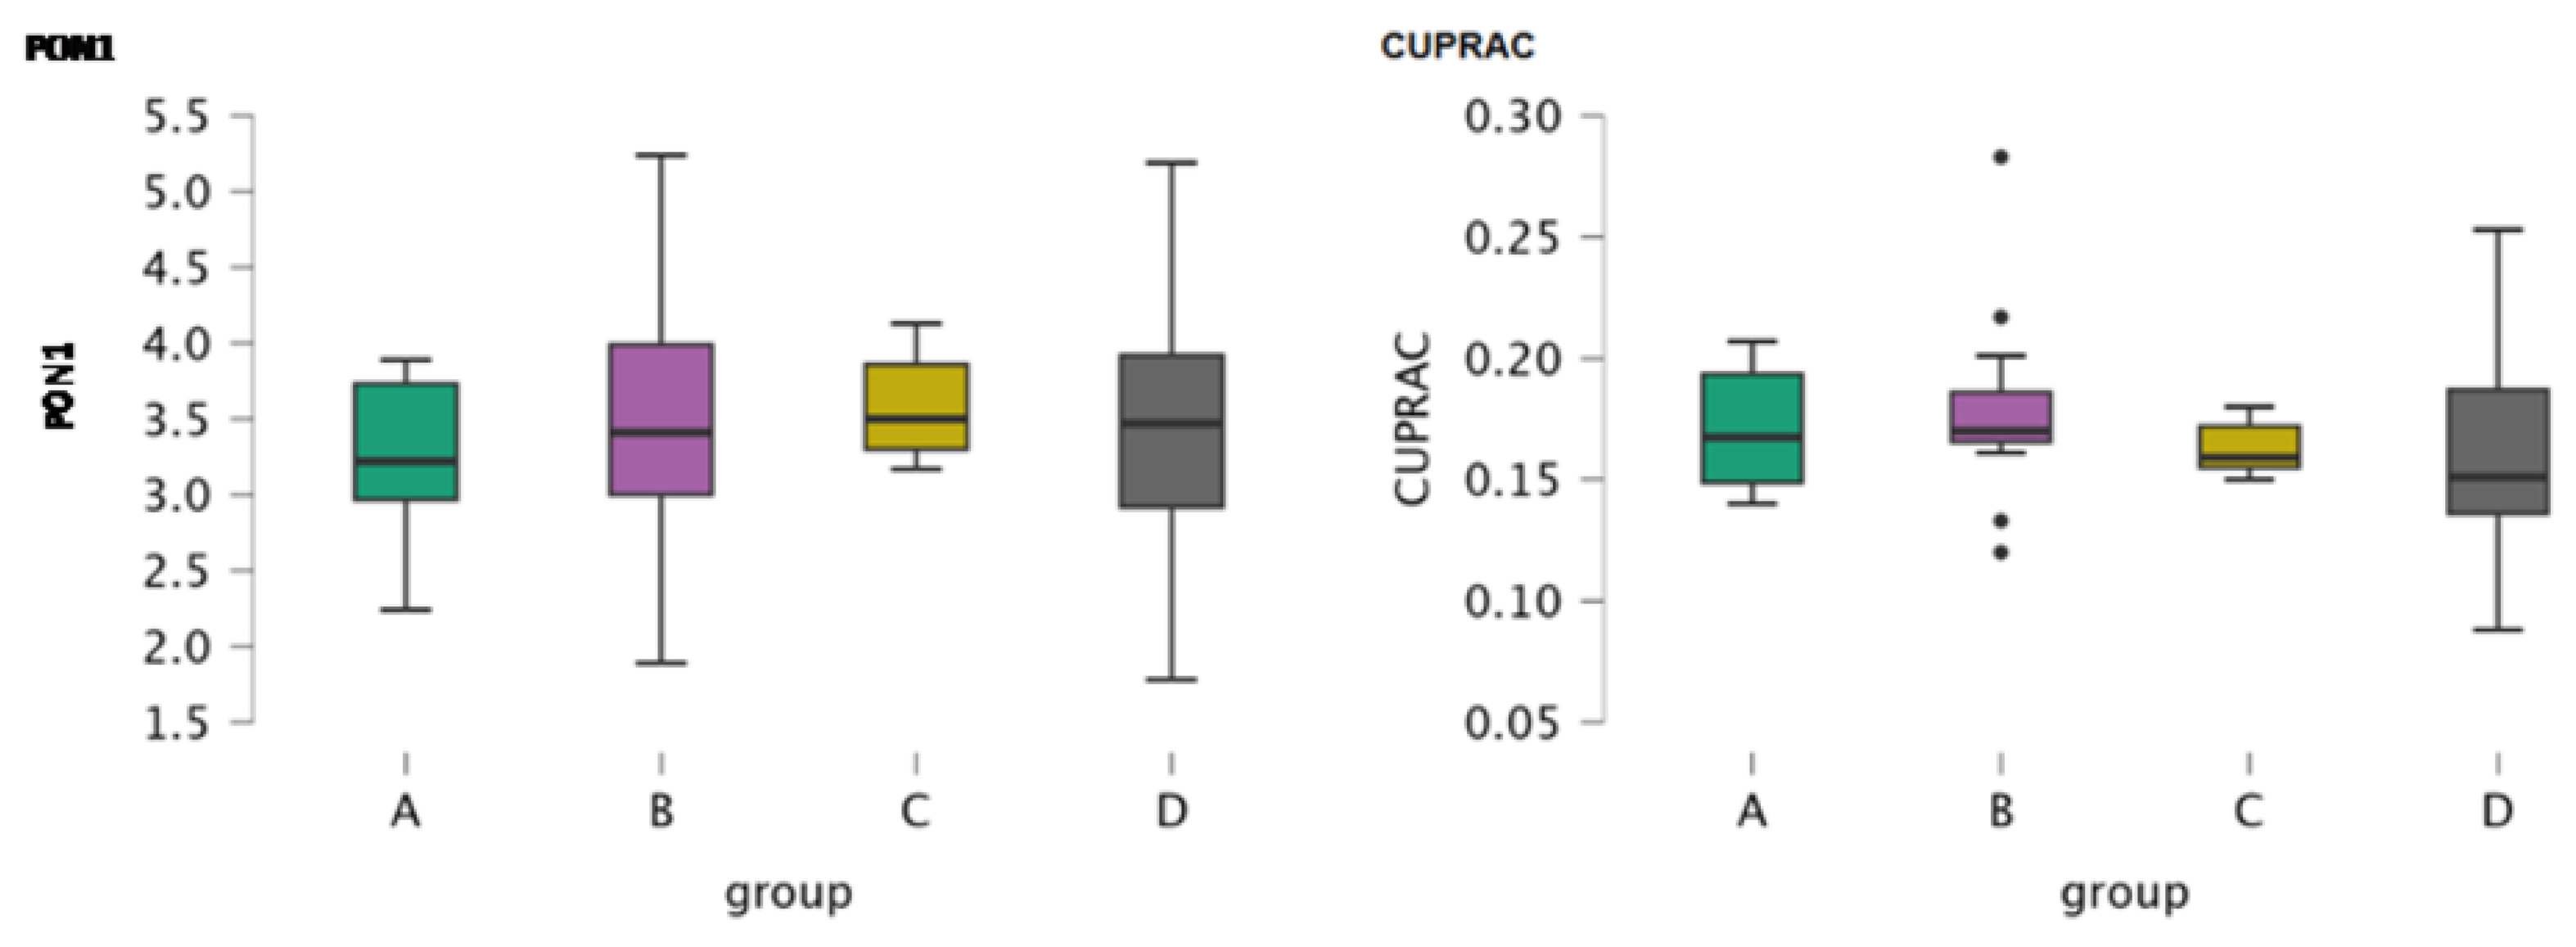
Figure 2.
Boxplot of the concentration of cholinesterase in serum samples.
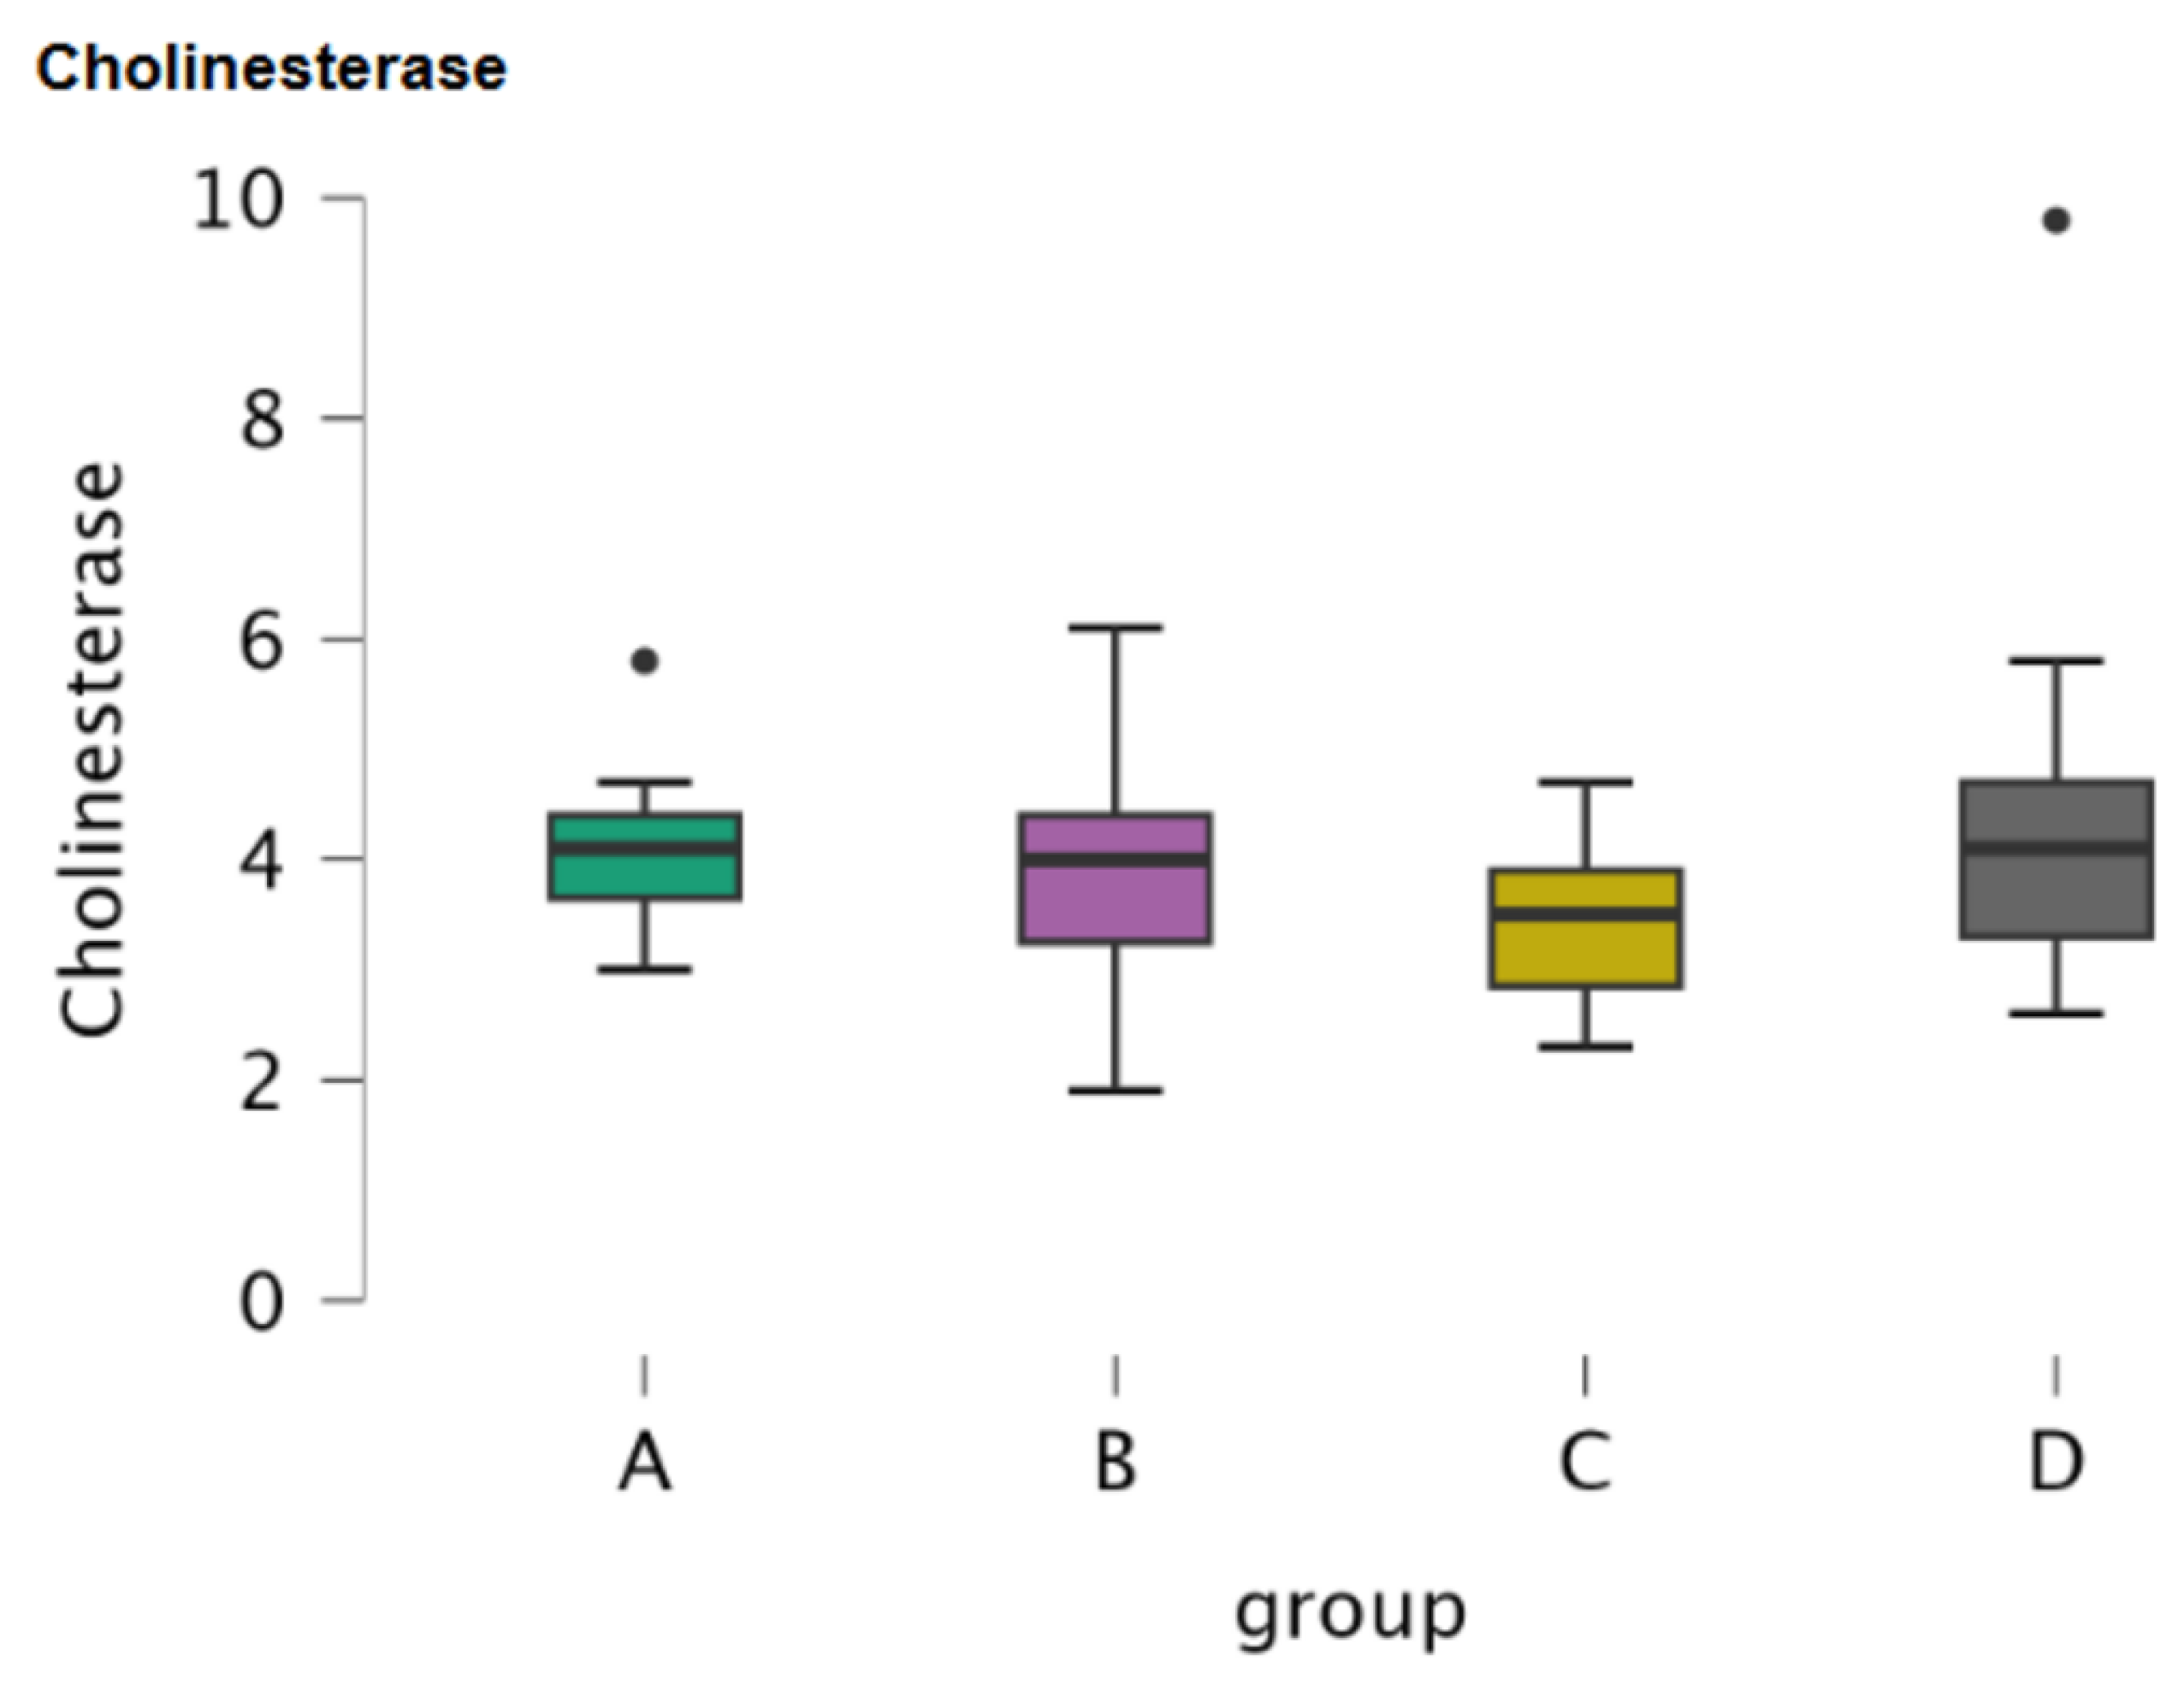
Figure 3.
Boxplot of the concentration of CRP in serum samples.
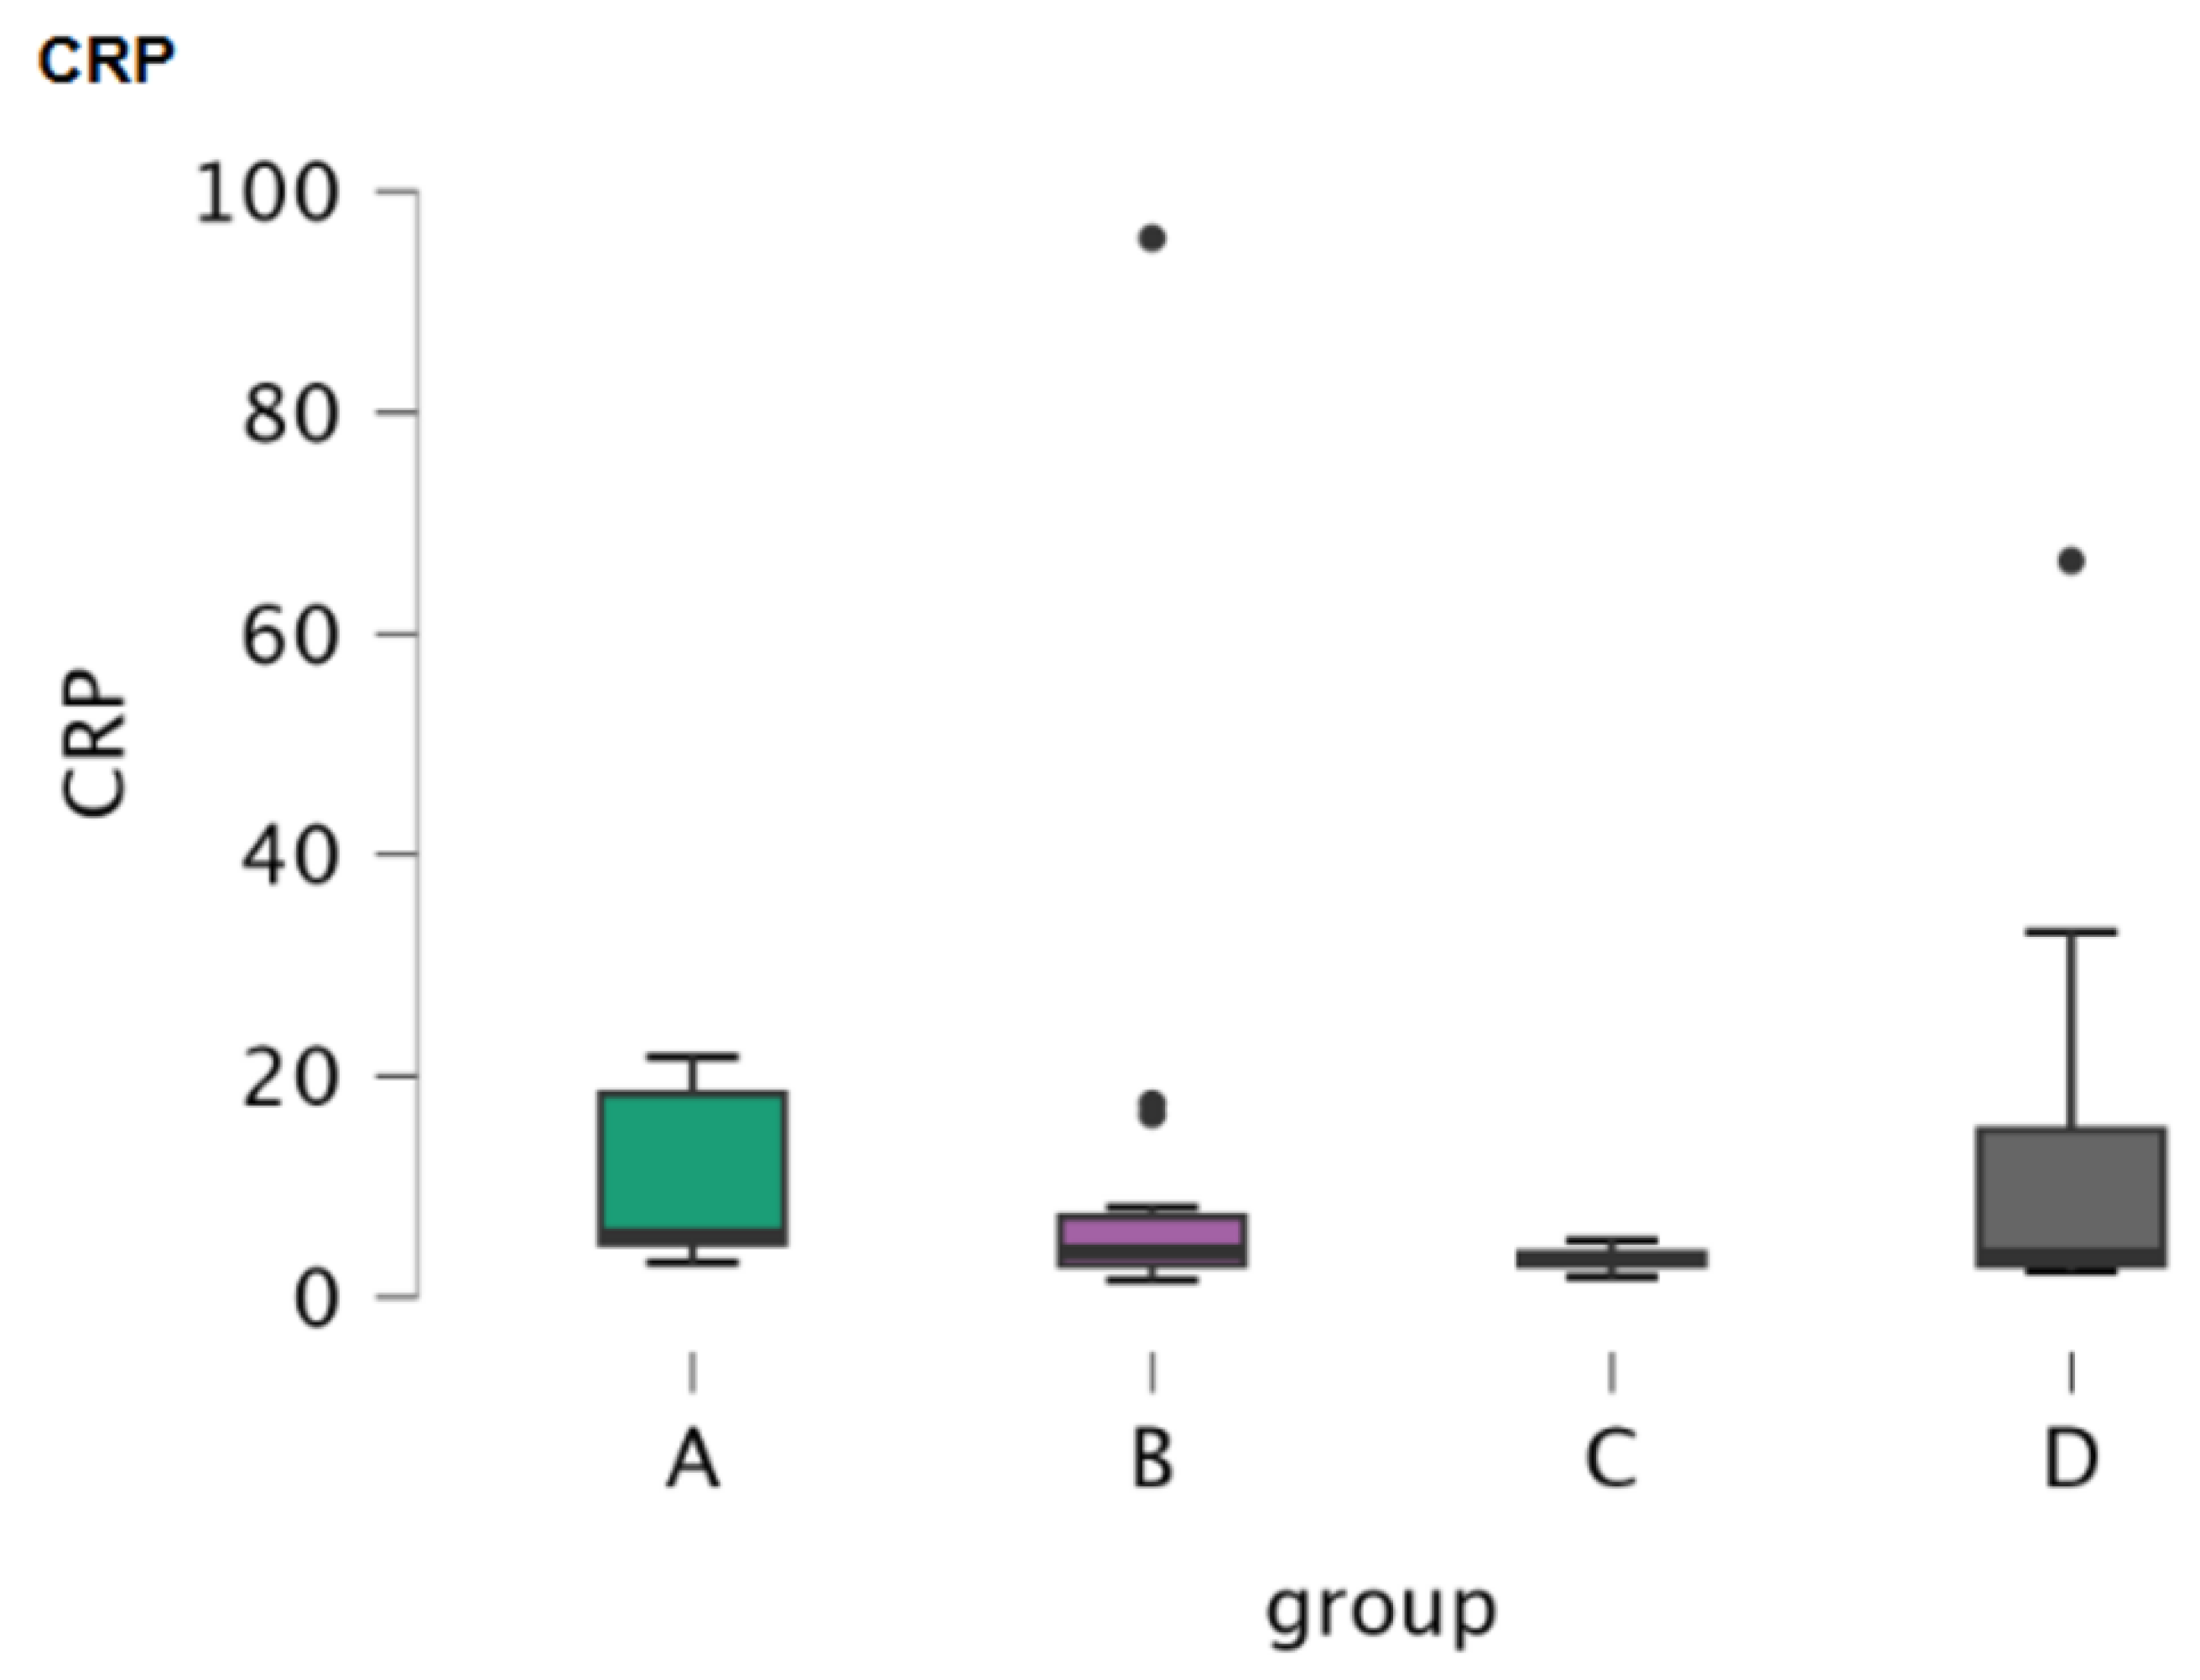
Figure 4.
Boxplots of the concentration of oxidative stress markers in CSF samples.
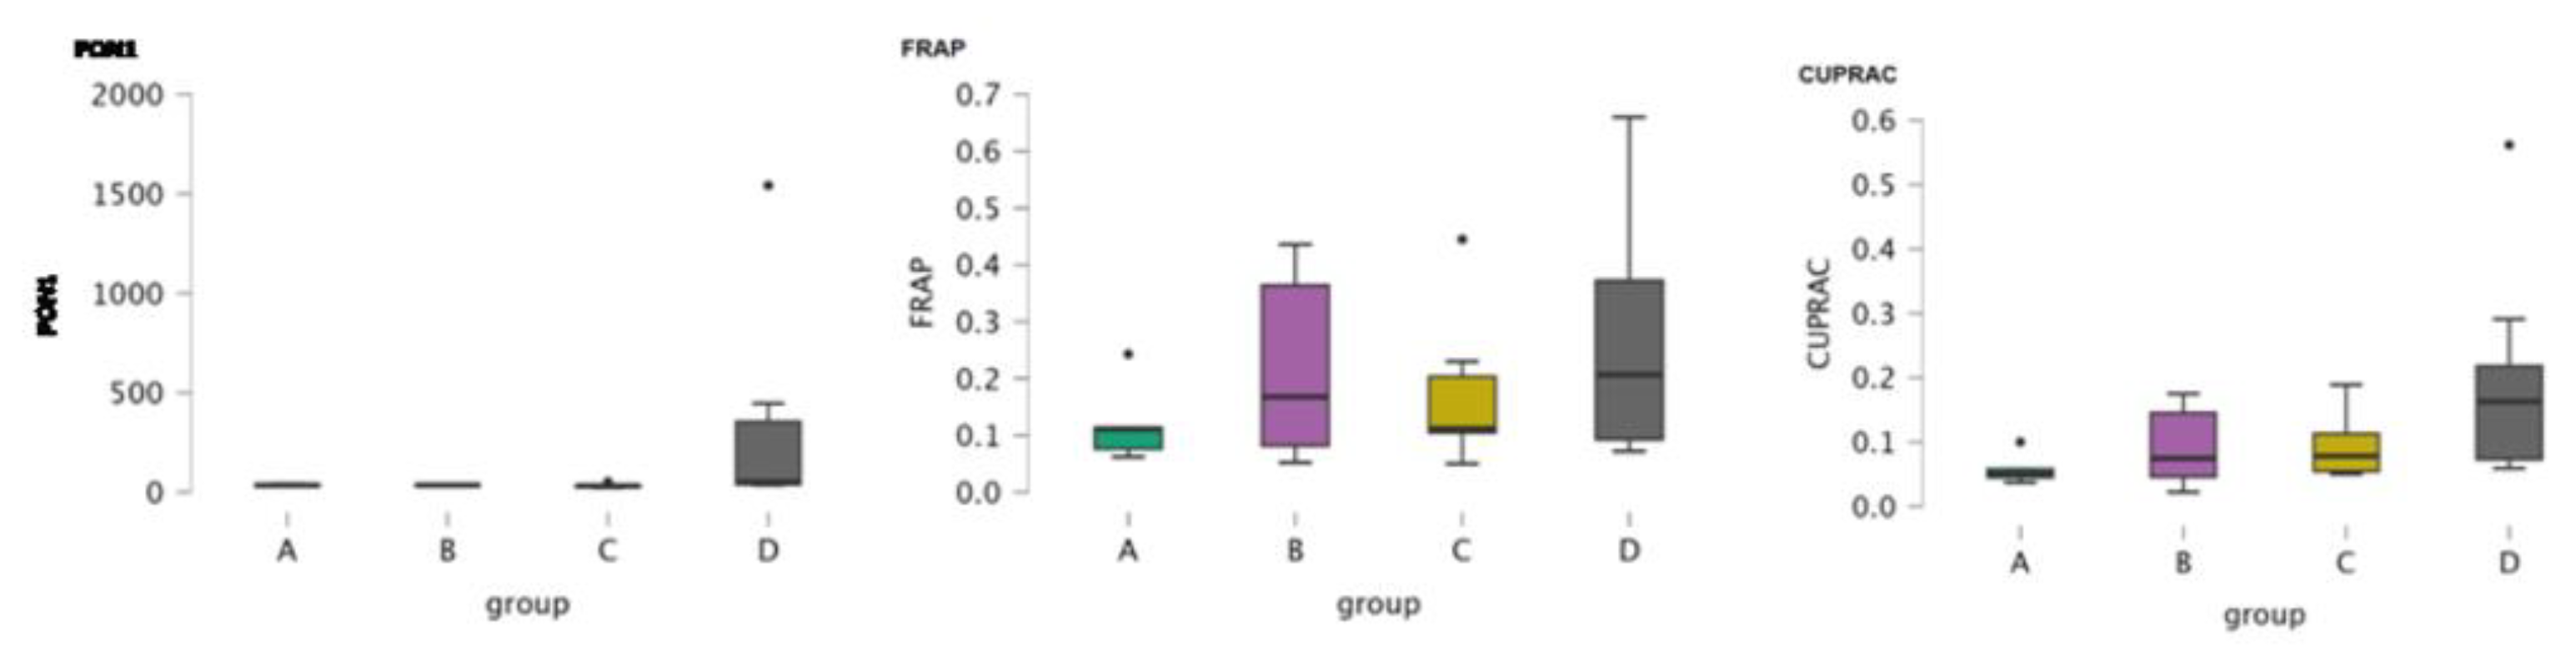
Figure 5.
Boxplot of the concentration of cholinesterase in CSF samples.

Figure 6.
Boxplot of the concentration of oxytocin in CSF samples.
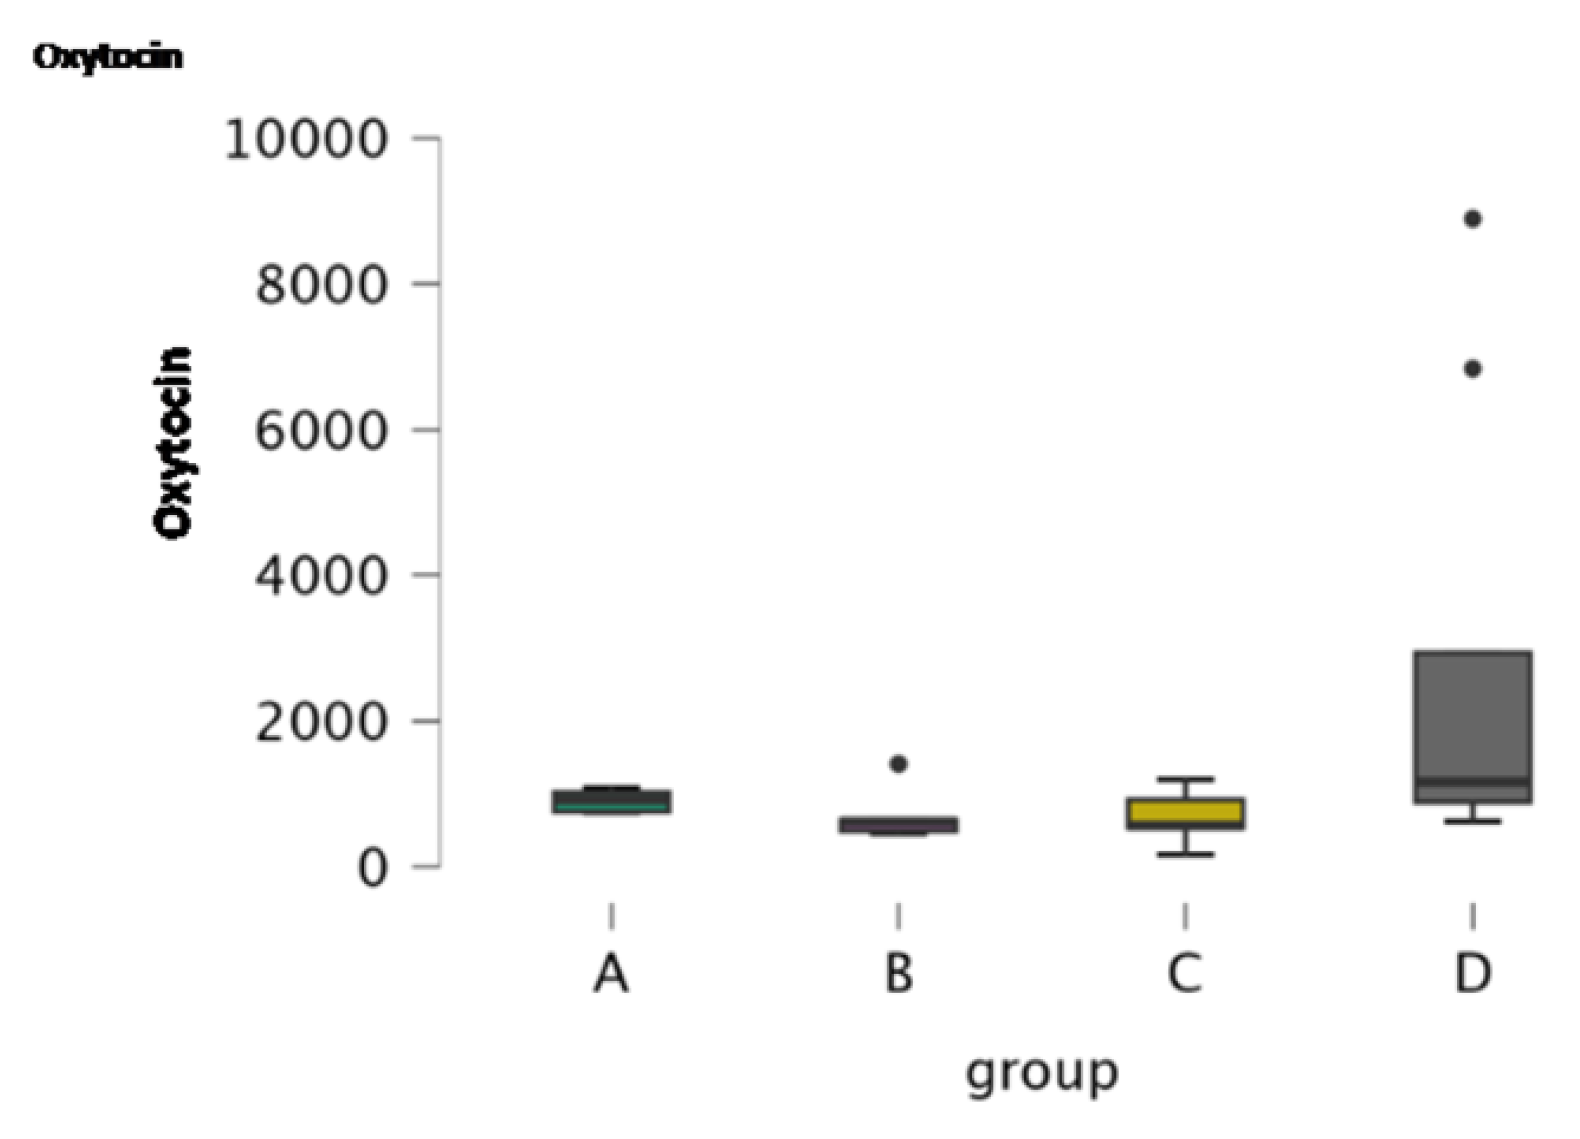

Table 1.
Descriptive statistics of the serum oxidative stress parameters, cholinesterase and c- reactive protein (CRP).
Table 1.
Descriptive statistics of the serum oxidative stress parameters, cholinesterase and c- reactive protein (CRP).
| Parameters | PON1 | CUPRAC | Cholinesterase | CRP | |||||||||||||
|---|---|---|---|---|---|---|---|---|---|---|---|---|---|---|---|---|---|
| Groups | A | B | C | D | A | B | C | D | A | B | C | D | A | B | C | D | |
| Valid | 8 | 15 | 11 | 17 | 8 | 15 | 11 | 17 | 8 | 15 | 11 | 17 | 8 | 15 | 11 | 17 | |
| Missing | 0 | 0 | 0 | 0 | 0 | 0 | 0 | 0 | 0 | 0 | 0 | 0 | 0 | 0 | 0 | 0 | |
| Median | 3.220 | 3.410 | 3.500 | 3.470 | 0.167 | 0.170 | 0.159 | 0.151 | 4.100 | 4.000 | 3.500 | 4.100 | 5.550 | 4.100 | 3.400 | 3.800 | |
| Mean | 3.231 | 3.557 | 3.586 | 3.400 | 0.171 | 0.179 | 0.163 | 0.164 | 4.125 | 3.827 | 3.436 | 4.306 | 10.338 | 11.860 | 3.464 | 11.629 | |
| Std. Deviation | 0.583 | 0.937 | 0.337 | 0.867 | 0.027 | 0.037 | 0.010 | 0.047 | 0.880 | 1.065 | 0.757 | 1.682 | 7.773 | 23.722 | 0.904 | 16.521 | |
| 95% CI Std. Dev. Upper | 1.186 | 1.478 | 0.592 | 1.320 | 0.056 | 0.059 | 0.018 | 0.071 | 1.790 | 1.680 | 1.328 | 2.561 | 15.820 | 37.412 | 1.586 | 25.143 | |
| 95% CI Std. Dev. Lower | 0.385 | 0.686 | 0.236 | 0.646 | 0.018 | 0.027 | 0.007 | 0.035 | 0.582 | 0.780 | 0.529 | 1.253 | 5.139 | 17.368 | 0.631 | 12.304 | |
| Skewness | -0.513 | 0.339 | 0.267 | -0.013 | 0.160 | 1.395 | 0.473 | 0.674 | 0.740 | 0.094 | 0.163 | 2.290 | 0.668 | 3.612 | 0.039 | 2.678 | |
| Std. Error of Skewness | 0.752 | 0.580 | 0.661 | 0.550 | 0.752 | 0.580 | 0.661 | 0.550 | 0.752 | 0.580 | 0.661 | 0.550 | 0.752 | 0.580 | 0.661 | 0.550 | |
| Kurtosis | -0.558 | -0.272 | -1.479 | -0.059 | -2.208 | 3.976 | -1.230 | -0.271 | 1.017 | 0.407 | -0.847 | 7.039 | -1.941 | 13.478 | 0.288 | 7.838 | |
| Std. Error of Kurtosis | 1.481 | 1.121 | 1.279 | 1.063 | 1.481 | 1.121 | 1.279 | 1.063 | 1.481 | 1.121 | 1.279 | 1.063 | 1.481 | 1.121 | 1.279 | 1.063 | |
| Shapiro-Wilk | 0.935 | 0.958 | 0.924 | 0.979 | 0.864 | 0.868 | 0.918 | 0.925 | 0.949 | 0.971 | 0.967 | 0.778 | 0.773 | 0.438 | 0.979 | 0.613 | |
| P-value of Shapiro-Wilk | 0.561 | 0.657 | 0.351 | 0.950 | 0.131 | 0.032 | 0.303 | 0.181 | 0.706 | 0.872 | 0.860 | 0.001 | 0.015 | 1.150×10⁻⁶ | 0.961 | 1.386×10⁻⁵ | |
| Minimum | 2.240 | 1.890 | 3.170 | 1.780 | 0.140 | 0.120 | 0.150 | 0.088 | 3.000 | 1.900 | 2.300 | 2.600 | 3.100 | 1.500 | 1.800 | 2.300 | |
| Maximum | 3.890 | 5.240 | 4.130 | 5.190 | 0.207 | 0.283 | 0.180 | 0.253 | 5.800 | 6.100 | 4.700 | 9.800 | 21.700 | 95.800 | 5.100 | 66.600 | |
Table 2.
Post-Hoc comparisons for oxidative stress markers, cholinesterase and CRP in serum samples.
Table 2.
Post-Hoc comparisons for oxidative stress markers, cholinesterase and CRP in serum samples.
| Group comparisons | Mean Difference | SE | df | t | pturkey | |
|---|---|---|---|---|---|---|
| PON1 | ||||||
| A | B | -0.326 | 0.337 | 47 | -0.968 | 0.768 |
| C | -0.355 | 0.358 | 47 | -0.993 | 0.754 | |
| D | -0.169 | 0.330 | 47 | -0.511 | 0.956 | |
| B | C | -0.029 | 0.306 | 47 | -0.095 | 1.000 |
| D | 0.157 | 0.273 | 47 | 0.577 | 0.938 | |
| C | D | 0.186 | 0.298 | 47 | 0.626 | 0.923 |
| CUPRAC | ||||||
| A | B | -0.008 | 0.016 | 47 | -0.496 | 0.960 |
| C | 0.008 | 0.017 | 47 | 0.492 | 0.960 | |
| D | 0.008 | 0.015 | 47 | 0.489 | 0.961 | |
| B | C | 0.016 | 0.014 | 47 | 1.123 | 0.677 |
| D | 0.015 | 0.013 | 47 | 1.205 | 0.627 | |
| C | D | -6.791×10⁻⁴ | 0.014 | 47 | -0.049 | 1.000 |
| Cholinesterase | ||||||
| A | B | 0.298 | 0.543 | 47 | 0.549 | 0.946 |
| C | 0.689 | 0.576 | 47 | 1.195 | 0.633 | |
| D | -0.181 | 0.532 | 47 | -0.340 | 0.986 | |
| B | C | 0.390 | 0.492 | 47 | 0.793 | 0.857 |
| D | -0.479 | 0.439 | 47 | -1.091 | 0.697 | |
| C | D | -0.870 | 0.480 | 47 | -1.812 | 0.281 |
| CRP | ||||||
| A | B | -0.326 | 0.337 | 47 | -0.968 | 0.768 |
| C | -0.355 | 0.358 | 47 | -0.993 | 0.754 | |
| D | -0.169 | 0.330 | 47 | -0.511 | 0.956 | |
| B | C | -0.029 | 0.306 | 47 | -0.095 | 1.000 |
| D | 0.157 | 0.273 | 47 | 0.577 | 0.938 | |
| C | D | 0.186 | 0.298 | 47 | 0.626 | 0.923 |
Note. P-value and confidence intervals of comparing a family of 4 estimates (confidence intervals corrected using turkey method.) for PON1 and CRP; Note 2. P-value adjusted for comparing a family of 4 estimates for CUPRAC and cholinesterase.
Table 3.
Kruskal-Wallis test for oxidative stress markers, cholinesterase and CRP in serum samples.
| PON1 | CUPRAC | Cholinesterase | CRP | ||
|---|---|---|---|---|---|
| Factor | group | group | group | group | |
| Statistic | 1.700 | 3.120 | 3.294 | 6.648 | |
| dF | 3 | 3 | 3 | 3 | |
| P | 0.637 | 0.374 | 0.348 | 0.084 | |
| Rank ε2 | 0.034 | 0.062 | 0.066 | 0.133 | |
| 95% CI for Rank ε2 | Lower | 0.009 | 0.010 | 0.017 | 0.059 |
| Upper | 0.272 | 0.358 | 0.299 | 0.305 | |
| Rank η2 | 0.000 | 0.003 | 0.006 | 0.078 | |
| 95% CI for Rank η2 | Lower | 0.000 | 0.000 | 0.000 | 0.016 |
| Upper | 0.174 | 0.295 | 0.229 | 0.296 |
Table 4.
Dunn’s Post-Hoc comparisons for oxidative stress markers, cholinesterase and CRP in serum samples.
Table 4.
Dunn’s Post-Hoc comparisons for oxidative stress markers, cholinesterase and CRP in serum samples.
| Comparisons | z | Wi | Wj | rrb | p | pbonf | pholm |
|---|---|---|---|---|---|---|---|
| PON1 | |||||||
| A - B | -0.809 | 20.938 | 26.200 | 0.167 | 0.419 | 1.000 | 1.000 |
| A - C | -1.299 | 20.938 | 29.909 | 0.409 | 0.194 | 1.000 | 1.000 |
| A - D | -0.744 | 20.938 | 25.676 | 0.184 | 0.457 | 1.000 | 1.000 |
| B - C | -0.629 | 26.200 | 29.909 | 0.152 | 0.530 | 1.000 | 1.000 |
| B - D | 0.099 | 26.200 | 25.676 | 0.043 | 0.921 | 1.000 | 1.000 |
| C - D | 0.736 | 29.909 | 25.676 | 0.134 | 0.462 | 1.000 | 1.000 |
| CUPRAC | |||||||
| A - B | -0.595 | 27.063 | 30.933 | 0.083 | 0.552 | 1.000 | 1.000 |
| A - C | 0.292 | 27.063 | 25.045 | 0.034 | 0.770 | 1.000 | 1.000 |
| A - D | 0.831 | 27.063 | 21.765 | 0.176 | 0.406 | 1.000 | 1.000 |
| B - C | 0.998 | 30.933 | 25.045 | 0.406 | 0.318 | 1.000 | 1.000 |
| B - D | 1.742 | 30.933 | 21.765 | 0.278 | 0.082 | 0.490 | 0.490 |
| C - D | 0.571 | 25.045 | 21.765 | 0.262 | 0.568 | 1.000 | 1.000 |
| Cholinesterase | |||||||
| A - B | 0.524 | 29.438 | 26.033 | 0.092 | 0.601 | 1.000 | 1.000 |
| A - C | 1.480 | 29.438 | 19.227 | 0.432 | 0.139 | 0.833 | 0.695 |
| A - D | 0.110 | 29.438 | 28.735 | 0.044 | 0.912 | 1.000 | 1.000 |
| B - C | 1.155 | 26.033 | 19.227 | 0.255 | 0.248 | 1.000 | 0.993 |
| B - D | -0.514 | 26.033 | 28.735 | 0.118 | 0.607 | 1.000 | 1.000 |
| C - D | -1.655 | 19.227 | 28.735 | 0.369 | 0.098 | 0.588 | 0.588 |
| CRP | |||||||
| A - B | -0.809 | 20.938 | 26.200 | 0.167 | 0.419 | 1.000 | 1.000 |
| A - C | -1.299 | 20.938 | 29.909 | 0.409 | 0.194 | 1.000 | 1.000 |
| A - D | -0.744 | 20.938 | 25.676 | 0.184 | 0.457 | 1.000 | 1.000 |
| B - C | -0.629 | 26.200 | 29.909 | 0.152 | 0.530 | 1.000 | 1.000 |
| B - D | 0.099 | 26.200 | 25.676 | 0.043 | 0.921 | 1.000 | 1.000 |
| C - D | 0.736 | 29.909 | 25.676 | 0.134 | 0.462 | 1.000 | 1.000 |
Note. Rank-biserial correlation based on individual Mann-Whitney tests.
Table 5.
Descriptive statistics of CSF oxidative stress and inflammatory markers, cholinesterase and oxytocin.
Table 5.
Descriptive statistics of CSF oxidative stress and inflammatory markers, cholinesterase and oxytocin.
| Parameters | PON1 | FRAP | Cholinestrase | CUPRAC | Oxytocin | |||||||||||||||
|---|---|---|---|---|---|---|---|---|---|---|---|---|---|---|---|---|---|---|---|---|
| Groups | A | B | C | D | A | B | C | D | A | B | C | D | A | B | C | D | A | B | C | D |
| Valid | 5 | 4 | 5 | 7 | 5 | 6 | 7 | 8 | 5 | 4 | 6 | 7 | 5 | 6 | 7 | 8 | 5 | 6 | 7 | 8 |
| Missing | 0 | 2 | 2 | 1 | 0 | 0 | 0 | 0 | 0 | 2 | 1 | 1 | 0 | 0 | 0 | 0 | 0 | 0 | 0 | 0 |
| Median | 34.100 | 34.800 | 31.000 | 51.000 | 0.111 | 0.167 | 0.112 | 0.206 | 58.000 | 65.600 | 77.550 | 152.700 | 0.050 | 0.074 | 0.078 | 0.163 | 912.920 | 615.285 | 561.190 | 1161.220 |
| Mean | 34.920 | 34.450 | 31.860 | 345.014 | 0.121 | 0.218 | 0.175 | 0.263 | 61.280 | 72.150 | 79.783 | 368.671 | 0.058 | 0.092 | 0.093 | 0.197 | 902.374 | 698.715 | 688.223 | 2746.130 |
| Std. Deviation | 5.186 | 3.580 | 12.054 | 551.093 | 0.072 | 0.171 | 0.133 | 0.208 | 13.030 | 20.756 | 37.847 | 454.231 | 0.025 | 0.064 | 0.052 | 0.167 | 151.306 | 358.166 | 343.063 | 3223.943 |
| Skewness | 0.931 | -0.549 | 1.502 | 2.238 | 1.705 | 0.492 | 1.704 | 1.008 | 0.131 | 1.431 | 0.274 | 2.038 | 1.720 | 0.467 | 1.261 | 1.760 | 0.023 | 2.142 | 0.017 | 1.521 |
| Std. Error of Skewness | 0.913 | 1.014 | 0.913 | 0.794 | 0.913 | 0.845 | 0.794 | 0.752 | 0.913 | 1.014 | 0.845 | 0.794 | 0.913 | 0.845 | 0.794 | 0.752 | 0.913 | 0.845 | 0.794 | 0.752 |
| Kurtosis | 0.139 | 0.952 | 2.565 | 5.186 | 3.215 | -2.187 | 3.133 | 0.387 | -0.393 | 1.739 | -1.070 | 4.165 | 3.235 | -1.954 | 0.740 | 3.379 | -2.550 | 4.890 | -0.364 | 0.726 |
| Std. Error of Kurtosis | 2.000 | 2.619 | 2.000 | 1.587 | 2.000 | 1.741 | 1.587 | 1.481 | 2.000 | 2.619 | 1.741 | 1.587 | 2.000 | 1.741 | 1.587 | 1.481 | 2.000 | 1.741 | 1.587 | 1.481 |
| Shapiro-Wilk | 0.902 | 0.982 | 0.851 | 0.658 | 0.816 | 0.851 | 0.826 | 0.866 | 0.978 | 0.867 | 0.961 | 0.709 | 0.831 | 0.892 | 0.846 | 0.805 | 0.902 | 0.700 | 0.964 | 0.690 |
| P-value of Shapiro-Wilk | 0.424 | 0.911 | 0.198 | 0.001 | 0.109 | 0.162 | 0.073 | 0.139 | 0.924 | 0.286 | 0.826 | 0.005 | 0.141 | 0.331 | 0.112 | 0.032 | 0.422 | 0.006 | 0.851 | 0.002 |
| Minimum | 30.300 | 29.800 | 21.200 | 34.600 | 0.062 | 0.052 | 0.050 | 0.072 | 44.400 | 55.800 | 34.000 | 85.800 | 0.037 | 0.022 | 0.050 | 0.059 | 743.270 | 454.080 | 164.890 | 619.650 |
| Maximum | 42.800 | 38.400 | 51.900 | 1542.700 | 0.243 | 0.436 | 0.445 | 0.660 | 78.600 | 101.600 | 133.800 | 1329.400 | 0.100 | 0.175 | 0.189 | 0.562 | 1081.760 | 1409.120 | 1195.170 | 8894.840 |
Table 6.
Post Hoc comparisons for oxidative stress markers (PON1, FRAP and CUPRAC), 11holinesterase in CSF samples.
Table 6.
Post Hoc comparisons for oxidative stress markers (PON1, FRAP and CUPRAC), 11holinesterase in CSF samples.
| Group comparisons | Mean Difference | SE | df | t | pturkey | |
|---|---|---|---|---|---|---|
| PON1 | ||||||
| A | B | 0.470 | 219.669 | 17 | 0.002 | 1.000 |
| C | 3.060 | 207.106 | 17 | 0.015 | 1.000 | |
| D | -310.094 | 191.743 | 17 | -1.617 | 0.396 | |
| B | C | 2.590 | 219.669 | 17 | 0.012 | 1.000 |
| D | -310.564 | 205.249 | 17 | -1.513 | 0.452 | |
| C | D | -313.154 | 191.743 | 17 | -1.633 | 0.387 |
| FRAP | ||||||
| A | B | -0.096 | 0.098 | 22 | -0.986 | 0.759 |
| C | -0.054 | 0.095 | 22 | -0.566 | 0.941 | |
| D | -0.141 | 0.092 | 22 | -1.534 | 0.435 | |
| B | C | 0.043 | 0.090 | 22 | 0.478 | 0.963 |
| D | -0.045 | 0.087 | 22 | -0.514 | 0.955 | |
| C | D | -0.088 | 0.084 | 22 | -1.050 | 0.723 |
| CUPRAC | ||||||
| A | B | -0.034 | 0.062 | 22 | -0.542 | 0.948 |
| C | -0.035 | 0.060 | 22 | -0.582 | 0.936 | |
| D | -0.139 | 0.059 | 22 | -2.367 | 0.113 | |
| B | C | -0.001 | 0.057 | 22 | -0.023 | 1.000 |
| D | -0.105 | 0.056 | 22 | -1.891 | 0.260 | |
| C | D | -0.104 | 0.053 | 22 | -1.949 | 0.237 |
| Cholinesterase | ||||||
| A | B | -10.870 | 176.571 | 18 | -0.062 | 1.000 |
| C | -18.503 | 159.385 | 18 | -0.116 | 0.999 | |
| D | -307.391 | 154.124 | 18 | -1.994 | 0.227 | |
| B | C | -7.633 | 169.905 | 18 | -0.045 | 1.000 |
| D | -296.521 | 164.980 | 18 | -1.797 | 0.307 | |
| C | D | -288.888 | 146.440 | 18 | -1.973 | 0.235 |
| Oxytocin | ||||||
| A | B | 203.659 | 1112.024 | 22 | 0.183 | 0.998 |
| C | 214.151 | 1075.313 | 22 | 0.199 | 0.997 | |
| D | -1843.756 | 1046.936 | 22 | -1.761 | 0.318 | |
| B | C | 10.492 | 1021.705 | 22 | 0.010 | 1.000 |
| D | -2047.415 | 991.794 | 22 | -2.064 | 0.196 | |
| C | D | -2057.907 | 950.451 | 22 | -2.165 | 0.164 |
Note. P-value adjusted for comparing a family of 4 estimates.
Table 7.
Kruskal-Wallis test for oxidative stress and inflammatory markers, cholinesterase and oxytocin in CSF samples.
Table 7.
Kruskal-Wallis test for oxidative stress and inflammatory markers, cholinesterase and oxytocin in CSF samples.
| PON1 | FRAP | CUPRAC | Cholinesterase | Oxytocin | ||
|---|---|---|---|---|---|---|
| Factor | group | group | group | group | group | |
| Statistic | 8.489 | 1.224 | 7.202 | 10.763 | 8.013 | |
| dF | 3 | 3 | 3 | 3 | 3 | |
| P | 0.037 | 0.747 | 0.066 | 0.013 | 0.046 | |
| Rank ε2 | 0.424 | 0.049 | 0.288 | 0.513 | 0.321 | |
| 95% CI for Rank ε2 | Lower | 0.179 | 0.011 | 0.110 | 0.379 | 0.113 |
| Upper | 0.824 | 0.403 | 0.687 | 0.797 | 0.645 | |
| Rank η2 | 0.323 | 0.000 | 0.191 | 0.431 | 0.228 | |
| 95% CI for Rank η2 | Lower | 0.108 | 0.000 | 1.106x10⁻⁴ | 0.254 | 0.000 |
| Upper | 0.706 | 0.322 | 0.642 | 0.813 | 0.665 |
Table 8.
Dunn’s Post-Hoc comparisons for oxidative stress markers, cholinesterase and oxytocin in CSF samples.
Table 8.
Dunn’s Post-Hoc comparisons for oxidative stress markers, cholinesterase and oxytocin in CSF samples.
| Comparisons | z | Wi | Wj | rrb | p | pbonf | pholm |
|---|---|---|---|---|---|---|---|
| PON1 | |||||||
| A - B | -0.006 | 9.100 | 9.125 | 0.050 | 0.995 | 1.000 | 1.000 |
| A - C | 0.586 | 9.100 | 6.800 | 0.280 | 0.558 | 1.000 | 1.000 |
| A - D | -2.018 | 9.100 | 16.429 | 0.771 | 0.044 | 0.262 | 0.218 |
| B - C | 0.559 | 9.125 | 6.800 | 0.400 | 0.576 | 1.000 | 1.000 |
| B - D | -1.879 | 9.125 | 16.429 | 0.786 | 0.060 | 0.362 | 0.241 |
| C - D | -2.651 | 6.800 | 16.429 | 0.771 | 0.008 | 0.048 | 0.048 |
| FRAP | |||||||
| A - B | -0.587 | 10.700 | 13.417 | 0.167 | 0.557 | 1.000 | 1.000 |
| A - C | -0.577 | 10.700 | 13.286 | 0.143 | 0.564 | 1.000 | 1.000 |
| A - D | -1.101 | 10.700 | 15.500 | 0.450 | 0.271 | 1.000 | 1.000 |
| B - C | 0.031 | 13.417 | 13.286 | 0.000 | 0.975 | 1.000 | 1.000 |
| B - D | -0.504 | 13.417 | 15.500 | 0.125 | 0.614 | 1.000 | 1.000 |
| C - D | -0.559 | 13.286 | 15.500 | 0.143 | 0.576 | 1.000 | 1.000 |
| CUPRAC | |||||||
| A - B | -0.879 | 7.600 | 11.667 | 0.200 | 0.380 | 1.000 | 0.759 |
| A - C | -1.255 | 7.600 | 13.214 | 0.543 | 0.210 | 1.000 | 0.629 |
| A - D | -2.574 | 7.600 | 18.813 | 0.850 | 0.010 | 0.060 | 0.060 |
| B - C | -0.364 | 11.667 | 13.214 | 0.095 | 0.716 | 1.000 | 0.759 |
| B - D | -1.731 | 11.667 | 18.813 | 0.500 | 0.083 | 0.500 | 0.417 |
| C - D | -1.415 | 13.214 | 18.813 | 0.482 | 0.157 | 0.942 | 0.628 |
| Cholinesterase | |||||||
| A - B | -0.539 | 6.400 | 8.750 | 0.300 | 0.590 | 1.000 | 1.000 |
| A - C | -0.958 | 6.400 | 10.167 | 0.333 | 0.338 | 1.000 | 1.000 |
| A - D | -3.013 | 6.400 | 17.857 | 1.000 | 0.003 | 0.016 | 0.016 |
| B - C | -0.338 | 8.750 | 10.167 | 0.167 | 0.735 | 1.000 | 1.000 |
| B - D | -2.238 | 8.750 | 17.857 | 0.857 | 0.025 | 0.151 | 0.126 |
| C - D | -2.129 | 10.167 | 17.857 | 0.714 | 0.033 | 0.200 | 0.133 |
| Oxytocin | |||||||
| A - B | 1.468 | 15.800 | 9.000 | 0.667 | 0.142 | 0.852 | 0.568 |
| A - C | 1.359 | 15.800 | 9.714 | 0.429 | 0.174 | 1.000 | 0.568 |
| A - D | -0.677 | 15.800 | 18.750 | 0.300 | 0.499 | 1.000 | 0.997 |
| B - C | -0.168 | 9.000 | 9.714 | 0.000 | 0.867 | 1.000 | 0.997 |
| B - D | -2.360 | 9.000 | 18.750 | 0.708 | 0.018 | 0.110 | 0.110 |
| C - D | -2.283 | 9.714 | 18.750 | 0.679 | 0.022 | 0.135 | 0.112 |
Note. Rank-biserial correlation based on individual Mann-Whitney tests.
Disclaimer/Publisher’s Note: The statements, opinions and data contained in all publications are solely those of the individual author(s) and contributor(s) and not of MDPI and/or the editor(s). MDPI and/or the editor(s) disclaim responsibility for any injury to people or property resulting from any ideas, methods, instructions or products referred to in the content. |
© 2025 by the authors. Licensee MDPI, Basel, Switzerland. This article is an open access article distributed under the terms and conditions of the Creative Commons Attribution (CC BY) license (http://creativecommons.org/licenses/by/4.0/).
Copyright: This open access article is published under a Creative Commons CC BY 4.0 license, which permit the free download, distribution, and reuse, provided that the author and preprint are cited in any reuse.


