Submitted:
17 December 2025
Posted:
17 December 2025
You are already at the latest version
Abstract
This study evaluated the life-cycle cost and financial sustainability of a fecal sludge management system using planted drying beds and constructed wetlands in Vientiane Capital, Lao PDR, with a focus on resource recovery from sludge-based fertilizers. Primary data were obtained from semi-structured interviews with key stakeholders and multi-year operational and financial records, complemented by regional benchmarking against com-parable systems in Southeast Asia (SEA). A 15-year life-cycle cost analysis, applying dis-count rates of 3–7% and inflation rates of 3–5%, encompassed capital, opera-ton-and-maintenance, replacement, and end-of-life costs, alongside a sensitivity analysis of key cost and revenue drivers. The system’s annualized cost of USD 237,072 contrasts with revenues of USD 100,822 per year from treatment fees and fertilizer sales, leaving a persistent financing gap of USD 136,250 per year (57.5% of total costs). Although unit treatment costs fall within the regional mid-range, the cost recovery rate of 42.5% is 1.2–1.8 times lower than that in comparable Southeast Asian cities, where cross-subsidies via water bills, stronger regulatory enforcement, and more mature fertilizer markets improve financial performance. The findings indicate that resource recovery alone cannot ensure financial self-sufficiency and highlight the need for integrated financing strategies, regulatory reforms to increase regular fecal sludge emptying, and expanded markets for re-source recovery products.
Keywords: Fecal sludge management; life cycle cost analysis; resource recovery; planted drying beds with constructed wetlands; urban sanitation services; financial gaps.
Keywords:
fecal sludge management
; life cycle cost analysis
; resource recovery
; planted drying beds with constructed wetlands
; urban sanitation services
; financial gaps
1. Introduction
Globally, billions of people lack access to safe sanitation and hygiene, exposing them to preventable diseases, environmental contamination, and social and economic exclusion. Despite progress in toilet construction, wastewater and fecal sludge often remain untreated or are inadequately managed, undermining public health and water quality. These persistent gaps indicate that expanding toilet access alone is insufficient. Effective management of fecal sludge across the entire sanitation chain is essential to achieving the water- and sanitation-related targets of the Sustainable Development Goals (SDG 6) [1,2,3]. These challenges are particularly acute in Southeast Asia, where rapid urbanization, limited sewerage coverage, and evolving regulatory frameworks are placing increasing pressure on fecal sludge management systems. In ASEAN countries, overall access to sanitation has increased, yet existing regulations frequently lag emerging technologies and do not fully support systematic fecal sludge management, indicating the need for updated standards and stronger institutional arrangements [4].
Within this regional context, Lao PDR illustrates an imbalance between rising sanitation coverage and the limited safe management of fecal sludge services. Nationally, most of the population now has access to basic sanitation and toilets, yet only a small number are connected to centralized sewerage, with the majority relying on on-site systems such as septic tanks and soak pits. In Vientiane Capital, where almost all households have access to basic sanitation, approximately 95% depend on on-site systems, while only approximately 1-2% are linked to sewerage networks. FSM services are largely on-demand rather than scheduled, are underfunded, and are weakly regulated, creating a high risk of uncontrolled sludge disposal to the environment [16].
These governance and financing constraints mirror the difficulties faced by many rapidly urbanizing cities seeking financially sustainable, resource-oriented fecal sludge management, underscoring the broader relevance of the Vientiane case. However, decision makers in Lao PDR still lack accurate, context-specific financial data on FSM costs and revenues to guide investment planning, tariff setting, and long-term financing strategies, as well as empirically grounded estimates of tariffs, cross-subsidies, and subsidy requirements [5,6,7].
Existing FSM cost studies frequently rely on assumptions, short time horizons, or data from other countries with different economic conditions, labor costs, and construction practices, limiting their applicability to Vientiane. Although life-cycle cost analysis is increasingly being used to compare sanitation options, empirical evidence on full-chain FSM costs, financing gaps, and the role of resource recovery in low-income urban areas remains scarce. Addressing these empirical and governance gaps in Vientiane provides an opportunity to generate context-specific life-cycle cost evidence that can inform tariff design, resource recovery strategies, and sustainable financing mechanisms in similar Southeast Asian cities. Based on this rationale, this study conducted a 15-year life-cycle cost analysis of an operational FSM system with planted drying beds and constructed wetlands in Vientiane Capital, combining quantitative financial data with stakeholder perspectives to assess financial sustainability and identify options to close the financing gap.
1.2. Literature Review
Most economic analyses of sanitation systems rely on model assumptions, data from capital-intensive engineered systems, or short time horizons (2-5 years) [6,7]. A critical shortfall is the absence of an empirical understanding of how costs and revenues are distributed across the entire FSM service chain, from household collection, private operator transport, and centralized treatment to end-of-life resource use). This gap is especially pronounced in low-income countries, where informal operators and mixed public-private arrangements dominate (Mills et al. 2020). International experience has demonstrated that underfunded operations and maintenance are the primary causes of treatment system failures [9]. However, most FSM feasibility studies emphasize capital costs while underestimating or ignoring the recurrent financing needs for staffing, maintenance, repair, and replacement [10]. This gap between design expectations and financial reality leads to project failure 5-10 years after the contract is signed [9]. Resource recovery from fecal sludge (nutrient reuse and compost production) is promoted as a pathway to financial sustainability; however, market feasibility remains poorly understood in the Southeast Asian context [11]. Sludge-based fertilizers often compete with subsidized mineral fertilizers and face farmer uncertainty regarding product quality and safety [11,12]. The scale and persistence of resource recovery revenue gaps have not been quantified in empirical studies [7]. FSM costs vary widely (USD 2-15/t globally, depending on technology, labor, and local conditions). In addition, Dodane et al. (2012) conducted a quantitative analysis of both capital and operational expenditures associated with full-scale fecal sludge management (FSM) and wastewater treatment systems in Dakar [13]. The findings indicate that FSM can constitute a substantial portion of the total urban sanitation costs, with expenses varying significantly depending on the technology and scale employed in the process. Nonetheless, few studies provide transparent comparative analyses within physical regions. This makes it difficult for planners to assess whether the proposed costs are competitive and which design choices optimize the cost-effectiveness [14].
This study extends existing FSM costing evidence by moving beyond global and modeled assessments to provide an empirical, full-chain life-cycle cost analysis of an operational fecal sludge treatment system in a lower-income, semi-centralized context in Southeast Asia (Southeast Asia). Whereas Daudey (2018) synthesizes unit costs across technologies and cities using heterogeneous secondary data, this study assembles multi-year financial, operational, and revenue records from a single system and applies a transparent LCCA framework that covers capital, operation and maintenance, replacement, and end-of-life costs [6]. In contrast to Mills et al. (2020), who emphasized how climate, contamination, and high-level investment needs shape citywide sanitation decisions, this study quantifies the concrete financing gap between annualized costs and revenues under locally observed tariffs, inflation, and discount rates, and tests its sensitivity to plausible macro-financial scenarios [7]. Building on McConville et al. (2019), which provides generic costing guidance for citywide FSM [8], the Vientiane analysis operationalizes these guidelines in a real municipal setting and couples them with qualitative insights on governance, tariff politics, and resource-recovery market constraints, thereby demonstrating how costing tools perform when confronted with incomplete records, mixed public-private arrangements, and politically constrained user fees.
1.3. Research Objectives and Questions
This study conducts a life-cycle cost analysis of an existing FSM system in Vientiane by combining quantitative financial data with qualitative stakeholder insights. The specific research questions were as follows.
(i) What are the complete life cycle costs (capital, operations, maintenance, replacement, and end-of-life) and revenue streams of an existing FSM system in Vientiane over a 15-year service life period?
(ii) What is the scale of the financing gap between annualized costs and revenues, and which cost drivers (e.g., capital vs. operation and maintenance vs. replacement) govern?
(iii) How do unit treatment costs and financing gaps in Vientiane compare with similar FSM systems in neighboring Southeast Asian contexts?
(iv) What are the perspectives of municipal authorities and private service providers regarding the barriers to cost recovery, operational challenges, and potential financing mechanisms?
(v) What evidence-based policy recommendations emerge for sustainable financing, tariff design, and regulatory arrangements for FSM in low-income urban settings?
The goal is to support more effective urban sanitation and resource recovery solutions suitable for developing countries, reduce exposure to fecal sludge, and enhance public health (SDG 6). Additionally, this study explored stakeholders’ understanding of sanitation benefits in relation to cost recovery. It offers evidence-based recommendations that extend beyond capital expenses to include all the relevant costs, thereby facilitating sustainable sanitation management and resource recovery.
2. Materials and Methods
Figure 1 presents the study area, which includes five districts located within the urban extent of Vientiane Capital, Lao PDR, covering a total land area of 605 km2 and accommodating a population of approximately 489,374 [15,16]. This area represents the most densely populated part of the capital.
This section describes the study area, data sources, life-cycle costing framework, financial assumptions, and analytical procedures used to evaluate the fecal sludge management system in Vientiane Capital. This study employs a mixed-methods case study design that combines a quantitative financial analysis with qualitative stakeholder perspectives.
2.1. Study Sample
The full FSM service chain involves four categories of stakeholders:
1) Local authority decision-makers (Vientiane City Office for Management and Services, n=3) Officials responsible for facility planning, budgeting, tariff setting, and policy oversight.
2) Fecal Sludge Treatment System staff (n=3): operators, supervisors, and maintenance workers
3) Private fecal sludge emptying operators (n=3): licensed companies providing collection and transport services.
4) Service Provider/Businesses (n=3): farmers purchasing and applying sludge-based fertilizer. Total sample: n=12 key informants.
The interviews were conducted in February 2023. This sample size aligns with commonly accepted minimum levels for qualitative saturation in semi-structured interview research and represents the complete institutional landscape of FSM service delivery in Vientiane [17].
2.2. Data Collection Methods
2.2.1. Semi-Structured Interviews
The interview themes were organized into five categories adapted from established FSM costing frameworks [8]
1) Capital Expenditure (CAPEX): Infrastructure investment, equipment procurement, land acquisition, design and engineering costs, government or donor support, and cost escalation patterns
2) Operating Expenditure (OPEX): staffing levels and salary scales, routine maintenance schedules and costs, emergency repairs, spare parts availability and pricing, and administration.
3) Resource Recovery and Revenue: Fecal sludge volumes, treatment capacity utilization, fertilizer production and sales volumes, market prices and price stability, buyer types, and demand constraints.
4) Financial Oversight and Cost Recovery: tariff structures and mechanisms, fee collection rates and payment discipline, subsidy arrangements, financial audits and accounting practices, cost monitoring systems
5) Governance Barriers: regulatory enforcement gaps, institutional coordination challenges, stakeholder perspectives on financing mechanisms, private sector participation constraints, and identified solutions.
The interview protocols were piloted with two key informants to ensure clarity, cultural appropriateness, and relevance before the full data collection. The interview duration ranged from 60 to 90 minutes. Interviews were conducted in the Lao language by the lead author, with written note-taking and respondents’ validation of verbal summaries to ensure accuracy. No audio recording was used; instead, key numerical data (costs, volumes, prices) were photographed directly from facility records to maximize data precision and respondent comfort. The interview transcripts were manually coded in English using a deductive thematic analysis framework aligned with the five interview categories outlined above.
Supplementary data were compiled from the following sources: 1) financial records (2018-2023): monthly payroll, maintenance expenditure logs, and equipment replacement records; 2) operational data: monthly fecal sludge treatment volume (t/day), loading rates, and processing performance; 3) revenue documentation: monthly treatment fee collection and annual fertilizer sales records (volume, price, and buyer type); and 4) technical facility specifications: treatment design capacity, land area, equipment inventory, and design life assumptions. These records were reviewed during site visits and cross-checked with staff interviews to determine their accuracy. Together, the interview and documentary data provided the cost, volume, and revenue inputs required for the life-cycle cost analysis framework described in Section 2.3.
2.3. Life-Cycle Cost Analysis Framework and Equations
Life-cycle cost analysis (LCCA) was applied following the approaches used in prior infrastructure and sanitation studies and fecal sludge management costing guidance [18,19,20,21]. The analysis assumed a 15-year service life, reflecting a typical design life for fecal sludge treatment plants, and expressed all costs in USD.
Four main cost categories were identified: capital, operation and maintenance, replacement, and end-of-life. Salvage value was treated as a negative cost at the end of the analysis period. Capital costs comprise initial investments for land acquisition, civil works, mechanical and electrical equipment, and design and construction services, discounted to the present value. O&M costs include recurring annual expenses for staffing, routine maintenance, spare parts, utilities, and consumable supplies, projected over 15 years with a 4% annual escalation to account for inflation. The replacement costs covered the scheduled renewal of major equipment or infrastructure components with technical lifetimes shorter than the 15-year analysis period, with each replacement outlay discounted back to year zero. End-of-life costs covered the decommissioning of treatment units, rehabilitation of land and site works, and disposal of equipment and residual structures in year 15, which were also discounted to the present value. The salvage value represents the residual economic value of land and long-lived assets (for example, administrative buildings or durable civil works) remaining at the end of the analysis period and is deducted from the total costs as terminal credit.
2.3.1. Annualized Capital Cost Calculation
The Capital Recovery Factor (CRF) converts lump-sum capital costs into equivalent annual costs (USD).
where i is the real discount rate (annual %) and n is the analysis period (years).
2.3.2. Net Present Value (NPV)
Future costs and revenues are discounted to present value (Year 0) using:
where = nominal (inflation-adjusted) cost in year ; the nominal discount rate, represents the years from the base year.
2.3.3. Total Life Cycle Cost (LCC)
where is the real discount rate (5% baseline), and = replacement costs in year .
2.3.4. Unit Treatment Cost (USD/Tone)
The financial parameters and scenario configurations applied to these equations are detailed in Section 2.4.
2.4. Financial Parameters and Scenarios
The analysis assumed a project service life of 15 years. This was combined with a baseline discount rate of 5%, selected to reflect the typical commercial lending interest rates observed in Lao PDR in 2024. Operating and maintenance (O&M) costs were assumed to increase at an annual inflation rate of 4%. The treatment facility is assumed to operate at 100% of its nominal treatment capacity for costing purposes, which is conservative compared to the observed average utilization levels of approximately 85–90% from historical operational data. Life-cycle cost analysis was conducted according to internationally established protocols [18,22]. The annualized capital cost and net present value calculations were performed using the capital recovery factor (CRF) and discounted cash flow methods, as outlined below.
Figure 2 presents the technical specifications for fecal sludge treatment, which involves a sand layer underlain by gravel, enclosed within low walls, and equipped with an underdrain system to collect the liquid percolating through the bed. Wet sludge was deposited onto the bed and left to allow water to percolate through and evaporate from the surface until the material was sufficiently dried for removal, using spades or other appropriate equipment. The primary function of this system is to dewater the sludge and separate solids from the liquid. The performance of planted drying beds in fecal sludge treatment systems (FSTS) can be evaluated based on the solids and pathogen content of the dried sludge and the quality of the percolate [21].
2.5. Data Analysis Methods
Using the life-cycle cost analysis framework and financial scenarios described in Section 2.3 and Section 2.4, the quantitative analysis comprised three main components. All financial calculations were performed using Microsoft Excel 2021 using the cost recovery factor (CRF) and NPV equations. The cost data are expressed in USD. The total life-cycle costs were disaggregated by component category (capital, labor, maintenance, and equipment replacement costs) to identify the main cost drivers within the Fecal Sludge Treatment system. Life-cycle costs (LCC), net present value (NPV), and unit treatment costs were compared across multiple discount rate scenarios. This approach tests the robustness of the conclusions under different economic conditions and financing assumptions, reflecting the range of real-world discount rates that project implementers might face depending on the funding source. The unit costs for fecal sludge treatment in Vientiane (expressed as USD/ton) were systematically compared with published cost data for similar decentralized or semi-centralized treatment systems operating in Thailand, Vietnam, Cambodia, and Bangladesh. This regional benchmarking contextualizes Vientiane’s costs within the broader Southeast Asian sanitation landscape, identifies cost competitiveness, and signals opportunities for technology transfer or process optimization based on regional best practices.
The interview data were analyzed using a structured thematic analysis approach serving as a reference to ensure systematic and transparent coding in research focused on costs and uncertainties [23]. The coding categories were deductively developed from the interview guide to maintain a close alignment between data collection and analysis. Consistency was verified across three data sources: (1) quantitative records, (2) interview responses from different stakeholder types, and (3) published benchmarks from comparable systems (Patton 2015).
3. Results
3.1. Qualitative Interviews
3.1.1. Capital and Operation Cost Barriers
This subsection presents qualitative interview findings that contextualize the subsequent cost and life cycle analysis. A treatment system was established with international donor support. However, existing operation and maintenance (O&M) allocations are inadequate to sustain an efficient treatment system. Reported salaries for plant staff (approximately USD 300/month in 2023), were described as uncompetitive compared to private sector opportunities, leading to high staff turnover and the repeated retraining of new operators. These salary records represent the staffing cost baseline and the Annual Operational Expenditure (OPEX).
Across stakeholder groups, the respondents identified constrained and volatile markets for sludge-derived fertilizers as a significant limitation to the financial sustainability of resource recovery facilities. Participants reported high seasonality in demand, with compost sales declining by approximately 50% during the agricultural off-season. They noted that competition from business firms selling subsidized fertilizers at approximately USD 20/t makes it challenging to market compost at approximately USD 35/t. This represents the unit price applied to the revenue calculations. Historical data confirm these market constraints, showing a ±15% year-to-year variation in fertilizer sales volume.
3.1.2. Governance and Institutional Gaps
Regulatory and institutional shortcomings significantly weaken both the demand for formal FSM services and the ability to recover treatment facility costs. At the time of data collection, no enforceable regulations required regular septic tank emptying or treatment and households were not obligated to use licensed providers. Consequently, the participants estimated that approximately 40% of the fecal sludge remained untreated. The tariff setting was further described as politically constrained, and the prevailing treatment tariff of USD 0.46/t was estimated to cover only 30–40% of the actual service costs. Participants reported that the local government was unable to approve higher tariffs because of anticipated public resistance, resulting in recurrent operating deficits that must be absorbed by municipal authorities. Stakeholders have proposed mechanisms to enhance FSM financial sustainability. First, cross-subsidization through the integration of FSM charges into water utility bills, already applied in parts of Thailand and Vietnam, was considered a promising strategy for stabilizing revenue and distributing costs across a broader customer base. Second, respondents suggested performance-based incentives, including agricultural extension programs, to certify sludge-based fertilizers and facilitate contracted buyer relationships to reduce the market risk for resource recovery products. Third, interviewees expressed interest in improved sludge management and public–private partnership models, in which private operators would be engaged through output-based contracts rather than operation and maintenance subsidies, with payments aligned with certifiable collection and treatment performance.
3.2. Capital and Operating Costs
Building on these qualitative insights, we quantify the capital costs, operating expenditures, and revenue streams of the FSM system. Table 1 presents the estimated capital cost of a fecal sludge treatment system employing drying beds with constructed wetlands. Detailed information on the treatment system design, capacity, and materials was obtained from previous project documentation and technical handbooks [30]. This categorical methodology for capital cost estimation is based on previously executed projects, thereby enhancing the transparency and reliability of the analysis. Such comprehensive breakdowns are indispensable for feasibility studies, life-cycle cost assessments, and comparative evaluations, thereby supporting both academic research and practical decision-making in the development of sanitation infrastructure projects. The total capital cost of the 150 m3/day treatment facility was USD 1,575,000, with treatment equipment costing USD 650,000 (40%), followed by civil works and construction at USD 500,000 (32%). Design and engineering costs accounted for USD 150,000 (10%), project management for USD 80,000 (5%), permits and environmental studies for USD 50,000 (3%), equipment installation for USD 65,000 (4%), and contingency for USD 80,000 (6%). This capital cost serves as the baseline for all subsequent life-cycle cost calculations.
Table 2 presents the annual operational expenditure (OPEX) associated with fecal sludge treatment systems that utilize drying beds and constructed wetlands. This table delineates the principal annual operating costs, including manpower, staff salaries, replacement and repair, routine maintenance, and other administrative expenses of facilities. Cost data pertaining to operations and expenditures were acquired through direct interviews and historical records (2018-2023), whereas information on resource recovery revenue was obtained through interviews with the Vientiane City Office of Management and Services. The total annual OPEX is USD 60,000, comprising staffing costs of USD 18,000 (30%), replacement and emergency repairs of USD 18,000 (30%), routine maintenance of USD 10,000 (17%), administrative and overhead costs of USD 8,000 (13%), laboratory and quality monitoring of USD 3,000 (5%), training and capacity building of USD 1,500 (2%), and contingency costs of USD 1,300 (2%). Staffing costs were distributed across one plant operator at USD 300/month (USD 3,600/year), two guards and security personnel at USD 300/month each (USD 7,200/year), and two sanitary workers at USD 300/month each (USD 7,200/year). These values were derived from stakeholder interviews and were consistent across all the scenarios.
Source:
(1) Operation and Expenditure obtained from direct interview and historical record. Revenue from resource recovery was obtained through director interviews with the Vientiane City Office of Management and Services.
Table 3 presents the annual revenue from resource recovery in fecal sludge treatment systems, which is primarily generated through two main sources: treatment fees and the sale of processed sludge as a fertilizer. These revenues were estimated based on the actual quantities processed and the prevailing market rates, ensuring that the calculations reflected real-world operations and values. The inclusion of compost sales using the median from five years of data (2018-2023), strengthened the reliability of the revenue data by minimizing the impact of year-to-year variability. The key revenue findings. Fertilizer revenue was calculated from the processed fecal sludge volumes: 45,625 t/year processed sludge × 5% total solids (TS) recovery = 2,281 t/year of the final product. The tariff of USD 0.46/t reflects the politically constrained rate noted in the qualitative interviews (Section 3.1.2), whereas a fertilizer price of USD 35/ton represents the prevailing market rate identified by stakeholder interviews (Section 3.1.1). Historical data (2018-2023) show a ±15% year-to-year variation in fertilizer sales volume due to seasonal demand and buyer credit constraints, and treatment fee collection rates averaged at 85%.
Source:
- (1)
- Revenue from resource recovery was obtained through director interviews with the Vientiane City
Office of Management and Services.
Note:
Historical data (2018-2023) show a ±15% year-to-year variation in fertilizer sales volume due to seasonal demand and buyer credit constraints. The fertilizer prices remained relatively stable (USD 32-38/t) throughout the study period. The average treatment fee collection rate was 85% (n=6 years of historical data).
3.4. Life-Cycle Costs Analysis (Annualized Costs, Revenues, and Financing Gap)
Using the component cost and revenue estimates described above, life-cycle cost analysis yields the following annualized costs, revenues, and financing gaps under alternative discount rate scenarios. Table 4 presents the life-cycle cost and net benefit evaluation across the three discount rates (3%, 5%, and 7%) over 15 years. This means that user charges cover only 42.5% of the necessary funding, requiring the remainder (USD 136,250/year, or 57.5% of the costs) from subsidies or external support. As shown in Table 6, the discount rate converts future cash flows into present values. As the rate increases from 3% to 7%, the discount factor for 15 years decreases from 0.642 to 0.359, thereby reducing the weight of future expenditure and revenue in present-value terms. While a capital cost of USD 1,575,000 remains unaffected as an upfront investment, the present value of operating expenditures (OPEX) and revenues varies with the rate. The net present value of OPEX decreases from USD 152,167 at 3% to USD 114,035 at 5% (baseline) and USD 85,926 at 7%. Similarly, the net present value of revenue declines from USD 64,714 at 3% to USD 48,497 at 5% and USD 36,543 at 7%, showing a decreased present value of future payments at higher rates.
The integration of the capital and discounted operating costs yields the total life-cycle cost for each scenario. At a 3% discount rate, the total life-cycle cost was USD 1,662,453, decreasing to USD 1,640,538 at 5% (baseline) and USD 1,624,383 at 7%. This decline indicates that project costs are mainly influenced by the initial capital investment, which remains constant, whereas discounted operating expenditure (OPEX) is reduced at a higher rate. Because the capital cost is substantial and fixed, and revenue is inadequate to cover annualized costs, the system shows a persistent financing gap across all scenarios). Thus, external funding is essential for the long-term sustainability of a project.
3.5. Sensitivity Analysis
To assess the robustness of these estimates, a sensitivity analysis was conducted to explore how varying discount and inflation rates affect total life-cycle costs, annualized costs, and unit costs. Table 5 presents the sensitivity analysis results across three scenarios: a 3% discount rate with 4% inflation (low-cost scenario), 5% discount rate with 4% inflation (baseline scenario), and 7% discount rate with 5% inflation (high-cost scenario), consistent with the framework outlined in Section 2.4. The findings demonstrate how discount and inflation rates impact the present value, annualized cost, and unit cost of the fecal sludge management system over 15 years.
Higher discount rates reduce the present value of future cash flows and lower the total life cycle cost. However, when the discount rate increases from 3% to 7% (with inflation rising from 4% to 5%), the net present value (NPV) of operating expenses decreases from USD 179,649 to USD 94,736, and revenue NPV declines from USD 64,714 to USD 36,343. The transition from 3%/4% to 5%/4% reduces the annualized cost from USD 279,877 to USD 237,072, reflecting the dominant effect of a lower discount rate. However, at 7%/5%, the annualized cost increases to USD 261,379/year because higher inflation partially offsets the benefits of stronger discounting. The unit cost follows the annualized cost trend, reaching a minimum of USD 6.93/t in the 5%/4% scenario (baseline), demonstrating that the most cost-efficient service delivery occurs at moderate financial parameters, rather than extreme discounts or inflation rates. These results show that cost estimates are sensitive to macroeconomic assumptions, with moderate discount rates yielding lower service costs than extreme discount rates. Practitioners must justify the selected rates and conduct sensitivity analyses to assess the robustness of unit cost estimates, as the choice of financial parameters can influence the apparent project costs by ±20%.
3.6. Regional Benchmarking: Comparative FSM Costs in Southeast Asia
Finally, to situate Vientiane’s FSM performance within the broader Southeast Asian context, unit treatment costs and cost recovery rates were compared with those from similar systems. Table 6 presents the comparative life-cycle costs of FSM systems in Southeast Asia. In the Vientiane case, the cost of fecal sludge treatment was estimated at USD 6.93/t, positioning it within the mid-range of regional benchmarks, which spanned from USD 4.8/t [24] to USD 10.2/t [25]. Despite this moderate unit cost, Vientiane faces a significant financing gap, with only 42.5% cost recovery compared with regional comparators, which range from 30% to 62%. Vientiane’s unit cost is directly comparable to a similar technological system [26]. However, Vientiane’s cost recovery rate is 1.2 to 1.8 times lower than that in Southeast Asia cities, where recovery rates range from 48% to 62%. This inequality is not attributable to higher technical costs but rather to tariff structures, service coverage, and market conditions for fertilizer products.
The relatively insufficient financial performance of Vientiane can be attributed to three primary cost drivers: (1) limited treatment capacity relative to the scale of capital investment, resulting in elevated unit costs; (2) reliance on imported mechanical equipment, which increases both capital and maintenance expenditures; and (3) an underdeveloped local market for fertilizer products derived from fecal sludge, which constrains resource recovery revenues. By contrast, Thailand and Vietnam achieve higher cost recovery and more sustainable financial performance through a combination of institutional and market mechanisms. First, both countries employ government-backed cross-subsidization by integrating sanitation charges into water billing systems, thereby ensuring a reliable revenue stream for Fecal Sludge Management (FSM) operations. Second, stronger regulatory enforcement of user fee collection ensures consistent financial contributions from households and desludging service providers. Third, the effective integration of agricultural extension services with sludge-derived fertilizer marketing has strengthened demand and improved the economic value of resource-recovery products. These factors collectively demonstrate how policy integration, market incentives, and economies of scale can enhance the financial viability of FSM systems in developing urban contexts, offering valuable insights for improving the cost recovery strategies in Vientiane.

| Regional | Technology | Capacity (m3/d) | Unit Cost (USD/t) | Cost Recovery Rate (%) | Study Year | Notes |
| Vientiane, Lao PDR (This Study) | Drying beds with wetlands | 150 | 6.93 | 42.5 | 2023 | Full-chain LCCA; empirical data |
| Bangkok, Thailand | Stabilization ponds | 250 | 4.80-5.20 | 38-45 | 2020 | Land-abundant; lower labor cost |
| Ho Chi Minh City, Vietnam | Drying beds with constructed wetlands | 180 | 5.50-6.10 | 48-52 | 2021 | Higher farmer demand for compost |
| Phnom Penh, Cambodia | Lagoons with wetlands | 200 | 7.80-8.50 | 35-40 | 2019 | Limited collection coverage; lower volumes |
| Dhaka, Bangladesh | Mechanical dewatering |
150 | 8.50-10.20 | 30-35 | 2020 | High equipment/import costs; market constraints |
4. Discussion
This study conducted a comprehensive life-cycle cost analysis of an operational fecal sludge treatment system in Vientiane to assess its financial sustainability under current tariffs and market conditions. The key finding is that despite the mid-range unit treatment costs relative to comparable Southeast Asian systems [6,14], the system cannot achieve financial self-sufficiency in the long run. The annualized cost of USD 237,072/year far exceeds the annual revenue of USD 100,822, leaving a persistent financing gap of USD 136,250/year (57.5% of the costs). This section examines the drivers of this gap and identifies options to improve financial sustainability [11,27].
4.1. Cost Structure and Operation and Maintenance
The cost breakdown shows that capital-intensive infrastructure dominates the financial landscape. An initial investment of USD 1,575,000 accounts for most of the discounted life-cycle costs across all discount rate scenarios [6,14]. This structure is typical for sanitation systems where large upfront costs are recovered through user fees [18]. However, the analysis also shows that ongoing operating expenses are significant; staffing and maintenance together make up about 60% of annual OPEX. Even more important, stakeholder interviews revealed that current salary levels (USD 300/month/person) are still too low to attract and keep skilled operators, leading to high staff turnover and operational vulnerability. Plant staff and municipal officials also reported repeated delays in maintenance, limited availability of spare parts, and emergency repairs done on an ad hoc basis, all of which reduce treatment performance over time [9]. This pattern is consistent with wider evidence that underfunded O&M is a major cause of treatment system failure within 5–10 years of installation [9,10].
4.2. Sensitivity to Discount Rate and Inflation Assumptions
Scenario and sensitivity analyses indicate that varying discount rates between 3% and 7%, combined with realistic inflation assumptions, have only a limited effect on total life-cycle costs and do not alter the conclusion that the system is financially unsustainable [22]. Higher discount rates reduce the present value of future O&M expenditures but also reduce the present value of future revenues, whereas large upfront capital costs continue to dominate the total LCC across scenarios [7,8]. The minimum unit cost of USD 6.93/m3 at a 5% discount rate and 4% inflation reflects a balance between discounting and cost escalation; however, user charges still cover less than half of the required funding [5]. These results highlight the need to explicitly justify financial parameters in FSM cost studies and to use sensitivity analysis rather than relying on a single nominal rate [6]. They also showed that adjusting discount and inflation rates alone cannot meaningfully reduce the financing gap in Vientiane; structural changes to tariffs, customer bases, and resource recovery markets are required [7,10]
4.3. Comparison with Regional Benchmarking
Benchmarking against systems in Thailand, Vietnam, Cambodia, and Bangladesh indicates that Vientiane’s challenges stem more from tariffs, coverage, and markets than from high, technical costs. The estimated unit cost of USD 6.93/t is comparable to systems using drying beds and wetlands in Ho Chi Minh City (USD 5.5–6.1/t); however, Vientiane’s cost recovery rate (42.5%) is 1.2–1.8 times lower than the 48–62% observed in other Asian cities [7,14]. This suggests that the core constraint is not technical inefficiency but the configuration of tariff levels, service coverage, and market integration of resource recovery products [8]. Three structural factors distinguish Vientiane from higher-performing systems: a relatively low effective treatment capacity compared with capital investment, which limits economies of scale [6]; reliance on imported mechanical equipment, which increases capital and maintenance costs and exposes the system to foreign exchange and supply chain risks [14]; and an underdeveloped market for sludge-based fertilizers, where compost competes with cheaper subsidized mineral fertilizers (approximately USD 20/t) and faces persistent farmer concerns about quality and safety [11,12]. These factors limit both throughput and revenue even when treatment technology is comparable to regional peers [7].
4.4. Governance and Regulation
Qualitative data indicate that governance and regulatory gaps substantially reduce the demand for formal FSM services and undermine cost recovery [5,8]., There was no enforceable requirement for regular septic tank emptying or the use of licensed operators, and stakeholders estimated that approximately 40% of fecal sludge was disposed of without treatment [2,3,28]. This undermines public and environmental health and erodes the revenue base because a large share of sludge bypasses formal systems [9]. Tariff-setting is further constrained by political and social considerations: the prevailing treatment fee of USD 0.46/t is estimated to cover only 30–40% of actual service costs, and local officials reported limited scope to increase tariffs owing to anticipated public resistance. The result is chronic operating deficits that must be absorbed by municipal budgets, illustrating a common political–economic challenge in FSM finance, where utilities are expected to achieve cost recovery within tariff regimes that do not reflect full life-cycle costs [7].
4.5. Resource Recovery
The analysis confirms that fertilizer sales make a meaningful but insufficient contribution to the cost recovery [7]. Annual revenues from approximately 2,281 t/y of composted sludge sold at approximately USD 35/t exceed treatment fee revenues but remain far below the level required to close the annual funding gap [7]. Historical records show ±15% variation in annual fertilizer sales volumes driven by seasonal demand and buyer credit constraints, which add financial uncertainty [11,12]. Stakeholders identified several barriers to scaling up sludge-derived fertilizer markets, including competition from subsidized mineral fertilizers, perceived lower reliability and quality, and limited agricultural extension support for their safe use and certification [11,12]. These findings align with regional evidence that full financial sustainability through resource recovery alone is unlikely in price-sensitive agricultural markets influenced by fertilizer subsidy regimes. Resource recovery should therefore be treated as an important co-benefit that partially offsets costs, not as a standalone financing strategy [7]
4.6. Financial Sustainability
The results point to the need for integrated financing strategies that combine improved cost recovery with targeted public support and regulatory reform [5]. Stakeholders have proposed several options, including integrating FSM charges into water utility billing, which has proven to be effective in Thailand and Vietnam. This approach enables utilities to distribute costs across a broader customer base and implement tariff reforms incrementally over several years, aligning user charges more closely with full life-cycle cost recovery without causing abrupt price for low-income households [14]. This strategy helps protect low-income households while simultaneously enhancing the medium-term financial sustainability of services tariff-setting benchmark [31].
In parallel, stronger regulatory enforcement of regular septic tank emptying and mandatory use of licensed operators would increase the volume of sludge entering the formal system, improving both public health outcomes and the revenue base for treatment facilities [2]. Performance-based contracts with private operators, linked to verifiable collection and treatment outcomes, can enhance service quality and reduce the risk of illegal dumping [7,8]. Finally, coordinated agricultural extension and certification programs for sludge-based fertilizers would help address farmers’ concerns, expand demand, and improve price realization for resource-recovery products, thereby increasing the contribution of compost revenues to overall cost recovery [11,12].
4.7. Contribution to FSM Costing
This study provides one of the first empirical full-chain life-cycle cost assessments for an operational fecal sludge treatment system in Lao PDR based on multi-year financial and operational records rather than modelled projections [6,7]. The combination of life cycle cost analysis, sensitivity analysis, and qualitative stakeholder perspectives offers a nuanced understanding of how costs, revenues, and governance arrangements interact to shape financial performance [8,32]. The findings underscore that sustainable FSM in rapidly urbanizing, lower-income contexts requires not only technically appropriate treatment technologies but also realistic tariffs, cross-subsidization mechanisms, and deliberate efforts to develop viable markets for resource recovery products, in alignment with SDG 6 and city-level planning [9,14].
5. Conclusions
This study conducted a life-cycle cost analysis to an operational fecal sludge management system using planted drying beds and constructed wetlands in Vientiane, based on multiyear financial and operational records and key stakeholder interviews. The main conclusions, significance, and policy implications are as follows.
- The system recovers only approximately 42.5% of its annualized costs, leaving a persistent financing gap of roughly USD 136,250 per year that must be covered by public subsidies or external support.
- Sensitivity analysis across realistic discount and inflation rates shows that this structural gap remains under plausible financial conditions, indicating that resource recovery revenue alone cannot achieve financial self-sufficiency.
- The financing gap is driven by three interrelated constraints: capital-intensive infrastructure with limited economies of scale, underfunded operations and maintenance, and weak demand for both formal fecal sludge management services and sludge-based fertilizers.
- Unit treatment costs are in the mid-range compared with similar systems in neighboring countries, but lower tariff levels, limited treatment coverage, and competition from subsidized fertilizers keep the cost-recovery rate well below that of regional peers.
These findings imply that sustainable FSM financing in similar contexts requires integrated strategies that combine gradual tariff reform with explicit cross-subsidization mechanisms (for example, via water bills or related utility charges) and reliable public funding for core O&M. Strengthened regulatory frameworks, such as enforceable requirements for regular septic tank emptying, mandatory use of licensed operators, and measures to reduce illegal dumping, are essential to increase the demand for formal services and expand the revenue base. Performance-based contracts with private operators, along with agricultural extension and certification for sludge-based fertilizers, can help improve service quality, stabilize fertilizer markets, and enhance the contribution of resource recovery to overall cost recovery. Methodologically, the study demonstrates the value of empirical, full-chain life-cycle cost analysis that integrates quantitative financial data with stakeholder perspectives, providing a transferable approach for other rapidly urbanizing low- and middle-income cities seeking to design financially realistic FSM investment and tariff plans for fecal sludge emptying.
Future research should extend the comparative LCCA across Southeast Asian FSM systems to refine regional cost benchmarks and identify technology–tariff–governance combinations that support financial sustainability under varying conditions. Long-term operational trajectories and the potential performance decline of treatment systems in resource-constrained settings warrant further investigation. Studies examining cross-subsidization models and regulatory enforcement mechanisms across governance contexts strengthen evidence for FSM financing reform.
Data Availability Statement
All data generated or analyzed during this study are included in this published article and its Supplementary Materials. Further inquiries can be directed to the corresponding author.
Acknowledgments
The author gratefully acknowledges the Department of Civil and Environmental Engineering at Ritsumeikan University for supporting the survey interviews and field visits conducted for this case study in Vientiane, Lao PDR. We appreciate the local authorities for their collaboration and all households participating in the survey, whose cooperation facilitated the collection of valuable data and information. The authors also thank those who provided advice and opinions, which contributed significantly to the development of this study.
Conflicts of Interest
The authors declare that this research was carried out without any commercial or financial relationships that could be construed as a potential conflict of interest.
Abbreviations
| ASEAN | Association of Southeast Asian Nations |
| CAPEX | Capital Expenditure |
| CRF | Capital Recovery Factor |
| EOL | End-of-life (costs) |
| FSM | Fecal Sludge Management |
| FSTS | Fecal Sludge Treatment System |
| GGGI | Global Green Growth Institute |
| LCC | Life Cycle Cost |
| LCCA | Life-Cycle Cost Analysis |
| Lao PDR | Lao People’s Democratic Republic |
| NPV | Net Present Value |
| O&M | Operation and Maintenance |
| OPEX | Operating Expenditure / Operational Expenditure |
| SDG | Sustainable Development Goal |
| SEA | Southeast Asia |
| TS | Total Solids |
| t | (Tone) |
| USD | United States Dollar |
| WHO/UNICEF | World Health Organization / United Nations Children’s Fund (Joint Monitoring context) |
References
- UN-Water. Sustainable Development Goal 6 Synthesis Report on Water and Sanitation 2025; UN-Water: Geneva, Switzerland, 2025.
- WHO/UNICEF Joint Monitoring Programme for Water Supply, Sanitation and Hygiene. Progress on Household Drinking Water, Sanitation and Hygiene 2000–2020: Five Years into the SDGs; WHO/UNICEF: New York, NY, USA, 2021.
- WHO/UNICEF Joint Monitoring Programme for Water Supply, Sanitation and Hygiene. Progress on Drinking Water, Sanitation and Hygiene in Schools: 2000–2021 Data Update; WHO/UNICEF: New York, NY, USA, 2022.
- Japan Integration ASEAN Fund (JIAF). Policy Dialogue and Network Building of Multi-Stakeholders on Integrated Decentralized Domestic Wastewater Management in ASEAN Countries; JIAF: Tokyo, Japan, 2020.
- Sanitation and Water for All. Lao PDR: WASH Country Overview; SWA: New York, NY, USA, 2020.
- Daudey, L. The cost of urban sanitation solutions: A literature review. J. Water Sanit. Hyg. Dev. 2018, 8, 176–195. [CrossRef]
- Mills, F.; Willetts, J.; Petterson, S.; Mitchell, C.; Norman, G. Costs, climate and contamination: Three drivers for citywide sanitation investment. Front. Environ. Sci. 2020, 8, 130. [CrossRef]
- McConville, J.R.; Kvarnström, E.; Maiteki, J.; Niwagaba, C. Costing guidance for citywide fecal sludge management services. J. Water Sanit. Hyg. Dev. 2019, 9, 454–466.
- WaterAid. Sustainability of Water, Sanitation and Hygiene Interventions in South Asia: Lessons from the Field; WaterAid Asia Regional Office: Kathmandu, Nepal, 2019.
- Schrecongost, A.; Pedi, D.; Rosenboom, J.W.; Shrestha, R.; Ban, R. Citywide inclusive sanitation: A public service approach for reaching the urban sanitation SDGs. Front. Environ. Sci. 2020, 8, 19. [CrossRef]
- Poortvliet, P.M.; Sanders, L.; van den Berg, C. Drivers and barriers for adoption of resource recovery from sanitation. Resour. Conserv. Recycl. 2017, 123, 204–215. [CrossRef]
- Tanoh, R.; Nikiema, J.; Asiedu, Z.; Jayathilake, N.; Cofie, O. The contribution of tipping fees to the operation, maintenance, and management of fecal sludge treatment plants: The case of Ghana. J. Environ. Manag. 2022, 307, 114477.
- Dodane, P.-H.; Mbéguéré, M.; Ousmane, S.; Strande, L. Capital and operating costs of full-scale fecal sludge management and wastewater treatment systems in Dakar, Senegal. Environ. Sci. Technol. 2012, 46, 3705–3711. [CrossRef]
- Nair, A.; Kumar, D.; Dixit, S. Cost-effectiveness of fecal sludge management technologies in South Asia. Environ. Sci. Technol. 2021, 55, 8456–8471.
- Ministry of Public Works and Transport, Department of Housing and Urban Planning. Urban Master Plan of Vientiane Capital 2030; MPWT: Vientiane, Lao PDR, 2019. (In Lao).
- Lao Statistics Bureau. Lao Social Indicator Survey II 2017: Survey Findings Report; Lao Statistics Bureau and UNICEF: Vientiane, Lao PDR, 2018.
- Miles, M.B.; Huberman, A.M.; Saldaña, J. Qualitative Data Analysis: A Methods Sourcebook, 3rd ed.; SAGE Publications, Inc.: Thousand Oaks, CA, USA, 2014.
- Arditi, D.; Messiha, H.M. Life-cycle cost analysis (LCCA) in municipal organizations. J. Infrastruct. Syst. 1999, 5, 1–10. [CrossRef]
- Carrard, N.; Jayathilake, N.; Willetts, J. Life-cycle costs of a resource-oriented sanitation system and implications for advancing a circular economy approach to sanitation. J. Clean. Prod. 2021, 307, 127135. [CrossRef]
- Eawag/Sandec. Sandec Training Tool 1.0—Module 5: Faecal Sludge Management; Eawag: Dübendorf, Switzerland, 2002.
- Eawag/Sandec. FSM Costing Guidelines and Assessment Tools; Swiss Federal Institute of Aquatic Science and Technology: Dübendorf, Switzerland, 2021.
- Lee, D.B. Fundamentals of life-cycle cost analysis. Transp. Res. Rec. 2002, 1812, 203–210.
- Barahmand, Z.; Eikeland, M.S. Life cycle assessment under uncertainty: A scoping review. World 2022, 3, 39. [CrossRef]
- Thongchai, P.; Napasintuwong, O. Life-cycle costs of fecal sludge management systems in Bangkok Metropolitan Area. Water Sci. Technol. 2020, 81, 2432–2449.
- Hoque, M.; Rahman, A.; Khan, M. Cost-effectiveness of fecal sludge treatment in Dhaka: Comparative analysis of technologies. Environ. Monit. Assess. 2020, 192, 213.
- Tran, T.; Nguyen, H.; Bui, V. Economic analysis of decentralized fecal sludge treatment systems in Ho Chi Minh City. J. Water Supply Res. Technol.—Aqua 2021, 70, 156–172.
- Diener, S.; Semiyaga, S.; Niwagaba, C.B.; Muspratt, A.M.; Gning, J.B.; Mbéguéré, M.; Ennin, J.E.; Zurbrügg, C.; Strande, L. A value proposition: Resource recovery from faecal sludge—Can it be the driver for improved sanitation? Resour. Conserv. Recycl. 2014, 88, 32–38. [CrossRef]
- Vientiane City Office for Management and Services. Operational records and financial data for fecal sludge management and resource recovery system in Vientiane Capital [Unpublished internal documents and interviews]; Vientiane City Office for Management and Services: Vientiane, Lao PDR, 2023.
- Andrés, L.A.; Saltiel, G.; Misra, S.; Joseph, G.; Lombana Cordoba, C.; Thibert, M.; Fenwick, C. Revisiting Water Pricing for Affordable and Sustainable Water Services; World Bank: Washington, DC, USA, 2019.
- Global Green Growth Institute (GGGI). Fecal Sludge Treatment, Technical Feasibility Report 2020: Pakse City, Champasak Province, Lao PDR; GGGI: Seoul, Republic of Korea, 2020.
- Agricultural policy monitoring and evaluation 2021: Addressing the challenges facing food systems. OECD Publishing 2021. [CrossRef]
- Patton, M.Q. Qualitative Research & Evaluation Methods: Integrating Theory and Practice; SAGE Publications: Thousand Oaks, CA, USA, 2015.
- Sophea, S.; Vibol, K.; Chea, R. Costing and financing gaps in FSM services in Phnom Penh. Int. J. Sanit. Water Supply 2019, 9, 45–62.
Figure 1.
Study area in Vientiane Capital, Lao PDR.
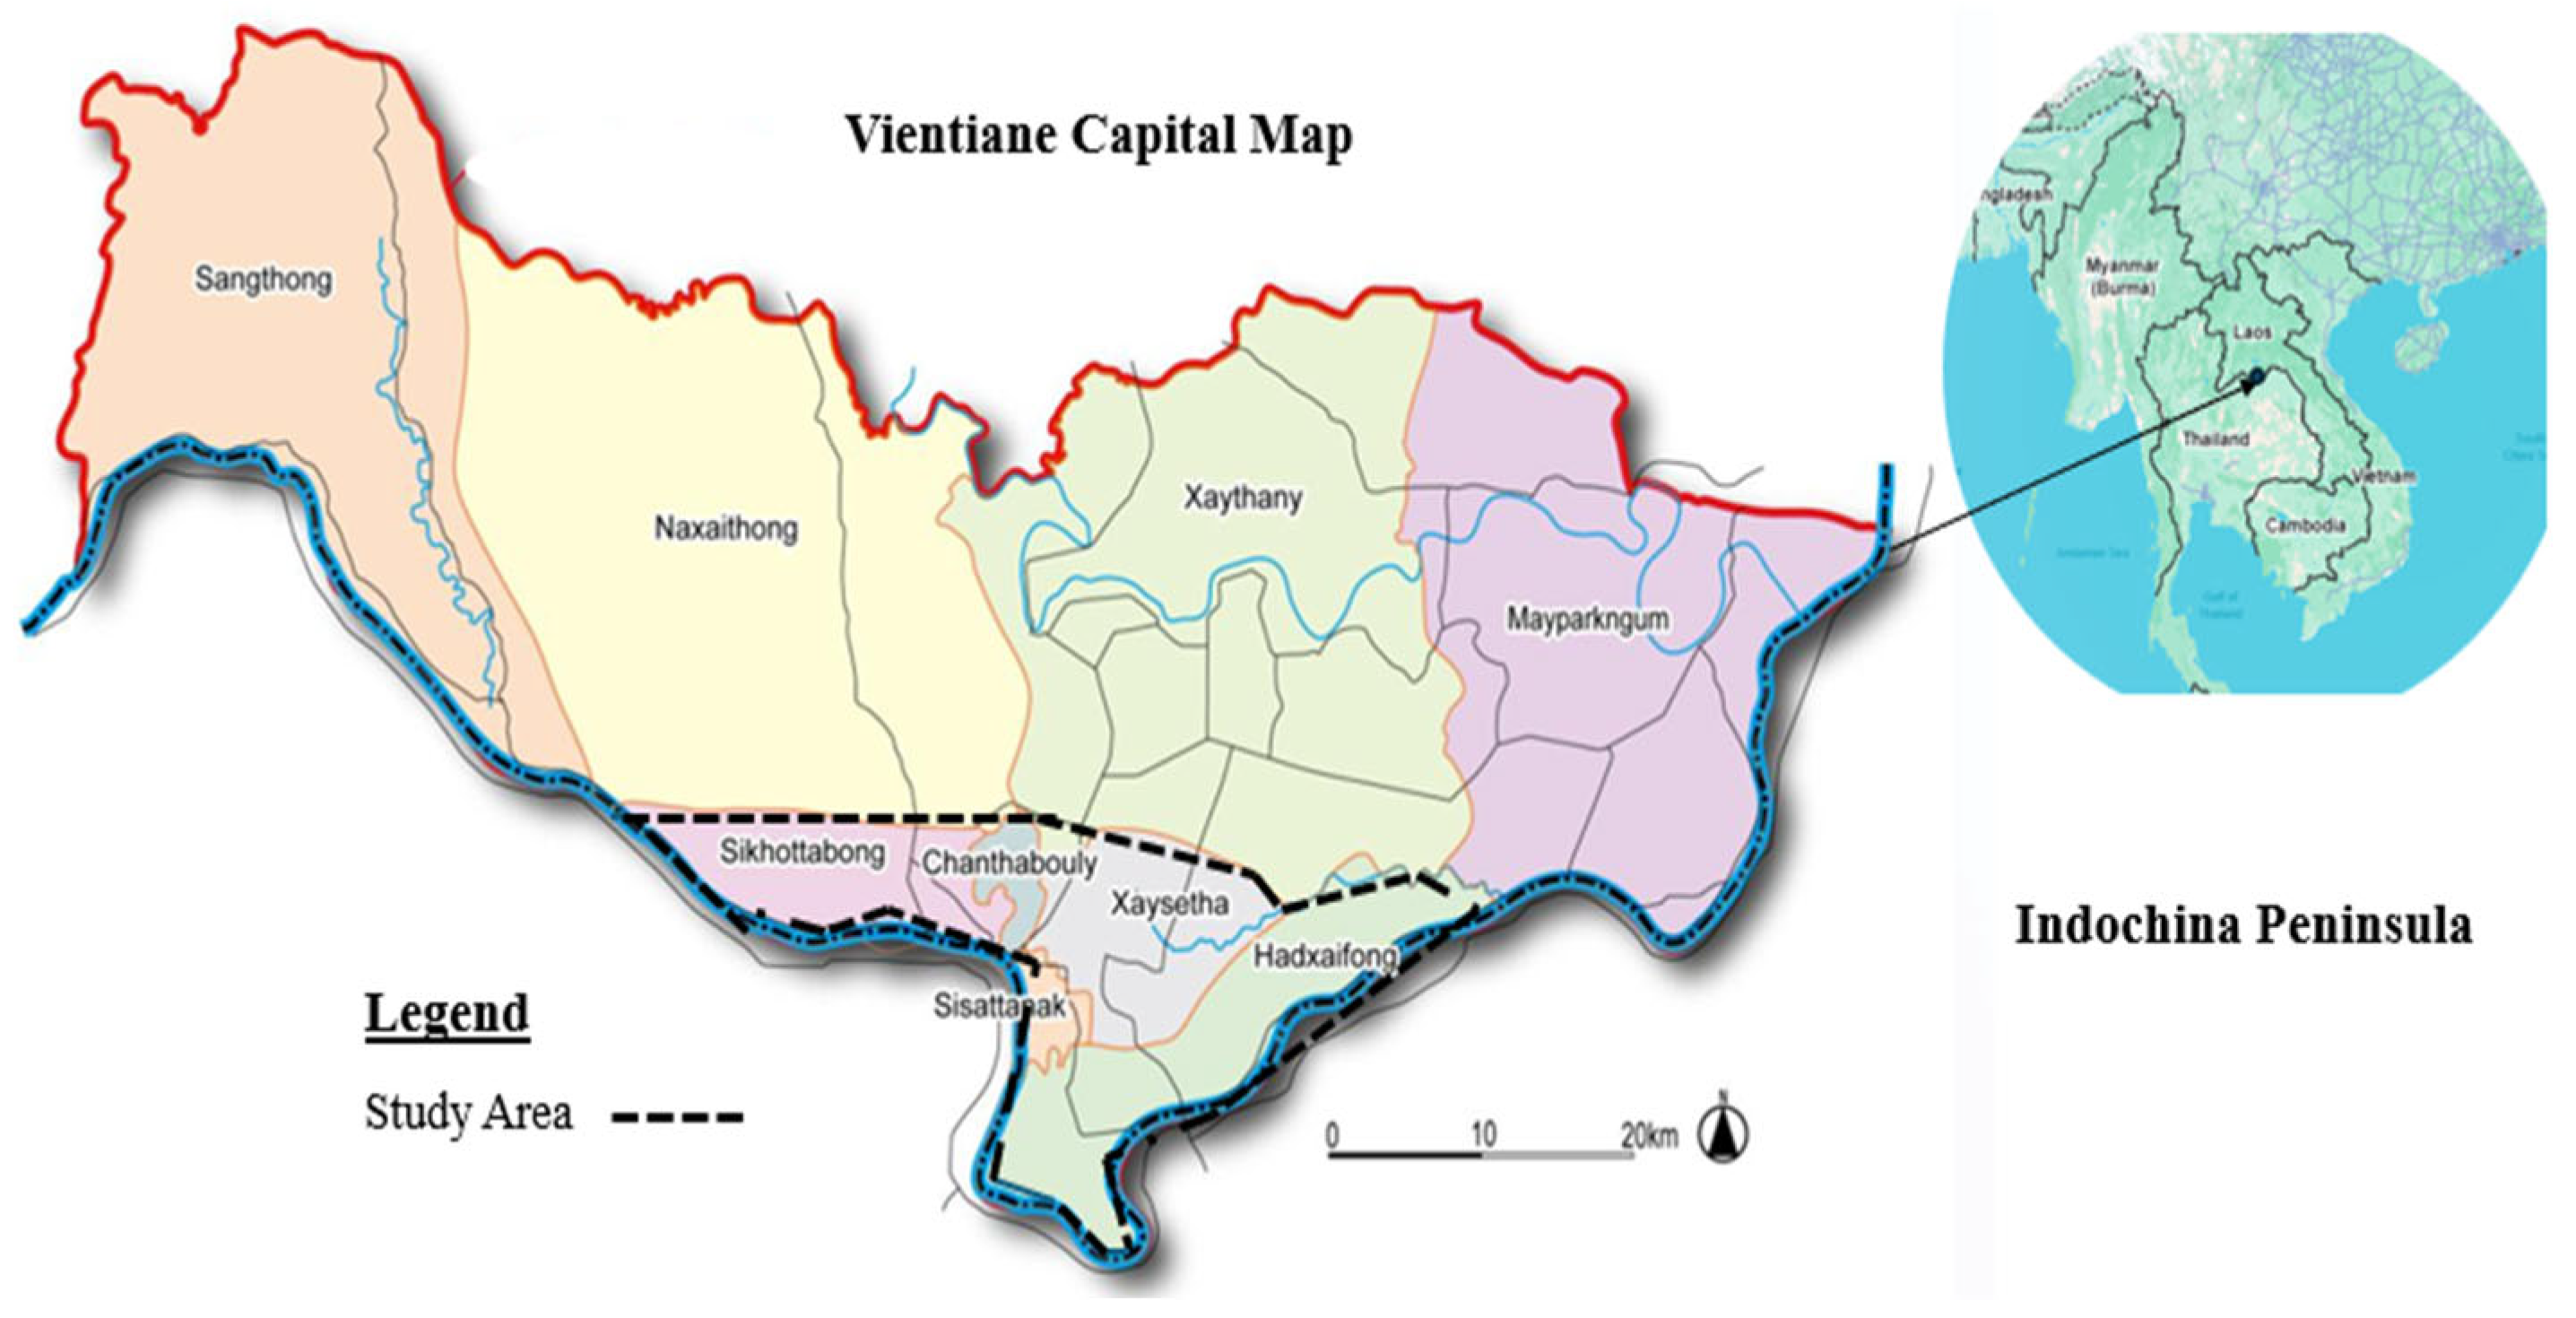
Figure 2.
Planted drying bed and constructed wetland.
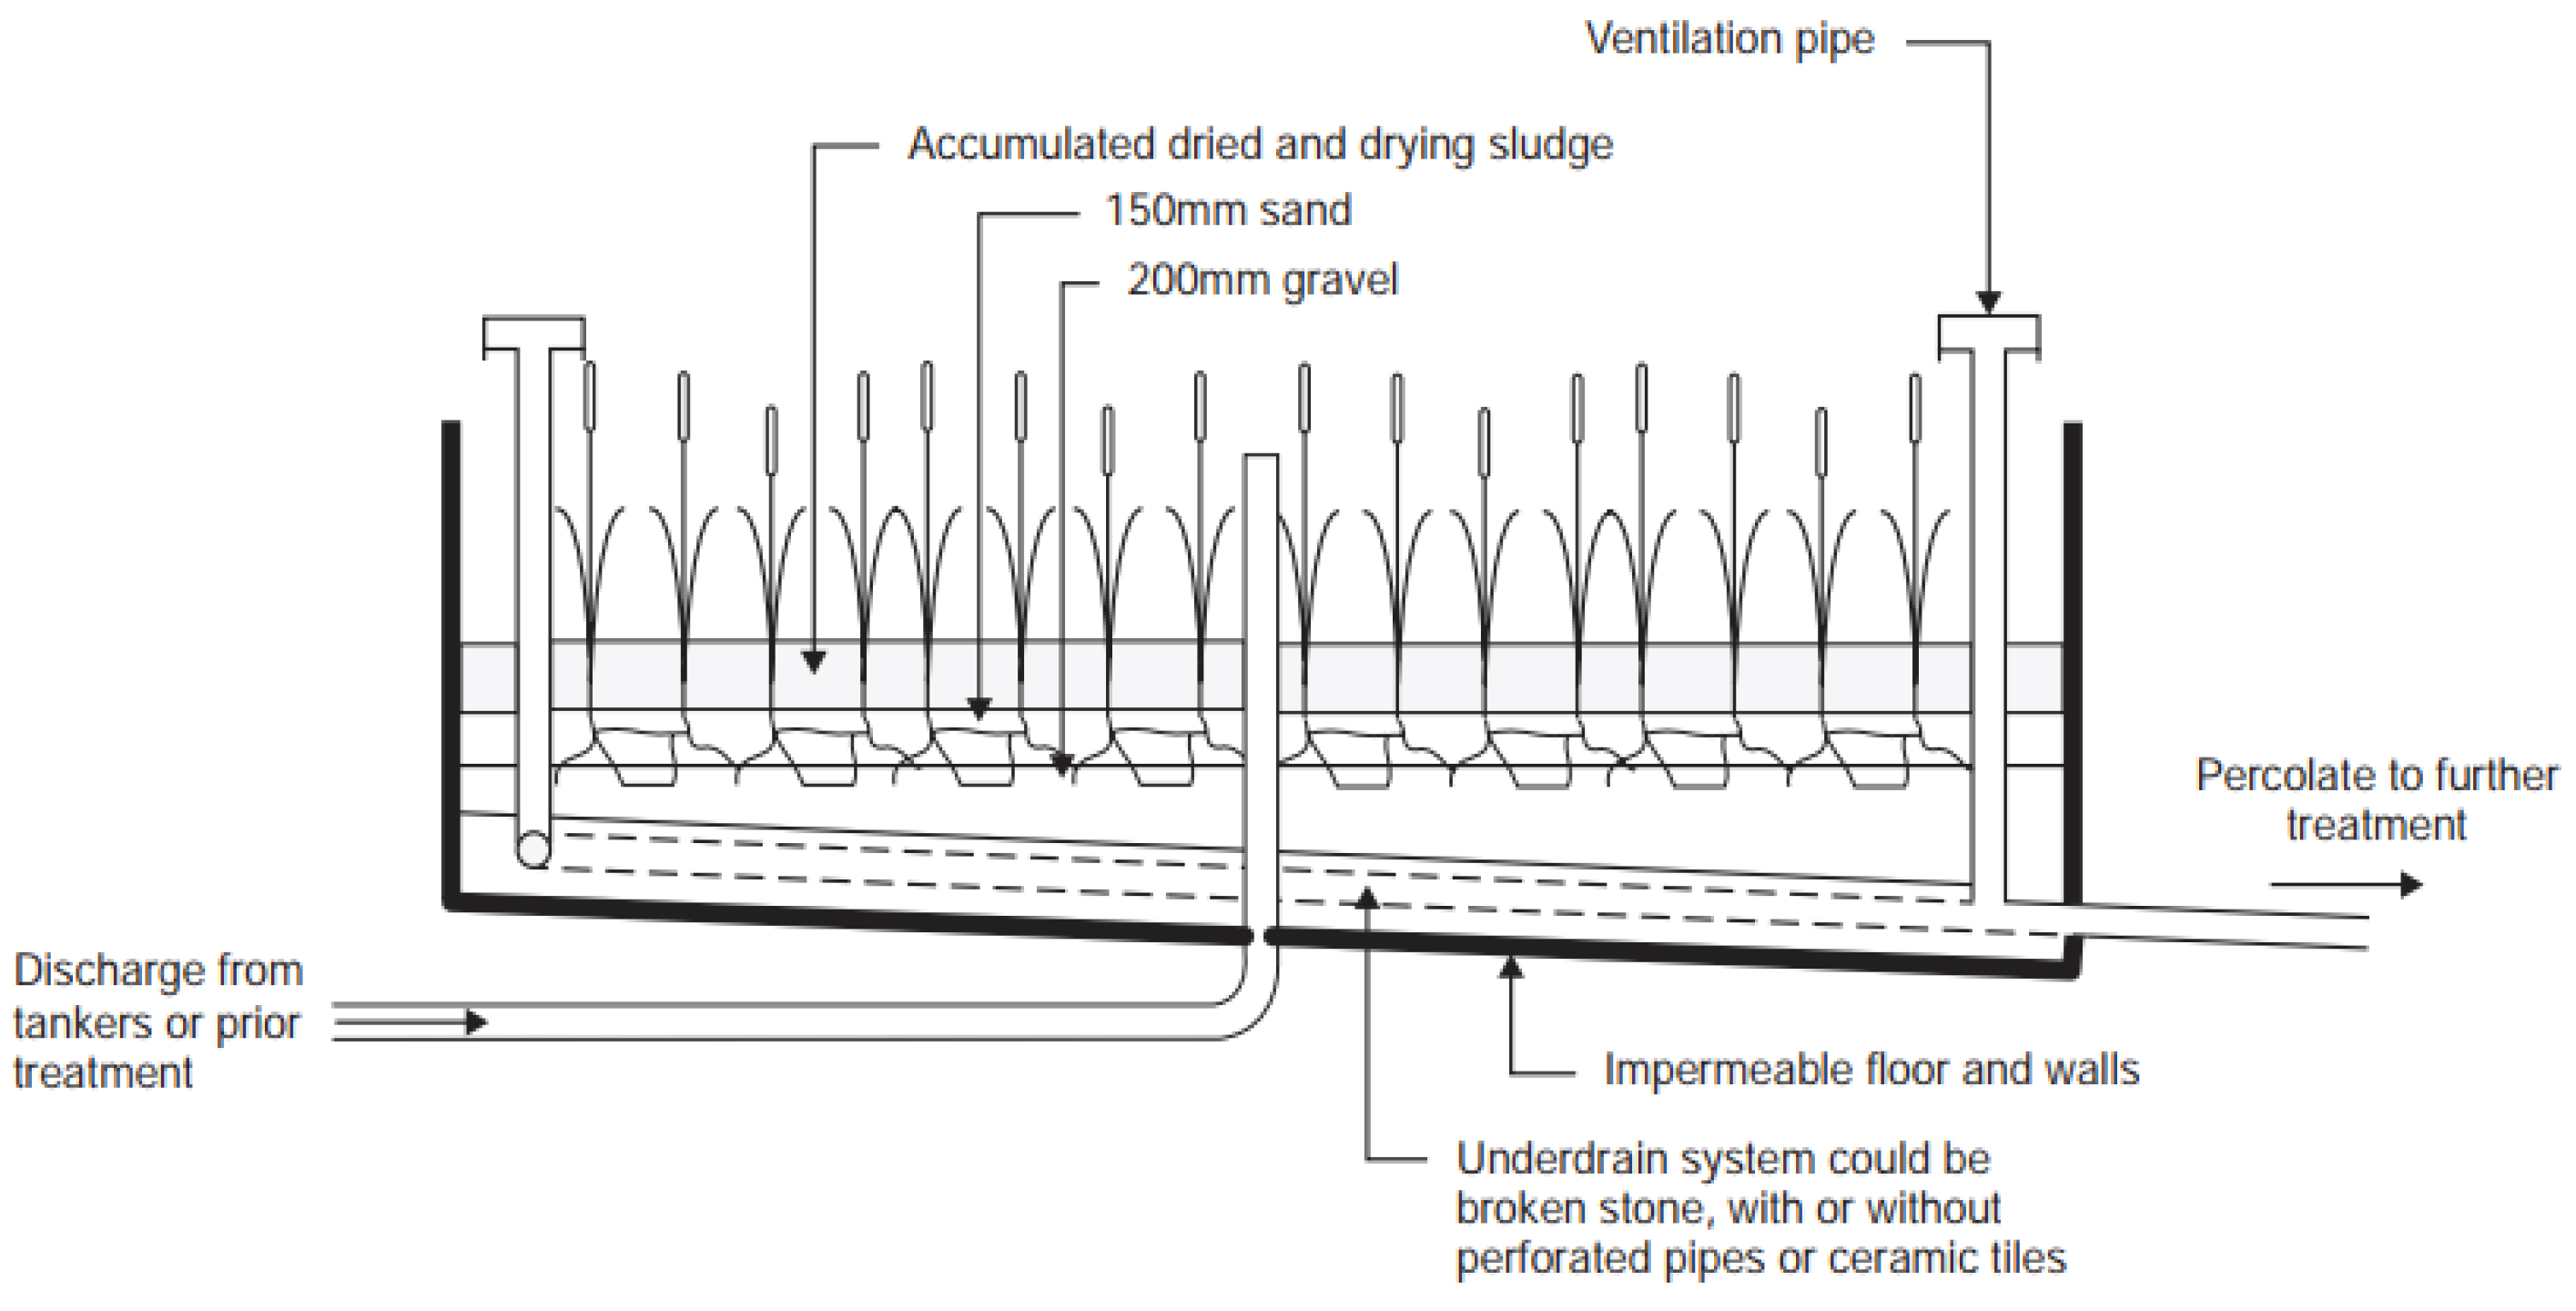
Table 1.
Fecal sludge Treatment System (Planned Drying Beds with Constructed Wetland).
| Cost Category | Estimated Cost (USD) | Percentage (%) |
| Capacity: 150 m3/d | - | - |
| Civil Works and Construction | 500,000 | 32 |
| Treatment Equipment | 650,000 | 40 |
| Equipment Installation | 65,000 | 4 |
| Design & Engineering | 150,000 | 10 |
| Project Management | 80,000 | 5 |
| Permits & Environmental Studies | 50,000 | 3 |
| Contingency (5%) | 80,000 | 6 |
| Total Capital Cost | 1,575,000 | 100 |
Source: (1) Global Green Growth Institute (GGGI). 2020: Fecal Sludge Treatment, Technical Feasibility Report 2020, Pakse City Chamsack Province, Lao PDR; and (2) obtained from Project Technical Report from VCOMS.
Table 2.
Annual Operational Expenditure (OPEX).
| Expense Category | Staffing/Method | Annual Cost (USD) | Percentage (%) |
| Plant Operator (1) | Salary USD 300/month × 12 | 3,600 | 6 |
| Guards & Security (2) | Salary USD 300/month × 12 × 2 | 7,200 | 12 |
| Sanitary Workers (2) | Salary USD 300/month × 12 × 2 | 7,200 | 12 |
| Total Staffing | — | 18,000 | 30 |
| Operation Expenditure (OPEX) | Equipment/Tools | Annual Cost (USD) | Percentage (%) |
| Routine Maintenance | Scheduled maintenance, supplies | 10,000 | 17 |
| Replacement/Emergency Repairs | Unplanned repairs, spare parts | 18,000 | 30 |
| Administrative & Overhead | Accounting, reporting, supervision | 8,000 | 13 |
| Training & Capacity Building | Staff professional development | 1,500 | 2 |
| Laboratory & Quality Monitoring | Equipment maintenance, supplies | 3,000 | 5 |
| Contingency | Buffer for unforeseen costs | 1,300 | 2 |
| Total OpEx | — | 60,000 | 100 |
Table 3.
Revenue from Resource Recovery (fertilizers).
| Revenue | Method | Total (USD)/year |
| Fecal Sludge Treatment Fee | 45,625 t/y/ x $ 0.46 | 20,987 |
| Fecal sludge processed | 45,625 t/y | - |
| Fecal sludge processed Assumed Liquid: <5% Total Solids (TS) |
45,625t/y x 0.05= 2,281t/y | 79,835 |
| Total Annual Selling of Fertilizer to stakeholders | 2,281 t/y x $ 35/t | $ 100,822 |
Table 4.
Life Cycle Cost Analysis of Fecal Sludge Management.
| Parameter | Discount Rate (3%) | Discount Rate (5% Baseline) | Discount Rate (7%) |
| Annual Cost (Annualized) | USD 237,072 | USD 237,072 | USD 237,072 |
| Annual Revenue | USD 100,822 | USD 100,822 | USD 100,822 |
| Annual Financing Gap | USD 136,250 | USD 136,250 | USD 136,250 |
| Gap as % of Costs | 57.47% | 57.47% | 57.47% |
| Discounting Factor (15 years) | 0.642 | 0.481 | 0.359 |
| Capital Cost | 1,575,000 | 1,575,000 | 1,575,000 |
| NPV of OPEX | 152,167 | 114,035 | 85,926 |
| NPV of Revenue | 64,714 | 48,497 | 36,543 |
| Total Life Cycle of Costs | USD 1,662,453 | USD 1,640,538 | USD 1,624,383 |
Note: Unit treatment cost remains stable (USD 6.93/t) across all scenarios because cost is calculated on a constant-dollar annualized basis independent of the discount rate. However, the financing gap persists across all scenarios and represents the actual annual subsidy requirement.
Table 5.
Sensitivity Analysis of Fecal Sludge Management (15 Years) [30].
Table 5.
Sensitivity Analysis of Fecal Sludge Management (15 Years) [30].
| Parameter | 3% Discount 4% Inflation |
5% Discount 4% Inflation |
7% Discount 5% Inflation |
| Capital cost (USD) | 1,575,000 | 1,575,000 | 1,575,000 |
| NPV of OPEX (USD) | 179,649 | 114,035 | 94,736 |
| NPV of revenue (USD) | 64,714 | 48,497 | 36,343 |
| Total life cycle cost, LCC (USD) | 1,689,935 | 1,640,538 | 1,633,193 |
| Project life (years) | 15 | 15 | 15 |
| Total fecal sludge treated (m3) | 34,215 | 34,215 | 34,215 |
| Annualized cost (USD/y) | 279,877 | 237,072 | 261,379 |
| Unit cost of treatment (USD/m3) | 8.18 | 6.93 | 7.64 |
Disclaimer/Publisher’s Note: The statements, opinions and data contained in all publications are solely those of the individual author(s) and contributor(s) and not of MDPI and/or the editor(s). MDPI and/or the editor(s) disclaim responsibility for any injury to people or property resulting from any ideas, methods, instructions or products referred to in the content. |
© 2025 by the authors. Licensee MDPI, Basel, Switzerland. This article is an open access article distributed under the terms and conditions of the Creative Commons Attribution (CC BY) license (http://creativecommons.org/licenses/by/4.0/).
Copyright: This open access article is published under a Creative Commons CC BY 4.0 license, which permit the free download, distribution, and reuse, provided that the author and preprint are cited in any reuse.


