Submitted:
16 December 2025
Posted:
17 December 2025
You are already at the latest version
Abstract
Planning a vacation is not easy and choosing a destination is itself a difficult task. But with modern machine learning technology we can predict user preferences and recommend suitable destinations for vacations. This research aims to analyze public preferences between two popular vacation destinations named mountains and beaches, using ma- chine learning techniques. By considering demographic factors like age, gender, income, education and lifestyle choices, this study explores the influences on vacation destination preferences. A unique dataset containing over 52,000 instances is used to predict whether individuals prefer mountains or beaches, employing algorithms like Decision Tree, Random Forest, Gradient Boosting, Deep Learning, and Ensemble Methods. The study concludes that Deep Learning models achieved the highest accuracy of 99.81%, followed by Gradient Booster at 98.85%. The results suggest that machine learning can enhance personalized travel recommendations and contribute to more efficient tourism marketing.
Keywords:
travel preference modeling
; personalized vacation recommendation
; destination choice analysis
; demographic influence on travel
; predictive analytics in tourism
1. Introduction
Tourism and travel are essential in today’s world, offering opportunities to explore new destinations and experience diverse cultures. Whether it’s a relaxing beach trip or an adventurous mountain getaway, people travel to enjoy themselves and create lasting memories. According to Statista, 1.3 billion international tourists traveled globally for vacations in 2023 [1].
Tourism during vacations also plays a significant role in the global economy. In 2023, the tourism industry contributed approximately 9.9 trillion U.S. dollars to the global GDP, a figure expected to rise to 11.1 trillion U.S. dollars in 2024 [2]. Therefore, the importance of the vacation tourism and travel industry cannot be overlooked. The rapid growth and evolving nature of this sector have made it increasingly competitive, with travelers seeking personalized recommendations that align with their preferences and lifestyles. Choosing a vacation destination can be challenging, especially when deciding between peaceful mountains and sunny beaches [3].
Mountain tourism accounted for 9–16% of global international tourist arrivals in 2019, equating to 195 to 375 million tourists [4,5,6]. Additionally, an ABC News/Washington Post poll (June 13–17, 2012) explored vacation preferences between beaches and mountains, comparing preferences across genders [7,8,9,10]. The poll highlights the importance of targeted marketing strategies and personalized solutions for different tourist demographics.
Figure 1 illustrates the results of a national poll conducted by ABC News/Washington Post (June 13–17, 2012), showing favorable opinions on summer vacation destinations among men and women.
With the advancement of AI, tourism companies can now develop smart recommender systems that suggest vacation destinations based on user demographics, leveraging machine learning and deep learning techniques [11,12,13,14]. These systems provide tailored recommendations, enhance market understanding, and improve customer segmentation.
This research aims to analyze public preferences between two common vacation destinations: mountains and beaches. It offers insights into various demographic factors—such as income, gender, age, pet ownership, and education—as well as preferred activities like skiing, sunbathing, and hiking, which may influence these preferences [15,16].
By applying multiple machine learning techniques, we predicted whether individuals prefer mountains or beaches based on their attributes. This represents a significant breakthrough in the tourism industry, emphasizing the importance of understanding customer needs and developing personalized travel experiences. It also contributes to improving current vacation recommendation systems [17,18].
Figure 2 illustrates the workflow of this study. The Introduction section provides an overview of the role of vacation tourism and the travel industry, highlighting the importance of customer preferences. The Literature Review details previous work in tourism prediction using machine learning and deep learning methods [19,20,21]. The Methodology section describes our primary research, including dataset preprocessing and model implementation. This is followed by a discussion of the results, where we compare our findings with previous studies and evaluate model accuracies. Finally, the paper concludes with key insights derived from the analysis [22,23,24].
2. Literature Review
To conduct the literature review, we took a broader perspective to understand the previous work done in the field of tourism and the use of machine learning techniques to predict mountain vs. beach choice preferences based on demographics and proximity to vacation locations [25,26,27,28].
A social and behavioral study by Svyatoslav Gorbatov and Petr Chuvatkin [4] shows that younger individuals (16–25 years) showed a stronger preference for social settings like beaches, while older participants (26–35 years) preferred mountains for relaxation and nature exploration. Their study also reveals that active lifestyles are associated with a preference for mountains due to hiking and physical activities, while socially active individuals prefer beaches for their visual appeal. Higher-income groups prefer mountains due to activities like skiing, while budget-conscious travelers prefer beaches for affordability. Gender differences show women favoring beaches for relaxation, while men have a balanced preference for both settings based on available activities. This research is very viable in order to understand human preferences for vacation selection. Victor Chang’s study [5] predicts tourist preferences in Bangladesh using machine learning. His dataset contains tourism-related information about 6,318 people and achieved 96.3% accuracy in predicting preferences using Linear SVM.
Abhishek Kulkarni’s paper [6] presents a recommendation system for tourism using sentiment analysis. He used a dataset from Kaggle of 1 million reviews selected from the Amazon dataset, and 20,000 reviews of tourist places were collected manually. The system generates tailored tour plans based on user interests, achieving accuracies of 94.56% for RNN and 94.40% for CNN. He is using sentiment analysis based on reviews, but the limitation here is that people often plan trips based on their budget and preferred activities, which are not taken into consideration in this study.
Sumitra Kongpeng’s and Anantaporn Hanskunatai’s research [7] develops a tourist recommendation system for Thailand using machine learning for personalized destination suggestions. They collected data from 429 tourists via online surveys. They categorized data into five regions based on tourist destinations and applied different machine learning algorithms. The results they achieved are commendable. The average hit rate across five regions is 0.80. The average NDCG (Normalized Discounted Cumulative Gain) score for the regions is 0.59. NDCG is a metric used to evaluate the quality of ranked results in tasks like recommendation systems and search engines. The Random Forest (RF) algorithm shows the highest efficiency in predictions. The research also concludes that the key factors influencing destination selection include activity and travel budget, which are the focus of our research paper.
The paper by Pravinkumar Swamy and Sandeep Tiwari [8] gives insights into the advantages of e-commerce in the tourism sector, providing users with tailored solutions like travel routes, costs, and nearby destinations. They have implemented machine learning techniques, particularly the SVM algorithm. According to their paper, they improved the accuracy of predictions in recommending travel plans, but the accuracy is not mentioned specifically. They also developed an Android application prototype of a personalized travel recommendation system that provides real-time guidance [29,30].
Gabriel I. Penagos-Londoño and Carla Rodriguez–Sanchez proposed in their research [9] a machine learning-based segmentation approach for tourists based on factors like destination sustainability and trustworthiness. They collected data from 438 tourists from Chile and Ecuador through online surveys. They segmented tourists into three categories: Extremely Optimistic, Optimistic, and Moderately Optimistic. A genetic algorithm was used for feature selection, while latent class analysis was employed to identify the segments. Their results reveal significant differences in perceptions of sustainability (economic, sociocultural, and environmental) and trustworthiness across the segments.
The study by Deepanjal Shrestha and Tan Wenan [10] developed a personalized tourist recommendation system for Nepal using machine learning and data-driven analysis. They collected data from 2,400 tourists through a survey to train models across 125 variables. Models like RF and GB achieved nearly 100% accuracy in predicting preferences and satisfaction. The system outperformed platforms like TripAdvisor by delivering highly accurate personalized recommendations based on factors such as cost, popularity, and ratings.
Mickael Figueredo and Jose Ribeiro researched a tourism recommender system integrated into the Find Trip Platform for a smart tourism destination in Brazil [11]. The system uses CNN and fuzzy logic to analyze tourists’ preferences based on their social media photos. It classifies tourists into five categories, landscape, adventure, cultural, urban, and shopping—and provides personalized recommendations for points of interest (POIs). Their system achieved over 90% accuracy in classification and validation [31].
3. Methodology
The methodology portion of the paper is the most crucial part of our research. We started by collecting the dataset, which in our case was obtained from Kaggle. The data was then preprocessed to check for missing values, and unnecessary columns that had no impact on predicting the results were dropped. The imbalanced dataset was balanced by applying SMOTE. Next, the data was split into a 70/30 ratio using Altair AI Studio. The 70% portion of the data was used for training the algorithm. We experimented with different machine learning algorithms, including Random Forest (RF), Decision Tree (DT), Naive Bayes, KNN, and Deep Learning. After training, the “Apply Model” operator was used to implement the model, and the remaining 30% of the data was utilized for testing. The model was evaluated by assessing its performance using the “Performance” operators. Finally, the results were obtained. The complete flow of the work done in this section is shown in Figure 2 below.
a) Data Collection
This dataset was the only one available on Kaggle suitable for analyzing the influence of demographic and lifestyle factors on vacation preferences. It originally included 52,444 instances and 13 features, consisting of both categorical and numerical data. The dataset was clean with no missing values, and the sample size was sufficiently large. However, it had a major issue: class imbalance. We addressed this in the data preprocessing stage using an appropriate technique. The target column, “Preference,” was binary-coded: 1 for mountains and 0 for beaches. We converted these numerical values into textual binomial categories, labeling them as “mountains” and “beaches” to enhance readability and interpretability.
b) Tools
We used Altair AI Studio (formerly known as RapidMiner) and Google Colab for applying machine learning techniques. This open-source platform is widely used for ML model building and experimentation. We used the latest version 2024.1.0 for our implementation.
c) Data Pre-Processing
While the dataset was already clean, it suffered from high class imbalance:
- a)
- Preference for beaches: 39,296 samples
- b)
- Preference for mountains: 13,148 samples
This results in an imbalance ratio of:
This implies a distribution of roughly 25.06% (mountains) to 74.94% (beaches). To resolve this, we used the Synthetic Minority Oversampling Technique (SMOTE), which generates synthetic samples of the minority class to balance the dataset. However, SMOTE works only with numerical values. Since our dataset had categorical features, we applied encoding techniques to convert categorical data to numerical format without altering the structure or semantics of the dataset.
After encoding and applying SMOTE, the dataset was successfully balanced with:
- a)
- 39,296 beach samples
- b)
- 39,296 mountain samples
The total dataset size increased to 78,592 samples. Care was taken to ensure that no original data was duplicated or lost, and that the newly generated samples aligned logically with the existing distribution. Figure 3 shows dataset before and after applying SMOTE.
d) Data Splitting
Data splitting ratios are flexible, but the most used ratios are 70:30 and 80:20. We used a 70:30 split since the original size of the dataset was 52,444 with 36,711 samples for training and 15,733 samples for testing. After applying SMOTE, the dataset size was increased to 78,592 with 55,014 samples for training and 23,578 samples for testing [12,13,14,15]. For splitting the data, we had multiple techniques like linear sampling, automatic sampling, stratified sampling etc. We have applied Stratified Sampling because it is a technique that is used to divide a dataset into distinct subgroups or strata based on specific characteristics or categories. Figure 4 shows data splitting before and after SMOT
e) Selecting Algorithm
The 70% or 55,014 samples were used for training the model. The algorithm identifies patterns from the dataset and generates equations which are then passed to the model for training. But selecting the right algorithm is a challenging task.
f) Model Applying Testing
After training the learning algorithm on the training data, we obtained a rule or equation from the algorithm, which was then passed to the operator named “Apply Model.” This operator takes two inputs: the rule generated by the algorithm and the 30% testing data from the split. Here is the complete model. Figure 5 shows the applied model sample in raid miner.
g) Model Performance Evaluation
When the model was trained, it was time to measure its performance. For this, we used performance operators available in Altair AI Studio (RapidMiner). There were multiple performance operators but since we were dealing with a classification problem, we selected the one appropriate for classification and applied it. This helped in visualizing the output of our model. The performance included factors such as accuracy, precision, recall and other metrics that were used to evaluate the model’s results.
4. Results and Discussion
The performance of various classification algorithms was evaluated using four key metrics: accuracy, precision, recall, and F1-score. These metrics were applied to both imbalanced and balanced versions of the dataset to compare the models’ effectiveness before and after applying the SMOTE technique for balancing the classes.
a. Performance on Imbalanced Dataset (Before SMOTE)
As shown in Table 1, when using the imbalanced dataset with “Beaches” designated as the positive class, Deep Learning outperformed all other models. It achieved an accuracy of 99.62%, precision of 99.88%, recall of 99.61%, and an F1-score of 99.74%. This was followed by the Ensemble Learning approach (Voting using Decision Tree, Random Forest, and Gradient Booster), which also showed high performance across all metrics.
Among traditional models, Decision Tree, Random Forest, and Gradient Booster yielded strong and consistent results. Naïve Bayes, although delivering 100% recall, suffered from lower precision (93.40%). On the other hand, KNN (k=5) exhibited the weakest performance, with only 72.75% accuracy, making it less suitable for this imbalanced dataset.
The corresponding confusion matrix for this evaluation is illustrated in Figure 6, showcasing the correct and incorrect predictions for the deep learning model on the imbalanced dataset.
b. Performance on Balanced Dataset (After SMOTE)
After applying SMOTE to address class imbalance, the dataset became evenly distributed between the “Beaches” and “Mountains” classes. The updated results are summarized in Table 2.
Deep Learning continued to dominate, improving further to 99.81% accuracy, 99.76% precision, 99.86% recall, and 99.82% F1-score. Both Gradient Booster and Ensemble Learning approaches also performed exceptionally well. Decision Tree and Random Forest showed high precision, but slightly lower recall compared to the top performers. Naïve Bayes gave decent results, while KNN (k=5) remained the least effective.
These balanced dataset results are supported by the confusion matrix in Figure 7, demonstrating the enhanced classification performance of the deep learning model after addressing class imbalance.
c. Comparative Analysis
The comparative performance of the models across the imbalanced and balanced datasets is shown in Figure 8, which visualizes the accuracy of each model in both settings.
While models like Decision Tree and Ensemble Learning showed slightly better accuracy on the imbalanced dataset, the results from the balanced dataset are considered more reliable due to the equal representation of both classes. In the imbalanced version, the positive class “Beaches” dominated, potentially skewing the model’s learning. After SMOTE, class balance was achieved, leading to a more generalizable and fair evaluation.
5. Conclusions
People plan their vacations carefully by considering many factors such as budget, preferred activities, and proximity of the destination. With advancements in technologies like machine learning and deep learning, it is now possible to predict people’s vacation preferences such as whether they prefer beaches or mountains based on their personal demographics and lifestyle factors. This helps tourism and travel agencies better understand consumer preferences, enabling them to suggest destinations or implement targeted marketing strategies based on segmented preferences. We began the paper with a literature review, discussing previous studies in the tourism industry, and then moved on to the practical research methodology. In this section, we balanced the dataset and applied stratified sampling to split the data. The data was then trained using various algorithms and tested accordingly. We obtained different accuracy levels from each algorithm and compared the results. Ultimately, our findings showed a maximum accuracy of 99.81% using a deep learning algorithm on the balanced dataset (after applying SMOTE). In the future, these results can be improved by including more data and incorporating additional preference options to further enhance applications in the tourism industry.
References
- “International tourist arrivals worldwide 1950–2023 | Statista.” Accessed: Jan. 14, 2025. [Online]. Available: https://www.statista.com/statistics/209334/total-number-of-international-tourist-arrivals/.
- “Travel and tourism: contribution to global GDP 2023 | Statista.” Accessed: Jan. 14, 2025. [Online]. Available: https://www.statista.com/statistics/233223/travel-and-tourism-total-economic-contribution-worldwide/.
- “Tourism’s Potential for Mountain Ecosystems and Communities Outlined in New Report.” Accessed: Jan. 14, 2025. [Online]. Available: https://www.unwto.org/news/tourism-s-potential-for-mountain-ecosystems-and-communities-outlined-in-new-report.
- S. Gorbatov and P. Chuvatkin, “The Research of Youth Travel Preferences,” European Publisher, Apr. 2021, pp. 464–475. [CrossRef]
- V. Chang, M. R. Islam, A. Ahad, M. J. Ahmed, and Q. A. Xu, “Machine Learning for Predicting Tourist Spots’ Preference and Analysing Future Tourism Trends in Bangladesh,” Enterprise Information Systems, 2024. [CrossRef]
- A. Kulkarni, R. M. Samant, and P. Barve, “A Machine Learning Approach to Building a Tourism Recommendation System Using Sentiment Analysis,” 2019.
- S. Kongpeng and A. Hanskunatai, “Tourist Destination Recommendation System Based on Machine Learning,” in ACM International Conference Proceeding Series, Association for Computing Machinery, Oct. 2024, pp. 58–67. [CrossRef]
- P. Hajare, H. Jarad, S. Jakate, R. Nishad, and N. Zaman, “Tours and Travel Recommend System Using Machine Learning Techniques,” International Research Journal of Engineering and Technology, 2022. [Online]. Available: www.irjet.net.
- G. I. Penagos-Londoño, C. Rodriguez-Sanchez, F. Ruiz-Moreno, and E. Torres, “A Machine Learning Approach to Segmentation of Tourists Based on Perceived Destination Sustainability and Trustworthiness,” Journal of Destination Marketing and Management, vol. 19, Mar. 2021. [CrossRef]
- D. Shrestha, T. Wenan, D. Shrestha, N. Rajkarnikar, and S. R. Jeong, “Personalized Tourist Recommender System: A Data-Driven and Machine-Learning Approach,” Computation, vol. 12, no. 3, Mar. 2024. [CrossRef]
- M. Figueredo, J. Ribeiro, A. C. A. da Rocha, and L. M. G. Gonçalves, “From Photos to Travel Itinerary: A Tourism Recommender System for Smart Tourism Destination,” in Proceedings - IEEE 4th International Conference on Big Data Computing Service and Applications (BigDataService 2018), IEEE, Jul. 2018, pp. 85–92. [CrossRef]
- Muzafar, S., & Jhanjhi, N. Z. (2020). Success stories of ICT implementation in Saudi Arabia. In Employing Recent Technologies for Improved Digital Governance (pp. 151-163). IGI Global Scientific Publishing.
- Jabeen, T., Jabeen, I., Ashraf, H., Jhanjhi, N. Z., Yassine, A., & Hossain, M. S. (2023). An intelligent healthcare system using IoT in wireless sensor network. Sensors, 23(11), 5055. [CrossRef]
- Zhang, H., Zhang, L., Liu, Y., & Zhang, L. (2023). Understanding travel mode choice behavior: Influencing factors analysis and prediction with machine learning method. Sustainability, 15(14), 11414. [CrossRef]
- Shah, I. A., Jhanjhi, N. Z., & Laraib, A. (2023). Cybersecurity and blockchain usage in contemporary business. In Handbook of Research on Cybersecurity Issues and Challenges for Business and FinTech Applications (pp. 49-64). IGI Global.
- Williams, A. M., Chen, J. L., Li, G., & Baláž, V. (2022). Risk, uncertainty and ambiguity amid Covid-19: A multi-national analysis of international travel intentions. Annals of Tourism Research, 92, 103346. [CrossRef]
- Hanif, M., Ashraf, H., Jalil, Z., Jhanjhi, N. Z., Humayun, M., Saeed, S., & Almuhaideb, A. M. (2022). AI-based wormhole attack detection techniques in wireless sensor networks. Electronics, 11(15), 2324. [CrossRef]
- Shah, I. A., Jhanjhi, N. Z., Amsaad, F., & Razaque, A. (2022). The role of cutting-edge technologies in industry 4.0. In Cyber Security Applications for Industry 4.0 (pp. 97-109). Chapman and Hall/CRC.
- Mwale, M., Luke, R., & Pisa, N. (2022). Factors that affect travel behaviour in developing cities: A methodological review. Transportation Research Interdisciplinary Perspectives, 16, 100683. [CrossRef]
- Humayun, M., Almufareh, M. F., & Jhanjhi, N. Z. (2022). Autonomous traffic system for emergency vehicles. Electronics, 11(4), 510. [CrossRef]
- Muzammal, S. M., Murugesan, R. K., Jhanjhi, N. Z., & Jung, L. T. (2020, October). SMTrust: Proposing trust-based secure routing protocol for RPL attacks for IoT applications. In 2020 International Conference on Computational Intelligence (ICCI) (pp. 305-310). IEEE.
- Morar, C., Tiba, A., Basarin, B., Vujičić, M., Valjarević, A., Niemets, L., ... & Lukić, T. (2021). Predictors of changes in travel behavior during the COVID-19 pandemic: The role of tourists’ personalities. International journal of environmental research and public health, 18(21), 11169. [CrossRef]
- Vimont, A., Leleu, H., & Durand-Zaleski, I. (2022). Machine learning versus regression modelling in predicting individual healthcare costs from a representative sample of the nationwide claims database in France. The European Journal of Health Economics, 23(2), 211-223. [CrossRef]
- Isaac, R. K., & Keijzer, J. (2021). Leisure travel intention following a period of COVID-19 crisis: a case study of the Dutch market. International Journal of Tourism Cities, 7(3), 583-601.
- Brohi, S. N., Jhanjhi, N. Z., Brohi, N. N., & Brohi, M. N. (2023). Key applications of state-of-the-art technologies to mitigate and eliminate COVID-19. Authorea Preprints.
- Khalil, M. I., Humayun, M., Jhanjhi, N. Z., Talib, M. N., & Tabbakh, T. A. (2021). Multi-class segmentation of organ at risk from abdominal ct images: A deep learning approach. In Intelligent Computing and Innovation on Data Science: Proceedings of ICTIDS 2021 (pp. 425-434). Singapore: Springer Nature Singapore.
- Humayun, M., Jhanjhi, N. Z., Niazi, M., Amsaad, F., & Masood, I. (2022). Securing drug distribution systems from tampering using blockchain. Electronics, 11(8), 1195. [CrossRef]
- Lu, Q., & Atadil, H. A. (2021). Do you dare to travel to China? An examination of China’s destination image amid the COVID-19. Tourism Management Perspectives, 40, 100881. [CrossRef]
- Grekousis, G., Feng, Z., Marakakis, I., Lu, Y., & Wang, R. (2022). Ranking the importance of demographic, socioeconomic, and underlying health factors on US COVID-19 deaths: A geographical random forest approach. Health & Place, 74, 102744. [CrossRef]
- JingXuan, C., Tayyab, M., Muzammal, S. M., Jhanjhi, N. Z., Ray, S. K., & Ashfaq, F. (2024, November). Integrating AI with Robotic Process Automation (RPA): Advancing Intelligent Automation Systems. In 2024 IEEE 29th Asia Pacific Conference on Communications (APCC) (pp. 259-265). IEEE.
- Javed, D., Jhanjhi, N. Z., Ashfaq, F., Khan, N. A., Das, S. R., & Singh, S. (2024, July). Student Performance Analysis to Identify the Students at Risk of Failure. In 2024 International Conference on Emerging Trends in Networks and Computer Communications (ETNCC) (pp. 1-6). IEEE.
Figure 1.
Favorable Opinions on Summer Vacation Destinations (Men vs. Women).
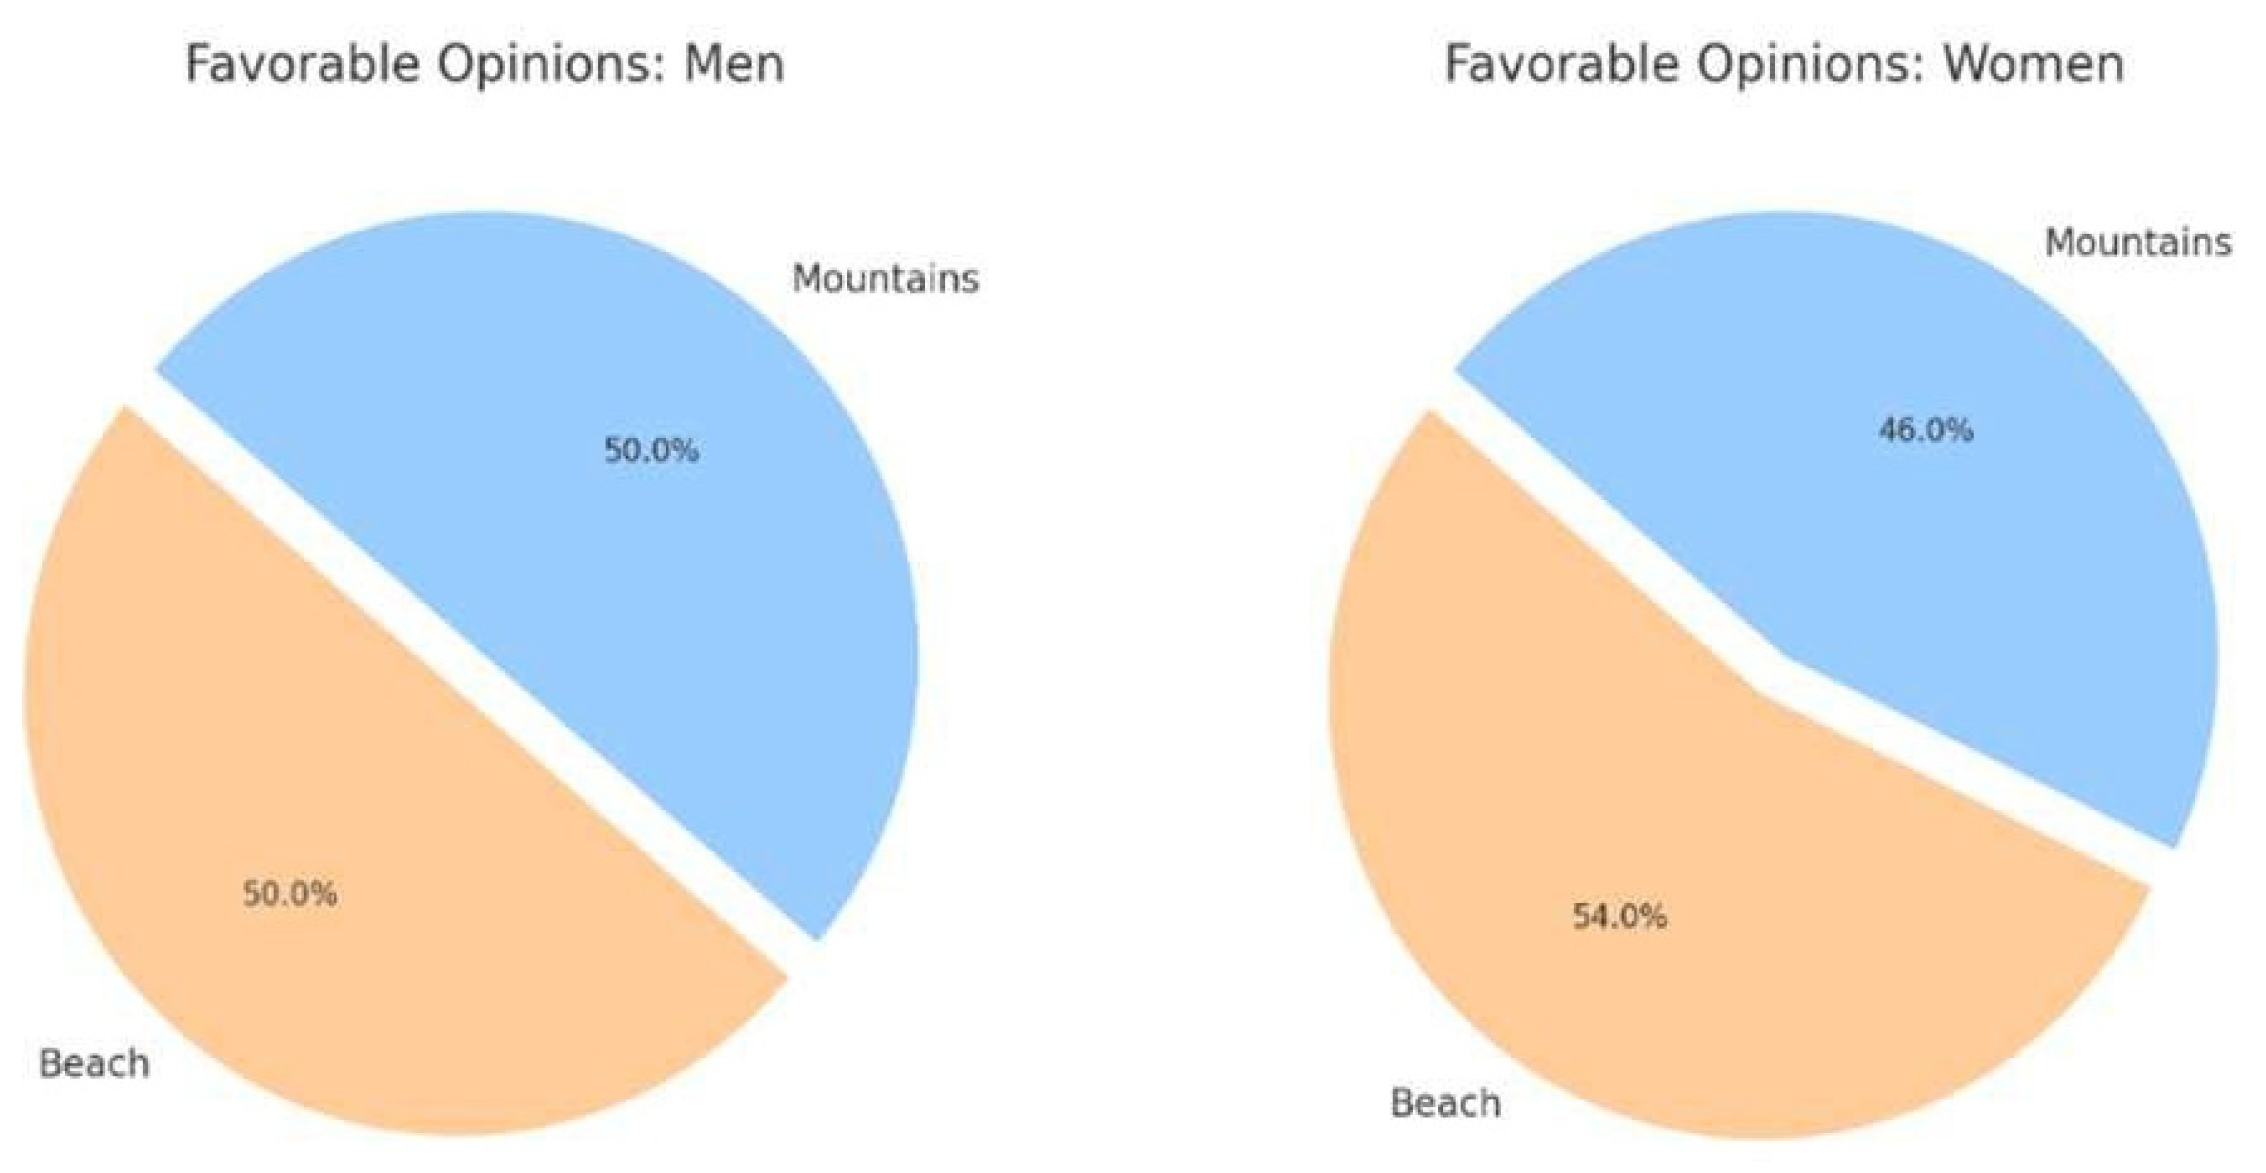
Figure 2.
Research Paper Flow.
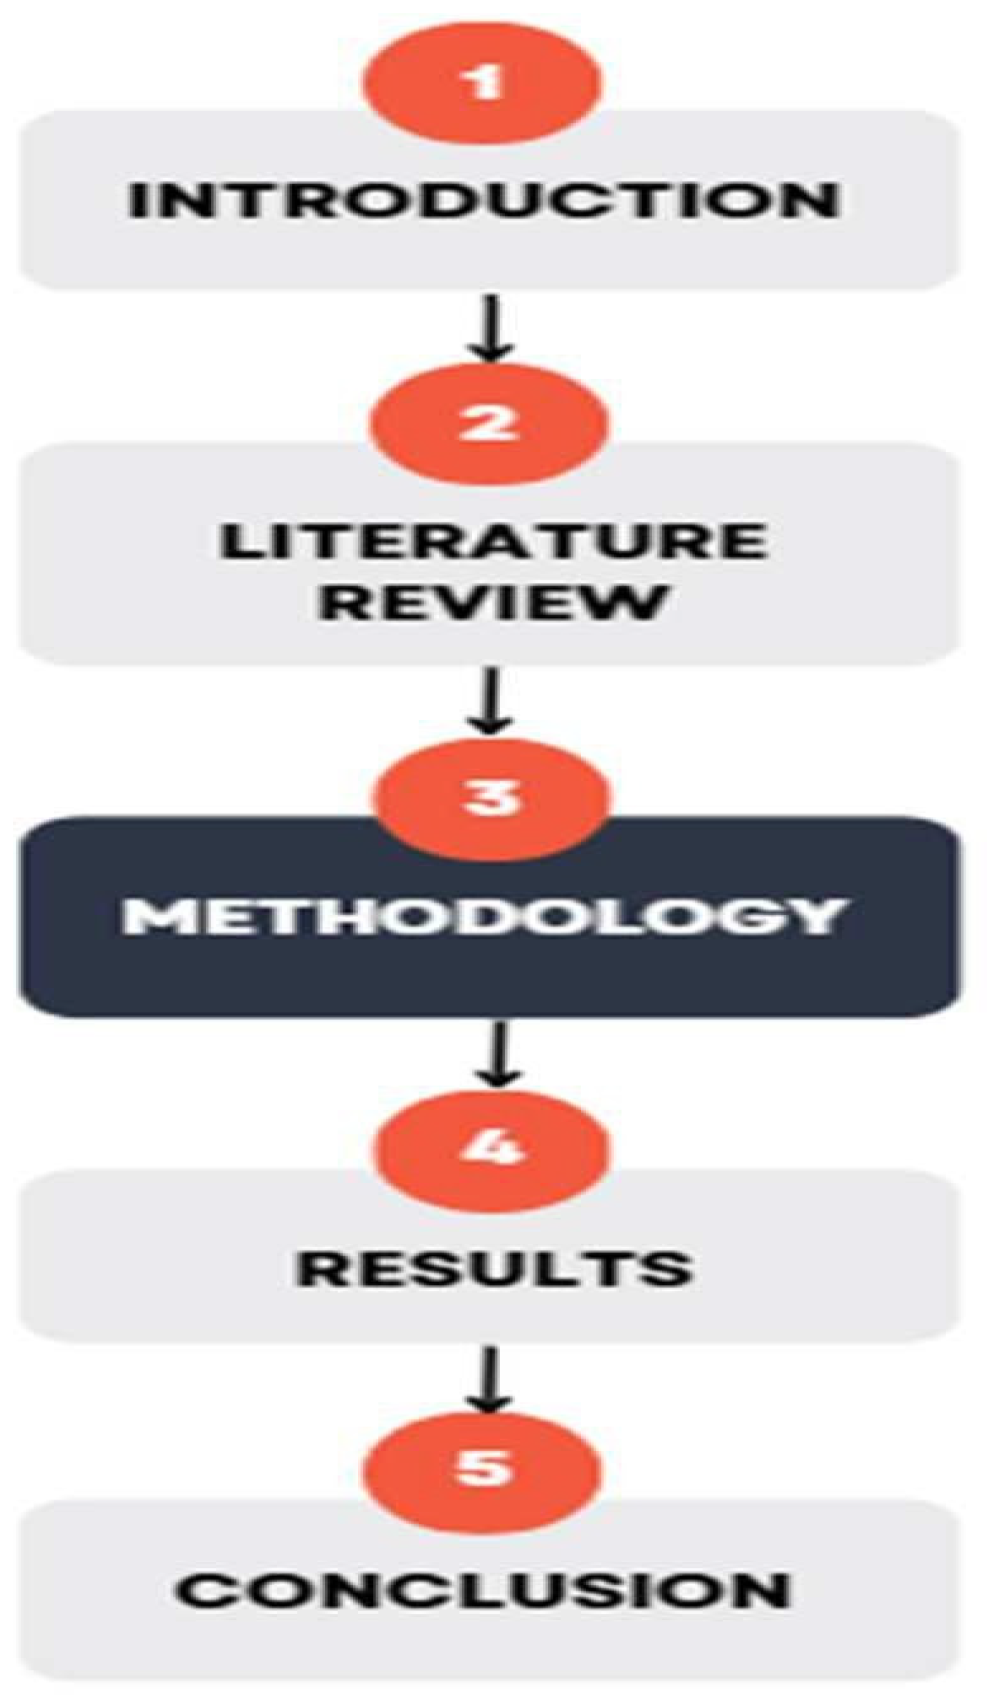
Figure 2.
Methodology Overview.
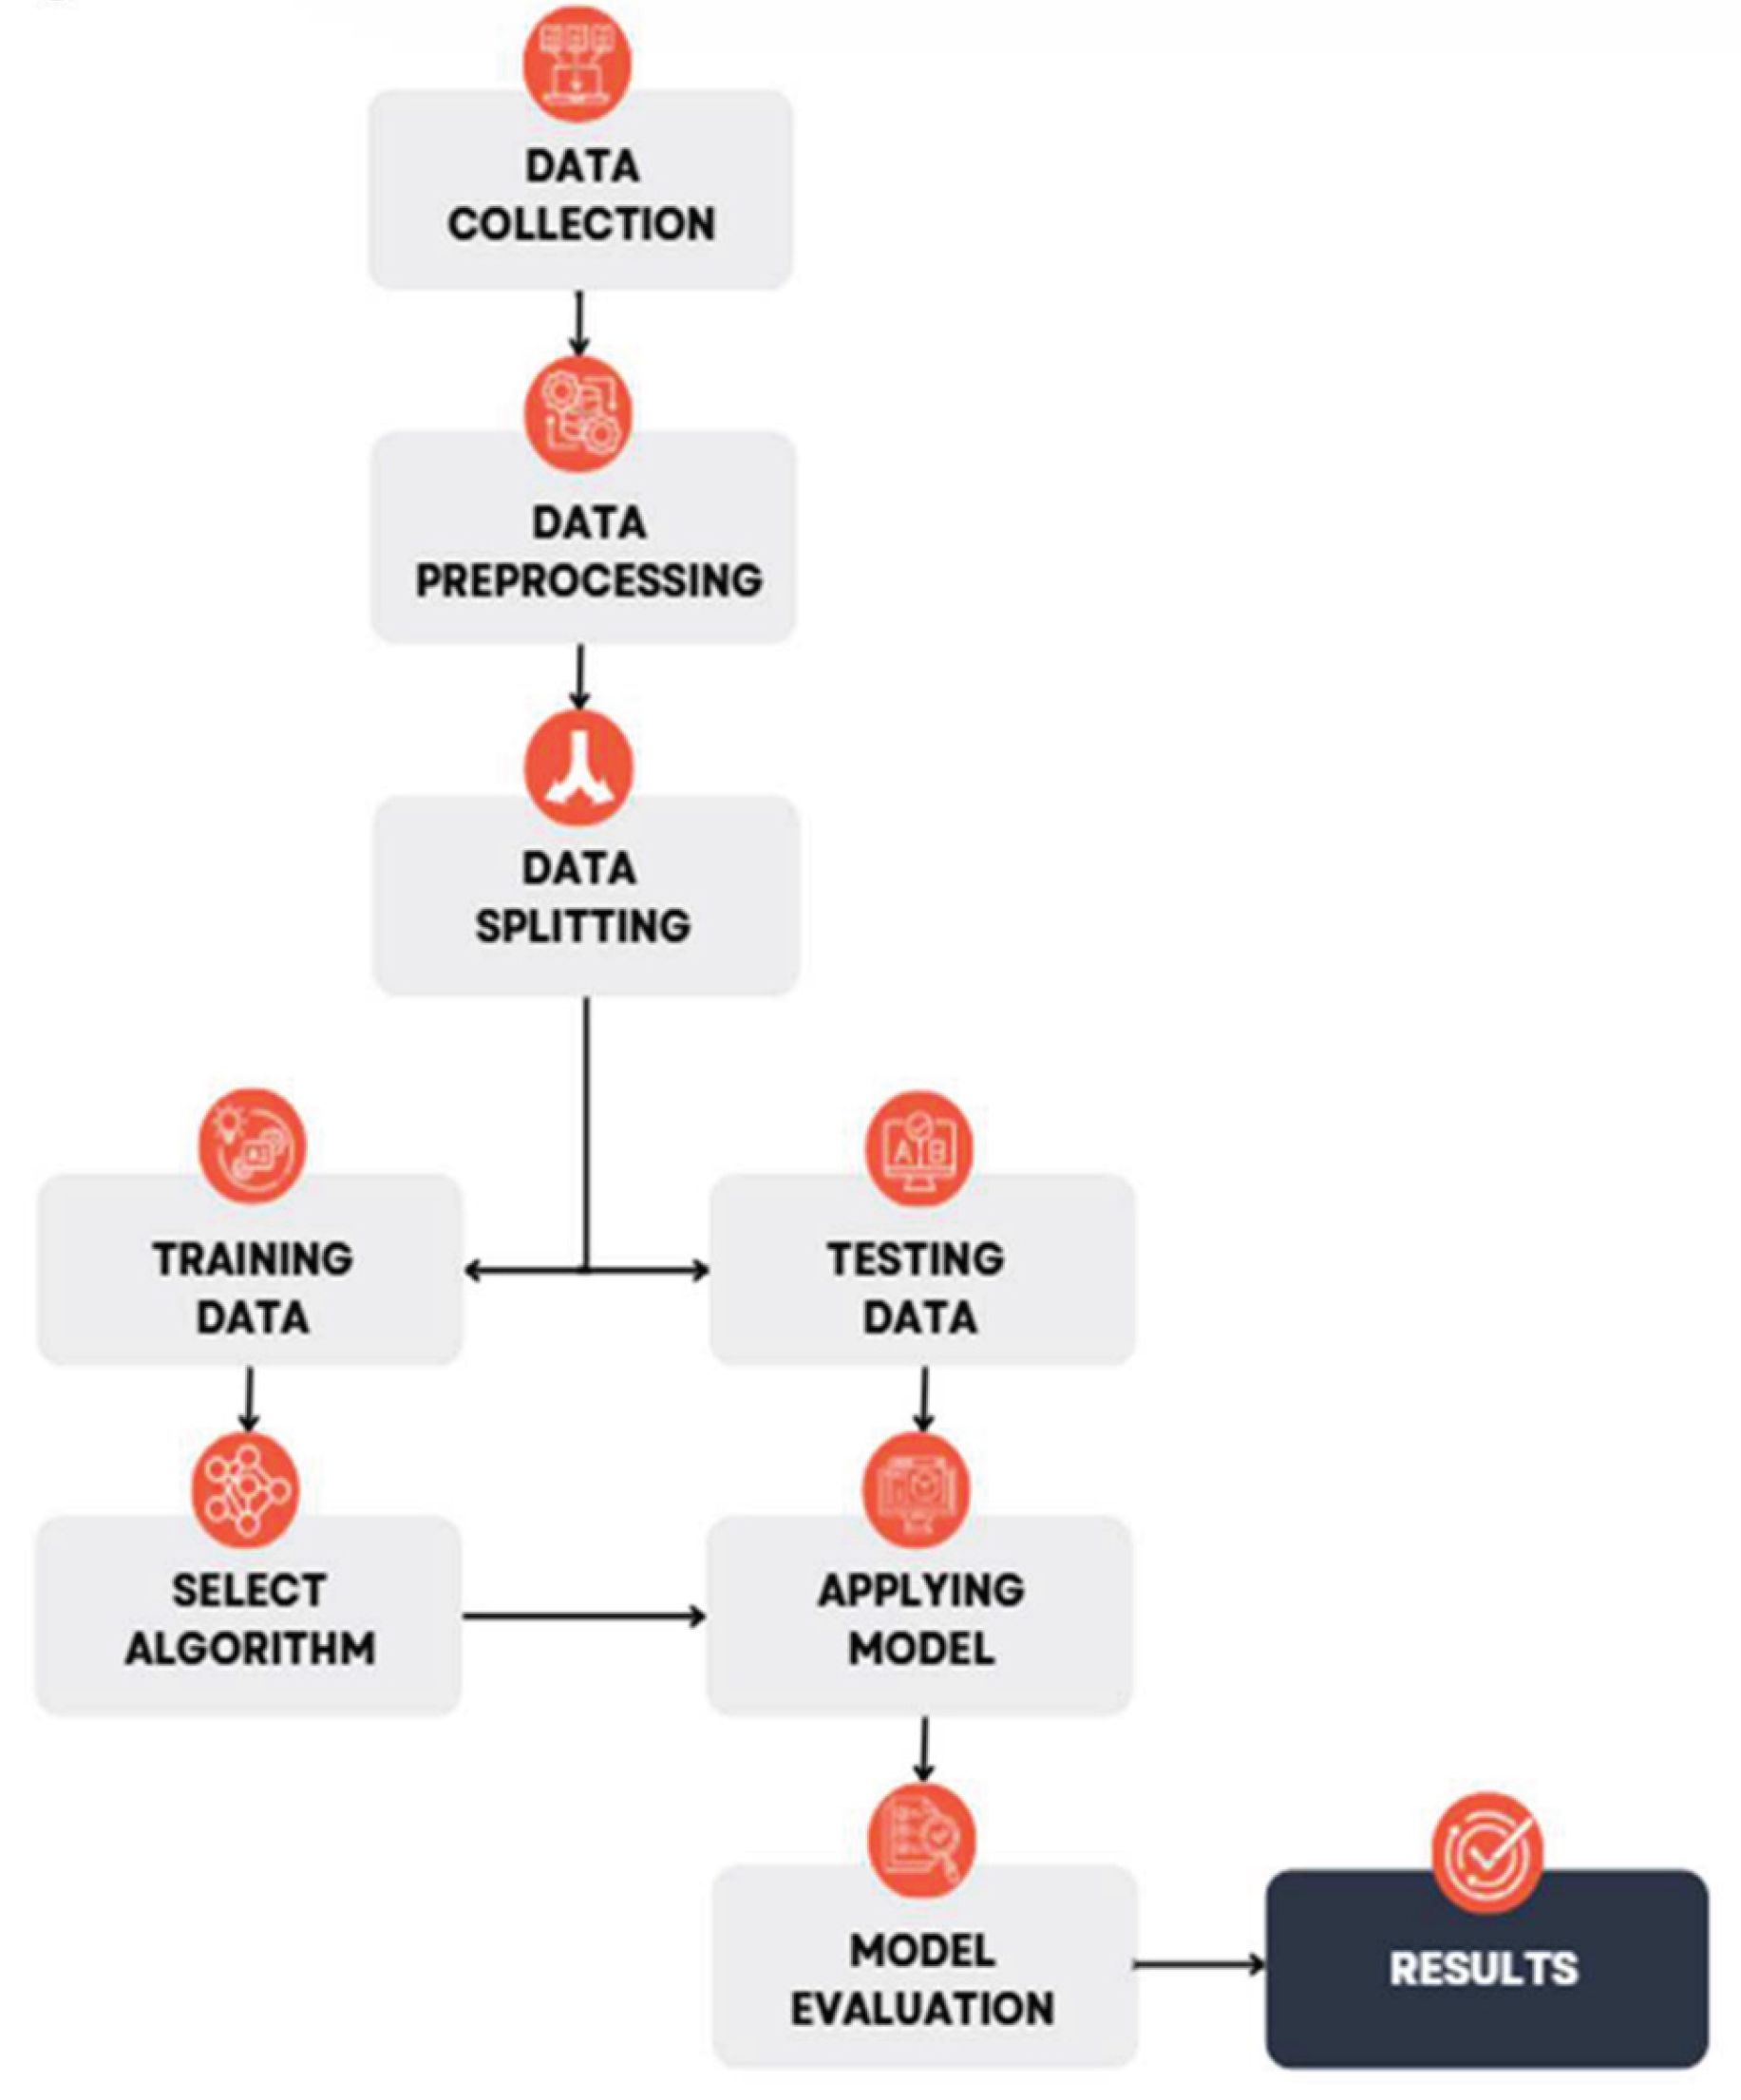
Figure 3.
Dataset before and after SMOTE.
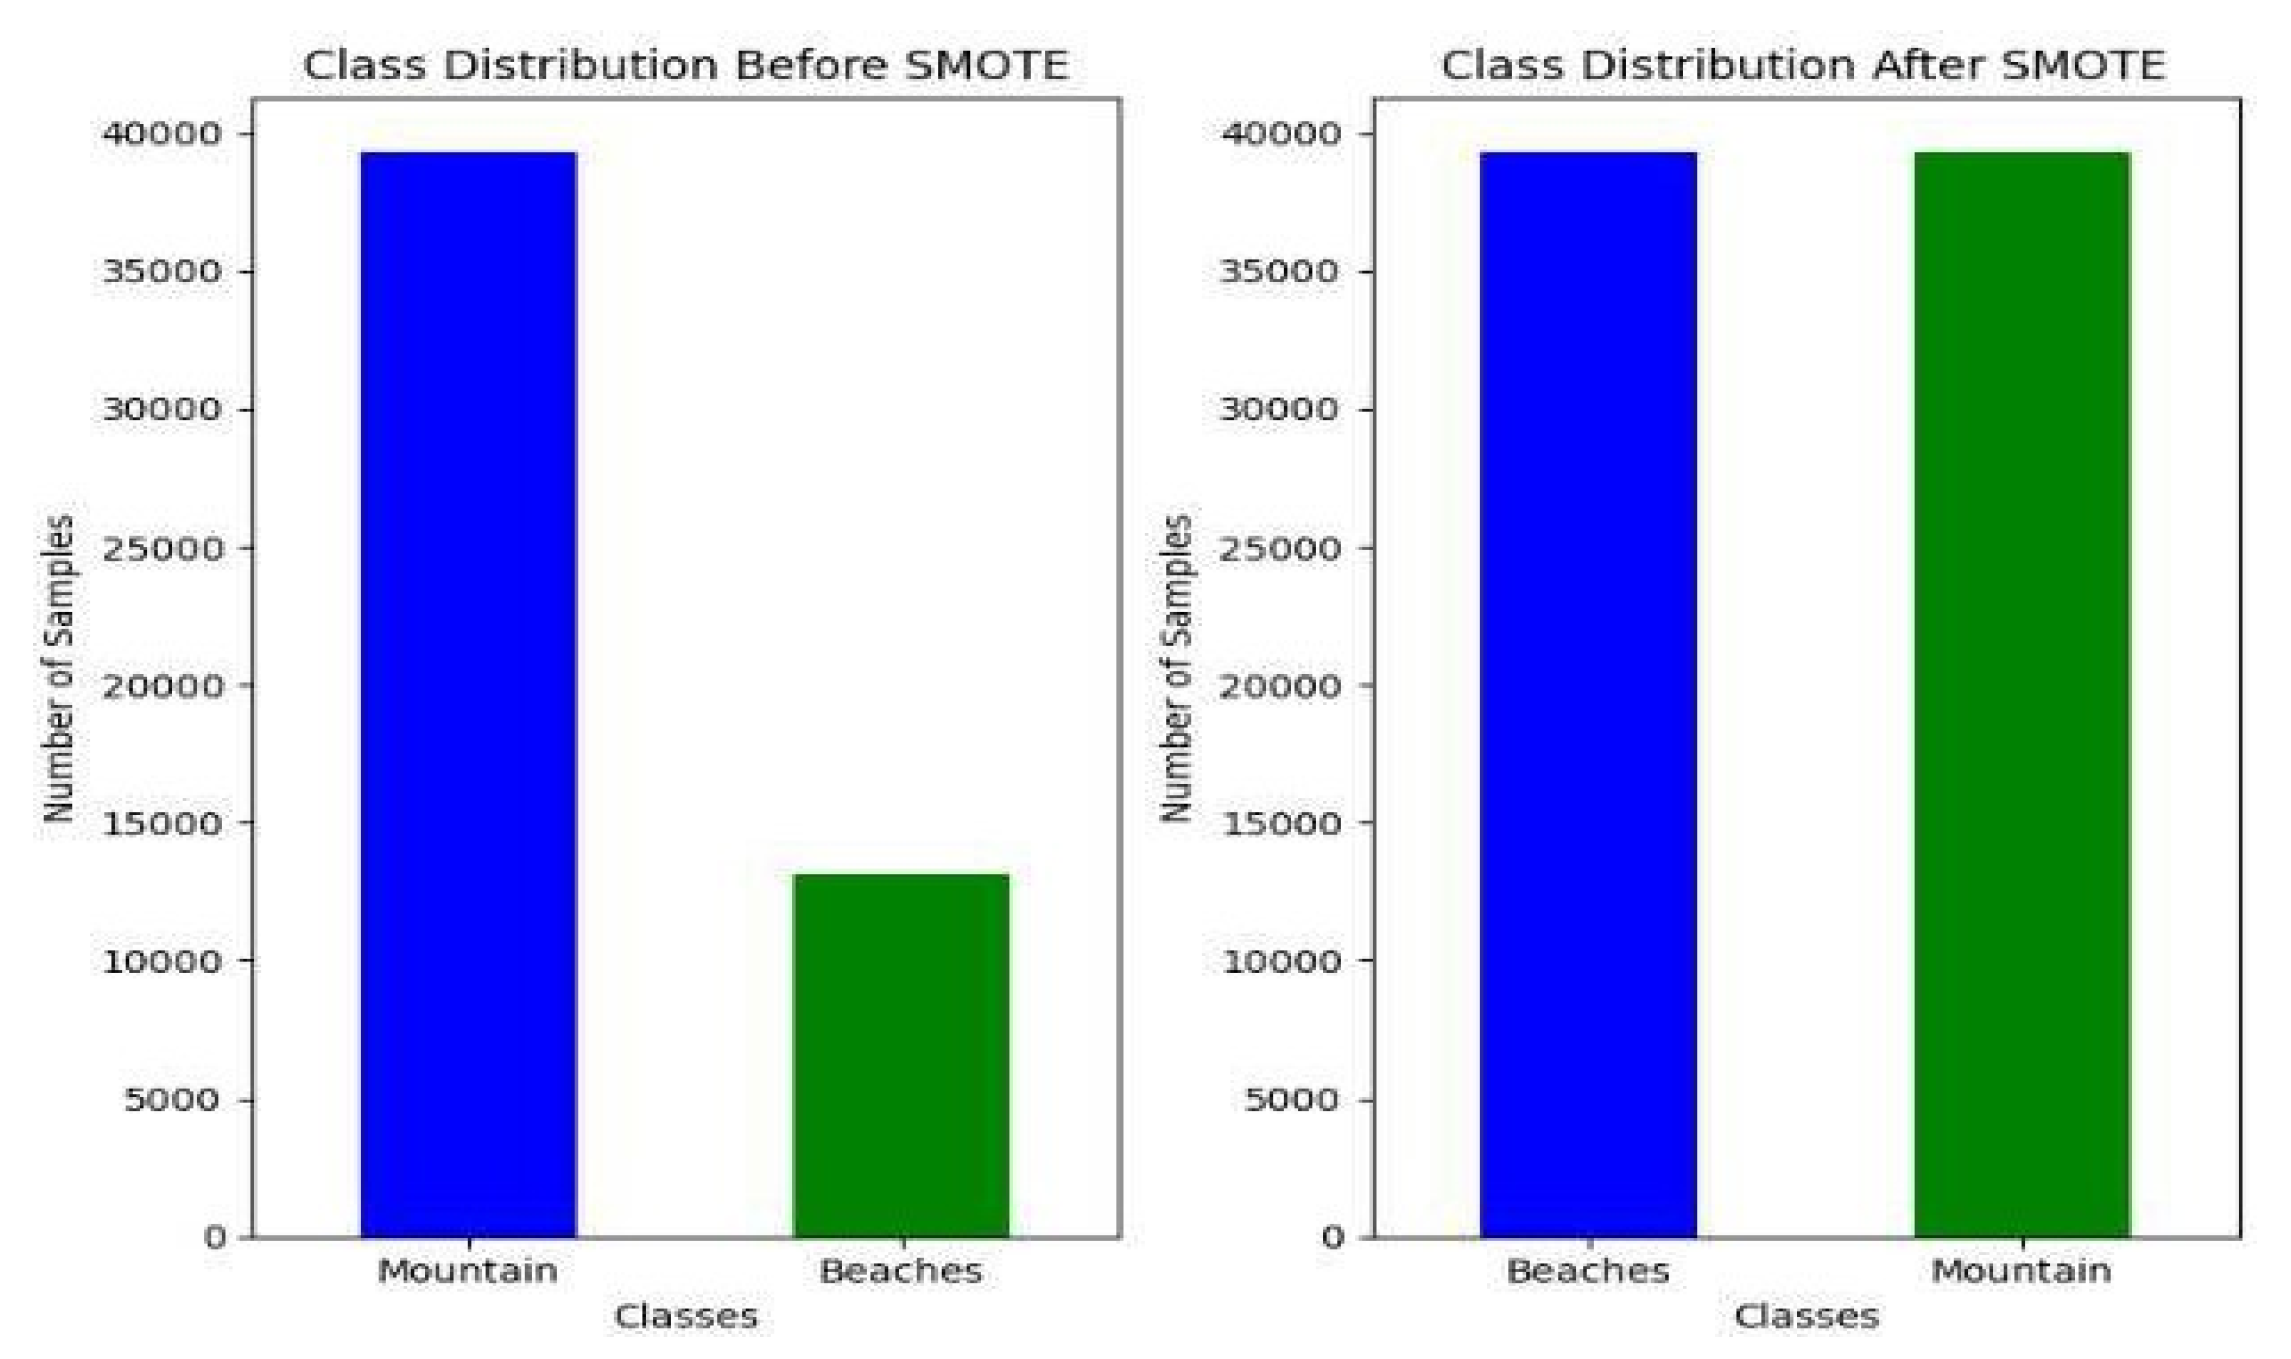
Figure 4.
Data Splitting before and after SMOTE.
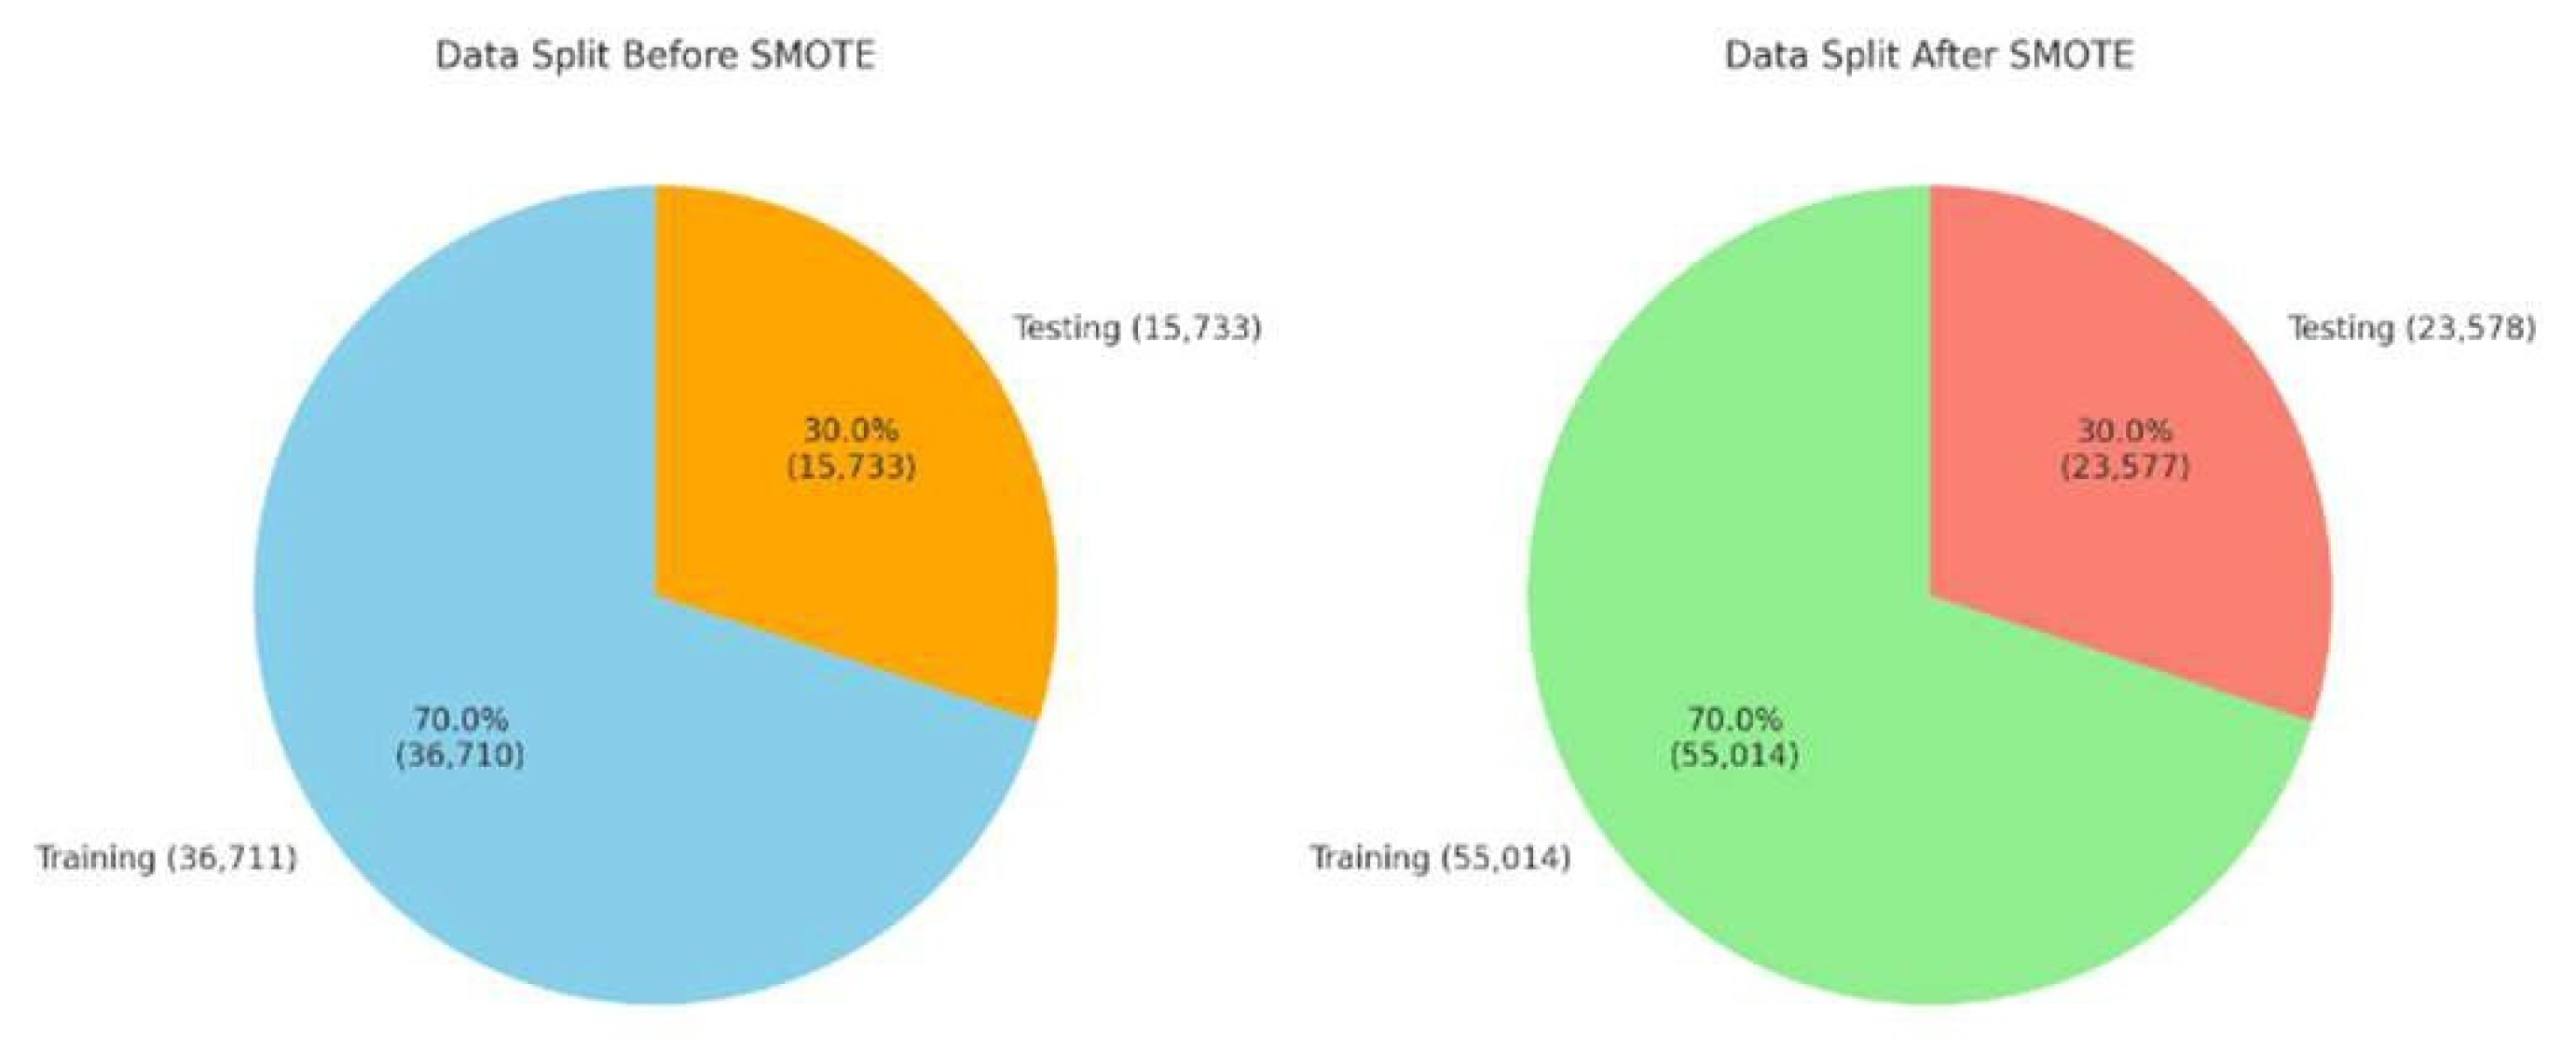
Figure 5.
Applying Model.

Figure 6.
Confusion Matric Before SMOTE.
Figure 7.
Confusion matrix (after SMOTE).
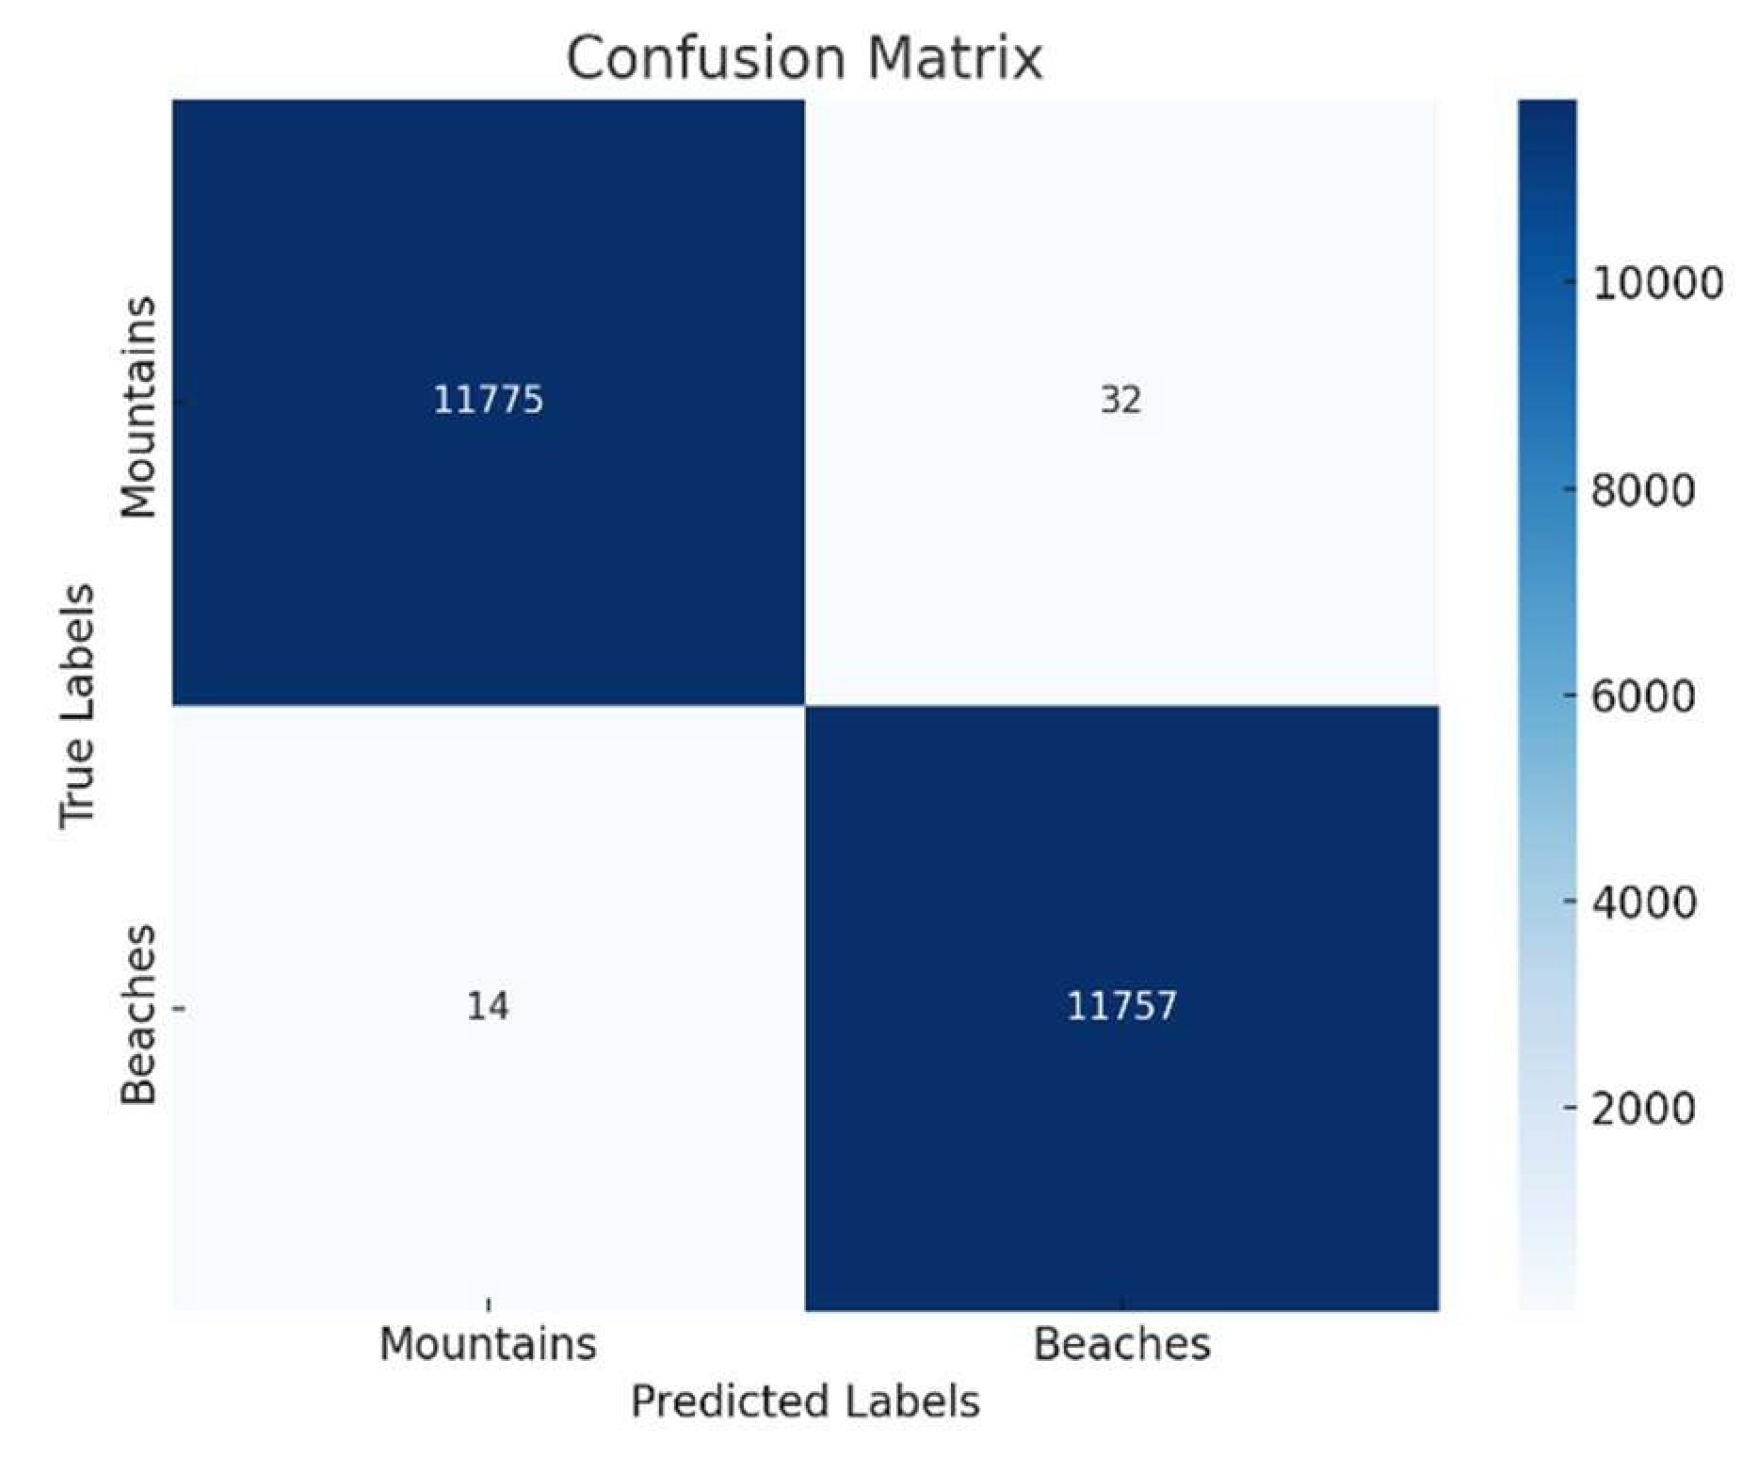
Figure 8.
Accuracy Comparison Between Imbalanced and Balanced Datasets.
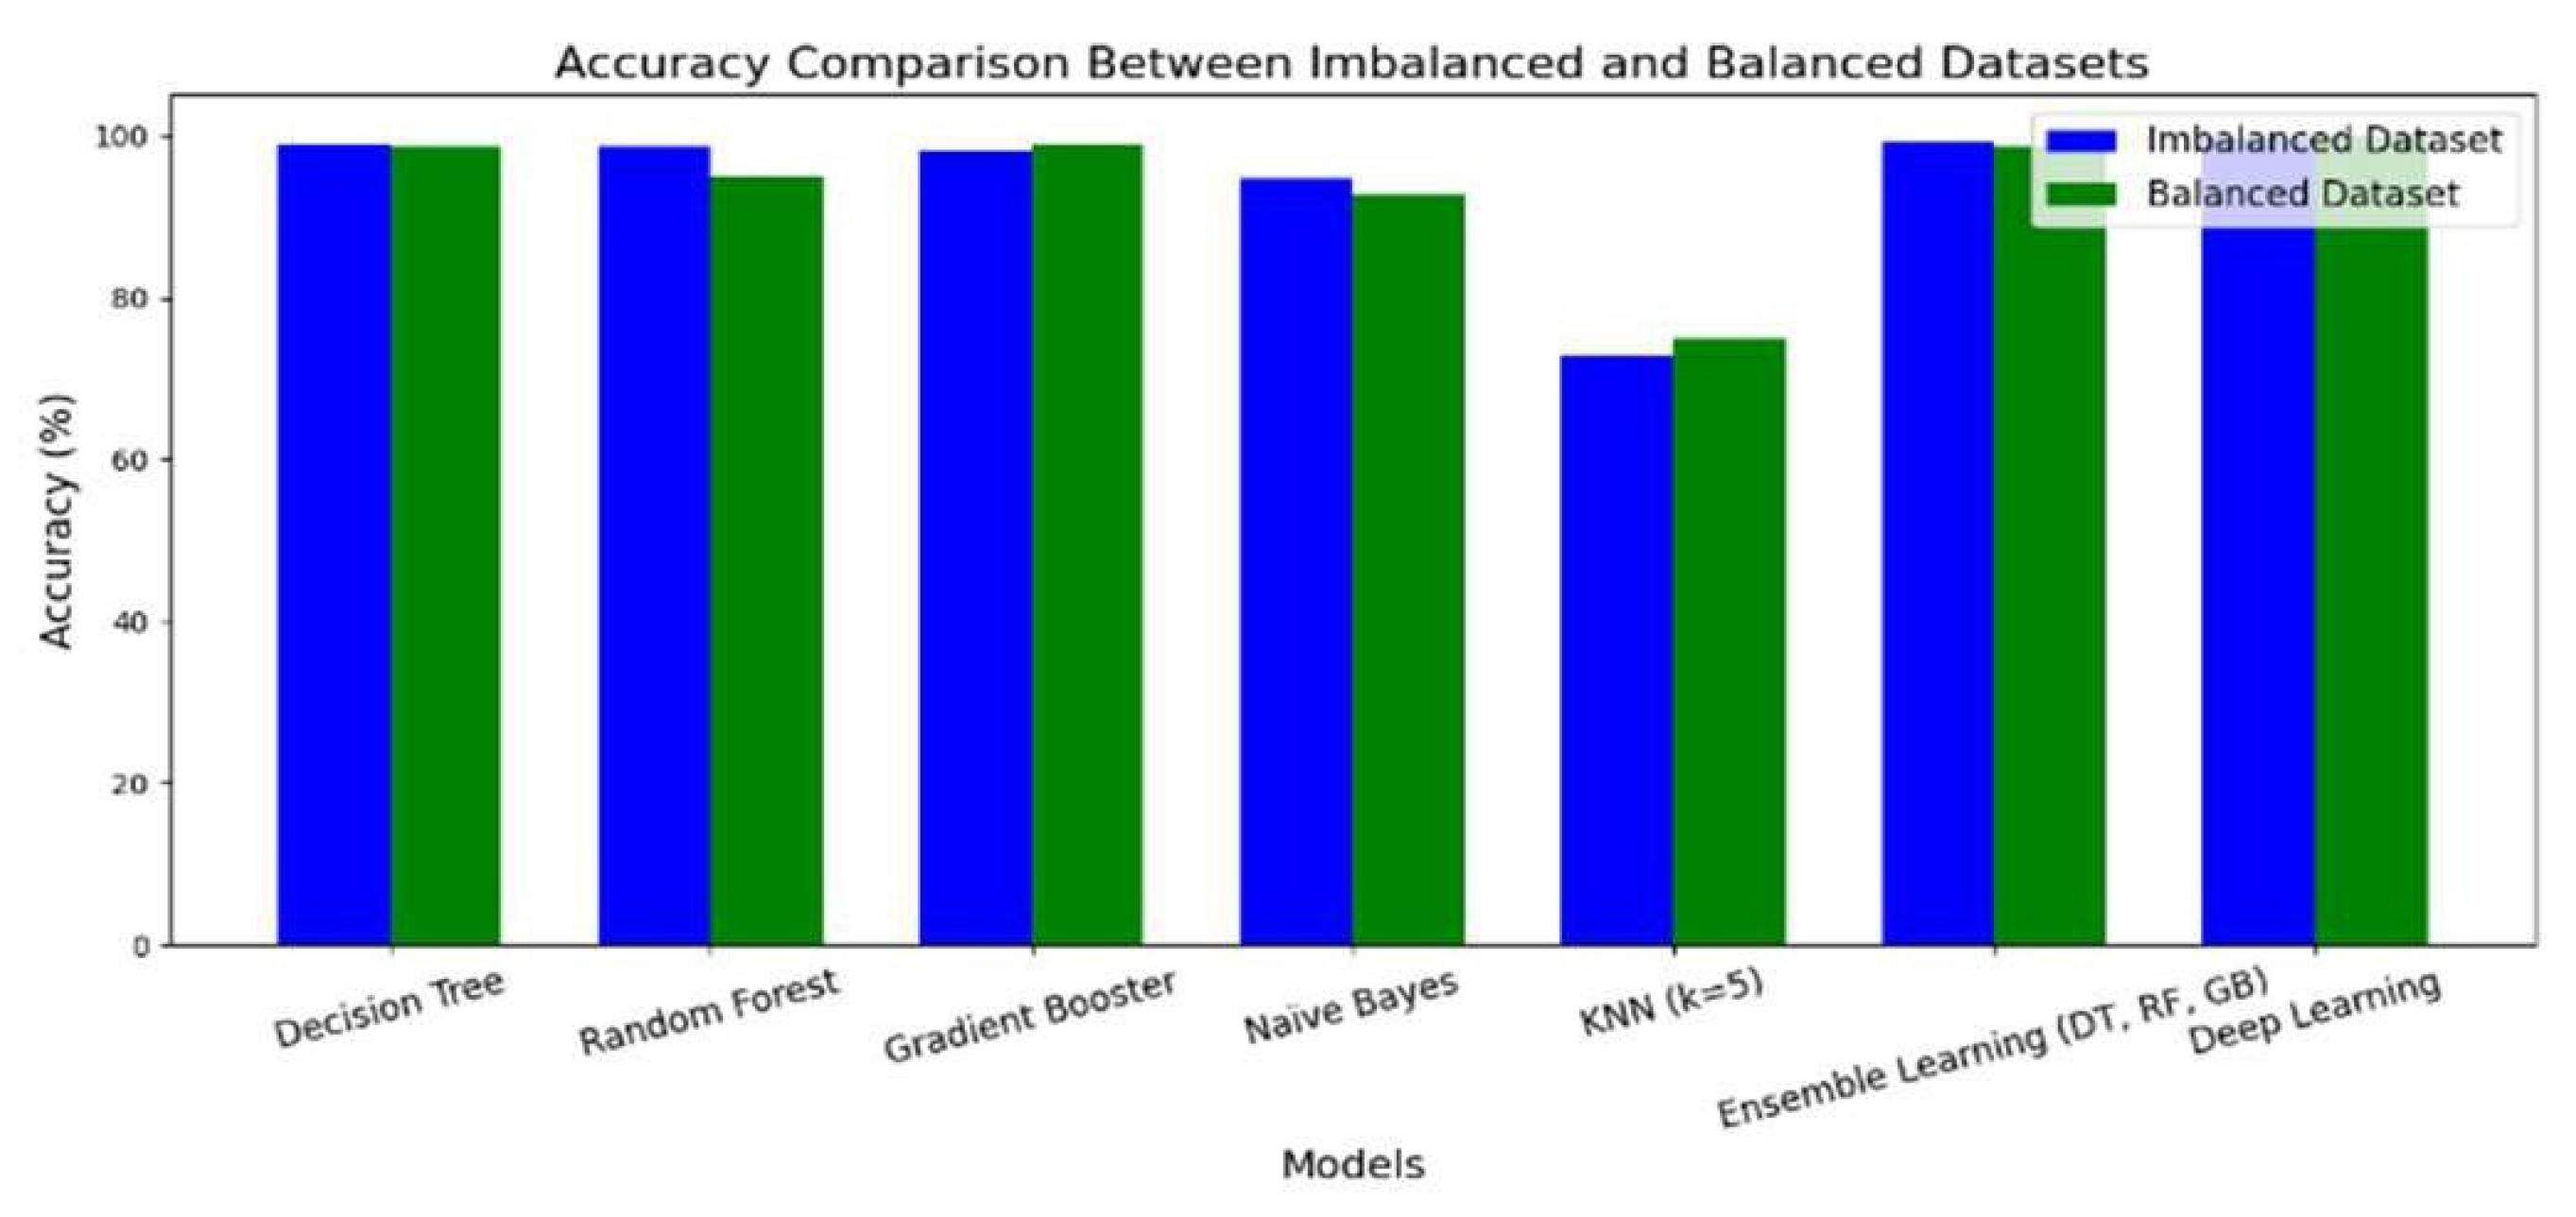

Table 1.
Performance on Imbalanced Dataset.
| Algorithms | Accuracy | Precision | Recall | F1-score |
|---|---|---|---|---|
| Decision Tree | 98.97% | 99.10% | 99.52% | 99.34% |
| Random Forest | 98.77% | 99.03% | 99.33% | 99.20% |
| Gradient Booster | 98.27% | 99.32% | 98.36% | 98.78% |
| Naïve Bayes | 94.71% | 93.40% | 100.00% | 96.58% |
| KNN (k=5) | 72.75% | 77.65% | 89.35% | 83.02% |
| Ensemble Learning (DT, RF, GB) | 99.14% | 99.33% | 99.52% | 99.44% |
| Deep Learning | 99.62% | 99.88% | 99.61% | 99.74% |
Table 2.
Performance on Balanced Dataset (After SMOTE).
| Algorithms | Accuracy | Precision | Recall | F1-score |
|---|---|---|---|---|
| Decision Tree | 98.63% | 99.64% | 97.61% | 98.67% |
| Random Forest | 94.94% | 99.66% | 90.19% | 94.54% |
| Gradient Booster | 98.85% | 98.30% | 99.41% | 98.86% |
| Naïve Bayes | 92.76% | 92.23% | 93.38% | 92.90% |
| KNN (k=5) | 74.96% | 82.92% | 62.86% | 71.52% |
| Ensemble Learning (DT, RF, GB) | 98.61% | 99.66% | 97.56% | 98.60% |
| Deep Learning | 99.81% | 99.76% | 99.86% | 99.82% |
Disclaimer/Publisher’s Note: The statements, opinions and data contained in all publications are solely those of the individual author(s) and contributor(s) and not of MDPI and/or the editor(s). MDPI and/or the editor(s) disclaim responsibility for any injury to people or property resulting from any ideas, methods, instructions or products referred to in the content. |
© 2025 by the authors. Licensee MDPI, Basel, Switzerland. This article is an open access article distributed under the terms and conditions of the Creative Commons Attribution (CC BY) license (https://creativecommons.org/licenses/by/4.0/).
Copyright: This open access article is published under a Creative Commons CC BY 4.0 license, which permit the free download, distribution, and reuse, provided that the author and preprint are cited in any reuse.


