Submitted:
16 December 2025
Posted:
17 December 2025
You are already at the latest version
Abstract
Objectives: Intensive care units (ICUs) are characterised by high care complexity and nursing workload, which directly affects patient safety and staff sustainability. Latvia faces a chronic shortage of nurses, particularly in intensive care, yet systematic national data on nursing workload have been lacking. This study aimed to quantitatively assess nursing workload in Latvian ICUs using the Nursing Activities Score (NAS) and to evaluate its relationship with staffing adequacy. Methods: A prospective, multicentre observational study was conducted over six months (May–November 2025) in 14 Lat-vian ICUs representing all three levels of intensive care. Nursing workload was meas-ured using the NAS during each 12-hour shift. A total of 28,079 complete NAS obser-vations were analysed using descriptive statistics, inferential tests (t-tests, ANOVA), mixed-effects modelling, regression analysis, and time-series forecasting. Results: The mean NAS was 65.45 (SD = 25.76), equivalent to an average of 15.71 nursing care hours per patient per day. Workload remained similarly high during day and night shifts. Significant differences were observed between ICUs and care levels, with level 2 units showing the highest workload. The average nursing shortage rate was 42.6% and was strongly predicted by NAS values (R² = 0.115), whereas shift type and unit level had minimal explanatory power. Conclusions: ICU nursing workload in Latvia is persis-tently high and unevenly distributed across units. Staffing levels are not adequately adjusted to actual care demands. Integrating NAS-based workload monitoring into staffing models is essential for evidence-based workforce planning, improving patient safety, and reducing nurse overburdening.
Keywords:
intensive care units
; nursing workload
; personnel staffing and scheduling
; health workforce
; Latvia
1. Introduction
ICU are the health care environment with the highest patient care intensity, where sufficient nursing staff is critical for ensuring high-quality and safe care [1]. The matter of nursing workload and staff shortages in ICUs has been raised in many countries in recent years and was particularly exacerbated by the COVID-19 pandemic [2]. These challenges are striking in Latvia because the number of nurses per capita is significantly lower than the EU average – around 4.2 nurses per 1,000 inhabitants, which is less than half the EU average of ~ 8.5, and the healthcare system faces a persistent shortage of qualified staff [3]. In particular, there is an acute shortage of nurses in ICUs in Latvia: out of almost 9,000 active nurses, only around 600 specialise in intensive care and are registered nurses with a specialisation, and due to limited resources, one ICU nurse often has 2-3 critically ill patients at a time, although optimally a separate nurse should be provided for each patient [4]. Such a situation, where the nurse/patient (N/P) ratio is higher than stated in international recommendations, poses a serious risk to the quality and safety of patient care and overburdens staff [5].
The direct impact of staff shortages is reflected in increased patient safety risks and impaired treatment outcomes [6]. Scientific studies have shown that excessive workload for nurses in ICUs has a negative impact on patients’ health [6,7]. Under high workload conditions, the incidence of adverse events such as errors, infections and even mortality, increases [7]. A systematic review found [8] that higher nursing workload in ICUs is statistically associated with higher patient mortality risk and more adverse events. At the same time, overburdening also affects the staff, and prolonged activity in understaffing conditions contributes to professional burnout and staff turnover [8]. For example, studies in similar healthcare environments, including in Belgium, have shown that high nursing workload correlates with accelerated attrition of nurses and lower patient care outcomes [9]. Similar tendencies are also observed in Latvia. ICU managers point out that constant tensions and overburdening contribute to the departure of young nurses from the sector, with mostly older nurses staying at work [10]. This leads to a vicious circle where the quality and safety of care deteriorate due to insufficient staff, while the complexity of care and stress levels make it difficult to attract new specialists and retain existing ones [11].
In recent years, much attention in international literature has been paid to quantifying and optimising ICU nursing workload for the sake of patient safety [12]. One of the most widely used tools for measuring nursing workload in intensive care is the Nursing Activities Score (NAS) [12]. The NAS was developed in 2003 by D. Miranda and co-authors as an improved alternative to previous evaluation systems such as TISS-28, and it has gained widespread international recognition, reaffirming reliability and practical applicability in intensive care environments in studies in different countries [13]. The NAS allows the amount of nursing care to be quantified, expressed as a percentage of the time of one shift. For example, 100 NAS points correspond to a situation where a shift of one full-time nurse is fully required to care for a patient during 24 hours [13]. According to the latest meta-analysis summarising 70 observational studies, > 56,000 patient data, ICU patient care globally requires about two-thirds of one nurse’s shift on average or ~ 66% of the workload per patient [12]. Moreover, NAS values tend to be even higher in certain periods, such as during patient admission and morning hours, and the average workload increased significantly during the COVID-19 pandemic compared to the pre-pandemic period [12]. This data challenges the conventional assumption that a fixed N/P ratio (for example, 1:2) is sufficient for an ICU. In fact, the average level of patient care intensity is closer to that of nearly 1:1 care, especially in case of severely ill patients and in crisis situations [14]. International experts therefore call for flexible staff planning models that take into account actual care needs, such as dynamic redeployment and reinforcements in situations where NAS values are above normal workload [15]. Traditional fixed staffing standards in many places no longer guarantee adequate care, and several countries are revising staffing principles based on objective workload measurements [16].
Latvia’s situation has so far been understudied compared to the international context. Although Western countries have developments in nursing workload monitoring and far-sighted staff planning, systematic measurement of nursing workload has not yet been implemented in Latvia [4]. The NAS was chosen as an appropriate solution for the intensive care needs of Latvia, as it covers approximately 81% of all nursing activities in intensive patient care compared to the older TISS-28, which covered only ~43% [5]. It is important that the NAS assessment is universal and independent of patient diagnosis, severity of disease or specific ICU profile [13]. This means that NAS results are comparable on a large scale and allow an objective assessment of how much patient care nurses actually do during their working hours. Experience of foreign countries has shown that integrating such an objective workload measurement approach into staff management makes it possible to better balance the number of nurses with patients’ needs, prevent overburdening and improve the quality of care [9]. In other words, nursing workload data can serve as a basis for evidence-based decision-making, such as optimal measurement of the nurse/patient ratio in a particular unit, reallocation of work tasks or introduction of support mechanisms to ensure patient safety and better treatment outcomes [15,16].
In view of the above, it is clear that there is an acute need in Latvia for studies that evaluate the nursing workload in ICUs and allow for comparison with international data. So far, the country lacked empirical data to quantify the size and structure of nursing workloads in intensive care units [4,5]. It is intended to bridge this knowledge gap with a study, which collects NAS measurements in several hospitals in Latvia in a uniform and systematic manner for the first time. Within the framework of the study, 28,079 observations were performed over 6 months in 14 ICUs across Latvia, filling the NAS, which provides the broadest insight so far into the nursing workload on a national scale. This data analysis will make it possible to assess actual trends in care intensity in Latvia, compare them with published data elsewhere in the world and identify critical discrepancies between available staff resources and patient needs. A scientifically sound understanding of nursing workload in ICUs in Latvian circumstances is important both in theory and in practice, as it facilitates a wider comparison of international and national contexts, strengthens the theoretical rationale for staff planning and serves as a reference point for further reforms in the healthcare system. Finally, the study provides a reasoned basis for measures aimed at strengthening staff capacity in ICUs, improving the quality and safety of patient care and ensuring better treatment outcomes in the long term.
2. Description of Latvian ICUs
In Latvia’s healthcare system, ICUs form a structural and functional basis for providing acute care to patients with severe, life-threatening medical conditions. To ensure a differentiated approach to the treatment of patients and efficient use of resources, ICUs in medical treatment institutions in Latvia are divided into three levels [17]. Such classification is based on internationally recognised criteria and is defined in the guidelines of the Health Inspectorate and the National Health Service [18].
Level one ICUs are suitable for patients with moderate severity of life function impairment requiring short-term intensive monitoring and treatment, without significant support requirements for organ functions [19]. Level two ICUs provide treatment for patients with more serious conditions, including the need for artificial lung ventilation, invasive monitoring and long-term infusion therapy [19]. Level three ICUs, usually based in university hospitals or large regional hospitals, offer the highest intensity of care, including complex multiorgan support, dialysis therapy, long-term ventilatory support, and 24/7 access to specialist doctors and nursing staff [19].
Nursing staff in each ICU play a central role in patient care regardless of the level. In Latvia, a person may work as an ICU nurse if he or she is a medical practitioner who has acquired at least first-level professional higher education (at college or bachelor level) in nursing studies, has been registered in the Register of Medical Practitioners and, preferably, has acquired specialisation in anaesthetic and intensive care [20]. Specialisation is achieved through graduation of professional improvement programmes harmonised with the requirements of the Cabinet of Ministers (CM) [20]. In addition, a nurse is obliged to renew his or her registration every five years, showing the number of hours of professional continuing education, thus ensuring that their knowledge and skills are in line with the development of the sector [21].
ICU nurses in Latvia are responsible for the entire cycle of patient care, from patient intake and monitoring of vital functions to performing complex procedures, administering medication, providing ventilatory care, communicating with patients and their loved ones, and maintaining care records [20]. Such specificity of care requires high professional competence and the ability to make clinical decisions quickly in complex and evolving situations. Although internationally the optimum N/P ratio in intensive care environments is considered to be 1:1-1.5, in Latvia’s reality this ratio is most often 1:2 or even worse – 1:3 or 1:5, especially at night or during holidays [19]. This disproportion increases the risk of professional error and reduces the quality of patient care.
In addition to registered nurses, several layers of support staff are also involved in the ICU care process. One of them is a medical assistant – a middle-level medical practitioner who is entitled to perform certain manipulations, as well as assist the physician in certain procedures. However, the medical assistant is not responsible for independent assessment or clinical decision-making for intensive care patients and only acts under the supervision of a registered nurse or physician [22].
Nursing assistants, who may not be medical practitioners, in particular students, but have acquired professional qualifications in the field of care, play an important role in practical care. Their duties include patient hygiene, positioning, mobilisation assistance and maintenance of the environment. While nursing assistants perform essential support tasks, they do not have the right to perform medical manipulations or document a patient’s treatment process. Their activities are always based on instructions and take place under the supervision of a registered nurse [23].
Some medical treatment institutions also employ physician assistants who have specific qualifications for performing medical support functions under the supervision of a physician. In the context of intensive care, their role is limited, and this profession is much less common in the units. When they are involved, their tasks are usually not limited to documenting or supporting certain procedures under the guidance of a physician, but they are trained, work and provide care as nurses [23].
The division of responsibility in ICUs is strictly regulated by laws and regulations, including the Medical Treatment Law [23], the Law on the Rights of Patients and the CM Regulations on classification of medical practitioners’ professions and care quality standards [20,22]. In accordance with this regulation, patient care is the responsibility of a treating physician and a registered nurse [23]. The performance of each care activity must be adequately documented and, where an element of care is delegated to another person such as a nursing assistant, the responsibility for supervising it remains with the nurse. This means that the legal responsibility for the care provided to the patient is directly linked to the boundaries of competence, professional standards and documented decisions of a medical practitioner.
The work organisation in ICUs in Latvia is usually based on a shift system where 24/7 care is provided. During day and night shifts, the unit has a certain number of nurses, each responsible for a certain number of patients. Normally, there is also one senior or coordinating nurse in each shift who is responsible for staff allocation, work coordination, communication with physicians and continuity of care, but very often this function is performed by the unit’s head nurse. In level three ICUs, this structure is more detailed and multidisciplinary, while in lower level units the activities tend to be more flexible, but with higher staff workload per patient in care [19].
Such organisational and legal context forms the basis for the quality of the care process and patient safety in the ICU environment of Latvia. At the same time, it marks significant challenges related to insufficient staffing, high workload and the need for structured, data-driven staff planning, especially in level three care centres. It is for this reason that studies [4,5], which systematically analyse the real care workload based on internationally recognised tools such as NAS, become relevant, allowing an assessment of the extent to which the provision of human resources in Latvia corresponds to the actual care needed by patients.
3. Materials and Methods
3.1. Study Design and Purpose
This study was developed as a quantitative, multicentre, prospective observational study aimed at assessing the workload of intensive care nurses in medical treatment institutions of different levels in Latvia using a structured assessment tool – NAS. The main objective of the study was to quantitatively analyse nursing care activities over a six-month period, identifying potential levels of overburdening, structural differences between units and possible discrepancies between available human resources and patients’ needs.
The study focused on studying the impact of staff shortages on the provision of care, not only recording the actual intensity of care (measured in NAS points), but also assessing the level of compliance of the existing number of nurses with the required resource, taking into account the amount of care provided during that shift. Thus, this study provides the first systematic set of data on the nursing workload in intensive care settings in Latvia at the national level, based on the use of an internationally recognised tool in everyday practice.
An important stage in the preparation of the study was the comprehensive training of the staff of interested hospitals in the use of the NAS to ensure a common understanding and consistency of data input. A three-month training cycle led was organised before the beginning of the study. Nurses, unit managers and responsible coordinators of all the ICUs involved attended this targeted training. The training content included the theoretical rationale of the NAS, interpretation of specific care activities, practical application, analysis of examples and simulation situations. As a result, it was ensured that the NAS was practically completed consistently and in line with methodological standards.
The study design was aimed at making the findings reflect the real circumstances of clinical practice without fostering interference of data collection with the care process. The nurses collected the information as they assessed each patient on the NAS based on the care activities carried out in the last 12 hours. The data was collected in all the units involved in the study at the same time over a certain period of time, ensuring comparability between different regions, hospital levels and care practices.
3.2. Analysis Set and ICU Included
14 ICUs from various Latvian medical treatment institutions participated in the study, representing all 3 intensive care level categories, as well as hospitals of different regional and institutional profiles. The selection was based on the principle of voluntary participation by inviting ICUs, which expressed interest in targeted workload assessments and were prepared to integrate NAS recording into the day-to-day care process. The set of units included provides representative coverage, both geographically and structurally, including both university hospitals, national-level hospitals, and also regional and local medical treatment institutions. 5 level three ICUs, 5 level two ICUs and 4 level one ICUs were represented in the study. 3 of the ICUs had mixed-type beds, and had both level 2 and level 3 beds.
Such an analysis set made it possible not only to obtain quantitative amounts of data, but also to compare the intensity of care, staff workload and organisational differences in care environments of different levels. The included units covered both Riga territory and regional hospitals in Kurzeme, Vidzeme, Zemgale and Latgale, thus ensuring comparability of different care models and available resources.
All the units included had a pre-structured composition of care staff, where staff completed NAS as part of their daily shift documentation. In all the hospitals, data entry was done digitally, directly in electronic form, using customised NAS forms.
Overall, the selected sample model ensures good internal and external comparability and enables analysis of both the overall workload trend and the differences between units, regions and intensive care levels. In subsequent analyses, this diversity was used to identify structural and organisational factors that may affect the extent and intensity of care workload.
3.3. Data Collection
Data was collected over a six-month period from 01.05.2025 to 01.11 2025 in all 14 ICUs involved in the study, covering treatment institutions of different levels throughout Latvia. The nurses registered in each unit monitored patients during each 12-hour shift and completed NAS forms based on the care activities performed during that shift. This approach ensured the reliability of the data and at the same time had minimal impact on the flow of daily clinical care.
Data were only collected electronically, and all calculations were made automatically. Recording was performed for all patients who received active intensive care during the given shift, and 28,079 NAS observations were obtained during six months, making this the largest workload data set to date in intensive care in Latvia.
In total, staff from 14 ICUs were involved in the data collection, with 369 registered nurses, 32 physician assistants, 48 medical assistants directly completing NAS and observing and 115 assistant nurses responsible for patient hygiene, care environment and technical support.
This staff distribution reflects the multi-layered care model of intensive care in Latvia, where much of the practical care is organised under the guidance of a nurse, involving support staff as part of the delegation of tasks.
A total of 167 intensive care beds, 29 of which were in level one ICUs, 59 were in level two ICUs and 79 were in level three ICUs, were registered in the study.
Shift work was used in all the units – most often two 12-hour shifts per day (for example, 08:00–20:00 and 20:00–08:00), however, 24-hour shift was still used in many places. During data collection, staff distribution by workdays, weekends and public holidays was also documented, allowing for later analysis of workload fluctuations between different periods.
3.4. Tool Used in the Study
The NAS was used in this study to objectively assess the nursing workload in ICUs. It is one of the most internationally recognised tools for measuring care intensity [12,13]. The NAS was developed as an improved alternative to TISS-28, with a particular focus on the specificity of nursing functions and quantifying workload in the context of intensive care. The NAS includes 23 items that cover the most frequent nursing activities and allow the intensity of care to be expressed as a percentage. The NAS value is 100% equivalent to the full-time work of one nurse with one patient during 24 hours.
Each item on the NAS corresponds to a specific care activity with an assigned percentage (for example, respiratory support, mobilisation, discharge organisation), allowing real-time documentation of care intensity and forecasting of the required staff resource. This feature makes the NAS particularly suitable for both operational workload management and long-term systemic analysis.
Prior to the commencement of this multi-centre study in Latvia, a pilot study was carried out in three ICUs [4] aimed at assessing the suitability of the NAS tool for the local context. As part of the adaptation, terminology was tested, staff training was performed and first experience of usability of the tool was acquired. While the scale of the study was limited, it allowed the practical challenges to be identified and application algorithms to be improved before the wider rollout.
3.5. Data Processing and Statistical Analysis Methods
Upon completion of the data collection, all acquired NAS protocols were centrally collected and prepared for further analysis using IBM SPSS Statistics (version 29). The data processing process involved a sequence of several steps, ranging from quality control and data purification to analysis of descriptive and comparative statistics.
A total of 28,154 NAS protocols were obtained, of which 28,079 complete records were included following manual inspection and quality control. Excluded cases mainly included entries with missing data on the type of shift, NAS total or other relevant variables. Each protocol included information about the hospital code, unit level (Level 1, 2 or 3 ICU), type of shift (day or night shift), total NAS points value, as well as the number of staff and calculated patient/nurse ratio. A staff deficit indicator was also included if the data were available.
As part of the descriptive statistics, mean NAS points, standard deviation, median, quartile (Q1, Q3), interquartile range (IQR) and minimum and maximum values were calculated for each unit and type of shift. These indicators made it possible to characterise the intensity of care in different clinical contexts and to identify variability between treatment institutions.
Several inferential tests were performed to assess statistically significant differences. The independent samples t-test was used to compare NAS points between day and night shifts, while one factor analysis of variance (ANOVA) was used to compare mean NAS values between level one, level two and level three ICUs. In cases where ANOVA showed statistically significant differences, a Tukey HSD post hoc test was applied to identify specific sources of differences between groups. In addition, a Pearson correlation analysis was performed to assess the relationship between NAS point values and the patient/nurse ratio or other workload indicators.
The results were supplemented with visuals, including boxplot charts, to illustrate NAS distribution across different units and shift types, as well as line graphs to analyse care workload dynamics over time. This combined approach made it possible not only to identify structural differences between medical treatment institutions, but also to assess the variability of care intensity according to time of day or month.
Staff shortages were calculated by comparing the actual number of nurses available on a given shift with the theoretical need, which was obtained on the basis of the sum total of NAS points. If the level of actual supply was lower than required, it was classified as a staff shortage and expressed as a percentage. These calculations were made for each medical treatment institution, each month and each type of shift, providing a detailed view of the adequacy of human resources to care needs.
3.6. Ethical Considerations
This study was carried out in accordance with the principles of the Helsinki Declaration [24] and the current Latvian regulatory framework for the protection of human data and research ethics. A permit was obtained from the Ethics Committee of Rīga Stradiņš University (protocol No. 2-PEC-4/416/2023) prior to the beginning of the study, which confirmed that the methodology of the study complied with ethical requirements and subjects’ rights were fully respected.
The study did not collect personally identifiable information, thus ensuring anonymity and confidentiality of respondents at all stages of the study. NAS protocols were completed using unique hospital and shift identifiers that prevent specific individuals from being identified. All the findings were stored in a protected environment with access only by those involved in the study.
Participation in the completion of the data was organised on the basis of informed consent, and all the nurses involved in the study were informed in advance of the purpose of the study, the data usage procedure and the principles of voluntary participation. The data collection did not affect staff work or clinical care, and there was no intervention in the patient treatment process.
During the study, the procedures for division of responsibility and organisational coordination were also followed. The management of each hospital gave formal permission to carry out the study and assigned responsible contacts to collect and transmit NAS data. After analysis of the data, the results will only be used for scientific and policy planning purposes, without the possibility of detecting individual or institution-specific sensitive indicators.
4. Results
4.1. Descriptive Statistics
The mean NAS across the analysis set was 65.45 points (SD = 25.76; median = 60.8; range 10.20–176.8), indicating high care intensity, i.e., care for one patient over a 12-hour shift requires about 2/3 of one nurse’s workload on average. The minimum and maximum values reflect significant fluctuations in workload across shifts and units, from very low care needs to situations where care for one patient requires more than a full nurse workload in one shift. Missing NAS or personnel indicators were not detected because all protocols were completed digitally as mandatory fields (missing data = 0%).
When analysing intensive care levels, the mean NAS was 52.46 points (SD = 23.98) in level 1 units, 79.60 points (SD = 27.97) in level 2 units, and 64.10 points (SD = 23.09) in level 3 units. This indicates a higher workload in level 2 units, where patients with moderate and severe clinical conditions are concentrated.
There were marked variations between the individual units: the lowest overall mean NAS was in unit 7 (M = 38.77) and the highest in unit 1 (M = 86.41). The total NAS distribution interquartile range (IQR 16.90–48.20) demonstrates wide variability in workload, with NAS exceeding 100 points in some cases, meaning that care for one patient required more than a full nurse workload per shift.
Descriptive statistics by unit are summarised in Table 1. It shows not only the mean NAS but also the number of protocols by day and night shifts, the minimum and maximum NAS values per nurse, the average hours of care, the nurse shortage rate and the Workload Index for each unit.
The mean NAS for day and night shifts was similar (65.63 ± 26.14 and 65.25 ± 25.30 points, respectively), meaning that high working intensity remained regardless of the type of shift.
Descriptive statistics are also summarised by levels of care (Table 2). It shows NAS distribution, care time per patient, nurse shortage rate and Workload Index in level 1–3 units. Of all the protocols, 16.5% were for care level 1, 21.1% – for care level 2, and 62.4% – for care level 3.
Descriptive statistics by days of the week and public holidays are summarised in Table 3. The mean NAS on working days was relatively stable (around 64–66 points), while higher mean values were observed on Sundays and public holidays (67.82 and 69.32 points, respectively). This indicates increased work intensity at a time when staff numbers are often more limited.
Descriptive analysis was performed to describe the distribution of NAS points across the dataset. The total mean daily value was 1163.05 (SD = 614.52), while the median was 1148.30. The data range ranged from 23.5 to 2660.4, while the interquartile range (IQR) was 982.4 points.
The figures show mild positive asymmetry (skewness = 0.194) and a slightly flatter distribution than normal (kurtosis = -0.849). The histogram (Figure 1) indicates a left-skewed distribution, while the boxplot chart shows several outliers above the upper whisker.
The test for normality using the Kolmogorov-Smirnov test showed a statistically significant result (D = 0.047, p < 0.001), which, given the large analysis set size, is not surprising and attests to the abnormality of the distribution. However, descriptive indicators and visualisations (histogram, boxplot) provide the basis for further use of non-parametric methods.
4.1.2. Number of Patients
The mean number of patients was 10.28 (SD = 5.50; MD = 10.00) per day shift and 9.43 (SD = 5.70; MD = 8.00) per night shift. The number varied from 1 to 26 patients per day shift and from 1 to 29 patients per night shift. The interquartile range (IQR) was 9 and 8, respectively, indicating a relatively similar distribution of the number of patients in both shifts. Numerical data and the boxplot chart (Figure 2) reflect slight differences in the distribution of patients between shifts, but normality tests (Kolmogorov-Smirnov) indicate a statistically significant deviation from the normal distribution in both groups (p < .001).
Normality tests (Kolmogorov-Smirnov test) for both shifts showed a statistically significant deviation from normal distribution (p < .001), suggesting that the data were unevenly distributed.
There were significant differences in the number of patients in the 14 ICUs. For example, in unit 3, the mean number of patients was 15.86 (SD = 4.75), while in units 1, 4, 11 and 12 the mean number of patients was below 5 per shift. The largest number variation was observed in unit 9 (Range = 18, SD = 3.68) and the lowest – in unit 13 (Range = 7, SD = 1.81). The boxplot chart (Figure 3) clearly reflects significant heterogeneity in the distribution of patients between units.
4.2. Comparative and Inferential Analysis
4.2.1. NAS Differences Between Shifts, Units, Levels and Days of the Week
An independent samples t-test was conducted to assess workload differences between shifts. Mean NAS values during day and night shifts did not differ significantly (Day = 65.63, SD = 26.14; Night = 65.24, SD = 25.30), t = 1.24, p = 0.216. The effect size was negligible (Cohen d = 0.015), suggesting that the workload in both shifts was similarly high. The NAS distribution by shift type is shown in Figure 4 (boxplot).
One factor ANOVA showed statistically significant differences in NAS among units, F = 650.70, p < 0.001. The homogeneity assumption of the variance was not met (Levene F = 207.55, p < 0.001), and the effect size was large (η2 = 0.232), i.e., approximately 23% of NAS variation is due to belonging to a particular unit. The Tukey HSD test showed that the highest mean NAS values were in units 1 and 11 (around 86 points), and the lowest were in units 7 and 13 (around 39–44 points) (Figure 5).
NAS also differed between care levels: Level 1 (M = 52.46; SD = 23.98), Level 2 (M = 79.60; SD = 27.97) and Level 3 (M = 64.10; SD = 23.09). ANOVA results confirmed significant differences, F = 248.13, p < 0.001, with a small but significant effect size (η2 = 0.017). Tukey post-hoc analysis showed that Level 2 is significantly different from Level 3 and Level 1 (p < 0.001), while the difference between Level 1 and Level 2 was not statistically significant (p > 0.05). Spearman’s correlation between Level and NAS was very weak but statistically significant (ρ = 0.040, p < 0.001), confirming the direction that was theoretically expected – higher levels of care are associated with slightly higher NAS.
Mean NAS values varied statistically significantly across the week, with the Spearman’s correlation pointing to slightly higher weekend load (ρ = -0.052, p < 0.001). This is in line with the descriptive results showing higher workloads on Sundays and public holidays (Figure 6).
An independent samples t-test was carried out to assess whether the health care workload varied between public holidays and the rest of the days of the week. When comparing mean NAS points on public holidays (M = 1148.23; SD = 565.17; n = 963) and non-public holidays (M = 1163.58; SD = 616.21; n = 27116), the results showed that there were no statistically significant differences between the groups, t(1044.88) = 0.825, p = 0.409 (bilateral). The Levene test showed unequal variance (F = 36.56; p < 0.001), so the results were interpreted without a homogeneity assumption of the variance. The effect size was small (Cohen’s d = 0.025).
A binary variable was created to assess the differences in the overall NAS score between workdays and weekends, with “0” referring to workdays (Monday-Friday) and “1” referring to weekends (Saturday and Sunday). An independent groups t-test was conducted to compare the mean NAS points between these two groups. The results show that on average significantly higher NAS scores (M = 1187.74; SD = 625.54) were recorded on workdays than on weekends (M = 1089.48; SD = 580.47). The difference between the groups was statistically significant: t(12103.62) = 11.77; p < 0.001. The mean difference between the groups was 98.26 points (95% CI: [81.89; 114.62]).
The effect size was small (Cohen’s d = 0.16), indicating that while the difference was statistically significant, its practical significance could be limited. However, in a clinical context, this trend can signal potentially lower care intensity or patient workload on weekends, which can be important in resource planning and work organisation.
The scatterplot (Figure 7) visually confirms that the distribution of NAS points over time forms a distributed, inconstant structure without a clear trend, which is consistent with a very weak linear regression trend.
Welch ANOVA was performed to verify the robustness of results under unequal variance and group size conditions. The Welch test also confirmed marked interunit differences in mean NAS values (Welch F = 498.74, p < 0.001), and the effect size (Welch ω2 = 0.229) indicated that approximately 23% of NAS variance was due to belonging to a particular unit. The Games–Howell post-hoc test suitable for heterogeneous variances identified several statistically significant differences between unit pairs, including between units 2 and 6 (p = 0.021), which were not detected by Tukey HSD.
Overall, comparative analysis shows that NAS differ significantly among units and care levels, while differences between shifts are statistically insignificant and small.
4.2.2. Mixed Effects Model and Interunit Variation
A linear mixed effects model was created with a unit as random intercept and fixed effects “Level,” “Shift” and “Weekday” to quantify the extent to which variation in NAS values is associated with interunit differences (structure, organisation) rather than just individual shift specifics.
The results showed that the unit factor had a significant impact on NAS values (Wald Z = 10.41, p < 0.001). The intraclass correlation coefficient (ICC = 0.214) indicates that approximately 21.4% of NAS total variance is due to interunit differences. In the fixed effects analysis, the effects of care level (F = 287.4, p < 0.001) and day of the week (F = 4.95, p < 0.001) were statistically significant, while the type of shift showed no significant effect (F = 1.27, p = 0.261).
The model, which was evaluated using REML, showed a better adjustment than a simple fixed effects model (AIC = 266,302.5; ΔAIC = –1540). This means that the inclusion of a unit as a random effect significantly improves the accuracy of the model and data relevance and will confirm that some of the workload variation is structural and systemic rather than purely individual.
4.2.3. Care Time per Patient per Day
By recalculating the NAS scale values in the equivalent form, where 100 points correspond to 24 hours of nursing daily work, the average care time per patient in an ICU of Latvia was 15.71 hours per day (SD = 6.18; range 2.45–43.58). This means that one nurse can provide care to about 1.5 patients (about 65% of full time per patient) on average during a 12-hour shift.
The care time in day shifts (M = 15.75 h, SD = 6.27) and night shifts (M = 15.66 h, SD = 6.07) did not differ significantly (t = 1.02, p = 0.308) corresponding to the nature of continued intensive care. Care time varied significantly between units (p < 0.001), fluctuating between 9.30 and 20.74 hours a day; the effect size (η2 ≈ 0.18) indicates that the unit affiliation explains about a fifth of the variation in total care time.
4.2.4. Care Structure (NAS Domains)
The breakdown of care activities by NAS domains showed that Basic activities (71.7% of total NAS) accounted for the largest share of nursing hours, followed by Renal (12.0%) and Ventilatory care (6.3%). Cardiovascular activities accounted for 2.9%, while Metabolic and Specific procedures combined for about 2.5%. The relative share of neurological activities in total workload was minimal.
A correlation analysis between NAS domains showed several weak but statistically significant relations. The strongest correlation was observed between Ventilatory and Metabolic activities (R = 0.341, p < 0.001), as well as between Cardiovascular and Specific (R = 0.129, p < 0.001) and Cardiovascular and Renal (R = 0.073, p < 0.001). A minor negative relation was found between Specific and Metabolic activities (R = –0.041, p < 0.001). The rest of the correlations were very weak or insignificant, indicating limited overlap between individual care domains. Correlation matrix visualised in domain heatmap (Figure 8).
A Kruskal-Wallis test was performed on all seven NAS domains to assess differences in care workload in NAS domains between day and night shifts. Statistically significant differences between shifts were stated in three domains: Metabolic (χ2 = 10.28, p = 0.001), Specific (χ2 = 18.07, p < 0.001) and Renal (χ2 = 5.74, p = 0.017). In particular, Metabolic and Specific tasks are significantly more frequent or intensive during the day, while in the Renal domain this difference is smaller but still needs to be interpreted clinically. In the other domains – Basic, Ventilatory, Cardiovascular and Neurological, no significant differences were stated, indicating a similar intensity of care regardless of the time of day.
Linear regression analysis was performed to determine which NAS domains have the most impact on total care workload. The results show that the regression model is statistically significant (F = 346.02; p < 0.001) and explains 7.9% (R2 = 0.079) of NAS total workload variance. Among the domains with a statistically significant contribution to the overall NAS score, the largest positive effect was demonstrated by the Ventilatory domain (β = 0.329; p < 0.001), indicating that for patients with a higher share of ventilatory tasks total NAS points are significantly higher. Basic (β = 0.168; p < 0.001), Metabolic (β = 0.062; p < 0.001) and Renal (β = 0.108; p < 0.001) domains also had significant positive effects on the overall NAS workload. Conversely, Cardiovascular (β = 0.009; p = 0.228), Neuro (β = -0.007; p = 0.254) and Specific (β = -0.007; p = 0.308) domains did not show statistically significant impact, indicating that the contribution of these domains is not significant in determining the total NAS score. Thus, the main “workload drivers”, or NAS point makers, are ventilatory, basic, metabolic and renal tasks.
The analysis of care activities did not require a detailed assessment of all 23 NAS items, because an analysis of the level of seven NAS domains was sufficient, and the breakdown of individual items also showed similar trends as in the domain structure.
4.2.5. Nursing Shortage and Relation to NAS
The average nursing shortage across the analysis set was 42.58% (SD = 44.98), indicating significant staff shortages. Shortage levels differed statistically significantly between units (ANOVA: F = 377.89, p < 0.001; η2 = 0.149). The values ranged from 4,51% to 63,34% (see Table 1 and Figure 9). The lowest mean shortage was stated in unit 10 (M = 4.51%) and unit 7 (M = 14.40%), while the highest was stated in unit 14 (M = 63.34%), 13 (M = 62.08%) and unit 9 (M = 62.71%). Tukey HSD showed that unit 10 was fundamentally different from most other units (lower shortage), while units 14, 13 and 9 formed a group with consistently higher shortages (> 60%).
On night shifts, nursing shortages were slightly higher than during the day (M_night = 43.98%, M_day = 41.41%), t = -4.84, p < 0.001, but the effect size was very small (Cohen d = -0.057), indicating a statistically but not clinically significant difference.
The line chart (Figure 10) shows seasonal cyclicality, with a rise in nursing shortage at the beginning of each month followed by a drop, possibly reflecting changes in workload and resources within a month. The boxplot chart (Figure 11) shows a relatively similar median across all months, but with differences in distribution indicating variable shortage intensity over different periods.
Normality tests (Kolmogorov-Smirnov and Shapiro-Wilk) showed that the nursing shortage data differed significantly from the normal distribution (p < 0.001) in each month, so the non-parametric Kruskal-Wallis test was used for comparison. The results showed there were statistically significant differences between months in terms of nursing shortage. One factor ANOVA was performed to evaluate the differences between the month groups. The results show a statistically significant difference between the groups: F = 891.36, p < .001. The effect size is significant (η2 = 0.292), indicating that the month explains about 29% of the variance. Tukey HSD post-hoc tests showed statistically significant differences between almost all month pairs (p < .001), pointing to the dynamic of varied shortages over time. This analysis indicates that the nursing shortage is not homogeneous throughout the period, and in some months (such as May and October) there are larger changes that may be associated with seasonality, staff availability or other organisational factors.
Shortages also differed significantly between levels of care (ANOVA: F = 248.13, p < 0.001; η2 = 0.017). The mean shortage was 48.08% in level 1 units, 51.64% in level 2 units and 38.06% in level 3 units. Tukey post-hoc analysis showed that in level 1 and level 2 units the shortage was significantly higher than in level 3 (p < 0.001), while the difference between level 1 and level 2 was not significant (p > 0.05).
A linear regression analysis showed that the sum of NAS points was a significant predictor of nursing shortage (see Figure 11).
The regression model was statistically significant (F = 3635,15, p < 0,001) and explained the variation in shortage of 11.5% (R2 = 0,115). The overall correlation between NAS and shortage was moderate (R = 0.339). Regression equation:
Nursing shortage (%) = 13.76 + 0.025 × sum of NAS points (1)
This means that each additional NAS point is associated with a mean 0.025% increase in nursing shortage. In hierarchical regression, structural factors (change, care level) alone explained only 0.4% variation in shortage (R2 = 0.004), while summing NAS and number of patients increased R2 to 0.166 (ΔR2 = 0.162, p < 0.001). NAS was the strongest positive predictor (β = 0.522, p < 0.001), care level was secondary (β = 0.224, p < 0.001), but the number of patients showed small negative effect (β = -0.107, p < 0.001), while shift had no significant effect.
The real N/P ratio and the NAS-based required number of nurses per unit were calculated to further assess staff compliance. The results show a significant discrepancy between the actual amount of care resources and the amount of care resources needed. Table 4 summarises key indicators – actual number of nurses, number of patients, real N/P ratio, NAS-based estimated number of nurses required, staff shortages and Workload Index
Boxplots (Figure 12) were created to visualise NAS-based staff demand in various intensive care units. The results show significant differences between units: Units 2, 3, 6, 9 and 10 show the highest average number of nurses required (≥ 15 per shift), while units 12, 13 and 14 show the lowest demand and lowest dispersion.
4.2.6. Relationship Between the Number of Patients, NAS, and Workload Index
The Pearson correlation analysis showed a strong positive relationship between the number of patients and the sum total of NAS points (R = 0.84, p < 0.001), meaning that the increase in patients significantly increases the overall amount of care work. The correlation between the number of patients and NAS per patient was negative but insignificant (R = -0.07, p = 0.09), suggesting that the average level of care intensity per patient remains relatively constant regardless of the total number of patients. The ratio between the number of patients and Workload Index was positive and statistically significant (R = 0.42, p < 0.001), indicating an increase in workload per available nurse as the number of patients increased.
The linear regression model confirmed this relationship: the number of patients statistically significantly predicted Workload Index, F = 52.14, p < 0.001, explaining 31% variation in work intensity (R2 = 0.31). The workload increased in proportion to the number of patients; however, at very high patient counts, the “plateau” effect was observed – NAS_sum continued to increase, while the Workload Index stabilised, possibly indicating that the staff capacity limit has been reached.
Pearson correlation between the NAS sum and the actual number of nurses in shifts was not statistically significant (R = 0.000, p = 0.953), meaning staff counts are systematically not adjusted to the actual care intensity.
4.2.7. Z-Score Normalisation and Workload Heatmap
NAS values were standardised using Z-score transformation to ensure comparability between units and weekdays (mean = 65.45; SD = 25.76):
Positive Z-score values (> 0) indicate a higher workload than the national average, negative (< 0) – a lower workload. The heatmap (Figure 13) shows the mean Z-score values in each of the 14 units over 7 days of the week.
The highest Z-score values (Z > +0.8) were observed in units 1 and 11, especially on Mondays and Tuesdays, where the workload exceeded the national average by 20-30%. Medium level values (Z ≈ 0) were observed in units 4, 5, 9 and 14, while significantly lower loads (Z < –1,0) were recorded in units 7 and 13, especially on weekends. The heatmap also visualises weekly cyclical fluctuations – in several units (e.g., 3, 5 and 9) NAS values dropped on Fridays and rose again on Mondays. Positive Z-score values (Z ≈ +0.5… +1.0) generally dominated in level 2 units, confirming that the workload in these units was consistently higher throughout the weekly cycle.
4.3. Time Trends and Forecasts
4.3.1. NAS Time Trend
Curve Estimation analysis was used to evaluate the dynamics of NAS points over time (May-October). The linear model was statistically significant (F = 139,01, p < 0,001) but explained only a small fraction of the variance (R2 = 0,005), indicating a weak but statistically significant downward trend. The coefficient sign (β = –0,070) shows that the average NAS level decreased slightly over the period. The square and cubic models did not significantly improve the adjustment, and the distribution of NAS points over time did not show a clear cyclical structure.
4.3.2. Monthly Dynamics of Workload and Staff Sufficiency
One factor ANOVA showed statistically significant yet small differences across months in total NAS sums, nursing shortages and Workload Index. The NAS average was the highest in May, fell slightly in the summer months (June-August), but stabilised in the autumn. Nursing shortages were significantly higher in May and gradually declined by October, which is consistent with seasonal workload dynamics – late spring as peak, summer months with relatively lower intensity.
Two-way ANOVA with the factors “Shift” (d/n) and “Month” showed that “Month” had a statistically significant effect on the NAS sum (F = 27.33, p < 0.001, η2 = 0.046), while differences between day and night shifts remained small.
After sensitivity analysis (exclusion of outliers), the results maintain high robustness. The ANOVA results remain statistically significant (F = 1114,764; p < 0,001) and the effect sizes (η2 = 0,928; Ω2 = 0,927) remain very high, indicating a strong effect.
Similarly, the regression analysis shows a stable effect from “Unit” to NursingShortage (β = 0.326; p < 0.001), with the same explanations of variance (R2 = 0.106). Moreover, regression factors and collinearity do not show any significant change. The structure of homogenous subsets remains comparable to the initial one, indicating that the exceptions do not affect the significant conclusions.
4.3.3. NAS and Workload Index Seasonality
NAS and Workload Index seasonality by month are reflected in Figure 14. The sum of NAS in day and night shifts showed similar dynamics – the highest level in May, a decrease in summer months and stabilisation in autumn. The Workload Index fluctuated in a narrow range (around 2.28–2.35), with slightly higher values in May, a slight fall in August, followed by a slight increase in September-October. The differences between day and night shifts were minimal.
4.3.4. Time Series Analysis (ARIMA)
An ARIMA(1,1,16) model with NAS sum total as a dependent variable was used to predict NAS workload dynamics. The model showed good adjustment (R2 = 0.797), indicating that approximately 80% of NAS variation is explained by values of the previous period. Forecast errors were clinically acceptable (RMSE = 276.8; MAE = 126.3; MAPE = 25.4%). The autoregressive factor AR(1) = 0.875 (p < 0.001) indicated a strong dependence on the previous period, while MA components (MA(1), MA(2), MA(16)) were statistically significant, reflecting short-term fluctuations. The autocorrelation of balances varied within ± 0.02 and the chart showed a good correspondence between observed and predicted values. The projections suggest that the NAS workload will remain high in the near future, with a concentration of predicted values around 1100 ± 100 points.
The ACF chart showed a marked autocorrelation in the first lags (lag 1 = 0.56; lag 2 = 0.27), but then the correlations approached zero. The PACF’s first lag dominated the rest, evidencing of AR(1) structure. The Box-Ljung test p < 0.001 confirmed that the time series is not white noise, and modelling is justified.
4.4. Additional Workload Indicators: Workload Index
ANOVA showed statistically significant differences in Workload Index between units (p < 0.001). The highest indices (> 3.0) were seen in units 1, 12, 13 and 14, suggesting significant overburdening, while the Workload Index was below 1.7 in units 7, 8 and 10, indicating a relatively balanced or lower work intensity (Figure 15).
There is a statistically significant positive correlation between the sum of NAS points and the Workload Index (Pearson’s R = 0.221, p < 0.001). This means that as NAS points rise, the Workload Index also grows, although the relationship is weak. Below there is an image of the scatterplot with a 95% confidence interval (Figure 16). In addition, correlations were examined separately by shift, because this is clinically relevant: during day shifts, the relationship was significantly stronger (R = 0.41) compared to night shifts (R = 0.28), indicating that the NAS points-to-workload ratio was closer during the day.
Workload Index differed between levels of care (F = 2430.43, p < 0.001; η2 = 0.148). Post-hoc Games–Howell tests showed that in level 1 and level 2 units the Workload Index was significantly higher than in level 3 units (p < 0.001), while the difference between level 1 and level 2 was not significant (p = 0.53). This indicates that despite the severity of level 3 patients, the Workload Index there is lower, possibly due to fewer patients per nurse or a more effective team distribution.
During night shifts, the Workload Index was statistically significantly higher (M = 2.35, SD = 1.22) than during the day (M = 2.28, SD = 1.22), t = –4.71, p < 0.001, but again with a very small effect (Cohen d = –0.056), indicating minor practical significance.
The Workload Index varied statistically from month to month, but not clinically relevant (F = 3.75, p = 0.002, η2 = 0.001), remaining at relatively stable levels throughout the study period, with slightly elevated values in May and lower in August.
The scatterplot shows a positive but ambiguous relationship between the number of patients and the workload index (Figure 17). As the number of patients increases, on average the workload also increases, but at the same time there are significant differences in Workload Index values with the same number of patients, suggesting that the intensity of care, not just the number of patients, also affects the workload.
5. Discussion
This six-month multicentre study showed that the average time of care per intensive care patient in Latvia is 15.71 hours a day, equivalent to about 65% of full-time nursing workload. In practical terms, this means that one nurse can realistically only provide full care to about 1–1.5 patients during a 12-hour shift. This indicator is in line with internationally published NAS values, where the average care time usually reaches 14–17 hours a day [9,13], and confirms that intensive care nurses in Latvia also have very high intensity of care and clinical involvement in day-to-day work.
However, unlike some international studies [9,12,14], Latvian data reveal a marked heterogeneity between units, care levels and hospitals. Care time between units varied almost twofold between 9.30 and 20.74 hours a day, and the effect size (η2 ≈ 0.18) suggests that the unit relationship explains about a fifth of the variation. This points to significant structural differences in the availability of human resources, in patient profiles and organisational models. Similar interunit fluctuations have also been described in the NAS studies carried out in Belgium [9], where the analysis of several ICUs has shown that the average workload was high but varied significantly between hospitals and units. Thus, Latvia’s results are part of a broader European trend; however, it emphasises, in particular, that the allocation of resources to Latvian ICUs is not proportionally adjusted to the needs of patient care.
In this study, multiple units showed the highest intensity of care, where a nurse should practically provide nearly full-time workload for 1 patient, while in lower-intensity units, one nurse can care for several patients. Such disproportions mean that in individual units nurses must provide care that takes almost twice as much working time as elsewhere. This poses a persistent risk of overburdening associated with both burnout and a higher likelihood of errors in care and adverse events, as evidenced by other studies on nursing workload and patient outcomes [9,25]. This is particularly important in the context of Latvia, as the number of nurses per capita is one of the lowest in the EU [3] and the shortage of ICU nurses is mentioned as a chronic problem.
The analysis of the care activity structure showed that the majority of nurses’ working time in intensive care consists of Basic activities, which account for 71.7% of total NAS, while Ventilatory and Renal care together accounts for a substantial but smaller share. The relative share of Metabolic, Specific and Neurological activities is relatively low. This care profile is in line with international NAS studies, which consistently show that it is general, direct basic care rather than technically complex but less frequent procedures that makes up the bulk of the workload [13,26]. This challenges the intuitive notion that intensive care nurses “primarily carry out technical tasks”; in fact, basic care – hygiene, positioning, communication, pain therapy, observation – is the core of the work and requires most of the time.
The NAS domain correlation structure confirmed that the scale functions multidimensionally – correlations between domains were generally weak. However, certain combinations of activities, particularly ventilatory and metabolic care as well as cardiovascular and renal care, marked specific physiological workload “clusters” typical for more severe patients with multiorgan failure. The slight negative correlation between specific and metabolic activities may indicate that acute, high-intensity interventions occur more frequently separately from routine metabolism monitoring, which in turn reflects prioritisation of care at critical moments. Overall, combinations of activities indicate that Latvian ICU nurses are involved in complex, multidimensional care, where both technical manipulations and long-term basic care need to be balanced in one shift.
Seasonal analysis showed moderate but consistent fluctuations in workload and staff shortages during the year: the workload increased in spring (especially in May-June), decreased in summer (July-August) and increased again in autumn. This pattern is consistent with international studies describing an increase in patient flow and intensive care workload in certain periods, including seasonal morbidity and the intensification of elective surgeries [9,27]. In Latvia, these fluctuations are likely to reflect both elective surgery schedules and hospitalisation flows, as well as the period of staff leaves, exacerbating the shortage.
It is important that the day and night shift NAS rates did not differ significantly – the intensity of care remained similarly high regardless of the time of day. Although small and statistically significant differences were found in the rates of nursing shortages and Workload Index, their practical impact was minimal. Also, the interaction analysis showed that the most significant differences between day and night shifts occur just in the spring months, when the workload is higher during day shifts (e.g., more procedures, consultations and transport). In the second half of the summer, these differences ease, and the workload between day and night shifts aligns. These results emphasise the principle of continuity of intensive care: regardless of the time of day, nurses should provide high-intensity care, and staff planning should not assume that the workload is “automatically” lower during night shifts.
The time series analysis using the ARIMA(1,1,16) model provided additional insights into the workload dynamics. The high autoregressive factor AR(1) = 0.875 pointed to a pronounced inertia – NAS values closely follow the previous period, which is characterised by a structurally stable but persistently high workload. The MA components reflected the flattening of short-term fluctuations, while the seasonality signal indicated repeated workload peaks. The ACF and PACF analysis, as well as the results of Box-Ljung tests, confirmed that the NAS time series is not white noise, but contains a structured time dependency that can be used for predictions. In practice, this means that the workload of intensive care nurses is not a randomly volatile process – it is systematic and predictable and should therefore be based on data-driven staff planning rather than just “historical schedules”.
Results on the relationship between nursing shortages and workload are particularly significant. The regression models showed that the formation of shortage is mainly determined by the sum of NAS points, while just structural factors – shift and level of care – hardly explain the shortage. This means the staff shortages are not just a matter of “schedules” or “unit type”. Shortages occur at times when the actual amount of care objectively exceeds the staff capacity available. Interestingly, in units with larger numbers of patients, shortages were not necessarily higher, which may suggest more efficient resource organisation or better job allocation. However, the overall trend is clear: the higher the NAS, the higher the shortage – and this pattern is most pronounced in level 2 units, where both acute and long-term intensive care patients are treated at the same time.
The conclusion that traditional structural categories such as “day/night shift” or “unit type” are not sufficient to predict and address nursing shortages is relevant from a policy and managerial point of view. The results highlight the need to use NAS or similar objective workload indicators as a primary tool for personnel planning. This is in line with international recommendations, which emphasise that fixed nurse/patient ratios (e.g., 1:2) no longer guarantee adequate care, especially in cases of complicated clinical and resource limitations [9].
In the context of Latvia, these results should be seen against the background of the overall systemic situation – lower nurse/inhabitant ratio, relatively low number of ICU nurses, ageing staff and difficulties in attracting young specialists. The study shows that ICUs already have high workloads that are often close to maximum capacity, significant staff shortages and marked interunit differences. Such a situation poses a serious risk both to patient safety and the well-being of the nurses, contributes to burnout, moral distress and potential staff turnover, as already demonstrated by both Latvian and international studies on intensive care staff.
Overall, the results of this study confirm that intensive care nurses in Latvia face a high intensity of care, significant variability of workload between units and moderate but significant seasonal fluctuations. The data show that nursing shortages are closely linked to the objectively measurable care workload rather than just schedule principles and reveal that the current allocation of resources is insufficient to ensure a smooth quality of care across ICUs. These results provide an important evidence-based basis for the introduction of a single NAS-based workload monitoring system, which would allow predicting peak loads, adapting staff numbers in a timely manner, reducing overburdening and improving outcomes of both patients and nurses in intensive care in Latvia in the long term.
6. Proposals
The results of this study clearly show that the workload of intensive care nurses in Latvia is very high and structurally heterogeneous, while the availability of staff often does not correspond to the actual intensity of care. The range of workload fluctuations between units, which is almost twice the mean value, indicates a significant systemic disproportion in human resource allocation and confirms the need to introduce uniform data-driven tools for personnel planning. A number of interconnected measures are needed, covering both the organisation of day-to-day activities and national health policies, in order to address these challenges effectively and ensure smooth and safe care across ICUs.
First, the study demonstrates that the transition from a fixed nurse/patient ratio to a dynamic care intensity-based approach is essential in staff planning. The average time of care in Latvia reaches 15.71 hours a day and indicates that 1 nurse can only care for about 1 patient in high-intensity conditions. The fixed relationship is no longer effective under these circumstances as it does not ensure sufficient staff at times of high workload. Dynamic models that take into account the NAS workload percentage would make it possible to identify more accurately the amount of human resources needed and reduce variations in the quality of care. Such a model is used in many European countries, and the results of the study clearly indicate that this approach would be particularly important in Latvia.
Secondly, the introduction of a single NAS-based workload monitoring system in all ICUs is essential. At present, interunit differences show that staff decisions are often made based on historical norms or schedules rather than on actual workload levels. A common system for collecting and analysing NAS data would enable an objective identification of the units experiencing an acute shortage of human resources, where additional positions are needed, and would ensure a horizontal levelling of human resources between hospitals. In addition, a NAS-based system would allow the creation of a centralised data platform functioning in real time that would provide management with an accurate workload forecast and warn about potential critical periods.
Thirdly, the seasonal fluctuations observed during the study reveal that personnel planning in Latvia often does not take place according to the actual dynamics of patient flow. The increase in the workload in spring and the decrease in summer is stable and repeat each year, but staff schedules and resources are not always adjusted to these trends. Seasonal projections should therefore be integrated into annual staff planning, providing additional human resources during periods of an increase in elective operations and acute patient intensity. This would help avoid situations where there is a simultaneous increase in workload and reduced availability of staff due to the holiday season.
Fourthly, it is necessary to improve information technology solutions that allow automated calculation of the required personnel and forecasting of workload changes. Digital decision support systems integrating NAS data, workload indices and time series forecasts would be able to provide accurate and objective staff planning at the hospital management level. Such systems are already in use in some countries and significantly improve both care safety and resource efficiency [28,29,30]. The introduction of such systems in Latvia would be a strategically important step considering high workload variability and critical staff shortages in intensive care.
In addition to technical solutions, the staff well-being dimension is also essential. The study showed that the workload in individual units approaches maximum capacity, which increases the risk of burnout, moral distress and staff turnover in the long run. Intensive care staff are particularly exposed to emotional and professional overload [31] and, given the shortage of specialists, these risks are even higher in Latvia. It is therefore necessary to develop systematic psychological support, supervision and professional growth programmes to help nurses cope with long-term high-intensity work and maintain long-term work capacity.
Ensuring sustainable outcomes also requires national guidelines for determining the workload of intensive care nurses. At the moment, the lack of uniform guidelines creates a situation where units work based on different principles, and this contributes to uneven quality of care between hospitals. The guidelines should define the frequency of NAS measurements, minimum human resources requirements and risk indicators for situations where the workload exceeds the limits of safe care. Such a system would ensure equality between patients and fairer working conditions for staff, regardless of region or hospital capacity.
Finally, the study highlights that strategic human resources development is essential for the future of intensive care in Latvia. The number of intensive care nurses is below the European average [3], and the ageing trend of staff, together with the insufficient flow of young specialists, poses an additional risk to the resilience of the future workforce. It is therefore necessary to have a long-term plan, which includes the preparation of specialised intensive care nurses, paid supplementary education, competence development systems and career paths that would encourage the attraction and retention of nurses in this sector.
Overall, the results of the study highlight the need for complex, systemic solutions based on objective workload data. A unified use of NAS, dynamic human resource models, digital forecasting systems, integration of seasonal fluctuations and support for staff well-being are complementary elements, the introduction of which can significantly improve the quality and sustainability of intensive care in Latvia. Given the significant differences between units and the persistently high workload, only an evidence-based, coordinated and national-level approach can ensure that Latvian intensive care nurses are able to provide safe, high-quality and sustainable care to all patients.
7. Limitations
The interpretation of this study should be considered in the light of a number of methodological and practical limitations which may affect the generalisation of results and their potential application in a broader context. Although the scope of the study data was considerable and covered several ICUs throughout Latvia, it nevertheless reflects the situation over a specific period of time and under certain organisational conditions. NAS measurements were taken over a six-month period, and while this period allows seasonal fluctuations to be identified, it does not cover a full year and does not allow long-term cyclicality or perennial trends to be accurately determined. Data collection also took place in ICUs, which currently use different workflows and organisational models, which can lead to some heterogeneity in measurement practices.
Another significant limitation is that the NAS data were collected in real-life care settings, where nurses worked under high workload conditions and could not always ensure a fully consistent completion of the score. Although all measurements comply with the NAS methodology, there is a likelihood that subjective assessment and lack of time may have affected the recording of individual activities. This limitation is inherent in all observational studies, which are based on routine clinical data, and does not imply a significant systematic error, but it should be taken into account in interpreting the results.
It should also be emphasised that the study does not cover data from the disease severity index (for example, SOFA or APACHE II), which would allow a more precise assessment of the extent to which the differences in workload between units are due to patient profiles rather than organisational factors alone. While NAS partly reflects patient severity, the disease severity indices would have allowed for a more detailed analysis of how specific clinical parameters affect the intensity of care needed. In addition, the study did not analyse patient outcome indicators that could provide an in-depth insight into the relationship between workload and quality of care.
It should also be mentioned that the study hospitals differ in size, profile, region and patient structure, which, while enriching the dataset, makes a completely uniform comparison between institutions difficult. Some units have consistently higher rates of care and more complex patients, while other units care for a wider group of less acute patients. These structural differences were not fully controlled because the primary objective of the study was to describe the reality of workload rather than isolate the effects of individual factors.
Time series modelling should take into account that NAS and nursing shortage data were analysed without additional exogenous variables that could potentially affect the accuracy of the forecasts. The ARIMA model revealed structural time dependency, but the predictive capacity of the shortage was limited because external factors such as patient severity fluctuations, elective surgery activity, leave schedules, availability of backup staff or temporary eHealth and infrastructure malfunctions were not included in the model. This limitation is significant as it shows that shortage dynamics are more complex than a linear dependency on NAS workload and require a multi-factor approach to ensure accurate forecasting.
Another limitation is that soft indicators such as the well-being, burnout, moral distress of nurses or quality of work environment were not included in the study, although previous studies in Latvia and internationally have shown that they are closely related to the objectively measurable workload. The absence of such information limits the possibility of fully assessing the impact of different workload patterns on the psychological and emotional health of staff, which is an essential aspect of sustainability of intensive care.
It should also be noted that the study does not allow establishing a clear “cause and effect”. While the analysis clearly shows that higher NAS levels are closely linked to nursing shortages, the observational design does not allow the conclusion to be drawn as to whether shortages occur directly because of the increase in workload, or whether other factors, such as sudden employee absences, institutional policies or local organisational limitations, exacerbate this.
Finally, although the analysis set of the study is one of the largest in the history of NAS studies conducted in Latvia, it is still not a complete national review. The 14 units in the study represent a significant part of the country’s intensive care capacity, but do not include all regions and specialist profiles. Therefore, the generalisation of results across the country should be done with caution, as regional differences in staff availability and patient severity may be greater than reflected in this study.
Overall, these limitations do not diminish the significance of the study, but emphasise the need for further studies that would complement these results, including full-year, additional clinical indicators, broader hospital coverage and systemic factors affecting intensive care nursing workload. Despite the abovementioned limitations, the study provides substantial evidence-based insight into the actual workload in intensive care units of Latvia and demonstrates the necessity to review and modernise the approaches to personnel planning and care organisation in this field.
8. Conclusions
This study provides comprehensive and evidence-based insight into the workload of intensive care nurses in Latvia, revealing consistently high care intensity and significant workload heterogeneity between units, care levels and hospitals. The average time of care was 15.71 hours per patient per day, which shows that one nurse is realistically only able to provide care to about one patient. At the same time, the nearly two-fold differences between units reveal structural disproportions in access to human resources and organisational models that directly affect both the quality of care and the well-being of staff.
The annual workload dynamics, seasonal fluctuations and structural inertia identified in the ARIMA analysis indicate that intensive care nursing workload is not accidental but predictable and systematically high. Nursing shortages are most closely linked to the amount of care measured by NAS rather than to the type of shift or unit level, which confirms that the shortage problem is directly linked to objective workload rather than administrative settings. Overall, the results indicate that current human resources planning approaches are not sufficient to ensure safe and smooth care.
The study emphasises the need to introduce a uniform NAS-based workload monitoring and personnel planning system in Latvia, which would allow ensuring the quality of care regardless of the institution and reduce the risk of overburdening. At the same time, it is essential to strengthen human resources policy, develop the sustainability of the nursing profession and provide adequate support to staff working in the highest-intensity care environment. These conclusions point to the need for a modernised, data-driven and patient-driven approach to the intensive care organisation in Latvia.
Author Contributions
Conceptualization, O.C.-B. and I.M.; methodology, O.C.-B. and I.M.; software, O.C.-B. and I.M.; validation, O.C.-B. and I.M.; formal analysis, O.C.-B. and I.M; investigation, I.M.; resources, X.X.; data curation, O.-C.B.; writing—original draft preparation, O.C.-B. and I.M.; writing—review and editing, O.C.-B. and I.M.; visualization, O.C.-B..; supervision, I.M.; project administration, O.C.-B. and I.M.; funding acquisition, I.M. All authors have read and agreed to the published version of the manuscript.
Funding
The APC was funded by Riga Stradiņš University, Department of Nursing and Midwifery (Riga, Latvia).
Institutional Review Board Statement
The study was conducted in accordance with the Declaration of Helsinki and approved by the Ethics Committee of Riga Stradiņš University (protocol code 2-PĒK-4/416/2023, on 9 May 2023).
Informed Consent Statement
Informed consent was obtained from all subjects involved in the study.
Data Availability Statement
The datasets produced and examined in this study can be obtained from the corresponding author upon a reasonable request. All data generated or analysed during this study are provided within the published article. The data utilised in this study is confidential.
Conflicts of Interest
The authors declare no conflicts of interest. The funders had no role in the design of the study; in the collection, analyses, or interpretation of data; in the writing of the manuscript; or in the decision to publish the results.
Abbreviations
The following abbreviations are used in this manuscript:
| ICU | Intensive Care Unit |
| NAS | Nursing Activities Score |
| ANOVA | Analysis of Variance |
| SD | Standard Deviation |
| R2 | Coefficient of Determination |
| COVID-19 | Coronavirus Disease 2019 |
| EU | European Union |
| N/P | Nurse-to-Patient Ratio |
| TISS-28 | Therapeutic Intervention Scoring System–28 |
| CM | Cabinet of Ministers (Republic of Latvia) |
| IBM-SPSS | International Business Machines Statistical Package for the Social Sciences |
| Q1-Q3 | First to Third Quartile |
| IQR | Interquartile Range |
| Tukey HSD | Tukey Honestly Significant Difference Test |
| PĒK | Research Ethics Committee (Rīga Stradiņš University) |
| M | Mean |
| n | Sample Size |
| p | Probability Value |
| t | Student’s t-Test |
| CI | Confidence Interval |
| F | F-Statistic |
| η2 | Eta Squared (Effect Size) |
| ω2 | Omega Squared (Effect Size) |
| Wald z | Wald z-Statistic |
| ICC | Intraclass Correlation Coefficient |
| AIC | Akaike Information Criterion |
| χ2 | Chi-Square Statistic |
| β | Standardized Regression Coefficient |
| ARIMA | Autoregressive Integrated Moving Average |
| RMSE | Root Mean Square Error |
| MAE | Mean Absolute Error |
| MAPE | Mean Absolute Percentage Error |
| MA | Moving Average |
| ACF | Autocorrelation Function |
| PACF | Partial Autocorrelation Function |
| SOFA | Sequential Organ Failure Assessment |
| APACHE | Acute Physiology and Chronic Health Evaluation |
References
- Villagracia, H.N.; Akhdair, T.A.; Sallam, S.A.E.G.; Villagracia, R.W.A.; Alshammari, B.; Alrasheeday, A.M.; Nageeb, S.M.; Dando, L.L.; Nacubuan, O.A.; Alsaif, T.A.; et al. Examining the link between intensive care unit nurses’ burnout and perceived quality of life: a multicenter cross-sectional study. BMC nursing 2025, 24, 399. [Google Scholar] [CrossRef]
- Hoogendoorn, M.E.; Brinkman, S.; Bosman, R.J.; Haringman, J.; de Keizer, N.F.; Spijkstra, J.J. The impact of COVID-19 on nursing workload and planning of nursing staff on the intensive care: A prospective descriptive multicenter study. Int. J. Nurs. Stud. 2021, 121, 104005. [Google Scholar] [CrossRef]
- WHO European Observatory on Health Systems and Policies. Latvia (2019): A New Initiative (2024–2029) Aims to Attract Health Professionals to Work in the Public Sector. Available online: https://eurohealthobservatory.who.int/monitors/health-systems-monitor/analyses/hspm/latvia-2019/a-new-initiative-(2024-2029)-aims-to-attract-health-professionals-to-work-in-the-public-sector (accessed on 13 December 2025).
- Cerela-Boltunova, O.; Millere, I.; et al. Exploring the Relation between Nursing Workload and Moral Distress, Burnout, and Turnover in Latvian Intensive Care Units: An Ecological Analysis of Parallel Data. Int. J. Environ. Res. Public Health 2025, 22, 1442. [Google Scholar] [CrossRef]
- Cerela-Boltunova, O.; Millere, I.; Trups-Kalne, I. Adaptation of the Nursing Activities Score in Latvia. Int. J. Environ. Res. Public Health 2024, 21, 1284. [Google Scholar] [CrossRef]
- Boston-Leary, K.; Lee, M.; Mossburg, SE. Patient Safety Amid Nursing Workforce Challenges. In Perspectives on Safety [Internet]; Agency for Healthcare Research and Quality (US): Rockville (MD), 24 Apr 2024; Available online: https://www.ncbi.nlm.nih.gov/books/NBK611041/ (accessed on 13 December 2025).
- Banda, Z.; Simbota, M.; Mula, C. Nurses’ Perceptions on the Effects of High Nursing Workload on Patient Care in an Intensive Care Unit of a Referral Hospital in Malawi: A Qualitative Study. BMC Nurs. 2022, 21, 136. [Google Scholar] [CrossRef] [PubMed]
- Ross, P.; Howard, B.; Ilic, D.; Watterson, J.; Hodgson, C.L. Nursing workload and patient-focused outcomes in intensive care: A systematic review. Nurs. Health Sci. 2023, 25, 1097–1110. [Google Scholar] [CrossRef] [PubMed]
- Bruyneel, A.; Tack, J.; Droguet, M.; Maes, J.; Wittebole, X.; Miranda, D.R.; Di Pierdomenico, L. Measuring the nursing workload in intensive care with the Nursing Activities Score (NAS): A prospective study in 16 hospitals in Belgium. J. Crit. Care 2019, 54, 205–210. [Google Scholar] [CrossRef]
- Cerela-Boltunova, O.; Millere, I.; Nagle, E. Moral Distress, Professional Burnout, and Potential Staff Turnover in Intensive Care Nursing Practice in Latvia—Phase 1. Int. J. Environ. Res. Public Health 2025, 22, 1261. [Google Scholar] [CrossRef] [PubMed]
- Nantsupawat, A.; Poghosyan, L.; Wichaikhum, O.A.; Kunaviktikul, W.; Fang, Y.; Kueakomoldej, S.; Thienthong, H.; Turale, S. Nurse staffing, missed care, quality of care and adverse events: A cross-sectional study. Journal of nursing management 2022, 30, 447–454. [Google Scholar] [CrossRef]
- Li, L.; Zou, X.; Chen, H. Workload in ICU Nurses: A Systematic Review and Meta-Analysis of the Nursing Activities Score. Intensive Crit. Care Nurs. 2025, 91, 104086. [Google Scholar] [CrossRef]
- Miranda, DR; Nap, R; de Rijk, A; Schaufeli, W; Iapichino, G; TISS Working Group. Therapeutic Intervention Scoring System. Nursing activities score. Crit Care Med. 2003, 31, 374–382. [Google Scholar] [CrossRef] [PubMed]
- Kim, Y.; Kim, SH. The Relationship of Nurse and Physician Staffing in Intensive Care Units with Patient Outcomes in Postoperative Patients on Ventilators: An Analysis Using Korean National Health Insurance Data. Healthcare (Basel) 2023, 11, 1124. [Google Scholar] [CrossRef]
- Griffiths, P; Saville, C; Ball, JE; Jones, J; Monks, T. Safer Nursing Care Tool study team. Beyond ratios - flexible and resilient nurse staffing options to deliver cost-effective hospital care and address staff shortages: A simulation and economic modelling study. Int J Nurs Stud. 2021, 117, 103901. [Google Scholar] [CrossRef]
- Griffiths, P; Saville, C; Ball, J; et al. Nursing workload, nurse staffing methodologies and tools: A systematic scoping review and discussion. Int J Nurs Stud. 2020, 103, 103487. [Google Scholar] [CrossRef]
- Guidelines for the Classification and Organisation of Intensive Care Units in Latvia. Riga, Latvia. Available online: https://www.vm.gov.lv/lv/media/9974/download?attachment (accessed on 13 December 2025).
- Health Workforce Development Guidelines for 2024–2029. Riga, Latvia. Available online: https://www.vm.gov.lv/lv/media/11871/download?attachment (accessed on 13 December 2025).
- Regulations and Guidelines on Nursing Practice and Workforce Organisation in Healthcare Institutions; Riga, Latvia.
- Available online: https://www.vm.gov.lv/lv/media/7908/download (accessed on 13 December 2025).
- Regulations on the Competence of Medical Practitioners and Students Acquiring Medical Education Programmes, and on the Scope of Their Theoretical and Practical Knowledge. Riga, Latvia. Available online: https://likumi.lv/ta/id/355161-noteikumi-par-arstniecibas-personu-un-studejoso-kuri-apgust-mediciniskas-izglitibas-programmas-kompetenci-arstnieciba-un-so-personu-teoretisko-un-praktisko-zinasanu-apjomu (accessed on 13 December 2025).
- Registration and Re-Registration of Medical Practitioners and Medical Support Staff. Riga, Latvia. Available online: https://www.vi.gov.lv/lv/arstniecibas-personu-un-arstniecibas-atbalsta-personu-parregistracija (accessed on 13 December 2025).
- National Classification of Occupations (Updated 31 January 2025). Riga, Latvia. Available online: https://www.lm.gov.lv/lv/klasifikacija/profesiju-klasifikators-5/profesiju-klasifikators-aktualizets-2025gada-31janvari (accessed on 13 December 2025).
- Republic of Latvia. Medical Treatment Law. Riga, Latvia. Available online: https://likumi.lv/ta/id/44108-arstniecibas-likums (accessed on 13 December 2025).
- World Medical Association. World Medical Association Declaration of Helsinki: Ethical Principles for Medical Research Involving Human Subjects. JAMA 2013, 310, 2191. [Google Scholar] [CrossRef]
- Twigg, DE; Whitehead, L; Doleman, G; El-Zaemey, S. The impact of nurse staffing methodologies on nurse and patient outcomes: A systematic review. J Adv Nurs. 2021, 77, 4599–4611. [Google Scholar] [CrossRef]
- De Vos, M.; Graafmans, W.; Mellema, M.; Dijkstra, N.; van der Hoven, B.; Goossens, A. Using the Nursing Activities Score to Measure Nursing Workload in Dutch ICUs. Nurs. Crit. Care 2017, 22, 75–81. [Google Scholar]
- Collet, M.O.; et al. Seasonal Variation in ICU Admissions and Workload: A Multicenter Analysis. Crit. Care 2022, 26, 47. [Google Scholar]
- McMahon, M.; et al. Development of a Data-Based Method for Predicting Nursing Workload. J. Med. Internet Res. 2025, 27, e66667. jmir.org. [Google Scholar] [CrossRef] [PubMed]
- Park, H.; Kang, Y. System Development for Measuring Nursing Workload Based on the Real-Time Location Information. J Nurs Manag. 2025, 2188150. [Google Scholar] [CrossRef] [PubMed]
- Hassan, EA; El-Ashry, AM. Leading with AI in critical care nursing: challenges, opportunities, and the human factor. BMC Nurs. 2024, 23, 752. [Google Scholar] [CrossRef] [PubMed]
- Giannetta, N.; Villa, G.; Vellone, E.; De Marinis, M. Burns Out and Moral Distress Among Critical Care Nurses: A Systematic Review. Intensive Crit. Care Nurs. 2023, 74, 103312. [Google Scholar]
Figure 1.
Histogram of NAS totals.
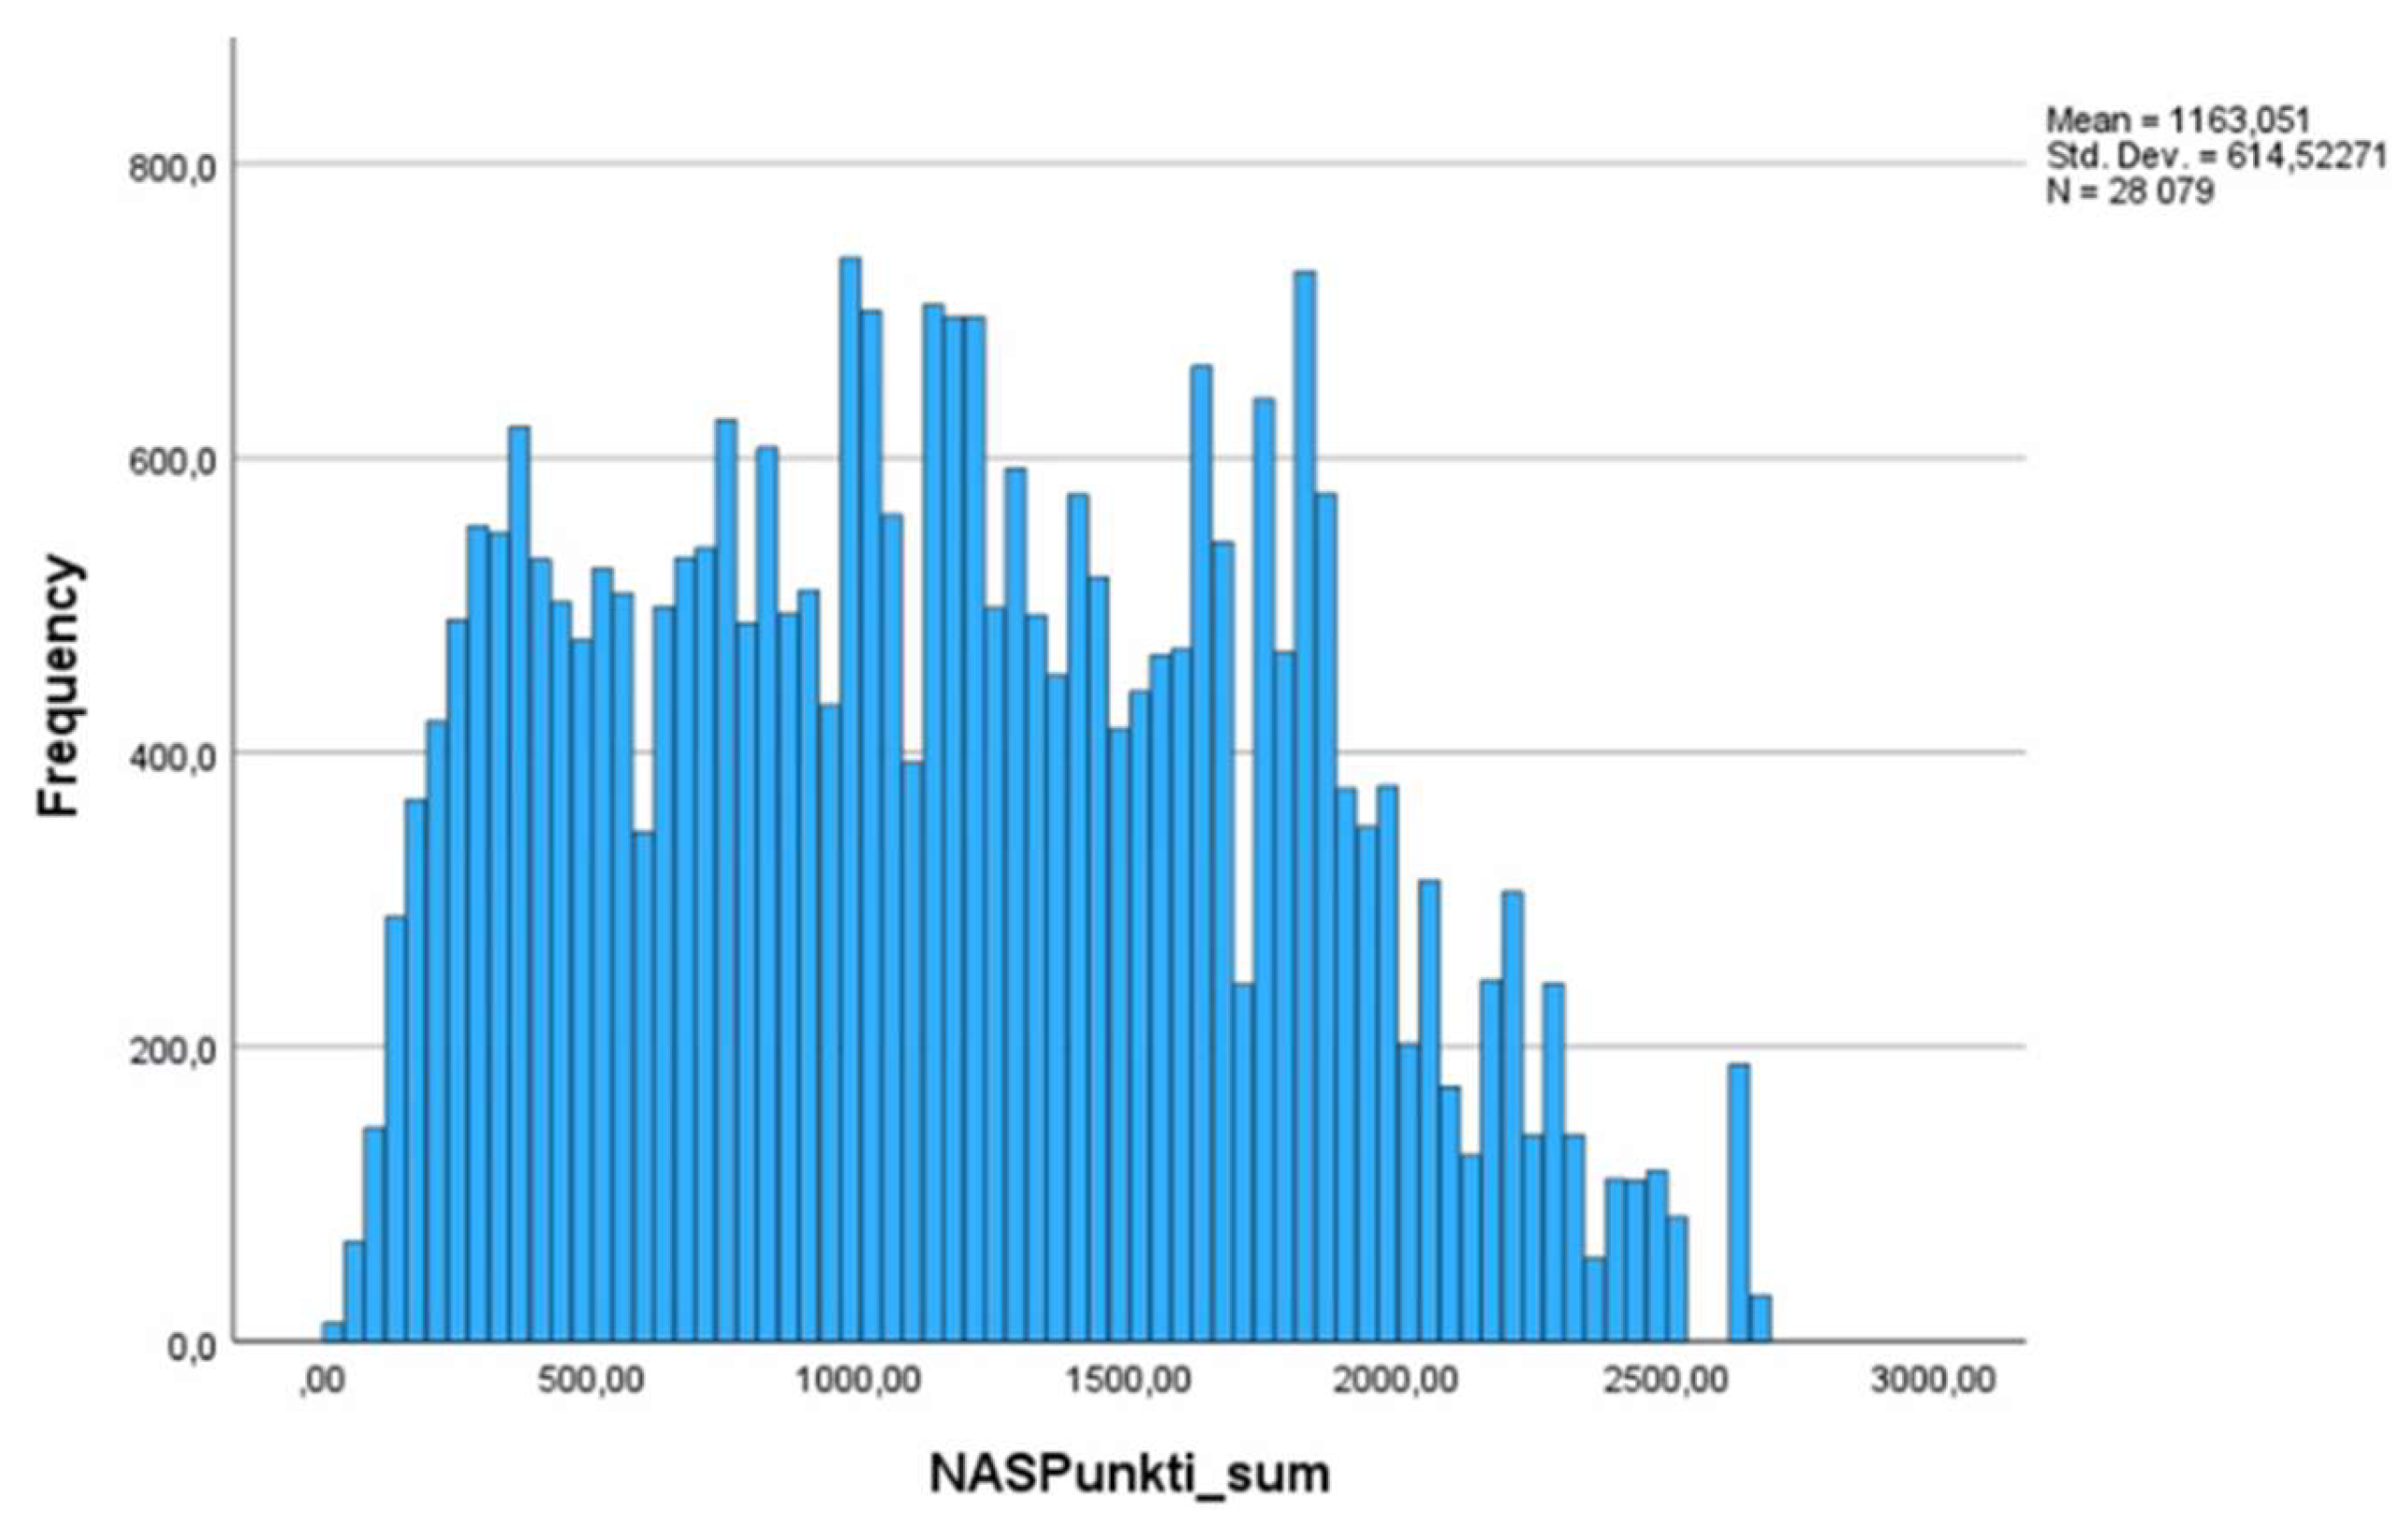
Figure 2.
Boxplot for the number of patients on day and night shifts. *Shift 1 – Day, Shift 2 - night.
Figure 2.
Boxplot for the number of patients on day and night shifts. *Shift 1 – Day, Shift 2 - night.
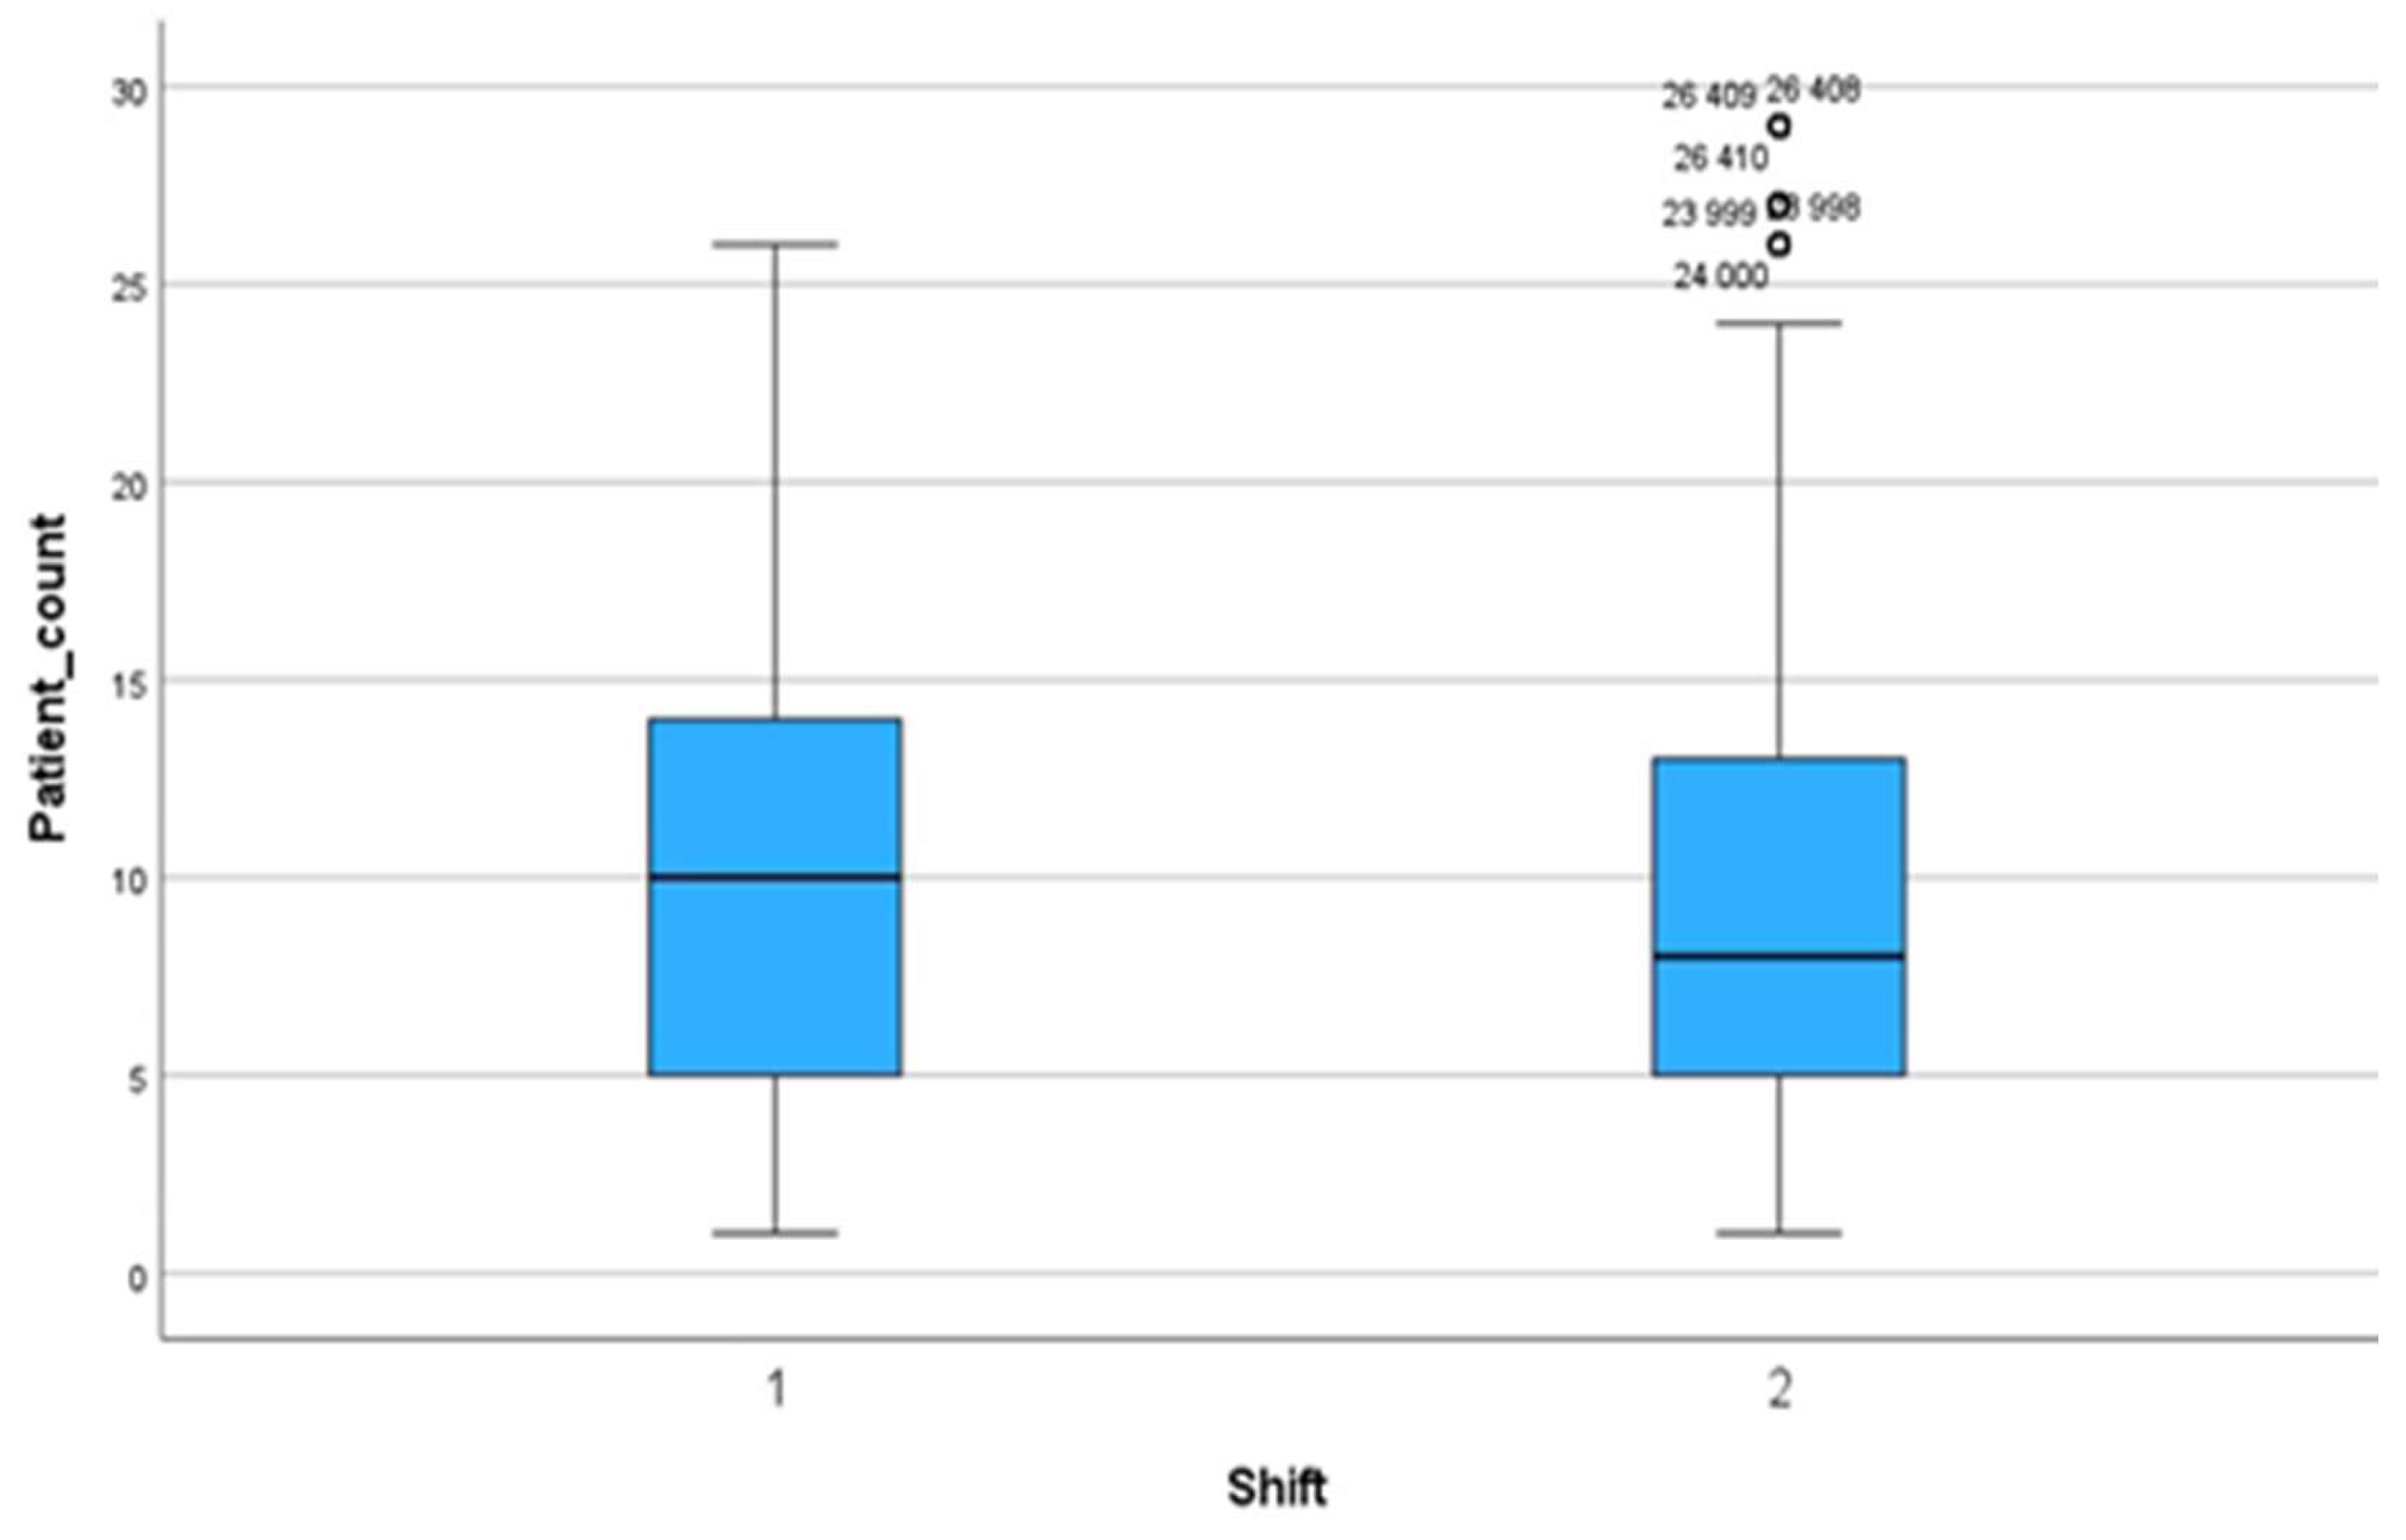
Figure 3.
Boxplot for the number of patients in 14 ICUs.
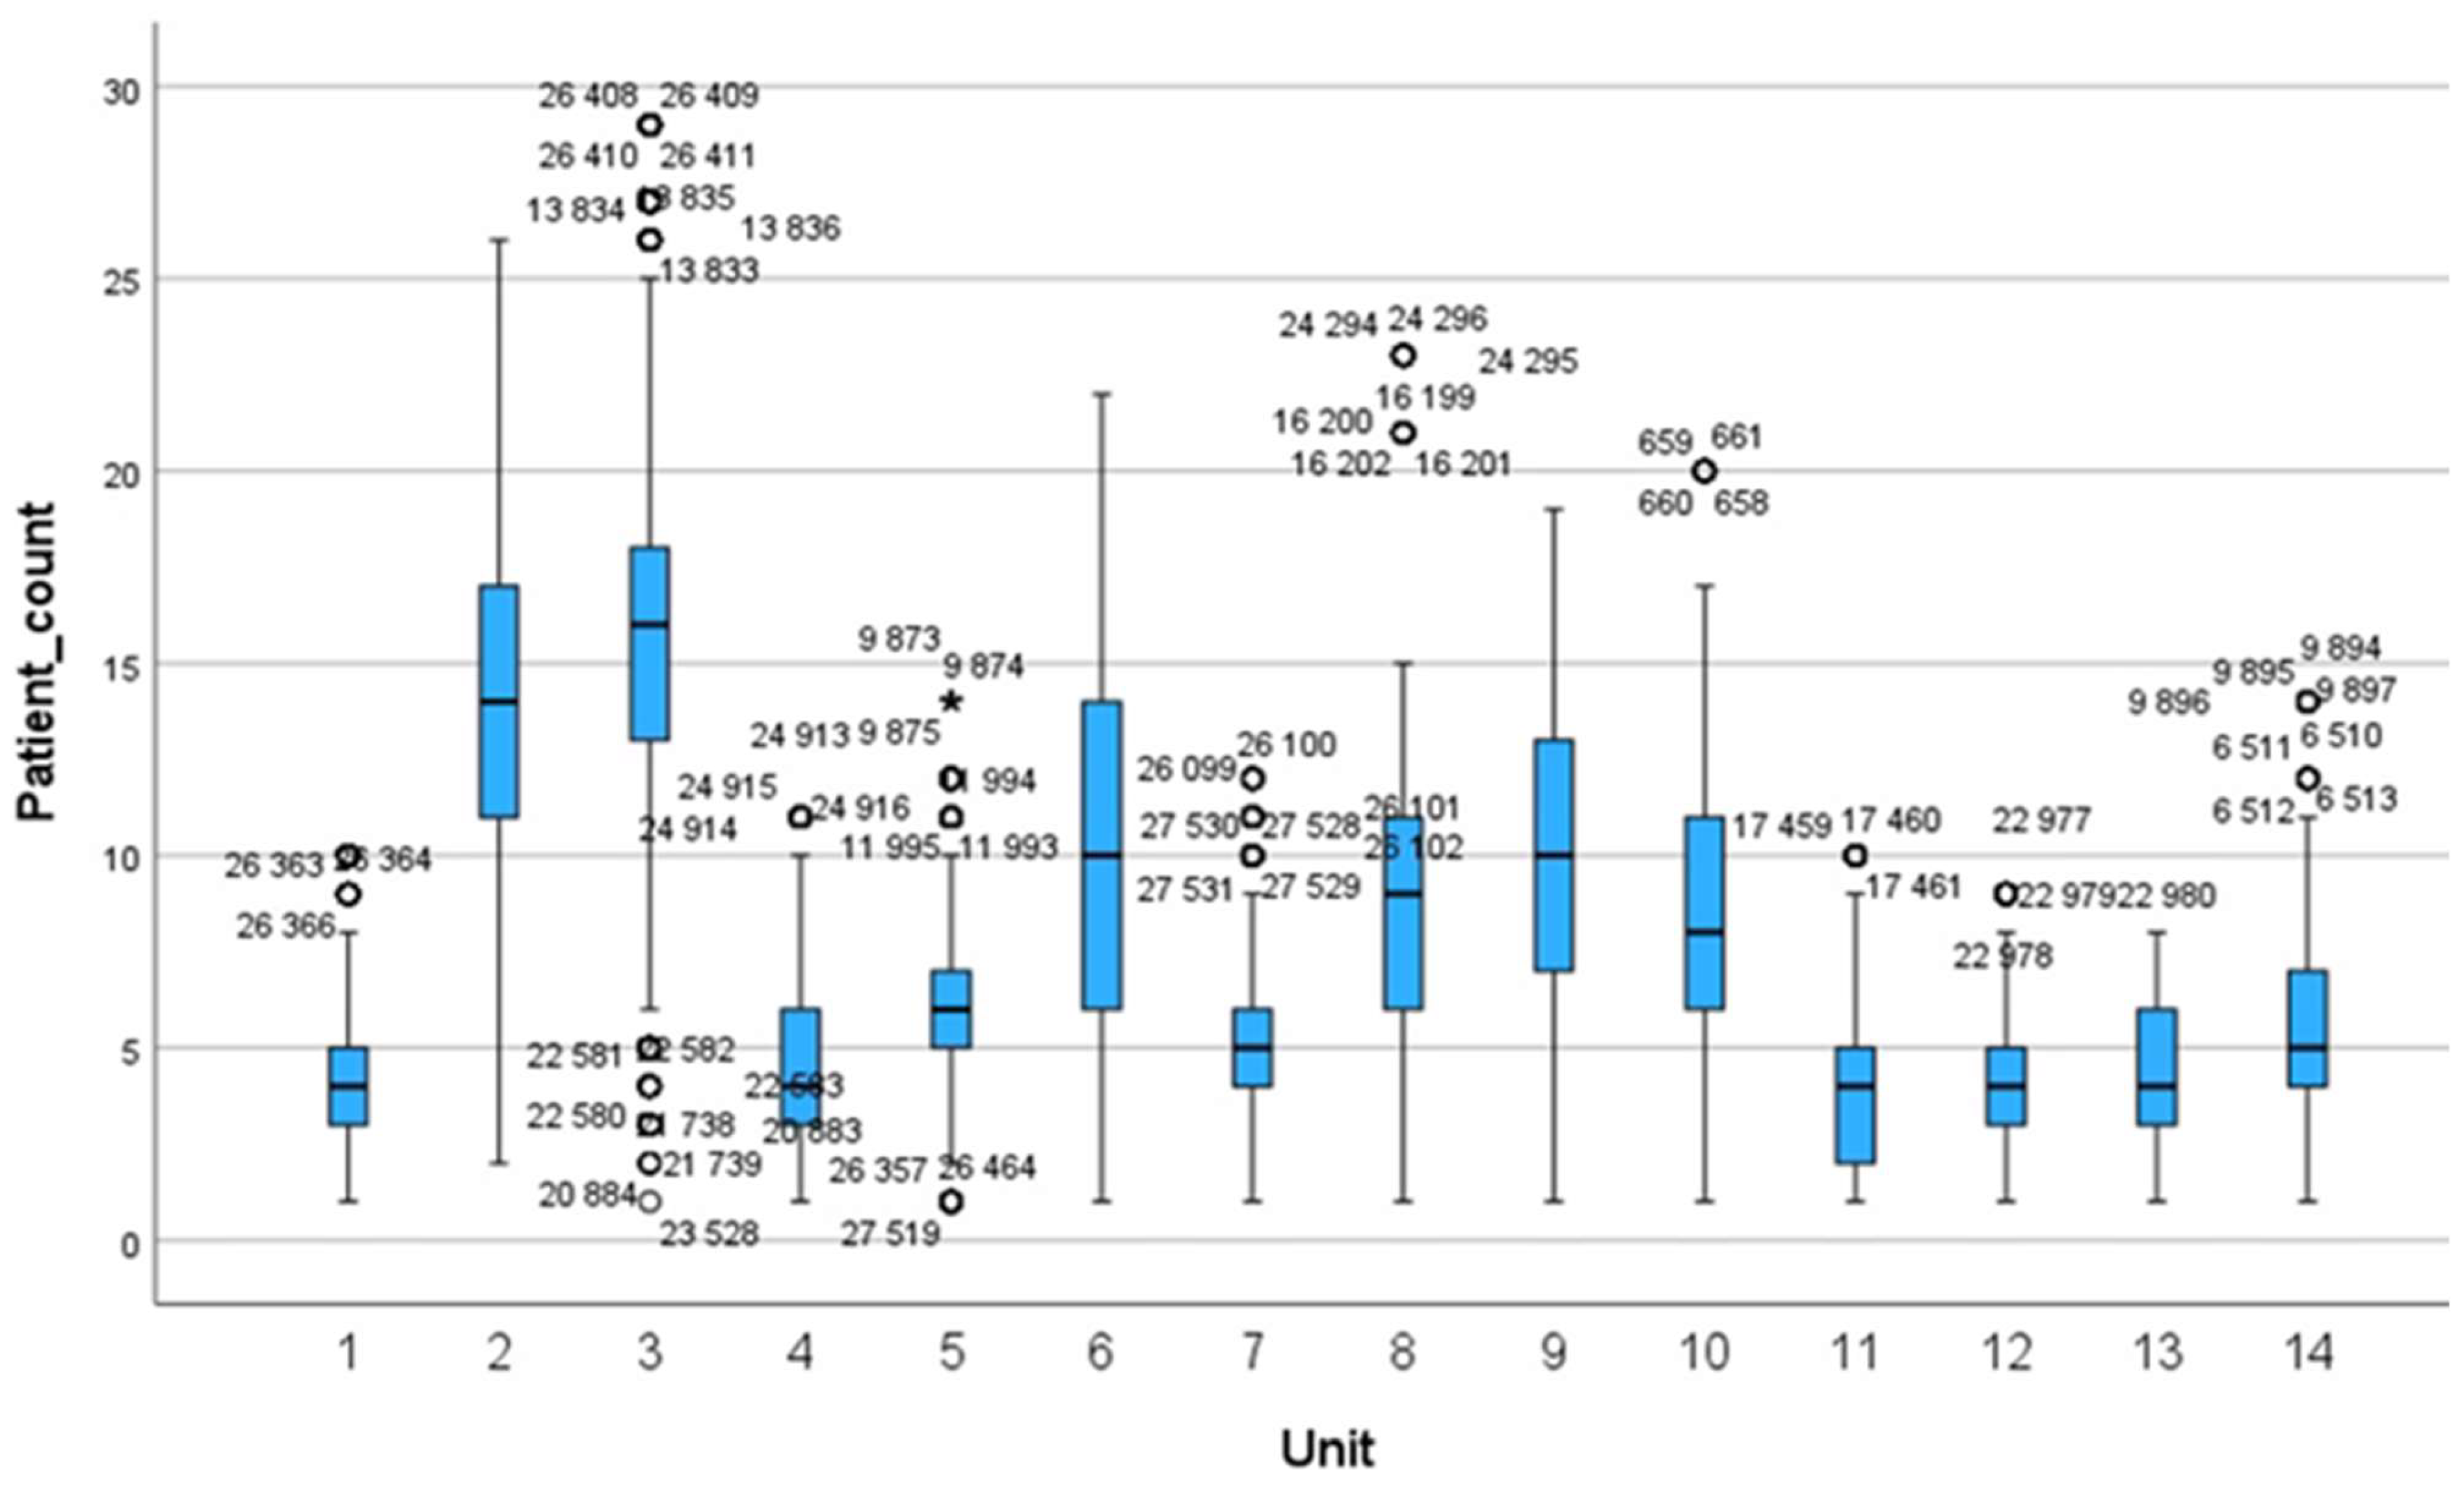
Figure 4.
Boxplot for NAS values during day and night shifts.
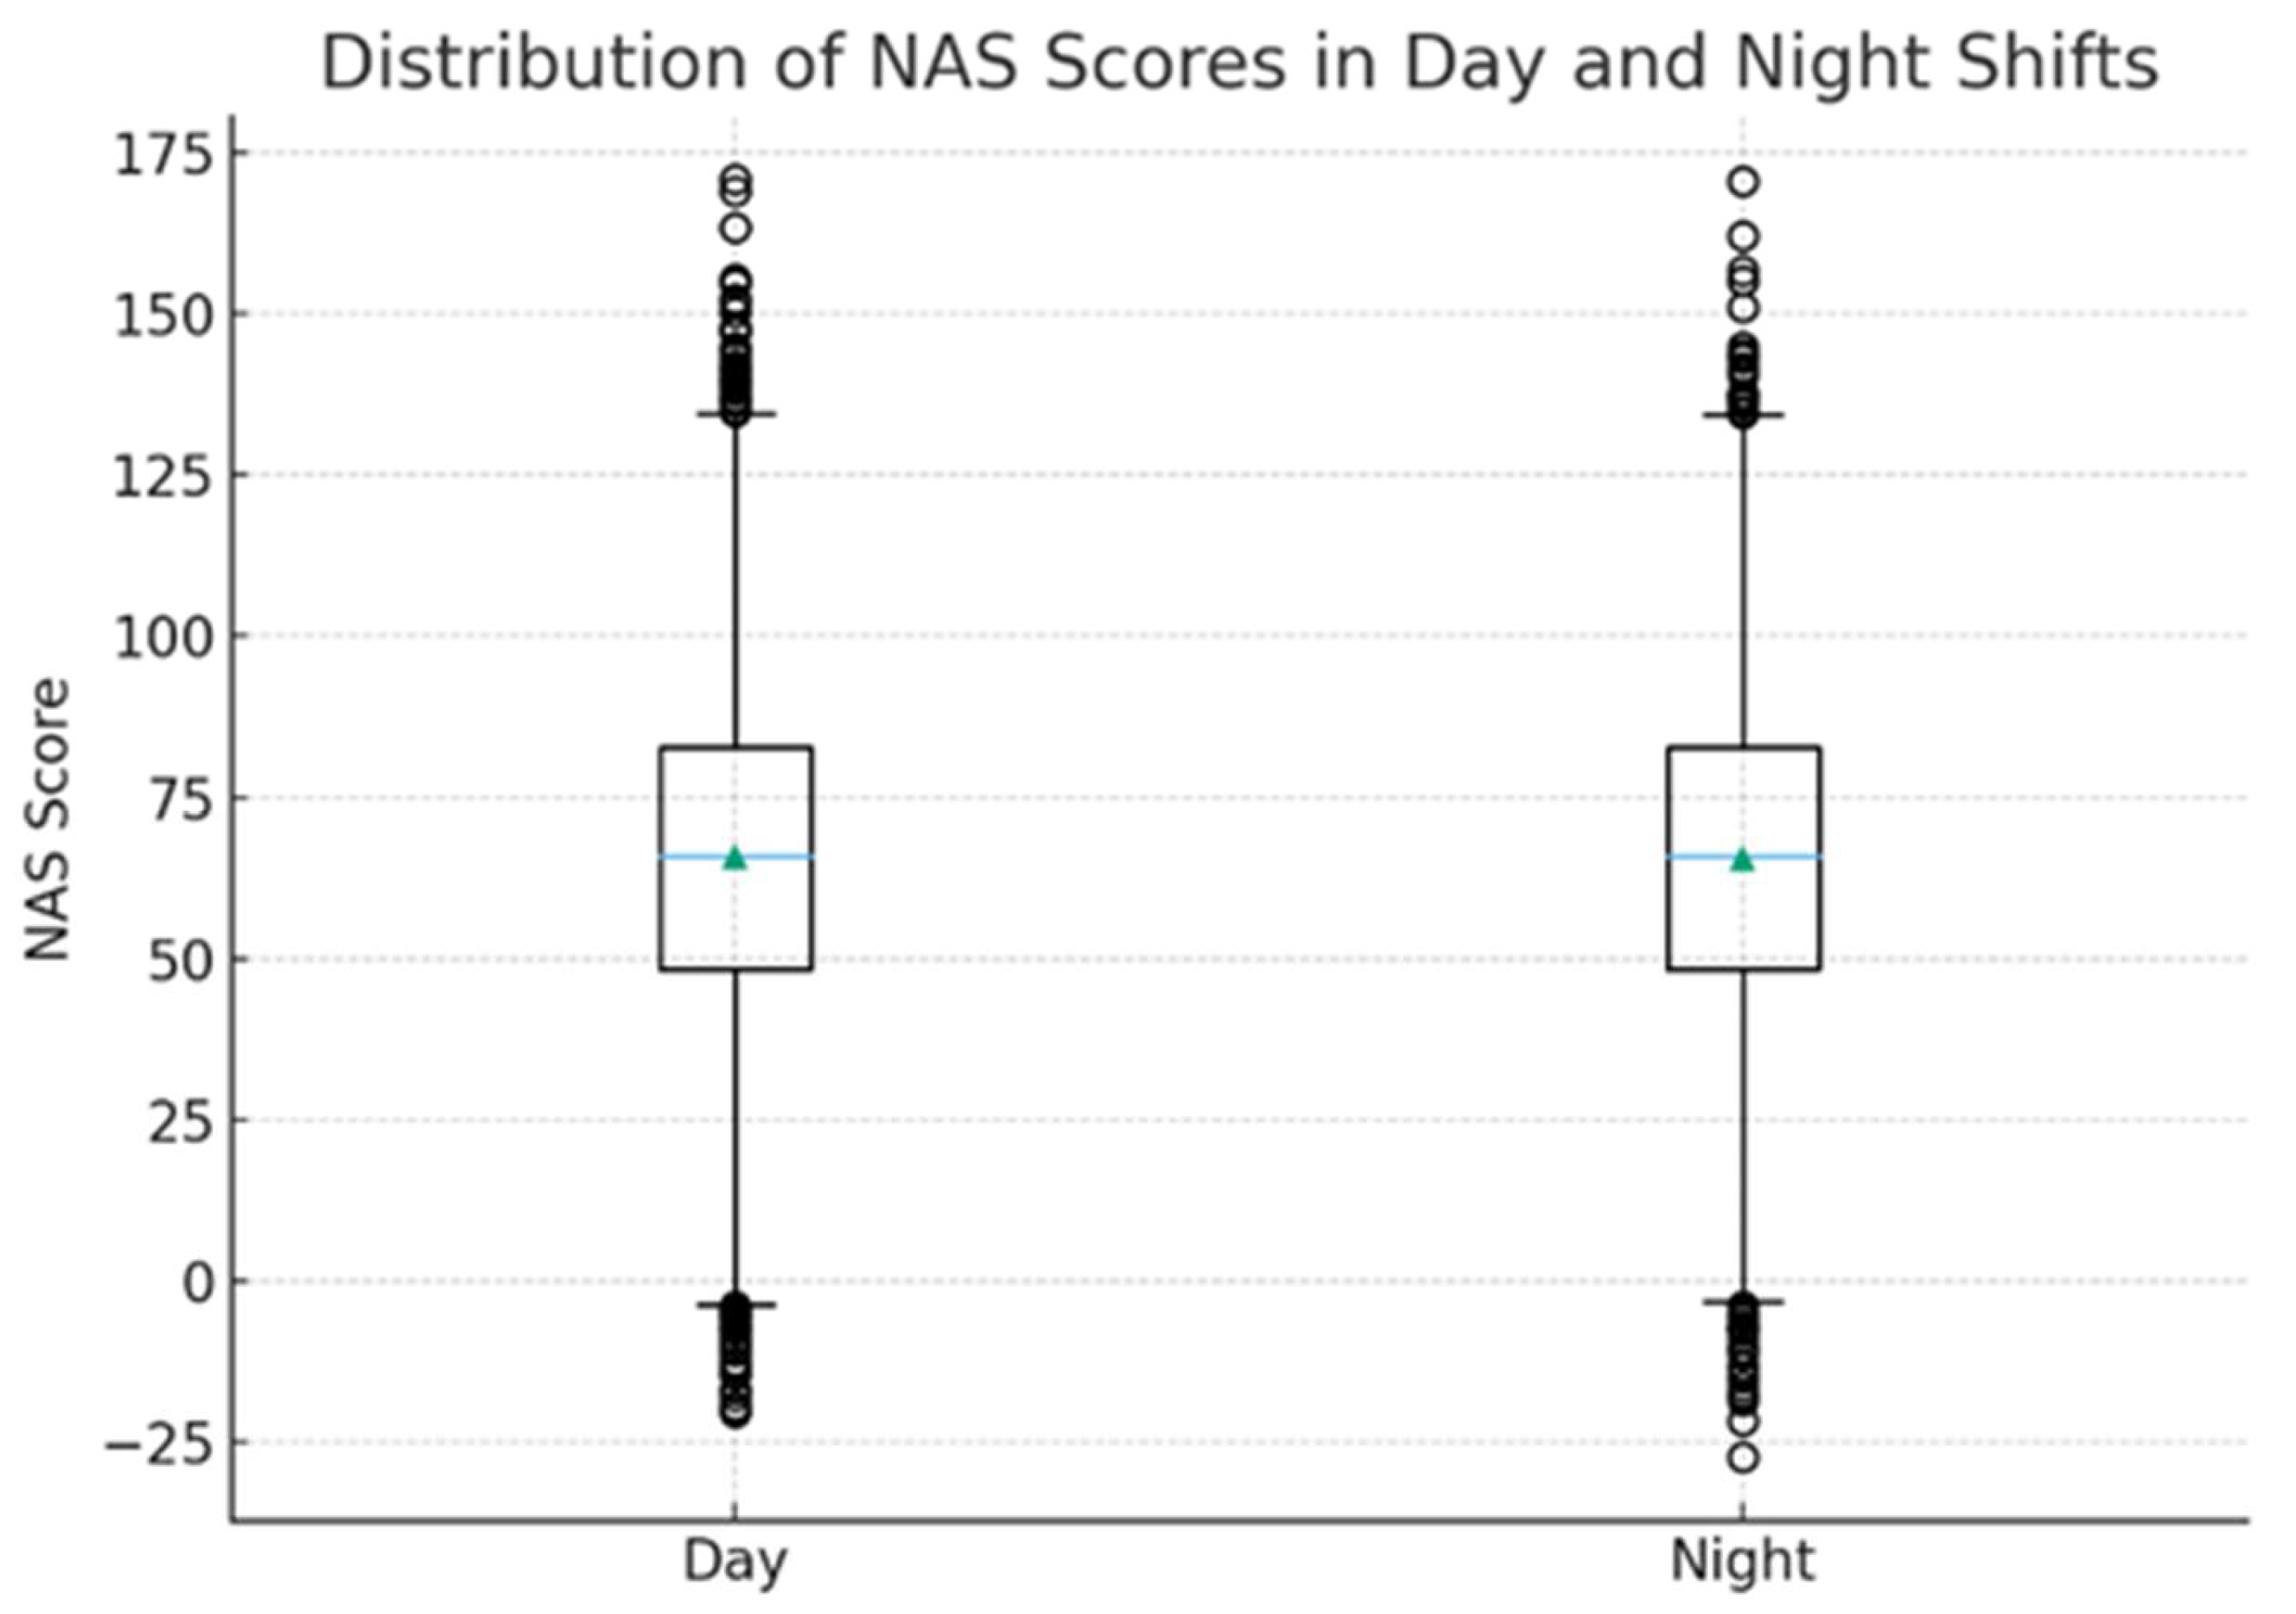
Figure 5.
Mean NAS by unit (95% CI).
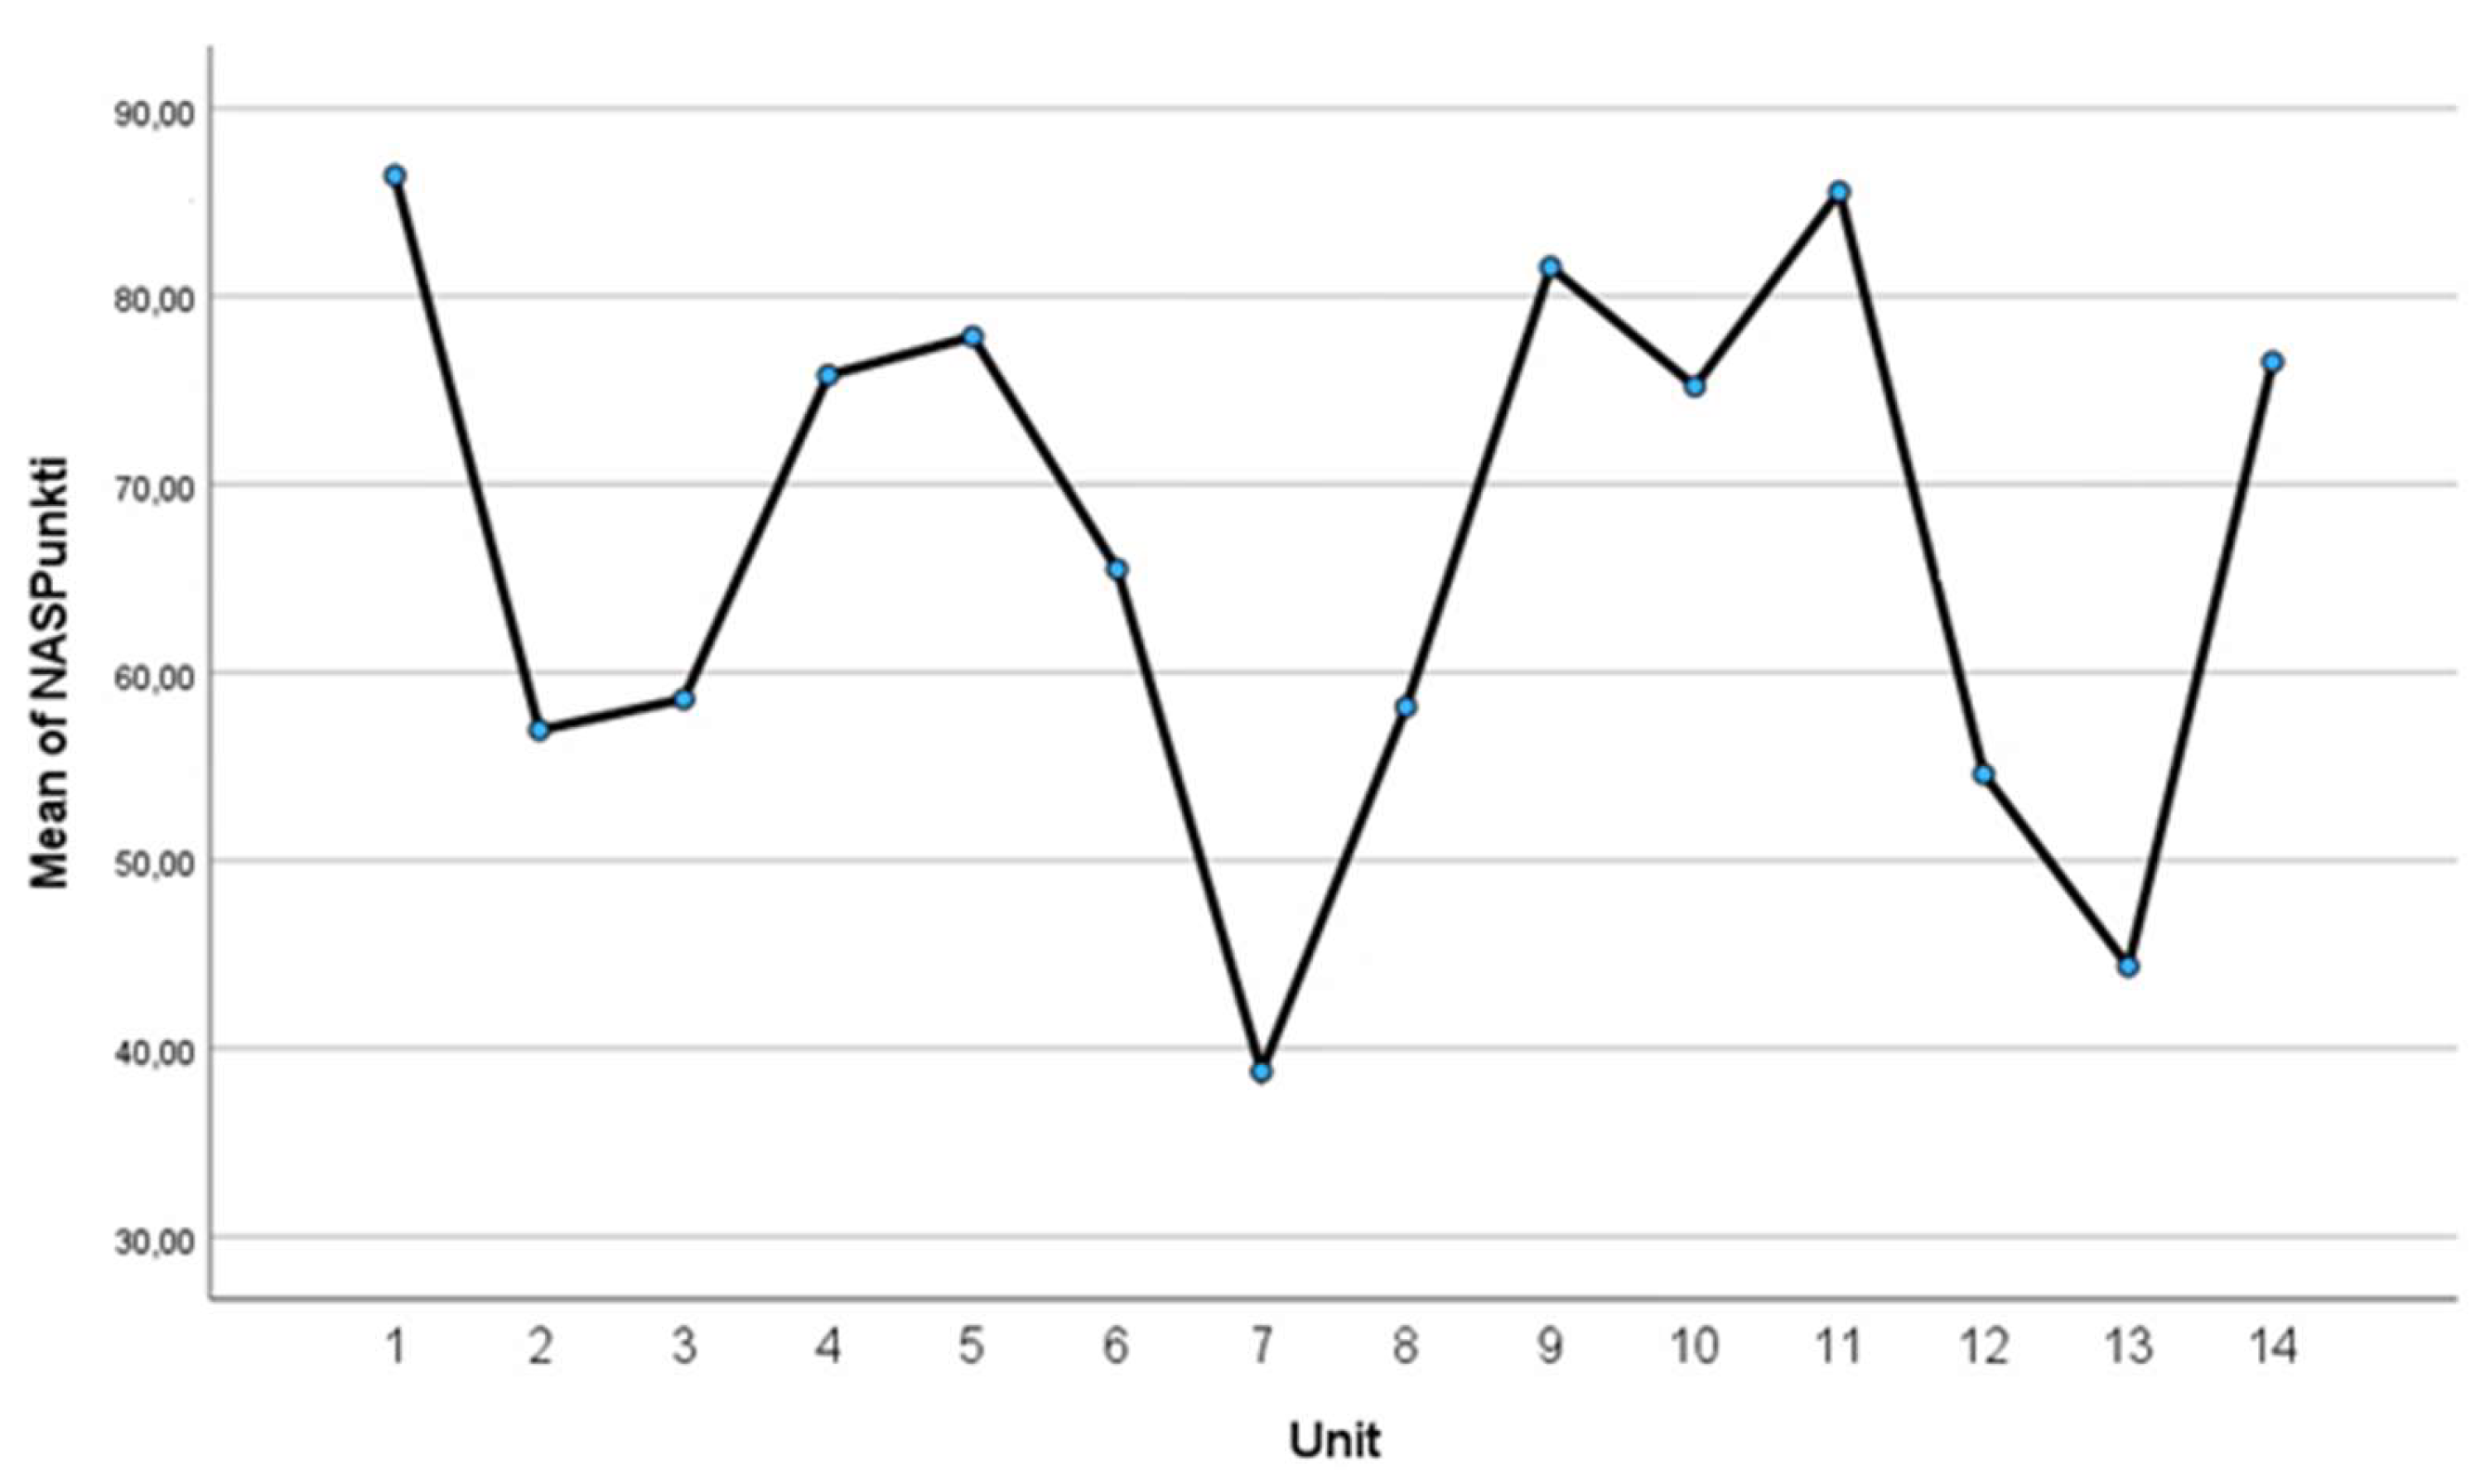
Figure 6.
Mean NAS across the week (95% CI).
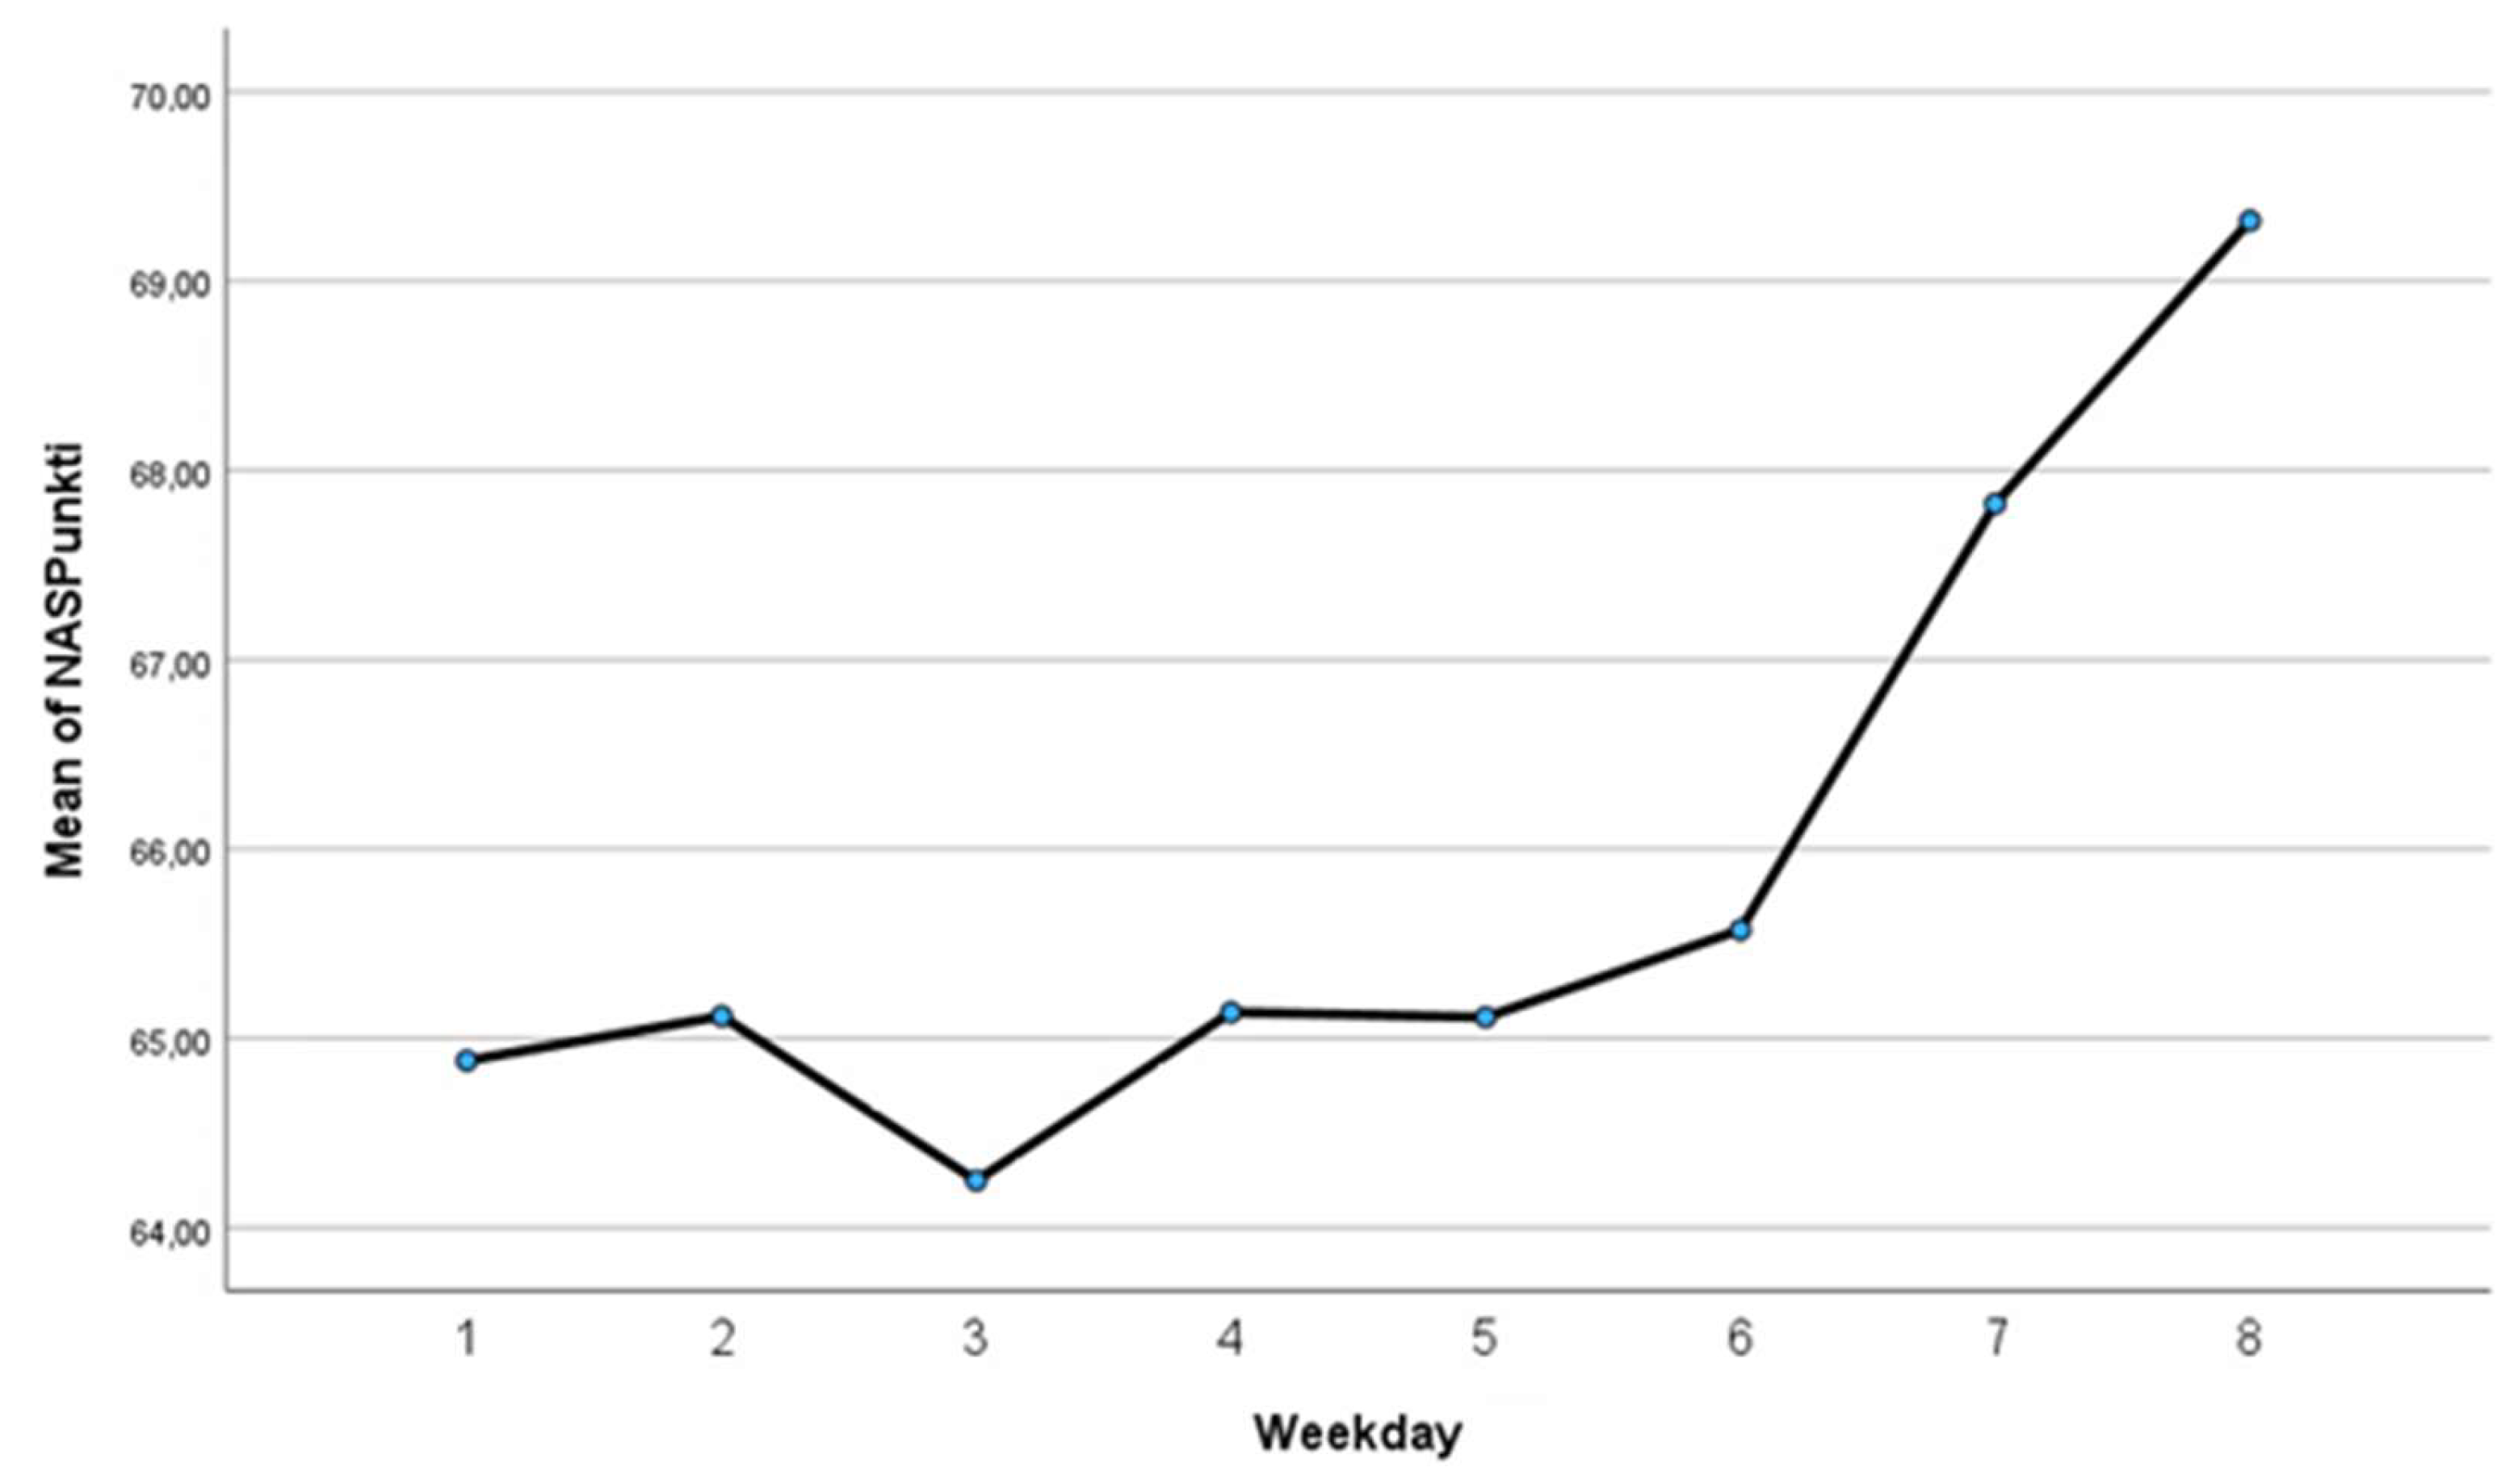
Figure 7.
Scatterplot of NAS totals.
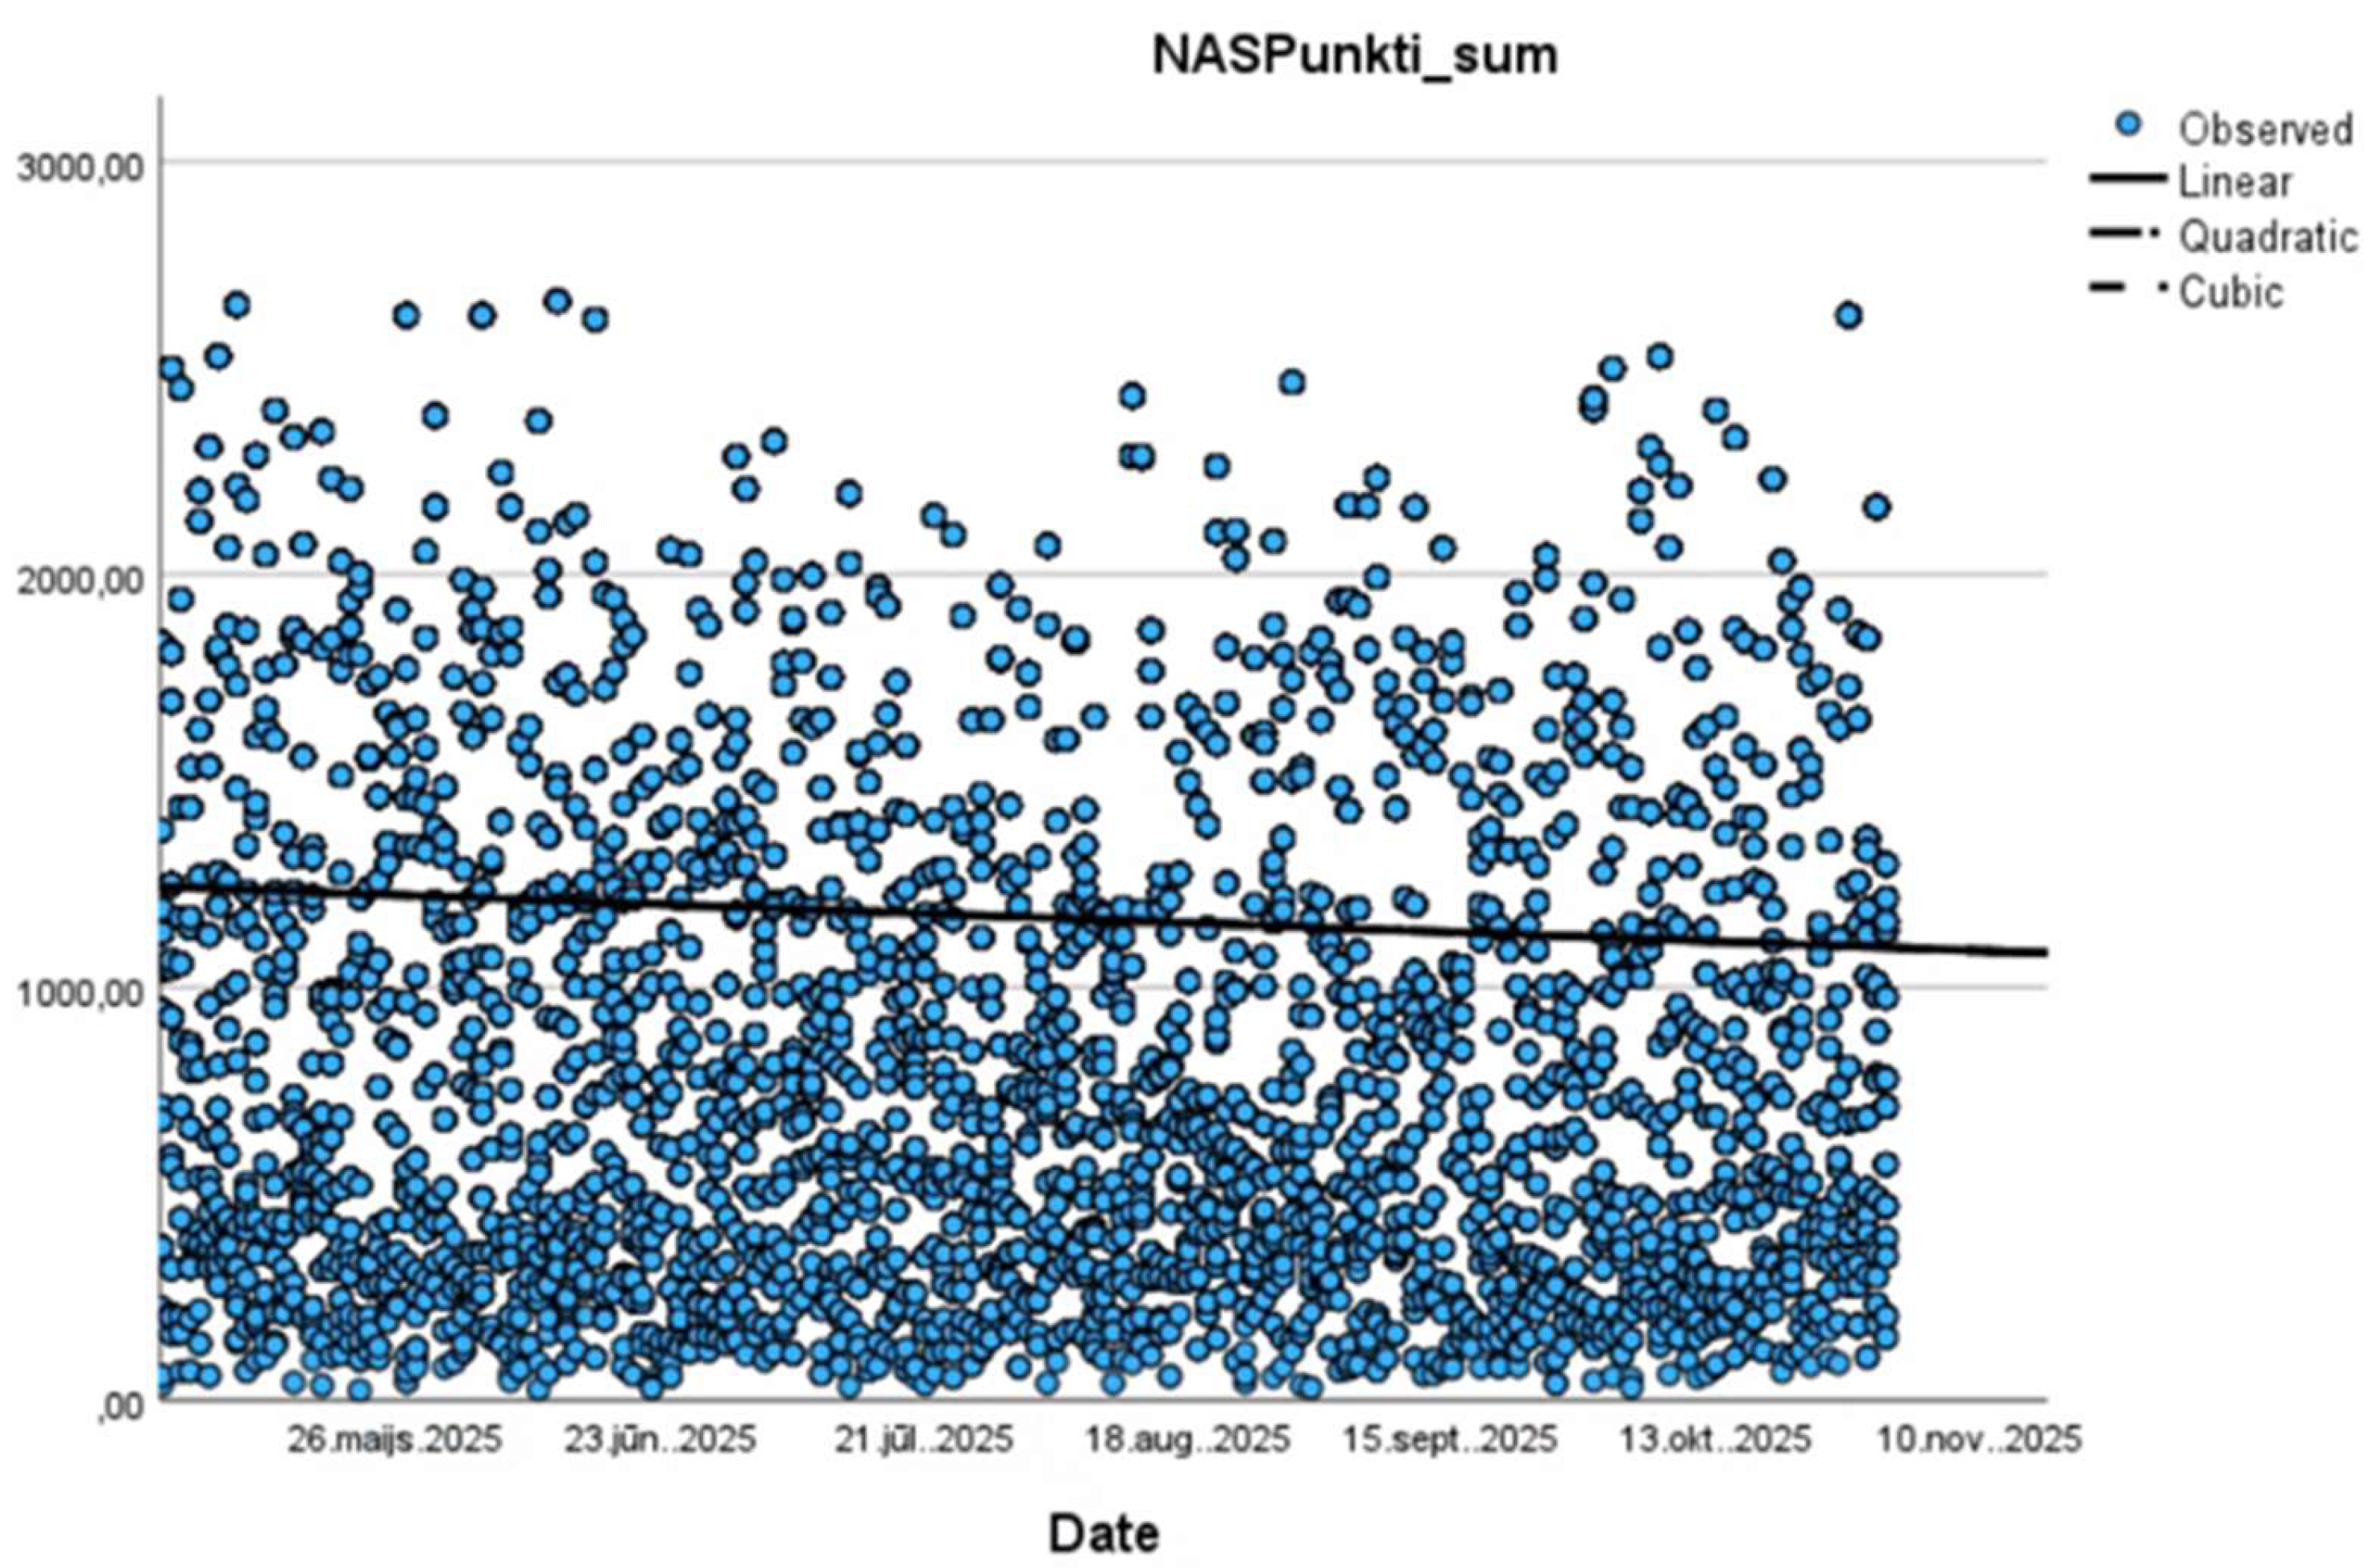
Figure 8.
Domain heatmap.

Figure 9.
Column chart: nursing workload by unit.
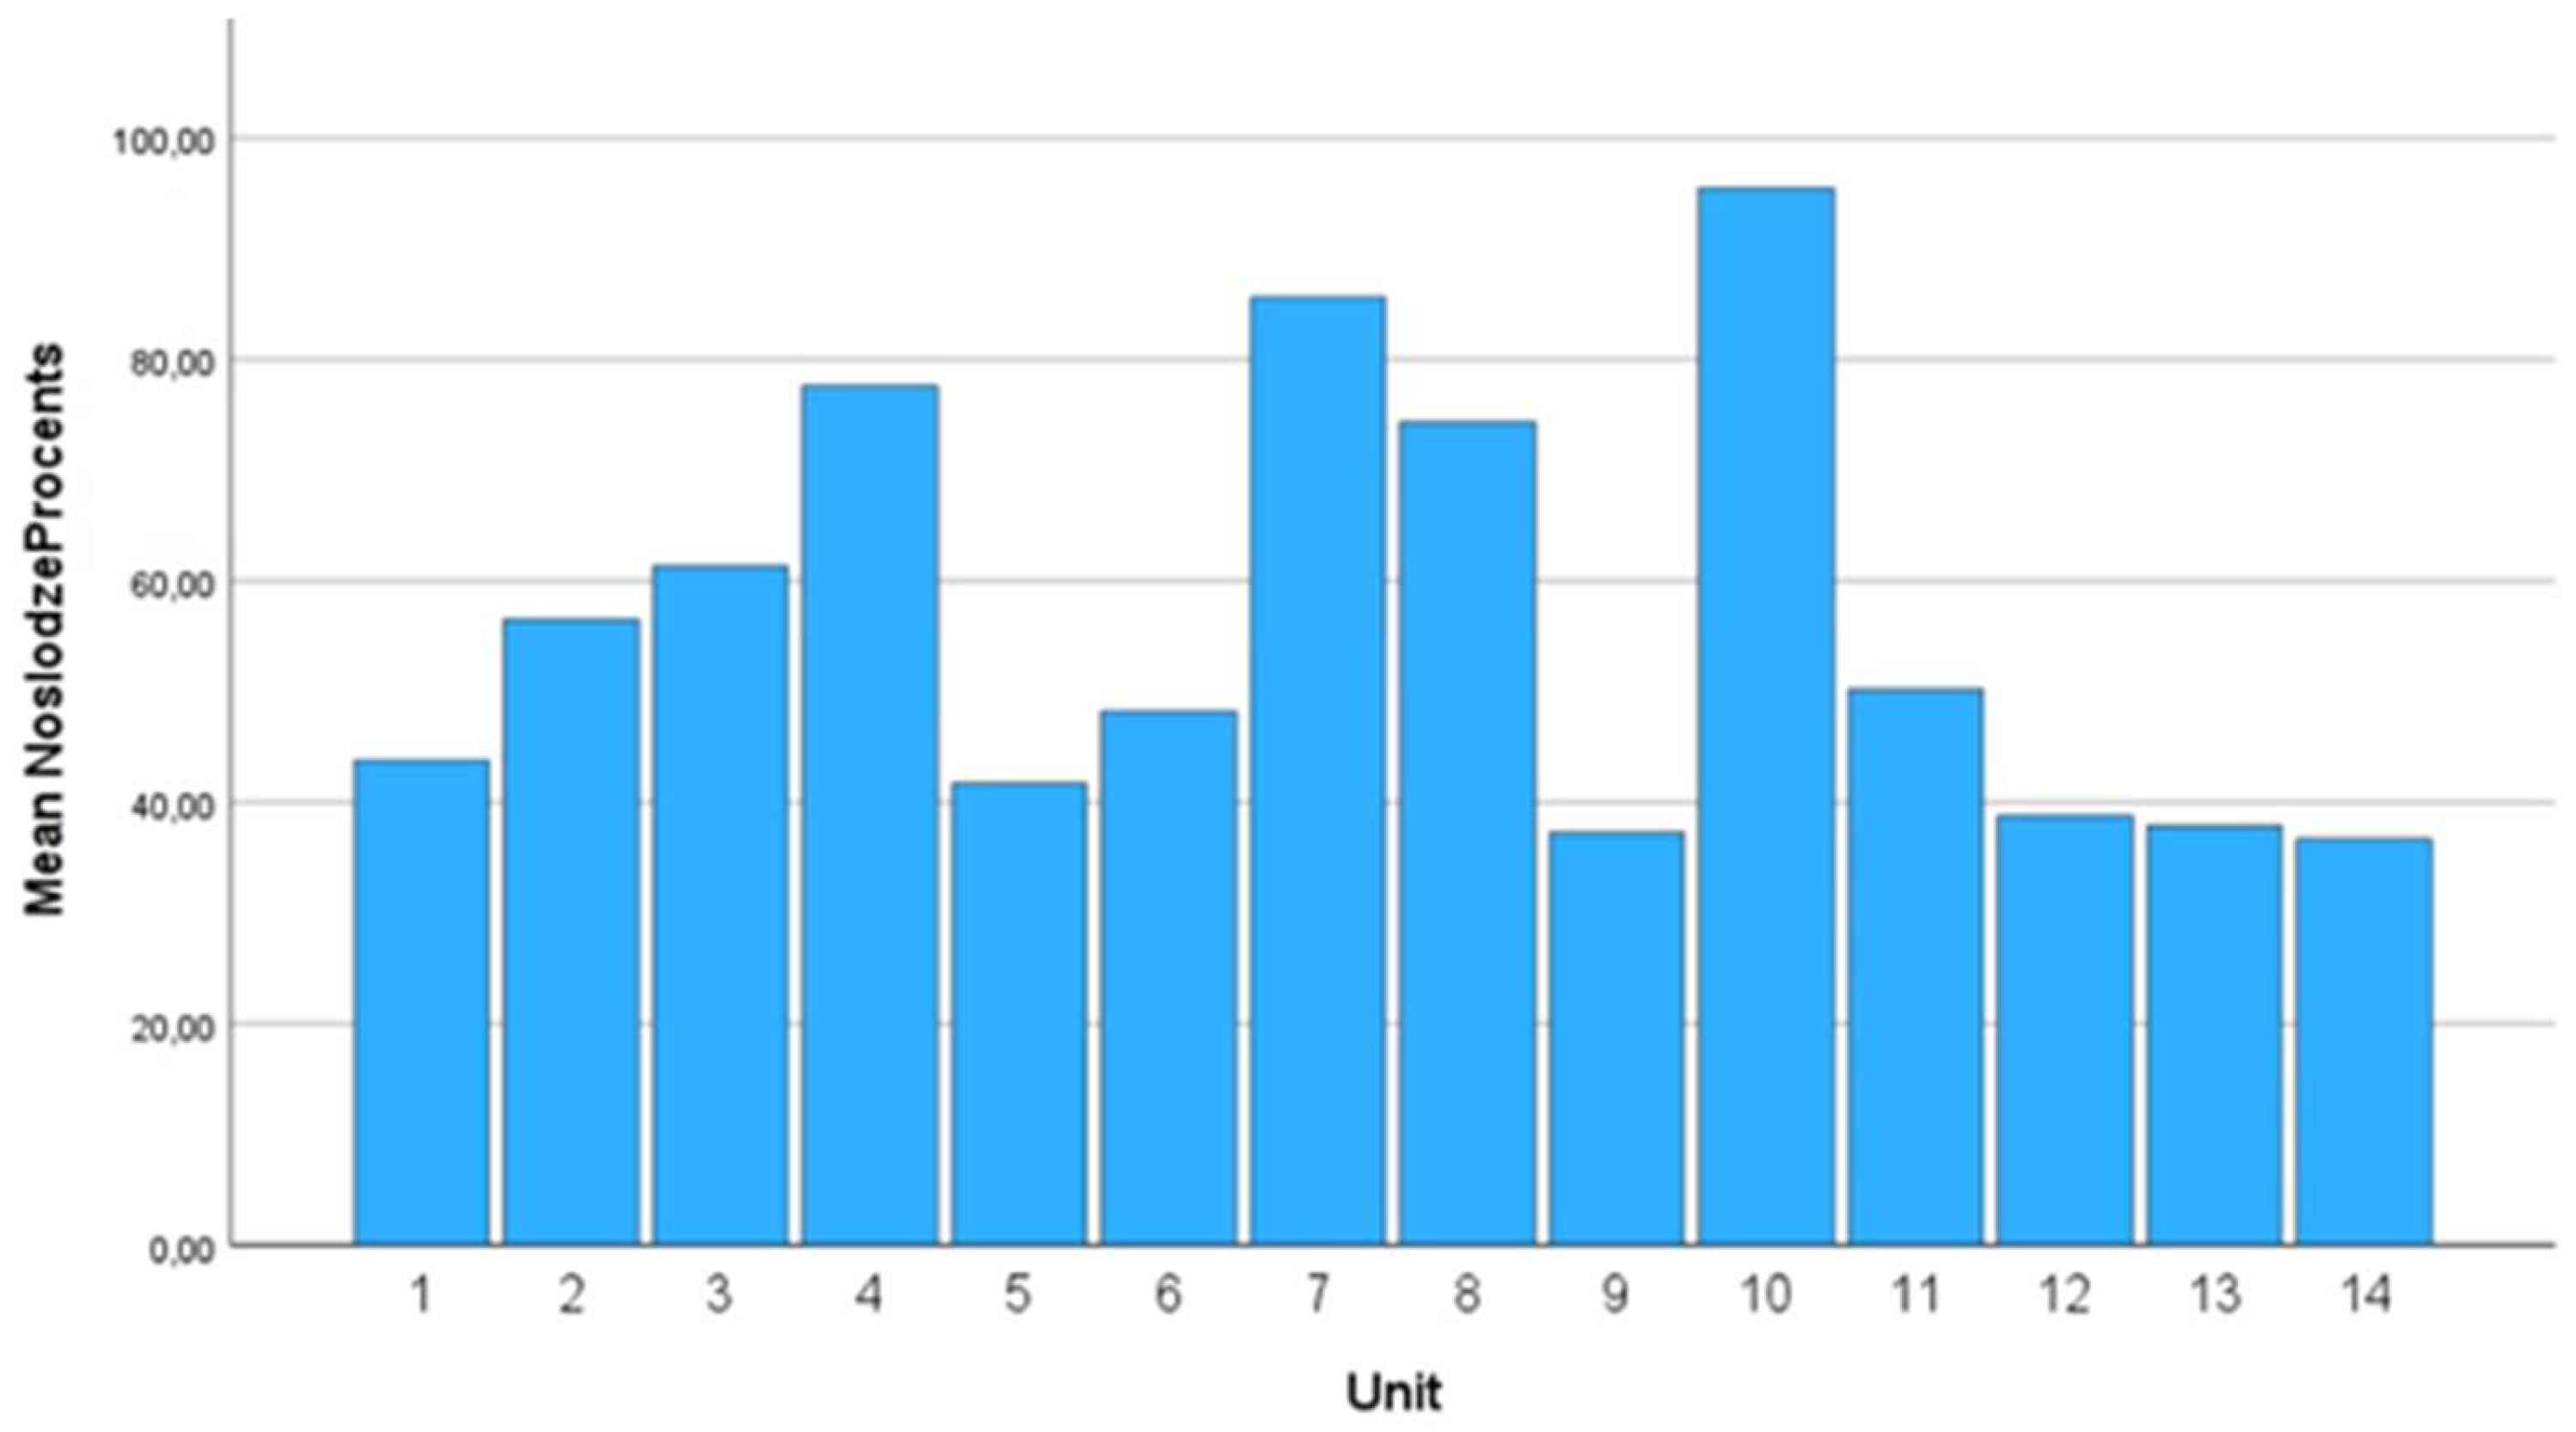
Figure 10.
Nursing shortage by month.
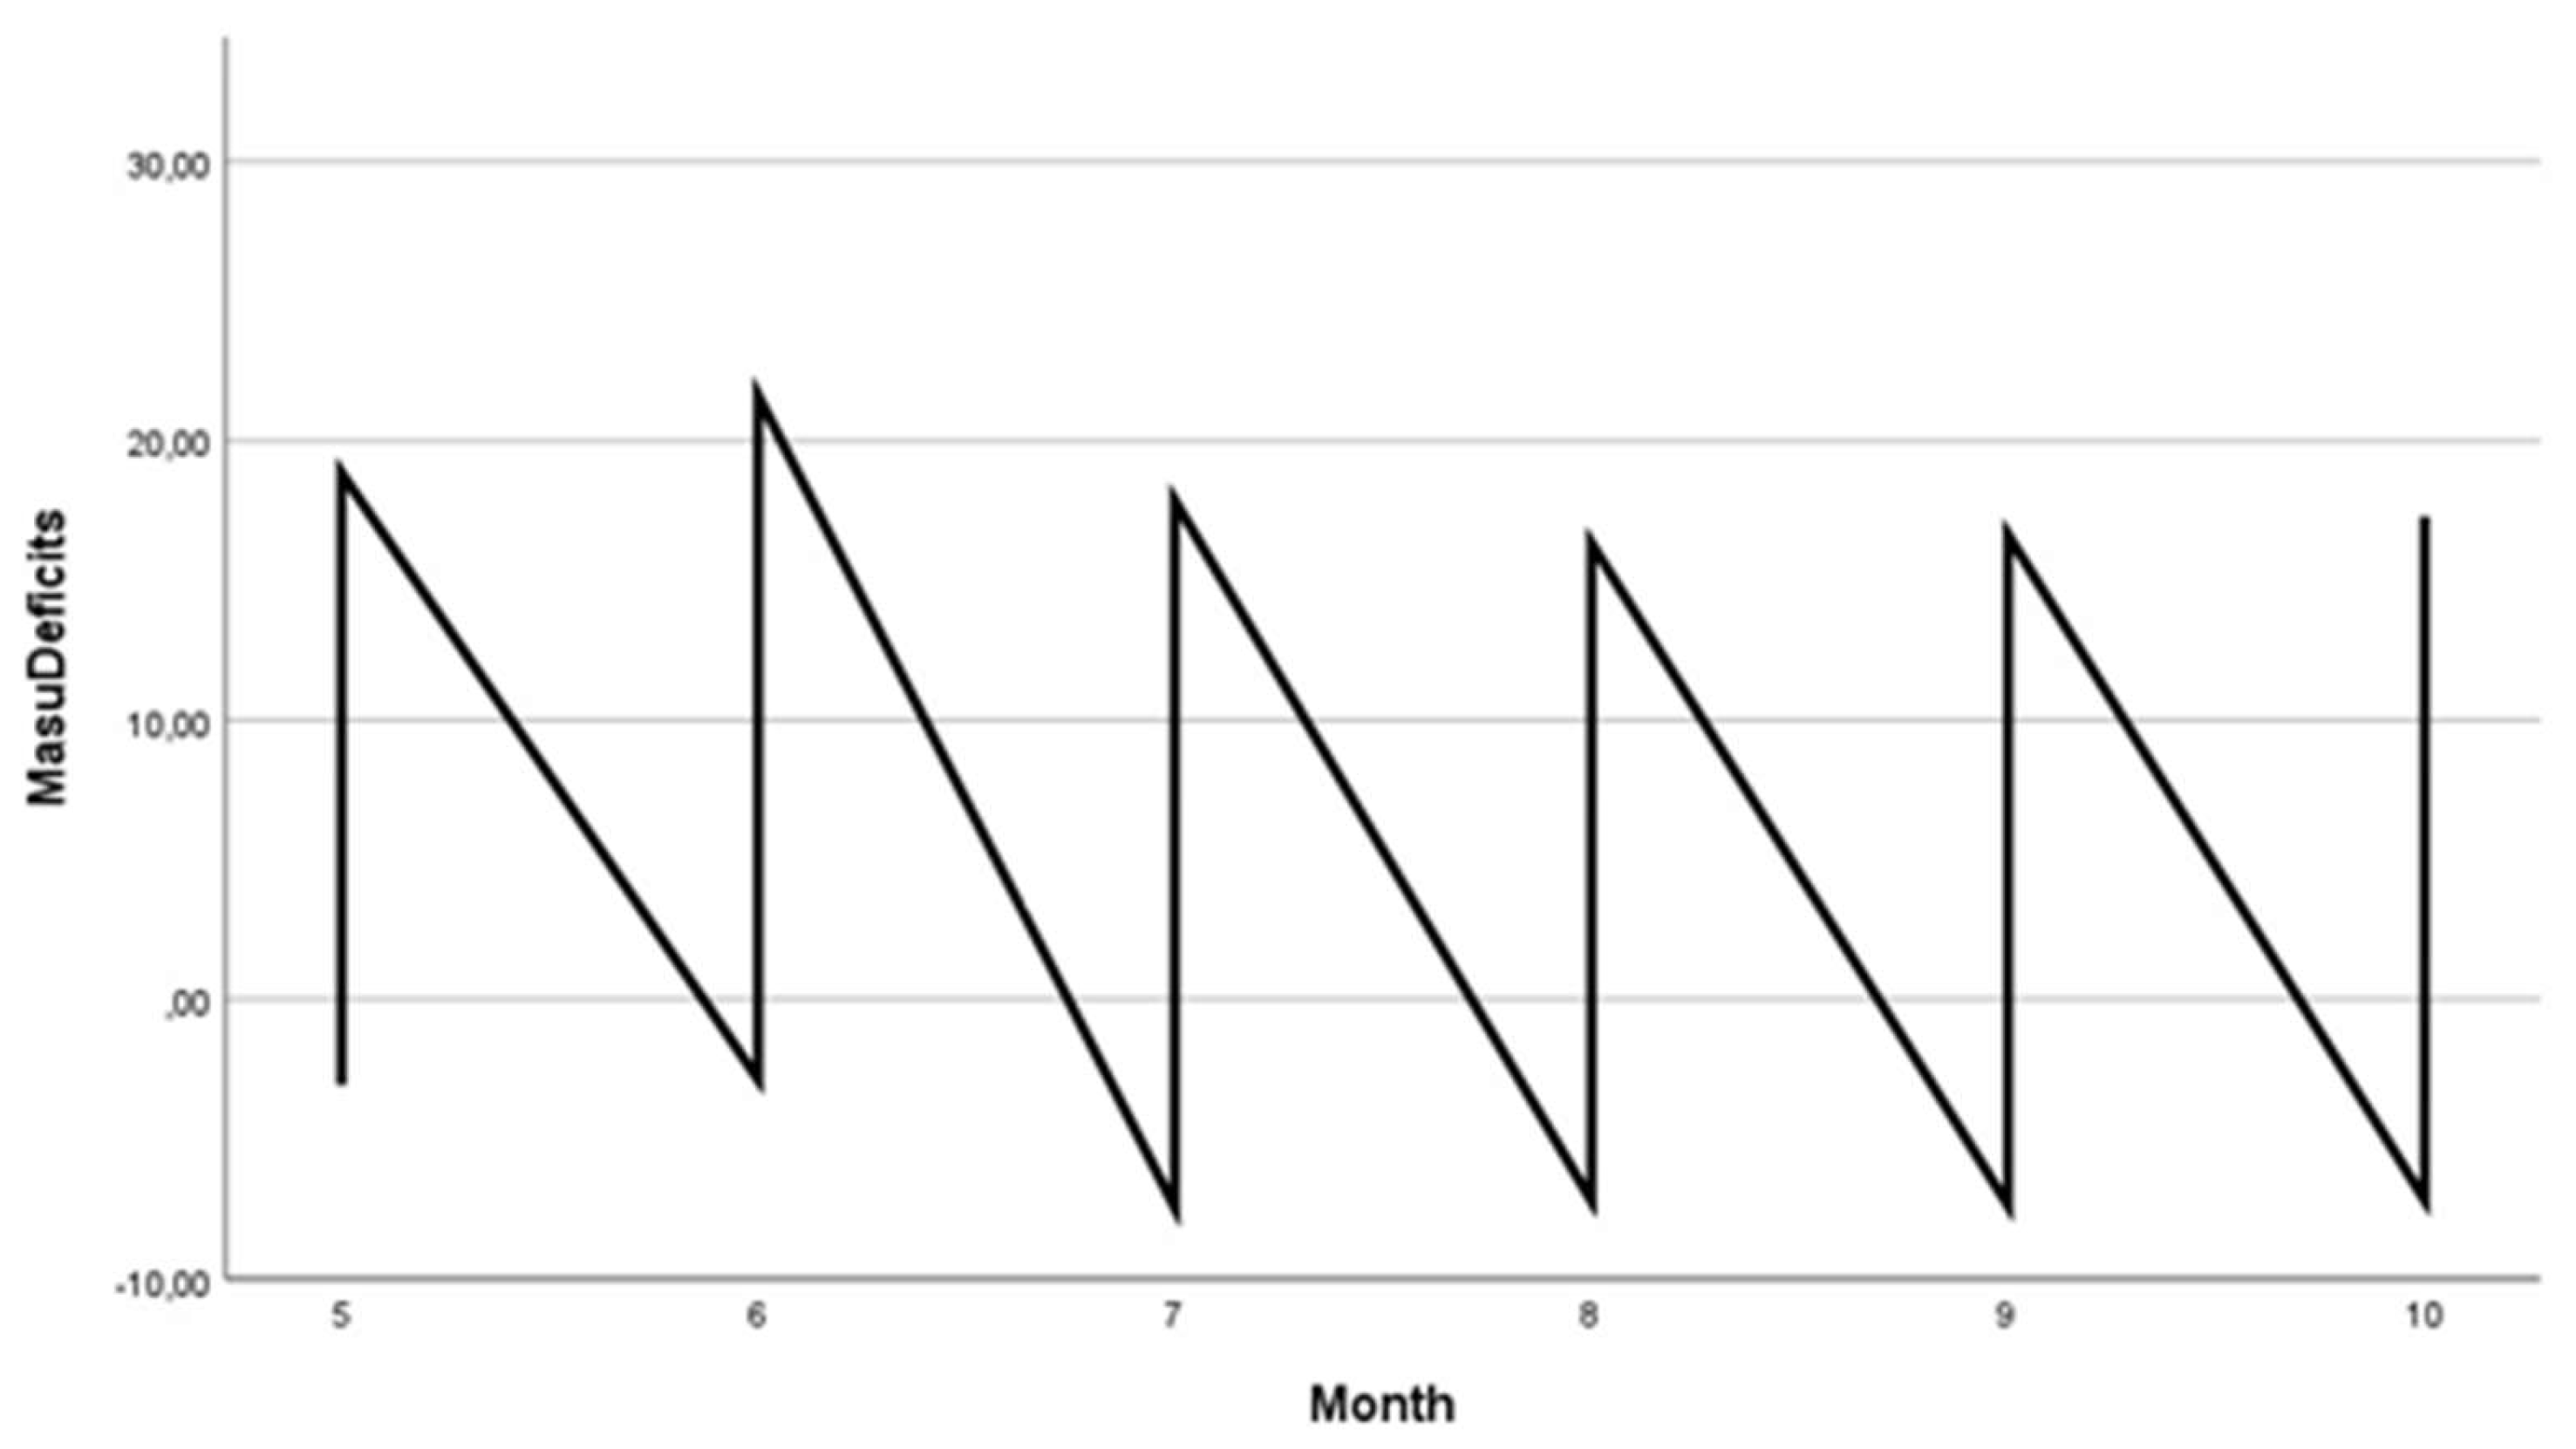
Figure 11.
Boxplot: nursing shortage by month.
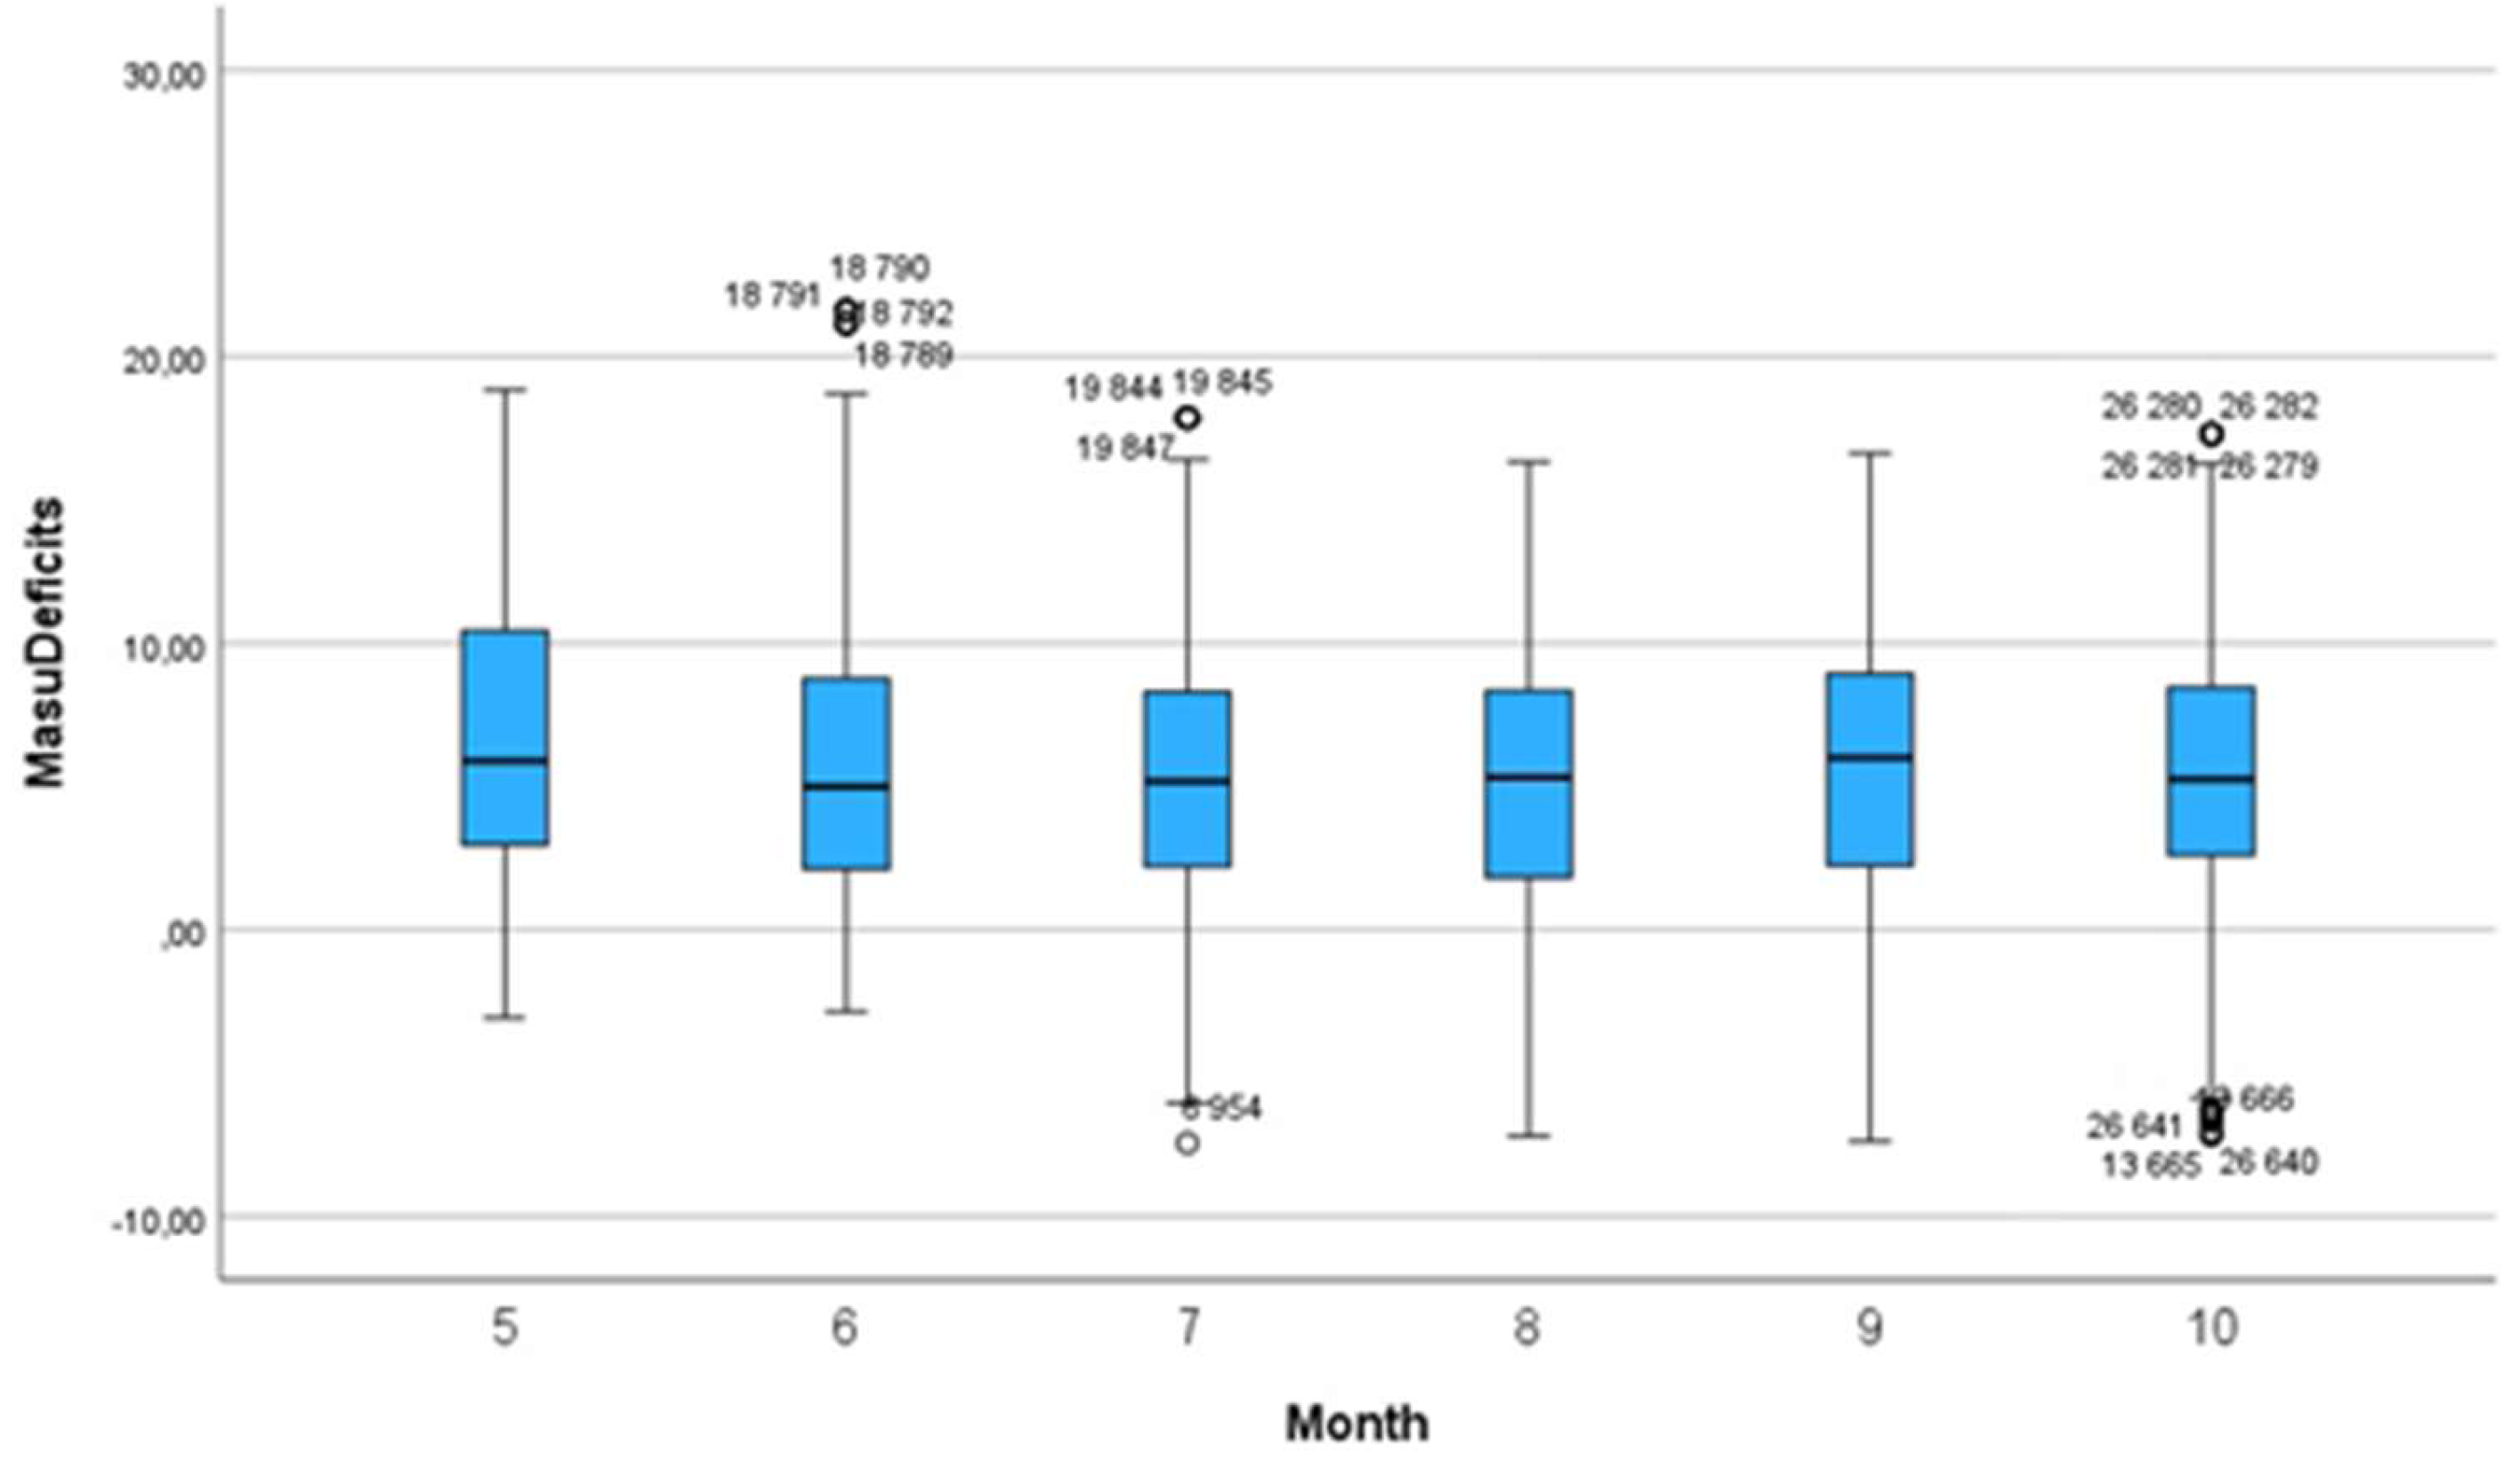
Figure 11.
Linear regression model between NAS points and nursing shortage.
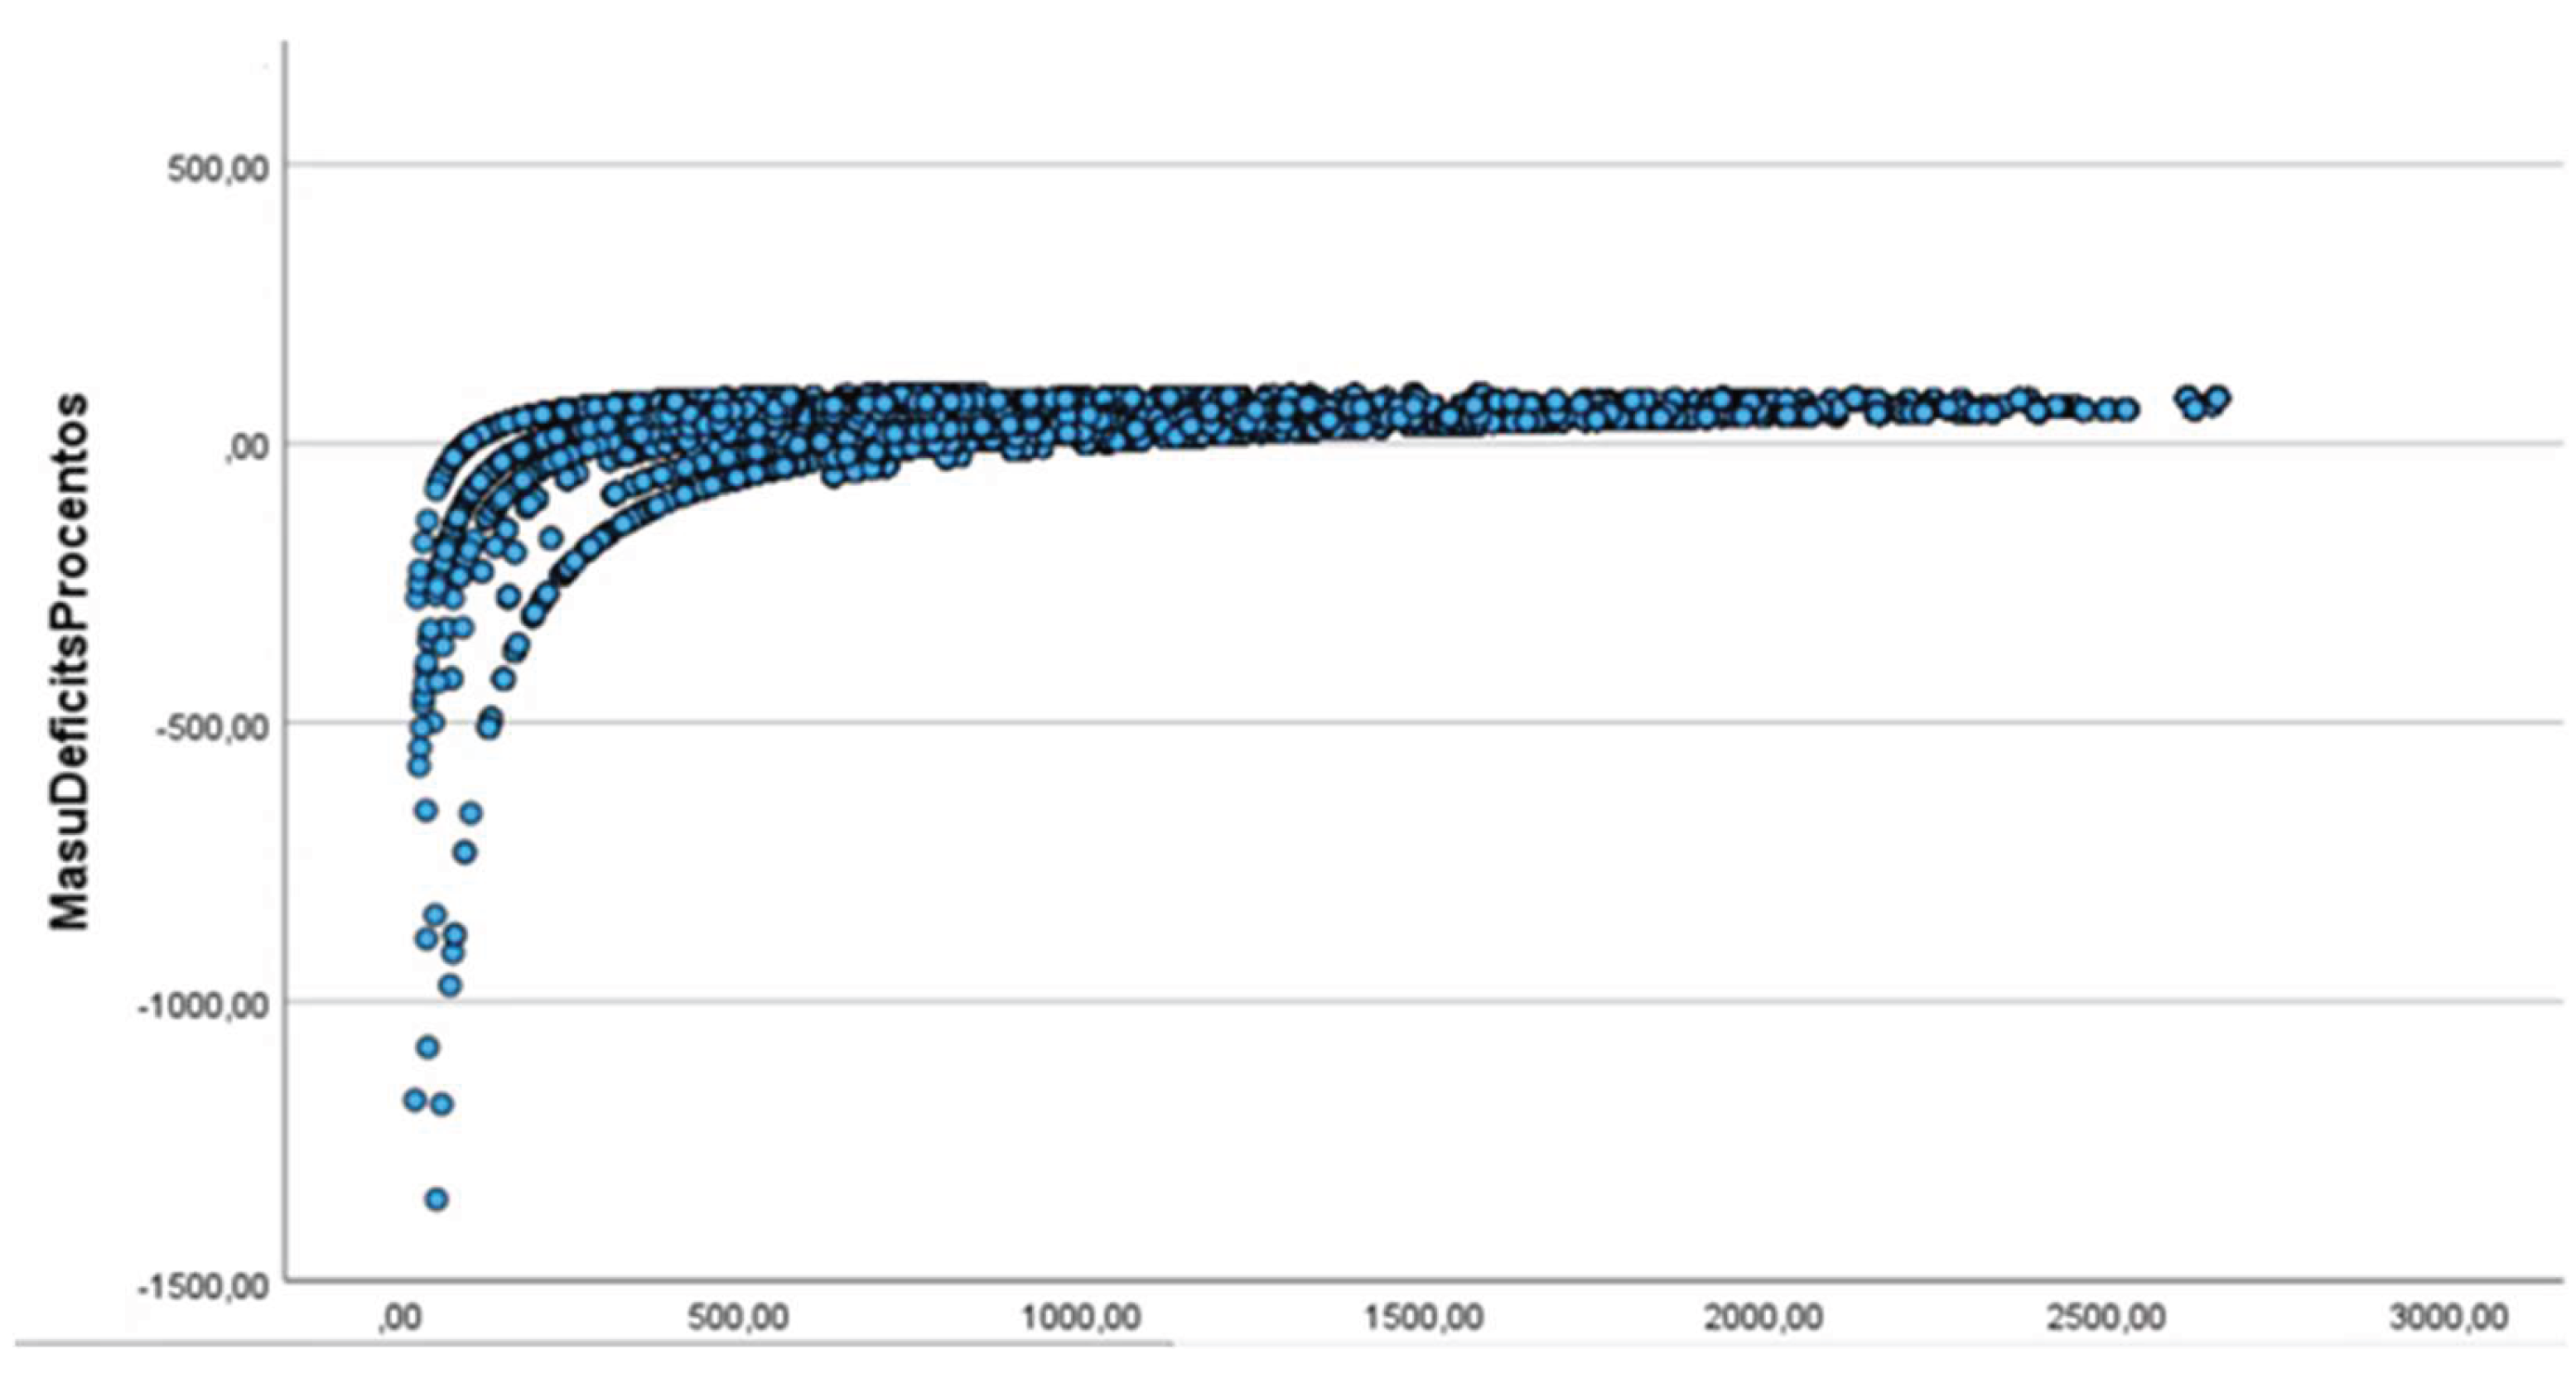
Figure 12.
NAS-based distribution of nurses required (NursesRequired) in 14 ICUs.
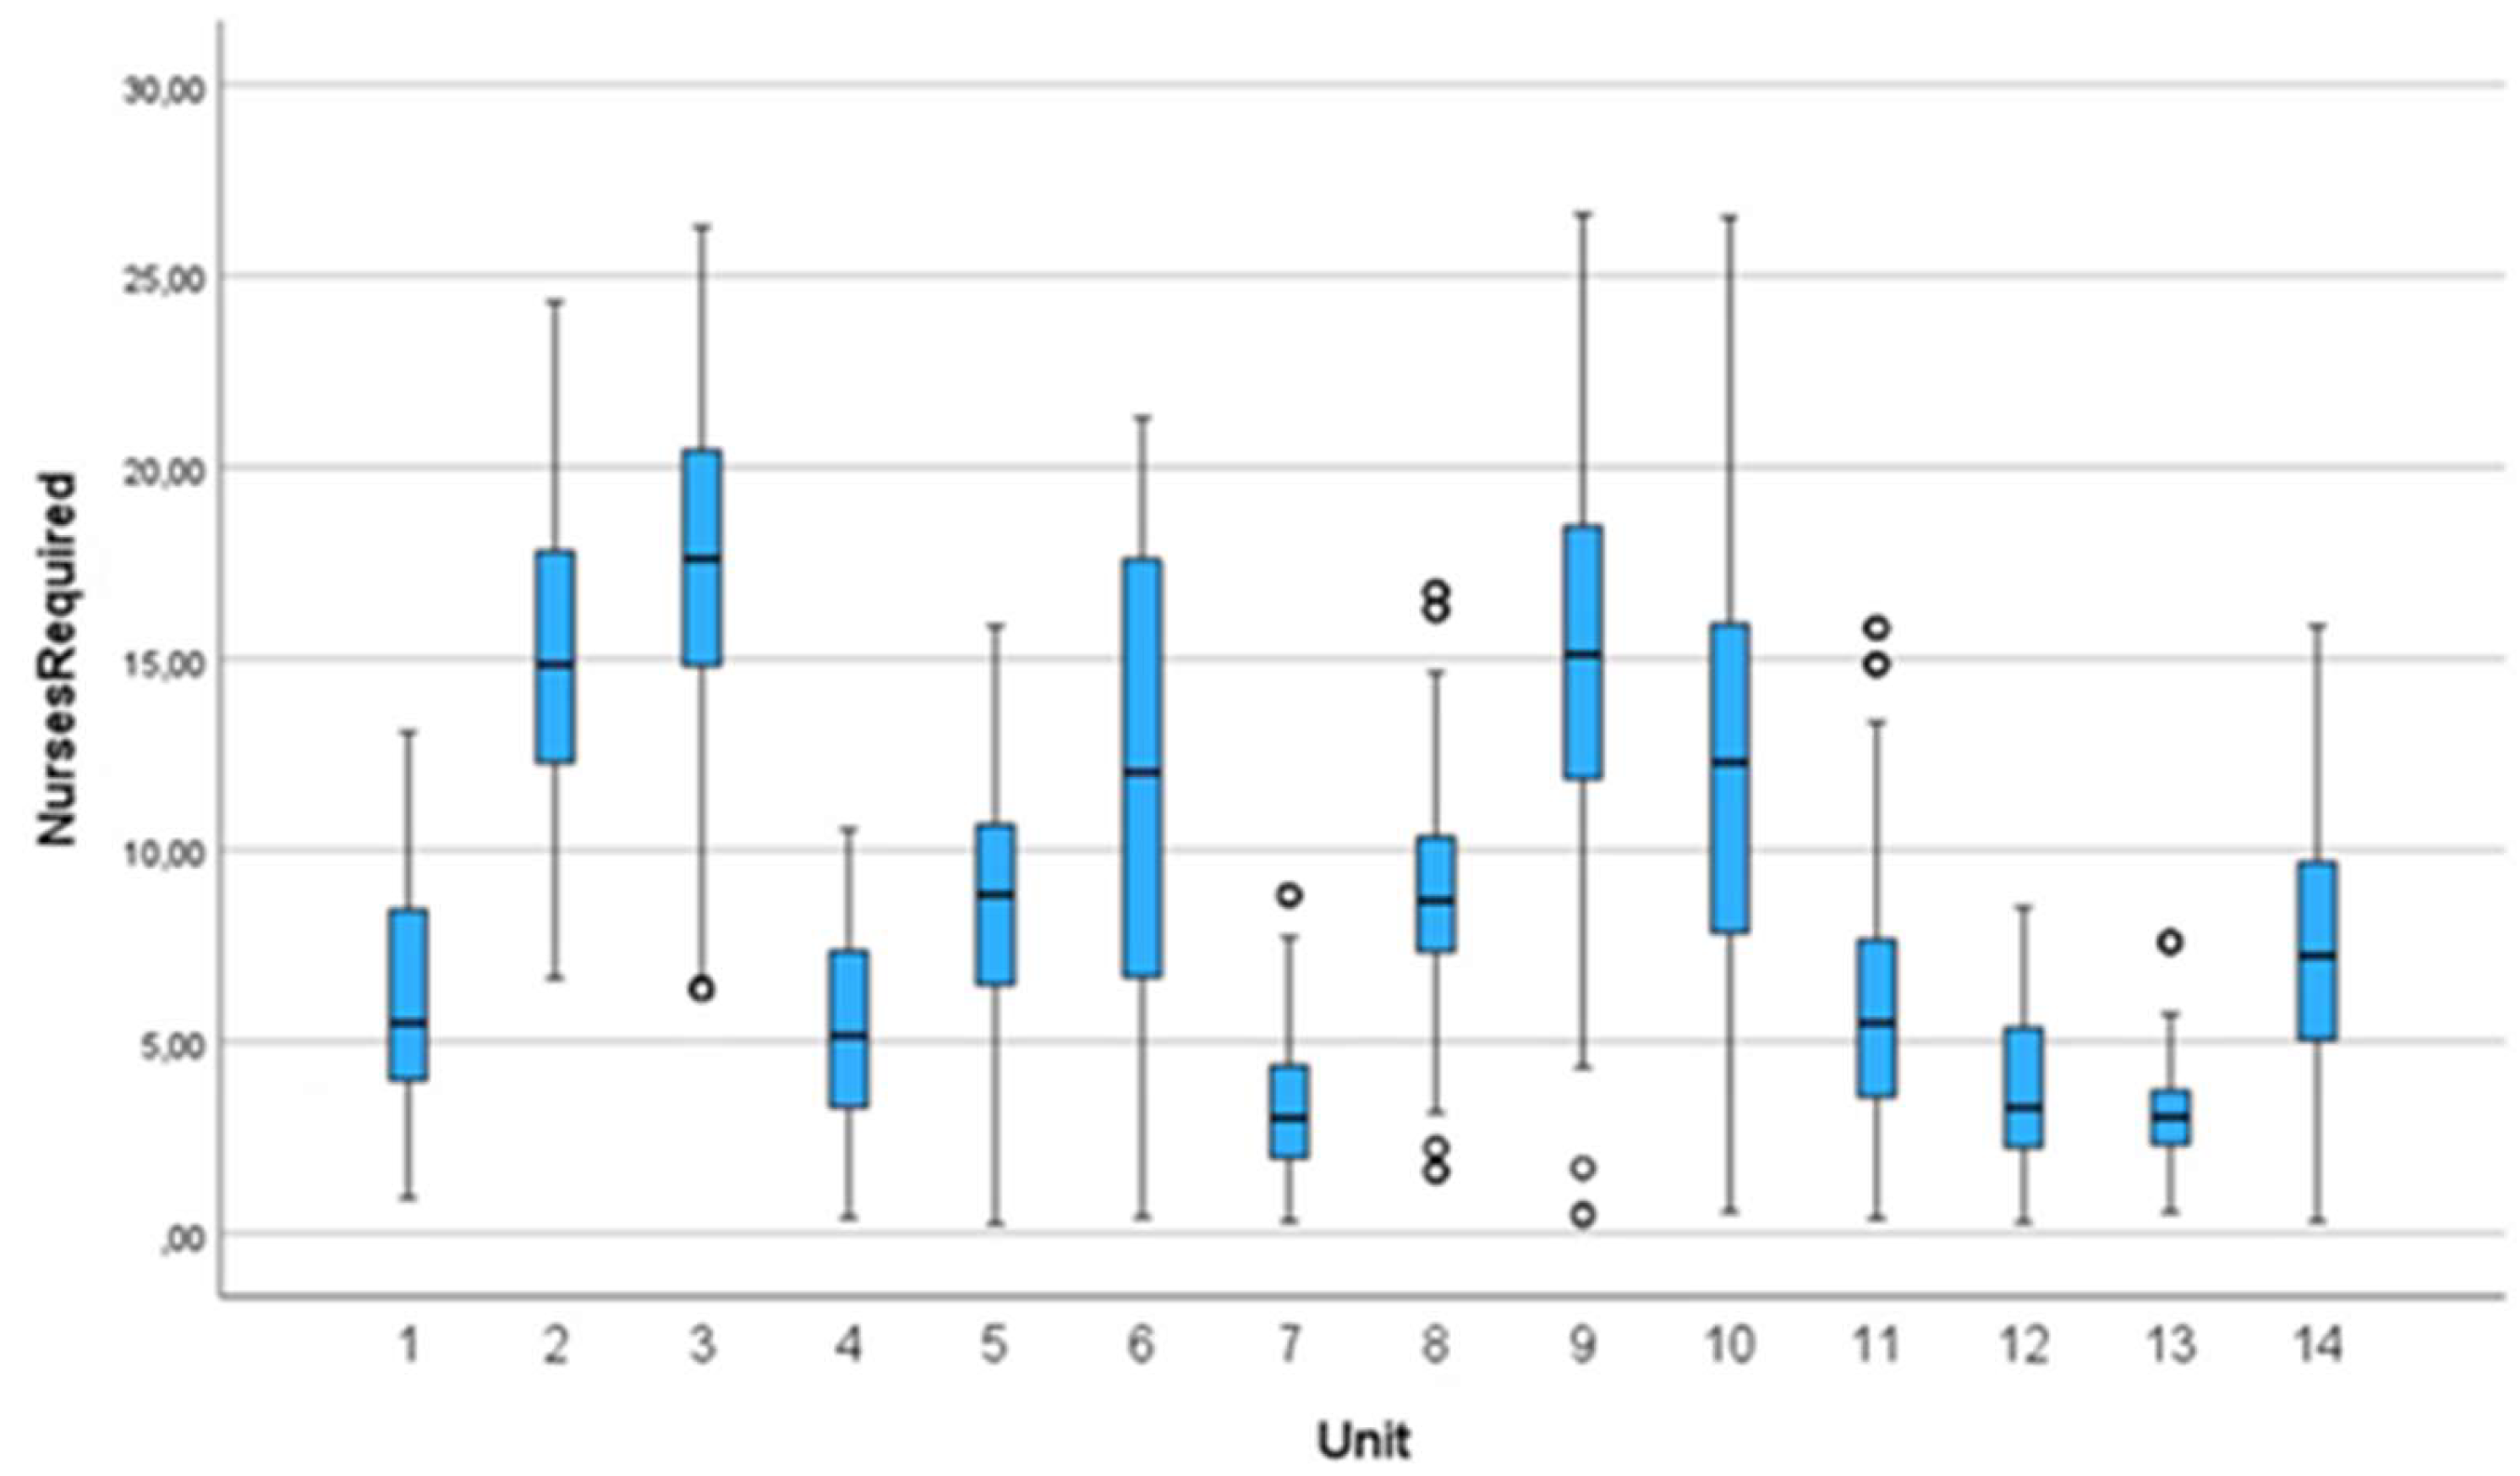
Figure 13.
Heatmap for unit workloads.
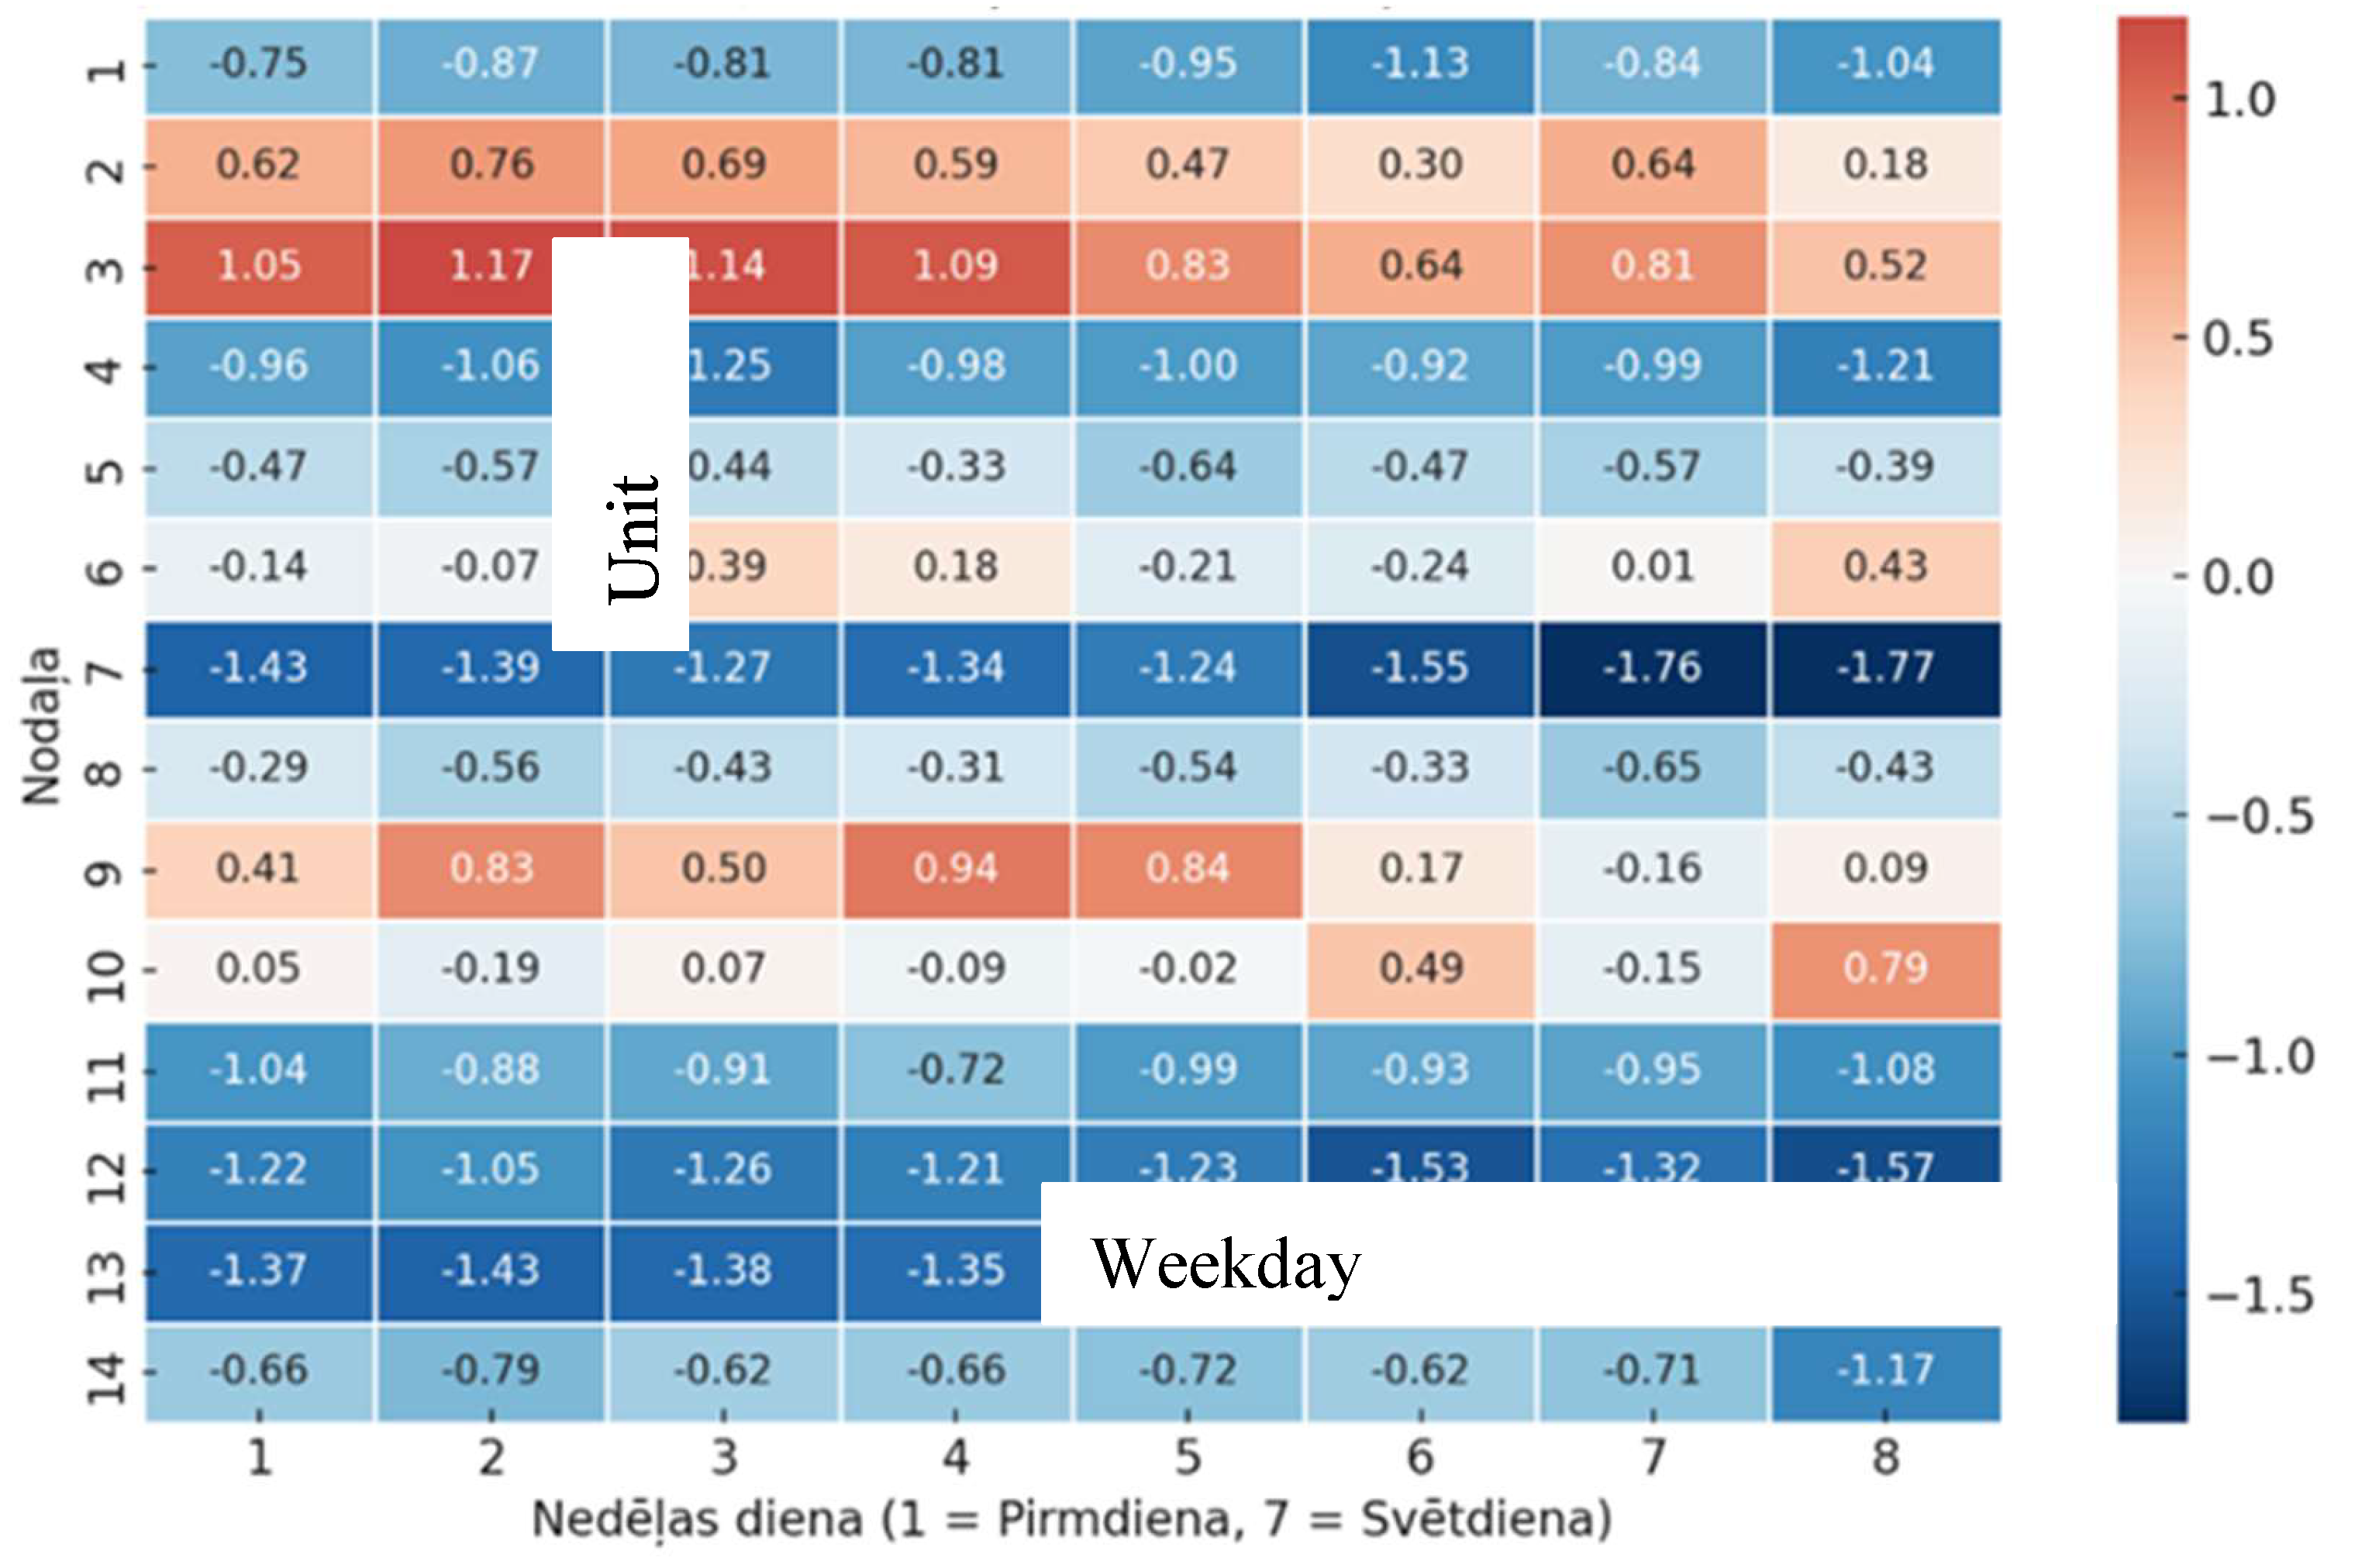
Figure 14.
NAS and Workload Index seasonality.
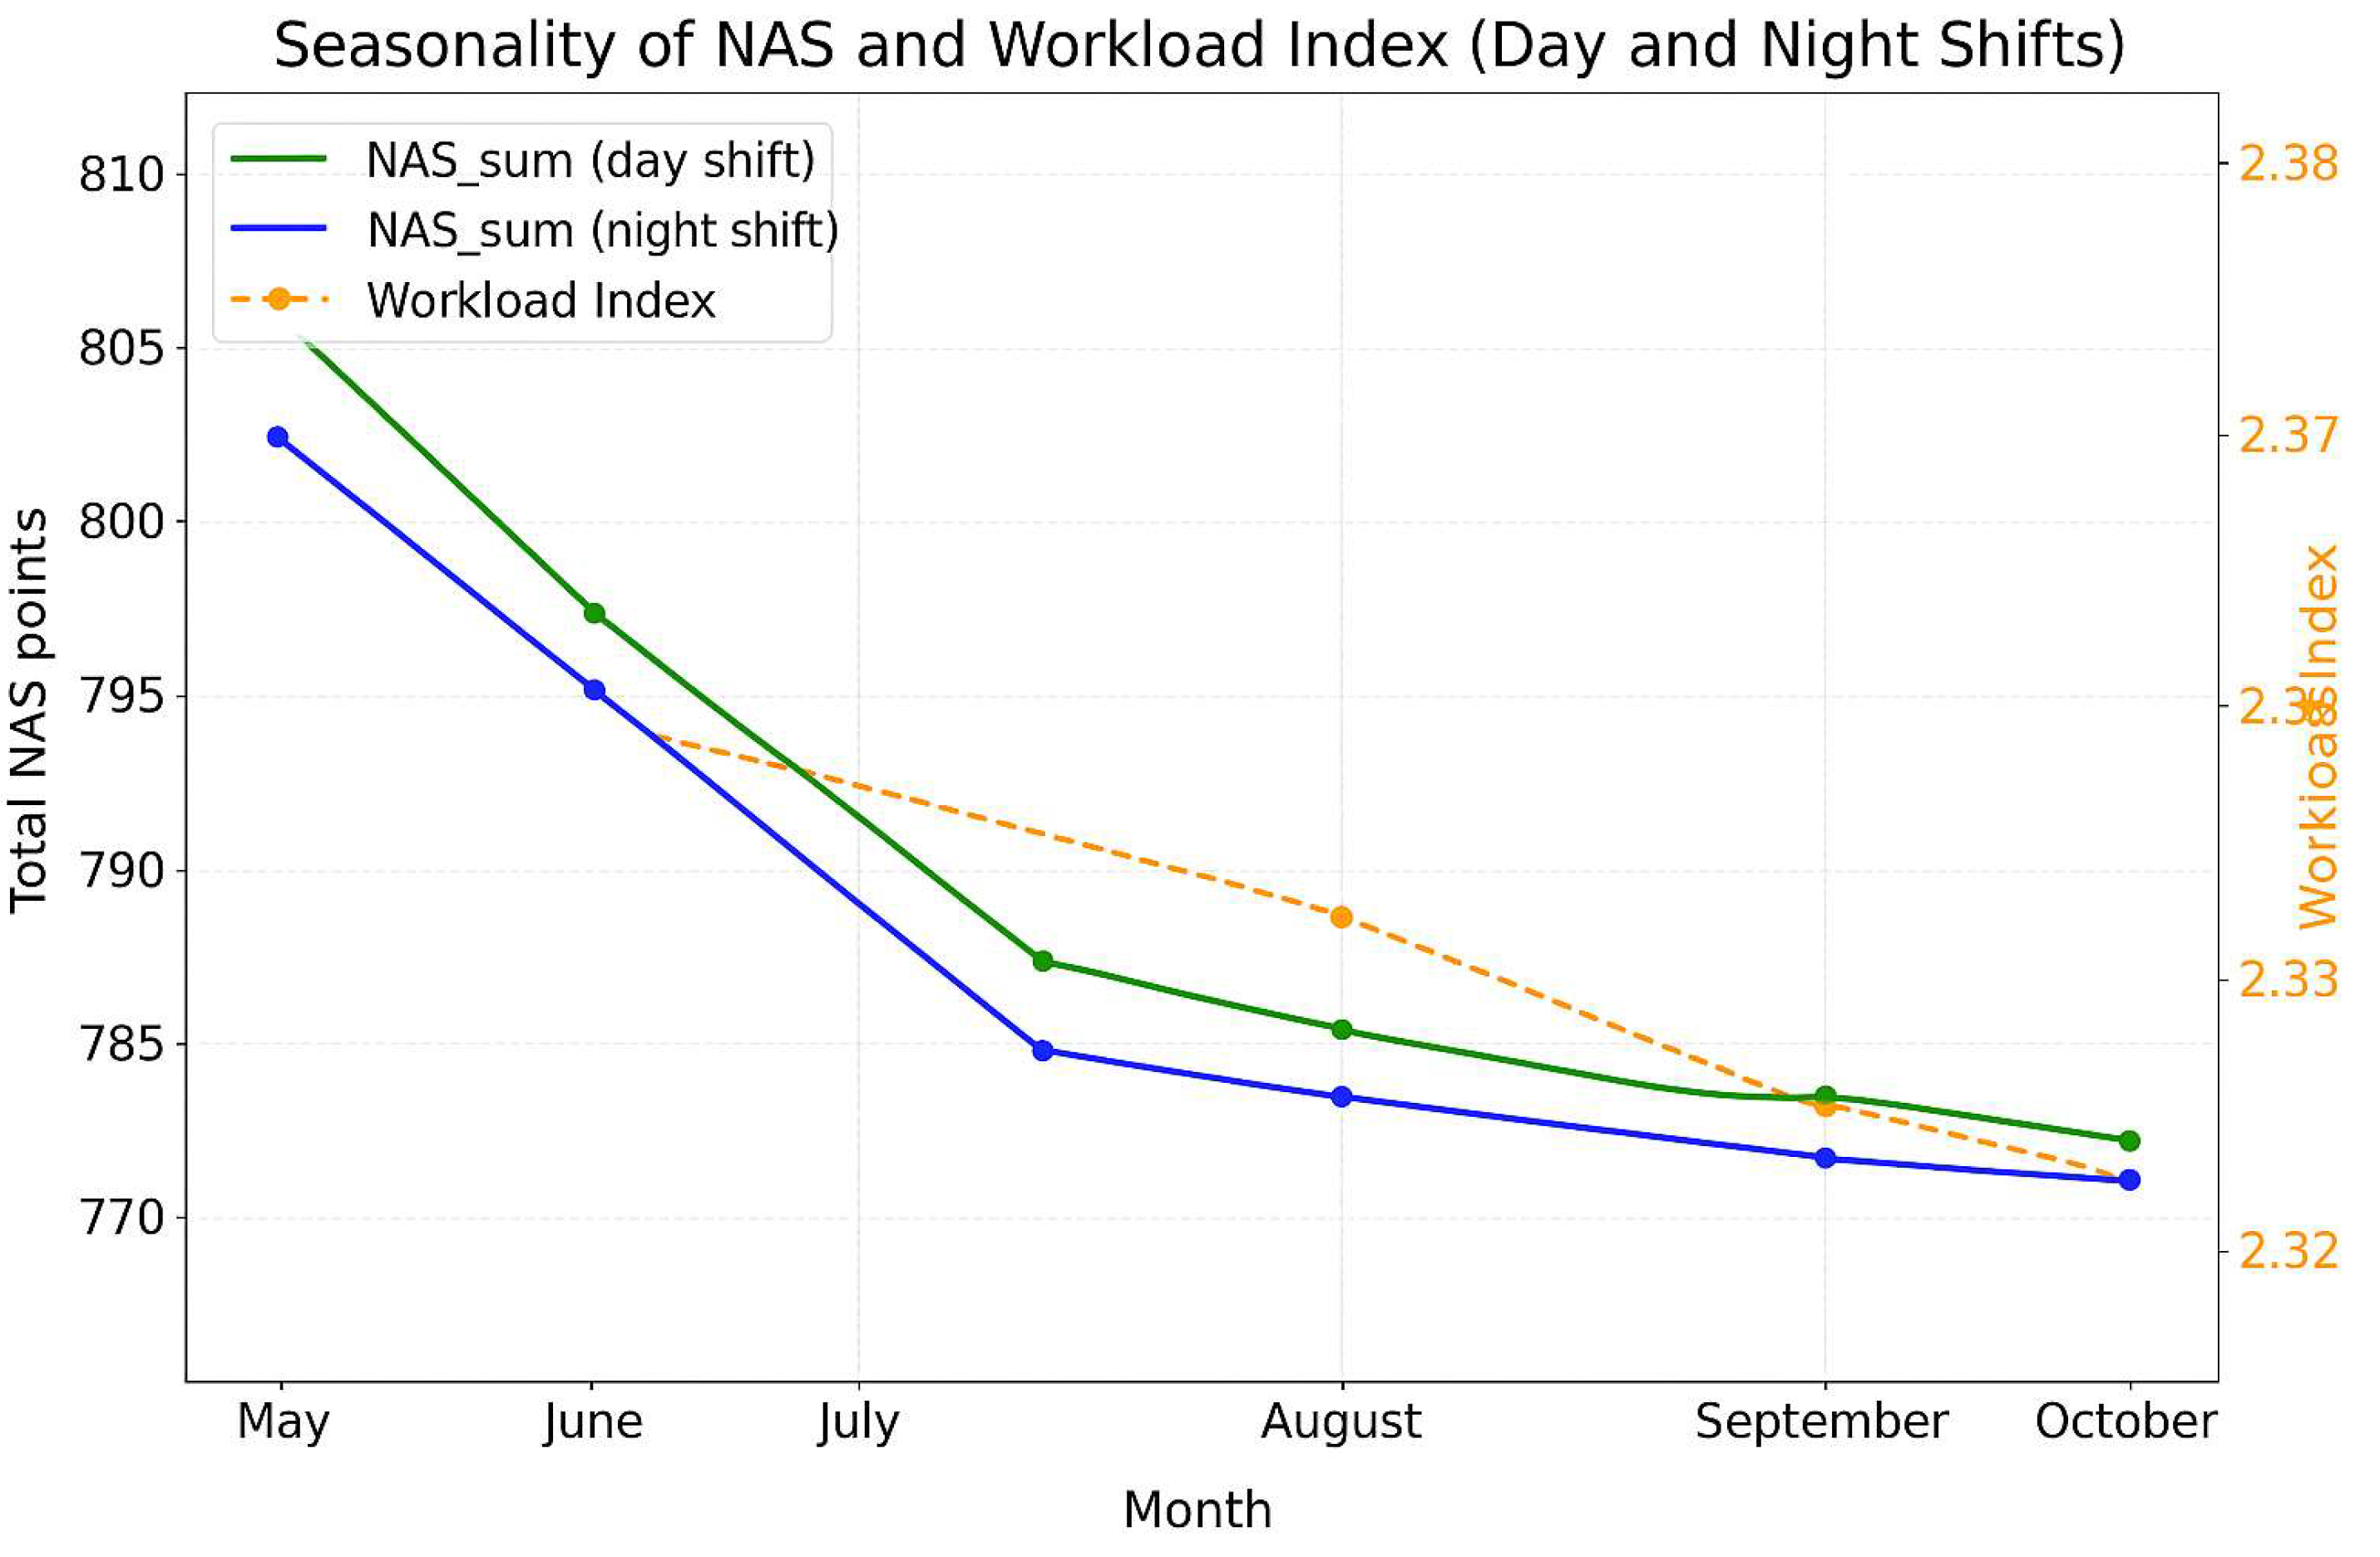
Figure 15.
Workload Index distribution by unit.
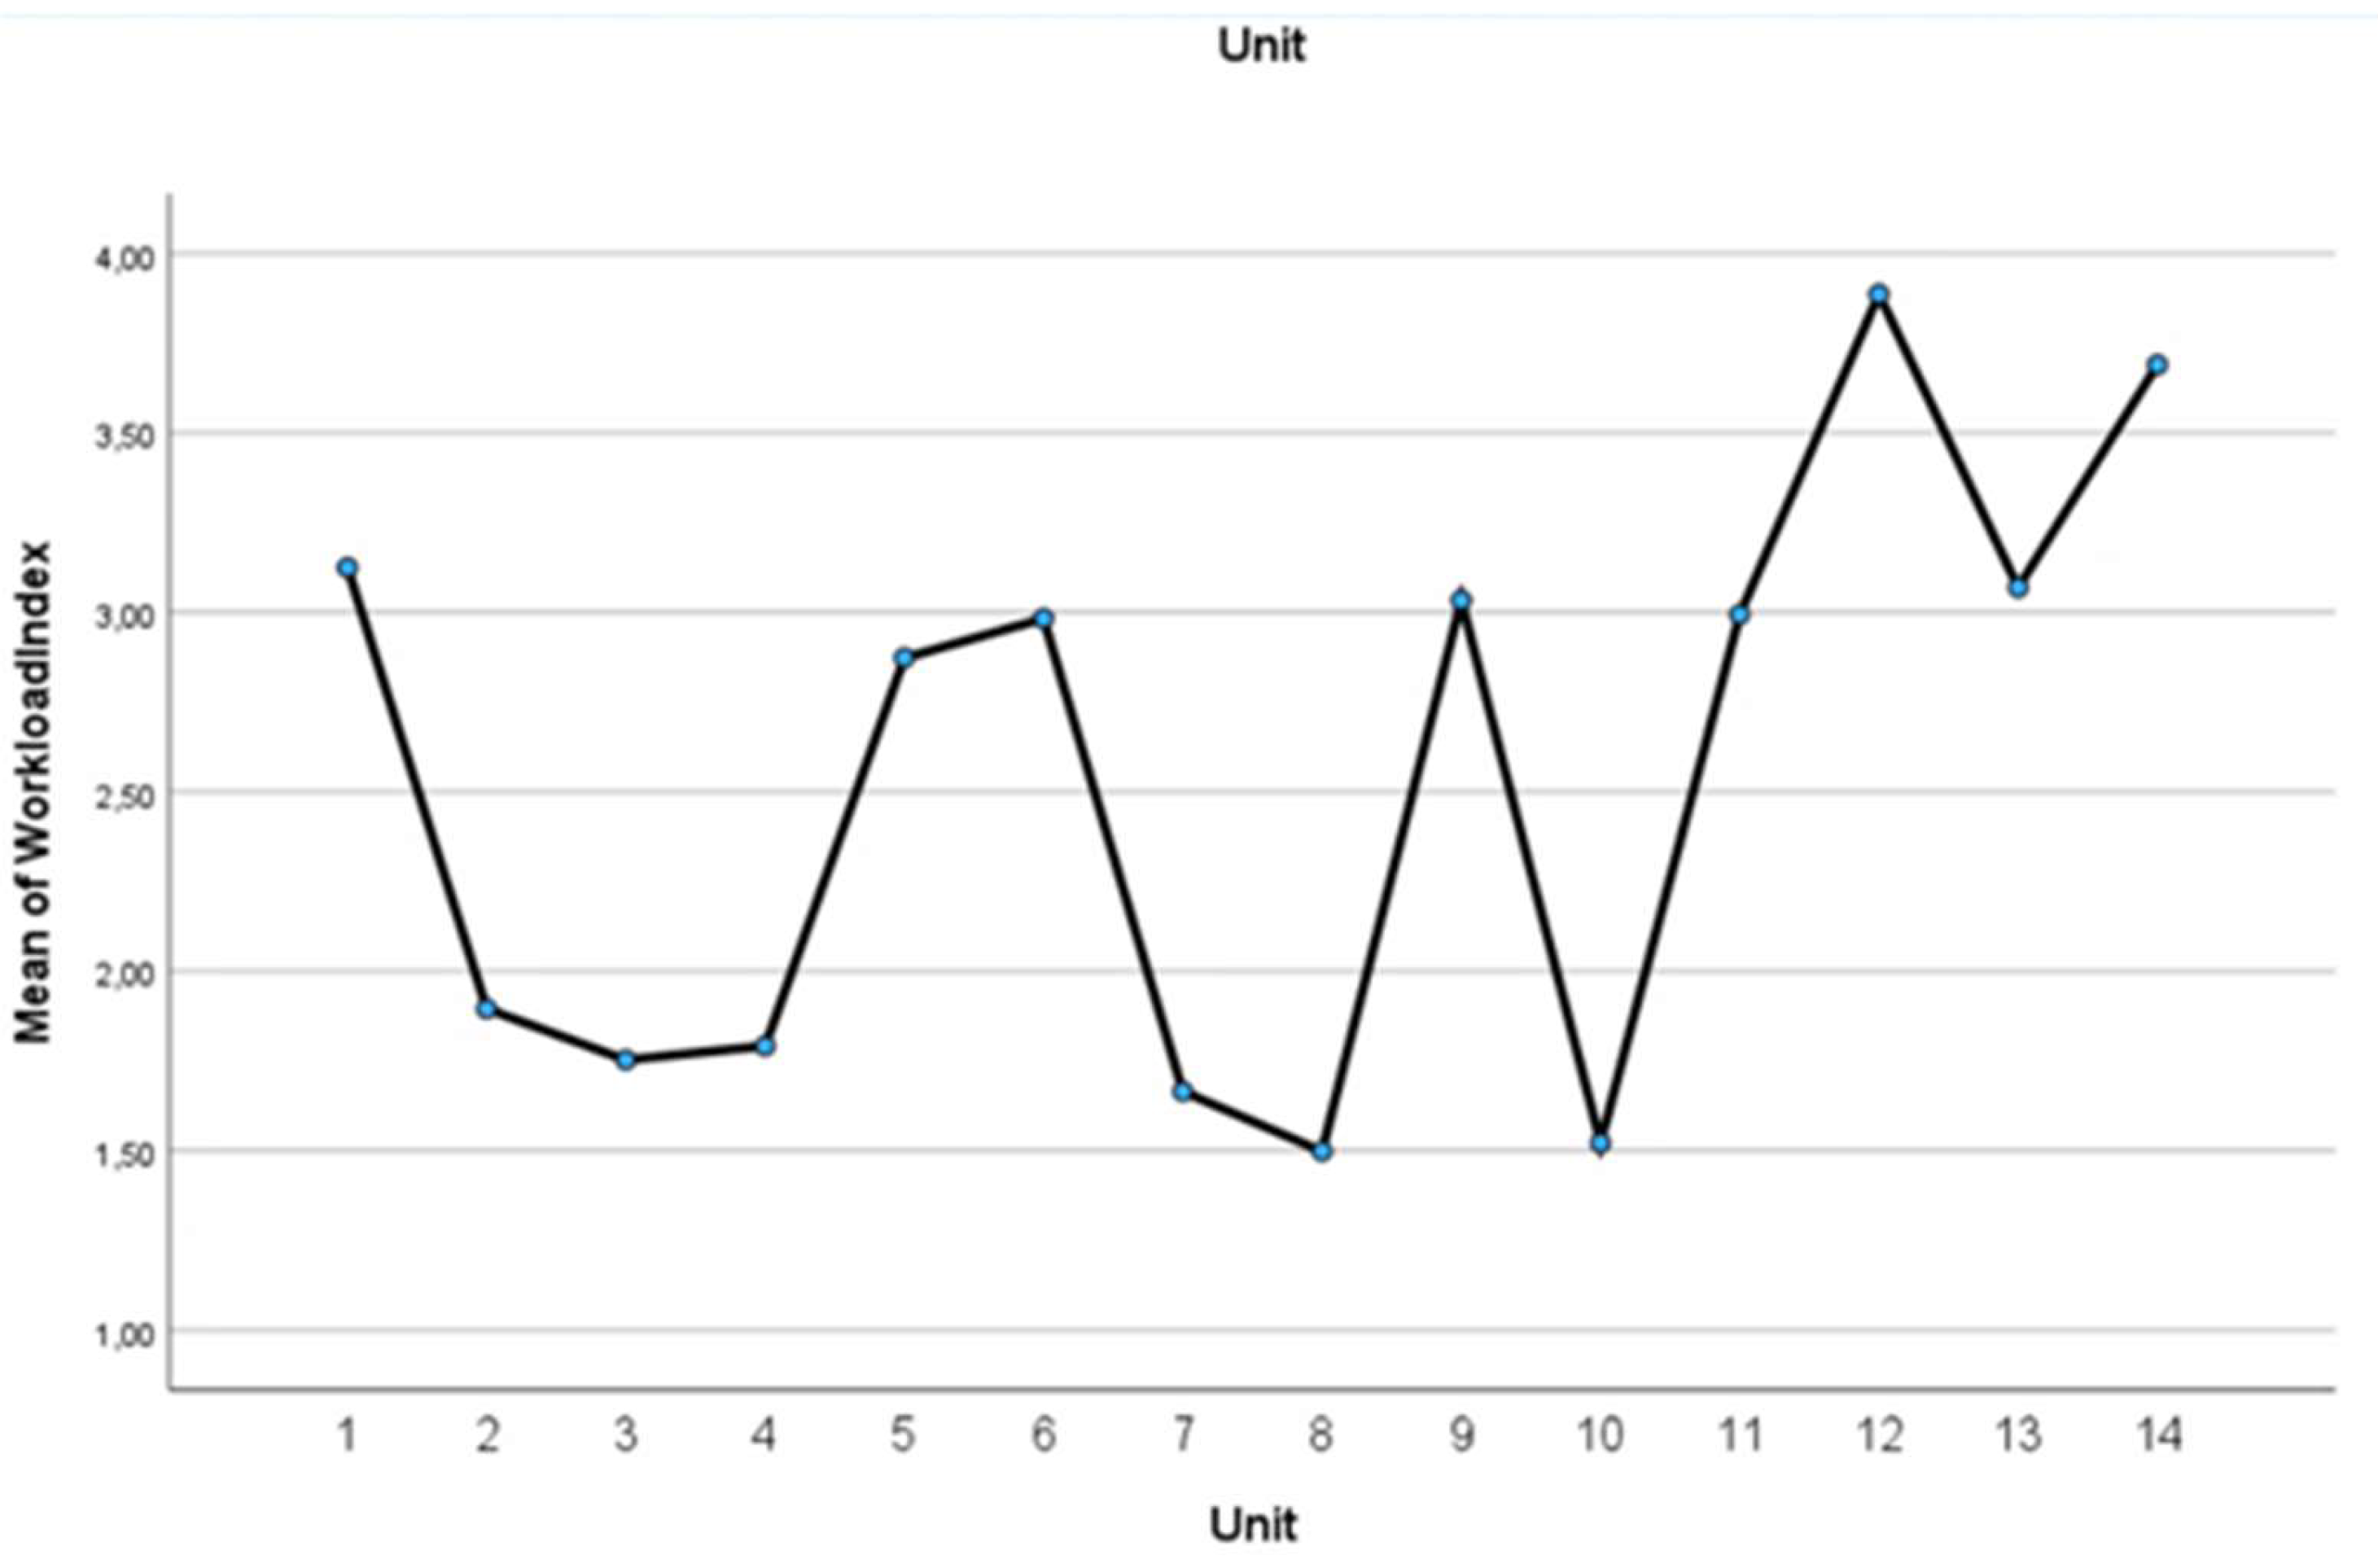
Figure 16.
Scatterplot for NAS point sum and Workload Index.
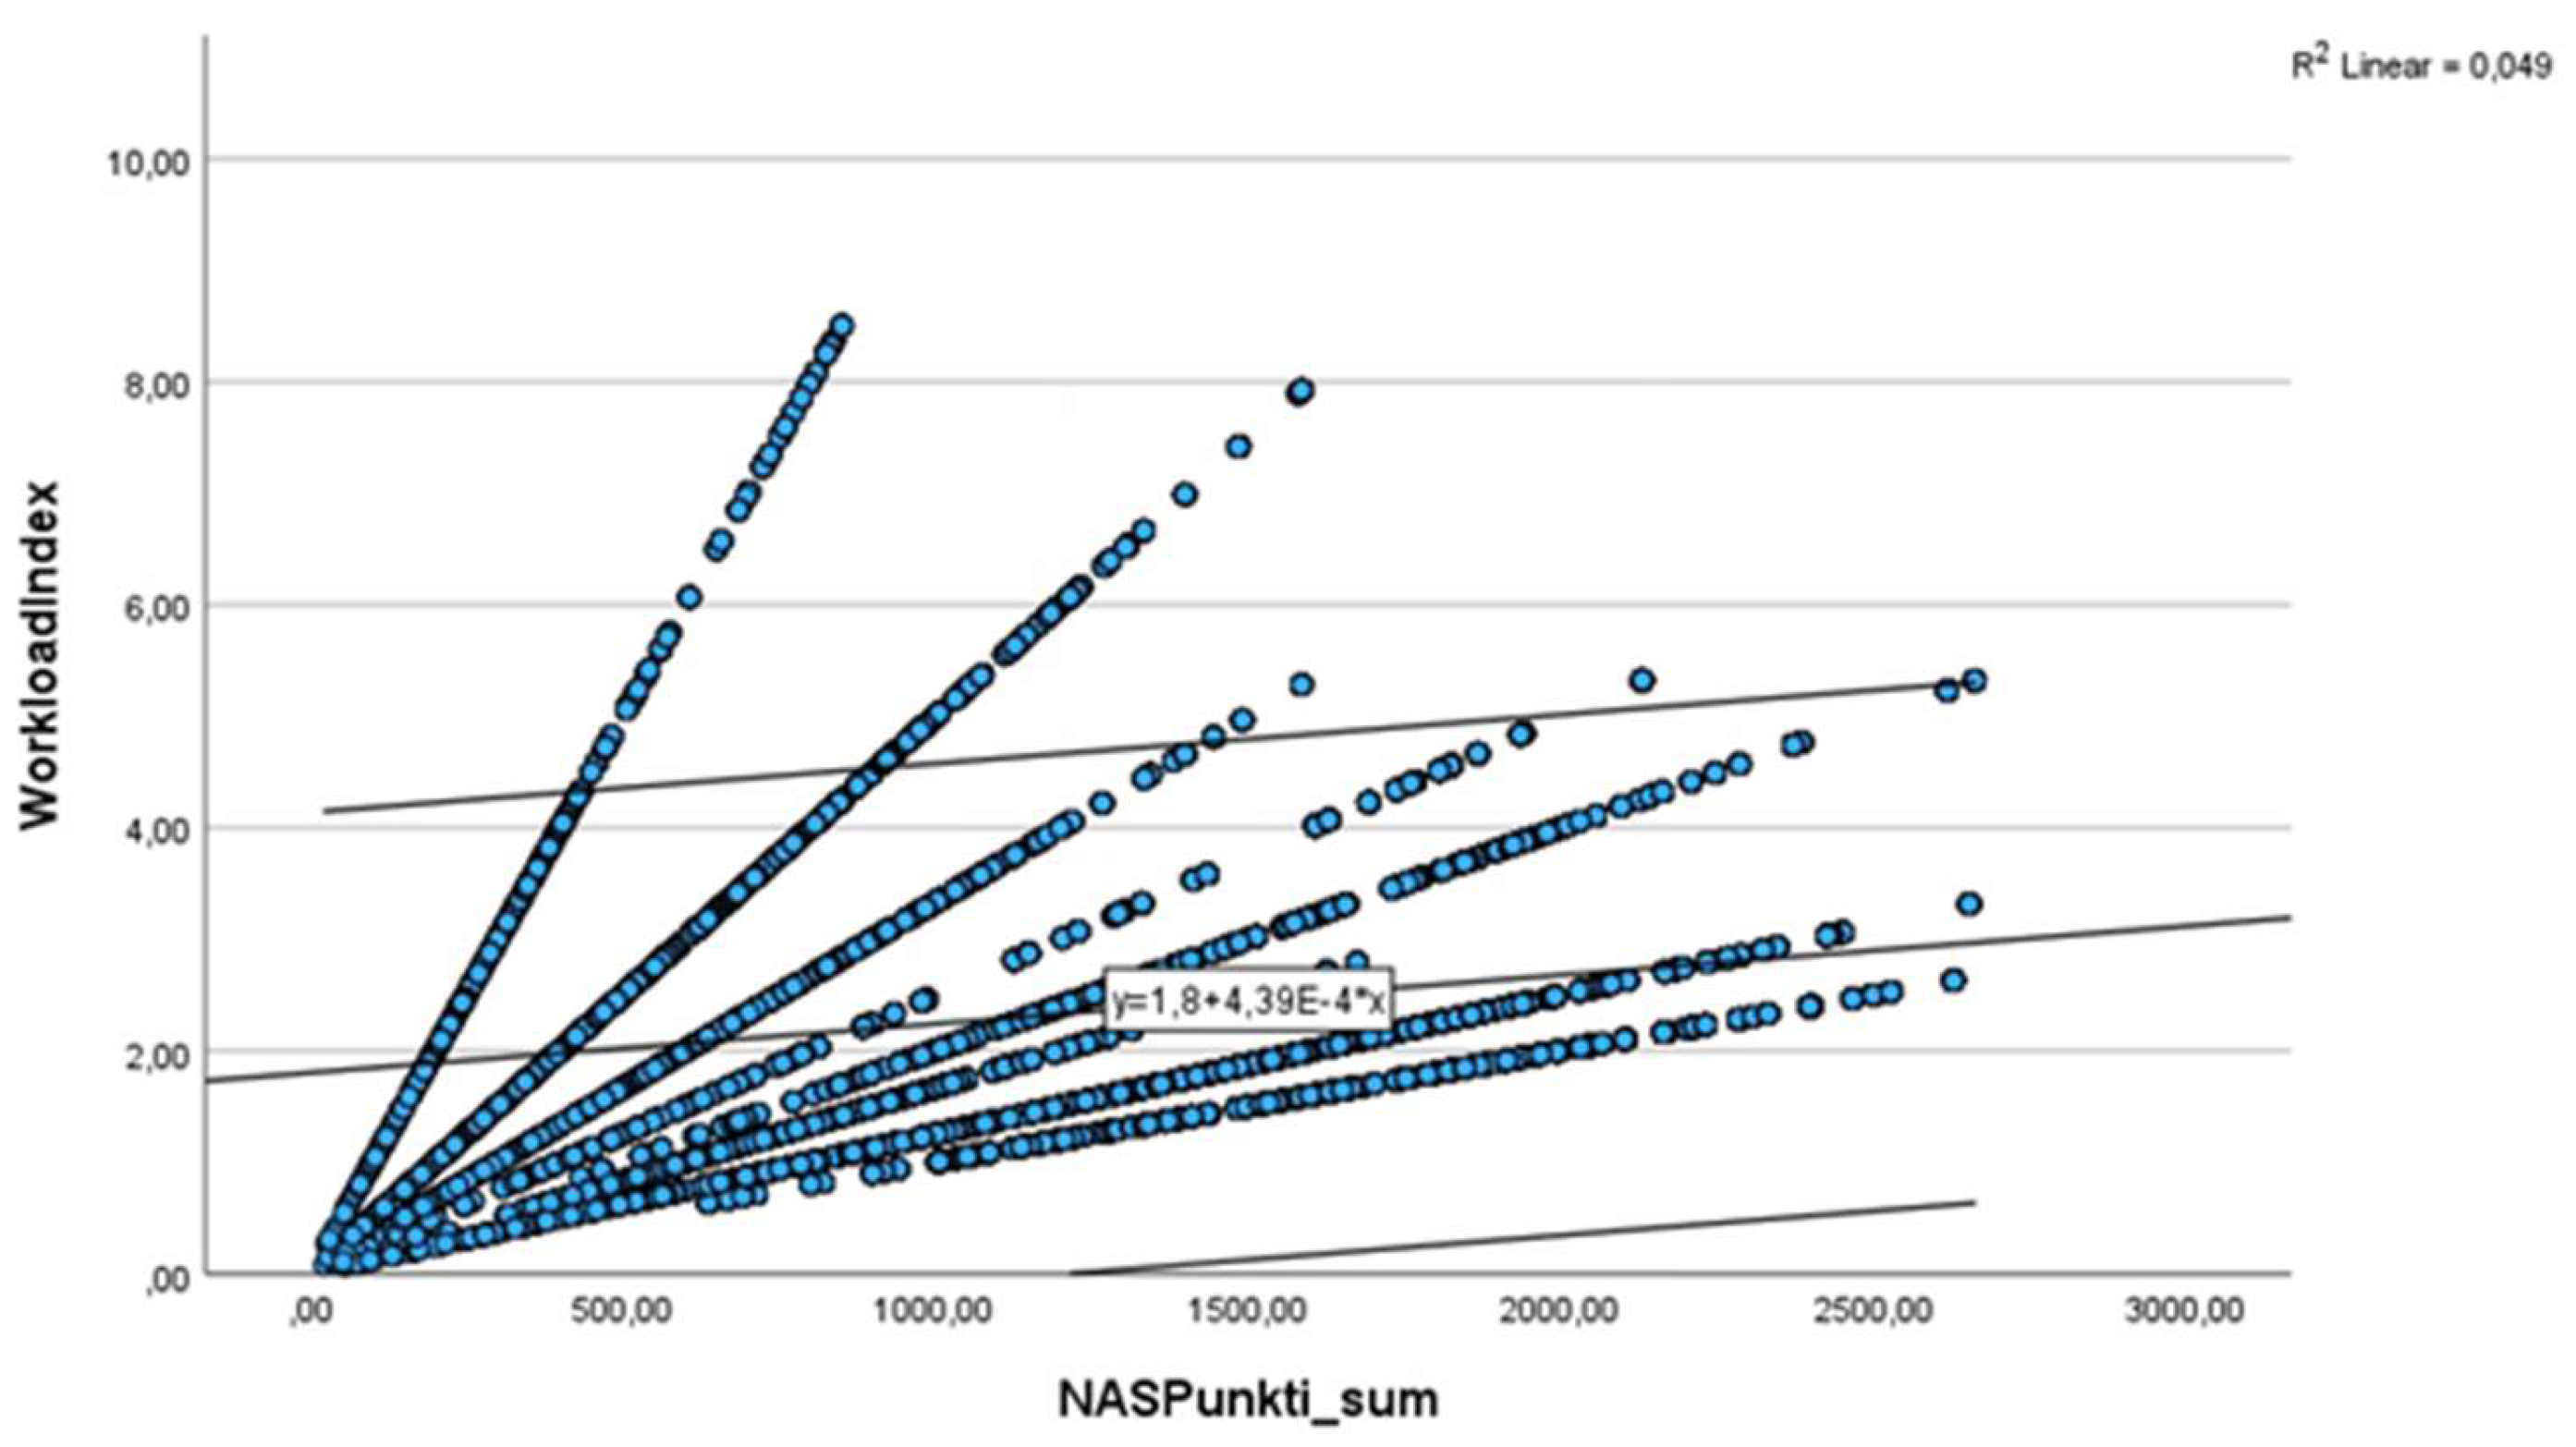
Figure 17.
Scatterplot for numbers of patients and Workload Index.
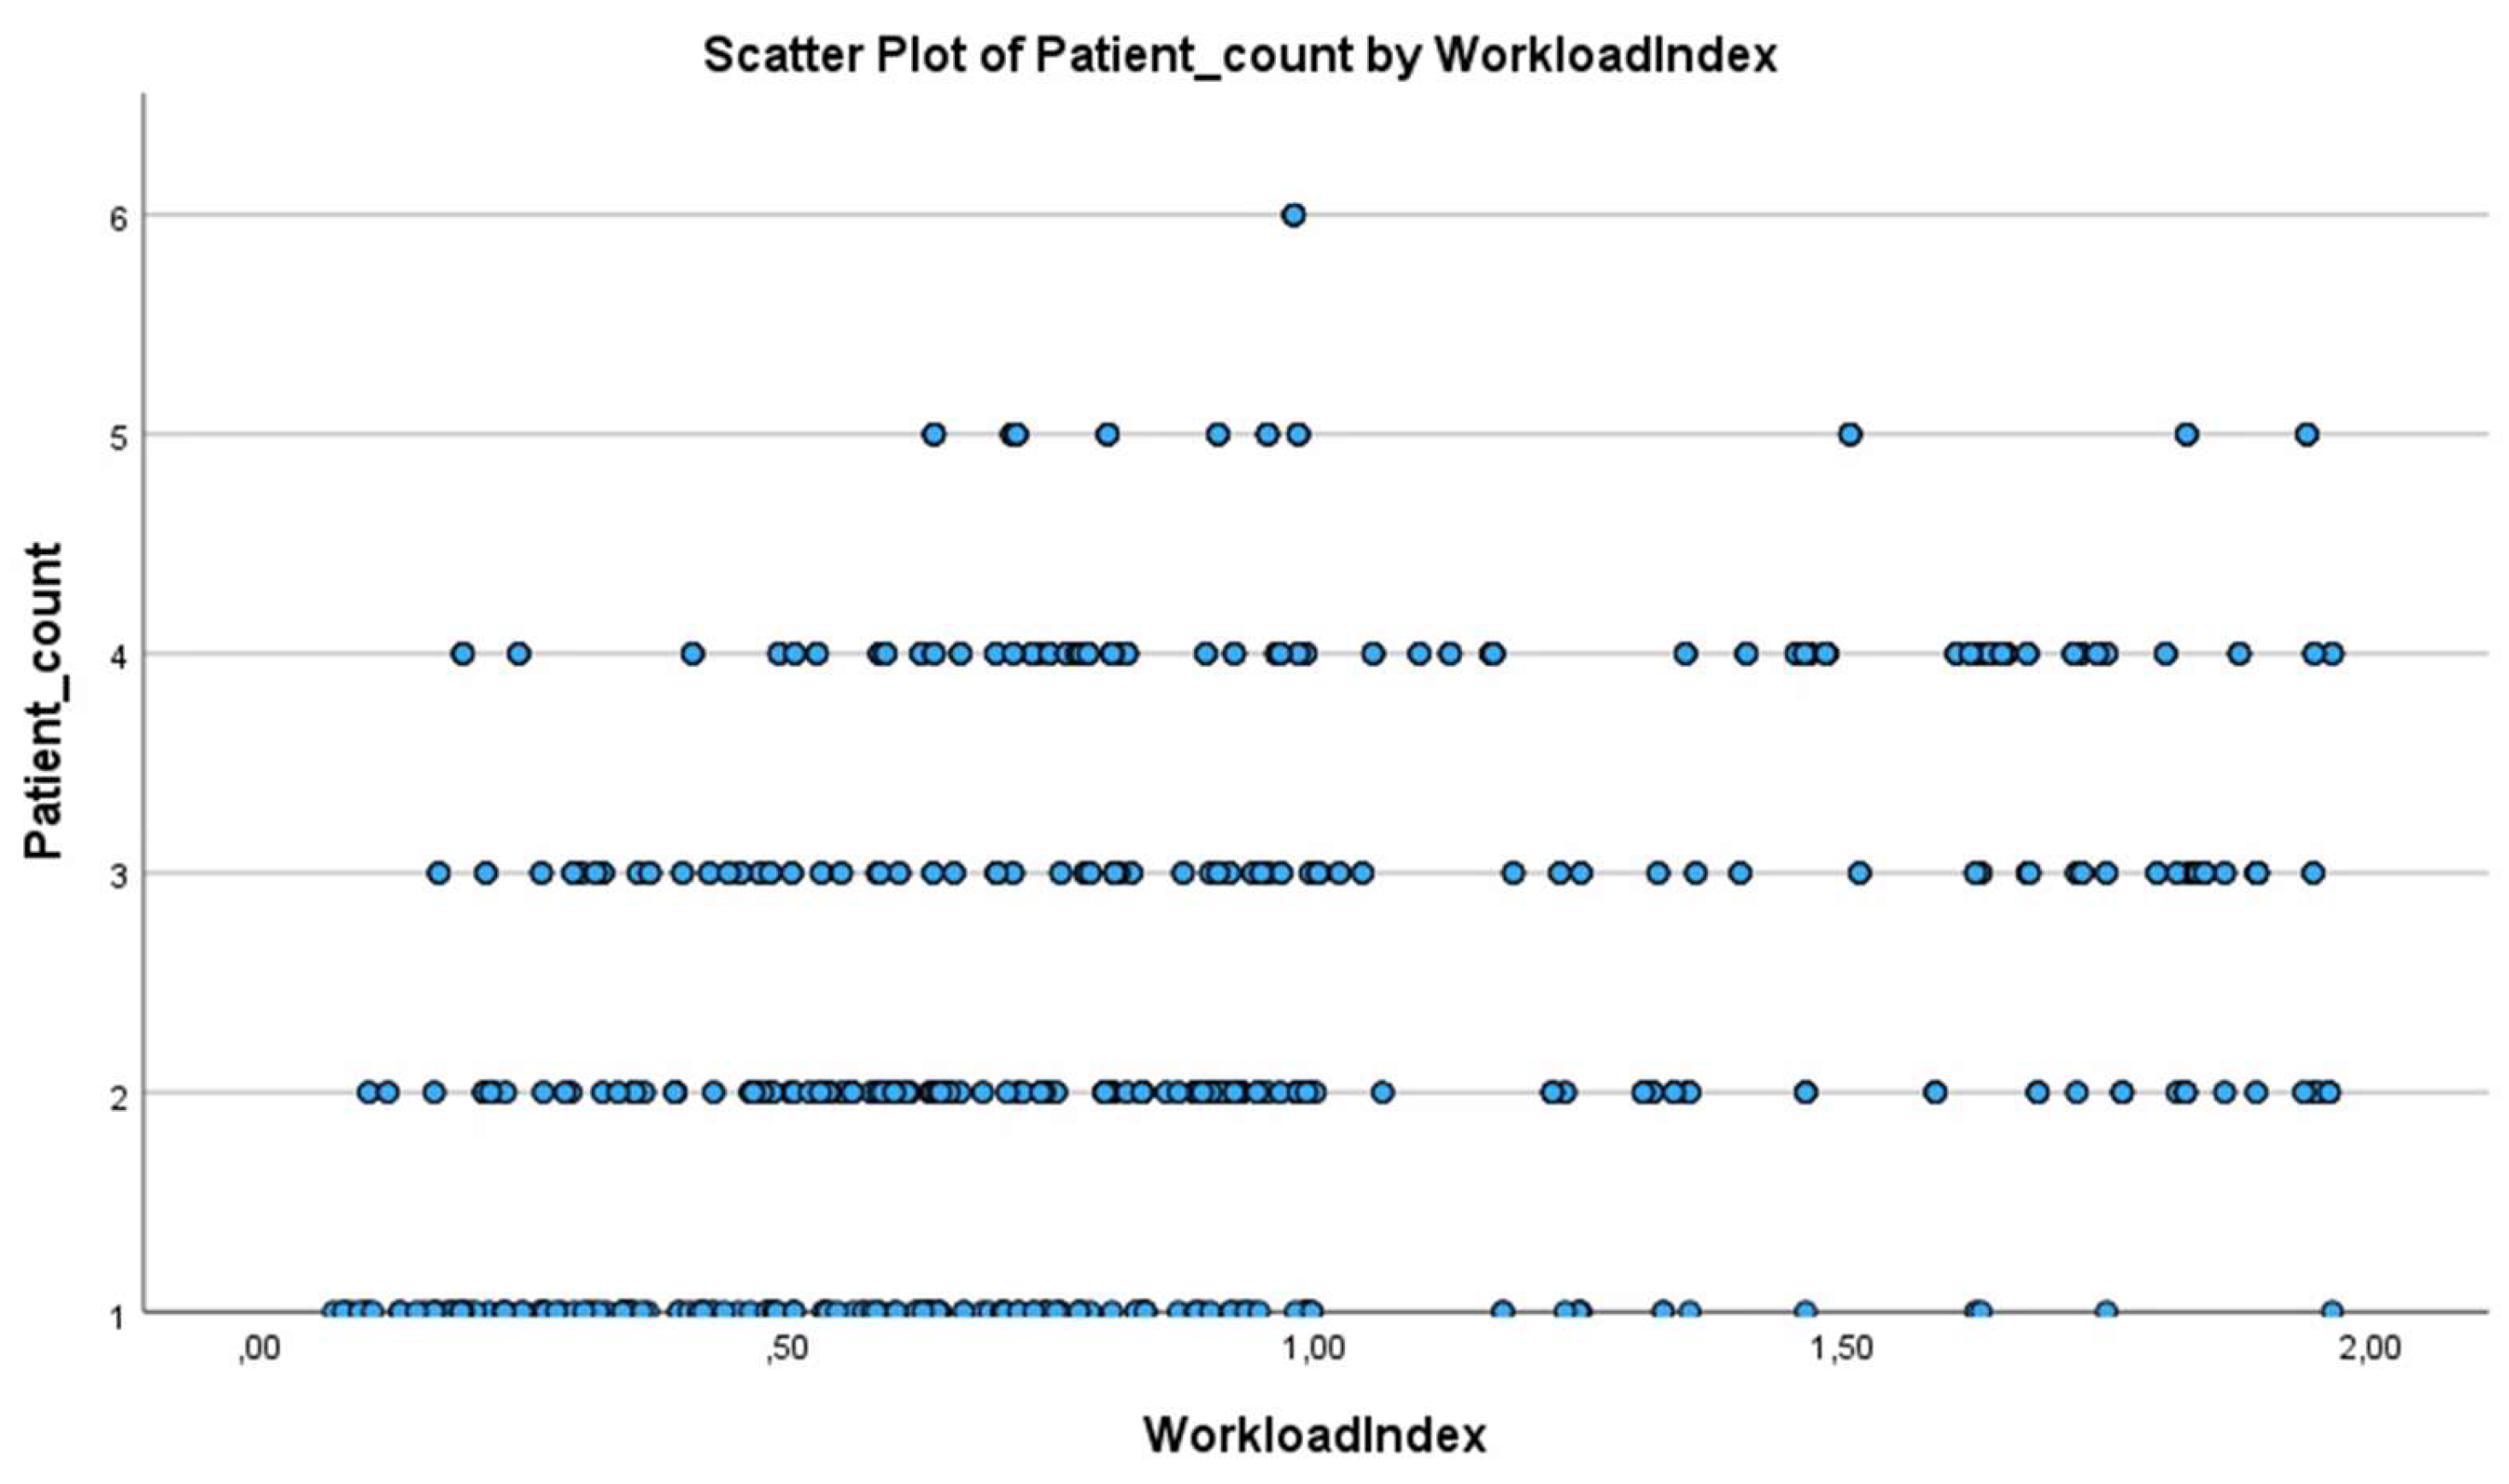

Table 1.
Descriptive statistics for 14 ICUs.
| Indicator | Unit | |||||||||||||
|---|---|---|---|---|---|---|---|---|---|---|---|---|---|---|
| 1 | 2 | 3 | 4 | 5 | 6 | 7 | 8 | 9 | 10 | 11 | 12 | 13 | 14 | |
| Number of protocols | 871 | 4604 | 5164 | 1031 | 1744 | 1597 | 994 | 2580 | 3054 | 2121 | 895 | 911 | 1127 | 1386 |
| Number of protocols (day) | 470 | 2518 | 2698 | 559 | 1000 | 849 | 489 | 1458 | 1824 | 1123 | 476 | 473 | 580 | 767 |
| Number of protocols (night) | 401 | 2086 | 2466 | 472 | 744 | 748 | 505 | 1122 | 1230 | 998 | 419 | 438 | 547 | 619 |
| Mean (day) | 85.66 | 57.15 | 57.78 | 75.46 | 76.32 | 60.01 | 37.66 | 59.05 | 80.45 | 75.15 | 87.94 | 56.78 | 46.12 | 75.70 |
| SD (day) | 22.76 | 18.11 | 19.19 | 31.23 | 29.53 | 25.96 | 13.31 | 22.25 | 22.15 | 27.31 | 31.13 | 28.17 | 16.41 | 29.30 |
| Mean (night) | 87.29 | 56.66 | 59.46 | 76.19 | 79.89 | 64.88 | 39.84 | 57.01 | 83.17 | 75.27 | 82.83 | 52.21 | 42.51 | 78.74 |
| SD (night) | 22.01 | 17.46 | 19.93 | 28.14 | 26.21 | 24.89 | 13.47 | 21.28 | 19.35 | 28.30 | 28.89 | 24.87 | 13.76 | 26.09 |
| 95% CI Lower | 84.92 | 56.41 | 58.05 | 73.97 | 76.58 | 64.23 | 37.93 | 57.31 | 80.79 | 74.03 | 83.57 | 52.85 | 43.47 | 75.03 |
| 95% CI Upper | 87.91 | 57.44 | 57.69 | 77.62 | 79.12 | 66.73 | 39.60 | 59.00 | 82.29 | 76.39 | 87.53 | 56.32 | 45.26 | 77.98 |
| Skewness | -.364 | .590 | .712 | .256 | -.501 | .694 | 1.443 | .869 | .071 | .887 | -.409 | 1.127 | 1.310 | .121 |
| Kurtosis | -.752 | .748 | .350 | -.713 | -.494 | -.201 | 2.947 | 1.402 | .224 | .216 | -.897 | .290 | 3.689 | .027 |
| Median (total) | 91.90 | 54.5 | 55.50 | 75.80 | 83.90 | 56.50 | 35.40 | 56.90 | 83.25 | 67.80 | 91.50 | 42.60 | 44.36 | 77.30 |
| Total Mean (total) | 86.41 | 56.93 | 58.58 | 75.79 | 77.85 | 65.48 | 38.77 | 58.16 | 81.55 | 75.21 | 85.55 | 54.58 | 43.37 | 76.51 |
| Total SD (total) | 22.42 | 17.82 | 19.57 | 29.85 | 27.07 | 25.46 | 13.42 | 21.84 | 21.11 | 27.78 | 30.19 | 26.72 | 15.28 | 27.98 |
| Total (day) | 15284 | |||||||||||||
| Total (night) | 12795 | |||||||||||||
| Total Mean (day) | 65.63 | |||||||||||||
| Total SD (day) | 26.14 | |||||||||||||
| Total Mean (night) | 65.25 | |||||||||||||
| Total SD (night) | 25.30 | |||||||||||||
| Min NAS points per 1 nurse | 24.80 | 11.50 | 11.50 | 11.60 | 10.20 | 11.30 | 11.50 | 11.50 | 15.50 | 22.60 | 16.50 | 19.80 | 12.60 | 11.50 |
| Max NAS points per 1 nurse | 161.90 | 136.00 | 136.50 | 160.30 | 153.90 | 148.70 | 104.90 | 154.20 | 148.60 | 158.40 | 141.50 | 130.90 | 121.30 | 176.80 |
| Hours per patient (Mean and SD) | 20.74 h (5.38) | 13.66 h (4.28) | 14.06 h (4.49) | 18.19 h (7.16) | 18.69 h (6.50) | 15.71 h (6.11) | 9.30 h (3.22) | 13.96 h (5.24) | 19.57 h (5.07) | 18.05 h (6.66) | 20.53 h (7.25) | 13.10 h (6.41) | 10.65 h (3.67) | 18.36 h (6.71) |
| Shortage rate (%) | 56.22 | 43.47 | 38.64 | 22.38 | 58.32 | 51.78 | 14.40 | 25.62 | 62.71 | 4.51 | 49.78 | 61.17 | 62.08 | 63.34 |
| Workload index | 3.12 | 1.89 | 1.75 | 1.79 | 2.87 | 2.98 | 1.66 | 1.50 | 3.03 | 1.52 | 2.99 | 3.89 | 3.07 | 3.69 |
Table 2.
Descriptive statistics at different levels of care (level 1–3).
| 1 | 2 | 3 | |
|---|---|---|---|
| Number of protocols | 4629 | 5927 | 17523 |
| Number of protocols (day) | 2391 | 3272 | 9621 |
| Number of protocols (night) | 2238 | 2655 | 7902 |
| Mean (day) | 53.56 | 78.83 | 63.13 |
| SD (day) | 24.89 | 29.59 | 23.16 |
| Mean (night) | 51.28 | 80.55 | 64.06 |
| SD (night) | 22.91 | 25.81 | 22.99 |
| 95% CI Lower | 51.77 | 78.89 | 63.76 |
| 95% CI Upper | 53.15 | 80.31 | 64.44 |
| Skewness | 1.218 | -.182 | .768 |
| Kurtosis | 1.063 | -.540 | .665 |
| Median (total) | 45.60 | 82.80 | 60.20 |
| Total Mean (total) | 52.46 | 79.60 | 64.10 |
| Total SD (total) | 23.98 | 27.97 | 23.09 |
| Min NAS points per 1 nurse | 11.30 | 10.50 | 10.50 |
| Max NAS points per 1 nurse | 148.70 | 176.80 | 158.40 |
| Hours per patient (Mean and SD) | 12.59 h (5.76) | 19.10 h (6.71) | 15.38 h (5.54) |
| Shortage of nurses (%) | 48.08 | 51.64 | 38.06 |
| Workload Index | 2.90 | 2.93 | 1.95 |
Table 3.
Descriptive statistics on weekdays, weekends and public holidays.
| Monday | Tuesday | Wednesday | Thursday | Friday | Saturday | Sunday | Public holiday | |
|---|---|---|---|---|---|---|---|---|
| Number of protocols | 3706 | 3984 | 4296 | 4334 | 4129 | 3611 | 3056 | 963 |
| Number of protocols (day) | 2067 | 2203 | 2332 | 2446 | 2286 | 1821 | 1609 | 520 |
| Number of protocols (night) | 1639 | 1781 | 1964 | 1888 | 1843 | 1790 | 1447 | 443 |
| Mean (day) | 64.14 | 65.71 | 63.68 | 65.15 | 65.25 | 66.54 | 68.71 | 71.04 |
| SD (day) | 25.90 | 25.89 | 26.58 | 25.06 | 26.94 | 25.64 | 26.80 | 25.76 |
| Mean (night) | 65.81 | 64.38 | 64.93 | 65.12 | 64.94 | 64.59 | 66.83 | 67.29 |
| SD (night) | 25.85 | 24.44 | 25.48 | 25.32 | 25.36 | 25.30 | 25.24 | 25.58 |
| 95% CI Lower | 64.05 | 64.33 | 63.47 | 64.39 | 64.31 | 64.74 | 66.90 | 67.69 |
| 95% CI Upper | 65.72 | 65.90 | 65.03 | 65.89 | 65.91 | 66.40 | 68.75 | 70.94 |
| Skewness | .582 | .484 | .594 | .648 | .624 | .626 | .546 | .560 |
| Kurtosis | -.209 | -.329 | -.114 | .128 | .-009 | .-083 | .-199 | .104 |
| Median (total) | 59.90 | 60.75 | 59.80 | 60.90 | 60.40 | 60.90 | 62.70 | 65.20 |
| Total Mean (total) | 64.88 | 65.12 | 64.25 | 65.14 | 65.11 | 65.57 | 67.82 | 69.32 |
| Total SD (total) | 25.89 | 25.26 | 26.09 | 25.17 | 26.25 | 25.49 | 26.08 | 26.73 |
| Min NAS points per 1 nurse | 12.80 | 10.20 | 11.50 | 13.80 | 11.50 | 11.50 | 11.50 | 11.50 |
| Max NAS points per 1 nurse | 158.40 | 151.60 | 176.80 | 176.80 | 161.70 | 153.90 | 160.30 | 176.80 |
| Nursing shortage (%) | 43.54 | 43.18 | 46.62 | 45.92 | 42.43 | 37.74 | 61.97 | 39.35 |
| Workload Index | 2.33 | 2.36 | 2.42 | 2.43 | 2.30 | 2.19 | 2.18 | 2.14 |
Table 4.
Nursing workload and staff compliance rates by ICU.
| Unit | Number of patients (mean) | Number of nurses (mean) | Real N/P | Intensity coefficient | Nurses required | Compliance (%) |
|---|---|---|---|---|---|---|
| 1. | 4.07 | 2 | 1/0.73 | 0.038 | 6.25 | 43.78 |
| 2. | 13.98 | 7.8 | 1/0.93 | 0.037 | 15.16 | 56.53 |
| 3. | 15.86 | 9.6 | 1/0.92 | 0.033 | 17.53 | 61.36 |
| 4. | 4.83 | 2.9 | 1/1.01 | 0.026 | 5.37 | 77.62 |
| 5. | 6.07 | 3 | 1/0.75 | 0.045 | 8.62 | 41.68 |
| 6. | 10.00 | 3.7 | 1/0.90 | 0.052 | 11.93 | 48.22 |
| 7. | 5.16 | 2 | 1/1.82 | 0.045 | 3.33 | 85.60 |
| 8. | 8.65 | 5.7 | 1/0.98 | 0.030 | 8.99 | 74.38 |
| 9. | 10.01 | 5.3 | 1/0.67 | 0.040 | 15.17 | 37.29 |
| 10. | 8.53 | 7.8 | 1/0.75 | 0.023 | 12.72 | 95.49 |
| 11. | 3.94 | 10.4 | 1/0.74 | 0.040 | 5.99 | 50.22 |
| 12. | 4.42 | 1 | 1/1.38 | 0.077 | 3.89 | 50.21 |
| 13. | 4.49 | 1 | 1/1.56 | 0.076 | 3.07 | 37.92 |
| 14. | 5.57 | 2 | 1/0.82 | 0.058 | 7.38 | 36.66 |
| Level 1 | 6.52 | 2.25 | 1/1.35 | 0.061 | 6.34 | 51.89 |
| Level 2 | 5.12 | 2.47 | 1/0.80 | 0.043 | 7.02 | 48.36 |
| Level 3 | 12.40 | 7.77 | 1/0.87 | 0.034 | 14.59 | 61.94 |
Disclaimer/Publisher’s Note: The statements, opinions and data contained in all publications are solely those of the individual author(s) and contributor(s) and not of MDPI and/or the editor(s). MDPI and/or the editor(s) disclaim responsibility for any injury to people or property resulting from any ideas, methods, instructions or products referred to in the content. |
© 2025 by the authors. Licensee MDPI, Basel, Switzerland. This article is an open access article distributed under the terms and conditions of the Creative Commons Attribution (CC BY) license (http://creativecommons.org/licenses/by/4.0/).
Copyright: This open access article is published under a Creative Commons CC BY 4.0 license, which permit the free download, distribution, and reuse, provided that the author and preprint are cited in any reuse.


