Submitted:
15 December 2025
Posted:
17 December 2025
You are already at the latest version
Abstract
Tuberous Sclerosis Complex (TSC) is a genetic disorder caused by mutations that inactivate TSC1 or TSC2 genes. TSC1 or TSC2 mutations activate the mammalian target of rapamycin complex 1 (mTORC1) protein kinase pathway. Although many patients inherit a single copy of a mutant TSC gene, somatic mutations that cause loss of heterozygosity in inhibitory neural progenitor cells are hypothesized to be one cause of abnormal development. This may lead to cortical malformations or benign growths along the ventricular-subventricular zone (V-SVZ), cortex, olfactory tract, and olfactory bulbs (OB). This idea is supported by focal single-cell knockout experiments that induce CRE-mediated recombination following neonatal electroporation of conditional Tsc2 or Tsc1 mice. Loss of Tsc2 causes mTORC1 pathway activation and the formation of striatal hamartomas composed of ectopic clusters of abnormal cells and cytomegalic neurons including within the OB. Neural phenotypes in this model can be partially rescued with Rapalink-1, a bisteric mTOR inhibitor, demonstrating the importance of mTOR in pathogenesis. We previously demonstrated that global V-SVZ neural stem cell (NSC) Tsc2 mutation induced by nestin-CRE-ERT2 causes transcriptional and translational errors that are accompanied by mTORC1 pathway activation. While we previously described the OB granule cells from these mice, we did not thoroughly describe changes outside this region. Here we provide evidence that removal of Tsc2 from neonatal V-SVZ NSCs causes subtle and rare brain malformations. This is exemplified by ectopic clusters of cytomegalic neurons or glia and mTORC1 activation. Heterotopic clusters retain elevated levels of NSC proteins including Sox2, supporting a model wherein loss of Tsc2 leads to excessive mTORC1, persistent expression of stem proteins, and the inability of a subset of cells to differentiate at the appropriate time. These data support the use of this model to study TSC, but the rarity and stochastic nature of lesions make the use challenging for identifying mechanisms and testing therapies.
Keywords:
Tsc2
; Tsc1
; tuberin
; tuberous sclerosis complex
; TSC
; mTOR
Introduction
Tuberous Sclerosis Complex (TSC) is a disease that affects several tissue types, including the nervous system, and cell types including neurons[1,2,3]. The underlying cause of TSC is inactivating mutations in the TSC1 or TSC2 genes found on chromosomes 9q34 and 16p13.3, respectively[4,5]. These mutations most often cause the loss of expression of the proteins encoded by TSC1/TSC2 through nonsense and missense mutations, deletions, and large rearrangements[9]. Loss of function of TSC1/TSC2 causes unrestrained mTORC1 activity[2]. TSC is considered an autosomal dominant disorder[7]. Patients who are afflicted with TSC are frequently born with congenital malformations or develop growths called hamartomas[1,8]. Brain malformations are associated with a wide range of neurological manifestations[9].
TSC is proposed to follow Alfred Knudson’s two-hit hypothesis wherein pathogenic mutations in one copy of the TSC genes may occur early in development or even be inherited from parents[10,11,12]. However, “second-hit” mutations occur in the other normal (wild-type) copy of this gene. Knudson used the Eker rat, which has a germ-line transmissible Tsc2 variant caused by a transposon-like insertion of an inactive 6,253 base pair intracisternal A-particle element containing multiple termination codons to demonstrate TSC growths adhere to the two-hit hypothesis[13,14]. This insertion is 3’ to the catalytic domain of the encoded protein Tuberin. Eker rats homozygous for this mutation fail to develop. However, 30-60% of heterozygous Eker rats develop CNS malformations that are reminiscent of those seen in patients[15]. The prevalence and severity of brain hamartomas increases when Eker rats are exposed to radiation or mutagens[16]. LOH and mTORC1 activation occur in these hamartomas[17]. These results support the two-hit hypothesis as a mechanism that is sufficient to cause TSC malformations[18,19]. Forty-three heterozygous Eker rats subject to necropsy demonstrated that 100% have renal tumors, 48% have subependymal hamartomas, 21% have subcortical hamartomas, 33% have meningiomas, and 58% have pituitary adenomas[15]. These results demonstrate that the Tsc2 gene is critically required in numerous cell types of different brain regions consistent with the vast heterogeneity of lesions found in patients and support an evolutionarily conserved role of TSC genes. Hamartomas often arose within the striatum near the caudate nucleus reminiscent of subependymal nodules or subependymal giant cell astrocytomas (SEGAs). More recently, the Eker rat has been revisited with demonstration of loss of neurons in the caudate, microglia activation, vasculature remodeling, gliosis, and increased neural stem cell marker expression[20].
Given the location and timing of SEN/SEGA appearance, it has been hypothesized that LOH mutations in neural stem cells (NSCs) along the ventricular-subventricular zone might be the cause. Indeed, several animal models have explored this possibility with significant overlap in agreement with the appearance of SEGAs in the Eker model[21,22,23,24,25]. In one of these models, loss of Tsc1 resulted in nodules along the lateral ventricles and large growths at the base of the lateral ventricles. This could be achieved by removing Tsc1 from Nestin expressing NSCs or transit amplifying cells, an intermediate progenitor of the V-SVZ. These growths were accompanied by fewer olfactory bulb (OB) granule cells. Similar abnormalities including heterotopic clusters of cytomegalic neurons were produced by CRE electroporation and/or using Tsc1 x Nestin-CRE-ERT2 mice. In another study, Tsc1 and PTEN were removed at P10 or P15-17 using Nestin-CRE-ERT2[21]. Mice developed SEN-like and SEGA-like growths in ~1 month and shared overlapping histopathological features with patient SENs and SEGAs.
Loss of TSC2 is, however, the most common genetic cause of SEGAs. Neonatal electroporation of conditional Tsc2 mice with CRE recombinase caused the formation of both intraventricular anomalies and hamartomas within the boundaries of the V-SVZ and striatum[22]. Fluorescent activated nuclei sorting (FANS) and single nuclei RNA sequencing demonstrated changes in NSC transitional states accompanied by the differential expression of stem and progenitor transcripts[22,26]. In vivo, neonatal lateral V-SVZ NSCs have high mTORC1 activity but generate striatal glia with low mTORC1 activity. Loss of Tsc2 prevented glia from downregulating mTORC1 activity. As expected, aberrant translation of NSC proteins occurred. The striatal hamartomas can be partially rescued with Rapalink-1, a bisteric mTOR inhibitor, demonstrating the importance of mTOR in pathogenesis[27].
We also crossed nestin-CRE-ERT2 mice to conditional Tsc2 mice and cultured mutant NSCs[22]. Cultured NSCs had altered transcriptomes with differences in many ribosomal RNAs and translational regulatory RNAs. Predictably, NSC mRNA translational programs are also altered in vitro. We further reported that OB granule cells from these mice have elevated mTORC1 activity and that the average soma size is enlarged[28]. These changes were corroborated with the neonatal electroporation model. However, the V-SVZ from these same nestin-CRE-ERT2 mice were not reported. Here, we provide corroborating evidence that loss of Tsc2 from V-SVZ NSCs using nestin-CRE-ERT2 mice causes brain pathology consistent with TSC patients, notably increased mTORC1 activity and ectopic clusters of cytomegalic cells.
Results
Targeted Recombination in Gliogenic and Neurogenic Stem Cells
The Nestin promoter drives selective expression of the intermediate filament structural protein, Nestin, in NSCs. Knockin mice have been engineered to contain the rat Nestin promoter downstream of sequences encoding a Cre recombinase fused to a modified estrogen receptor (ERT2) which can be used to manipulate NSCs and their progeny [29]. Application of (4-OH) tamoxifen causes the modified ERT2 to dimerize in the cytoplasm and transiently translocate CRE into the nuclear compartment where it subsequently excises DNA flanked by loxP sites. These Nestin-CRE-ERT2 mice were mated to mice having wild-type or conditional Tsc2 alleles (Tsc2tm1.1Mjg/J) containing loxP sites flanking exons 2,3, and 4 (henceforth referred to as Tsc2f/f). These mice were also crossed to Ai9 mice (B6.Cg-Gt(ROSA)26Sortm9(CAG-tdTomato)Hze/J) that have a loxP-flanked STOP cassette that prevents transcription of a CAG-promoter driven variant of red fluorescent protein (tdTomato, RFP). CRE-ERT2 will therefore remove the stop sequence and induces RFP expression and Tsc2 recombination where NSCs are located including along the lateral ventricle (Figure 1A, B)[29].
We previously demonstrated that neonatal application of tamoxifen induced robust Tsc2 recombination in the V-SVZ where NSCs exist[22,27,28]. V-SVZ NSCs cultured from these mice had detectable Tsc2 genomic recombination and loss of the encoded protein Tuberin. V-SVZ NSCs generate olfactory bulb granule cells in vivo. Indeed, rapid and sustained Tsc2 recombination could be detected in olfactory bulb granule cells. We demonstrated recombination of the Tsc2 gene as early as P10 but did not examine the developmental consequences. We confirmed recombination as indicated by robust RFP expression in DCX positive neuroblasts entering the olfactory bulb (Figure 1C, D). However, we did not detect recombination in NeuN positive neurons at this age (Figure 1C, D). RFP and NeuN double positive cells were absent from the striatum and cortex as well (Figure 1E, F). However, we did find robust labeling of cells having a glial/astrocyte morphology in the striatum and cortex. RMS neuroblasts and striatal and cortical astrocytes are produced from V-SVZ NSCs. We confirmed robust RFP expression in V-SVZ NSCs both based on the location and morphology of cells and their high Nestin expression, Sox2 expression, and proliferation indicated by incorporation of the thymidine analog EdU injected immediately prior to sacrifice (Figure 1G, H). RFP and DCX double positive neuroblasts formed migratory chains strewn among RFP positive NSCs labeled with Vimentin or Nestin (Figure I, J). These results confirm selective targeting of gliogenic and neurogenic stem cells.
Loss of Tsc2 in NSCs Increases mTORC1 Activity
We confirmed that at this early age (P10), V-SVZ cells including NSCs expressing Nestin had low but detectable mTORC1 activity as indicated by p4EBP staining (Figure 2A-C). While loss of Tsc2 had minor changes in mTORC1 activation at P10 (Figure 2D-F). Similar to CRE electroporation, Tsc2 mutant V-SVZ had elevated p4EBP levels by P30 (Figure 2G-N). This result was most notable within the ventral V-SVZ (Figure 2I-J and Figure 2M-N). RFP positive cells with an astrocyte morphology had little p4EBP. Incidentally, blood vessels and occasional cells outside of the V-SVZ were strongly p4EBP positive. The outer SVZ Nestin positive cells having high p4EBP may be analogous to outer SVZ gliogenic NSCs seen in the developing cortex of humans[30,31]. Remarkably, in some sections, Tsc2 mutant cells failed to down-regulate mTORC1 as they invaded the striatum and retained high p4EBP (Figure 2O-P). We quantified p4EBP levels and found a ~32% increase (p=0.0190) in Tsc2 mutant cells (Tsc2wt/wt = 3.085 ± 0.2469, n=5 vs Tsc2mut/mut = 4.084 ± 0.2354, n=5) (Figure 2Q). We also noted a variable but large (~61%) statistically significant (p=0.0423) expansion of the V-SVZ (Tsc2wt/wt = 21152 ± 2576, n=5 vs Tsc2mut/mut = 33998 ± 4657, n=5) (Figure 2R). These results support a model where in mTORC1 is active in the V-SVZ in active stem/progenitor cells and that mTORC1 typically decreases during striatal gliogenesis. However, loss of Tsc2 increases mTORC1 (Figure 2S) in the V-SVZ and in clusters of cells in the striatum.
Cellular Phenotypes Associated with Tsc2 Mutation
One of the fundamental questions that we entertained was whether abnormal cells might be produced in this model similar to electroporation models and Nestin-CRE-ERT2 x Tsc1 models. We first sought to confirm the cell types and regions labeled. P30 neurogenic regions including the lateral ventricles and hippocampus were thoroughly labeled by RFP as seen in sagittal sections (Figure 3A, B). The dentate gyrus of the hippocampus contains nestin expressing cells that produce neurons that are NeuN positive. We confirmed the neurogenic potential of these cells and identified NeuN positive granule cells having excitatory neuron morphologies which had axons that project along mossy fiber tracts to CA3 (Figure 3C, D). Cells along the ventricle included Nestin and GFAP positive NSCs (Figure 3D-J). Additionally, Sox2 positive progenitors were labeled. We found that Sox2 was detectable at low levels in astrocytes however, occasional cells having an ambiguous giant cell morphology with large ovoid Sox2 positive nuclei were present in the striatum (Figure 3K-L). While DCX positive neuroblasts were found lining the lateral portions of the lateral ventricles and at the base where the V-SVZ was expanded (Figure 3M-L) as well as the olfactory bulb (see Figure 1). Occasional DCX positive neuroblasts invaded the striatum. Although we cannot confirm whether these cells are destined to become neurons, large cells having a neuron-like morphology and which had no glial markers (such as glutamine synthetase) but expressed the neuron marker, NeuN were present (Figure 3Q-T). The occasional large neurons having an ovoid soma and nucleus staining positive for the neuronal marker NeuN were found at either the dorsal or more frequently, the ventral portions of the V-SVZ.
Loss of Tsc2 Models TSC Brain Pathological Features
By P30, several brains exhibited pathological hallmarks of Tuberous Sclerosis Complex. For example, we previously reported multinucleated giant cells in the cortex from Tsc2mut/mut mice [22]. These cortical malformations had fewer neurons around giant/balloon cells (Figure 4A-D). The giant cells were pS6 positive (Figure 4E-F). In some cases, especially in sagittal sections, the caudate nucleus of the striatum appeared to protrude into the ventricle (Figure 4G-H). In most coronal brain sections, this was not apparent (Figure 4I-L) and appeared as mostly astrocytes within the striatum. However, striatal abnormalities were visible in approximately one third of mice. Striatal abnormalities included disorganization with neurons strewn around the lateral and ventral striatum or clustered non-neuronal cells having an indistinct morphology (Figure 4M-P).
Neonatal Tsc2 Deletion Alters Cortical Development
NSC mTORC1 activity is tightly regulated during cortical development and along the V-SVZ(25). NSC mTORC1 activity is high in active NSCs and progenitors called transit amplifying cells (TACs)[32,33,34]. mTORC1 activity is transiently reduced in early neuroblasts and very low in astrocytes. mTORC1 activity is required for NSCs and progenitors to transition to an active state. Expression of constitutively active Rheb in these populations increases intermediate progenitors (TACs) along the dorsolateral portion of the V-SVZ[32]. Yet removing Tsc genes does not cause unrestricted proliferation. For example, loss of Tsc2 in lateral V-SVZ NSCs alters transcription and increases select translation factors[22]. Mutant Tsc2 V-SVZ NSCs alter translation of critical neurodevelopmental mRNAs. In many cases, as V-SVZ Tsc2 null NSCs generate striatal astrocytes, the astrocytes aberrantly translate NSC transcripts leading to hamartoma-like lesions[22].
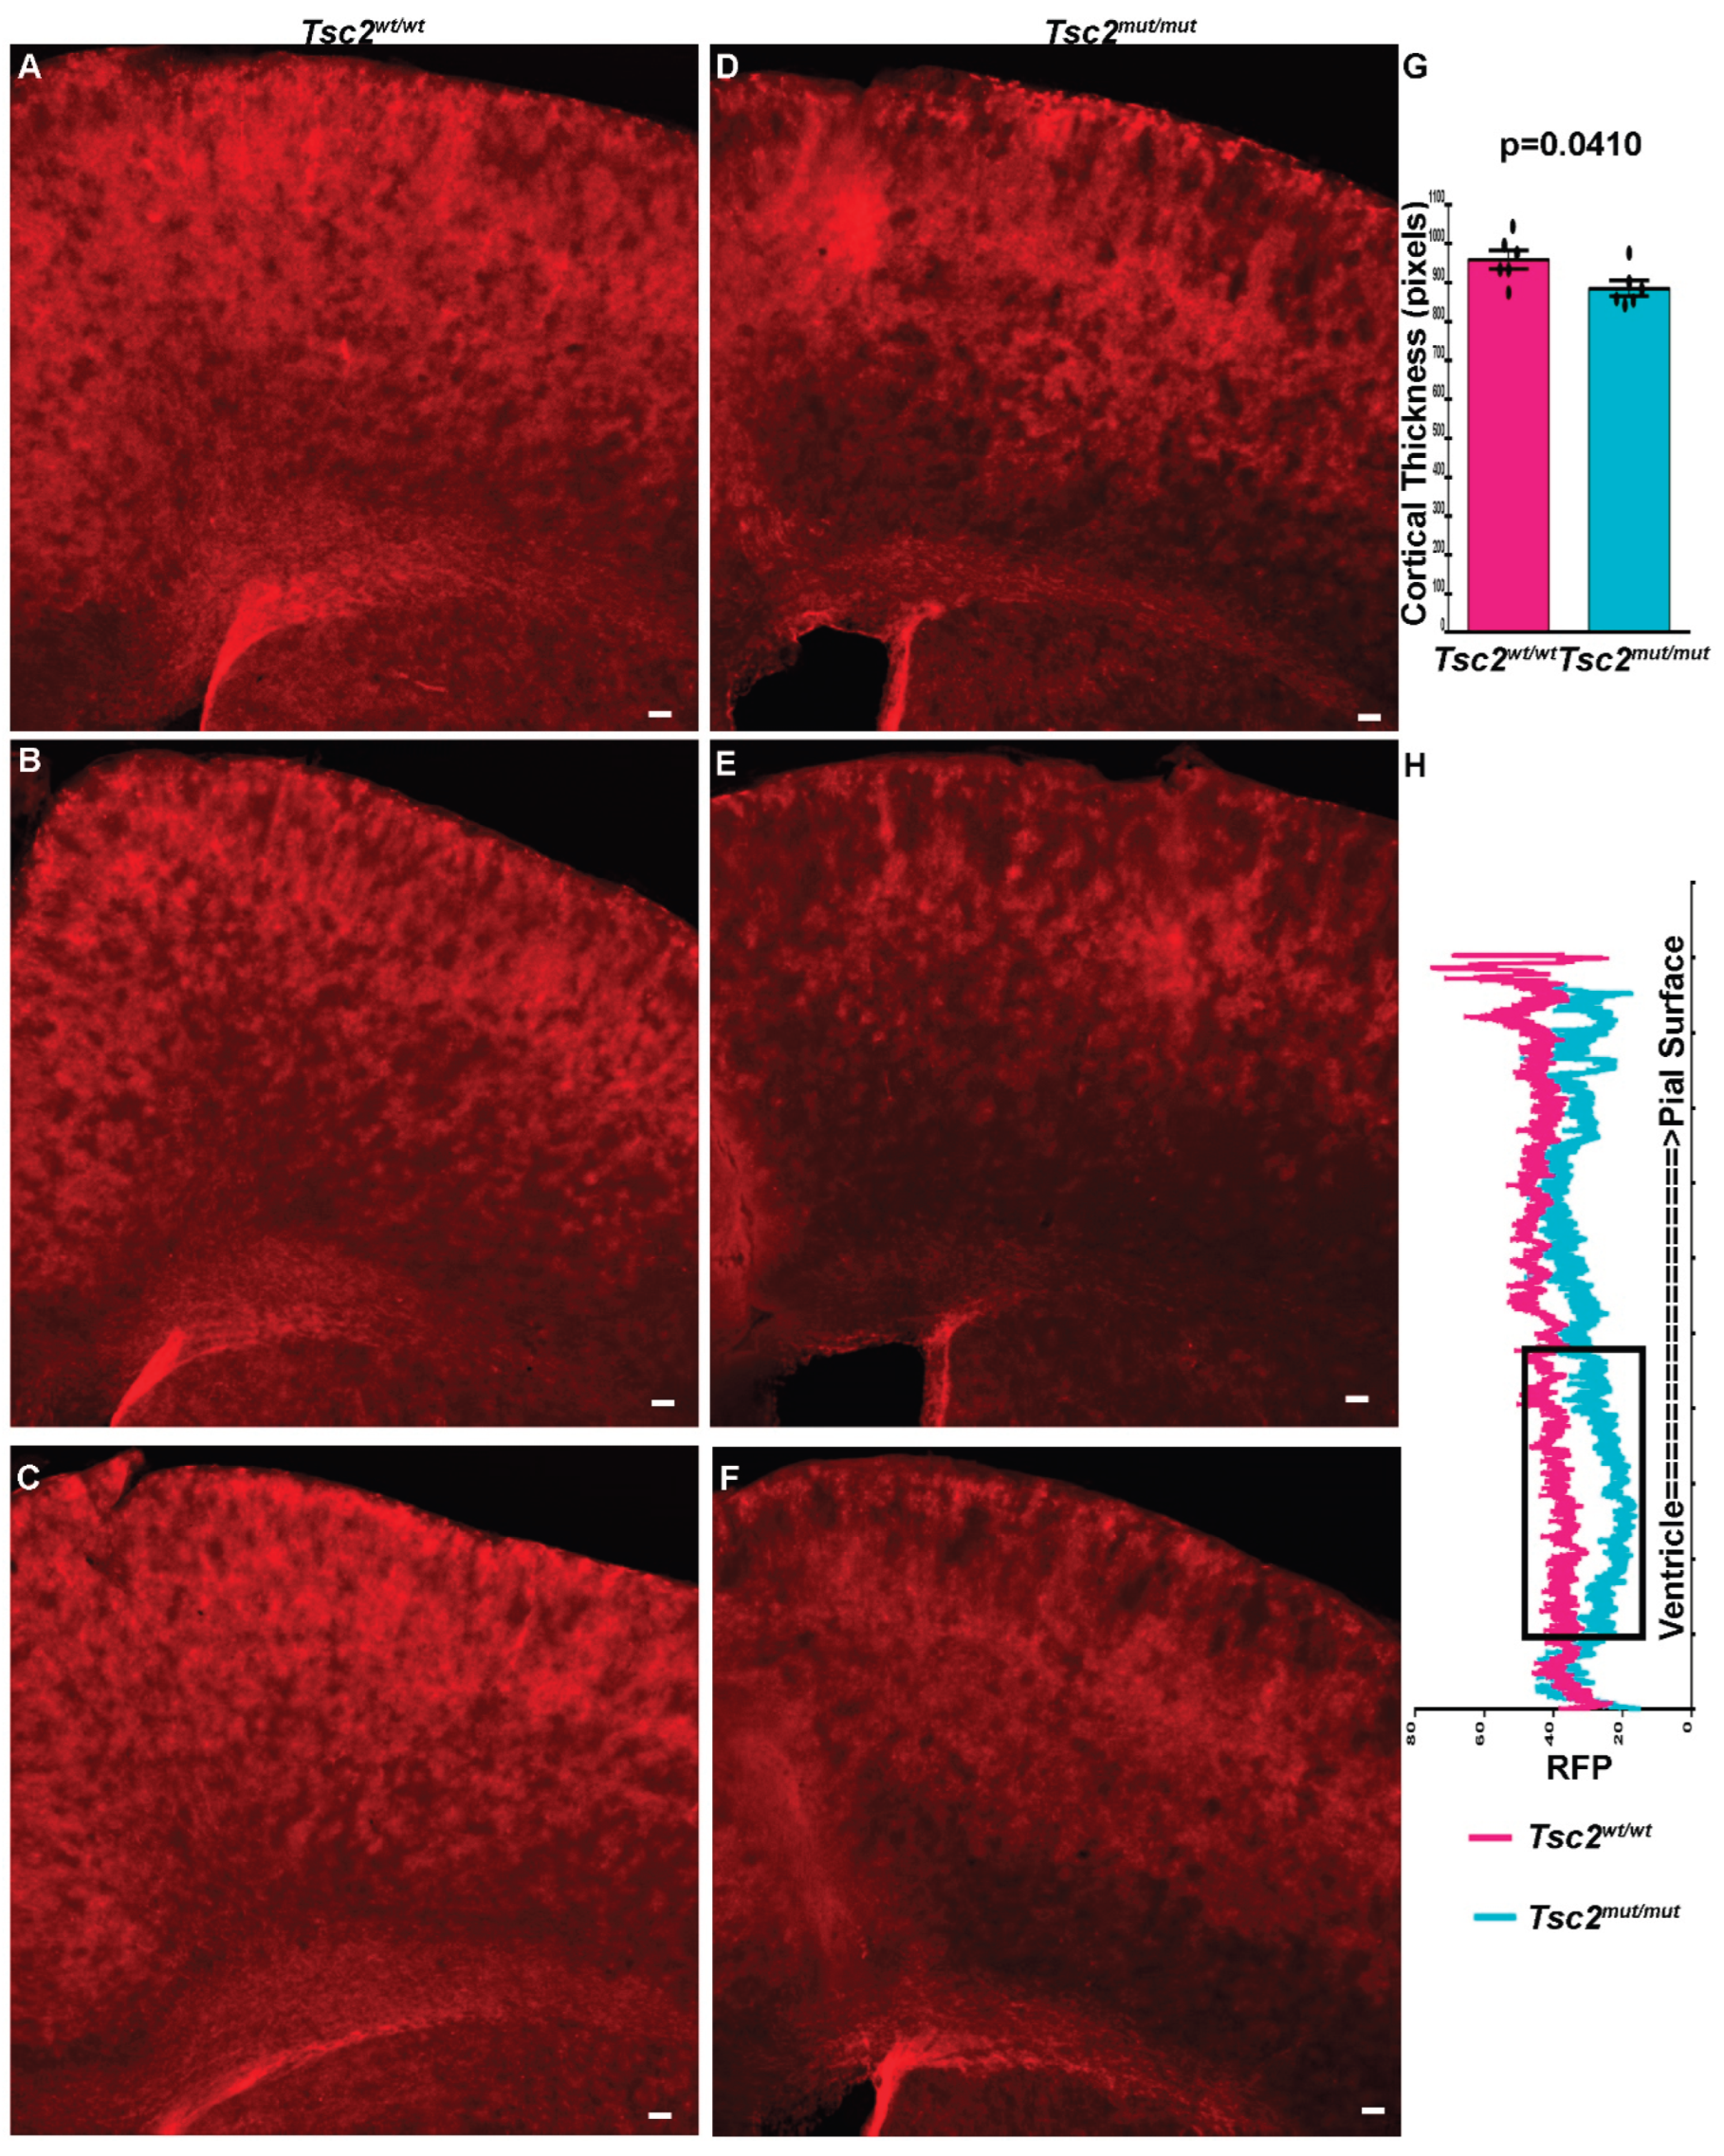
Loss of Tsc genes from embryonic dorsal radial glia alters cortical development[35,36,37]. Radial glia affecting cortical layer II/III pyramidal neurons are especially sensitive to loss of TSC genes leading to lamination defects. Indeed, a recent report demonstrated that loss of Tsc1/Tsc2 increases the number of Tbr2 positive intermediate progenitors thereby expanding upper layer neurogenesis, layer II/III cortical neurons, and results in macrocephally[38]. However, excessive mTORC1 activity can also reduce NSC proliferation and cause microcephally[39]. Cortical astrocytes are also produced from dorsal radial glia. We wondered whether loss of Tsc2 from nestin expressing cells during the neonatal period would affect cortical gliogenesis. RFP positive cells were nearly evenly distributed in Tsc2wt/wt brains except for the V-SVZ and corpus callosum due to NSCs and oligodendrocytes respectively (Figure 5A-C). Although the gross anatomy of Tsc2mut/mut brains appeared similar, the distribution of glia appeared altered (Figure 5D-F). The region measuring from the ventricle to the pia surface was also statistically (p=0.0410) smaller than Tsc2wt/wt brains (Tsc2wt/wt = 959.7 ± 24.20, n=6 vs. Tsc2mut/mut = 885.9 ± 20.12, n=6) (Figure 5G). This minor (8%) size and marginally significant measurement at first appearance seems to be unlikely relevant. However, it was accompanied by an RFP barren lower cortical layer that had remarkably fewer glia (Figure 5D-F, H). These results support that loss of Tsc2 from nestin positive NSCs causes abnormal brain development.
Discussion
Here we report neuropathological phenotypes associated with Nestin-CRE-ERT2 x RFP x Tsc2 mice. We confirmed selective labeling of the progeny and stem cells of the V-SVZ and hippocampus. We confirmed labeling of neuroblasts migrating to the olfactory bulb or astrocytes in the striatum and cortex that are produced from these stem cells [22]. p4EBP was detected in V-SVZ cells including NSCs but p4EBP was absent in astrocytes. However, we cannot rule out that p4EBP is below the threshold of detection in this study. We found that removal of Tsc2 increased p4EBP as we previously demonstrated in focal knockout using neonatal electroporation of CRE in the same conditional Tsc2 mice. P4EBP was extremely high in outer V-SVZ NSCs, although such cells were sparse (~2/slice/V-SVZ). However, following loss of Tsc2, on occasion, cells outside of the V-SVZ continued to have elevated p4EBP and retained stem cell proteins including Nestin or Sox2. In most slices, we found 2-4 cytomegalic cells having a neuron-like morphology within the dorsal-lateral striatum and stained positive for either NeuN or Sox2. Neurons were also prevalent along the ventral V-SVZ near the anterior commissure which is consistent with Tsc1 or focal neonatal electroporation Tsc1 or Tsc2 models. However, the extent to which this represents a completely “mutant” phenomenon is unclear as occasional neurons were also identified in control conditions. However, we previously placed this increase at ~3× and ~7× the number of neurons compared to ventral and lateral control conditions[22].
Subependymal nodules are common TSC brain malformations[1,40]. They are small (<1 cm) protrusions near the interface of the subependymal/subventricular zone, lateral ventricles, and striatum and frequently appear early in life[4,8]. They appear “button-like” or as “candle-gutterings”[41,42]. In addition to their anatomical appearance as “growths”, they can be discolored in comparison to the surrounding tissue. TSC SENs are often found before the age of five[8]. However, the actual prevalence at young ages is likely higher and may go unnoticed since the mean age of TSC diagnosis was 7.5 years of age in 2011. Screening for SENs is uncommon and specific neurological manifestations are not yet attributed to SENs[43]. However, SENs (having more than 2) is also a major diagnostic criterion of TSC[44]. Approximately 1/5th of TSC patients have growths around the ventricles larger than SENs called subependymal giant cell astrocytomas (SEGAs)[8,40,45]. SEGAs have profound heterogeneity, which might be a product of a specific procession of events. It appears that SENs transform into SEGAs in some patients[46,47]. However, this is debated. In some reports, SENs are not easily detectable by routine MRI screening and are instead found during operation, postoperatively, or posthumously[48]. Computed tomography scans better detect SENs. Thus, the immediate appearance of SEGAs in the absence of SEN could be a limitation of diagnostic imaging and monitoring. Nevertheless, SENs and SEGAs share histopathological features and therefore it is reasonable to consider SENs as precursors to SEGAs[49]. Although there is no consensus, the criterion of SEGA diagnosis ranges from >0.5-1.0 cm in size or serial growth[50,51]. SEGAs typically with a greater than 10 mm diameter near the foramen of Monro are also monitored for growth by MRI coupled with gadolinium[52]. SEGAs form early in life with the median age of SEGA diagnosis at 1 and high growth rates in children during brain development[53]. While the model presented here shares some aspects of SENs and SEGAs, they rarely appear to protrude into the ventricle.
Occasional neurons were found in the cerebral cortex. In comparison to previous studies using Tsc1 mice, there were far fewer cortical neurons[24]. However, in two Tsc2 mutant mice, we found cortical abnormalities consistent with TSC pathology including the presence of a mislaminated cortex having sparse NeuN labeling and rounded giant or balloon-like cells that were pS6 positive. Approximately 33% of mice had clear identifiable gross anatomical defects. The most frequent defects were within the striatum but were heterogenous in appearance. They could be categorized as ectopic disorganized neuronal clusters or glia-like heterotopias. Whereas neurons were pS6 positive, cells that were glia-like were p4EBP positive. Incidentally, the majority of RFP positive cells in the cortical plate were astrocytes. We found that lower layers of the cerebral cortex had fewer astrocytes. At first appearance, these results oppose those that describe loss of Tsc genes from neurogenic radial glia during embryogenesis[35,54,55,56,57,58,59]. Moreover, a recent study has described that removal of Tsc1/Tsc2 causes an increase in the number of intermediate progenitors, upper layer neurons, and GFAP positive cells[38]. Although it is unclear whether those GFAP positive cells are indeed astrocytes or NSCs. One possible explanation for our finding is that enhanced mTORC1 dependent translation alters cell transitional events based on the timing of TSC loss and which mRNAs are present [22]. Thus, while dorsal radial glia remain, they may slow in their gliogenic divisions. Future studies should distinguish between this possibility, the importance of timing of loss of TSC genes in gliogenic stem cells and whether the mode of division (for example, self-renewing cell division vs. terminal cell division producing neurons or glia) may be disrupted.
These studies support a model wherein several events likely occur during the development of TSC brain pathology. Loss of both alleles of Tsc2 in NSCs prevents the downregulation of mTORC1 activity in glia and stem cell proteins in a small fraction of cells leading to histopathological hallmarks consistent with TSC. These cells may require several weeks or months to gain the characteristics the pathognomonic “giant cells” of TSC as previously reported using a doxycycline Nestin-CRE system during embryogenesis[60]. However, these studies do not rule out the possibility that some pathogenic variants in TSC1 or TSC2 may only require heterozygosity for the formation of lesions. In addition, there may be single nucleotide polymorphisms that collaborate with pathogenic heterozygous mutations to cause gross anatomical defects in TSC. ~2.4% of SEGAs were identified after age 40 in one study refuting the probability of mutation of genes other than TSC1 and TSC2 as a significant cause of SEGAs[61]. Also, fewer than 10% of patients have bilateral SEGAs, but of all patients with SEGAs, ~45% have multiple or bilateral SEGAs. This result supports the idea that predisposing factors might make some patients more susceptible to developing SEGAs. This could be related to genotype since 13.2% of all patients have SEGAs with TSC1 mutations and 33.7% of all patients have SEGAs with TSC2 mutations[53]. Accordingly, in this comprehensive study, ~89.3% of all patients having SEGAs had mutations identified in TSC2. In addition, PKD1 is oriented in a tail-to-tail configuration with the TSC2 gene. Mutations affecting both genes cause PKD1-TSC2 contiguous gene syndrome, but this occurs in an estimated 3% of TSC cases and leads to polycystic kidney phenotypes and SEGAs[62]. Given that genetic testing may overlook the involvement of PKD1, its contribution to SEGA formation may be more common than currently recognized. Bilateral SEGAs are predicted to occur more frequently in patients with familial inherited TSC gene mutations and unilaterally in sporadic TSC. This idea aligns with Alfred Knudson’s proposed two-hit theory indicating that TSC hamartomas are caused by LOH(18,63). Indeed, TSC1 or TSC2 LOH occurs in SEGAs[64–67]. Involvement of additional mutations including in the proto-oncogene BRAF encoding the B-Raf kinase have dissolved with only TSC1 or TSC2 mutations consistently identified[67]. Nevertheless, it remains to be seen whether additional genetic or epigenetic events contribute to the appearance and growth of SEGAs.
Although there was tremendous heterogeneity in TSC mouse phenotypes, it is noteworthy that some anatomical defects were not bilaterally localized within the mice arguing against the genetic background being the major driver of phenotype. Moreover, despite several of the same cell types affected, the phenotypes appeared stochastically. Some TSC brain malformations have been theorized to arise from stem cells that are enriched in humans and are sparse in rodents which could also be a reason that brain lesions are rare in this model. It is also possible that the cell types responsible for TSC phenotypes are infrequently targeted in the Nestin-CRE-ERT2 model when tamoxifen is provided during the early neonatal period. While this is the most parsimonious reason that cortical malformations are rare given that we previously indicated that tubers were caused by loss of heterozygosity within embryonic NSCs (radial glia), we would have predicted that SENs/SEGAs and striatal hamartomas should be produced[36]. However, they were not efficiently generated which could be related to inefficient recombination in a cell type. Neonatal electroporation of Tsc2 mice, loss of Tsc1 by Nestin-CRE-ERT2 or Mash-CRE-ERT2, or double Tsc1/PTEN knockout using Nestin-CRE-ERT2 generates nodules or SEGAs [21,22,23,24,27,68,69]. Nevertheless, we favor a model for which compensatory mechanisms may allow for the titration of mTORC1 activity and translation which may overcome loss of Tsc2[27]. But if cells are unable to do this in a timely manner, and stemness is not lost, the wrong cells are produced and over time develop into cytomegalic neurons or giant cells which may affect brain anatomy and function. This is consistent with the cellular diversity of SEGAs and the abundance of GABAergic neurons[70].
Materials and Methods
Animals.
Clemson University Institutional Animal Care and Use Committee approved all performed experiments, and all guidelines set forth by the Clemson University Institutional Animal Care and Use Committee and were compliant with the Animal Care and Use Review Office (ACURO), a component of the USAMRDC Office of Research Protections (ORP) within the Department of Defense (DoD). (B6.Cg-Gt(ROSA)26Sortm9(CAG-tdTomato)Hze/J) (Strain #007909), C57BL/6-Tg(Nes-cre/ERT2)KEisc/J (Strain #:016261), Tsc2tm1.1Mjg/J (Strain #027458) were acquired from Jackson Laboratories. Mice were housed under pathogen-free conditions with a 12-h light/dark cycle and fed ad libitum. Recombination was induced using (Z)-4-Hydroxy-tamoxifen (Sigma Aldrich Cat#H7904) injected at a dose of 20-50 μg/g as previously described between P0-P2 for two consecutive days.
Genotyping PCR.
50 mM NaOH with 0.2 mM EDTA was added to tissue and incubated at 50°C for 90 minutes. An equal volume of 100 mM Tris-HCl was subsequently mixed with the digested tissue. Samples were briefly vortexed and centrifuged and 1-2 µL of supernatant was added to PCR Taq buffer (#R0241), forward primer 0.1-1.0 µM and reverse primer 0.1-1.0 µM, 1 mM MgCl2, template DNA, 1.25 U of Taq DNA Polymerase, and nuclease-free water (#R0581) for a final volume of 50 µL. Samples were placed into a thermocycler set for; initial denaturation step at 95°C for 3 min, followed by 32 cycles of denaturation at 95°C for 30 s, an annealing step at 60°C for 30 s, and an extension at 72°C for 30 seconds followed by a final extension at 72°C for 5 min. Mice having conditional Tsc2 alleles are distinguished by endpoint genotyping PCR using the following primer sequences, 5’-ACAATGGGAGGCACATTACC-3’ and 5’AGCAGCAGGTCTGCAGTG-3’. A wild type amplicon of 191 bp and a floxed amplicon of 250 bp are produced. Tomato genes were identified for Stock #7914 by endpoint genotyping PCR using the following primer sequences, 5’-AAGGGAGCTGCAGTGGAG TA-3’ and 5’-CCG AAAATCTGTGGGAAG TC-3’ and 5’-GGCATTAAAGCAGCGTATCC-3’ and 5’-CTGTTCCTGTACGGCATGG-3’ generating a tdTomato Mutant ~200 bp amplicon or a 297 bp Wild type amplicon. Nestin-CRE-ERT2 mice were genotyped with one of two primer sets 5’-ATGCAGGCAAATTTTGGTGT-3’ (CRE) and 5’-CGCCGCTACTTCTTTTCA AC-3’ (Nestin) and 5’-AGTGGCCTCTTCCAGAAATG-3’ (Internal Positive Control) and 5’-TGCGACTGTGTCTGATTTCC-3’ (Internal Positive Control). Alternatively, Nestin-CRE-ERT2 mice were genotyped with 5’-ATACCGGAGATCATGCAAGC-3’ (CRE) and 5’-GGCCAGGCTGTTCTTCTTAG-3’ (ERT2) and 5’-CTAGGCCAAGAATTGAAAGATCT-3’ (Internal Positive Control) and 5’-GTAGGTGGAAATTCTAGCATCATCC-3’ (Internal Positive Control)
Immunohistochemistry.
Euthasol (50 mg/kg) was administered by intraperitoneal injection followed by decapitation. Brains were dissected at room temperature in PBS and placed overnight at 4°C in 4% paraformaldehyde (in PBS). Brains were rinsed with PBS, mounted in agarose (3%), and sectioned on a Leica VTS 1000 vibratome. Sections were blocked with 2% BSA, 0.1% Triton X-100, 0.1% Tween-20 in PBS for 1 hr at room temperature. PBS containing 0.1% Tween-20 was used to subsequently was sections three times. Sections were subsequently incubated in primary antibody overnight at 4°C. Samples were washed three times in PBS containing 0.1% Tween-20. Sections were incubated with the appropriate secondary antibody (Alexa Fluor series; 1:500; Invitrogen) overnight at 4°C. Sections were mounted in ProLong Gold or Prolong Glass Antifade Mountant (ThermoFisher), covered with a coverslip, and nail polish was used to seal the samples. Images were acquired on a Leica SPE spectral confocal microscope with ×63 oil immersion objective, ×20 dry objective, or ×5 dry objectives.
Image Analysis.
Images were uploaded and analyzed on FIJI (ImageJ 1.5 g). The freehand selection tool was used to trace a region of interest (ROI) on RFP positive and RFP negative cells in the same Z section. The mean gray value was used to quantify the p4EBP staining intensity represented as the ratio of RFP positive/RFP negative for Tsc2wt/wt and Tsc2mut/mut conditions. The ventral portion of the V-SVZ from the same slice and region was traced to quantify the area of RFP positive cells from Tsc2wt/wt and Tsc2mut/mut mice. The distance from the dorsal aspect of the lateral ventricle to the pia surface was measured using the line tool. The distribution of glia within the dorsal forebrain was measured by drawing a line from the dorsal lateral ventricle to the pia surface. The histogram values of RFP positive cells starting from the ventricle to the outer cortical region were then exported into Graphpad and represented as the RFP signal in relation to distance.
Statistics
Data were graphed and analyzed with GraphPad Prism software (Version 8.2.0, GraphPad Software Inc.). Statistical significance was determined by Student’s t-test. Quantification was performed on 5-6 mice per condition per time point. Error bars are reported as standard error mean.
References
- Hasbani, D.M.; Crino, P.B. Tuberous sclerosis complex. Handbook of Clinical Neurology 2018, Vol. 148, 813–822. [Google Scholar]
- Feliciano, D.M.; Lin, T. V.; Hartman, N.W.; Bartley, C.M.; Kubera, C.; Hsieh, L.; Lafourcade, C.; O’Keefe, R.A.; Bordey, A. A circuitry and biochemical basis for tuberous sclerosis symptoms: From epilepsy to neurocognitive deficits. A circuitry and biochemical basis for tuberous sclerosis symptoms: From epilepsy to neurocognitive deficits. International Journal of Developmental Neuroscience 2013, 31, 667–678. [Google Scholar] [CrossRef]
- Feliciano, D.M. The Neurodevelopmental Pathogenesis of Tuberous Sclerosis Complex (TSC). The Neurodevelopmental Pathogenesis of Tuberous Sclerosis Complex (TSC). Front Neuroanat 2020, 14. [Google Scholar]
- Van Slegtenhorst, M.; De Hoogt, R.; Hermans, C.; Nellist, M.; Janssen, B.; Verhoef, S.; Lindhout, D.; Van Den Ouweland, A.; Halley, D.; Young, J.; et al. Identification of the tuberous sclerosis gene TSC1 on chromosome 9q34. Science (1979) 1997, 277, 805–808. [Google Scholar] [CrossRef]
- The European Chromosome 16 Tuberous Sclerosis Consortium Identification and characterization of the tuberous sclerosis gene on chromosome 16. Cell 1993, 75, 1305–1315. [CrossRef]
- Henske, E.P.; Jóźwiak, S.; Kingswood, J.C.; Sampson, J.R.; Thiele, E.A. Tuberous sclerosis complex. Nat Rev Dis Primers 2016, 2, 16035. [Google Scholar] [CrossRef]
- Henske, E.P.; Jóźwiak, S.; Kingswood, J.C.; Sampson, J.R.; Thiele, E.A. Tuberous sclerosis complex. Nat Rev Dis Primers 2016, 2, 16035. [Google Scholar] [CrossRef]
- Chan, D.L.; Calder, T.; Lawson, J.A.; Mowat, D.; Kennedy, S.E. The natural history of subependymal giant cell astrocytomas in tuberous sclerosis complex: A review. Rev Neurosci 2018, 29, 295–301. [Google Scholar] [CrossRef]
- Hasbani, D.M.; Crino, P.B. Tuberous sclerosis complex. Handbook of Clinical Neurology 2018, Vol. 148, 813–822. [Google Scholar]
- Knudson, A.G. Mutation and cancer: statistical study of retinoblastoma. Proc Natl Acad Sci U S A 1971, 68, 820–823. [Google Scholar] [CrossRef]
- Hino, O.; Klein-Szanto, A.J.P.; Freed, J.J.; Testa, J.R.; Brown, D.Q.; Vilensky, M.; Yeung, R.S.; Tartof, K.D.; Knudson, A.G. Spontaneous and radiation-induced renal tumors in the Eker rat model of dominantly inherited cancer. Proc Natl Acad Sci U S A 1993, 90, 327–331. [Google Scholar] [CrossRef]
- Yeung, R.S.; Xiao, G.H.; Jin, F.; Lee, W.C.; Testa, J.R.; Knudson, A.G. Predisposition to renal carcinoma in the Eker rat is determined by germ- line mutation of the tuberous sclerosis 2 (TSC2) gene. Proc Natl Acad Sci U S A 1994, 91, 11413–11416. [Google Scholar] [CrossRef]
- Yeung, R.S.; Xiao, G.H.; Jin, F.; Lee, W.C.; Testa, J.R.; Knudson, A.G. Predisposition to renal carcinoma in the Eker rat is determined by germ- line mutation of the tuberous sclerosis 2 (TSC2) gene. Proc Natl Acad Sci U S A 1994, 91, 11413–11416. [Google Scholar] [CrossRef]
- Xiao, G.H.; Jin, F.; Yeung, R.S. Germ-line Tsc2 mutation in a dominantly inherited cancer model defines a novel family of rat intracisternal-A particle elements. Oncogene 1995, 11. [Google Scholar]
- Yeung, R.S.; Katsetos, C.D.; Klein-Szanto, A. Subependymal astrocytic hamartomas in the Eker rat model of tuberous sclerosis. American Journal of Pathology 1997, 151, 1477–1486. [Google Scholar] [PubMed]
- Wenzel, H.J.; Patel, L.S.; Robbins, C.A.; Emmi, A.; Yeung, R.S.; Schwartzkroin, P.A. Morphology of cerebral lesions in the Eker rat model of tuberous sclerosis. Acta Neuropathol 2004, 108. [Google Scholar] [CrossRef]
- Kubo, Y.; Mitani, H.; Hino, O. Allelic Loss at the Predisposing Gene Locus in Spontaneous and Chemically Induced Renal Cell Carcinomas in the Eker Rat. Cancer Res 1994, 54, 2633–2635. [Google Scholar]
- Kubo, Y.; Klimek, F.; Kikuchi, Y.; Bannasch, P.; Hino, O. Early Detection of Knudson’s Two-Hits in Preneoplastic Renal Cells of the Eker Rat Model by the Laser Microdissection Procedure. Cancer Res 1995, 55, 989–990. [Google Scholar] [PubMed]
- Kobayashi, T.; Urakami, S.; Hirayama, Y.; Yamamoto, T.; Nishizawa, M.; Takahara, T.; Kubo, Y.; Hino, O. Intragenic Tsc2 somatic mutations as Knudson’s second hit in spontaneous and chemically induced renal carcinomas in the Eker rat model. Japanese Journal of Cancer Research 1997, 88, 254–261. [Google Scholar] [CrossRef]
- Kútna, V.; Uttl, L.; Waltereit, R.; Krištofiková, Z.; Kaping, D.; Petrásek, T.; Hoschl, C.; Ovsepian, S. V. Tuberous Sclerosis (tsc2+/-) Model Eker Rats Reveals Extensive Neuronal Loss with Microglial Invasion and Vascular Remodeling Related to Brain Neoplasia. Neurotherapeutics 2020, 17. [Google Scholar] [CrossRef] [PubMed]
- Zordan, P.; Cominelli, M.; Cascino, F.; Tratta, E.; Poliani, P.L.; Galli, R. Tuberous sclerosis complex-associated CNS abnormalities depend on hyperactivation of mTORC1 and Akt. Journal of Clinical Investigation 2018, 128, 1688–1706. [Google Scholar] [CrossRef]
- Riley, V.A.; Shankar, V.; Holmberg, J.C.; Sokolov, A.M.; Neckles, V.N.; Williams, K.; Lyman, R.; Mackay, T.F.C.; Feliciano, D.M. Tsc2 coordinates neuroprogenitor differentiation. iScience 2023, 26, 108442. [Google Scholar] [CrossRef]
- Zhou, J.; Shrikhande, G.; Xu, J.; Mckay, R.M.; Burns, D.K.; Johnson, J.E.; Parada, L.F. Tsc1 mutant neural stem/progenitor cells exhibit migration deficits and give rise to subependymal lesions in the lateral ventricle. Genes Dev 2011, 25, 1595–1600. [Google Scholar] [CrossRef] [PubMed]
- Feliciano, D.M.; Quon, J.L.; Su, T.; Taylor, M.M.; Bordey, A. Postnatal neurogenesis generates heterotopias, olfactory micronodules and cortical infiltration following single-cell TSC1 deletion. Hum Mol Genet 2012, 21, 799–810. [Google Scholar] [CrossRef] [PubMed]
- Feliciano, D.M.; Bordey, A. TSC-mTORC1 Pathway in Postnatal V-SVZ Neurodevelopment. Biomolecules 2025, 15, 573. [Google Scholar] [CrossRef]
- Holmberg, J.C.; Riley, V.A.; Sokolov, A.M.; Mukherjee, S.; Feliciano, D.M. Protocol for electroporating and isolating murine (sub)ventricular zone cells for single-nuclei omics. STAR Protoc 2024, 5, 103095. [Google Scholar] [CrossRef]
- Mukherjee, S.; Wolan, M.J.; Scott, M.K.; Riley, V.A.; Sokolov, A.M.; Feliciano, D.M. A bitopic mTORC inhibitor reverses phenotypes in a tuberous sclerosis complex model. Sci Rep 2025, 15, 20367. [Google Scholar] [CrossRef]
- Riley, V.A.; Holmberg, J.C.; Sokolov, A.M.; Feliciano, D.M. Tsc2 shapes olfactory bulb granule cell molecular and morphological characteristics. Front Mol Neurosci 2022, 15, 19. [Google Scholar] [CrossRef]
- Lagace, D.C.; Whitman, M.C.; Noonan, M.A.; Ables, J.L.; DeCarolis, N.A.; Arguello, A.A.; Donovan, M.H.; Fischer, S.J.; Farnbauch, L.A.; Beech, R.D.; et al. Dynamic contribution of nestin-expressing stem cells to adult neurogenesis. Journal of Neuroscience 2007, 27, 12623–12629. [Google Scholar] [CrossRef]
- Pollen, A.A.; Bhaduri, A.; Andrews, M.G.; Nowakowski, T.J.; Meyerson, O.S.; Mostajo-Radji, M.A.; Di Lullo, E.; Alvarado, B.; Bedolli, M.; Dougherty, M.L.; et al. Establishing Cerebral Organoids as Models of Human-Specific Brain Evolution. Cell 2019, 176, 743–756.e17. [Google Scholar] [CrossRef]
- Northrup, H.; Krueger, D.A.; Roberds, S.; Smith, K.; Sampson, J.; Korf, B.; Kwiatkowski, D.J.; Mowat, D.; Nellist, M.; Povey, S.; et al. Tuberous sclerosis complex diagnostic criteria update: Recommendations of the 2012 international tuberous sclerosis complex consensus conference. Pediatr Neurol 2013, 49, 243–254. [Google Scholar] [CrossRef]
- Lind, W.A.T. EPILOIA. Med J Aust 1924, 293, 1–5. [Google Scholar] [CrossRef]
- Crithchley, M.; Earl, C.J.C. Tuberose sclerosis and allied conditions. Brain 1932, 55. [Google Scholar] [CrossRef]
- Staley, B.A.; Vail, E.A.; Thiele, E.A. Tuberous sclerosis complex: Diagnostic challenges, presenting symptoms, and commonly missed signs. Pediatrics 2011, 127. [Google Scholar] [CrossRef]
- Krueger, D.A.; Northrup, H.; Krueger, D.A.; Roberds, S.; Smith, K.; Sampson, J.; Korf, B.; Kwiatkowski, D.J.; Mowat, D.; Nellist, M.; et al. Tuberous sclerosis complex surveillance and management: Recommendations of the 2012 international tuberous sclerosis complex consensus conference. Pediatr Neurol 2013, 49, 255–265. [Google Scholar] [CrossRef] [PubMed]
- Adriaensen, M.E.A.P.M.; Schaefer-Prokop, C.M.; Stijnen, T.; Duyndam, D.A.C.; Zonnenberg, B.A.; Prokop, M. Prevalence of subependymal giant cell tumors in patients with tuberous sclerosis and a review of the literature. Eur J Neurol 2009, 16, 691–696. [Google Scholar] [CrossRef]
- Fujiwara, S.; Takaki, T.; Hikita, T.; Nishio, S. Subependymal giant-cell astrocytoma associated with tuberous sclerosis - Do subependymal nodules grow? Child’s Nervous System 1989, 5. [Google Scholar]
- Morimoto, K.; Mogami, H. Sequential CT study of subependymal giant-cell astrocytoma associated with tuberous sclerosis. Case report. J Neurosurg 1986, 65. [Google Scholar] [CrossRef]
- Cuccia, V.; Zuccaro, G.; Sosa, F.; Monges, J.; Lubienieky, F.; Taratuto, A.L. Subependymal giant cell astrocytoma in children with tuberous sclerosis. Child’s Nervous System 2003, 19, 232–243. [Google Scholar] [CrossRef] [PubMed]
- Zordan, P.; Cominelli, M.; Cascino, F.; Tratta, E.; Poliani, P.L.; Galli, R. Tuberous sclerosis complex-associated CNS abnormalities depend on hyperactivation of mTORC1 and Akt. Journal of Clinical Investigation 2018, 128, 1688–1706. [Google Scholar] [CrossRef]
- Jóźwiak, S.; Nabbout, R.; Curatolo, P. Management of subependymal giant cell astrocytoma (SEGA) associated with tuberous sclerosis complex (TSC): Clinical recommendations. European Journal of Paediatric Neurology 2013, 17. [Google Scholar] [CrossRef]
- Roth, J.; Roach, E.S.; Bartels, U.; Jóźwiak, S.; Koenig, M.K.; Weiner, H.L.; Franz, D.N.; Wang, H.Z. Subependymal giant cell astrocytoma: Diagnosis, screening, and treatment. Recommendations from the international tuberous sclerosis complex consensus conference 2012. Pediatr Neurol 2013, 49, 439–444. [Google Scholar] [CrossRef]
- Northrup, H.; Aronow, M.E.; Bebin, E.M.; Bissler, J.; Darling, T.N.; de Vries, P.J.; Frost, M.D.; Fuchs, Z.; Gosnell, E.S.; Gupta, N.; et al. Updated International Tuberous Sclerosis Complex Diagnostic Criteria and Surveillance and Management Recommendations. Pediatr Neurol 2021, 123. [Google Scholar] [CrossRef]
- Jansen, A.C.; Belousova, E.; Benedik, M.P.; Carter, T.; Cottin, V.; Curatolo, P.; Dahlin, M.; D’Amato, L.; D’Augères, G.B.; De Vries, P.J.; et al. Clinical characteristics of subependymal giant cell astrocytoma in tuberous sclerosis complex. Front Neurol. 2019. [Google Scholar] [CrossRef]
- Goto, J.; Talos, D.M.; Klein, P.; Qin, W.; Chekaluk, Y.I.; Anderl, S.; Malinowska, I.A.; Di Nardo, A.; Bronson, R.T.; Chan, J.A.; et al. Regulable neural progenitor-specific Tsc1 loss yields giant cells with organellar dysfunction in a model of tuberous sclerosis complex. Proc Natl Acad Sci U S A 2011, 108. [Google Scholar] [CrossRef]
- Jansen, A.C.; Belousova, E.; Benedik, M.P.; Carter, T.; Cottin, V.; Curatolo, P.; D’Amato, L.; D’Augères, G.B.; De Vries, P.J.; Ferreira, J.C.; et al. Newly diagnosed and growing subependymal giant cell astrocytoma in adults with tuberous sclerosis complex: Results from the International TOSCA Study. Front Neurol 2019, 10. [Google Scholar] [CrossRef] [PubMed]
- Kotulska, K.; Borkowska, J.; Mandera, M.; Roszkowski, M.; Jurkiewicz, E.; Grajkowska, W.; Bilska, M.; Jóźwiak, S. Congenital subependymal giant cell astrocytomas in patients with tuberous sclerosis complex. Child’s Nervous System 2014, 30, 2037–2042. [Google Scholar] [CrossRef] [PubMed]
- Knudson, A.G. Mutation and cancer: statistical study of retinoblastoma. Proc Natl Acad Sci U S A 1971, 68, 820–823. [Google Scholar] [CrossRef]
- Henske, E.P.; Wessner, L.L.; Golden, J.; Scheithauer, B.W.; Vortmeyer, A.O.; Zhuang, Z.; Klein-Szanto, A.J.P.; Kwiatkowski, D.J.; Yeung, R.S. Loss of tuberin in both subependymal giant cell astrocytomas and angiomyolipomas supports a two-hit model for the pathogenesis of tuberous sclerosis tumors. American Journal of Pathology 1997, 151, 1639–1647. [Google Scholar]
- Giannikou, K.; Zhu, Z.; Kim, J.; Winden, K.D.; Tyburczy, M.E.; Marron, D.; Parker, J.S.; Hebert, Z.; Bongaarts, A.; Taing, L.; et al. Subependymal giant cell astrocytomas are characterized by mTORC1 hyperactivation, a very low somatic mutation rate, and a unique gene expression profile. Modern Pathology 2021, 34. [Google Scholar] [CrossRef] [PubMed]
- Chan, J.A.; Zhang, H.; Roberts, P.S.; Jozwiak, S.; Wieslawa, G.; Lewin-Kowalik, J.; Kotulska, K.; Kwiatkowski, D.J. Pathogenesis of tuberous sclerosis subependymal giant cell astrocytomas: Biallelic inactivation of TSC1 or TSC2 leads to mTOR activation. J Neuropathol Exp Neurol 2004, 63, 1236–1242. [Google Scholar] [CrossRef] [PubMed]
- Bongaarts, A.; Giannikou, K.; Reinten, R.J.; Anink, J.J.; Mills, J.D.; Jansen, F.E.; Spliet, W.G.M.; den Dunnen, W.F.A.; Coras, R.; Blümcke, I.; et al. Subependymal giant cell astrocytomas in Tuberous Sclerosis Complex have consistent TSC1/TSC2 biallelic inactivation, and no BRAF mutations. Oncotarget 2017, 8, 95516–95529. [Google Scholar] [CrossRef]
- Feliciano, D.M.; Su, T.; Lopez, J.; Platel, J.C.; Bordey, A. Single-cell Tsc1 knockout during corticogenesis generates tuber-like lesions and reduces seizure threshold in mice. Journal of Clinical Investigation 2011, 121, 1596–1607. [Google Scholar] [CrossRef]
- Feliciano, D.M.; Zhang, S.; Quon, J.L.; Bordey, A. Hypoxia-inducible factor 1a is a Tsc1-regulated survival factor in newborn neurons in tuberous sclerosis complex. Hum Mol Genet 2013, 22, 1725–1734. [Google Scholar] [CrossRef]
- Rushing, G. V.; Brockman, A.A.; Bollig, M.K.; Leelatian, N.; Mobley, B.C.; Irish, J.M.; Ess, K.C.; Fu, C.; Ihrie, R.A. Location-dependent maintenance of intrinsic susceptibility to mTORC1-driven tumorigenesis. Life Sci Alliance 2019, 2. [Google Scholar] [CrossRef] [PubMed]
- Holmberg, J.C.; Shankar, V.; Lyman, R.A.; Mackay, T.F.C.; Feliciano, D.M. Single Nuclei Transcriptomics reveals cellular diversity in TSC Subependymal Giant Cell Astrocytomas. iScience 2025, 113389. [Google Scholar] [CrossRef] [PubMed]
Figure 1.
Targeted Recombination in Gliogenic and Neurogenic Stem Cells A. Schematic diagram of conditional Tsc2 deletion. B. Coronal section of mouse brain with targeted regions along the lateral ventricle (VL). Allen Mouse Brain Atlas and Allen Reference Atlas – Mouse Brain mouse.brain-map.org and atlas.brain-map.org. C, D. 20× image of coronal section of an olfactory bulb from Tsc2wt/wt (C) or Tsc2mut/mut (D) demonstrating that most RFP positive cells (magenta) are neuroblasts and are DCX positive (yellow) not Neu-N positive (cyan). E, F. 5× image of coronal section of region shown in B and from Tsc2wt/wt (E) or Tsc2mut/mut (F) at P10 demonstrating RFP positive cells (magenta) along the lateral ventricle and Neu-N (cyan) to mark neurons. G, H. 5× image of coronal section of region shown in B and from Tsc2wt/wt (G) or Tsc2mut/mut (H) at P10 demonstrating that RFP positive cells (magenta) along the lateral ventricle colocalize with Sox2 (cyan) which labels neuroprogenitors. I, J. 5× image of coronal section of region shown in B from Tsc2wt/wt (I) or Tsc2mut/mut (J) at P10 demonstrating that RFP positive cells (magenta), vimentin positive neural stem cells (yellow) and DCX positive neuroblast (cyan). Scale bar = 50 µm.
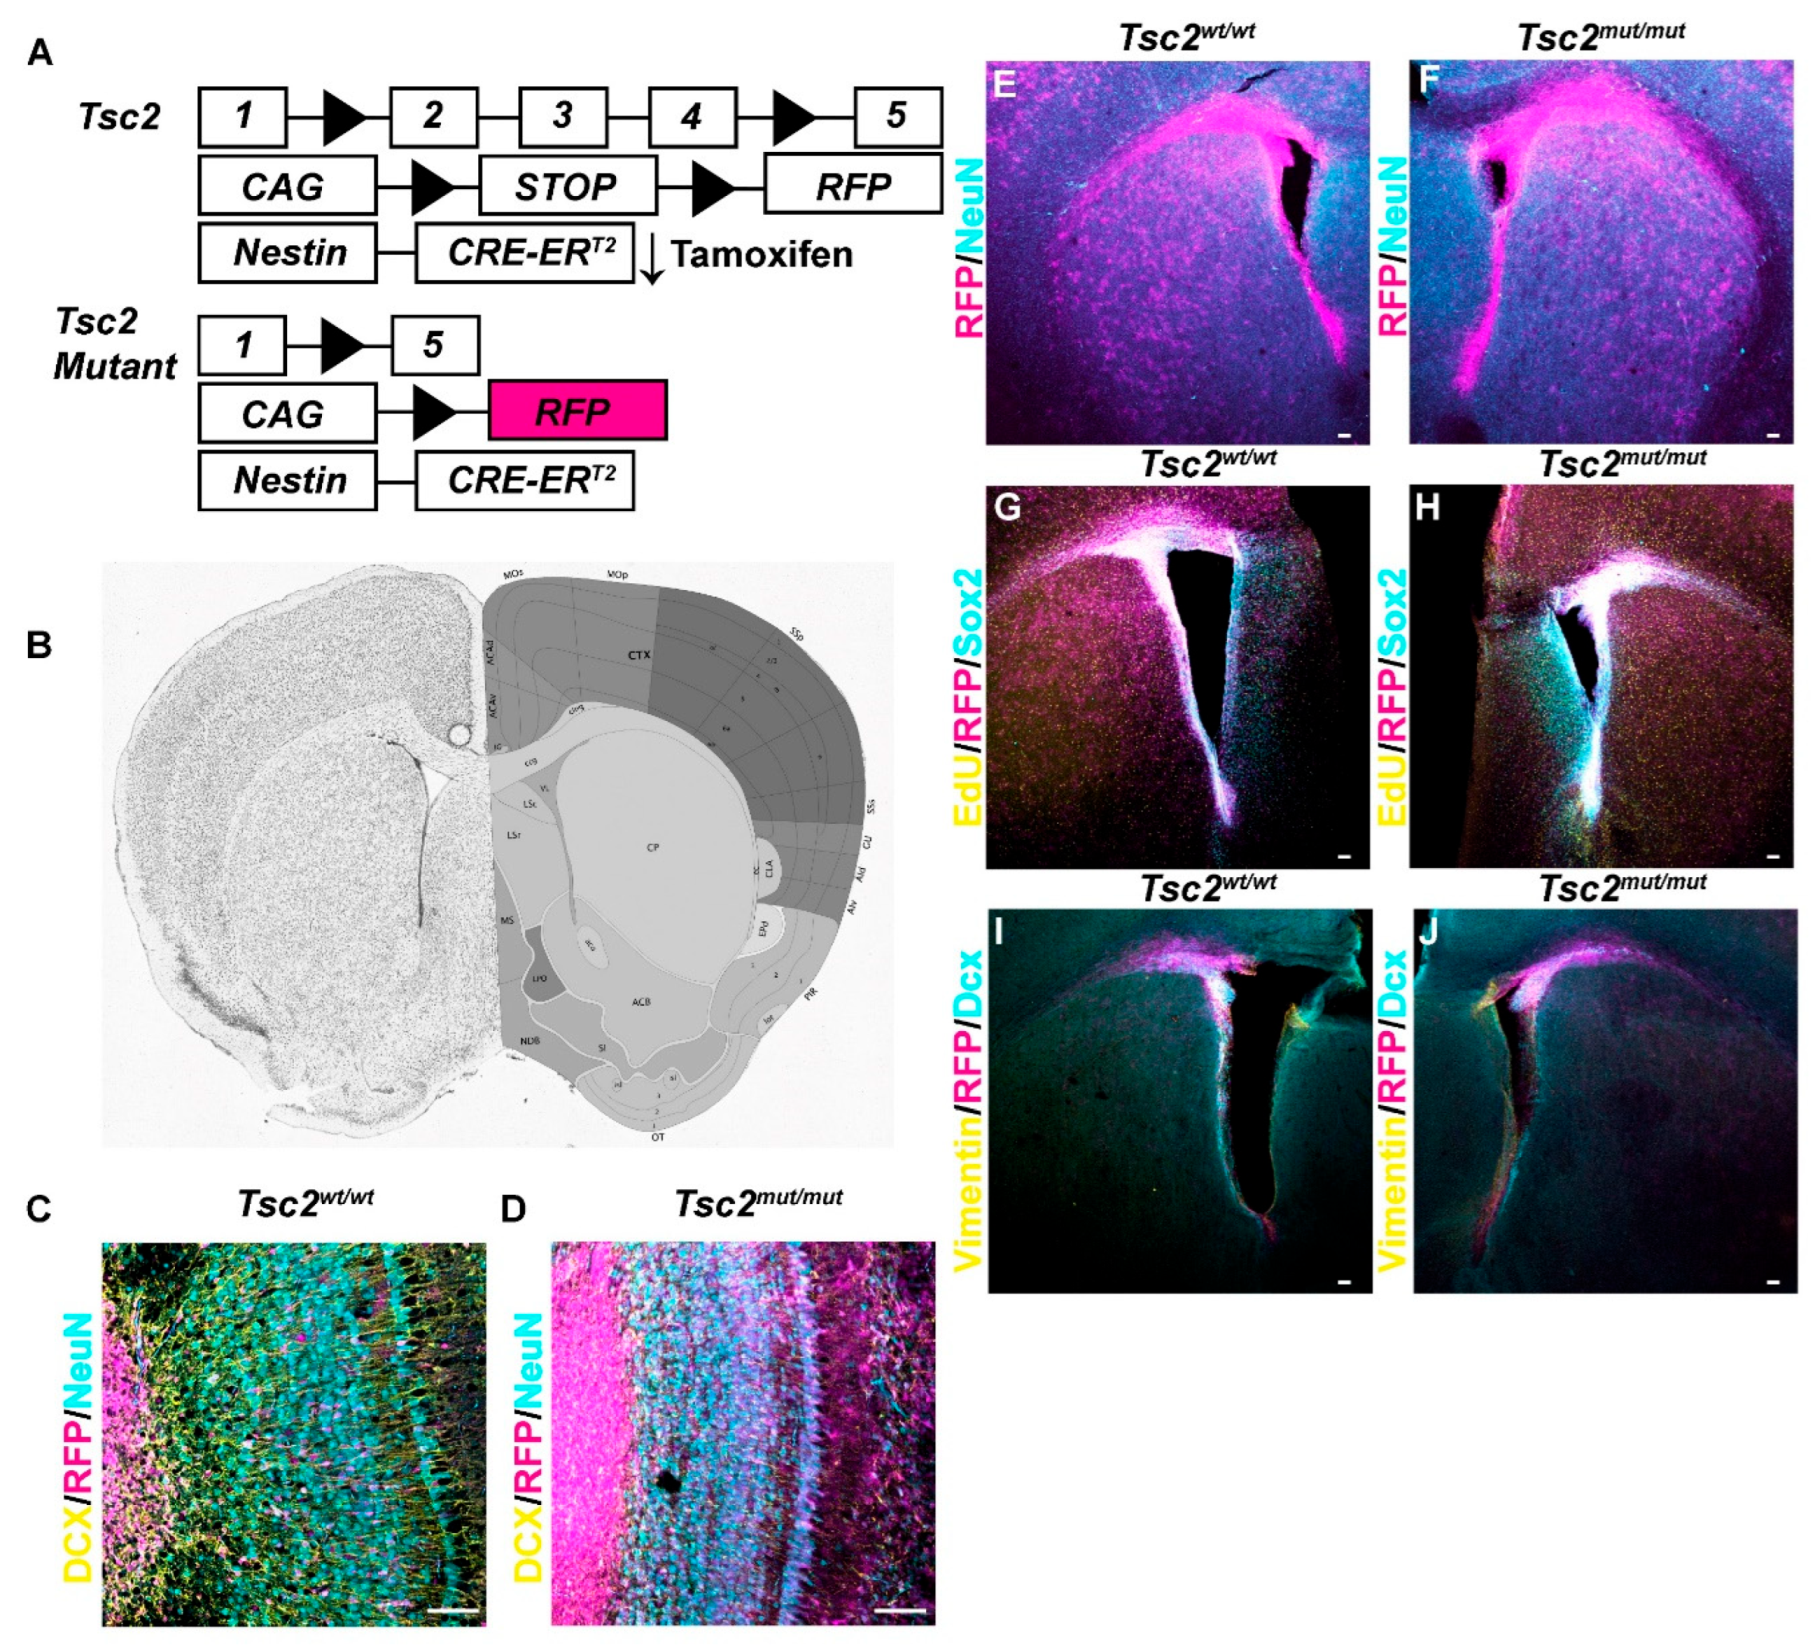
Figure 2.
Loss of Tsc2 in NSCs Increases mTORC1 Activity. A. 5× image of coronal section of a P10 Tsc2wt/wt demonstrating RFP (magenta) in Nestin (yellow) positive cells in the V-SVZ and stained for p4EBP (cyan). B.,C. 20× (B) and 40× digital zoom (C) demonstrating that p4EBP (blue) staining is mostly along the V-SVZ where RFP (red) NSCs are located. D. 5× image of coronal section of a P10 Tsc2mut/mut demonstrating RFP (magenta) in Nestin (yellow) positive cells in the V-SVZ and stained for p4EBP (cyan). E., F. 20× (E) and 40× (F) digital zoom demonstrating that p4EBP (blue) staining is mostly in the V-SVZ where RFP (red) NSCs are located and in an outer V-SVZ NSC. G-J. 20× images of coronal sections of a P30 Tsc2wt/wt in the upper (G, H) or lower V-SVZ (I, J) showing RFP (magenta) and p4EBP (blue). (K-N) 20× images of coronal sections of a P30 Tsc2mut/mut in the upper (K, L) or lower V-SVZ (M, N) showing RFP (magenta) and p4EBP (blue). O-P. 63× image of coronal section with up-regulated p4EBP within the striatum of heterotopically placed cells. Q. Quantification of mTORC1 activity in the V-SVZ of Tsc2wt/wt and Tsc2mut/mut NSCs. R. Quantification of V-SVZ area. S. Schematic diagram of the regulation of mTORC1 activity in NSCs. Scale bar A, B, D, E, G-N = 50 µm. Scale bar = 100 µm for C and F. Scale Bar = 157.5 µm O-P. * = p<0.05.
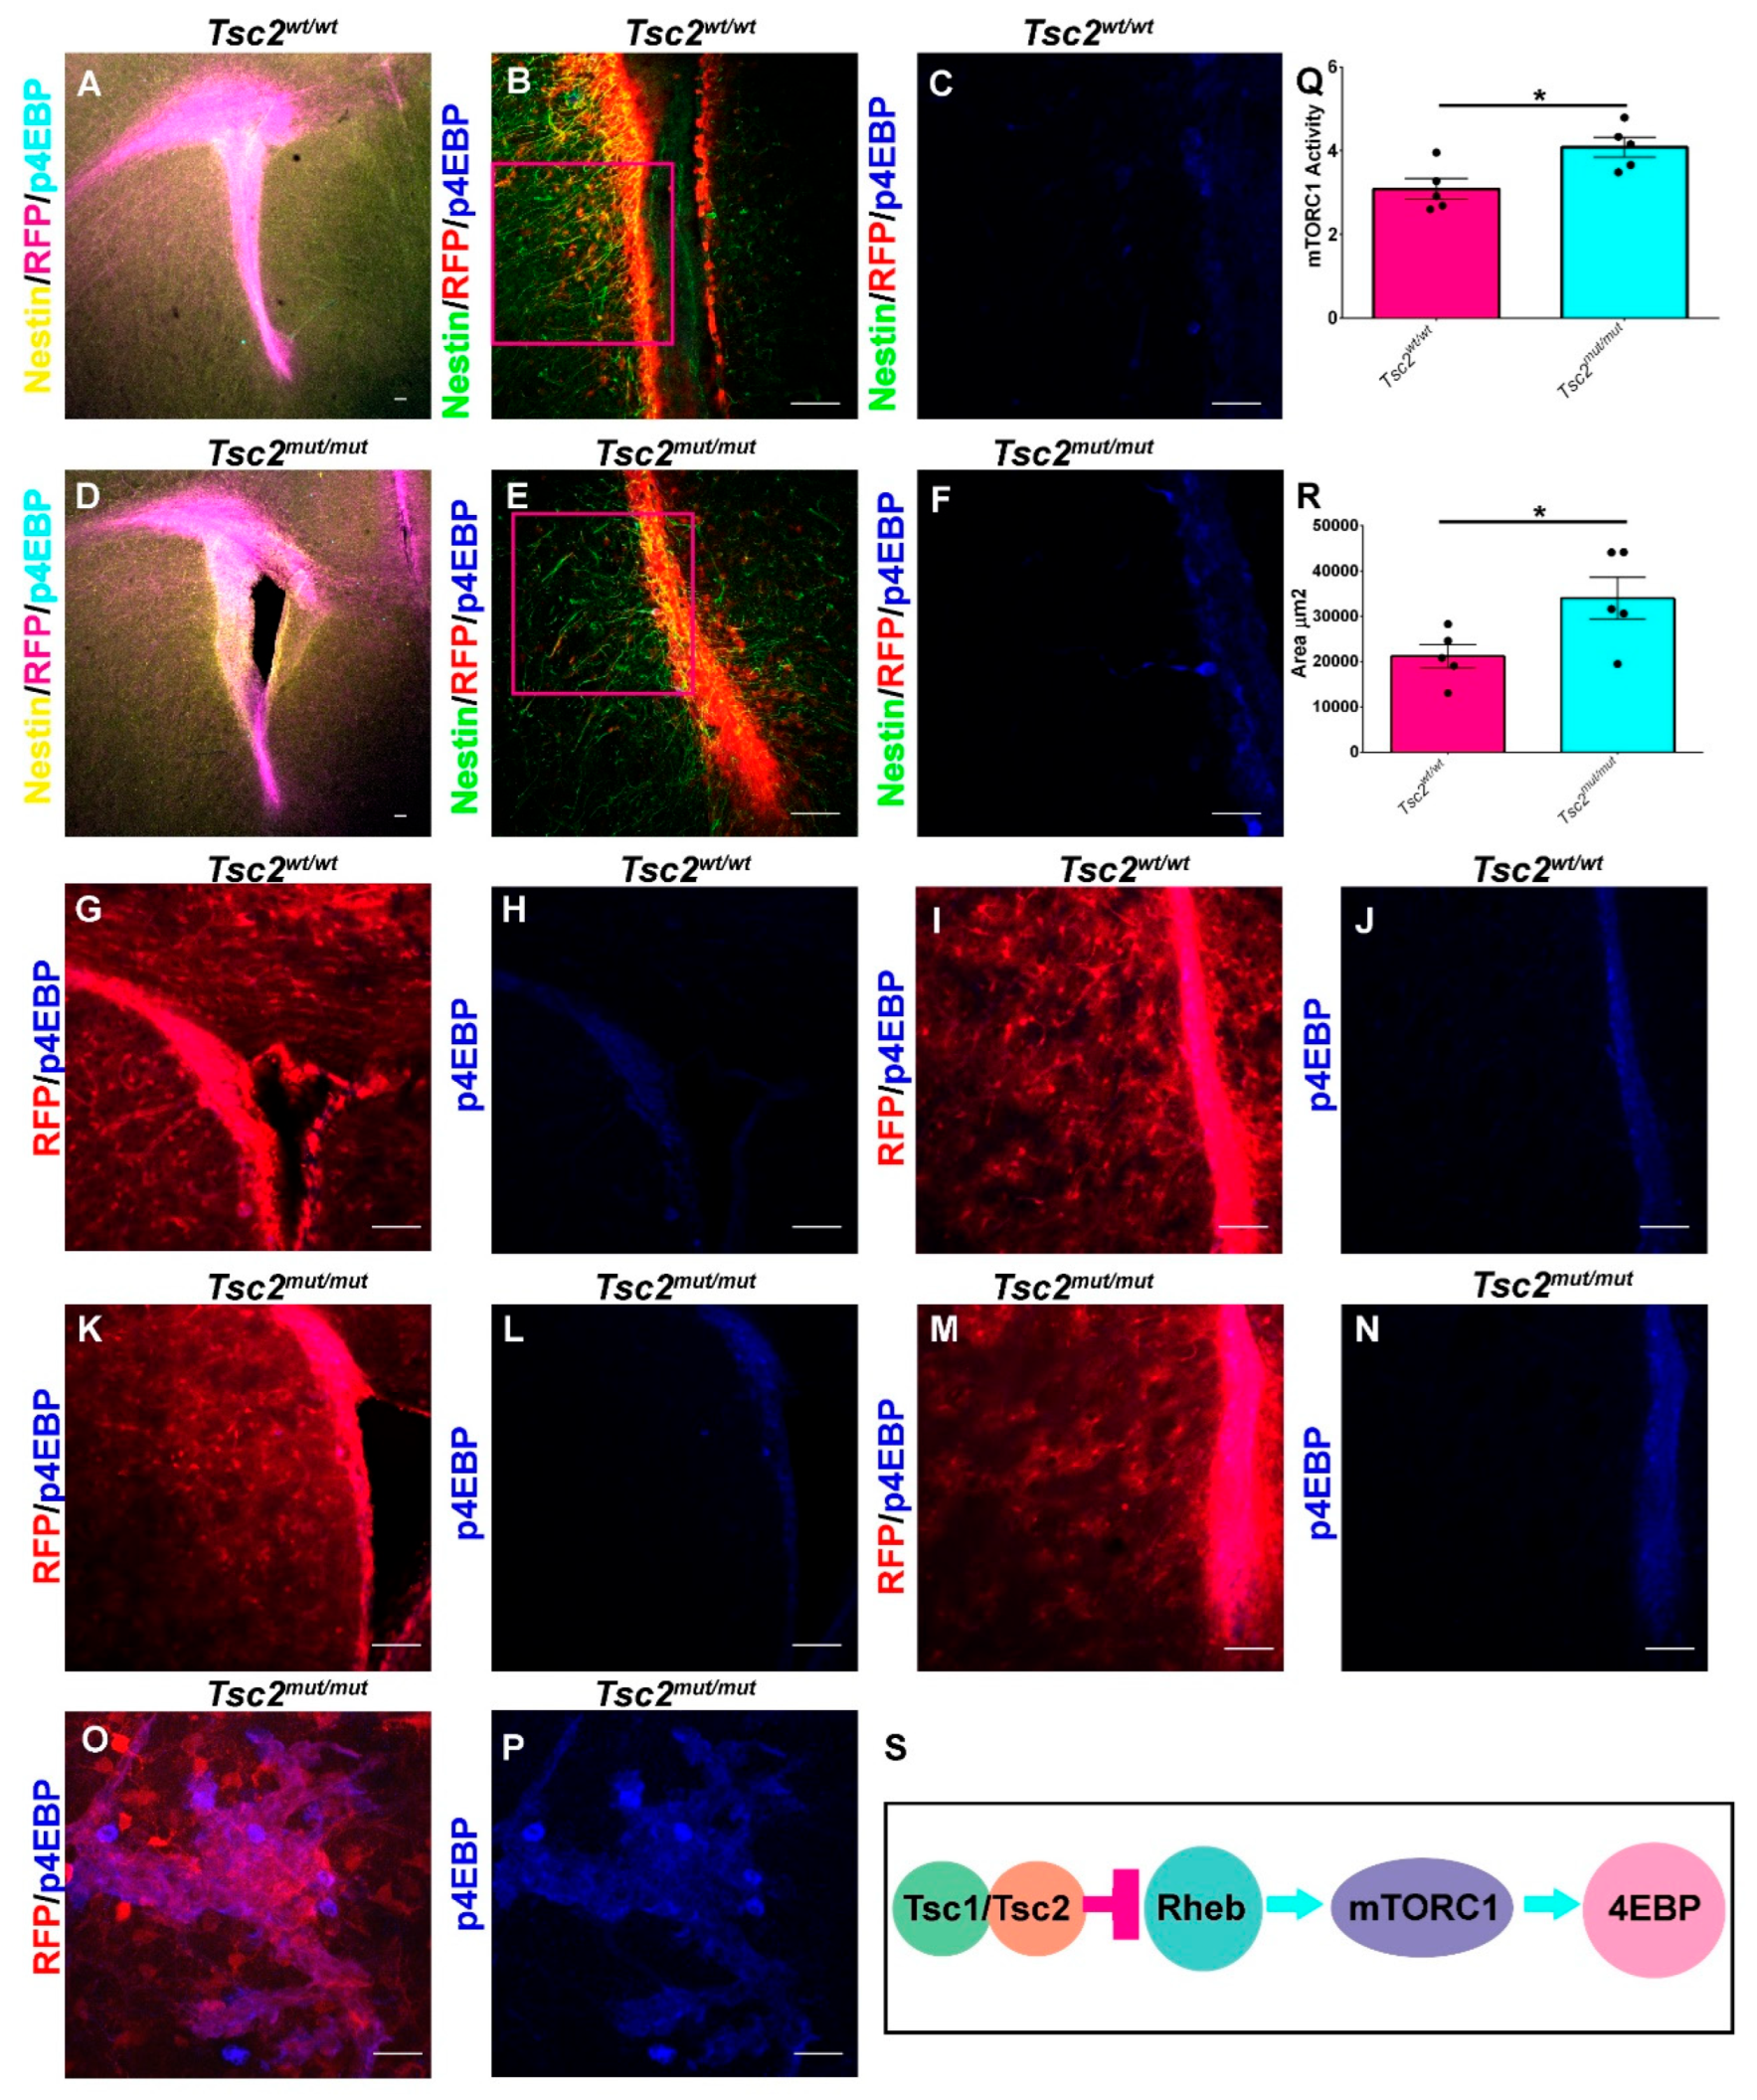
Figure 3.
Cellular Phenotypes Associated with Tsc2 Mutation. A. 5× or 10× (B) image of a sagittal section of a P30 Tsc2mut/mut brain demonstrating RFP (magenta), GFAP (yellow), and the DNA counterstain TO-PRO-3 (cyan) showing labeling of the V-SVZ and hippocampus. C. 5× image of a sagittal section of a P30 Tsc2mut/mut brain with RFP (magenta) positive hippocampus and the DNA counterstain TO-PRO-3 (blue) showing labeling of the dentate gyrus of the hippocampus. D. 5× image of a sagittal section of a P30 Tsc2mut/mut brain with RFP (magenta) positive hippocampus, NeuN (green) and the DNA counterstain TO-PRO-3 (blue) showing labeling of neurons in the dentate gyrus of the hippocampus. E-J. 5× (E), 10× (F), or 20× (G-J) image of a sagittal section of a P30 Tsc2mut/mut brain with RFP (red) positive cells surrounding the ventricle with the NSC marker Nestin (green), and GFAP (blue) which labels both NSCs and astrocytes. K. 20× image of a coronal section of a P30 Tsc2mut/mut brain with RFP (magenta) and cytomegalic Sox2 positive (yellow) cells in the striatum indicated by cyan arrows. The magenta box was magnified 2× digitally (L) and only Sox2 is shown (green) with magenta arrows highlighting the enlarged nucleus of the cytomegalic cells. M-N. 20× image of the lateral portion of a coronal section of a P30 Tsc2mut/mut brain with RFP (red), pS6 (blue) and DCX (green) cells mainly localized in the V-SVZ with occasional cells infiltrating the striatum indicated by cyan arrows. O-P. 20× image of the ventral portion of a coronal section of a P30 Tsc2mut/mut brain with RFP (red), pS6 (blue) and DCX (green) cells mainly localized in the V-SVZ with occasional cells infiltrating the striatum indicated by cyan arrows. Q-R. 20× image of the lateral portion of a coronal section of a P30 Tsc2mut/mut brain with RFP (red) and glutamine synthetase (GS, blue) showing that most RFP cells in the striatum have a glial morphology and are GS positive. S-T. 20× image of the lateral portion of a coronal section of a P30 Tsc2mut/mut brain with RFP (red) and NeuN (blue) demonstrating the presence of cytomegalic neurons.
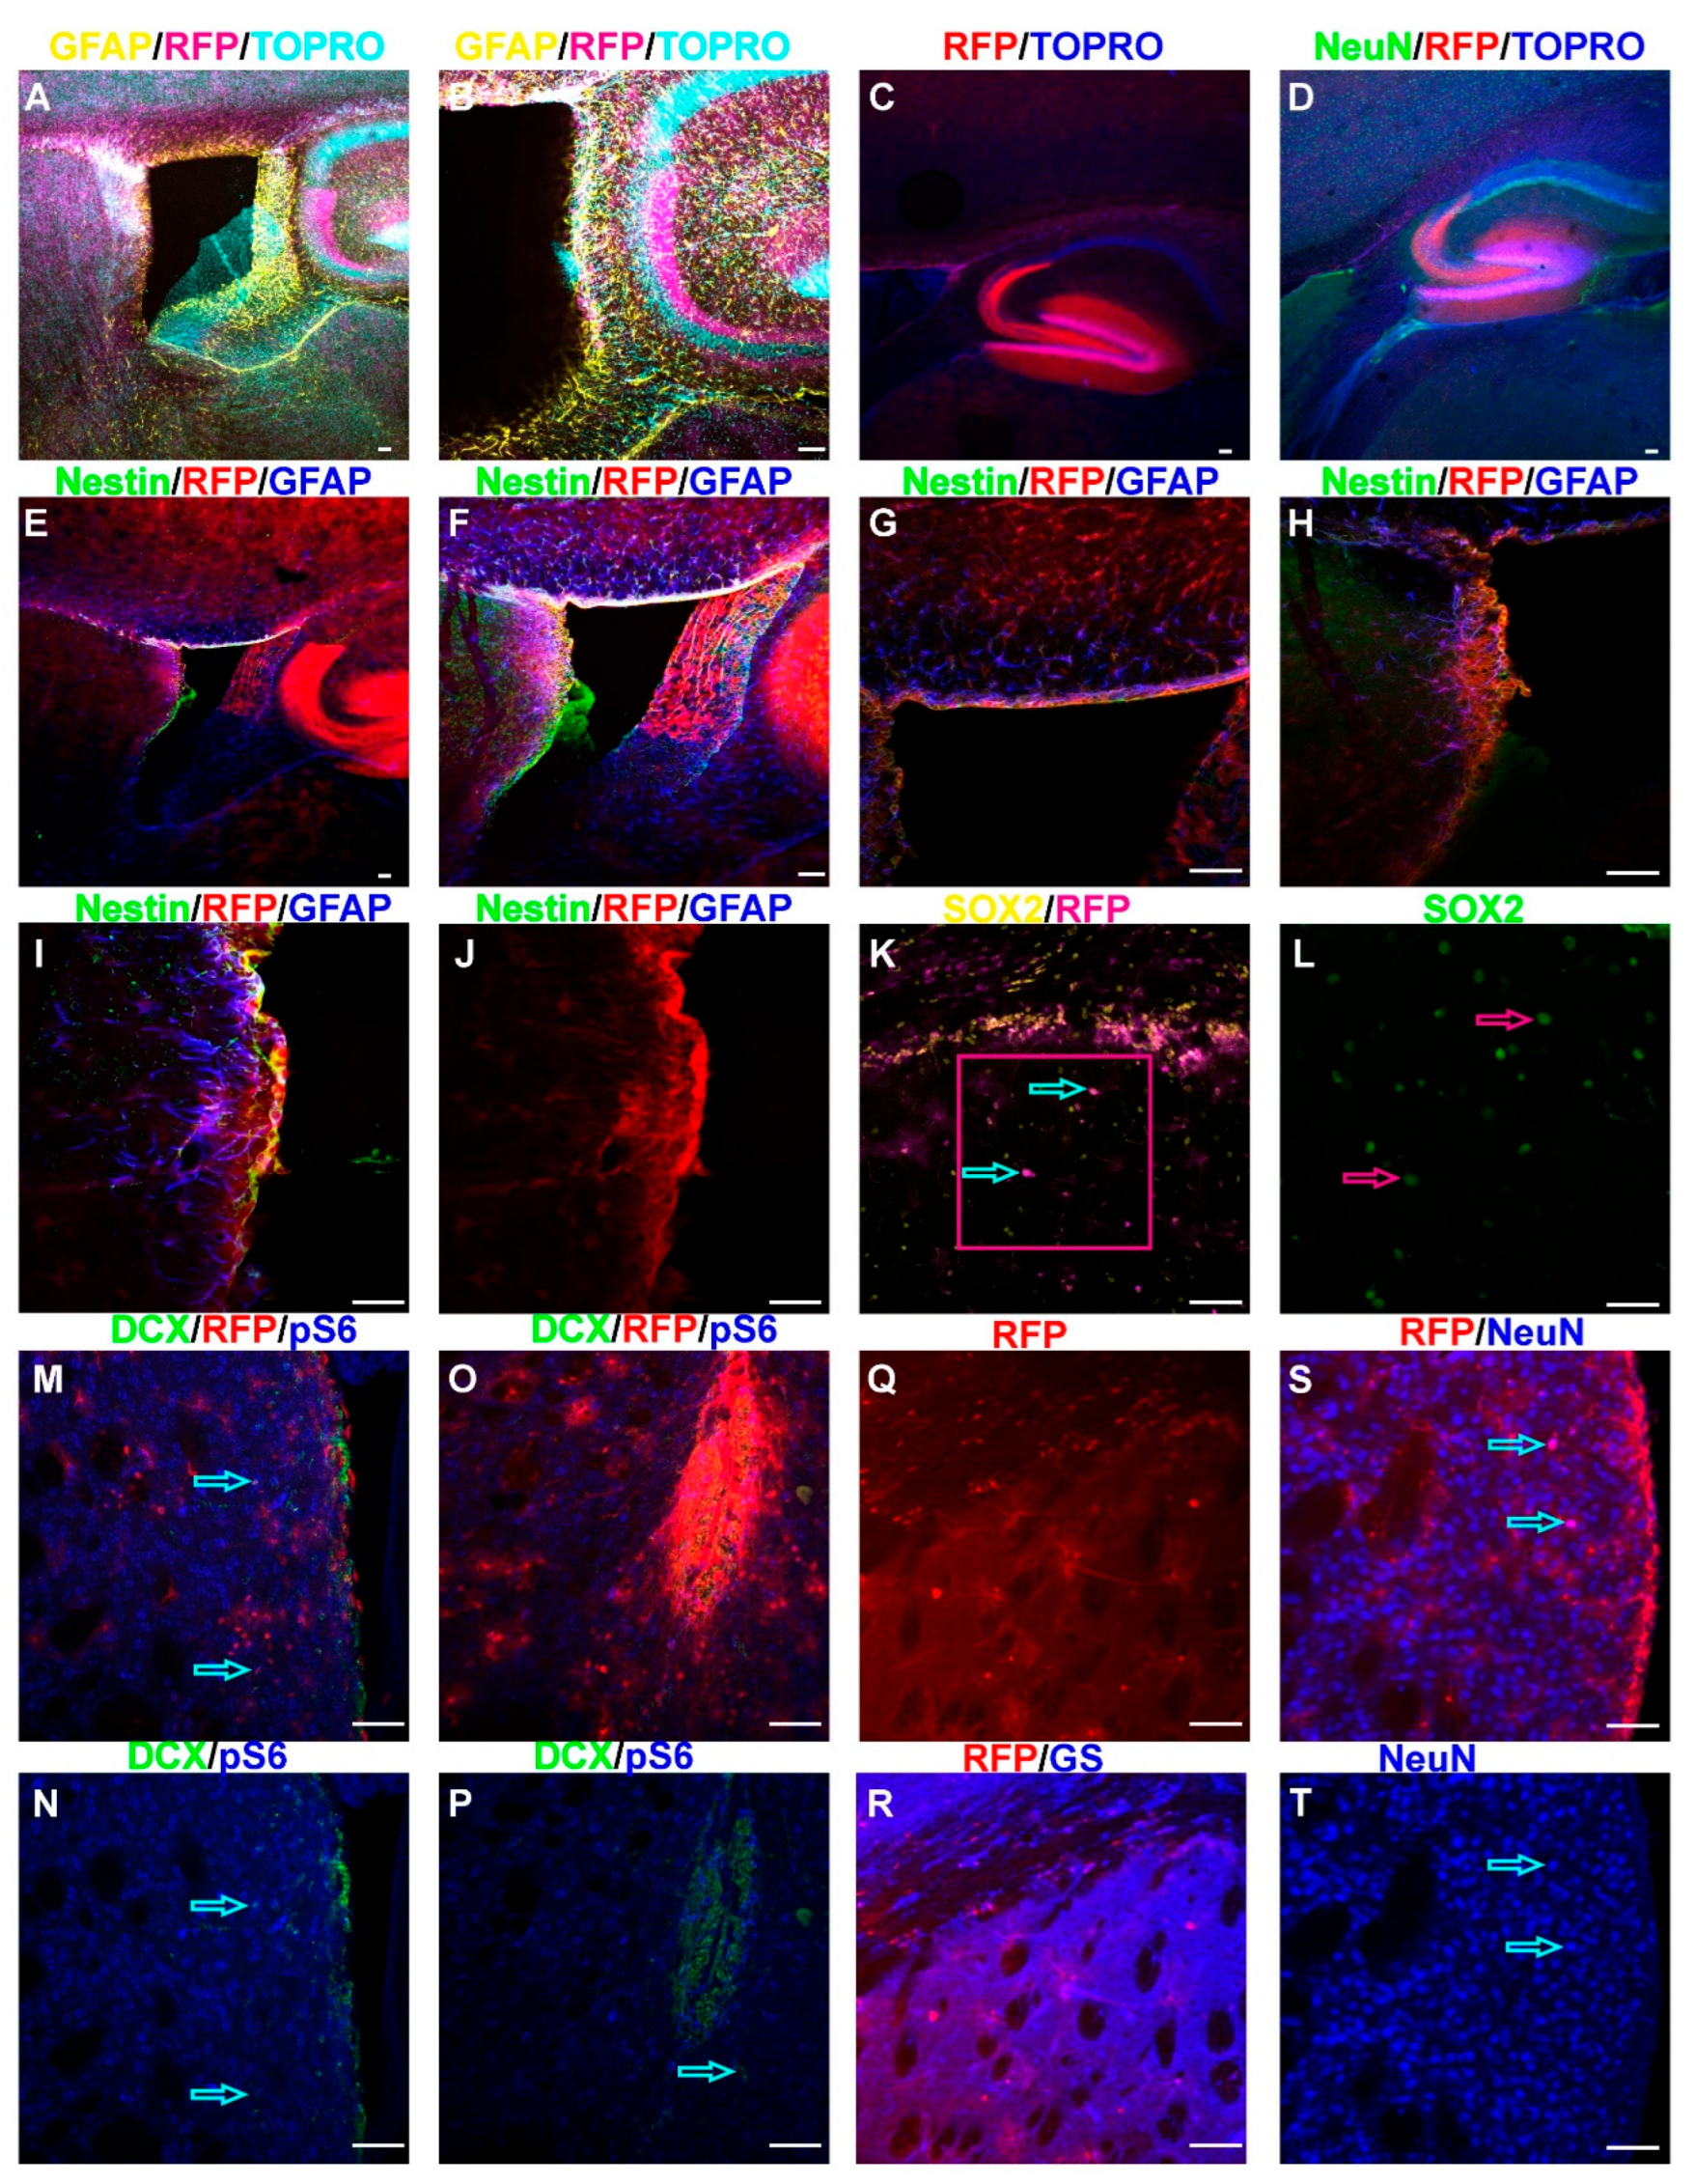
Figure 4.
Loss of Tsc2 Models TSC Brain Pathological Features. A-D. 5× image of coronal section of a P30 Tsc2mut/mut demonstrating RFP (magenta, A.) positive cells forming a lesion in the cerebral cortex. The lesion had sparse neurons indicated by NeuN staining (yellow, B.) although the cortex did not generally appear mislaminated as seen with the counterstain TO-PRO-3 (cyan, C) which labels DNA unless the composite (D) is examined. E, F. 20× image of the lesion in A-D demonstrating that RFP positive (red, E.) giant/balloon cells are also pS6 positive (green, F). G. 5× or (H) 20× image of a sagittal section of a P30 Tsc2mut/mut demonstrating RFP (red) positive cells protruding into the lateral ventricles. I. 5× image of a coronal section of a P30 Tsc2wt/wt brain demonstrating RFP (red) positive cells together with Nestin staining (green) around the ventricle or RFP alone (J) to show organization of the striatum. K. 5× image of a coronal section of a P30 Tsc2mut/mut brain demonstrating RFP (red) positive cells together with Nestin staining (green) or RFP alone (L) to show organization of a typical brain without a lesion. M. 5× or 20× (N) image of a coronal section of a P30 Tsc2mut/mut brain demonstrating RFP (magenta) and NeuN staining (yellow) positive cells and a striatal lesion made of disorganized neurons. O. 5× or 20×(P) image of a coronal section of a P30 Tsc2mut/mut brain demonstrating RFP (magenta) and p4EBP staining (blue) positive cells and a striatal lesion made of disorganized glia-like cells.
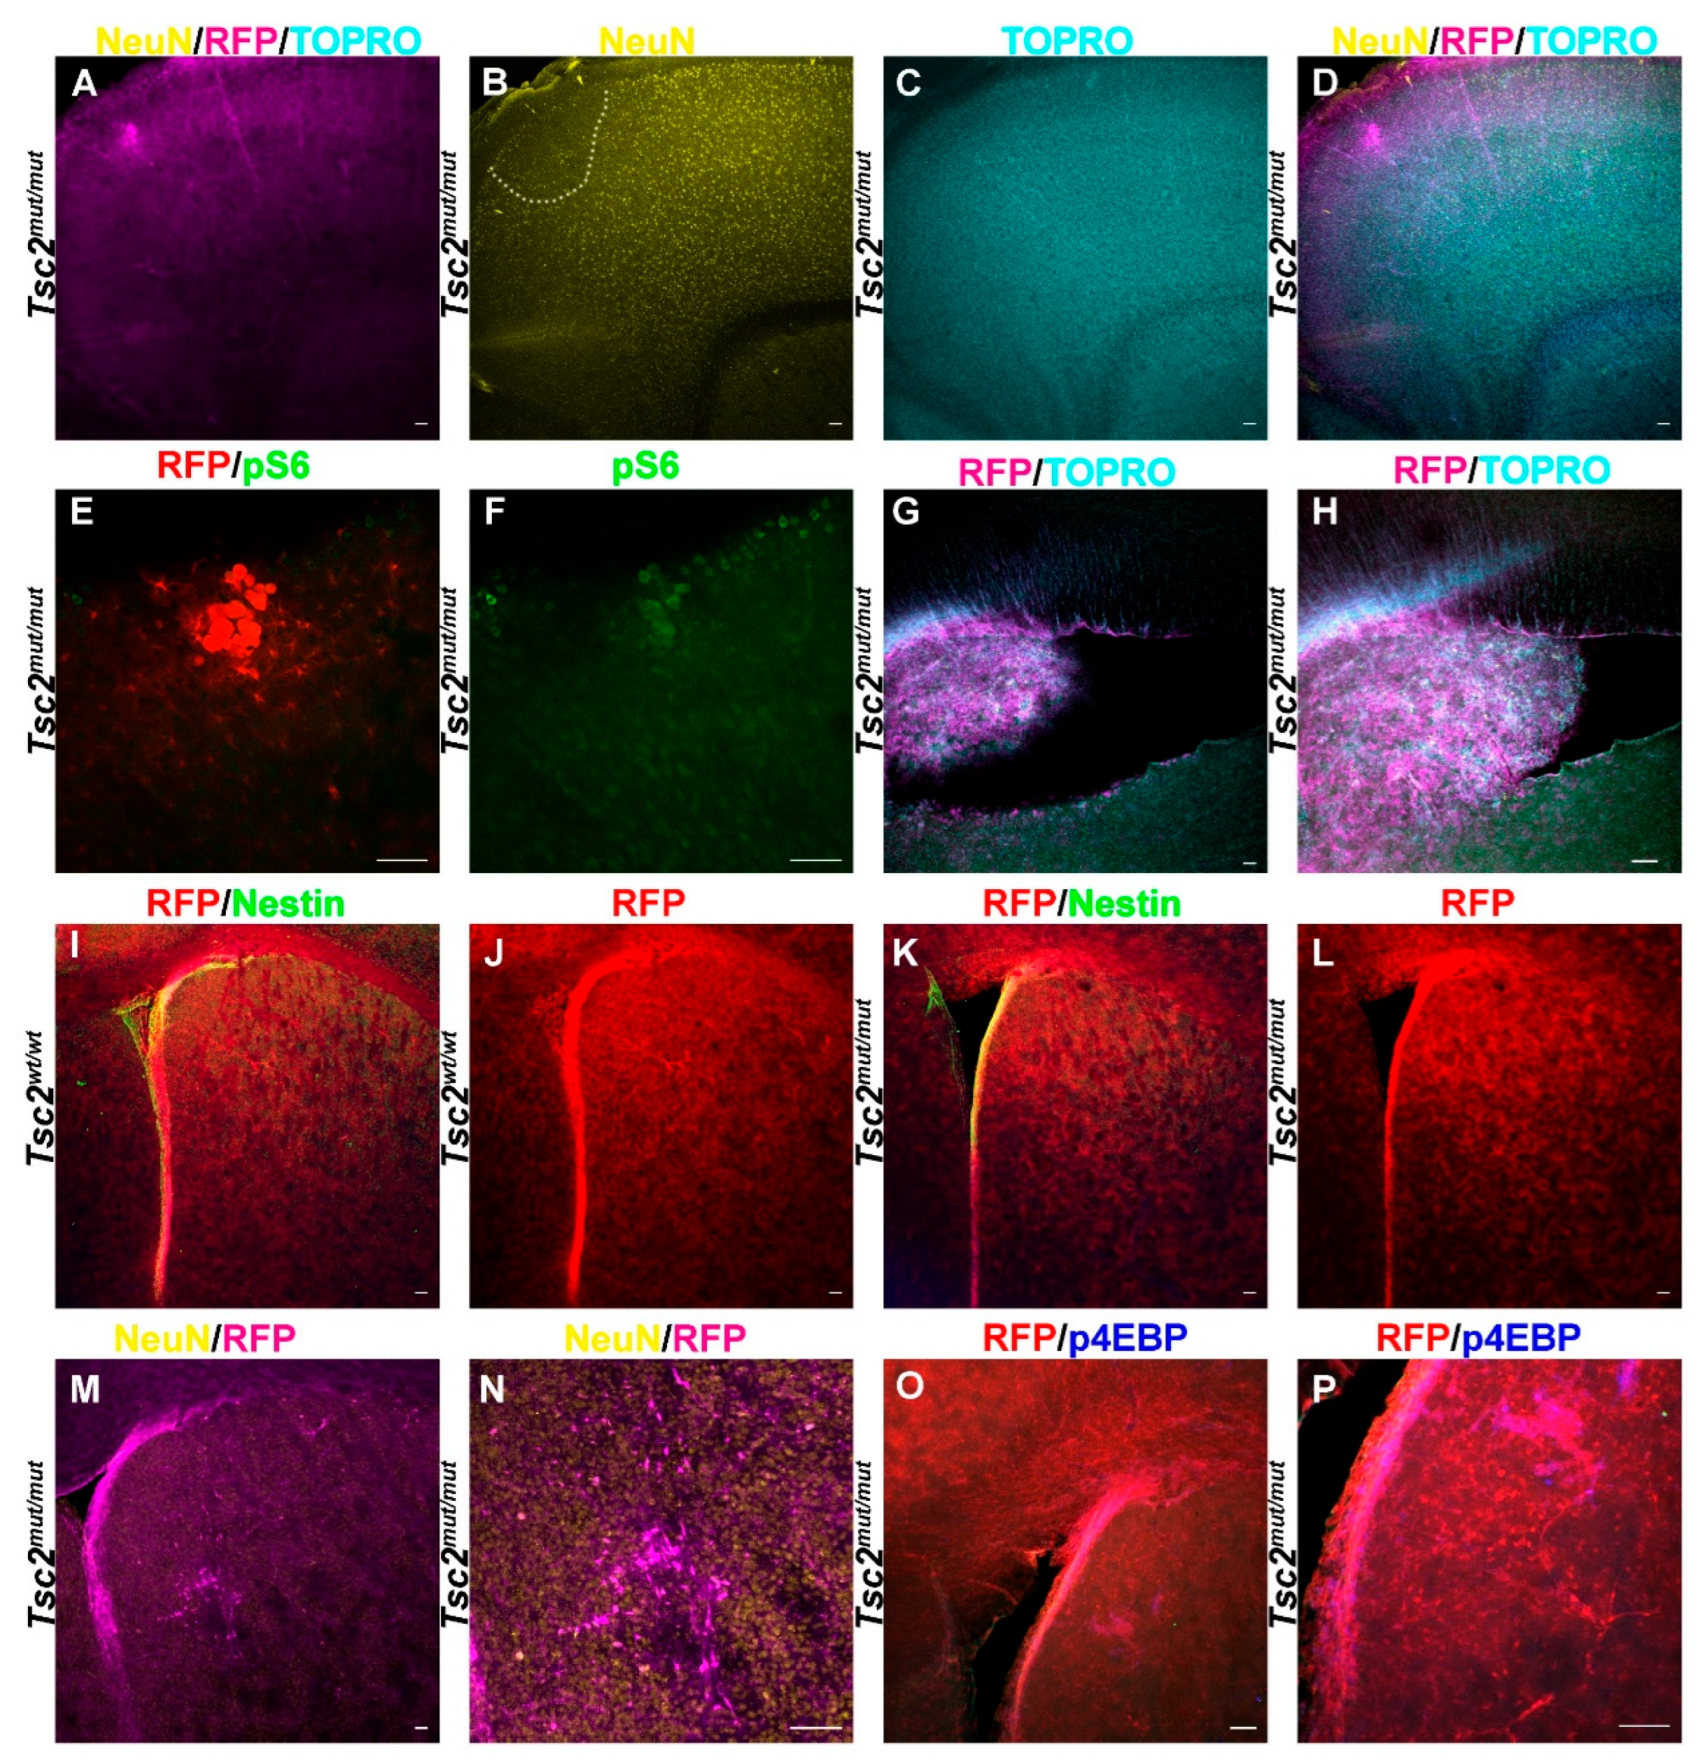
Figure 5.
Neonatal Tsc2 Deletion Alters Cortical Development A-C. 5× coronal sections of Tsc2wt/wt mouse brains showing RFP positive cell distribution in three different mice. D-F. 5× coronal sections of Tsc2mut/mut mouse brains showing RFP positive cell distribution in three different mice. G. Quantification of cortical thickness (N=6 for each genotype). H. Quantification of RFP positive cell distribution from the ventricle to the cortical pial surface demonstrating loss of glia from lower cortical layers (N=6 for each genotype). Scale bar = 50 µm. * denotes p=0.0410.
Disclaimer/Publisher’s Note: The statements, opinions and data contained in all publications are solely those of the individual author(s) and contributor(s) and not of MDPI and/or the editor(s). MDPI and/or the editor(s) disclaim responsibility for any injury to people or property resulting from any ideas, methods, instructions or products referred to in the content. |
© 2025 by the authors. Licensee MDPI, Basel, Switzerland. This article is an open access article distributed under the terms and conditions of the Creative Commons Attribution (CC BY) license (http://creativecommons.org/licenses/by/4.0/).
Copyright: This open access article is published under a Creative Commons CC BY 4.0 license, which permit the free download, distribution, and reuse, provided that the author and preprint are cited in any reuse.


