Submitted:
15 December 2025
Posted:
17 December 2025
You are already at the latest version
Abstract
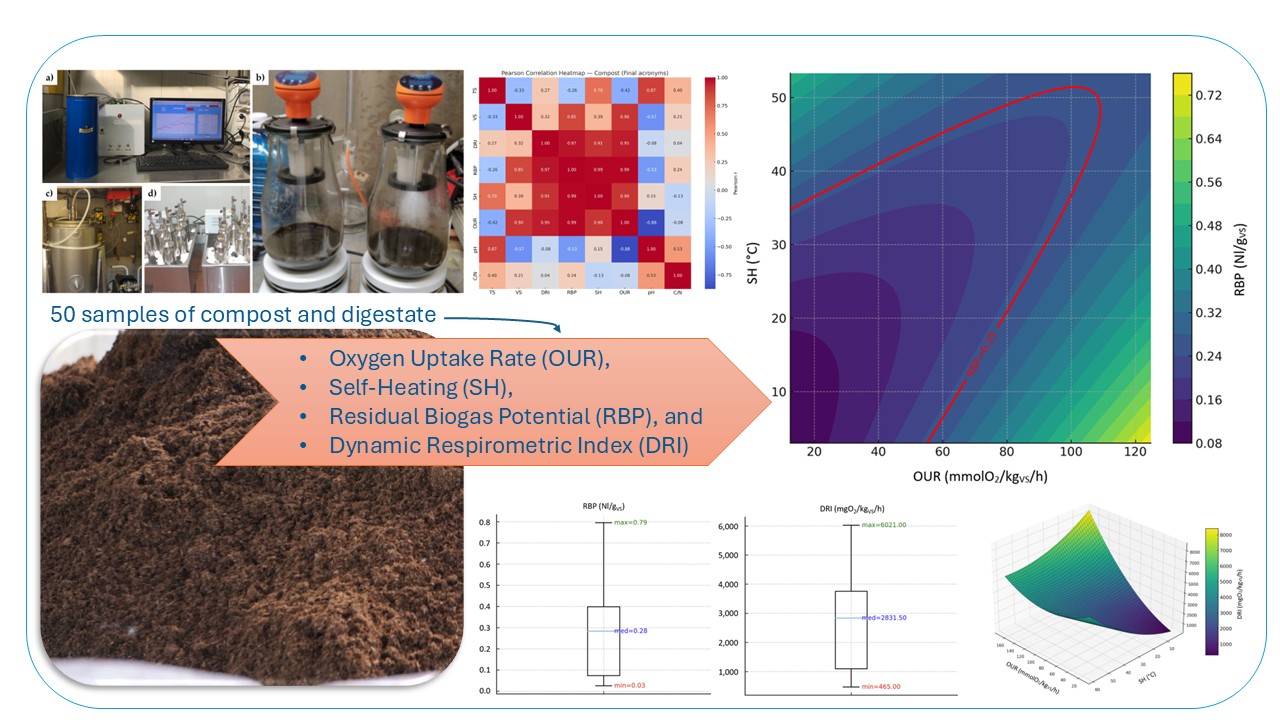
Nowadays, biowaste valorization is a key point in circular economy. Digestate and compost are produced from organic waste treatment and can be used as nutrient-rich fertilizers. In Europe, the use of biowaste-derived fertilizers is promoted by the European Fertilizer Regulation (EU) 2019/1009, which requires verification of their biological sta-bility through regulated indices; however, it is not clear whether the proposed indices and threshold values indicate the same level of stability and what correlations there are be-tween them. This study compared four biological stability indices, namely Oxygen Up-take Rate (OUR), Self-Heating (SH), Residual Biogas Potential (RBP), and Dynamic Respirometric Index (DRI), which were tested on 50 samples of compost and digestate. Overall, results revealed that most of the compost and digestate samples were quite far from European standards, according to OUR, SH and DRI indices. On the contrary, the RBP test seemed to be less stringent than the other indices, since a much larger number of samples was closer to or in compliance with the established threshold. Data analysis us-ing Pearson’s coefficients showed a strong linear correlation between the indices. Nev-ertheless, the linear regression predictive model based on experimental data demon-strated that the indices could not represent the same level of stability, providing poor consistency and variability in the predicted values and established threshold. In partic-ular, the DRI test appeared to be more severe than the other aerobic indices. The results obtained suggest revising the biological stability indices and threshold values, depending on the type of matrix.
Keywords:
biological stability index
; organic waste
; biowaste
; digestate
; compost
; circular economy
1. Introduction
Nowadays, biowaste management is a crucial point in political strategies of sustainable development and circular economy [1,2]. Annually, biowaste production in the European Union ranges from 118 to 138 million tons; among these, around 88 million tons come from municipal waste and 30-50 million tons from industrial sources, such as food processing facilities. Biowaste constitutes 30-40% of municipal solid waste (MSW), although it can vary from 18% to 60% [3]. In this context, digestate and compost can be produced from the treatment of organic waste through the anaerobic digestion and composting processes, respectively, representing valuable organic fertilizers rich in nutrients [4,5].
The use of digestate and compost from biowaste is regulated by the European Fertilizer Regulation (EU) 2019/1009 [6], which aligns with the broader goals of the EU Action Plan for the Circular Economy and the Bioeconomy Strategy, emphasizing the importance of sustainable use of resources by minimizing waste and environmental impact [7]. According to the above-mentioned regulation, it is necessary to verify the biological stability of compost and digestate before their application in agriculture by appropriate indices, which should certify their suitability in terms of human and environmental safety [8,9], while providing information to plant operators about process performance [10]. Indeed, biological stability is defined as the degree of decomposition of biodegradable organic matter and reflects the material’s potential for further microbial activity. Stable compost or digestate minimizes odour generation, phytotoxicity, pathogen regrowth, and greenhouse gas emissions during its storage and application [7,11]. In addition, it is worth noting that biological stability indices are mentioned in end-of-waste (EoW) [3] and for EU Ecolabel guidelines [12], which identify the process or set of processes that cause a waste to cease being a waste and multi-criteria label certifying excellent environmental performances for a product throughout its life-cycle, respectively.
Recent analyses of compost and digestate quality standards have also highlighted that European countries adopted heterogeneous stability methods and threshold values, leading to non-equivalent interpretations of biological stability[3,13,14,15]; this variability further complicates the harmonization of criteria under the EU Fertilizer Regulation. Prasad and Foster (2023) showed that OUR, RBP and self-heating tests often lead to divergent classifications of stability, emphasizing the need for clearer and more consistent evaluation frameworks across Europe[15]. Anyway, it is not clear whether the proposed indices and threshold values indicate the same level of stability and what correlations there are between them. Therefore, this study compared four biological stability indices, namely Oxygen Uptake Rate (OUR), Self-Heating (SH), Residual Biogas Potential (RBP), and Dynamic Respirometric Index (DRI), which were tested on 50 samples of compost and digestate collected from different organic waste treatment plants in Italy, according to the EU Fertilizer Regulation [11,16]. Digestate and compost are classified by the EU Fertilizer Regulation as Component Material Categories (CMCs): CMC3 refers to compost, while CMC5 refers to digestate (other than fresh crop digestate). Each category must satisfy at least one stability criterion, based on standardized methods. For compost (CMC3), either OUR or SH test is required; on the other hand, either OUR or RBP test may be applied for digestate (CMC5)[13].
Specifically, OUR measures the rate of oxygen consumption by microorganisms in the compost or digestate samples, indicating their metabolic activity and biological stability[17]. The SH or Dewar test evaluates the propensity of compost or digestate samples to undergo spontaneous heating due to microbial activity, providing insights into their biological activity and maturity[8]. RBP assesses the remaining biogas production potential of compost or digestate samples, indicating the extent of organic matter degradation and biological stability achieved during the composting or anaerobic digestion process[18]. DRI is a comprehensive index that integrates various parameters such as oxygen consumption rate, temperature, and moisture content to assess the overall biological stability and maturity of compost and digestate samples [19]. It should be noted that DRI is only used at the national level in Italy (according to the Legislative Decree No. 75 of April 29, 2010) [20,21,22]; however, it was considered as a further parameter for comparison with European standards.
In the literature, many authors have dealt with this topic, testing several physical, chemical, and biological indices. The DRI was evaluated as a descriptor of the biological stability of organic waste and compost in [22,23,24]. Biological and thermoanalytical indices were applied to assess the stability of 15 compost end-products in [25] A massive estimation of indices suitable for the measurement of biological stability of the organic matter content in solid waste samples was carried out by [26].
Compared different waste stability indices for mechanical–biological waste treatment and composting plants [27] . According to the authors, each of the above studies found good correlations between the tested indices.
In our knowledge, no studies have compared the biological stability indices, based on the European Fertilizer Regulation (EU) 2019/1009. This work could provide valuable support for the European governments in improving evaluation criteria and promoting compost and digestate use as organic fertilizers in agriculture, from a circular economy perspective.
2. Materials and Methods
2.1. Experient Description and Sample Characterization
OUR, SH, RBP, and DRI stability indices were tested on 50 samples (25 of digestate and 25 of compost), which were collected from different Italian organic waste treatment plants.
In the following sections, the procedure and instrumentation used for the calculation of the biological stability indices are described. Results obtained on digestate and compost samples were compared with the standard limits; in particular, the European Fertilizer Regulation (EU) 2019/1009 admits a maximum value of 25 mmolO2/kgVS/h and 0.25 Nl/gVS for OUR and RBP, respectively, while SH must reach at least a level of III, defined on the basis of the Rottegrad classification (Table 1). On the other hand, a maximum value of 1000 mgO2/kgVS/h is allowed by Italian Regulation for DRI.
2.1.1. Self-Heating (SH)
The SH or Dewar test is an indirect measure of the aerobic biological activity of organic solid materials with size smaller than 10 mm. This method is based on measuring the maximum temperature reached by the biomass placed in a vessel under standardized conditions for days, according to [28].
The experimental equipment consists of an adiabatic 2-L vessel (Dewar’s vessel), two thermocouples and a data acquisition system (Figure 1a). About 1.0–1.5 kg of organic material was placed into the vessel after sieving (with a 10 mm sieve) and the optimal moisture content (around 35% w/w) for the biological activity was set, according to the Technical Regulation UNI/EN 16087-2:2012[29]. Two T-type thermocouples continuously recorded room and biomass temperatures. One thermocouple was placed in the working environment, while the other was placed halfway up the vessel. All signals from thermocouples were acquired and processed by a cRIO 9030 data acquisition system (National Instruments, Austin, TX, USA).
During the experimental time, the temperature increased due to the exothermic trend of the biological degradation process. Experimental tests were stopped when the biomass temperature continuously decreased for two days, after reaching the maximum value. According to this procedure, the experimental time might vary from 5 to 10 days. The decomposition rate was calculated by measuring the difference between the maximum biomass temperature and the ambient temperature. The degree of biological stability of the tested material was determined according to the Rottegrad classification, proposed by the U.S. Composting Council in 1997 (Table 1). SH was measured in duplicate for each sample [28].
2.1.2. Oxygen Uptake Rate (OUR) Test
Aerobic stability tests for OUR determination were carried out by using Oxitop-IDS instrumentation, developed by WTW GmbH (Figure 1b). Oxitop instrumentation allows us to calculate the OUR by determining the oxygen demand for the biological oxidation (BOD-Biological Oxygen Demand) of the organic material. BOD calculation is based on pressure measurements (differential measurement), using a piezo-resistive electronic pressure sensor (Hagman and Box, n.d.), as described by the standardized methodology UNI EN 16087-1: 2012.
Samples were sifted with 10 mm sieve the samples were sieved with a 10 mm sieve to evaluate the amount of residual material: samples showing a residual material amount greater than 20% were considered unsuitable for testing. Suitable samples were instead tested by filling in a glass reactor (vessel) based on the TS and VS content; specifically, the following volumes were added:
- 180 ml of demineralized water,
- 10 ml of a complete nutrient solution,
- 10 ml of buffer solution,
- 5 ml of ATU solution.
Open vessels were stirred (250 rpm) and kept in contact with the air from 4 to 8 hours. At the end of this time, vessels were closed and sealed through the OxiTop head and the special hooks. Tests were then carried out in duplicate for a total duration of 7 days [30]. The calculation of oxygen consumption, evaluated in mmol O2 per kg of organic material (%TVS/TS), was determined by the decrease in pressure at the reactor's headspace, according to the following formula (eq. 1):
Where:
- OC is the oxygen consumption [mmolO2 per kg of organic matter].
- ΔP is the change in pressure in the reactor's headspace [kPa].
- R is the gas constant [8.314 l ∙ kPa K−1 mol−1].
- T is the test temperature [°C].
- W is the initial mass of the sample [kg].
- DM is the dry matter content [% by weight].
- OM is the organic matter content [%TVS/TS].
- Vgas is the volume of the gas phase in the reactor [ml].
2.1.3. Dynamic Respirometric Index (DRI) Test
DRI analysis was carried out using stainless steel adiabatic reactors with a capacity of 30 liters each, according to UNI / TS 11184: 2016 [31]standard. The experimental apparatus consists of two continuous flow aerobic respirometers, filled with approximately 20 kg of sample (Figure 1c). Before starting the analysis, sample parameters such as humidity, density, and pH were standardized according to the guidelines of reference [21].
To establish ideal conditions, the sample is subjected to continuous blowing of dry air from a compressor. Airflow was measured using two flowmeters (Aalborg Instruments), which were positioned at the inlet and outlet of the system. During the analysis, the inlet air flow was regulated by the flow meter to maintain an oxygen concentration in the exhaust air above 14%.
Special probes were installed at the outlet of the system to measure oxygen (Zirconium oxide sensor, TEC-ZRC, Tecnosens SpA) and CO2 concentrations (GasCard NG Gascheck 10%, Edinburgh Sensors) in the exhaust airflow. The reactors are externally coated with a water jacket heated by a thermostat (FA90, FALC instruments), to ensure that the adiabatic conditions of the system are maintained. The temperature of the incoming flow, the outgoing flow, the environment, and the biomass subjected to the process were monitored through the installation of thermocouples. The sensor signal installed in respirometric reactors was managed and acquired by a National Instrument acquisition system and developed by software (LabView environment).
DRI value was measured in accordance with [19], representing the average hourly index, measured during the 24 hours when biomass breathing is highest.
2.1.4. Residual Biogas Potential (RBP) Test
The RBP production can be evaluated through anaerobic biodegradability assays, as well as the biomethane potential (BMP) production can also be estimated through the composition of the generated biogas. The tests were conducted in triplicate for each sample, and the production of biogas was measured after 28 days (RBP28 and BMP28). The experiments were performed using 1-L stainless steel batch reactors (Figure 1d) [11]. These reactors were maintained at a constant temperature of 37 +0.1°C in a water bath controlled by a thermostat (FA90, FALC Instruments, Treviglio, Italy). Each reactor was filled with the sample mass and mixed with inoculum (collected from an anaerobic digester processing OFMSW and cattle manure), considering a VS mass ratio of 1.5:1.
The reactors were sealed with a ball valve cap to facilitate gas sampling. Before starting the experiment, each reactor was flushed with nitrogen gas to ensure anaerobic conditions [32]. Biogas production was measured by evaluating the pressure in the reactor headspace using a membrane pressure gauge (Model HD2304.0, Delta Ohm S.r.l., Selvazzano Dentro, Italy). This pressure was then converted into the residual biogas potential (RBP28) volume, which represents the cumulative biogas production over the entire experimental period [33].
2.2. Predictive Model and Analytical Relationships Between the Analyzed Indices
Based on experimental data obtained from biological stability indices of compost and digestate samples, Pearson's correlation coefficient (r) was used to measure the strength and direction of the linear relationship between any pair of indices. A value of +1 indicates a perfect positive correlation, -1 indicates a perfect negative correlation, and 0 indicates no linear correlation[36,37].
The calculation of the correlation coefficient for two variables (hereinafter referred to as X and Y) was carried out as follows [38]:
- Standardization of the variables X (zX) and Y (zY), which are reexpressed to have means equal to 0 and standard deviations (s.d.) equal to 1 (eq. 2 and eq. 3).
zXi = [Xi – mean (X)]/ s.d. (X)
zYi = [Yi – mean (Y)]/ s.d. (Y)
- Calculation of the correlation coefficient as the mean product of the paired standardized scores, considering sample size n (eq. 4)
rx,y = sum of [zXi · zXi] / (n-1)
In addition, to compare the stability levels obtained by different indices, predictive models were developed for three datasets (compost, digestate and all combined samples), using a second-order polynomial regression.
Based on experimental data, two group models were developed:
- Relationship Between RBP, OUR, and SH, representing a comparison between the biological stability indices permitted by European Fertilizer Regulation (EU) 2019/1009.
The considered key variables were OUR (mmolO₂/kgVS/h), SH (°C) and RBP (Nl/gTVS). A second-order polynomial regression was implemented according to the following form (eq. 5):
RBP = β₀ + β₁ · OUR + β₂ · SH + β₃ · OUR² + β₄ · SH² + β₅ · (OUR · SH)
- 2.
- DRI as a function of OUR and SH, representing a comparison between biological stability indices conducted under aerobic conditions.
DRI (mgO₂/kgVS/h) was the dependent variable, while OUR (mmolO₂/kgVS/h) and SH (°C) were the predictors, fitting the quadratic model as follows (eq. 6):
DRI = β₀ + β₁ · OUR + β₂ · SH + β₃ · OUR² + β4 · SH² + β5 · (OUR · SH)
Models were fitted using the least squares method implemented in Python’s scikit-learn library. The fit quality was assessed by the coefficient of determination (R²) and Root Mean Square Error (RMSE).
3. Results and Discussion
3.1. General Insights from the Analysis of Biological Stability Indices
Biological stability indices revealed significant variations in both compost and digestate samples, confirming strong heterogeneity in collected samples. Figure 2 and Figure 3 show the results obtained from the application of biological stability indices on compost and digestate samples, highlighting a wide range of values in all the indices analyzed.
Indeed, collected samples exhibited heterogeneous characteristics. Table 2 provides a comprehensive overview of the main physical and chemical parameters for digestate and compost, namely total solids (TS), volatile solids (VS), pH and carbon-to-nitrogen (C/N) ratio, showing a wide variability in the measured values.
3.1.1. Biological Stability Indices on Compost Samples
As shown in Figure 2a, the OUR test found a maximum value of 275 mmolO2/kgVS/h (11 times higher than the regulatory limit), as well as the average value of the analyzed samples was quite far from the threshold value of 25 mmolO2/kgVS/h.
As regards the SH test (Figure 2b), some samples obtained the level indicating the highest degree of stability according to the Rottegrad scale (level V, 0 – 10°C, Table 1); however, most of the samples did not comply with the minimum regulatory standard (level III, 20-30°), since the average value of the samples was on the lowest grade of the Rottegrad scale, which indicates a compost that is still fresh (level I, 40-50°C).
Concerning the RBP test (Figure 2c), a maximum value more than 3 times higher than the standard limit (0.25 Nl/gVS) was found; however, the average value obtained (0.28 Nl/gVS) is slightly higher than the threshold established by the European Fertilizer Regulation (EU) 2019/1009, indicating that most of the samples have complied with the regulatory threshold.
Finally, the DRI test (Figure 2d) reported values up to 6 times higher than the standard limit (1000 mgO2/kgVS/h); also, the average value of the samples (2831.5 mgO2/kgVS/h) is well above the maximum established level.
In this case, the results obtained showed that the OUR, SH and DRI indices were more in agreement with each other, showing that most of the compost samples were quite far from the stability requirements of the European Fertilizer Regulation (EU) 2019/1009. On the contrary, the RBP test seemed to be less stringent than the other indices, since the average value of the samples was found to be not far from the established threshold.
3.1.2. Biological Stability Indices on Digestate Samples
Figure 3a shows the results of the OUR test on digestate samples, marking maximum values about 5 times higher than the standard limit (25 mmolO2/kgVS/h), as well as the average value (57 mmolO2/kgVS/h) was much higher than the required threshold.
The SH test (Figure 3b) showed that a few digestate samples reached Level I (40–50 °C, Table 1) of the Rottegrad classification, indicating the lowest degree of biological stability. However, most samples fell within Level III (20–30 °C), which represents the minimum stability level required by the European Fertilizer Regulation. This is consistent with the average temperature rise (24 °C), suggesting that digestate generally exhibits moderate biological activity and acceptable stability under aerobic conditions.
Regarding the RBP test (Figure 3c), the maximum value detected was only slightly above the regulatory limit (approximately 1.4 times higher). More importantly, the average RBP value (0.17 Nl/gVS) was well below the threshold set by the European Fertilizer Regulation (0.25 Nl/gVS), indicating that most digestate samples displayed limited residual anaerobic biodegradability and complied with the normative requirement.
Conversely, the DRI test (Figure 3d) showed maximum values up to 4.4 times higher than the limit of 1000 mgO₂/kgVS/h. Although the mean DRI value (1252 mgO₂/kgVS/h) was closer to the threshold than the maximum value, it still exceeded the regulatory limit, highlighting residual aerobic biodegradation potential in several samples. Compared with compost, digestate exhibited lower maximum values across all indices and average values generally closer to their respective thresholds. SH and RBP confirmed good compliance with regulatory criteria, whereas OUR and DRI frequently exceeded the allowed limits, reinforcing the inconsistency between indices and the difficulty of deriving a uniform stability assessment across different methodologies.
3.2. Pearson's Correlation Coefficient r
Figure 4 shows Pearson correlation heatmap. Pearson coefficient (r) was calculated to identify potential linear relationships between the biological stability indices (i.e. OUR, SH, RBP, DRI) and the main chemical-physical parameters (i.e. TS, VS, pH, C/N ratio) for compost (Figure 4a) and digestate (Figure 4b) samples.
A high degree of correlation was found between the biological stability indices, as the r-coefficient ranged from 0.82 to 0.99, indicating a strong linear relationship between the analyzed variables. Indeed, according to [38], values between 0.70 and 1.0 (−0.70 and −1.0) indicate a strong positive (negative) linear relationship.
Compost samples obtained very high correlations (Figure 4a), as the r-coefficient ranged from 0.90 (coefficient r between SH/OUR) to 0.99 (coefficient r between SH/RBP and OUR/RBP). Digestate samples achieved lower correlation coefficients than compost samples (Figure 4b); however, the value of the coefficient r in digestate samples still fell into a high range, varying from 0.82 (coefficient r between SH/OUR, RBP/OUR and RBP/DRI) to 0.93 (coefficient r between SH/DRI).
In the case of digestate samples, it should be emphasized that the lowest values of the r-coefficient were obtained from the correlations between the RBP index with OUR and DRI indices, although they still have strong correlations (> 0.70). As is well known, digestate is the solid and liquid residue of the anaerobic digestion of organic matter[39]. The RBP test assesses the potential production of residual methane (i.e. the amount of biogas that can potentially still be produced from residual matter) and is conducted under anaerobic conditions[11,18]. Contrary, the OUR and DRI indices evaluate the decomposition of organic matter in the presence of oxygen and are conducted under aerobic conditions[17,40,41]. Therefore, the lower correlation between these indices could indicate that aerobic indices are less suitable in assessing the degree of stability and biodegradability on anaerobic matrices[41].
Finally, as regards the chemical-physical parameters, weak positive/negative (values between 0 and 0.3/-0.3) or moderate positive/negative (values between 0.3/-0.3 and 0.7/-0.7) linear relationships were generally found. Specifically, the few strong correlations were obtained in compost samples for the following pairs of variables: pH/OUR (-0.88), pH/TS (0.87), VS/OUR (0.9), VS/RBP (0.85) and TS/SH (0.7). On the other hand, no strong correlations related to chemical-physical parameters were observed in digestate samples.
3.3. Second-Order Polynomial Regression Predictive Model
3.3.1. Overview of Predictive Model Equations
To predict and compare the stability levels obtained by different indices, second-order polynomial regression models were developed, considering two group models. The first group model evaluated the relationship between RBP, OUR, and SH, which are the biological stability indices regulated at European level, using RBP as target index. The second group evaluated the relationship between DRI, OUR, and SH, representing a comparison between biological stability indices conducted under aerobic conditions and considering DRI as target index, which is an index permitted by the Italian legislation. In addition to compost and digestate, predictive models were developed considering all sample datasets, since the standard does not distinguish stability levels according to the type of matrix [22,23,24,26]. Model results for DRI and RBP, predicted as functions of OUR and SH, are listed in Table 3. The table summarizes all six second-order polynomial regression models fitted on the analyzed dataset. R² indicates the proportion of variance explained, and RMSE (Root Mean Squared Error) quantifies the average prediction error.
As highlighted, regression models showed that OUR and SH are strong predictors for both RBP and DRI in compost dataset, which exhibited the highest R² (> 0.96) and lowest RMSE. Digestate and all datasets displayed greater variability, indicating more complex dynamics. Model equation for RBP in digestate dataset exhibited a very low R² (0.6), indicating poor predictive ability. However, in the other cases, the R2 value was still high or acceptable, since it was between 0.84 and 0.96.
3.3.2. Relationship Between RBP, SH and OUR (Compost Dataset)
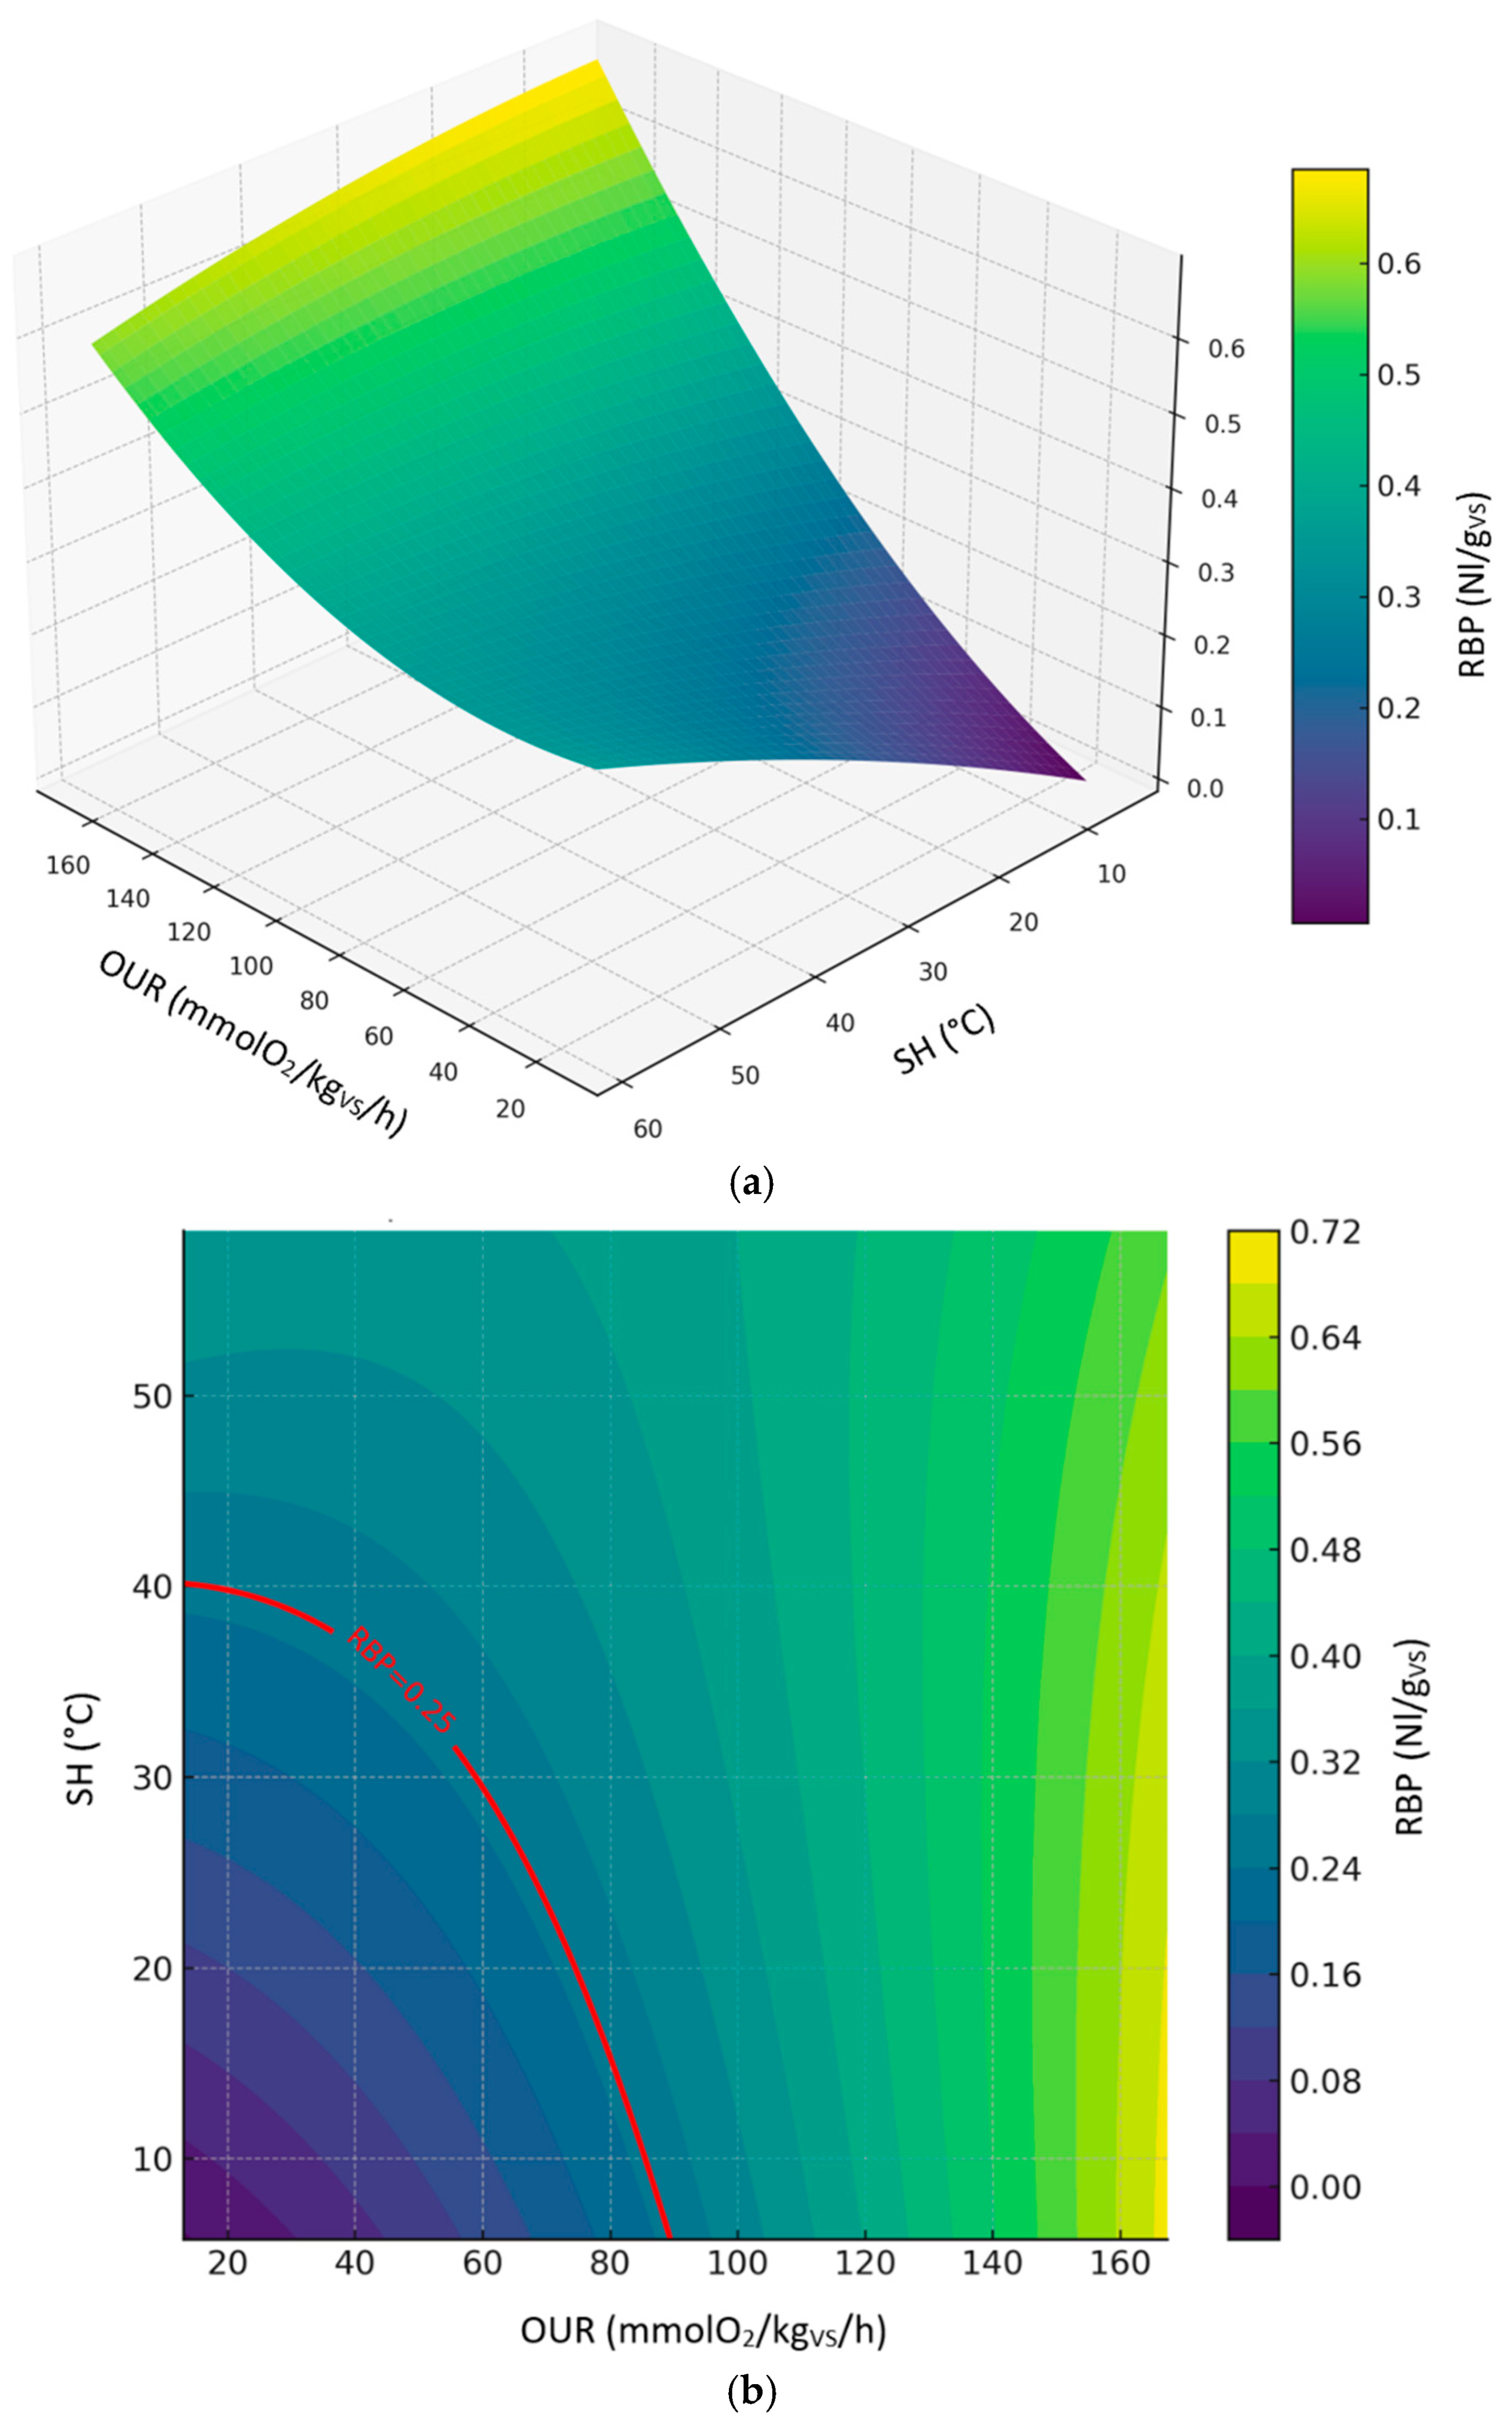
Figure 5 shows the 3d (Figure 5a) and 2d (Figure 5b) contour plots of the second-order polynomial regression model on the relationships between RBP, SH and OUR considering compost dataset. The compost model achieved an excellent fit (R² ≈ 0.96, Table 3), suggesting a well-defined quadratic response surface. RBP increased with OUR and SH up to intermediate levels, followed by a decline likely due to microbial oxidation and stabilization (Figure 5a). According to the prediction model, the values of OUR and SH corresponding to the threshold limit of RBP (0.25 Nl/gVS) ranged from ≈ 13.1 to 90.1 mmolO₂/kgVS/h and ≈ 5.7 to 40.5 °C, respectively (Figure 5b). Predicted levels by the model showed great variability in the expected results, reaching biological stability values outside the thresholds established by the European Fertilizer Regulation (EU) 2019/1009.
3.3.3. Relationship Between RBP, SH and OUR (Digestate Dataset)
Figure 6 shows the 3d (Figure 6a) and 2d (Figure 6b) contour plots of the second-order polynomial regression model on the relationships between RBP, SH and OUR considering digestate dataset. The digestate model showed lower predictive strength (R² ≈ 0.60, Table 3), reflecting higher variability in the dataset. While OUR had a positive influence on RBP, the interaction with SH introduced nonlinearity and possible inhibitory effects (Figure 6a). According to the prediction model, the values of OUR and SH corresponding to the threshold limit of RBP (0.25 Nl/gVS) ranged from ≈ 12.6 to 112.1 mmolO₂/kgVS/h and ≈ 3.0 to 52.7 °C, respectively (Figure 6b). Predicted levels by the model showed great variability in the expected results, reaching biological stability values outside the thresholds established by the European Fertilizer Regulation (EU) 2019/1009.
3.3.4. Relationship Between RBP, SH and OUR (All Sample Datasets)
Figure 7 shows the 3d (Figure 7a) and 2d (Figure 7b) contour plots of the second-order polynomial regression model on the relationships between RBP, SH and OUR considering all sample datasets. The global model demonstrated a strong correlation between RBP, OUR, and SH, explaining approximately 80% of the data variance. RBP increased moderately with SH and OUR, but excessive oxygen uptake appeared to limit RBP (Figure 7a). According to the prediction model, the values of OUR and SH corresponding to the threshold limit of RBP (0.25 Nl/gVS) ranged from ≈ 12.6 to 114.6 mmol O₂/kgVS/h and ≈ 3.0 to 45.2 °C, respectively (Figure 7b). Predicted levels by the model showed great variability in the expected results, reaching biological stability values outside the thresholds established by the European Fertilizer Regulation (EU) 2019/1009.
3.3.5. Relationship Between DRI, SH and OUR
The following figures display the 3d and 2d contour plots of the second-order polynomial regression model on the relationships between DRI, SH and OUR considering compost dataset (Figure 8), digestate dataset (Figure 9) and all sample datasets (Figure 10).
Predicted levels by the model showed great variability in the expected results; however, it is worth noting that the DRI seemed to be a more severe index than OUR and SH. Predicted values of OUR and SH corresponding to the threshold limit of DRI (1000 mgO2/kgVS/h) are summarized in table 4, based on the second-order polynomial regression model. In this case, compared to the models discussed in the previous sections, the maximum values obtained for the OUR are much lower and closer to the threshold limit (25 mmol O₂/kgVS/h); on the other hand, the maximum SH values are always below 30°C, thus indicating a level of biological stability that complies with the established standards of the European Fertilizer Regulation (EU) 2019/1009 .

Table 3.
Predicted values of OUR and SH corresponding to the threshold limit of DRI (1000 mgO2/kgVS/h), based on the second-order polynomial regression model.
Table 3.
Predicted values of OUR and SH corresponding to the threshold limit of DRI (1000 mgO2/kgVS/h), based on the second-order polynomial regression model.
| Dataset |
OUR min (mmol O₂/kgVS/h) |
OUR max (mmol O₂/kgVS/h) |
SH min (°C) |
SH max (°C) |
| Compost | 12.6 | 42.7 | 3.0 | 17.5 |
| Digestate | 13.1 | 35.3 | 5.7 | 20.2 |
| All sample | 12.6 | 44.1 | 3.0 | 19.8 |
5. Conclusions
This study compared four biological stability indices – OUR, SH, RBP and DRI - which were tested on 50 samples of compost and digestate collected from different organic waste treatment plants in Italy. In addition, Pearson's coefficients and second-order polynomial regression model were developed to measure the strength and direction of the linear relationship between any pair of indices and compare the stability levels obtained by different indices. Overall, results revealed that most of the compost and digestate samples were quite far from European standards, according to OUR, SH and DRI indices. On the contrary, the RBP test seemed to be less stringent than the other indices, since a much larger number of samples was closer to or in compliance with the established threshold. Data analysis using Pearson’s coefficients showed a strong linear correlation between the indices. Nevertheless, the linear regression predictive model based on experimental data demonstrated that the indices could not represent the same level of stability, providing poor consistency and variability in the predicted values and established threshold. Although it belongs to the Italian normative, it should be noted that DRI test appeared to be more severe than the other aerobic indices of the OUR and SH. The results obtained suggest revising the biological stability indices and threshold values, depending on the type of matrix.
Author Contributions
Conceptualization, I.P. and A.P.; methodology, I.P.; software, I.P.; validation, I.P., R.P. and F.P.; formal analysis, I.P.; investigation, I.P.; resources, I.P. and A.P.; data curation, I.P.; writing—original draft preparation, F.P. and R.P.; writing—review and editing, I.P. and F.P.; visualization, I.P.; supervision, I.P. and A.P.; project administration I.P. and A.P.; funding acquisition, I.P. and A.P. All authors have read and agreed to the published version of the manuscript.
Institutional Review Board Statement
Not applicable
Informed Consent Statement
Informed consent was obtained from all subjects involved in the study
Data Availability Statement
Data Availability Statements are available in section “MDPI Research Data Policies” at https://www.mdpi.com/ethics.
Acknowledgments
The authors acknowledge financial support under the National Recovery and Resilience Plan (NRRP), Mission 4, Component 2, Investment 1.1, Call for tender No. 104 published on 2.2.2022 by the Italian Ministry of University and Research (MUR), funded by the European Union – NextGenerationEU– Project Title 2022WLFFR “BIOpolymers from agri-food waste digestates for SMART release bioFERTilisers (BIOSMARTFERT)” – CUP _B53D23017200006 - Grant Assignment Decree No. 966 adopted on 30-06-2023 by the Italian Ministry of Ministry of University and Research (MUR).
Conflicts of Interest
The authors declare no conflict of interest.
Abbreviations
The following abbreviations are used in this manuscript:
| ATU | Allylthiourea |
| BOD | Biological Oxygen Demand |
| BMP | Biochemical (Residual) Methane Potential |
| BMP28 | BMP measured after 28 days |
| C/N | Carbon-to-Nitrogen Ratio |
| CE | CE marking (EU conformity) |
| CMC | Component Material Category; |
| CMC3 | Compost |
| CMC5 | Digestate other than fresh crop digestate |
| DM | Dry Matter |
| DRI | Dynamic Respirometric Index |
| DW | Dry Weight |
| EoW | End-of-Waste |
| EU | European Union |
| MSW | Municipal Solid Waste |
| Nl | Normal liters (standard conditions) |
| OC | Oxygen Consumption |
| OFMSW | Organic Fraction of Municipal Solid Waste |
| OM | Organic Matter |
| OUR | Oxygen Uptake Rate |
| R2 | R-squared |
| RBP | Residual Biogas Potential |
| RBP28 | RBP measured after 28 days |
| RMSE | Root Mean Squared Error |
| S/I | Substrate-to-Inoculum Ratio |
| SH | Self-Heating (Dewar / Rottegrad) |
| TS | Total Solids |
| TVS | Total Volatile Solids |
| Vgas | Gas Volume |
| VS | Volatile Solids |
References
- Lin, L.; Xu, F.; Ge, X.; Li, Y. Improving the Sustainability of Organic Waste Management Practices in the Food-Energy-Water Nexus: A Comparative Review of Anaerobic Digestion and Composting. Renewable and Sustainable Energy Reviews 2018, 89, 151–167. [Google Scholar] [CrossRef]
- Villegas-Méndez, M.Á.; Sosa-Martínez, J.D.; Castrillón-Duque, E.X.; Cossio-Carrillo, C.S.; Contreras-Esquivel, J.C.; Salmerón, I.; Montañez, J.; Morales-Oyervides, L. Waste Valorization Through Eco-Innovative Technologies and Yeast Conversion into High-Value Products. In Food Byproducts Management and Their Utilization; 2024. [Google Scholar]
- European Commission. End-of-Waste Criteria for Biodegradable Waste Subjected to Biological Treatment (Compost & Digestate): Technical Proposals; 2013. [Google Scholar]
- Pajura, R. Composting Municipal Solid Waste and Animal Manure in Response to the Current Fertilizer Crisis - a Recent Review. Science of the Total Environment 2024, 912. [Google Scholar] [CrossRef]
- Chojnacka, K.; Moustakas, K. Anaerobic Digestate Management for Carbon Neutrality and Fertilizer Use: A Review of Current Practices and Future Opportunities. Biomass Bioenergy 2024, 180. [Google Scholar] [CrossRef]
- European Union. REGULATION (EU) 2019/1009 OF THE EUROPEAN PARLIAMENT AND OF THE COUNCIL of 5 June 2019; 2019. [Google Scholar]
- European Commission A Sustainable Bioeconomy for Europe: Strengthening the Connection between Economy, Society and the Environment Updated Bioeconomy Strategy. 2018. [CrossRef]
- Mahapatra, S.; Ali, M.H.; Samal, K. Assessment of Compost Maturity-Stability Indices and Recent Development of Composting Bin. Energy Nexus 2022, 6. [Google Scholar] [CrossRef]
- Lamolinara, B.; Pérez-Martínez, A.; Guardado-Yordi, E.; Guillén Fiallos, C.; Diéguez-Santana, K.; Ruiz-Mercado, G.J. Anaerobic Digestate Management, Environmental Impacts, and Techno-Economic Challenges. Waste Management 2022, 140, 14–30. [Google Scholar] [CrossRef]
- Albini, E.; Pecorini, I.; Ferrara, G. Evaluation of Biological Processes’ Performances Using Different Stability Indices; 2019; Vol. 1. [Google Scholar]
- Pecorini, I.; Peruzzi, E.; Albini, E.; Doni, S.; Macci, C.; Masciandaro, G.; Iannelli, R. Evaluation of MSW Compost and Digestate Mixtures for a Circular Economy Application. Sustainability (Switzerland) 2020, 12. [Google Scholar] [CrossRef]
- European Commission. Commission Decision (EU) 2015/ 2099 - of 18 November 2015 - Establishing the Ecological Criteria for the Award of the EU Ecolabel for Growing Media, Soil Improvers and Mulch - (Notified under Document C(2015) 7891); 2015. [Google Scholar]
- European Union. European Regulation 2019; 2019. [Google Scholar]
- Italian government. DECRETO LEGISLATIVO 29 Aprile 2010, n. 75; 2010. [Google Scholar]
- Prasad, M.; Foster, P. Comprehensive Evaluation and Development of Irish Compost and Digestate Standards for Heavy Metals, Stability and Phytotoxicity. Environments - MDPI 2023, 10. [Google Scholar] [CrossRef]
- Rossi, E.; Pecorini, I.; Paoli, P.; Iannelli, R. Plug-Flow Reactor for Volatile Fatty Acid Production from the Organic Fraction of Municipal Solid Waste: Influence of Organic Loading Rate. J Environ Chem Eng 2022, 10. [Google Scholar] [CrossRef]
- Garcia-Ochoa, F.; Gomez, E.; Santos, V.E.; Merchuk, J.C. Oxygen Uptake Rate in Microbial Processes: An Overview. Biochem Eng J 2010, 49, 289–307. [Google Scholar] [CrossRef]
- Liu, Y.; Guo, W.; Longhurst, P.; Jiang, Y. Shortening the Standard Testing Time for Residual Biogas Potential (RBP) Tests Using Biogas Yield Models and Substrate Physicochemical Characteristics. Processes 2023, 11. [Google Scholar] [CrossRef]
- Adani, F.; Ubbiali, C.; Generini, P. The Determination of Biological Stability of Composts Using the Dynamic Respiration Index: The Results of Experience after Two Years. Waste Management 2006, 26, 41–48. [Google Scholar] [CrossRef]
- Adani, F. Volume II · Aprile 2007 · Numero 1; 2007. [Google Scholar]
- Scaglia, B.T.F.G.P.L. and A.F. Respiration Index Determination: DynamicAnd Statistic Approaches. CompostScience&Utilization 2000, 8(No2), 90–98.
- Adani, F.; Confalonieri, R.; Tambone, F. Dynamic Respiration Index as a Descriptor of the Biological Stability of Organic Wastes. J Environ Qual 2004, 33. [Google Scholar] [CrossRef] [PubMed]
- Adani, F.; Ubbiali, C.; Generini, P. The Determination of Biological Stability of Composts Using the Dynamic Respiration Index: The Results of Experience after Two Years. Waste Management 2006, 26, 41–48. [Google Scholar] [CrossRef]
- Scaglia, B.; Acutis, M.; Adani, F. Precision Determination for the Dynamic Respirometric Index (DRI) Method Used for Biological Stability Evaluation on Municipal Solid Waste and Derived Products. Waste Management 2011, 31, 2–9. [Google Scholar] [CrossRef]
- Baffi, C.; Dell’Abate, M.T.; Nassisi, A.; Silva, S.; Benedetti, A.; Genevini, P.L.; Adani, F. Determination of Biological Stability in Compost: A Comparison of Methodologies. Soil Biol Biochem 2007, 39, 1284–1293. [Google Scholar] [CrossRef]
- Barrena, R.; d’Imporzano, G.; Ponsá, S.; Gea, T.; Artola, A.; Vázquez, F.; Sánchez, A.; Adani, F. In Search of a Reliable Technique for the Determination of the Biological Stability of the Organic Matter in the Mechanical-Biological Treated Waste. J Hazard Mater 2009, 162. [Google Scholar] [CrossRef]
- Jędrczak, A.; Suchowska-Kisielewicz, M. A Comparison of Waste Stability Indices for Mechanical–Biological Waste Treatment and Composting Plants. Int J Environ Res Public Health 2018, 15. [Google Scholar] [CrossRef] [PubMed]
- Brinton, W.F.; Eric Evans Mary Droffner Richard B Brinton, J.L. A Standardized Dewar Test for Evaluation of Compost Self-Heating Dewar Test-Biocycle Report A STANDARDIZED DEWAR TEST FOR EVALUATION OF COMPOST SELF-HEATING; 1995. [Google Scholar]
- UNI EN 16087-2:2012 Soil Improvers and Growing Media - Determination of the Aerobic Biological Activity - Part 2: Self Heating Test for Compost 2011.
- Albini, E.; Pecorini, I.; Ferrara, G. Improvement of Digestate Stability Using Dark Fermentation and Anaerobic Digestion Processes. Energies (Basel) 2019, 12. [Google Scholar] [CrossRef]
- UNI 11184:2016 Waste and Refuse Derived Fuels - Determination of Biological Stability by Dinamic Respirometric Index. 2016.
- Angelidaki, I.; Alves, M.; Bolzonella, D.; Borzacconi, L.; Campos, J.L.; Guwy, A.J.; Kalyuzhnyi, S.; Jenicek, P.; Van Lier, J.B. Defining the Biomethane Potential (BMP) of Solid Organic Wastes and Energy Crops: A Proposed Protocol for Batch Assays. Water Science and Technology 2009, 59, 927–934. [Google Scholar] [CrossRef]
- Pecorini, I.; Olivieri, T.; Bacchi, D.; Paradisi, A.; Lombardi, L.; Corti, A.; Carnevale, E. Evaluation of Gas Production in a Industrial Anaerobic Digester by Means of Biochemical Methane Potential of Organic Municipal Solid Waste Components; 2012. [Google Scholar]
- Pecorini, I.; Baldi, F.; Iannelli, R. Biochemical Hydrogen Potential Tests Using Different Inocula. Sustainability (Switzerland) 2019, 11. [Google Scholar] [CrossRef]
- UNI/TS 11703:2018 Method for the Assessment of Potential Production of Methane from Anaerobic Digestion in Wet Conditions - Matrix into Foodstuffs 2018.
- Patten, M.L. The Pearson Correlation Coefficient. In Understanding Research Methods; 2021. [Google Scholar]
- Benesty, J.; Chen, J.; Huang, Y.; Cohen, I. Pearson Correlation Coefficient; 2009; pp. 1–4. [Google Scholar]
- Ratner, B. The Correlation Coefficient: Its Values Range between +1/−1, or Do They? Journal of Targeting, Measurement and Analysis for Marketing 2009, 17, 139–142. [Google Scholar] [CrossRef]
- Pasciucco, F.; Pasciucco, E.; Castagnoli, A.; Iannelli, R.; Pecorini, I. Comparing the Effects of Al-Based Coagulants in Waste Activated Sludge Anaerobic Digestion: Methane Yield, Kinetics and Sludge Implications. Heliyon 2024, 10, e29282. [Google Scholar] [CrossRef]
- Rotem, A.; Toner, M.; Tompkins, R.G.; Yarmush, M.L. Oxygen Uptake Rates in Cultured Rat Hepatocytes. Biotechnol Bioeng 1992, 40. [Google Scholar] [CrossRef]
- Antognoni, S.; Ragazzi, M.; Rada, E.C. Biogas Potential of OFMSW through an Indirect Method. International Journal of Environment and Resource 2013, 2. [Google Scholar]
- Fernández-Domínguez, D.; Guilayn, F.; Patureau, D.; Jimenez, J. Characterising the Stability of the Organic Matter during Anaerobic Digestion: A Selective Review on the Major Spectroscopic Techniques. Rev Environ Sci Biotechnol 2022, 21, 691–726. [Google Scholar] [CrossRef]
- Tambone, F.; Genevini, P.; D’Imporzano, G.; Adani, F. Assessing Amendment Properties of Digestate by Studying the Organic Matter Composition and the Degree of Biological Stability during the Anaerobic Digestion of the Organic Fraction of MSW. Bioresour Technol 2009, 100, 3140–3142. [Google Scholar] [CrossRef]
- Vitti, A.; Elshafie, H.S.; Logozzo, G.; Marzario, S.; Scopa, A.; Camele, I.; Nuzzaci, M. Physico-Chemical Characterization and Biological Activities of a Digestate and a More Stabilized Digestate-Derived Compost from Agro-Waste. Plants 2021, 10, 386. [Google Scholar] [CrossRef]
- Alburquerque, J.A.; de la Fuente, C.; Bernal, M.P. Chemical Properties of Anaerobic Digestates Affecting C and N Dynamics in Amended Soils. Agric Ecosyst Environ 2012, 160, 15–22. [Google Scholar] [CrossRef]
- Bona, D.; Cristoforetti, A.; Zanzotti, R.; Bertoldi, D.; Dellai, N.; Silvestri, S. Matured Manure and Compost from the Organic Fraction of Solid Waste Digestate Application in Intensive Apple Orchards. Int J Environ Res Public Health 2022, 19. [Google Scholar] [CrossRef]
- Esposito, G.; Frunzo, L.; Liotta, F.; Panico, A.; Pirozzi, F. Bio-Methane Potential Tests To Measure The Biogas Production From The Digestion and Co-Digestion of Complex Organic Substrates; 2012; Vol. 5. [Google Scholar]
- Cesaro, A.; Conte, A.; Belgiorno, V.; Siciliano, A.; Guida, M. The Evolution of Compost Stability and Maturity during the Full-Scale Treatment of the Organic Fraction of Municipal Solid Waste. J Environ Manage 2019, 232, 264–270. [Google Scholar] [CrossRef] [PubMed]
- Paradelo, R.; Moldes, A.B.; Prieto, B.; Sandu, R.-G.; Barral, M.T. Can Stability and Maturity Be Evaluated in Finished Composts from Different Sources? Compost Sci Util 2010, 18, 22–31. [Google Scholar] [CrossRef]
- Oviedo-Ocaña, E.R.; Torres-Lozada, P.; Marmolejo-Rebellon, L.F.; Hoyos, L.V.; Gonzales, S.; Barrena, R.; Komilis, D.; Sanchez, A. Stability and Maturity of Biowaste Composts Derived by Small Municipalities: Correlation among Physical, Chemical and Biological Indices. Waste Management 2015, 44, 63–71. [Google Scholar] [CrossRef] [PubMed]
- Di Trapani, D.; Cosenza, A.; De Marines, F.; Viviani, G. Biological Stability Assessment of MSW Organic Fractions by Means of Respirometric and Germination Tests. J Mater Cycles Waste Manag 2023, 25, 1142–1152. [Google Scholar] [CrossRef]
Figure 1.
Experimental configuration and instrumentation used for SH (a), OUR (b), DRI (c) and RBP (d) tests.
Figure 1.
Experimental configuration and instrumentation used for SH (a), OUR (b), DRI (c) and RBP (d) tests.
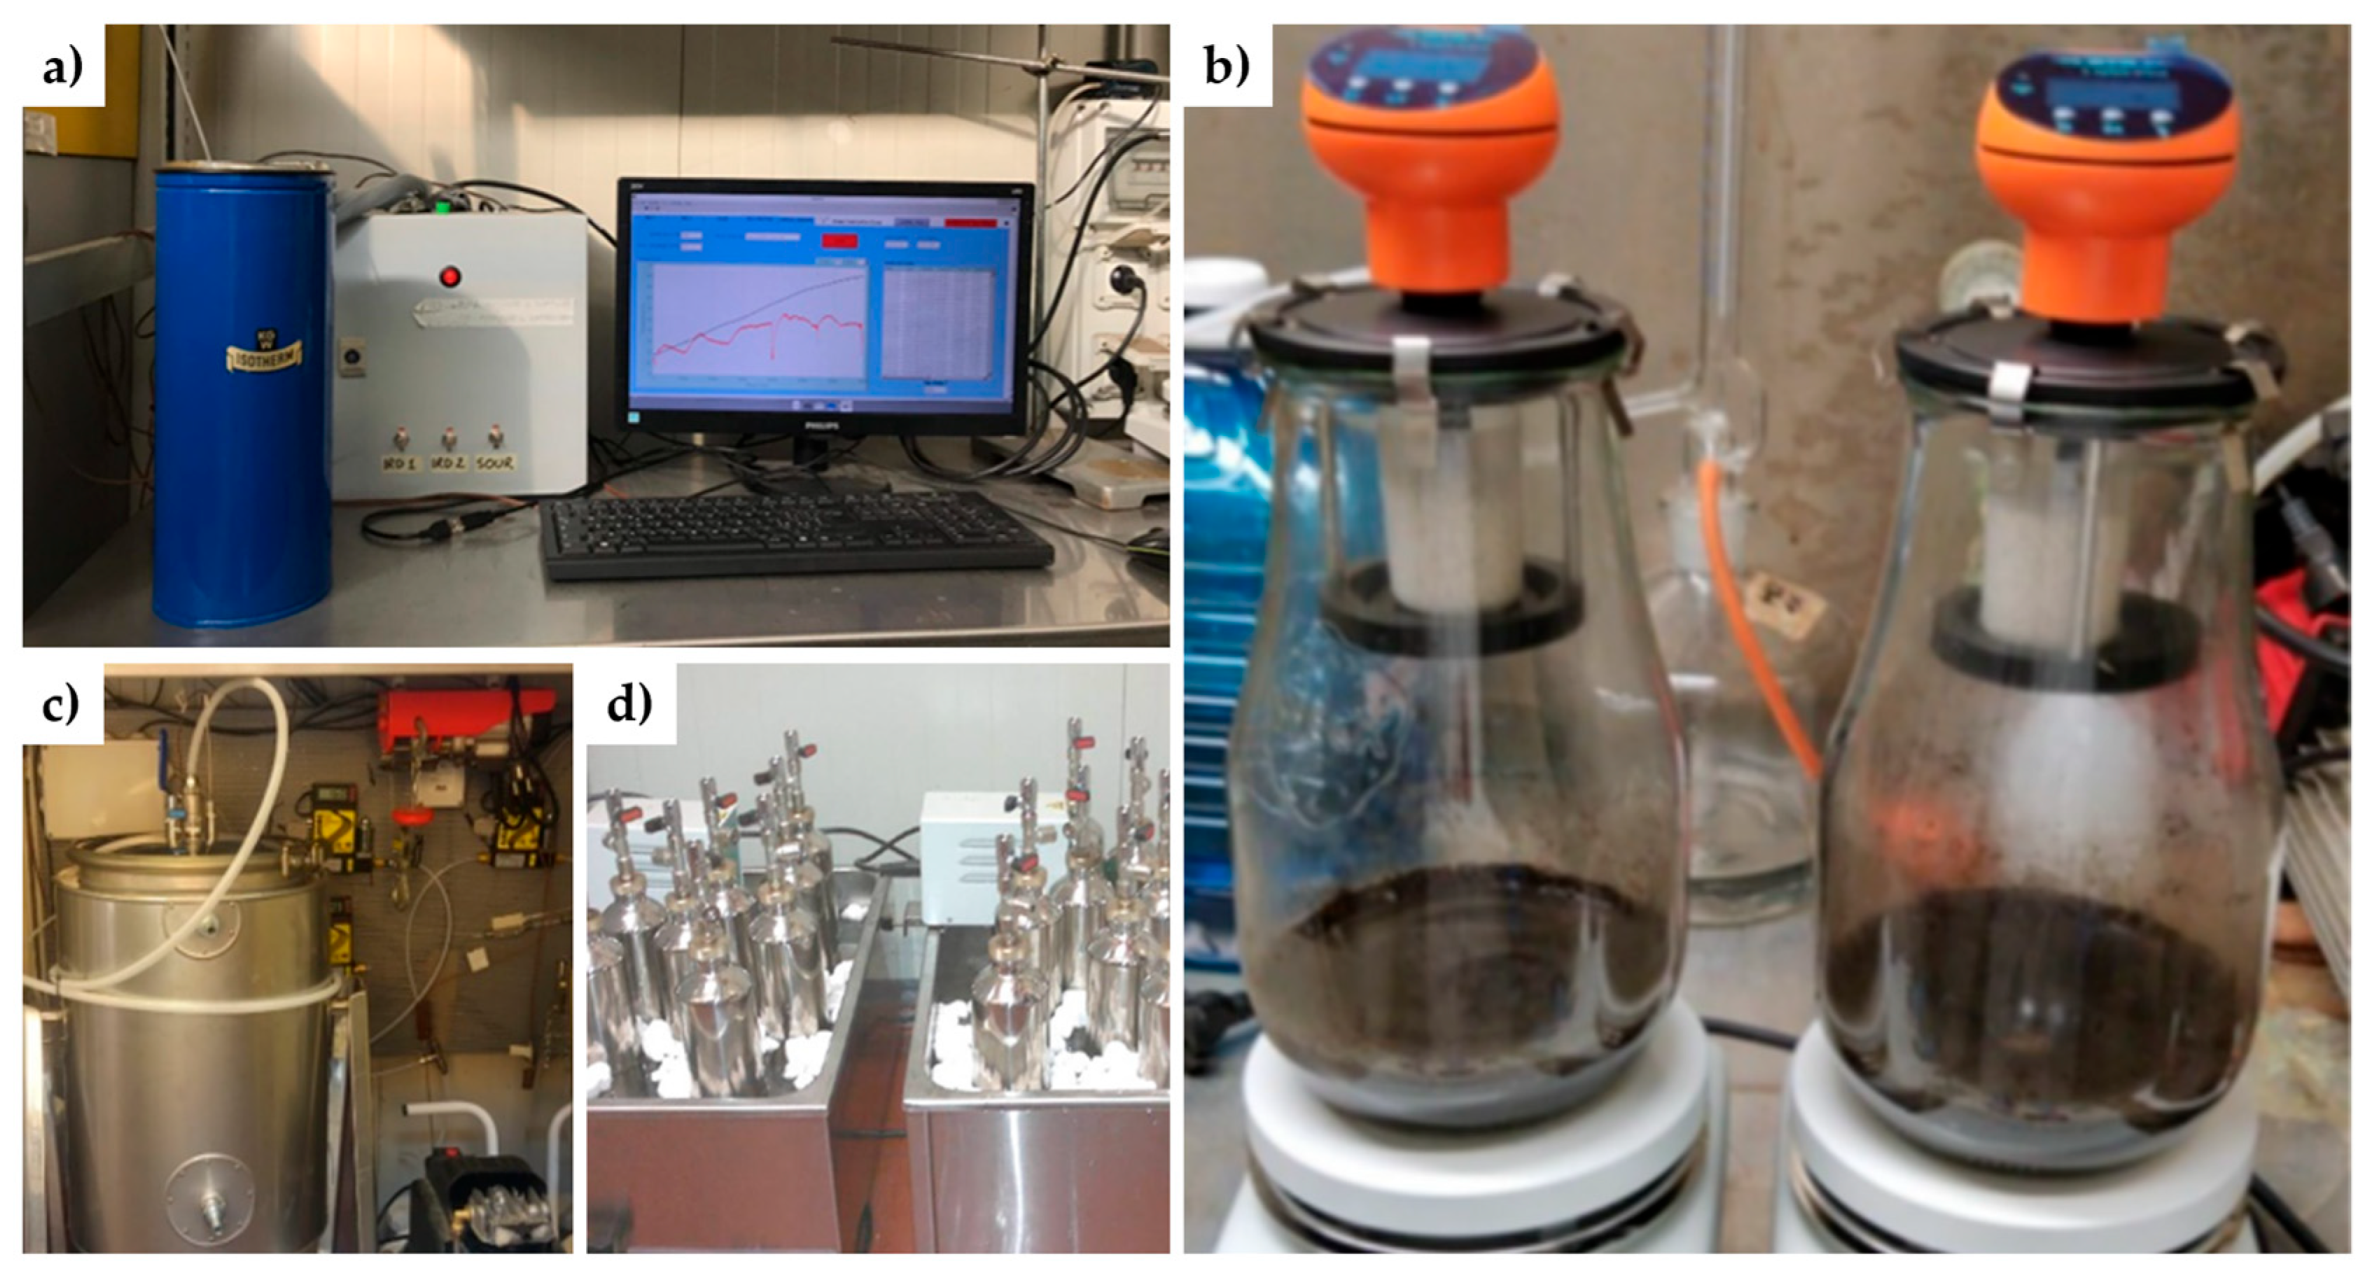
Figure 2.
Biological stability index ranges calculated for compost samples: OUR (a), SH (b), RBP (c) and DRI (d).
Figure 2.
Biological stability index ranges calculated for compost samples: OUR (a), SH (b), RBP (c) and DRI (d).
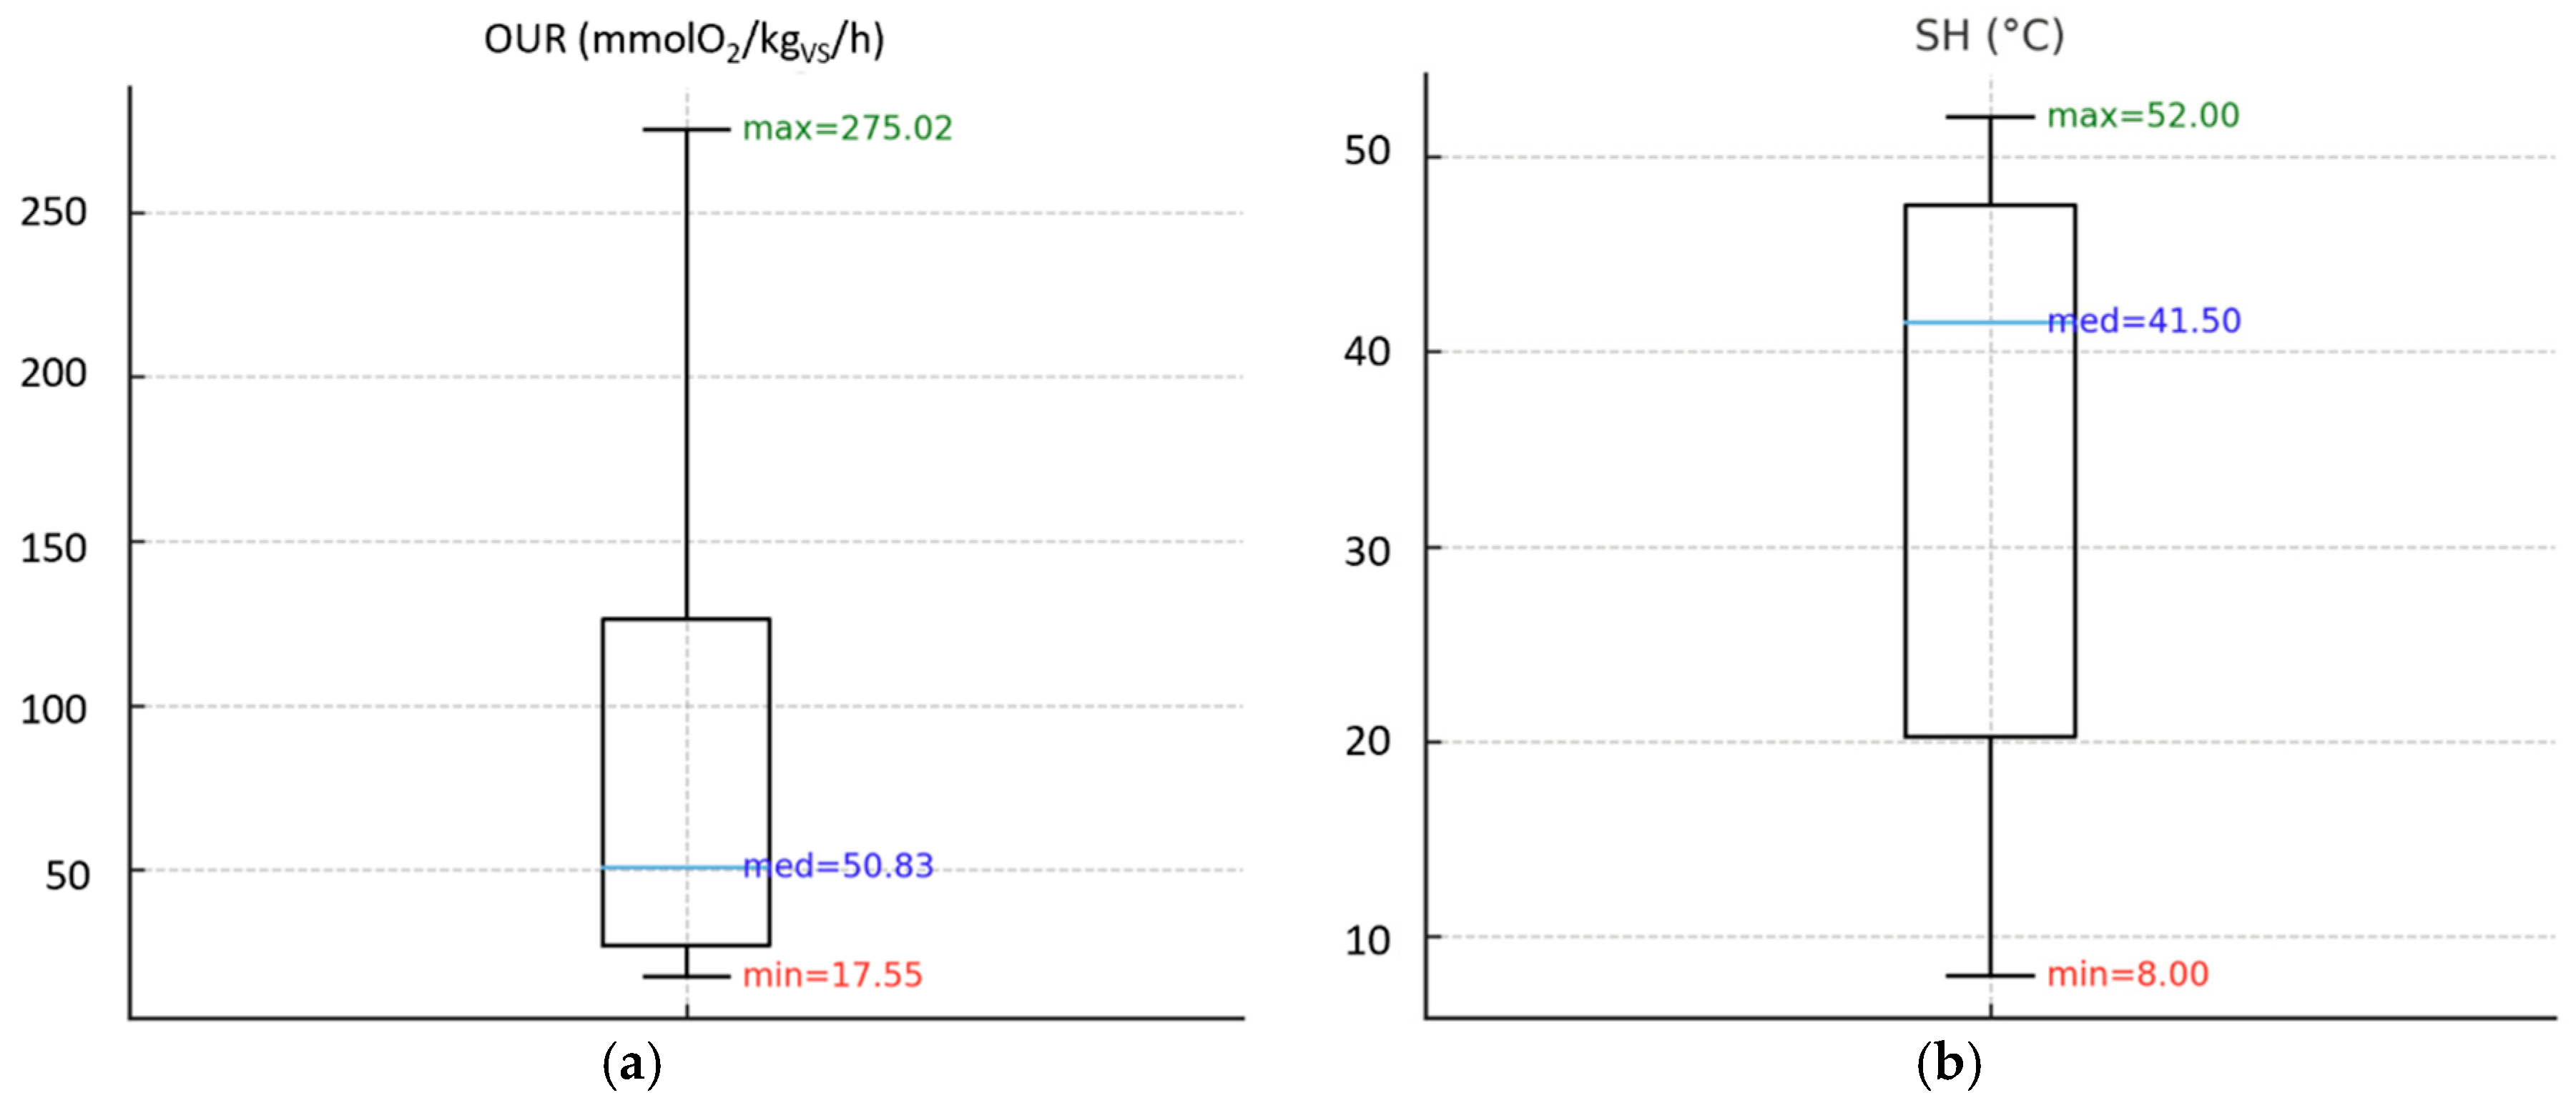
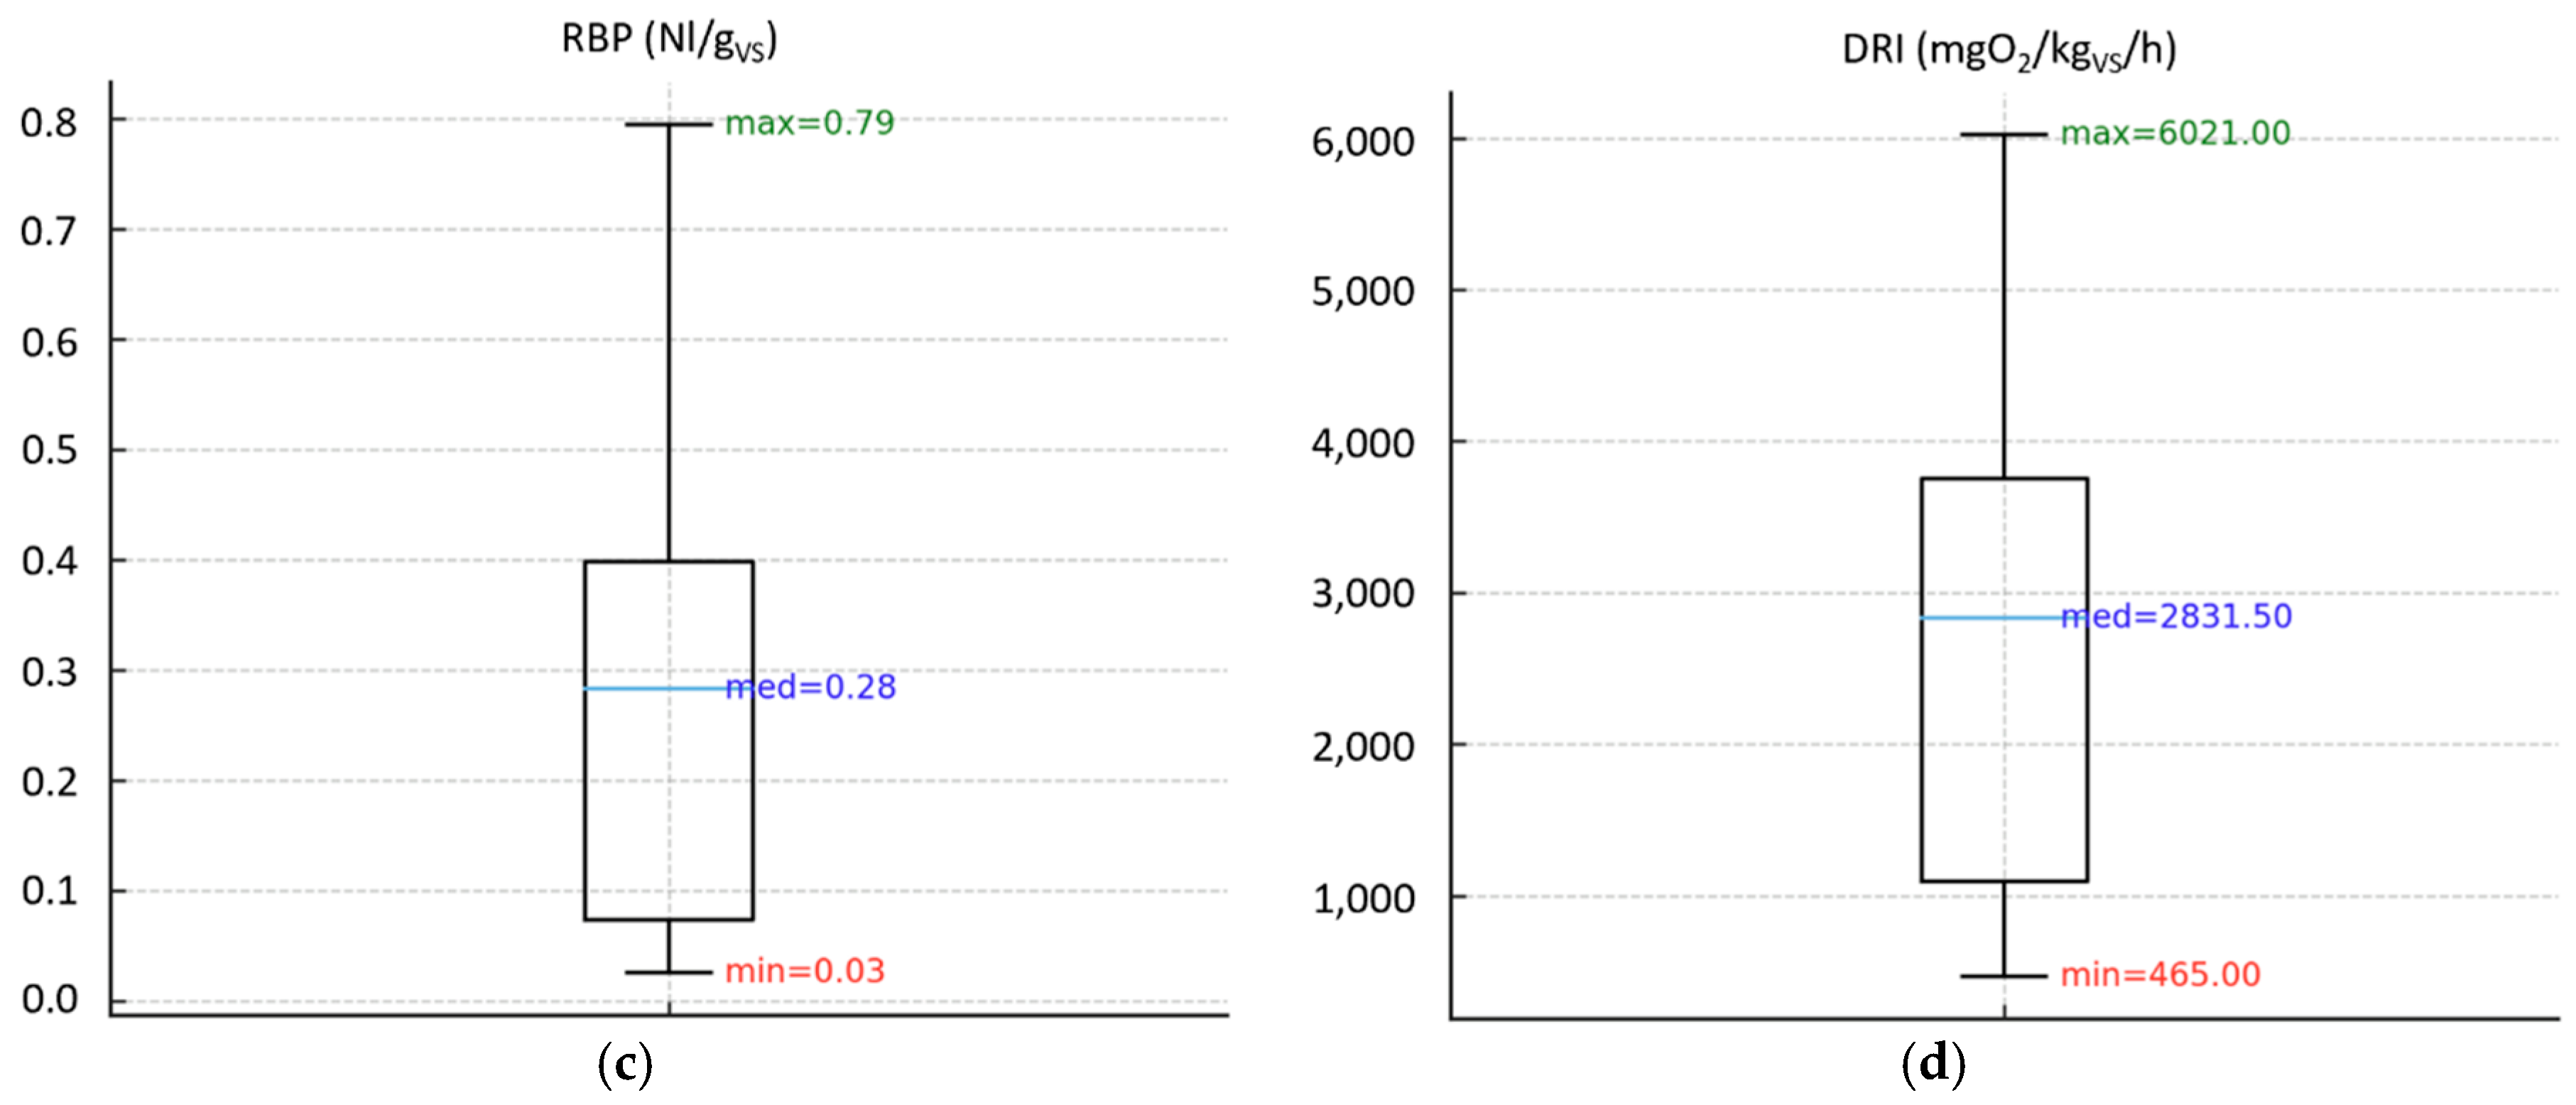
Figure 3.
Biological stability index ranges calculated for digestate samples: OUR (a), SH (b), RBP (c) and DRI (d).
Figure 3.
Biological stability index ranges calculated for digestate samples: OUR (a), SH (b), RBP (c) and DRI (d).
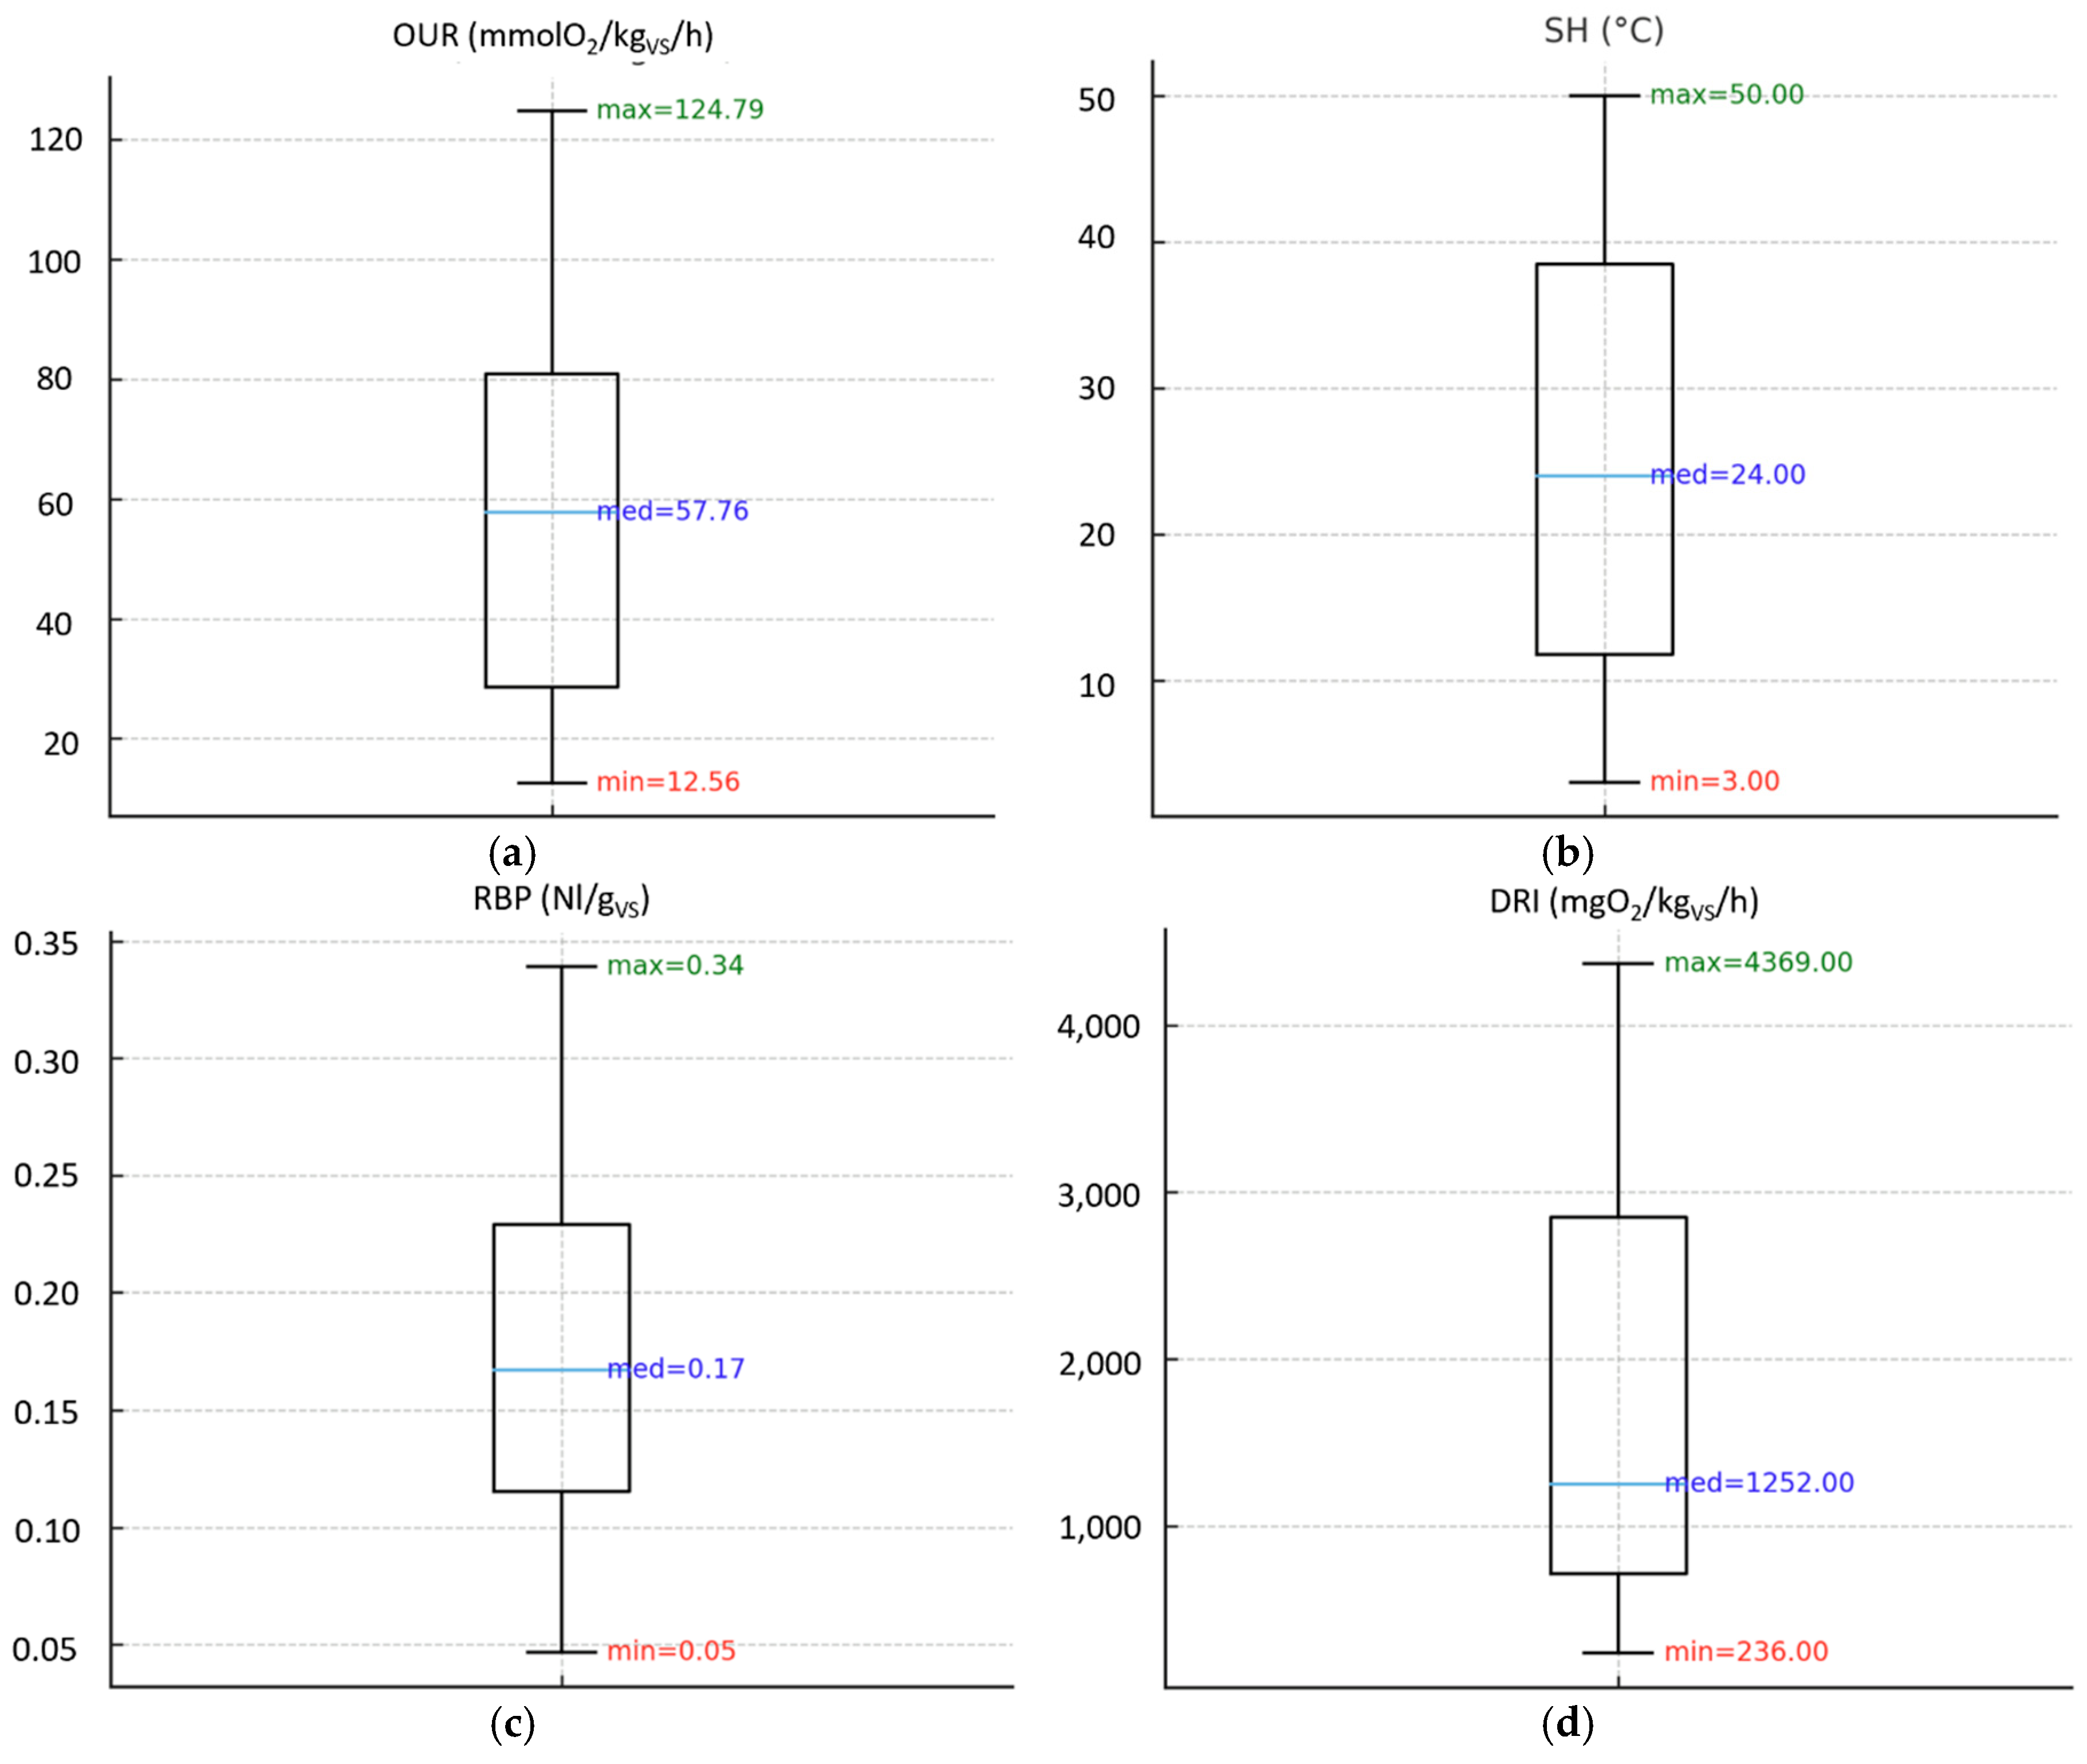
Figure 4.
Pearson's correlation coefficient r for compost (a) and digestate (b) samples.
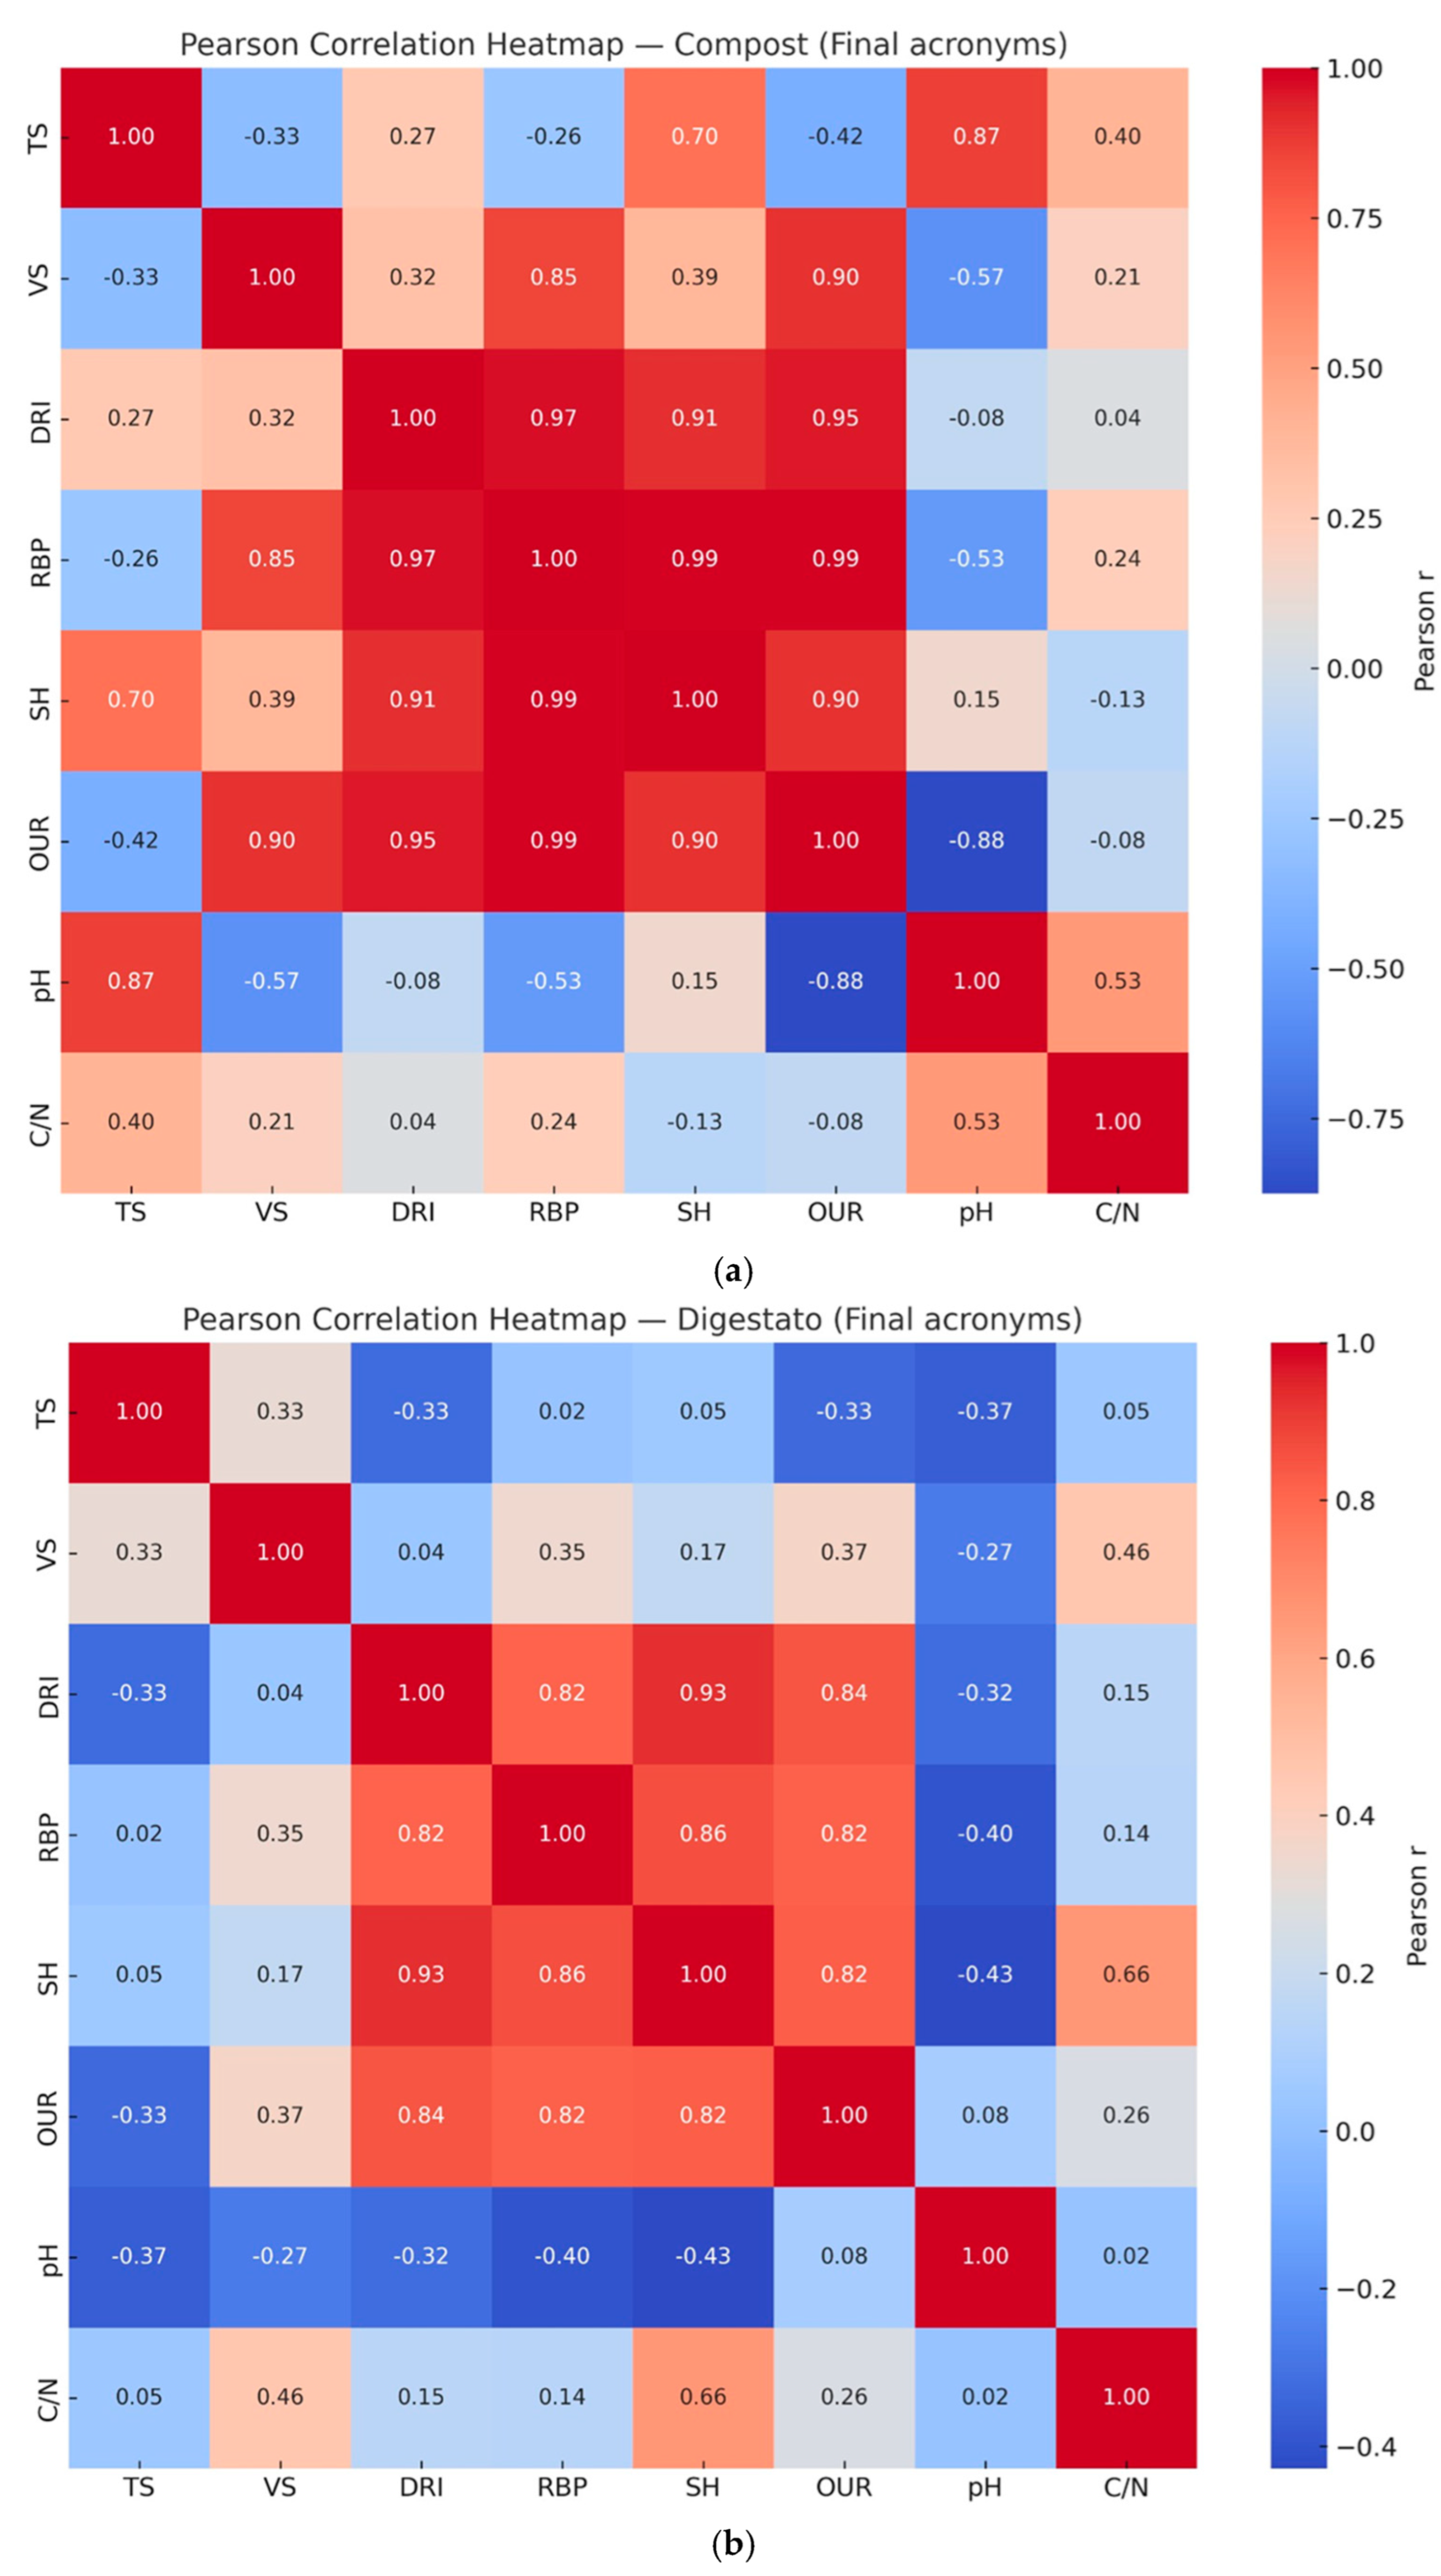
Figure 5.
3d (a) and 2d (b) contour plots of the second-order polynomial regression model on the relationships between RBP, SH and OUR (compost dataset).
Figure 5.
3d (a) and 2d (b) contour plots of the second-order polynomial regression model on the relationships between RBP, SH and OUR (compost dataset).
| Dataset | Target Index | Equation | R² | RMSE |
| Compost | RBP | RBP = -0.0852 + 0.0018·OUR + 0.0104·SH + -0.0000·OUR² + -0.0002·SH² + 0.0000·OUR·SH | 0.96 | 0.038 |
| Compost | DRI | DRI = -223.3858 + 21.4709·OUR + 45.2233·SH + -0.0817·OUR² + -0.7418·SH² + 0.4477·OUR·SH | 0.97 | 257.85 |
| Digestate | RBP | RBP = 0.0598 + 0.0026·OUR + -0.0003·SH + 0.0000·OUR² + 0.0002·SH² + -0.0002·OUR·SH | 0.60 | 0.052 |
| Digestate | DRI | DRI = -173.9605 + 28.1243·OUR + 28.3748·SH + 0.0282·OUR² + 0.9664·SH² + -0.6159·OUR·SH | 0.95 | 266.32 |
| All sample | RBP | RBP = 0.0295 + 0.0005·OUR + 0.0046·SH + -0.0000·OUR² + -0.0001·SH² + 0.0000·OUR·SH | 0.84 | 0.065 |
| All sample | DRI | DRI = -57.9241 + 19.7859·OUR + 32.0990·SH + -0.0182·OUR² + 0.1918·SH² + 0.0046·OUR·SH | 0.96 | 299.58 |
Figure 6.
3d (a) and 2d (b) contour plots of the second-order polynomial regression model on the relationships between RBP, SH and OUR (digestate dataset).
Figure 6.
3d (a) and 2d (b) contour plots of the second-order polynomial regression model on the relationships between RBP, SH and OUR (digestate dataset).
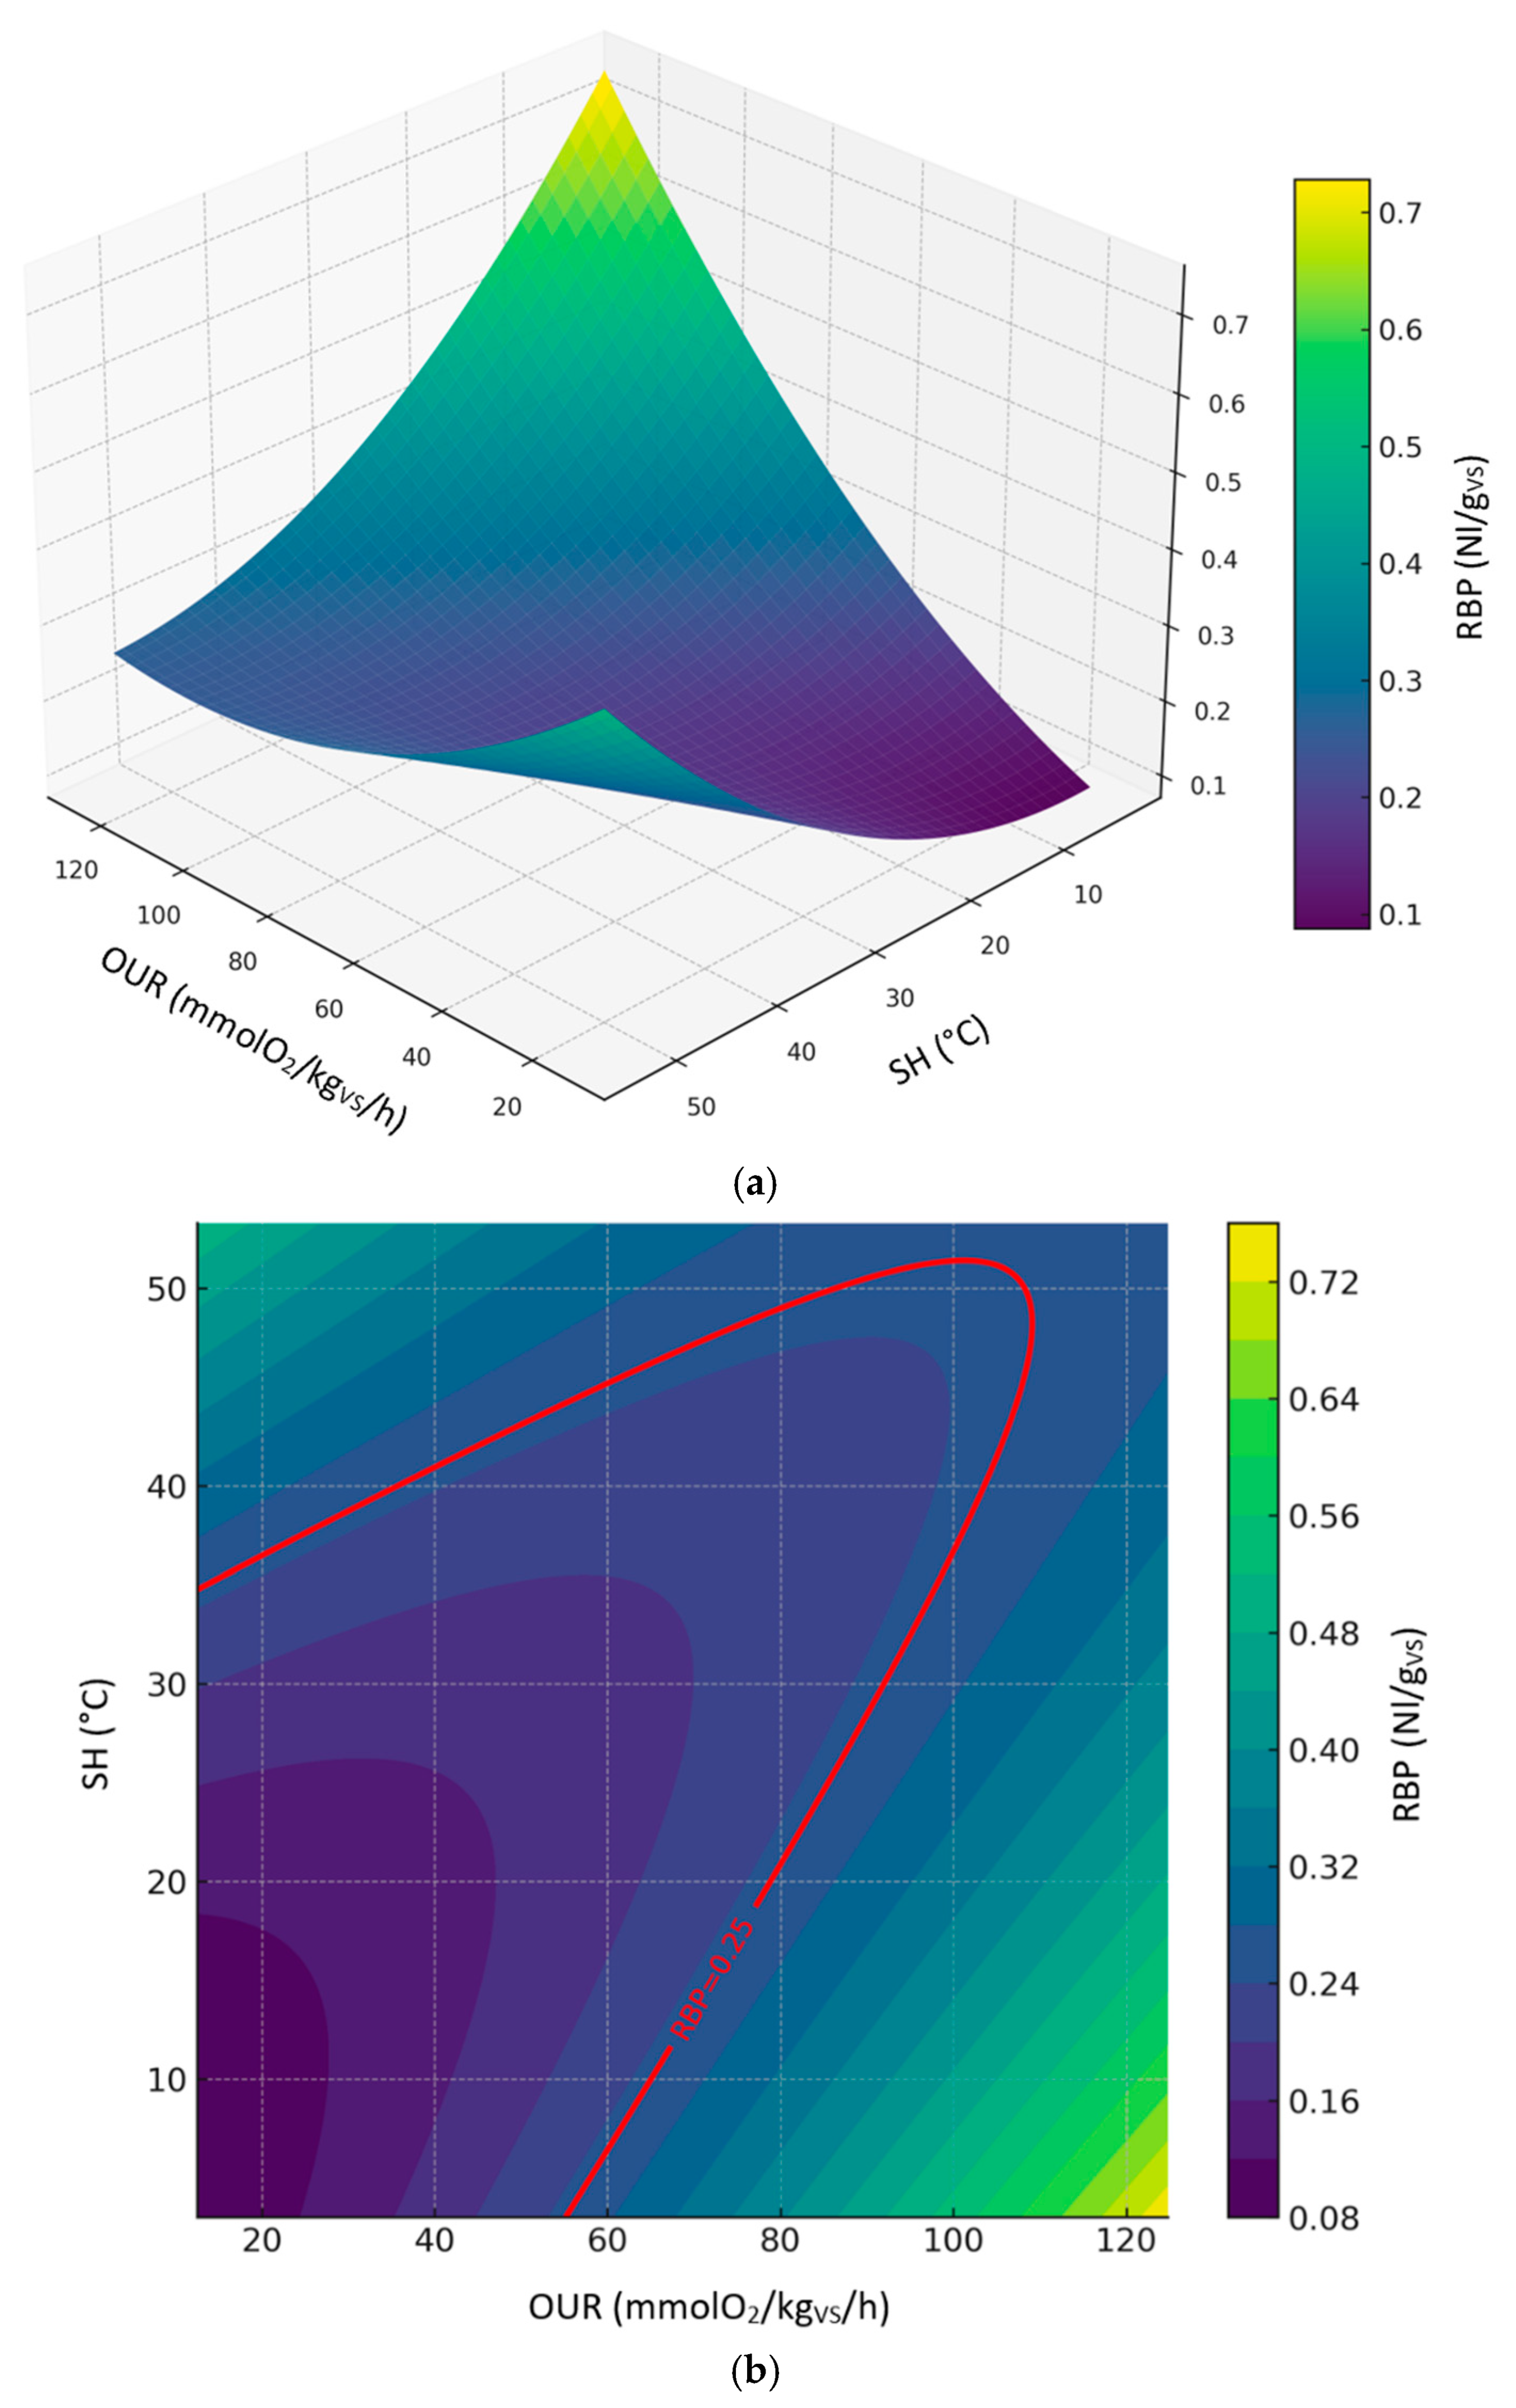
Figure 7.
3d (a) and 2d (b) contour plots of the second-order polynomial regression model on the relationships between RBP, SH and OUR (all sample dataset).
Figure 7.
3d (a) and 2d (b) contour plots of the second-order polynomial regression model on the relationships between RBP, SH and OUR (all sample dataset).
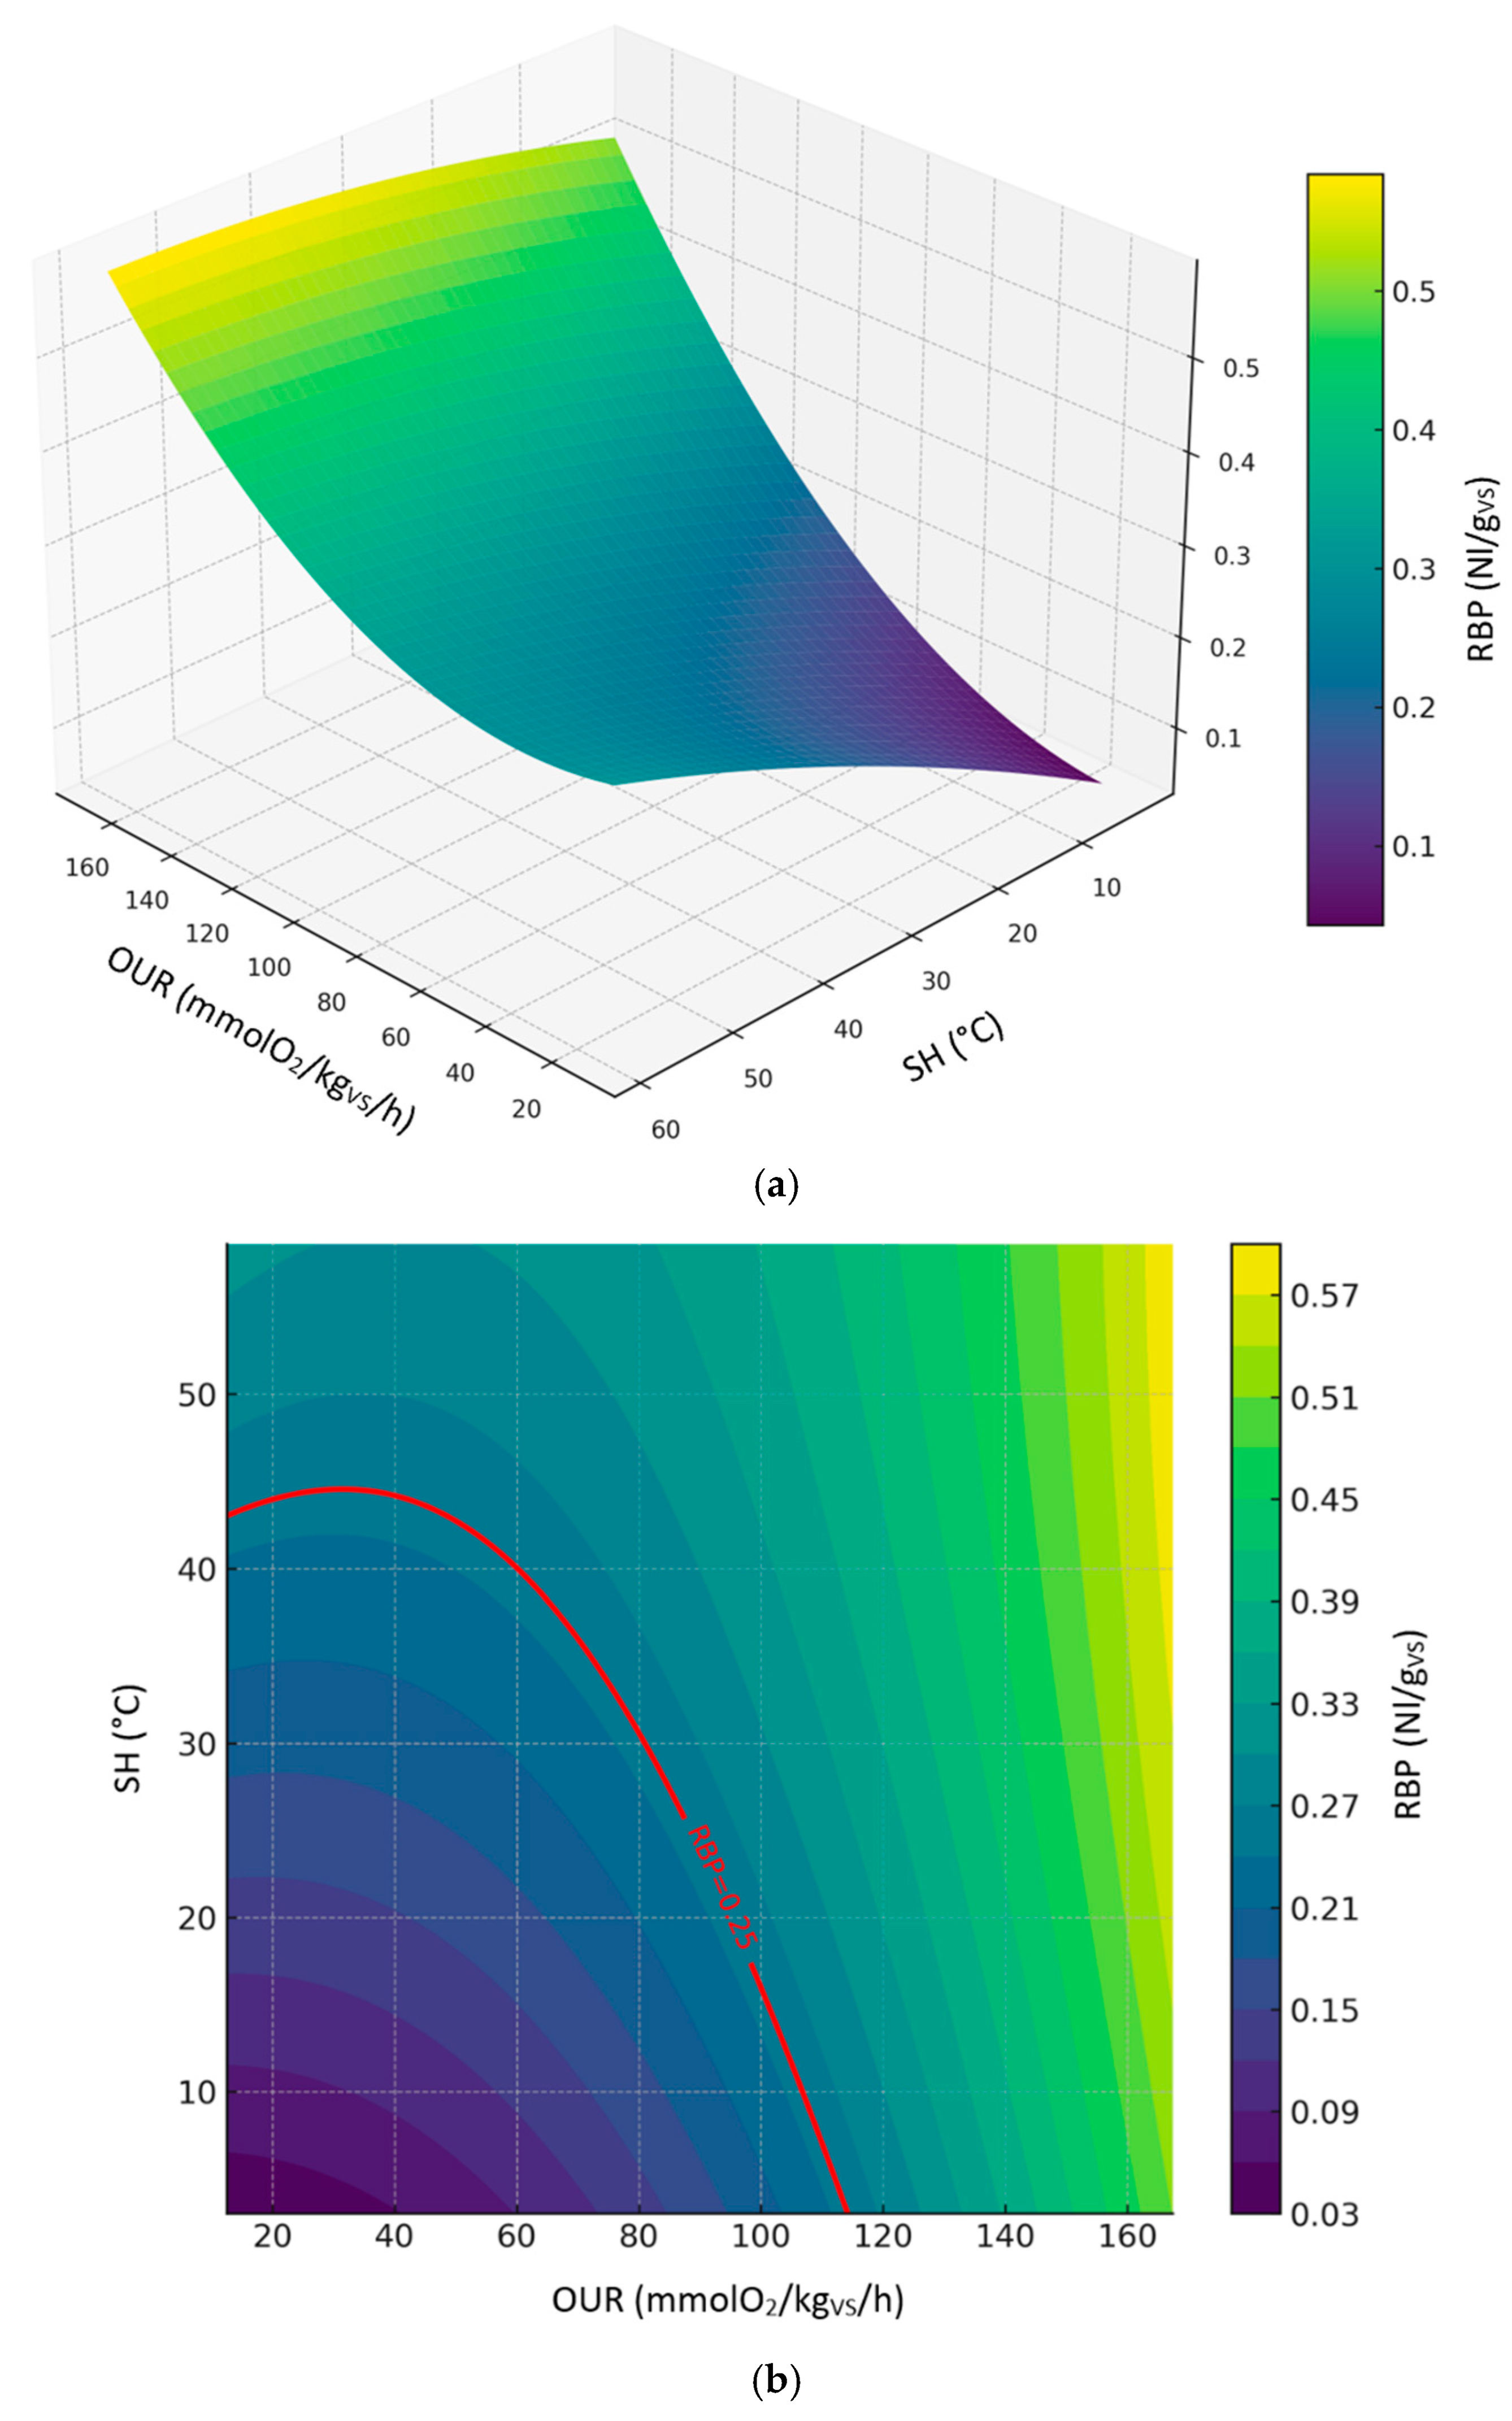
Figure 8.
3d (a) and 2d (b) contour plots of the second-order polynomial regression model on the relationships between DRI, SH and OUR (compost dataset).
Figure 8.
3d (a) and 2d (b) contour plots of the second-order polynomial regression model on the relationships between DRI, SH and OUR (compost dataset).
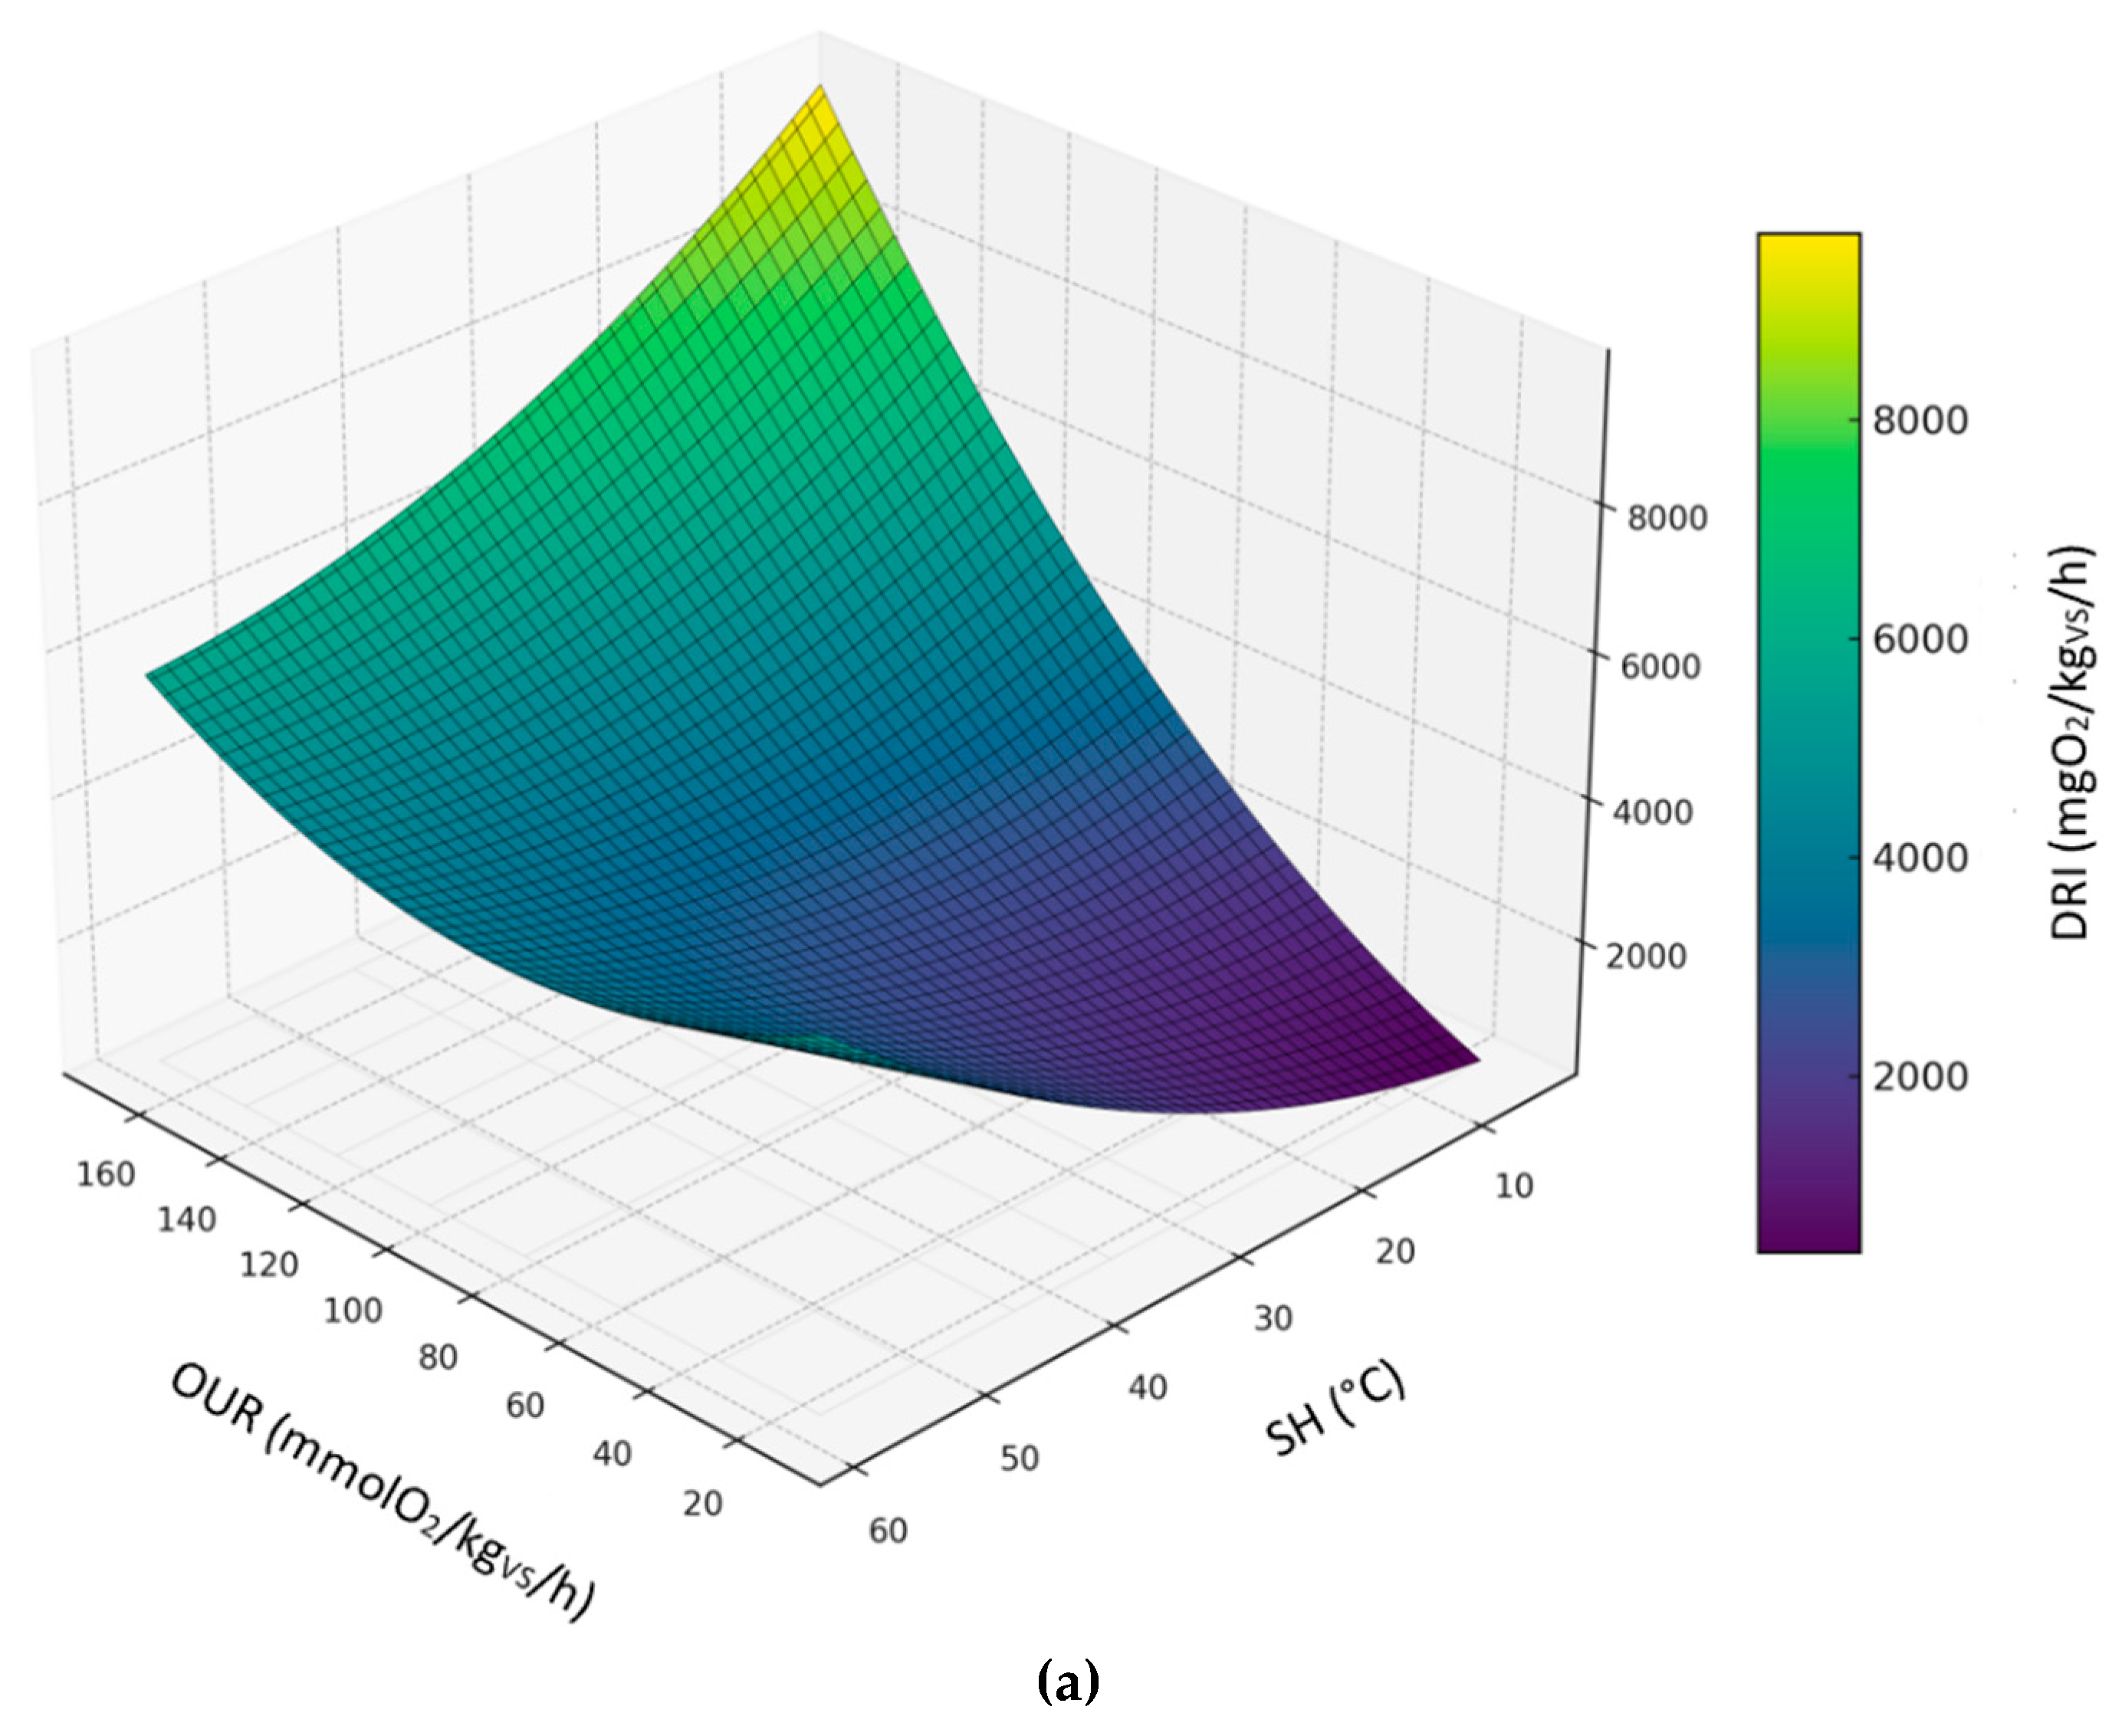

Figure 9.
3d (a) and 2d (b) contour plots of the second-order polynomial regression model on the relationships between DRI, SH and OUR (digestate dataset).
Figure 9.
3d (a) and 2d (b) contour plots of the second-order polynomial regression model on the relationships between DRI, SH and OUR (digestate dataset).
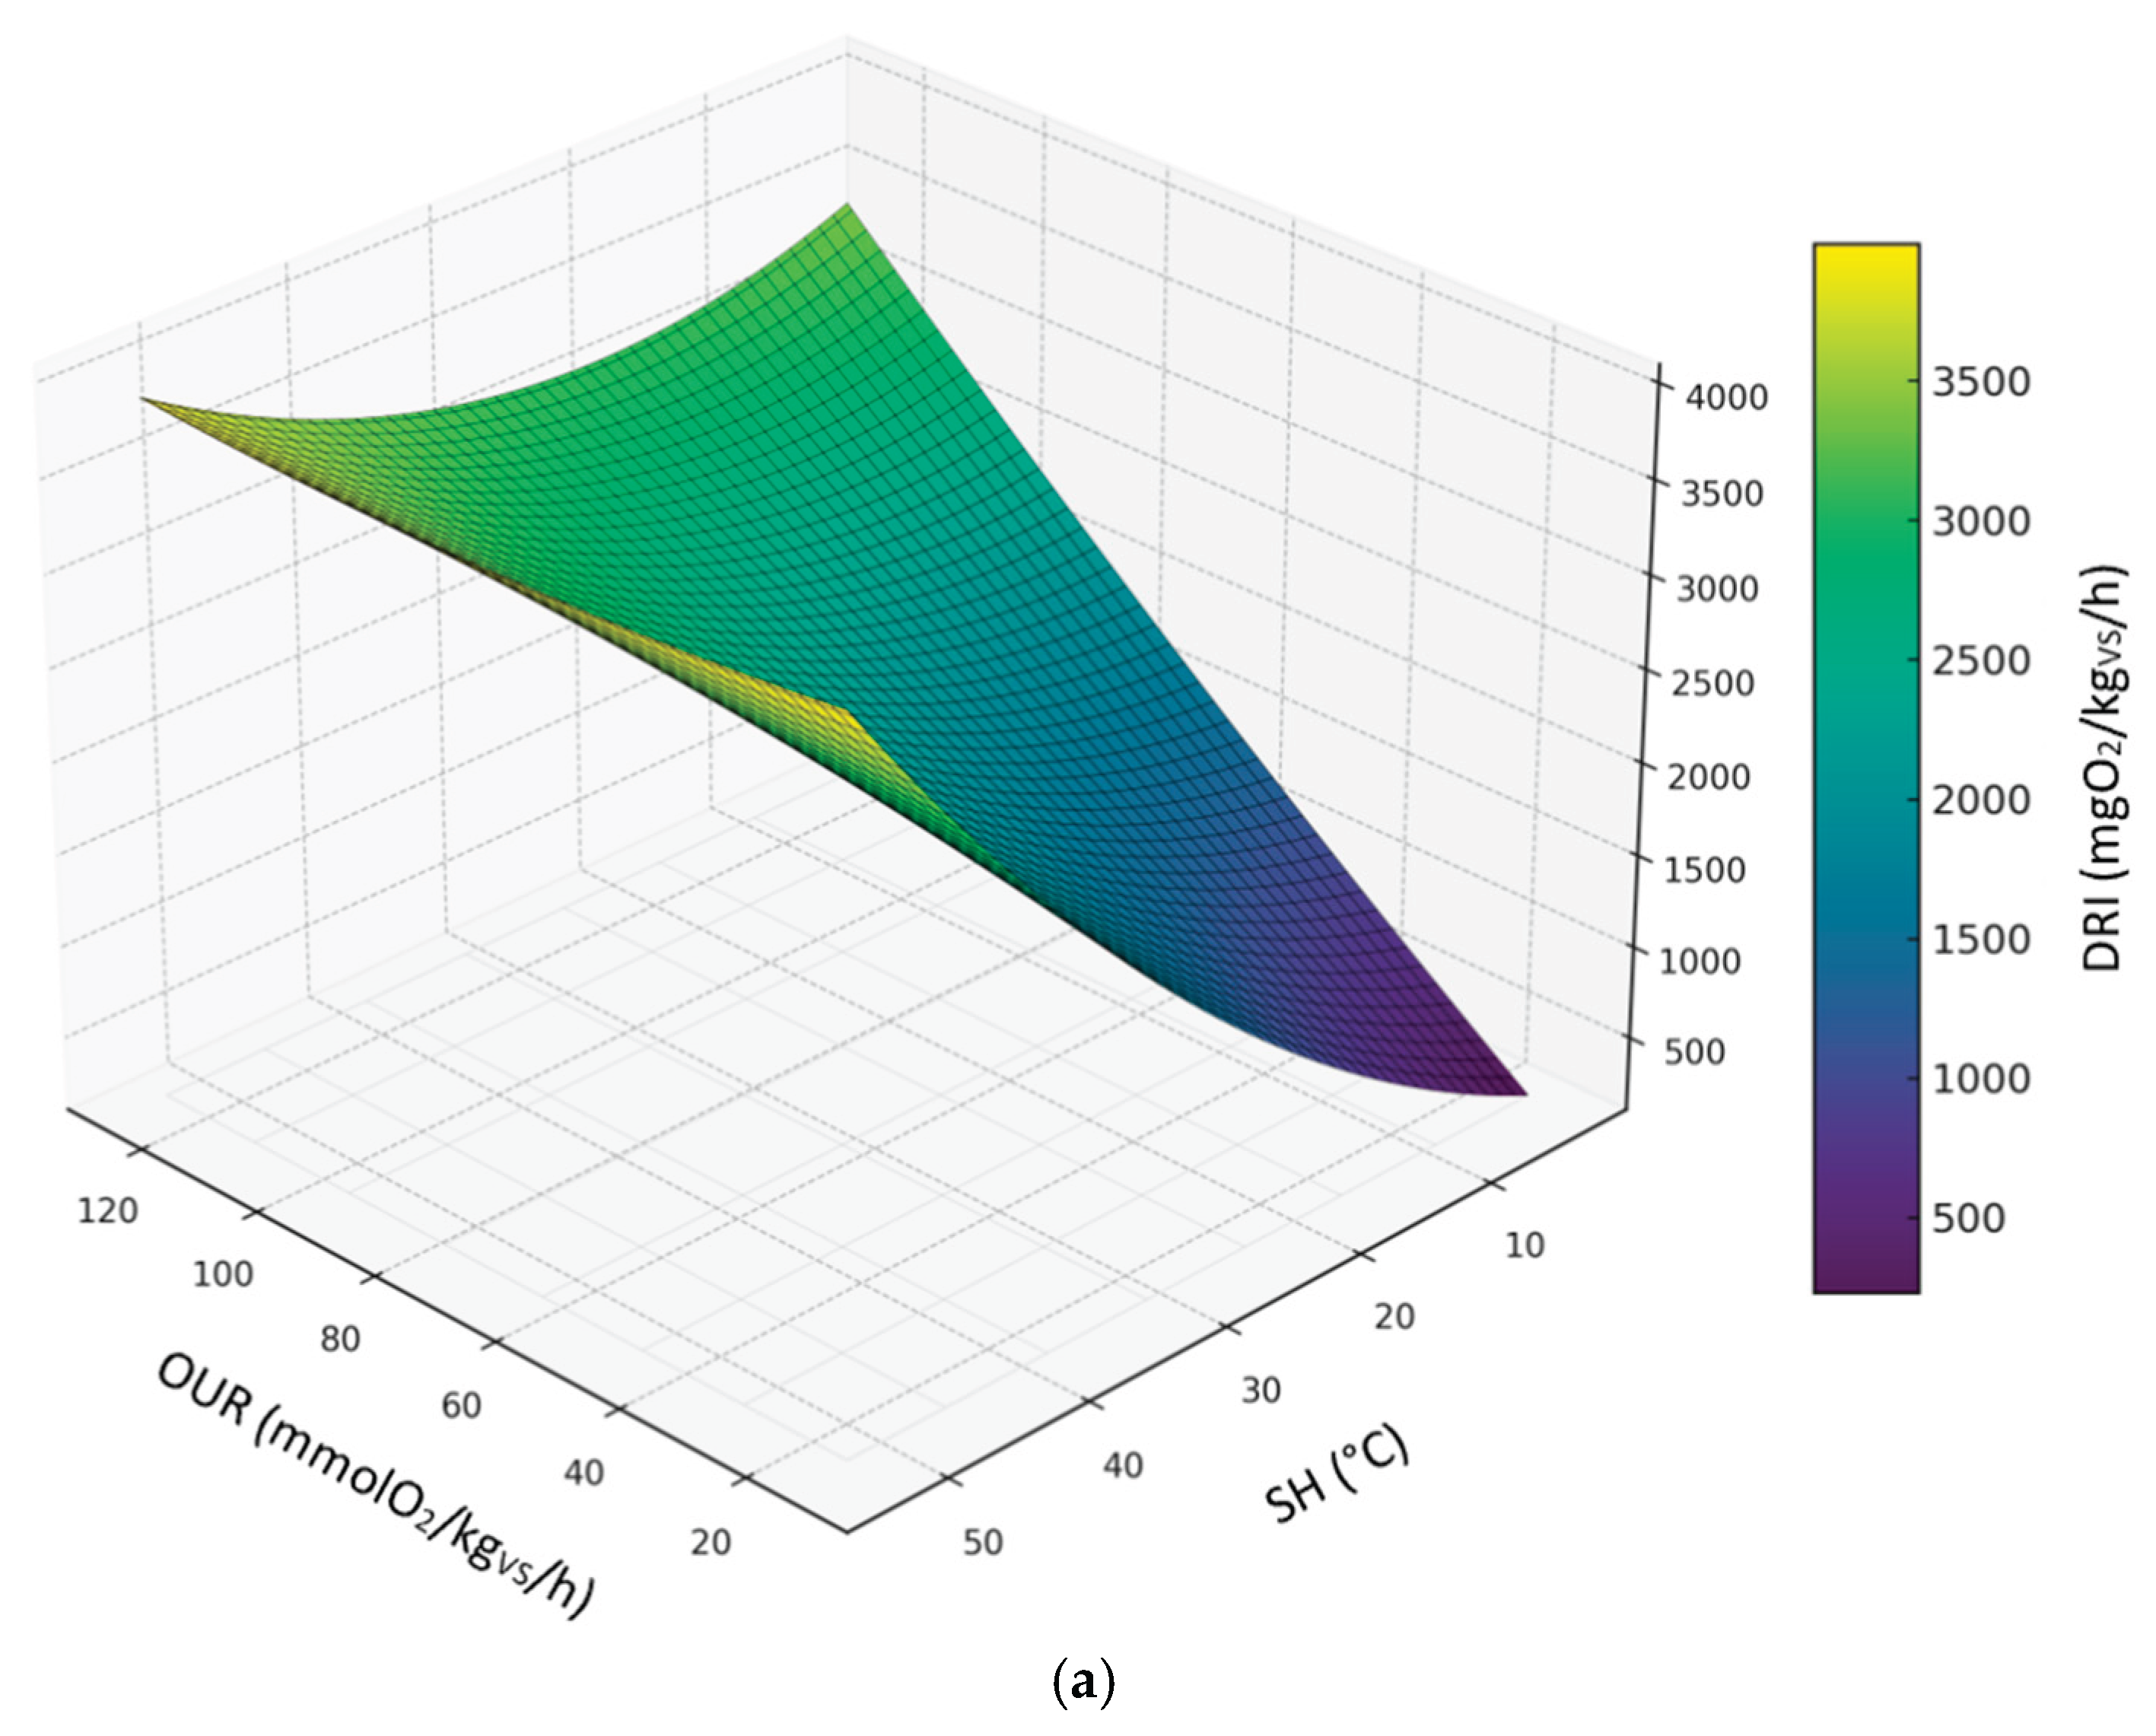
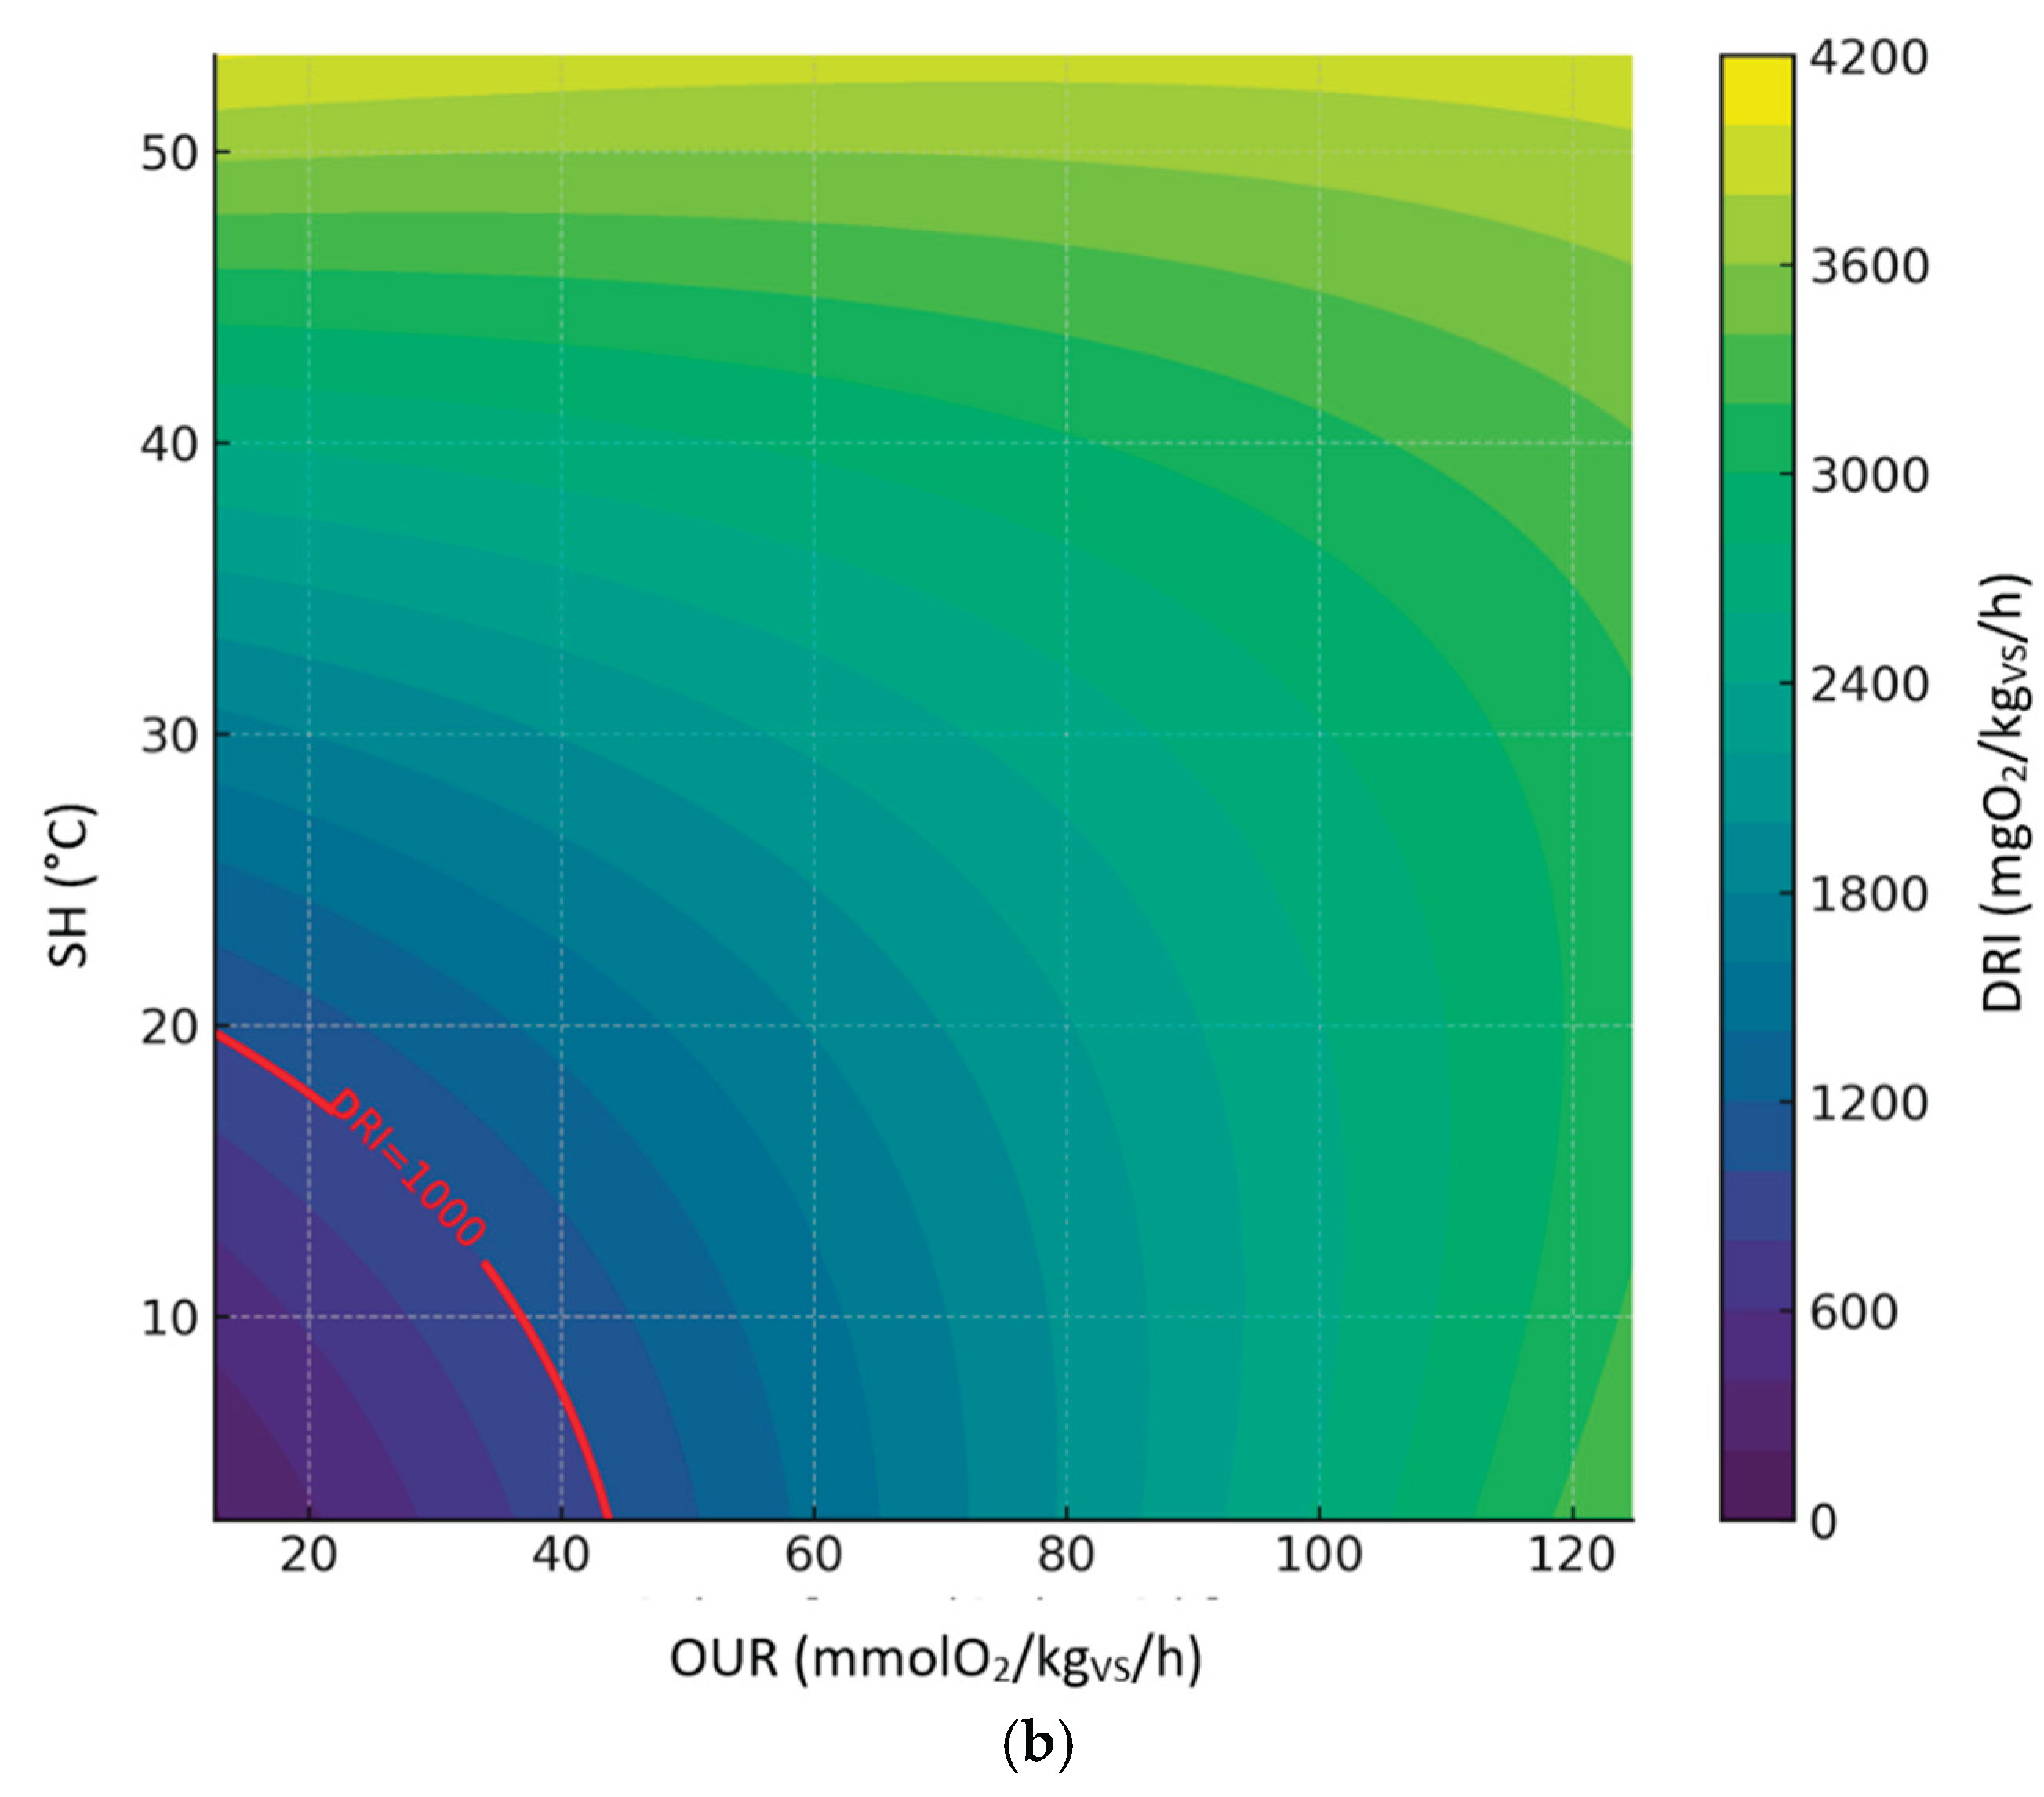
Figure 10.
3d (a) and 2d (b) contour plots of the second-order polynomial regression model on the relationships between DRI, SH and OUR (all sample dataset).
Figure 10.
3d (a) and 2d (b) contour plots of the second-order polynomial regression model on the relationships between DRI, SH and OUR (all sample dataset).
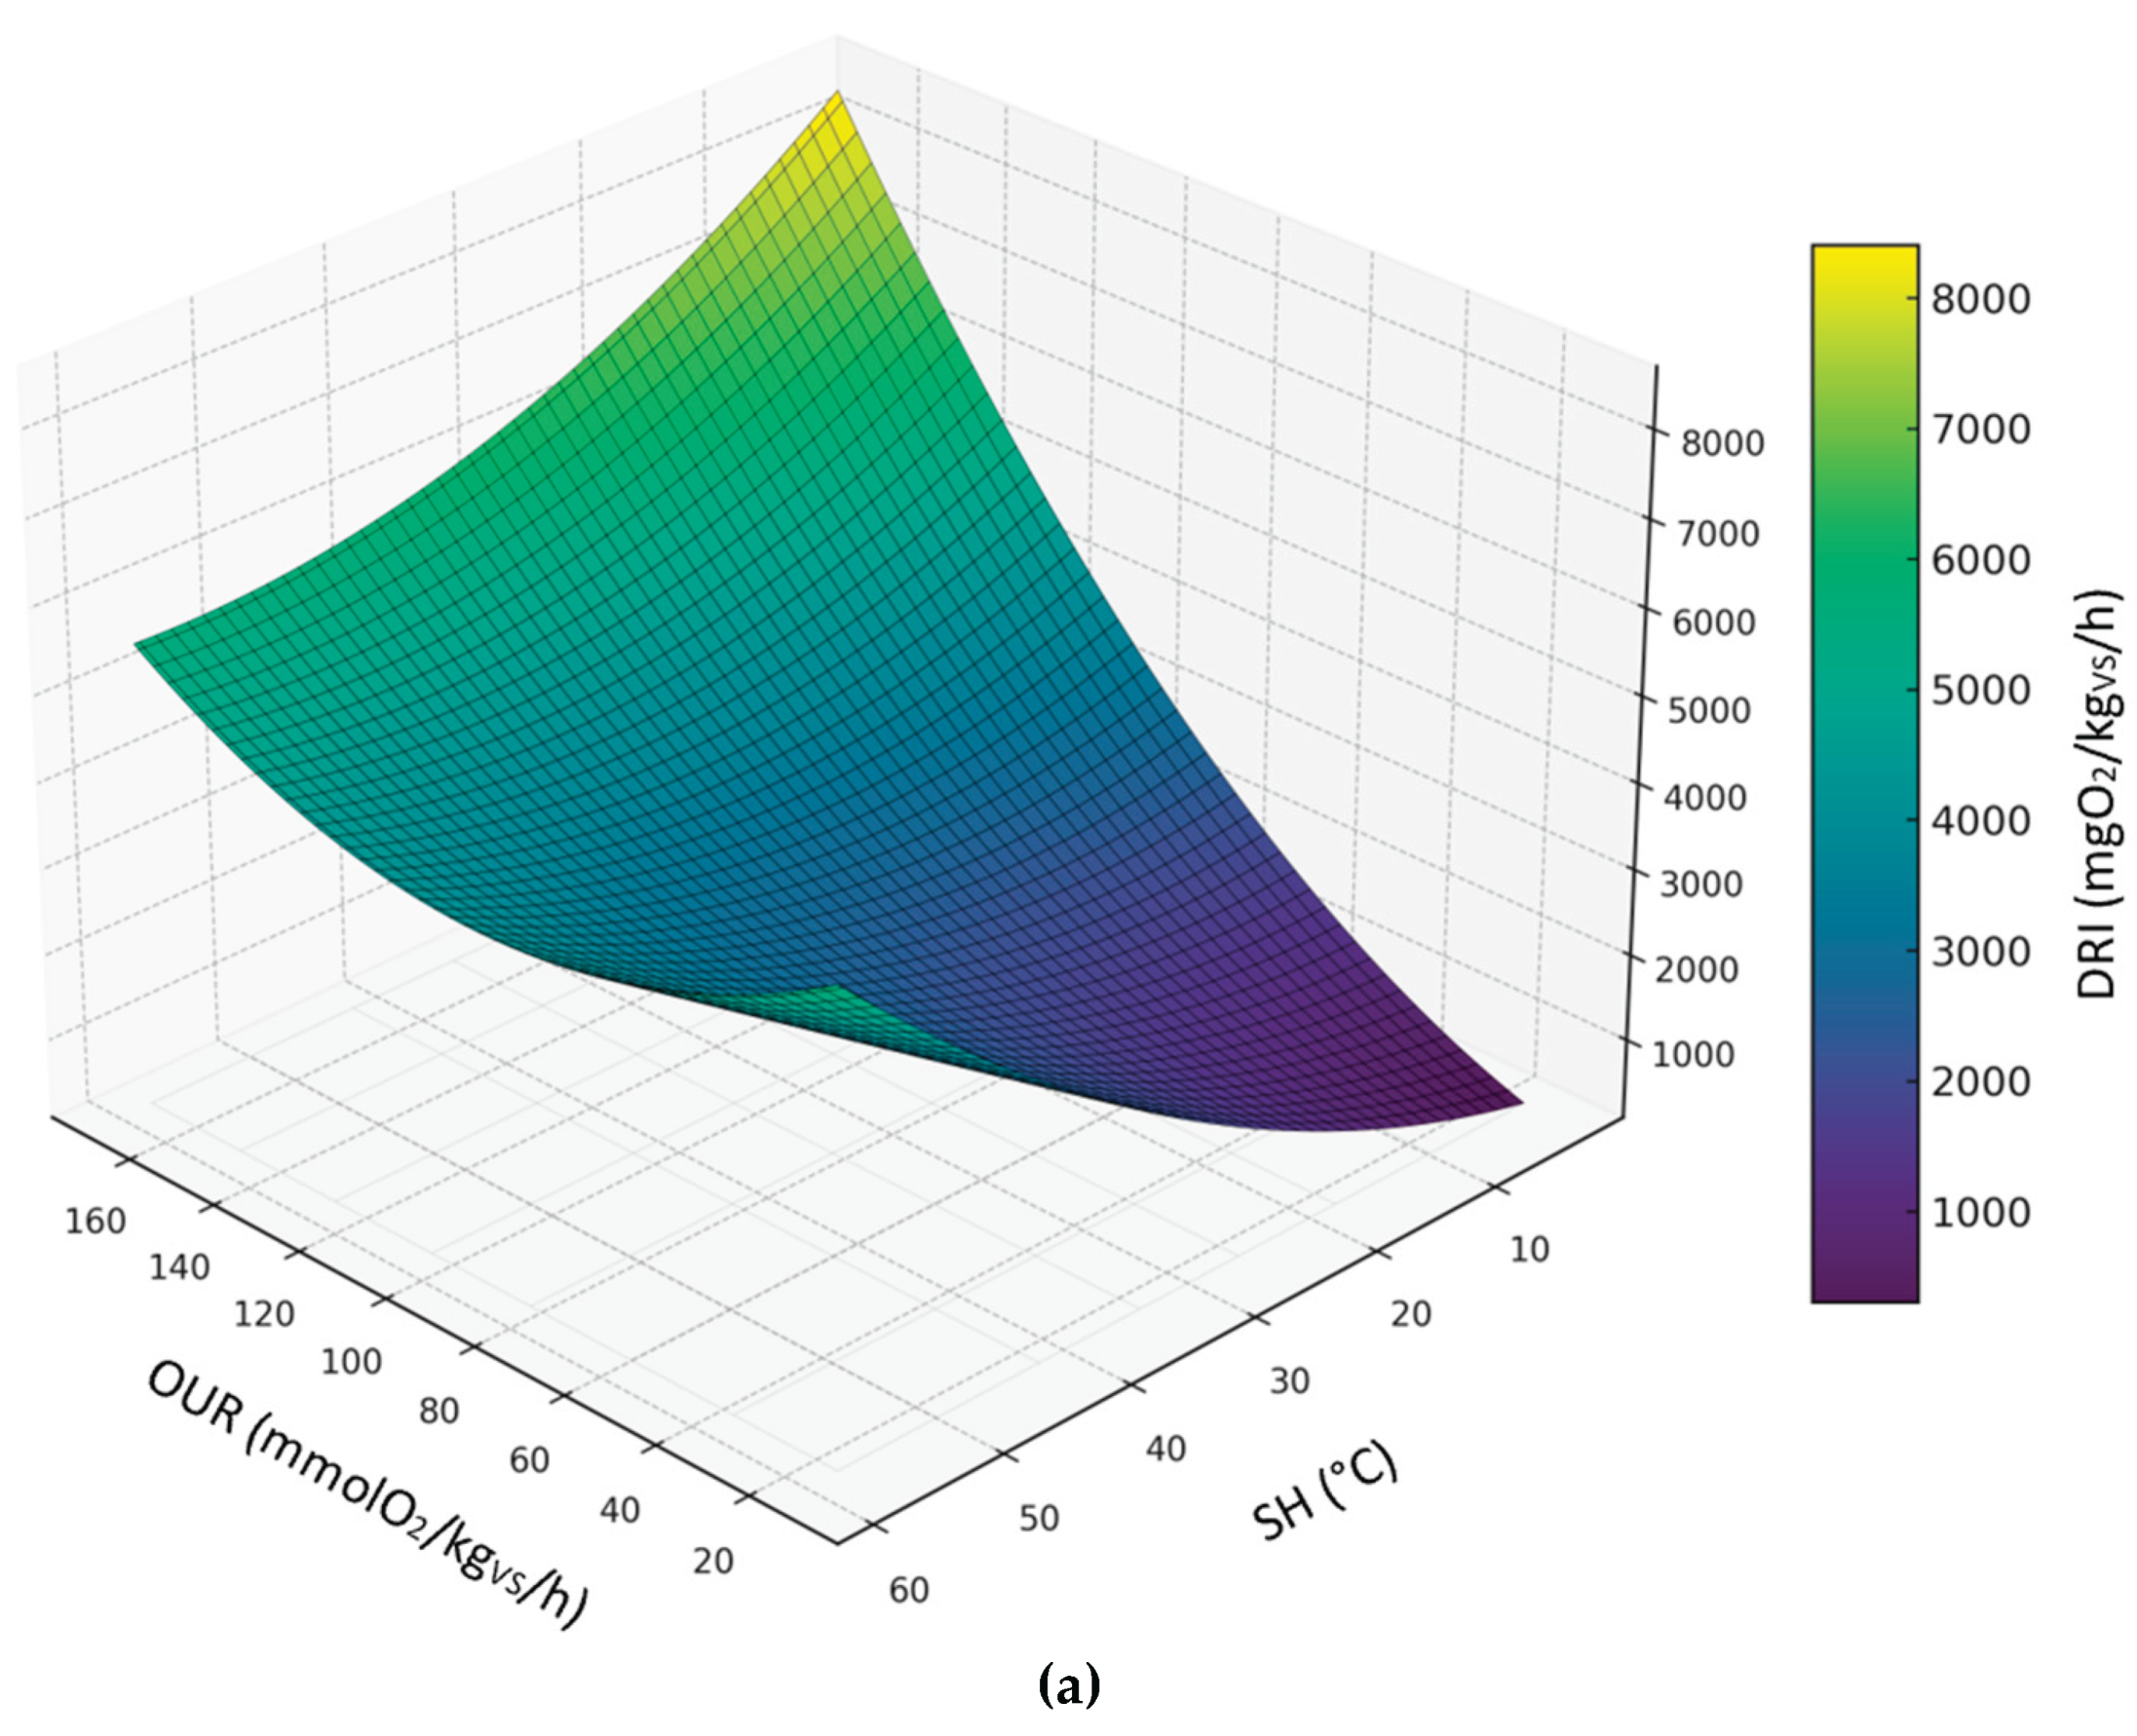
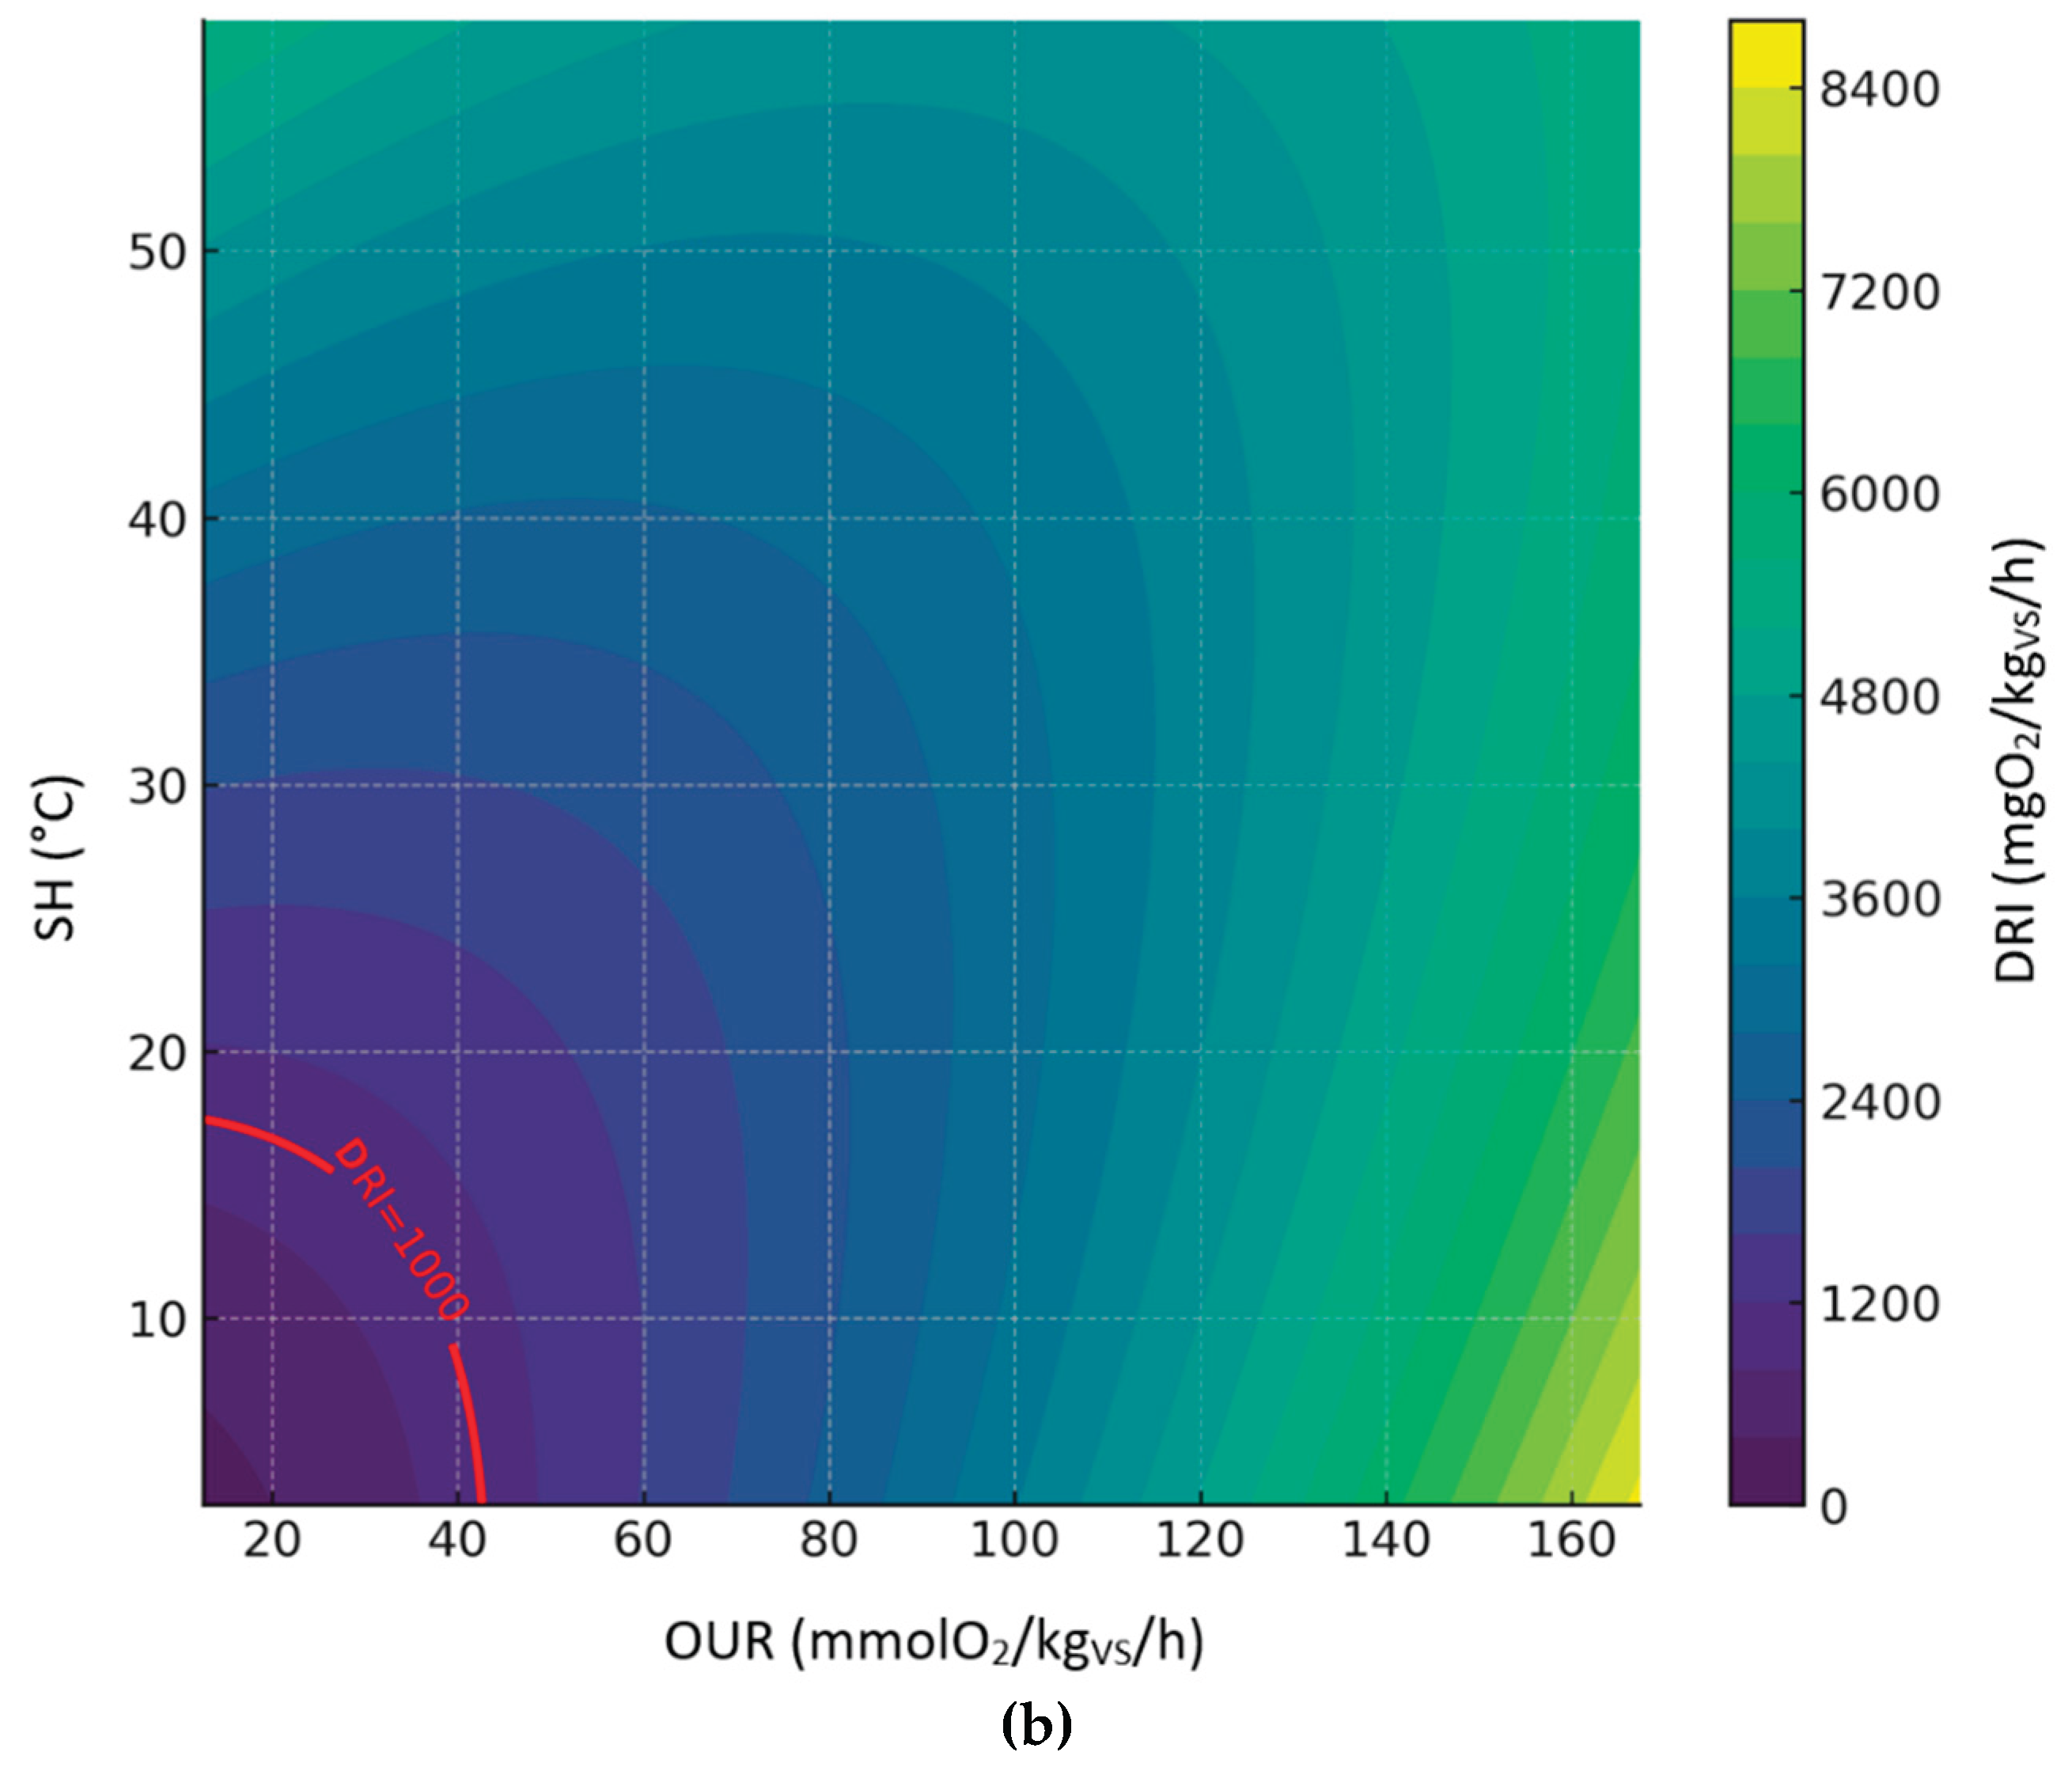
Table 1.
Dewar Self-Heating Increments, Rating and Description of Stability Classification based on the European System.
Table 1.
Dewar Self-Heating Increments, Rating and Description of Stability Classification based on the European System.
| Temperature Rise Above Ambient in C | OfficialClass of Stability | Descriptors of Class or Group | Major Group |
| 0 – 10° | V | Very stable, well-aged compost | Finished compost |
| 10 – 20° | IV | Moderately stable; curing compost | |
| 20 – 30° | III | Material still decomposing; active compost | Active compost |
| 30 – 40° | II | Immature, young or very active compost | |
| 40 – 50° (or more) | I | Fresh, raw compost, just mixed ingredients | Fresh compost |
Table 2.
Minimum (Min), maximum (Max) and average (Av.) values of the main physical and chemical parameters measured for digestate and compost.
Table 2.
Minimum (Min), maximum (Max) and average (Av.) values of the main physical and chemical parameters measured for digestate and compost.
| TS (%) | VS (%) | pH | C/N | |||||||||
| Min | Max | Av. | Min | Max | Av. | Min | Max | Av. | Min | Max | Av. | |
| Digestate | 1.44 | 88.9 | 35.5 | 47.0 | 91.0 | 66.0 | 4.5 | 8.7 | 7.3 | 6.0 | 21.5 | 11.4 |
| Compost | 9.6 | 92.7 | 70.8 | 29.0 | 87.1 | 49.3 | 4.0 | 9.0 | 7.4 | 12.0 | 15.9 | 13.7 |
Table 3.
Results of second-order polynomial regression models, summarizing sample type, target index, model equation, R-squared (R2) and the Root Mean Squared Error (RMSE).
Table 3.
Results of second-order polynomial regression models, summarizing sample type, target index, model equation, R-squared (R2) and the Root Mean Squared Error (RMSE).
| Dataset | Target Index | Equation | R² | RMSE |
| Compost | RBP | RBP = -0.0852 + 0.0018·OUR + 0.0104·SH + -0.0000·OUR² + -0.0002·SH² + 0.0000·OUR·SH | 0.96 | 0.038 |
| Compost | DRI | DRI = -223.3858 + 21.4709·OUR + 45.2233·SH + -0.0817·OUR² + -0.7418·SH² + 0.4477·OUR·SH | 0.97 | 257.85 |
| Digestate | RBP | RBP = 0.0598 + 0.0026·OUR + -0.0003·SH + 0.0000·OUR² + 0.0002·SH² + -0.0002·OUR·SH | 0.60 | 0.052 |
| Digestate | DRI | DRI = -173.9605 + 28.1243·OUR + 28.3748·SH + 0.0282·OUR² + 0.9664·SH² + -0.6159·OUR·SH | 0.95 | 266.32 |
| All sample | RBP | RBP = 0.0295 + 0.0005·OUR + 0.0046·SH + -0.0000·OUR² + -0.0001·SH² + 0.0000·OUR·SH | 0.84 | 0.065 |
| All sample | DRI | DRI = -57.9241 + 19.7859·OUR + 32.0990·SH + -0.0182·OUR² + 0.1918·SH² + 0.0046·OUR·SH | 0.96 | 299.58 |
Disclaimer/Publisher’s Note: The statements, opinions and data contained in all publications are solely those of the individual author(s) and contributor(s) and not of MDPI and/or the editor(s). MDPI and/or the editor(s) disclaim responsibility for any injury to people or property resulting from any ideas, methods, instructions or products referred to in the content. |
© 2025 by the authors. Licensee MDPI, Basel, Switzerland. This article is an open access article distributed under the terms and conditions of the Creative Commons Attribution (CC BY) license (http://creativecommons.org/licenses/by/4.0/).
Copyright: This open access article is published under a Creative Commons CC BY 4.0 license, which permit the free download, distribution, and reuse, provided that the author and preprint are cited in any reuse.


