
Submitted:
16 December 2025
Posted:
17 December 2025
You are already at the latest version
Abstract
Climate change is a growing concern, and its effects on biodiversity may depend largely on its consequences on the distribution of species that play a key role in communities. This study aims to determine whether forests in the Sudanian zone of Senegal will maintain the environmental conditions required for fifteen valuable species to persist under a range of climate change scenarios. We used forest inventory data from 2,398 plots and five bioclimatic variables as predictors. The distribution of the species was evaluated under three SSP scenarios (SSP2-4.5, SSP3-7.0 and SSP5-8.5) for the 2100 horizon by developing models for each species under each scenario using multiple logistic regression with a binomial distribution of the response. The findings indicate that the mean annual temperature is expected to increase in the region for all SSPs considered, while for precipitation metrics, some variability was observed depending on the scenarios. As demonstrated by our results, species distribution changes exhibited differences. Our models indicate a negative impact of climate for nine species, specifically Acacia macrostachya, Bombax costatum, Cordyla pinnata, Combretum micranthum, Detarium microcarpum, Prosopis africana, Pterocarpus erinaceus, Sterculia setigera and Terminalia avicennioides, under scenarios SSP2-4.5 and SSP3-7.0. These species would face significant declines under the most extreme scenario, scenario SSP5-8.5. The following species are predicted to decline significantly under the SSP2-4.5 and SSP3-7.0 scenarios: Pterocarpus erinaceus, Sterculia setigera, Terminalia avicennioides, and to be completely lost under the SSP5-8.5. Three species would maintain their distribution area under all scenarios SSP5-8.5. The results also indicate that species tend to move in a general west-southwest trajectory. Overall, the majority of high-value species are vulnerable to future climate, with a high risk of local extinction in the sudanian zone. This finding indicates the necessity for a reorientation of forest management strategies towards the implementation of adaptive management strategies to ensure the long-term resilience of forests. Urgent actions such as the development of specific management plans and monitoring schemes for vulnerable tree species, with the objective of minimizing their harvesting and promoting their regeneration, are required.
Keywords:
high-value species
; savannah
; niche modelling
; climate change
; threatened trees
1. Introduction
The Earth's surface temperature is rising (IPCC, 2022). Climate change is predicted to be one of the leading causes of species extinction worldwide and is a major threat to biodiversity (IPBES, 2019; IPCC, 2022). When climatic conditions change, species will either adapt, migrate or disappear (Feeley et al., 2012). However, it appears that the rate of future climate change will exceed the migration rates of most plant species (Neilson et al., 2005), so those that are unable to adapt are likely to be at risk of extinction. A meta-analysis of 1,103 species, including plants and animals from different regions, predicts that between 15% and 37% of those could become extinct by 2050 (Thomas et al., 2004). Threats to species and their habitat in Africa could be exacerbated due to a combination of factors, such as rapid population growth and poverty that has led to susceptibility to shifting climate change (IPCC, 2022).
In Senegal, rising temperatures and changes in rainfall patterns are expected to cause a shift from a humid to a more arid climate (Bodian, 2014; Sagna et al., 2016; Mbow, 2009). The impact of increasing temperatures and altered precipitation patterns will expose species to new environmental conditions that could have repercussions on their distribution (Gonzalez et al., 2001). For example, a number of species that were previously thought to be restricted to the more arid Sahel zone are now also found in the Sudanian zone (Herrmann and Tappan, 2013; Wittig et al., 2007). Shifts in species distributions may vary due to variations in species-specific requirements and adaptability (Scheiter & Savadogo, 2016). For instance, in Benin, the distribution of the endangered and valuable tree species Pterocarpus erinaceus Poir. is predicted to decrease (Biaou et al., 2023), while another valuable tree species, Bombax costatum Pellegr. & Vuillet, is predicted to expand its distribution into Mali (Coulibaly et al., 2023). In Senegal, it is predicted that Cordyla pinnata (Lepr. ex A. Rich.) Milne-Redh., one of the most valuable tree species, will lose almost half of its habitat range due to climate change (Sambou et al., 2024).
These contrasting results indicate that the degree of vulnerability to climate change of tree species in Sudanian zone may also vary according to local conditions. These local conditions can have various impacts on the life cycle of plants that can explain their degree of vulnerability to climate change. Although some studies in this country have reported the loss of certain tree species (Herrmann and Tappan, 2013; Gonzalez et al., 2012), regional satellite images have shown an increase in vegetation cover due to improved land management and increases in rainfall these recent years (Brandt et al., 2015). Rainfall and temperature have been identified as the main factors explaining changes in the distributions of trees and shrubs in the Sudano-Sahelian region (Gonzales et al.,2001).
Determining how the current occurrence of certain species correlates with bioclimatic data, like temperature and precipitation, can be used to explore how changing climate conditions under different scenarios might affect the geographic distribution of species (Amiri et al., 2020). This modeling approach is based on the hypothesis of the potential or fundamental niche of species (Hutchinson, 1957) and can help to understand climatic preferences of species (Pearson & Dawson, 2003). Predicting how tree species respond to climate change through their distribution is crucial for better planning of forest management strategies (Sinclair et al., 2010; Pecchi et al., 2019). However, few studies have investigated the potential impacts of climate change on forest tree species distributions in Senegal (Ndao et al., 2022; Sambou et al., 2024). Future research should examine the impact of climate change on the most valuable species in their natural habitats, mainly protected areas.
The Sudanian zone is important for conserving biodiversity as it is one of the largest biodiversity hotspots of Senegal. It covers a large number of protected areas, including national parks and protected forests commonly named classified forests. Forest management practices have historically focused on selective harvest of certain species, without considering potential climate change impacts on these species. Unfortunately, in this zone where many forests have been under management, this information on species range evolution under future climate is lacking for many species. To generate information for decision making on forest resources management, this study selected fifteen valuable species listed below to explore how climate conditions influence their likelihood of occurrence for different climatic scenarios. These species are of great importance for domestic and commercial uses, including energy, human consumption and traditional medicine (Ba et al., 2006; Diop et al., 2011). Furthermore, these valuable species are under increasing pressure from human activities due to their intensive and unregulated harvesting (Sambou, 2004; MEDD, 2015).
This study aimed to predict the occurrence of fifteen valuable species in the Sudanian zone of Senegal under three of the IPCC shared socioeconomic pathway (SSP) scenarios: SSP2-4.5, SSP3-7.0 and SSP5-8.5. SSP2-4.5 represents a low forcing pathway with growth and equity towards sustainability, SSP3-7.0 is the medium forcing scenario with medium climate change challenges, and SSP5-8.5 would be the most chaotic scenario under the assumption that there will be no mitigation action. In addition, this study will assess whether forests will maintain the environmental conditions required for these fifteen species under climate change scenarios. The results of many scientific studies show that national-scale range shifts southward is occurring (Bodian, 2014; Sagna et al., 2016; Mbow, 2009). Given the determinant role of climatic factors in the distribution of species in the Sudanese zone, it is expected that typical Sudanese species may shift their distribution, while Sahelo-Sudanese species may expand their range. Therefore, beyond species sensitive to climate, we expected differential responses due to species-specific climatic preferences.
2. Material and Methods
2.1. Studied Species and Their Geographic Distribution
Fifteen woody species identified for their roles in the national economies and the intensity of the harvesting pressure they experience were selected (Sambou, 2004; Diop et al., 2011; Dieng et al., 2016). These species include Acacia macrostachya Reichenb., Anogeissus leiocarpus (DC.) Guill. et Perrot., Bombax costatum Pellegr. & Vuillet, Combretum glutinosum Perr.Ex DC, Combretum micranthum G. Don, Combretum nigricans Lepr., Cordyla pinnata (Lepr. ex A.Rich.) Milne-Redh., Daniellia oliveri (Rolfe) Hutch & Dalz, Detarium microcarpum Guill. & Perr., Lannea acida A. Richard., Parkia biglobosa (Jacq.) G.Don, Prosopis africana (G. et Perr.), Pterocarpus erinaceus Poir., Sterculia setigera Del. and Terminalia avicennioides Guill and Perr. These high- value species are widely distributed in the Sudanian zone, which covers approximately two-thirds of central and southern Senegal, located between 12°20' - 15°10' North and 11°20' - 16°75' West, within isohyets of 500 and 1200 mm (Figure 1). The biophysical context of this zone is mainly influenced by its geographical position and humid tropical climate. The Sudanian domain is situated south of the Sahelian domain, and differs from it in terms of climate and vegetation physiognomy. This zone has a climate characterised by two contrasting seasons: a dry season, which lasts from November to May, and a rainy season, which lasts from June to October. The average annual rainfall is estimated at 900 ± 200 mm, while the average annual temperature is 28°C (ANACIM, 2020).
2.2. Species Presence Data
Species presence-absence data for each of the fifteen species were the response variables for this study. Data points was generated based on their presence or absence in 2,398 plots of 20 x 20 m that were randomly distributed in the different forests following a stratified sampling design (Sambou, 2004). The geographic coordinates in the WGS84 system for each plot were recorded from twenty forests stands.
2.3. Bioclimatic Data
The nineteen (19) bioclimatic variables provided by the World Clim database (Fick and Hijmans, 2017), and interpolated at a resolution of 2.5 arc-minutes (~ 4.6 km) were used as potential predictors of species distributions in this study (Table 1).
We used the historical climate data from WorldClim, covering the period from 1970 to 2000, to fit the models. Then, we used the fitted models (described below) along with the future climate data from WorldClim to make projections for two-time horizons, 2041-2060 and 2081-2100, and three of the IPCC shared socioeconomic pathway (SSP) scenarios: SSP2-4.5, SSP3-7.0 and SSP5-8.5. SSP2-4.5 represents a low forcing pathway with growth and equity towards sustainability, SSP3-7.0 is the medium forcing scenario with medium climate change challenges, and SSP5-8.5 would be the most chaotic scenario under the assumption that there will be no mitigation action. For each time horizon and SSP, we averaged the output of 11 climate models available in WorldClim: ACCESS-CM2, BCC-CSM2-MR, CMCC-ESM2, EC-Earth3-Veg, GISS-E2-1-G, INM-CM5-0, IPSL-CM6A-LR, MIROC6, MPI-ESM1-2-HR, MRI-ESM2-0 and UKESM1-0-LL.
2.4. Selection of Bioclimatic Predictors
In order to avoid model’s overfitting and increase the accuracy of species occurrence predictions (Amiri et al., 2020), the following approach was used to select a subset of the least correlated predictors from the 19 bioclimatic variables. First, a principal component analysis was performed on the variables using the FactoMineR package (Lê et al., 2018) in the R statistical programming software (version 4.2.2) and a preliminary set of predictors was selected by visual inspection of the PCA plot (Figure 2), choosing only 1 variable among each set of highly-correlated ones. Then, the variance inflation factor (VIF) was used to evaluate multicollinearities in this set of predictors, and a minimal number of predictors was removed, if necessary, until all VIFs were less than 10.
Based on the position of the 19 variables in the PCA (Figure 2), the five following bioclimatic variables were selected for the models: annual mean temperature (temp_mean_ann), maximum temperature of warmest month (temp_max_mon), minimum temperature of the coldest month (temp_min_mon), annual precipitation (prec_ann), and precipitation seasonality (prec_season). These bioclimatic variables were considered as important predictors of species distribution and had correlation values which were relatively acceptable (pairwise Pearson correlation coefficient < 0.7 and VIF < 7).
2.5. Species Distribution Models
A separate generalized linear mixed model (GLMM) was fit to the data of each species, relating its probability of presence to a linear combination of the bioclimatic variables with a logit link (Guisan et al., 2002), for each future scenario. The lme4 package in R (Bates et al., 2015) was used to fit the models. The values of the bioclimatic variables during the reference period (1970-2000) were extracted from the WorldClim data at the geographic position of each of the 2398 plots. Standardized versions of the bioclimatic predictors (subtracting their mean across all plots and dividing by their standard deviation) were used as inputs to the models. As the plots were grouped into grid squares within each forest, the forest and grid square were used as random effects in the models to account for the spatial structure of the data. For each future time horizon and climate scenario, we produced predictions of the probability of presence of each species across the full study area (Sudanian zone of Senegal) using the predict function in the terra package in R (Hijmans, 2024).
3. Results
3.1. Variation of Bioclimatic Variables According to the Different Scenarios
Table 2 presents the mean value of each of the selected bioclimatic variables across the Sudanian domain of Senegal (Fig. 2), for the reference period 1970-2000, and those projected for 2041-2060 and 2081-2100 for each of the three climate scenarios. The results indicate that the mean annual temperature is expected to increase in the region for all SSPs considered, with a divergence in temperature changes becoming more pronounced over time. On average, an increase of 2.4°C, 3.1°C, and 3.8°C is noted for SSP2, SSP3, and SSP5, respectively, when compared to the reference period. Other temperature metrics (for the warmest and coldest months) follow approximatively the same tendency as mean annual temperature.
Regarding precipitation metrics, there is some variability depending on the scenarios. A slight increase in average precipitation is expected for SSP2. The total annual precipitation in the region, which is approximately 850.5 mm/year for the reference period, is expected to increase to approximately 887.5 mm for the first period of SSP2 (2041-2060) and to 886 mm in the second period (2081-2100) of this scenario. In contrast, the SSP3 scenario shows stability in the first period and a decrease in the second period. The largest declines for both periods are observed in SSP5. As for precipitation seasonality, all its values exceed 100% which indicate a high intra-annual variability.
Temperature rise combined with a lack of precipitation will lead to an increase in evapotranspiration. This indicates that the climatic context in the study region will be characterized by water stress.
3.2. Relationship of Bioclimatic Variables and Species Occurrence
Depending on species, bioclimatic variables show variable relationships with their occurrence (Table 3). We found that an increase of mean temperature has a significant and negative effect on occurrence of Acacia macrostachya, Bombax costatum, Combretum micranthum, Cordyla pinnata and Sterculia setigera, while its effect is positive for Anogeissus leiocarpus. Apart from Acacia macotachya and Combretum micranthum (positive effect), maximum temperature of the warmest month has a significant negative effect on Daniellia oliveri, Detarium microcarpum, Parkia biglobosa and Pterocarpus erinaceus and a positive effect on Acacia macrostachya and Combretum micranthum. As for the minimum temperature of the coldest month, it has a negative effect only on Prosopis africana. However, for other species, namely Bombax costatum, Combretum micranthum, Cordyla pinnata, Pterocarpus erinaceus, and Sterculia setigera, it has a positive effect.
Regarding precipitation metrics, an increase in annual precipitation had a significant positive effect on the size of the predicted distribution area of Combretum nigricans, Daniellia oliveri, Detarium microcarpum, Lannea acida, Parkia biglobosa, Pterocarpus erinaceus and Terminalia avicennioides, but a negative effect for other species, including Acacia macrostachya, Combretum glutinosum and Combretum micranthum. Similarly, a greater seasonality of precipitation would negatively and significantly impact the distribution of Bombax costatum, Combretum glutinosum, Pterocarpus erinaceus and Sterculia setigera. It is worth noting that none of the studied species showed any positive effects from this seasonality of precipitation.
3.3. Evolution of Species Occurrence Under Different Climate Scenarios
Seven species, namely Acacia macrostachya, Bombax costatum, Combretum micranthum, Cordyla pinnata, Pterocarpus erinaceus, Sterculia setigera and Terminalia avicennioides, which have low to moderate frequencies in the study area in the current climate, experience a major decrease of their potential distribution in all future scenarios and may be completely lost under the worst scenario. In contrast, Anogeissus leiocarpus and Parkia biglobosa become highly frequent present in the future climate scenarios. The remaining six species, from the rarely present Prosopis africana to the very widely distributed Combretum glutinosum, show less drastic and less consistent changes across scenarios, although Combretum nigricans and Detarium microcarpum show a high decrease in their probability of presence for the worst scenario and longest time horizon (Table 4).
3.4. Evolution of Species Distribution Under Climate Scenarios
Our models indicate different patterns on species distribution (expansion, restriction, persistence and west-southwest trajectory) according to scenario and period. For instance, Acacia macrostachya, which is widely present in the northern part of the studied zone, experiences a large decrease in its probability of presence across the zone, regardless of the specific scenario (Figure 3). Unlike Acacia macrostachya, the time horizon seems favorable for the development of Anogeissus leiocarpus (Figure 4). Indeed, its potential distribution area shows a significant increase in both the different scenarios and the two time periods. Furthermore, this trend is also observed and becomes more pronounced for the second period (2081-2100) and the chaotic scenario of environmental conditions. Initially present in a small part of the extreme north-east of the study area, the species' distribution area would expand to the entire Sudanian zone from east to west and from north to south. However, its presence in the extreme southwest is only observed in the second period of the chaotic scenario of environmental conditions in which the species would be present throughout the studied area. The evolution of this species seems to depend much more on the time horizon than on the climatic conditions.
Bombax costatum, which is initially fairly scattered throughout the area, will completely disappear from the area under study over the specified time horizon (Figure 5).
As for the different Combretum species, we noted various patterns. Combretum glutinosum which was initially present in the entire Sudanian zone will experience a decrease over time during all three scenarios (Figure 6). Indeed, in all scenarios, the area of its distribution decreased with the most significant decline occurring in the second period of all scenarios and mostly that of the SSP2. During this second period of all scenarios, we also noted that this decline is affecting several different parts of the region. In the SSP2 scenario, the decline will occur in the far east and south, whereas in the SSP3 and SSP5 scenarios, this decrease will happen in the south-western and in extreme eastern parts, respectively (Figure 6). Regarding Combretum micranthum which was initially infrequent and mainly present in the southern part of the study area, it is expected to completely lose its potential distribution area over time regardless the specific climatic scenario (Figure 7). As for Combretum nigricans, which occurs mainly in the southern area of the region, it is projected to expand further south in the SSP 2 and SSP 3 scenarios, particularly in the second time period. Under SSP5, however, its distribution is expected to decrease (Figure 8). This is particularly true in the second period, when it decreases significantly towards the extreme south (Figure 8).
Cordyla pinnata is currently found with a relatively high probability in the southern and extreme western parts of the region (Figure 9). However, it is expected to decrease significantly in all climate scenarios and time horizons, except in the second period of SSP5, where it is predicted to disappear completely from the study region (Figure 9).
Daniellia oliveri, initially common in the western part of the region, will expand its range further south. This increase will be more pronounced in the second period of the SSP2 and SSP3, and to a lesser extent in the SSP5 (Figure 10). The distribution area of Detarium microcarpum generally decreased, except in the first period of SSP2, where it remained relatively similar to that of the reference period. In the second period of SSP5, this species that was more frequent in the south-western part, experienced a range restriction towards the extreme west (Figure 11). Lannea acida will experience a moderate expansion of its area of distribution in all scenarios and in both time periods. This species was originally found only in the southwest. In the future, it will be present in the entire southern strip of the region (Figure 12). Parkia biglobosa, a species initially more abundant in the southwest, tends to expand its range in all climate scenarios (Figure 13). However, the extent of this expansion varies according to the scenario and the time horizon. It covers almost the entire southern region and is more pronounced in the second study period in all climate scenarios. The expansion in SSP5 and, to a lesser extent, in SSP2 compared to SSP3 is of great importance (Figure 13).
Prosopis africana, a rare species, is likely to disappear in all climate scenarios and time periods (Figure 14). Pterocarpus erinaceus would also have a drastic reduction in distribution. In all scenarios and time horizons, this species which currently occupies the extreme west and almost the entire southern part of the region, would experience a significant loss of its range (Figure 15). It would eventually be restricted to the extreme south and west of the region. In the worst scenario, it would only be present in very small areas in the extreme southwest of the study area. (Figure 15). Similar to Prosopis africana, Sterculia setigera, weakly represented in the eastern part of the region, is likely to disappear in all scenarios and time horizons (Figure 16). Terminalia avicennioides, a species originally found in the extreme southwest, will experience a significant reduction in its range. Its range will be restricted to a small area in the extreme southwest in all climate scenarios and time periods, except in the chaotic scenario where it disappears completely (Figure 17).
4. Discussion
We investigated how climate change may affect the occurrence of fifteen high-value species from an ecological niche modelling based on presence-absence data. We expected and found differences in species distribution changes which is not surprising given specific-species responses to climate conditions. We found that nine out of the fifteen high-value species would be completely lost within the study area, two will remain relatively stable in their range while only three would expand their distribution or maintain their suitable range. These findings are consistent with the growing literature in many biogeographical zones that shows various patterns (Brice et al., 2019; Dyderski et al., 2018; Mkala et al., 2022). One possible explanation of this difference could be related to species performance to a changing climate (Muller et al., 2019). Changing of climatic conditions can compromise the survival and development of a wide variety of species and exert a range of influences on the life cycle of plants. There may be both direct and indirect consequences on valuable species (Valladares et al., 2014; Bocedi et al., 2013). The quality of habitat for plant species is likely to be influenced by climate change in a number of ways. Some species will be able to adapt by colonizing new areas, while others will be forced to disappear from their existing habitats (Urban, 2015; Van der Putten et al., 2010). We also found that shifts in high-value species ranges are expected to be more severe by 2081-2100 compared to 2041-2060 as found by Sambou et al. (2024). This indicates that long-term effects of environmental changes on species are critical because even if climatic conditions improve, a species in decline will not necessarily see its potential range expand (Harrison et al., 2006).
It is worth noting with our models that the range of nine species namely Acacia macrostachya, Bombax costatum, Cordyla pinnata, Combretum micranthum, Detarium microcarpum, Prosopis africana, Pterocarpus erinaceus, Sterculia setigera and Terminalia avicennioides would drastically decline under SSP 2-4.5 and SSP 3-7.0 and would be completely lost in the most drastic scenario (SSP 5-8.5). This finding supports recent studies which point out the worst impact of climate change on species in the region (Agwu et al., 2020; Lompo et al., 2021; Sambou et al., 2024). In many western African countries, a shift of bioclimatic regions is expected (Da, 2010). The decline of these species suggests that under climate change scenarios, the Senegalese Sudanian zone may not contain environmental conditions that are favorable to their maintenance. This could be explained by the worsening environmental conditions in West Africa as climate change proceeds. According to IPCC projections, in West Africa, 2°C warming is expected to reduce precipitation in the western part of West africa, where this study area is found, leading to a drier and arid climate. This projection is confirmed by our finding that demonstrates an increase of temperature metrics for all SSPs considered. This increase is estimated to vary between 2.4°C to 3.8°C from SSP2 to SSP5 compared to the reference scenario. It is known that if warming exceeds 3°C, droughts will become more frequent (IPCC, 2022). This is confirmed by our results on annual precipitation which predict a decrease over time even if we noted a certain variability. This variability is also consistent with the high estimated value of precipitation that is more than 100 %. These results indicate that the climatic context in the study region will be characterized by water stress.
We also found for the nine species that are declining, either temperature exclusively (C. pinnata and P. africana), only precipitation (C. nigricans and T. avicennioides) or both temperature and precipitation metrics (A. macrostachya, B. costatum, C. micranthum, P. erinaceus and S. setigera) adversely affect their potential distribution. This result suggests that it may be relevant to explain the potential distribution of high-value species related to climate change scenarios. For instance, our finding on the decline of Cordyla pinnata which is consistent with that of Sambou et al. (2024) who have found a drastic change in its distribution under SSP 585, could be linked with the negative effect of mean temperature (BIO 1) on its distribution. This finding is in accordance with the previous study who highlighted the greatest contribution of mean temperature of the coldest quarter (BIO 11) that cause the decrease of Cordyla pinnata (Sambou et al., 2024). One possible explanation of our result could be linked to the high sensitivity to desiccation of its fruits (berries) which have limited ability to resist in a hotter environment.
Our models also predict the decline of Bombax costatum. This result is consistent with that of Deguenon et al. (2021) who has shown an expansion of its unsuitable habitat in Benin. However, our finding is contrasting to the expansion of its range predicted in Mali (Coulibaly et al., 2023). B. costatum saplings are sensitive to water stress and this could explain a decline under the future climate (Zerbo et al., 2023). But this species is also known to have high ability of vegetative regeneration (Ouédraogo and Thiombiano, 2012) which could influence positively species resistance to more arid conditions.
As for Pterocarpus erinaceus, its decline found from this study is consistent with the finding of Biaou et al (2023) and Adjonou et al (2020) who demonstrated a significant reduction of this species under future climate scenarios in Benin and Senegal, respectively. In contrast, Adjonou et al (2020) highlighted an expansion of this species in other countries of West Africa. Our models show that maximum temperature of warmest month is the leading cause of the decline. This result is in accordance with Biaou et al (2023) who highlighted the greatest influence of temperature metrics (BIO 2 and BIO 3). But for Adjonou et al (2020), annual precipitation (BIO 12) followed by temperature seasonality (BIO 4) are the most import precipitation metrics than determine the distribution of P. erinaceus in West Africa. Whatever the importance of these metrics on its distribution under future climate, Pterocarpus erinaceus is known as a threatened species both at global and national levels and its saplings are very sensitive to desiccation during dry season (Barstow, 2018; Groves et Rutherford, 2016). This could increase the risk of local extinction of Pterocarpus erinaceus in the region.
Additionally, our models indicated that Combretum nigricans would be relatively less affected compared to those previous species, while Detarium microcarpum, Lannea acida would maintain a relatively stability of their range. This result from Combretum nigricans and Daniellia oliveri could be linked to the positive impact of annual precipitation (BIO 12) as demonstrated by our models. As for Detarium microcarpum, its distribution would be positively affected by this annual precipitation metric but negatively affected by the maximum temperature of the warmest month (BIO 5). This simultaneous positive and negative effect may make a balance and could explaining the relative stability of its range. In contrast, Agbo et al. (2019) predicted an increase of the distribution of D. microcarpum in Benin over 2050 due to projected increase in rainfall which confirm our finding on the positive effect of annual precipitation on D. microcarpum distribution. This sensitivity of S. setigera to precipitation has been highlighted in Togo by Atakpama et al. (2016) who indicated that the vulnerability of S. setigera would increase with climate change due to water scarcity.
In contrast to previous species, we found an expansion of the range of Anogeissus leiocarpus, Parkia biglobosa and likely, a slight decrease in the range of Combretum glutinosum. One possible explanation of the expansion of A. leicarpus could be linked to the positive effect of mean temperature on its range as demonstrated by our models, while for Parkia biglobosa, we found both positive effect with annual precipitation (BIO 12) and negative effect with maximum temperature of the warmest month (BIO 5). This simultaneous positive and negative effect can be balanced and could explain the relative increase of its the range. This result from Parkia biglobosa is in accordance with the findings in Sudanian zone of Benin, where Parkia biglobosa exhibits resistance to future environmental conditions (Ayihouenou et al., 2016; Dotchamou et al., 2016). In Sudanian zone, Parkia biglobosa is contributing to the resilience of agroforestry systems to climate change due its specific characteristics (Rolo et al., 2023). In addition, our models show that Parkia biglobosa will likely expand further south in the Sudanian zone. This finding is in accordance with the continuous increase in the size of the population of Parkia biglobosa in some agrosystems of this study area (B. Sambou, personal communication, February 2024). Given that changes of environmental conditions are also driven by local factors, it is probable that the magnitude of changes will differ within the Sudanian zone. But future studies that integrate variations in local conditions could help understand the leading cause of this expansion and its resistance to a changing of climate.
Regarding Combretum glutinosum, we found a slight decrease on its future distribution that could be linked to the negative effect of both annual precipitation and precipitation seasonality. Despite this marginal reduction, the models show that most of the Sudanian zone will remain suitable for this species. This result is not surprising because Combretum glutinosum is very common, and is known to thrive in hotter and drier conditions in the Sudanian and Sahelian domains (Thombiano et al., 2006; Sambou, 2004).
In this study, we only focused on temperature and precipitations metrics and demonstrated that the changing of these climatic variables is key driver of future distribution of high-value species in the Sudanian zone. However, favorable or unfavorable climatic conditions alone cannot guarantee species survival. Vulnerability of tree species to climate change is undoubtedly influenced by various factors beyond climate, like species traits which could constraint or facilitate their establishment (Boakye et al., 2023; Butt & Gallagher, 2018; Chuang & Peterson, 2016). For instance, differences in species ability to compete can lead to redistribution of dominance between species (Cavin et al., 2013). Species competitive ability traits like vegetative regeneration is predicted to be prominent in Sudanian zone and could be beneficial to species survival in hotter and drier climate (Niang et al., 2024). This vegetative regeneration ability is more versatile and efficient across a wider range of environments. Both A. leiocarpus and C. glutinosum are known to have high vegetative reproductive capacity and rapid growth rates allowing them to adapt in a context of water scarcity (Osborne et al., 2018; Néké et al. (2006). In a context of water scarcity, species with deep roots like A. leiocarpus will have greater chance to access to water resources in the soil (Boakye et al., 2023; Hennenberg et al., 2005).
5. Conclusions
The findings of this study suggest a multi-faceted vulnerability of high-value species to climate change in the Sudanian zone. This situation is very concerning from a conservation perspective, as it is predicted that Sudanian climatic conditions will likely become unsuitable for most of high-value species. This finding is valuable for developing appropriate adaptive forest management strategies to ensure long-term resilience of species. To sustain forest management urgent actions like developing specific management plan and monitoring scheme for most vulnerable tree species. Furthermore, it should be considered whether the prediction models are sufficient to include these particularly sensitive species in Red Lists as extinction risk is also inferred from measures of change in range area. Although, it may be beneficial for future research to consider additional variables not included in the present work, like other environmental variables and species' capacity for dispersal that may affect their geographical distribution.
Funding Statement
This work was supported by Université du Québec en Abitibi Témiscamingue (UQAT).
Conflicts of Interest Statement
The author declares no conflict of interest.
Data Availability Statement
The data that support the findings of this study are available from the corresponding author, upon reasonable request.
References
- ANACIM. Services d’Informations météorologiques; Agence Nationale de l’Aviation Civile et de la Météorologie (ANACIM): Sénégal, 2020. [Google Scholar]
- Adjonou, K.; Abotsi, K. E.; Segla, K. N.; Rabiou, H.; Houetchegnon, T.; Sourou, K. B.; Kokou, K. Vulnerability of African Rosewood (Pterocarpus erinaceus, Fabaceae) natural stands to climate change and implications for silviculture in West Africa. Heliyon 2020, 6(6). [Google Scholar] [CrossRef]
- Agbo, R. I.; Idohou, R.; Vihotogbé, R.; Missihoun, A. A.; Dagba, R. A.; Assogbadjo, A. E.; Agbangla, C. Spatio-temporal dynamics of suitable habitats for Detarium microcarpum Guill. & Perr. (Caesalpiniaceae), a priority food tree species in Benin (West Africa). Modeling Earth Systems and Environment 2019, 5, 595–604. [Google Scholar]
- Agwu, O. P.; Bakayokoa, A.; Jimoh, S. O.; Dimobe, K.; Porembski, S. Impact of climate on ecology and suitable habitat of Garcinia kola heckel in Nigeria. Trees, Forests and People 2020, 1, 100006. [Google Scholar] [CrossRef]
- Amiri, M.; Tarkesh, M.; Jafari, R.; Jetschke, G. Bioclimatic variables from precipitation and temperature records vs. remote sensing-based bioclimatic variables: Which side can perform better in species distribution modeling? Ecological informatics 2020, 57, 101060. [Google Scholar] [CrossRef]
- Atakpama, W.; Wala, K.; Gouwakinnou, G. N.; Pereki, H.; Polo-Akpisso, A.; Akodewou, A.; Akpagana, K. Abundance, distribution pattern and potential suitable habitat of Sterculia setigera Del. in Togo (West Africa). International Journal of Innovation and Scientific Research ISSN 2351-8014 2016, Vol. 26(No. 1), 23–38. Available online: http://www.ijisr.issr-journals.org/.
- Ayihouenou, E. B.; Fandohan, A. B.; Sodé, A. I.; Gouwakinnou, N. G.; Djossa, A. B. Biogéographie du néré (Parkia biglobosa (Jack.) R. Br. ex. Don.) sous les conditions environnementales actuelles et futures au Bénin. In Bulletin de la Recherche Agronomique du Bénin, Numéro spécial Agronomie, Société, Environnement & Sécurité Alimentaire; 2016; pp. 93–108. [Google Scholar]
- Ba, C. O; Bishop, J.; Dème, M.; Diadhiou, H. D.; Dieng, A. B.; Diop, O.; Garzon, P. A.; Guèye, B.; Kébé, M.; Ly, O. K.; Ndiaye, V.; Ndione, C. M.; Sène, A.; Thiam, D.; Wade, I. A. Evaluation économique des ressources sauvages au Sénégal: Evaluation préliminaire des produits forestiers non ligneux, de la chasse et de la pêche continentale; UICN: Gland, Suisse et Cambridge, Royaume-Uni, 2006. [Google Scholar]
- Barstow, M. Pterocarpus erinaceus. The IUCN Red List of Threatened Species 2018: e.T62027797A62027800. Accessed on. 2018. (accessed on 06 April 2024). [CrossRef]
- Bates, D; Mächler, M; Bolker, B; Walker, S. Fitting Linear Mixed-Effects Models Using lme4. Journal of Statistical Software 2015, 67(1). [Google Scholar] [CrossRef]
- Biaou, S.; Gouwakinnou, G. N.; Noulèkoun, F.; Salako, K. V.; Kpoviwanou, J. M. R. H.; Houehanou, T. D.; Biaou, H. S. S. Incorporating intraspecific variation into species distribution models improves climate change analyses of a widespread West African tree species (Pterocarpus erinaceus Poir, Fabaceae). Global Ecology and Conservation 2023, 45, e02538. [Google Scholar] [CrossRef]
- Boakye, E. A.; Ceesay, A.; Osemwegie, I.; Kapoury, S.; Hounkpevi, A.; Matchi, I. I.; Tetteh, E. N. Climate change has limited effect on the growth of Afzelia africana Sm. and Anogeissus leiocarpus (DC.) Guill. and Perr. in riparian forests in the savannas of Ghana. Forestry 2023, 96(3), 316–325. [Google Scholar] [CrossRef]
- Bocedi, G.; Atkins, K. E.; Liao, J.; Henry, R. C.; Travis, J. M.; Hellmann, J. J. Effects of local adaptation and interspecific competition on species’ responses to climate change. Annals of the New York Academy of Sciences 2013, 1297(1), 83–97. [Google Scholar] [CrossRef]
- Bodian, A. Caractérisation de la variabilité temporelle récente des précipitations annuelles au Sénégal (Afrique de l'Ouest), Physio-Géo [En ligne]. 2014, mis en ligne le 02 novembre 2014. 2014, Volume 8. Available online: http://journals.openedition.org/physio-geo/4243. [CrossRef]
- Brandt, M.; Mbow, C.; Diouf, A. A.; Verger, A.; Samimi, C.; Fensholt, R. Ground-and satellite-based evidence of the biophysical mechanisms behind the greening Sahel. Global change biology 2015, 21(4), 1610–1620. [Google Scholar] [CrossRef]
- Brice, M. H.; Cazelles, K.; Legendre, P.; Fortin, M. J. Disturbances amplify tree community responses to climate change in the temperate–boreal ecotone. Global Ecology and Biogeography 2019, 28(11), 1668–1681. [Google Scholar] [CrossRef]
- Butt, N.; Gallagher, R. Using species traits to guide conservation actions under climate change. Climatic Change 2018, 151(2), 317–332. [Google Scholar] [CrossRef]
- Cavin, L.; Mountford, E. P.; Peterken, G. F.; Jump, A. S. Extreme drought alters competitive dominance within and between tree species in a mixed forest stand. Functional Ecology 2013, 27(6), 1424–1435. [Google Scholar] [CrossRef]
- Chuang, A.; Peterson, C. R. Expanding population edges: theories, traits, and trade-offs. Global change biology 2016, 22(2), 494–512. [Google Scholar] [CrossRef]
- Coulibaly, A.; Avakoudjo, H. G. G.; Idohou, R.; Vodounnon, E. J.; Diallo, S.; Cherif, M. Impact of climate change on the distribution of Bombax costatum Pellegr. & Vuillet in Mali, West Africa. Trees, Forests and People 2023, 11, 100359. [Google Scholar]
- Da, S. S. Spatial patterns of West-African plant diversity along a climatic gradient from coast to Sahel. Doctoral dissertation, Universitäts-und Landesbibliothek Bonn, 2010. [Google Scholar]
- Deguenon, S. D. D. M.; Idohou, R. A.; Akpona, T. J. D.; Azihou, F.; Assogbadjo, E. A.; Sinsin, B. Impact of Climate Change on Priority Plant Species Conservation in The Forests Under ONAB (the National Wood Office of Benin) Management. 2021. [Google Scholar] [CrossRef]
- Dieng, S.D.; Diop, M.; Goudiaby, A.; Niang-Diop, F.; Faye, L.C.; Guiro, I.; Sambou, S.; Lykke, A.M.; Sambou, B. Caractérisation des services écosystémiques fournis par Cordyla pinnata dans la périphérie de la Forêt classée de Patako au Sénégal. VertigO 2016, 16(2), 1–17. [Google Scholar]
- Diop, M.; Sambou, B.; Goudiaby, A.; Guiro, I.; Niang-Diop, F. Ressources végétales et préférences sociales en milieu rural senegalais. Bois et Forêts des Tropiques 2011, 4, 57–68. [Google Scholar] [CrossRef]
- Dotchamou, F. T.; Atindogbe, G.; Sode, A. I.; Fonton, H. N. Density and spatial pattern of Parkia biglobosa under climate change: the case of Benin. J Agric Environ Int Dev 2016, 110(1), 173–194. [Google Scholar]
- Dyderski, M. K.; Paź, S.; Frelich, L. E.; Jagodziński, A. M. How much does climate change threaten European forest tree species distributions? Global change biology 2018, 24(3), 1150–1163. [Google Scholar] [CrossRef]
- Feeley, K. J.; Rehm, E. M.; Machovina, B. Perspective: the responses of tropical forest species to global climate change: acclimate, adapt, migrate, or go extinct? Frontiers of biogeography 2012, 4(2). [Google Scholar] [CrossRef]
- Gonzalez, P. Desertification and a shift of forest species in the West African Sahel. Climate research 2001, 17(2), 217–228. [Google Scholar] [CrossRef]
- Gonzalez, P.; Tucker, C. J.; Sy, H. Tree density and species decline in the African Sahel attributable to climate. Journal of Arid Environments 2012, 78, 55–64. [Google Scholar] [CrossRef]
- Groves, Rutherford. La CITES et le Bois, Guide d’espèces d’arbres inscrites aux Annexes CITES, 103 p. 2016. Available online: https://www.kew.org/sites/default/files/2019-02/CITES%20and%20Timber_french.pdf.
- Guisan, Antoine; Edwards, Thomas C., Jr.; Hastie, Trevor. Generalized linear and generalized additive models in studies of species distributions: setting the scene. Ecological modelling 2002, 157.2-3, 89–100. [Google Scholar] [CrossRef]
- Harrison, PA.; Berry, PM.; Butt, N.; Nouveau, M. Modelling climate change impacts on species’ distributions at the European scale: implications for conservation policy. Environmental Science & Policy 2006, 9(Issue 2), Pages 116–128. [Google Scholar] [CrossRef]
- Hennenberg, K. J.; Goetze, D.; Minden, V.; Traoré, D.; Porembski, S. Size-class distribution of Anogeissus leiocarpus (Combretaceae) along forest–savanna ecotones in northern Ivory Coast. Journal of Tropical Ecology 2005, 21(3), 273–281. [Google Scholar] [CrossRef]
- Herrmann, S.M.; Tappan, G.G. Vegetation impoverishment despite greening: A case study from central Senegal. Journal of Arid Environments 2013, 90, pp 55–66. [Google Scholar] [CrossRef]
- Hijmans, R. terra: Spatial Data Analysis. R package version 1.7-74. 2024. Available online: https://rspatial.github.io/terra/, https://rspatial.org/.
- Hutchinson, G.E. Concluding remarks. Cold Spring Harbor Symp Quantitative Biol. 1957, 22, 415–427. [Google Scholar] [CrossRef]
- IPBES. Global assessment report on biodiversity and ecosystem services of the intergovernmental science-policy platform on biodiversity and ecosystem services; Brondizio, E. S., Settele, J., Díaz, S., Ngo, H. T., Eds.; IPBES secretariat, 2019. [Google Scholar]
- IPCC., 2022: Climate Change 2022: Impacts, Adaptation, and Vulnerability. Contribution of Working Group II to the Sixth Assessment Report of the Intergovernmental Panel on Climate Change; Pörtner, H.-O., Roberts, D.C., Tignor, M., Poloczanska, E.S., Mintenbeck, K., Alegría, A., Craig, M., Langsdorf, S., Löschke, S., Möller, V., Okem, A., Rama, B., Eds.; Cambridge University Press. Cambridge University Press: Cambridge, UK and New York, NY, USA; p. 3056 pp. [CrossRef]
- Lê, S; Josse, J; Husson, F. FactoMineR: A Package for Multivariate Analysis. Journal of Statistical Software 2008, 25(1), 1–18. [Google Scholar] [CrossRef]
- Lompo, O.; Dimobe, K.; Mbayngone, E.; Savadogo, S.; Sambaré, O.; Thiombiano, A.; Ouédraogo, A. Climate influence on the distribution of the yellow plum (Ximenia americana L.) in Burkina Faso. Trees, Forests and People 2021, 4, 100072. [Google Scholar] [CrossRef]
- Mbow, C. Potentiel et dynamique des stocks de carbone des savanes soudaniennes et soudano-guinéennes du Sénégal; Thèse de Doctorat d’État ès Sciences. Institut des Sciences de l’Environnement, Université Cheikh Anta Diop: Dakar, 2009; p. 319 p. [Google Scholar]
- MEDD. Stratégie nationale et plan d’actions pour la biodiversité. 2015. [Google Scholar]
- Mkala, E. M.; Mutinda, E. S.; Wanga, V. O.; Oulo, M. A.; Oluoch, W. A.; Waswa, E. N.; Wang, Q. F. Modeling impacts of climate change on the potential distribution of three endemic Aloe species critically endangered in East Africa. Ecological Informatics 2022, 71, 101765. [Google Scholar] [CrossRef]
- Muller, J. J.; Nagel, L. M.; Palik, B. J. Forest adaptation strategies aimed at climate change: Assessing the performance of future climate-adapted tree species in a northern Minnesota pine ecosystem. Forest Ecology and Management 2019, 451, 117539. [Google Scholar] [CrossRef]
- Ndao, B; Leroux, L; Hema, A; Diouf, AA; Bégué, A; Sambou, B. Tree species diversity analysis using species distribution models: a F. albida parkland case study in Senegal. Ecol Indic 2022. [Google Scholar] [CrossRef]
- Neilson, R. P.; Pitelka, L. F.; Solomon, A. M.; Nathan, R. A. N.; Midgley, G. F.; Fragoso, J. M.; Thompson, K. E. N. Forecasting regional to global plant migration in response to climate change. Bioscience 2005, 55(9), 749–759. [Google Scholar] [CrossRef]
- Neke, K. S.; Owen-Smith, N.; Witkowski, E. T. Comparative resprouting response of Savanna woody plant species following harvesting: the value of persistence. Forest Ecology and Management 2006, 232(1-3), 114–123. [Google Scholar] [CrossRef]
- Niang, F.; Marchand, P.; Fenton, N.; Sambou, B.; Bouchard, E. Forecasting forest management impacts on regeneration traits of high socio-economic value species in Senegal's Sudanian zone, West Africa. Forest Ecology and Management 2024, 559, 121821. [Google Scholar] [CrossRef]
- Osborne, C. P.; Charles-Dominique, T.; Stevens, N.; Bond, W. J.; Midgley, G.; Lehmann, C. E. Human impacts in African savannas are mediated by plant functional traits. New Phytologist 2018, 220(1), 10–24. [Google Scholar] [CrossRef]
- Ouédraogo, A.; Thiombiano, A. Regeneration pattern of four threatened tree species in Sudanian savannas of Burkina Faso. Agroforestry Systems 2012, 86, 35–48. [Google Scholar] [CrossRef]
- Pearson, R. G.; Dawson, T. P. Predicting the impacts of climate change on the distribution of species: are bioclimate envelope models useful? Global ecology and biogeography 2003, 12(5), 361–371. [Google Scholar] [CrossRef]
- Pecchi, M.; Marchi, M.; Burton, V.; Giannetti, F.; Moriondo, M.; Bernetti, I.; Chirici, G. Species distribution modelling to support forest management. A literature review. Ecological Modelling 2019, 411, 108817. [Google Scholar] [CrossRef]
- Rolo, V.; Rivest, D.; Maillard, É.; Moreno, G. Agroforestry potential for adaptation to climate change: a soil-based perspective. Soil Use and Management 2023, 39(3), 1006–1032. [Google Scholar] [CrossRef]
- Sagna, P.; Ndiaye, O.; Diop, C.; Niang, A. D.; Sambou, P. C. Les variations récentes du climat constatées au Sénégal sont-elles en phase avec les descriptions données par les scénarios du GIEC ? ». In Irevues.Inist.fr: Pollution Atmosphérique, Climat, Santé; Société N°227, 2016. [Google Scholar]
- Sambou, B. Évaluation de l’état, de la dynamique et des tendances évolutives de la flore et de la végétation ligneuses dans les domaines soudanien et sub-guinéen au Sénégal. In Thèse; université Cheikh Anta Diop: Sénégal, 2004; p. 210 p. [Google Scholar]
- Sambou, M.; Koné, B.; Sane, S.; Vodounnon, M. E. J.; Diatta, A. A.; Diatta, L.; Mbow, C. Impact of climate change on the habitat range and distribution of Cordyla pinnata, Faidherbia albida and Balanites aegyptiaca in Senegal. In Modeling Earth Systems and Environment; 2024; pp. 1–19. [Google Scholar]
- Scheiter, S.; Savadogo, P. Ecosystem management can mitigate vegetation shifts induced by climate change in West Africa. Ecological Modelling 2016, 332, 19–27. [Google Scholar] [CrossRef]
- Sinclair, S. J.; White, M. D.; Newell, G. R. How useful are species distribution models for managing biodiversity under future climates? Ecology and Society 2010, 15(1). [Google Scholar] [CrossRef]
- Thiombiano, A.; Schmidt, M.; Kreft, H.; Guinko, S. Influence du gradient climatique sur la distribution des espèces de Combretaceae au Burkina Faso (Afrique de l'Ouest). Candollea 2006, 61(1), 189–213. [Google Scholar]
- Thomas, C. D.; Cameron, A.; Green, R. E.; Bakkenes, M.; Beaumont, L. J.; Collingham, Y. C.; Erasmus, B. F. N. Extinction Risk from Climate Change. Nature 2004, 427, 145–148. [Google Scholar] [CrossRef]
- Urban, M. C. Accelerating extinction risk from climate change. Science 2015, 348(6234), 571–573. [Google Scholar] [CrossRef]
- Valladares, F.; Matesanz, S.; Guilhaumon, F.; Araújo, M. B.; Balaguer, L.; Benito-Garzón, M.; Zavala, M. A. The effects of phenotypic plasticity and local adaptation on forecasts of species range shifts under climate change. Ecology letters 2014, 17(11), 1351–1364. [Google Scholar] [CrossRef]
- Van der Putten, W. H.; Macel, M.; Visser, M. E. Predicting species distribution and abundance responses to climate change: why it is essential to include biotic interactions across trophic levels. Philosophical Transactions of the Royal Society B: Biological Sciences 2010, 365(1549), 2025–2034. [Google Scholar] [CrossRef]
- Wittig, R.; König, K.; Schmidt, M.; Szarzynski, J. A study of climate change and anthropogenic impacts in West Africa. Environmental Science and Pollution Research-International 2007, 14, 182–189. [Google Scholar] [CrossRef]
- Zerbo, I.; Salako, K. V.; Hounkpevi, A.; Zozoda, D.; Kakaï, R. G.; Thiombiano, A. Impact of climate patterns, land-use types and exploitation on the population structure of Bombax costatum Pellegr. and Vuillet in West African semi-arid savannas. Global Ecology and Conservation 2023, 43, e02434. [Google Scholar] [CrossRef]
Figure 1.
Studied area of Sudanian bioclimatic domain in Senegal and location of the different forests studied, color-coded based on their management status (UMF = unmanaged forests, OMF = older managed forests > 10 years, NMF = newly managed forests < 10 years, CRF = community reserve forests).
Figure 1.
Studied area of Sudanian bioclimatic domain in Senegal and location of the different forests studied, color-coded based on their management status (UMF = unmanaged forests, OMF = older managed forests > 10 years, NMF = newly managed forests < 10 years, CRF = community reserve forests).
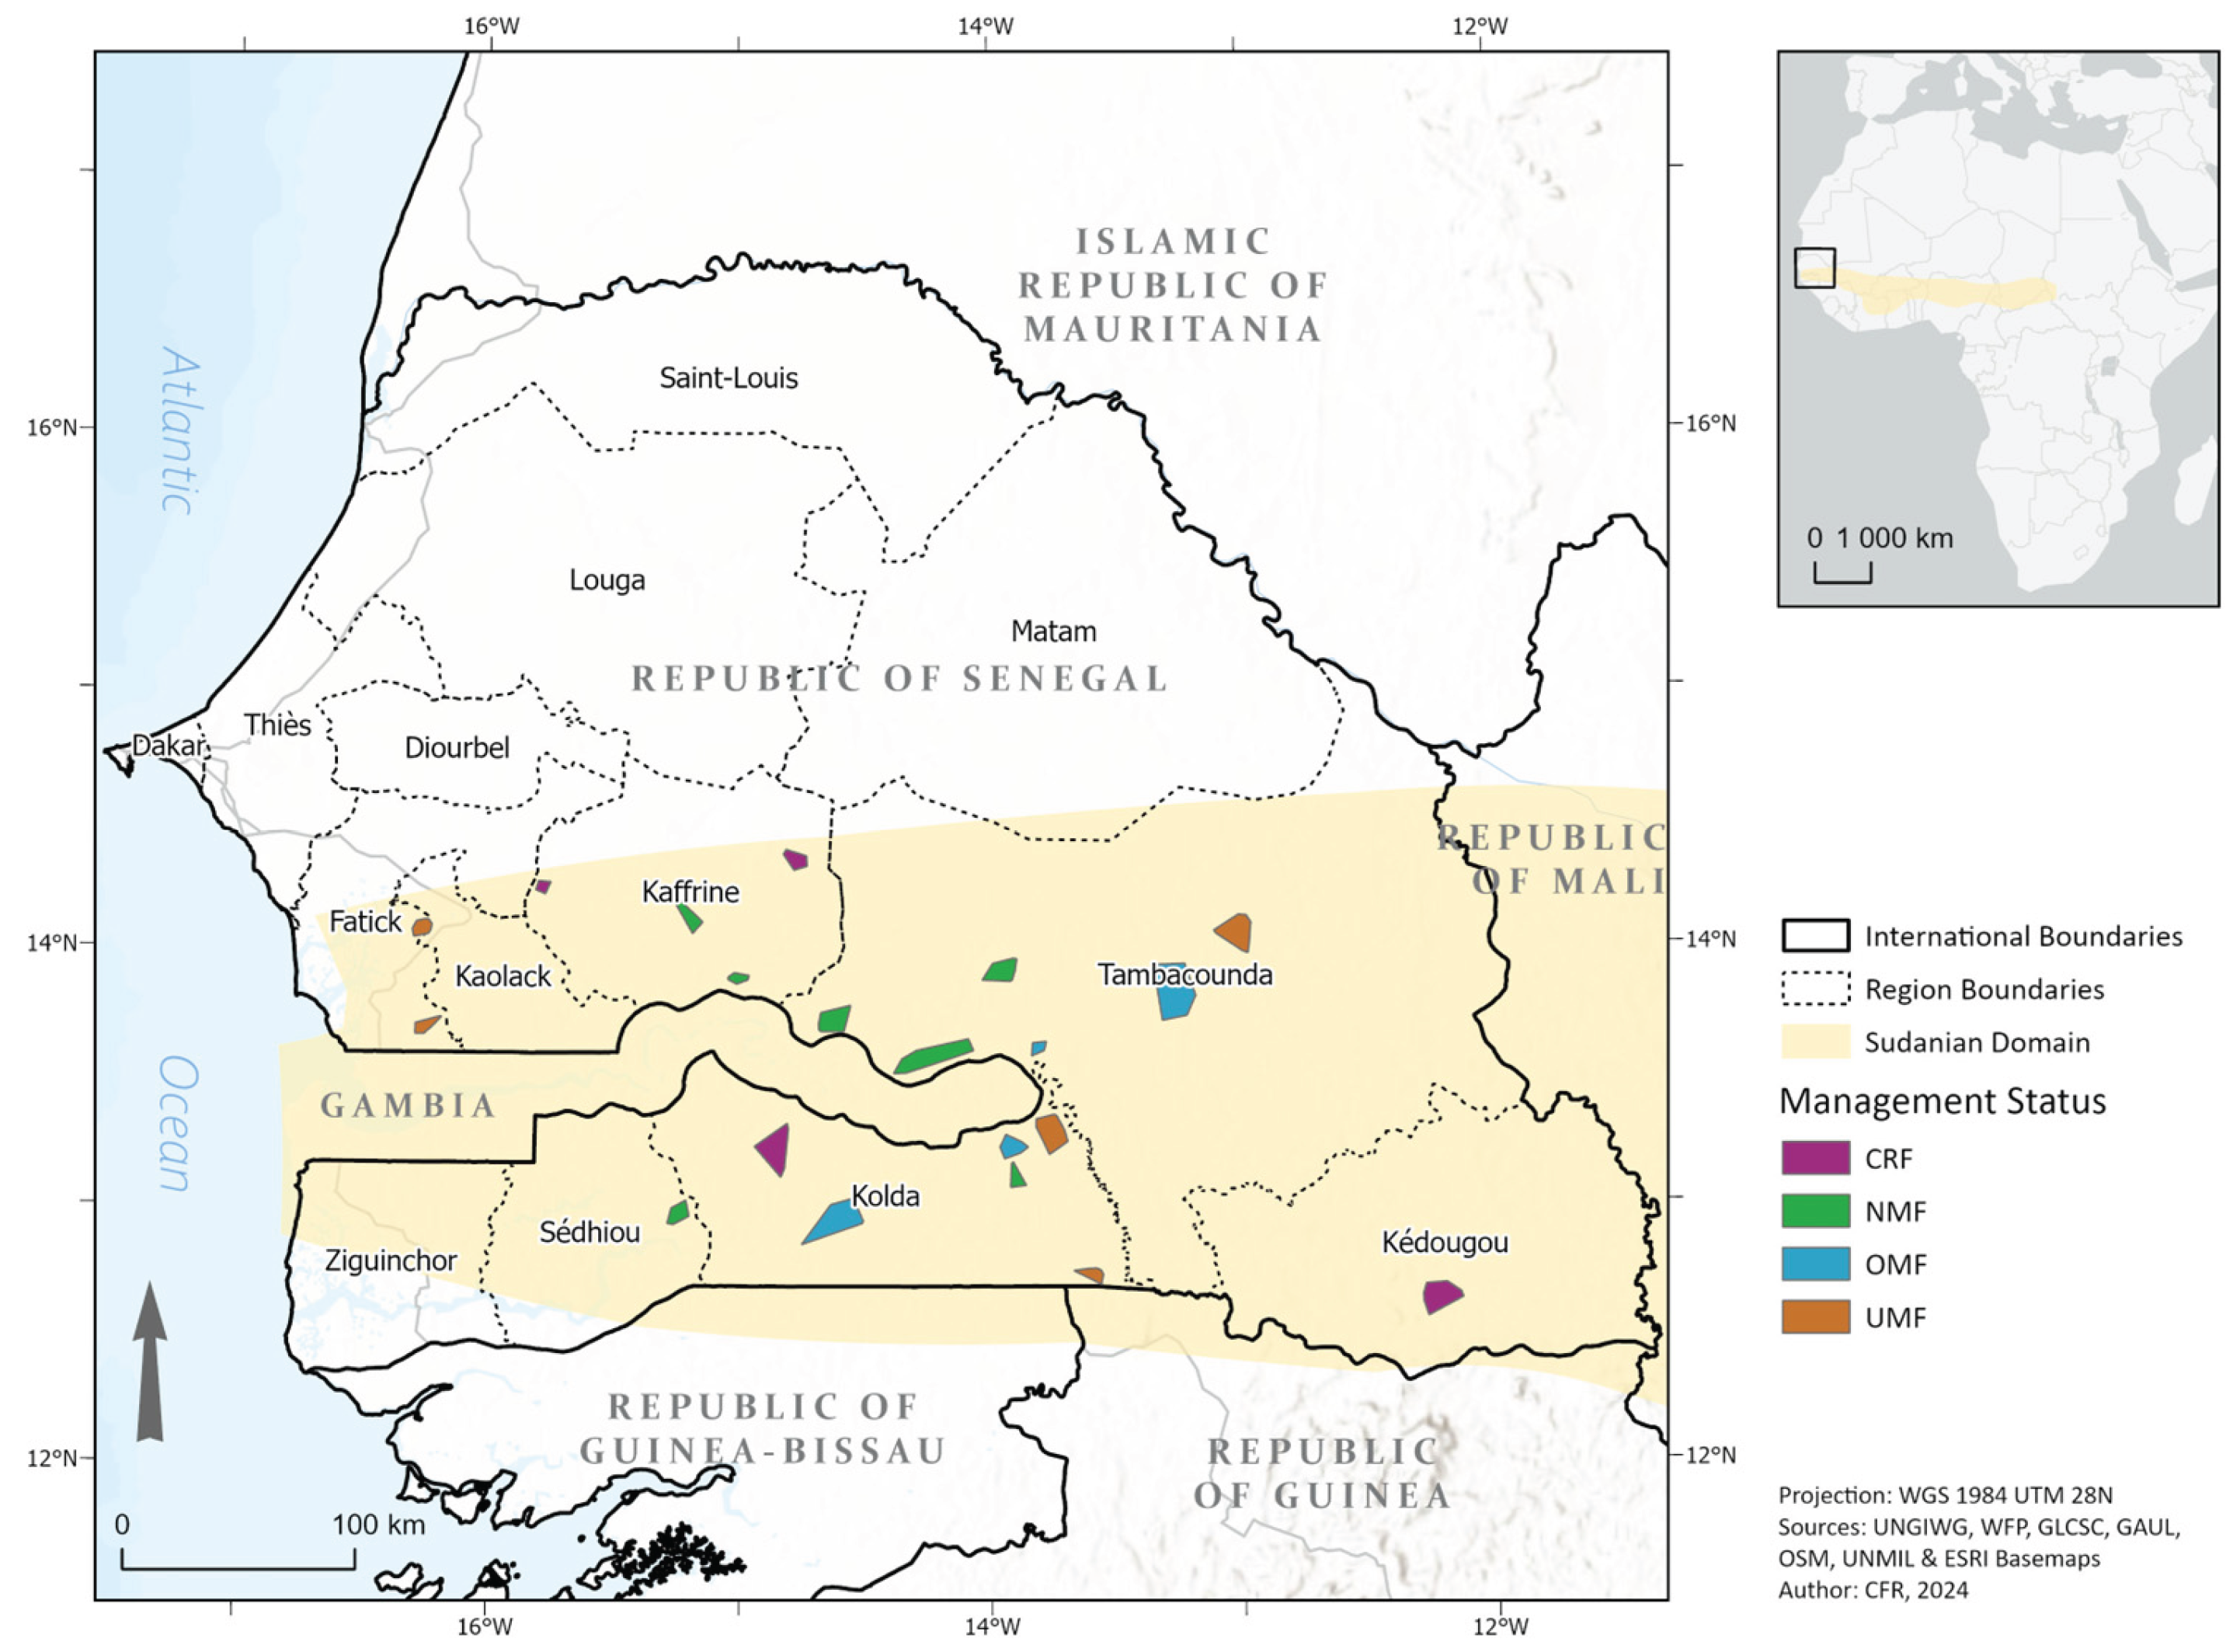
Figure 2.
Principal Component Analysis plot for the nineteen bioclimatic variables (defined in Table1).
Figure 2.
Principal Component Analysis plot for the nineteen bioclimatic variables (defined in Table1).
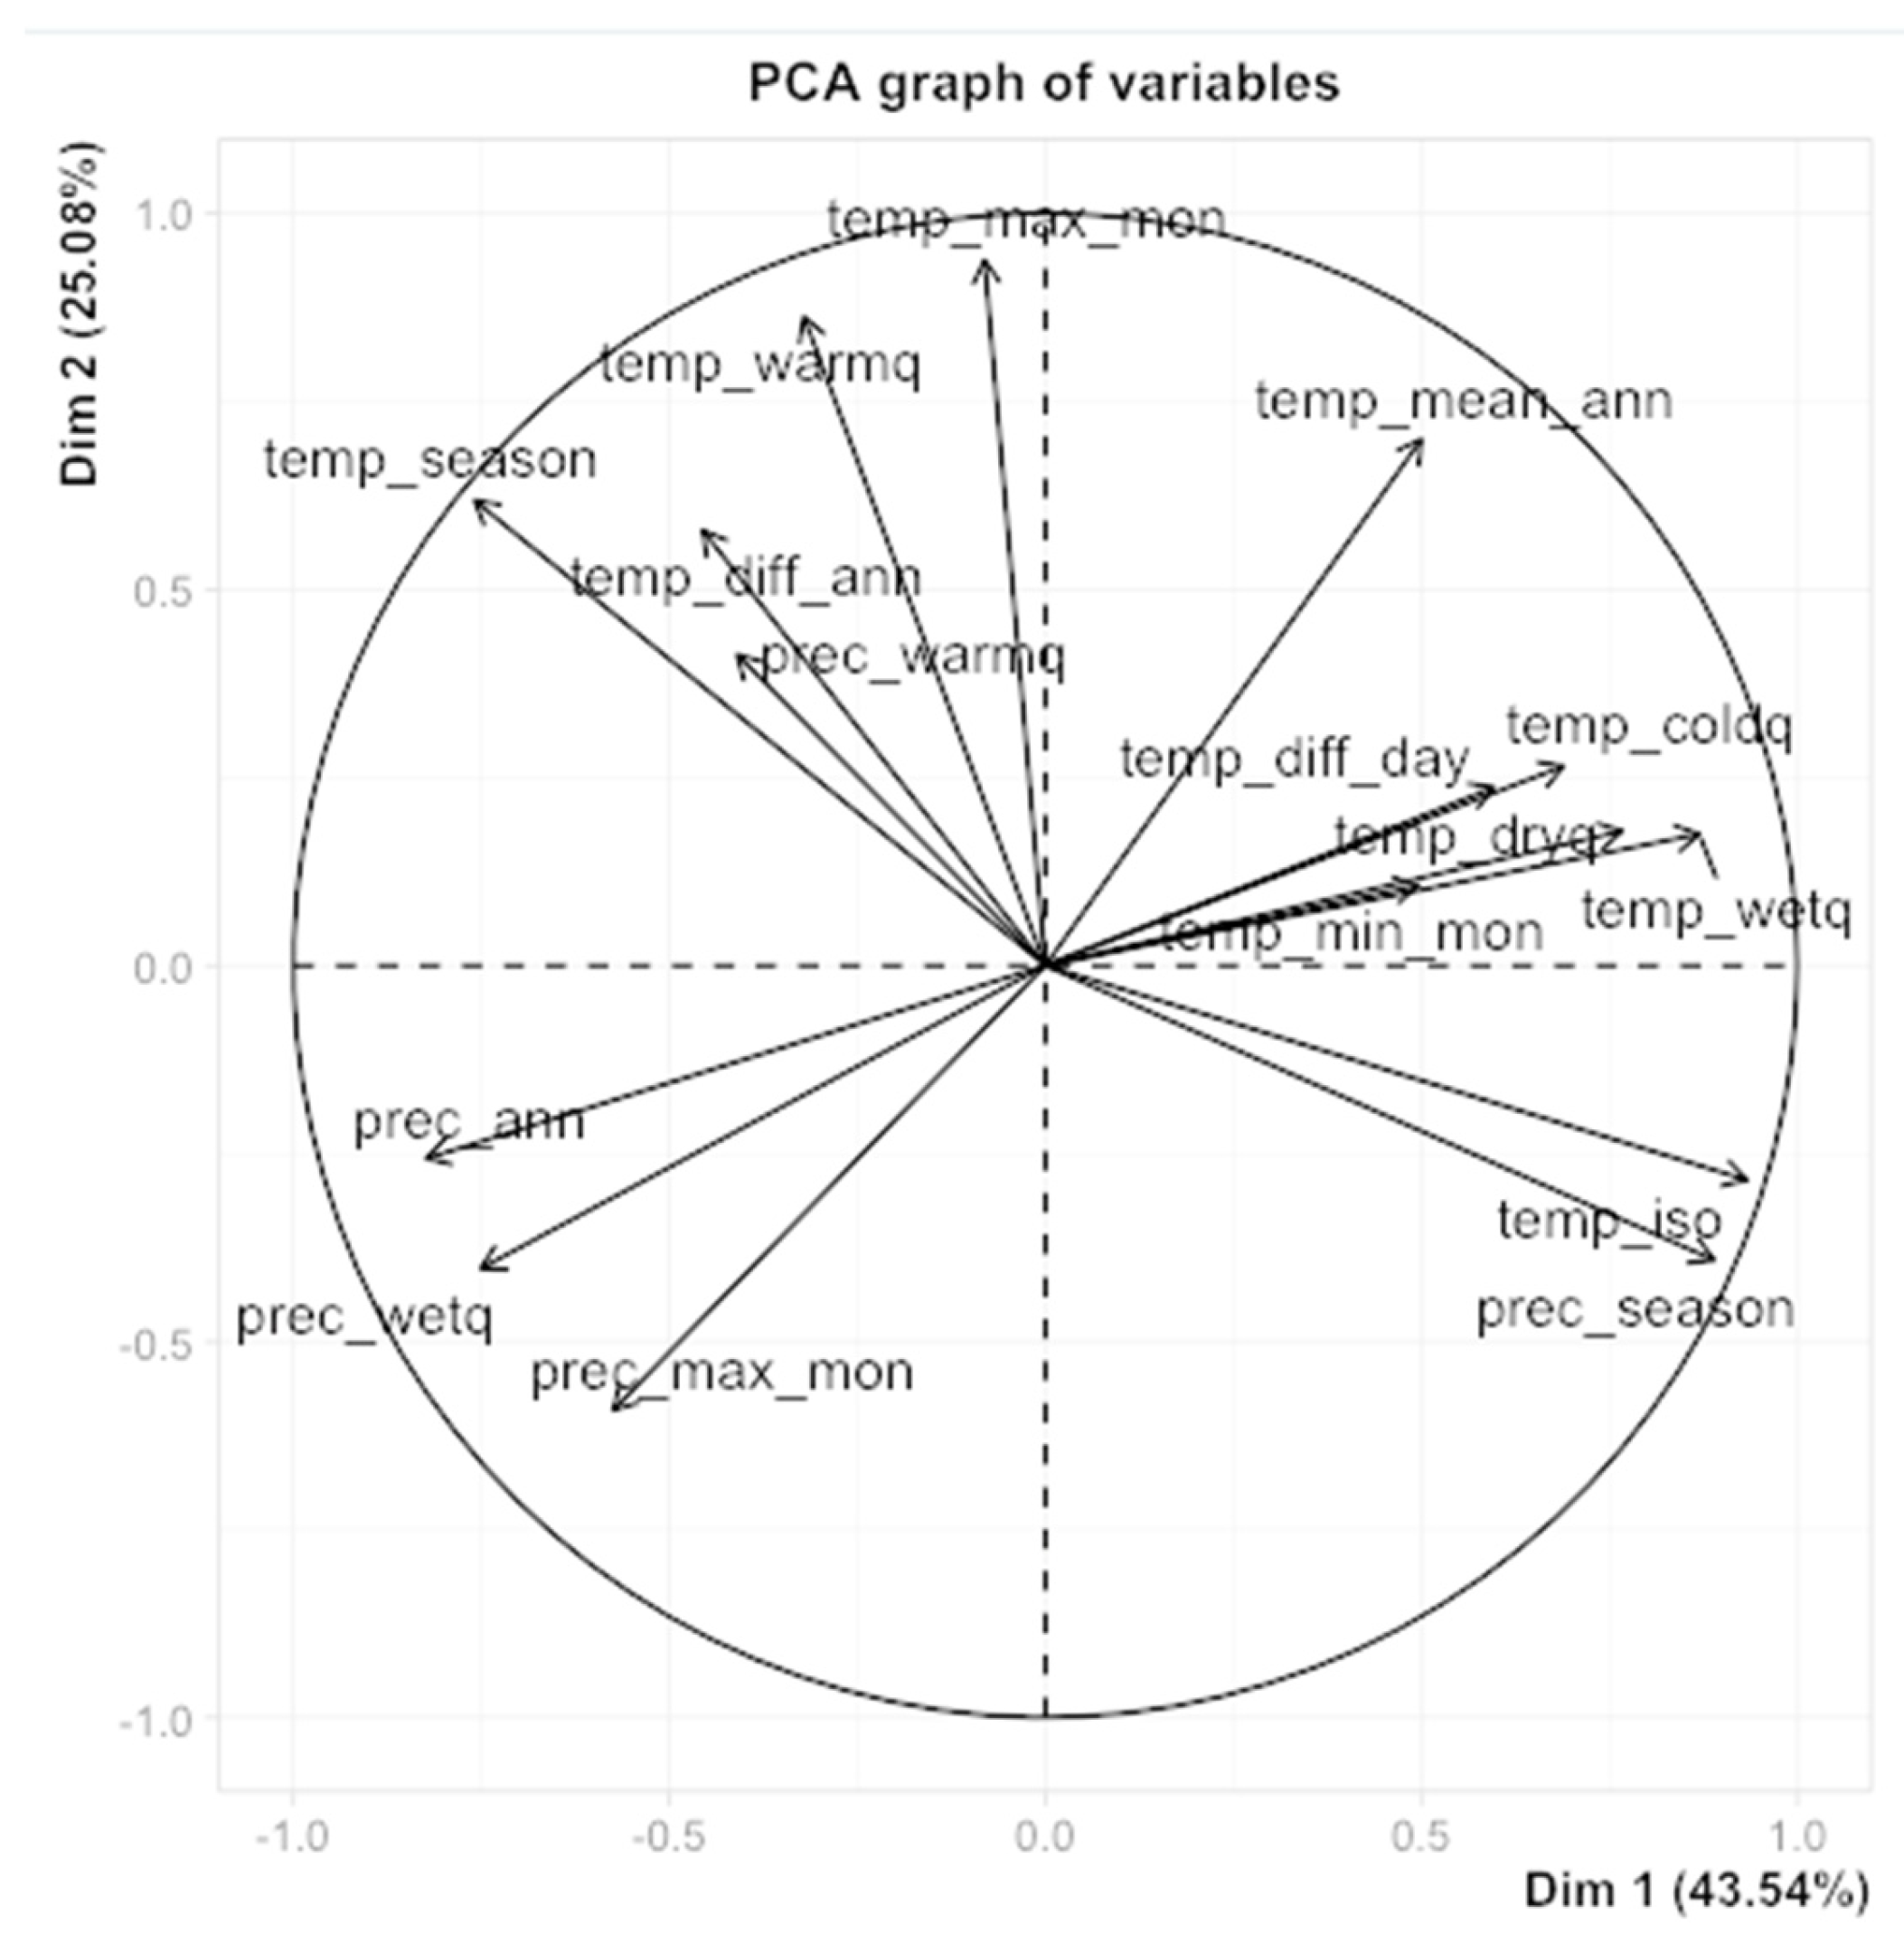
Figure 3.
Potential distributions of Acacaia macrostachya for the present (1970-2000) and for the future under three different climate change scenarios (SSP245, SSP370, SSP585) for two periods (2041-2060 and 2081-2100).
Figure 3.
Potential distributions of Acacaia macrostachya for the present (1970-2000) and for the future under three different climate change scenarios (SSP245, SSP370, SSP585) for two periods (2041-2060 and 2081-2100).
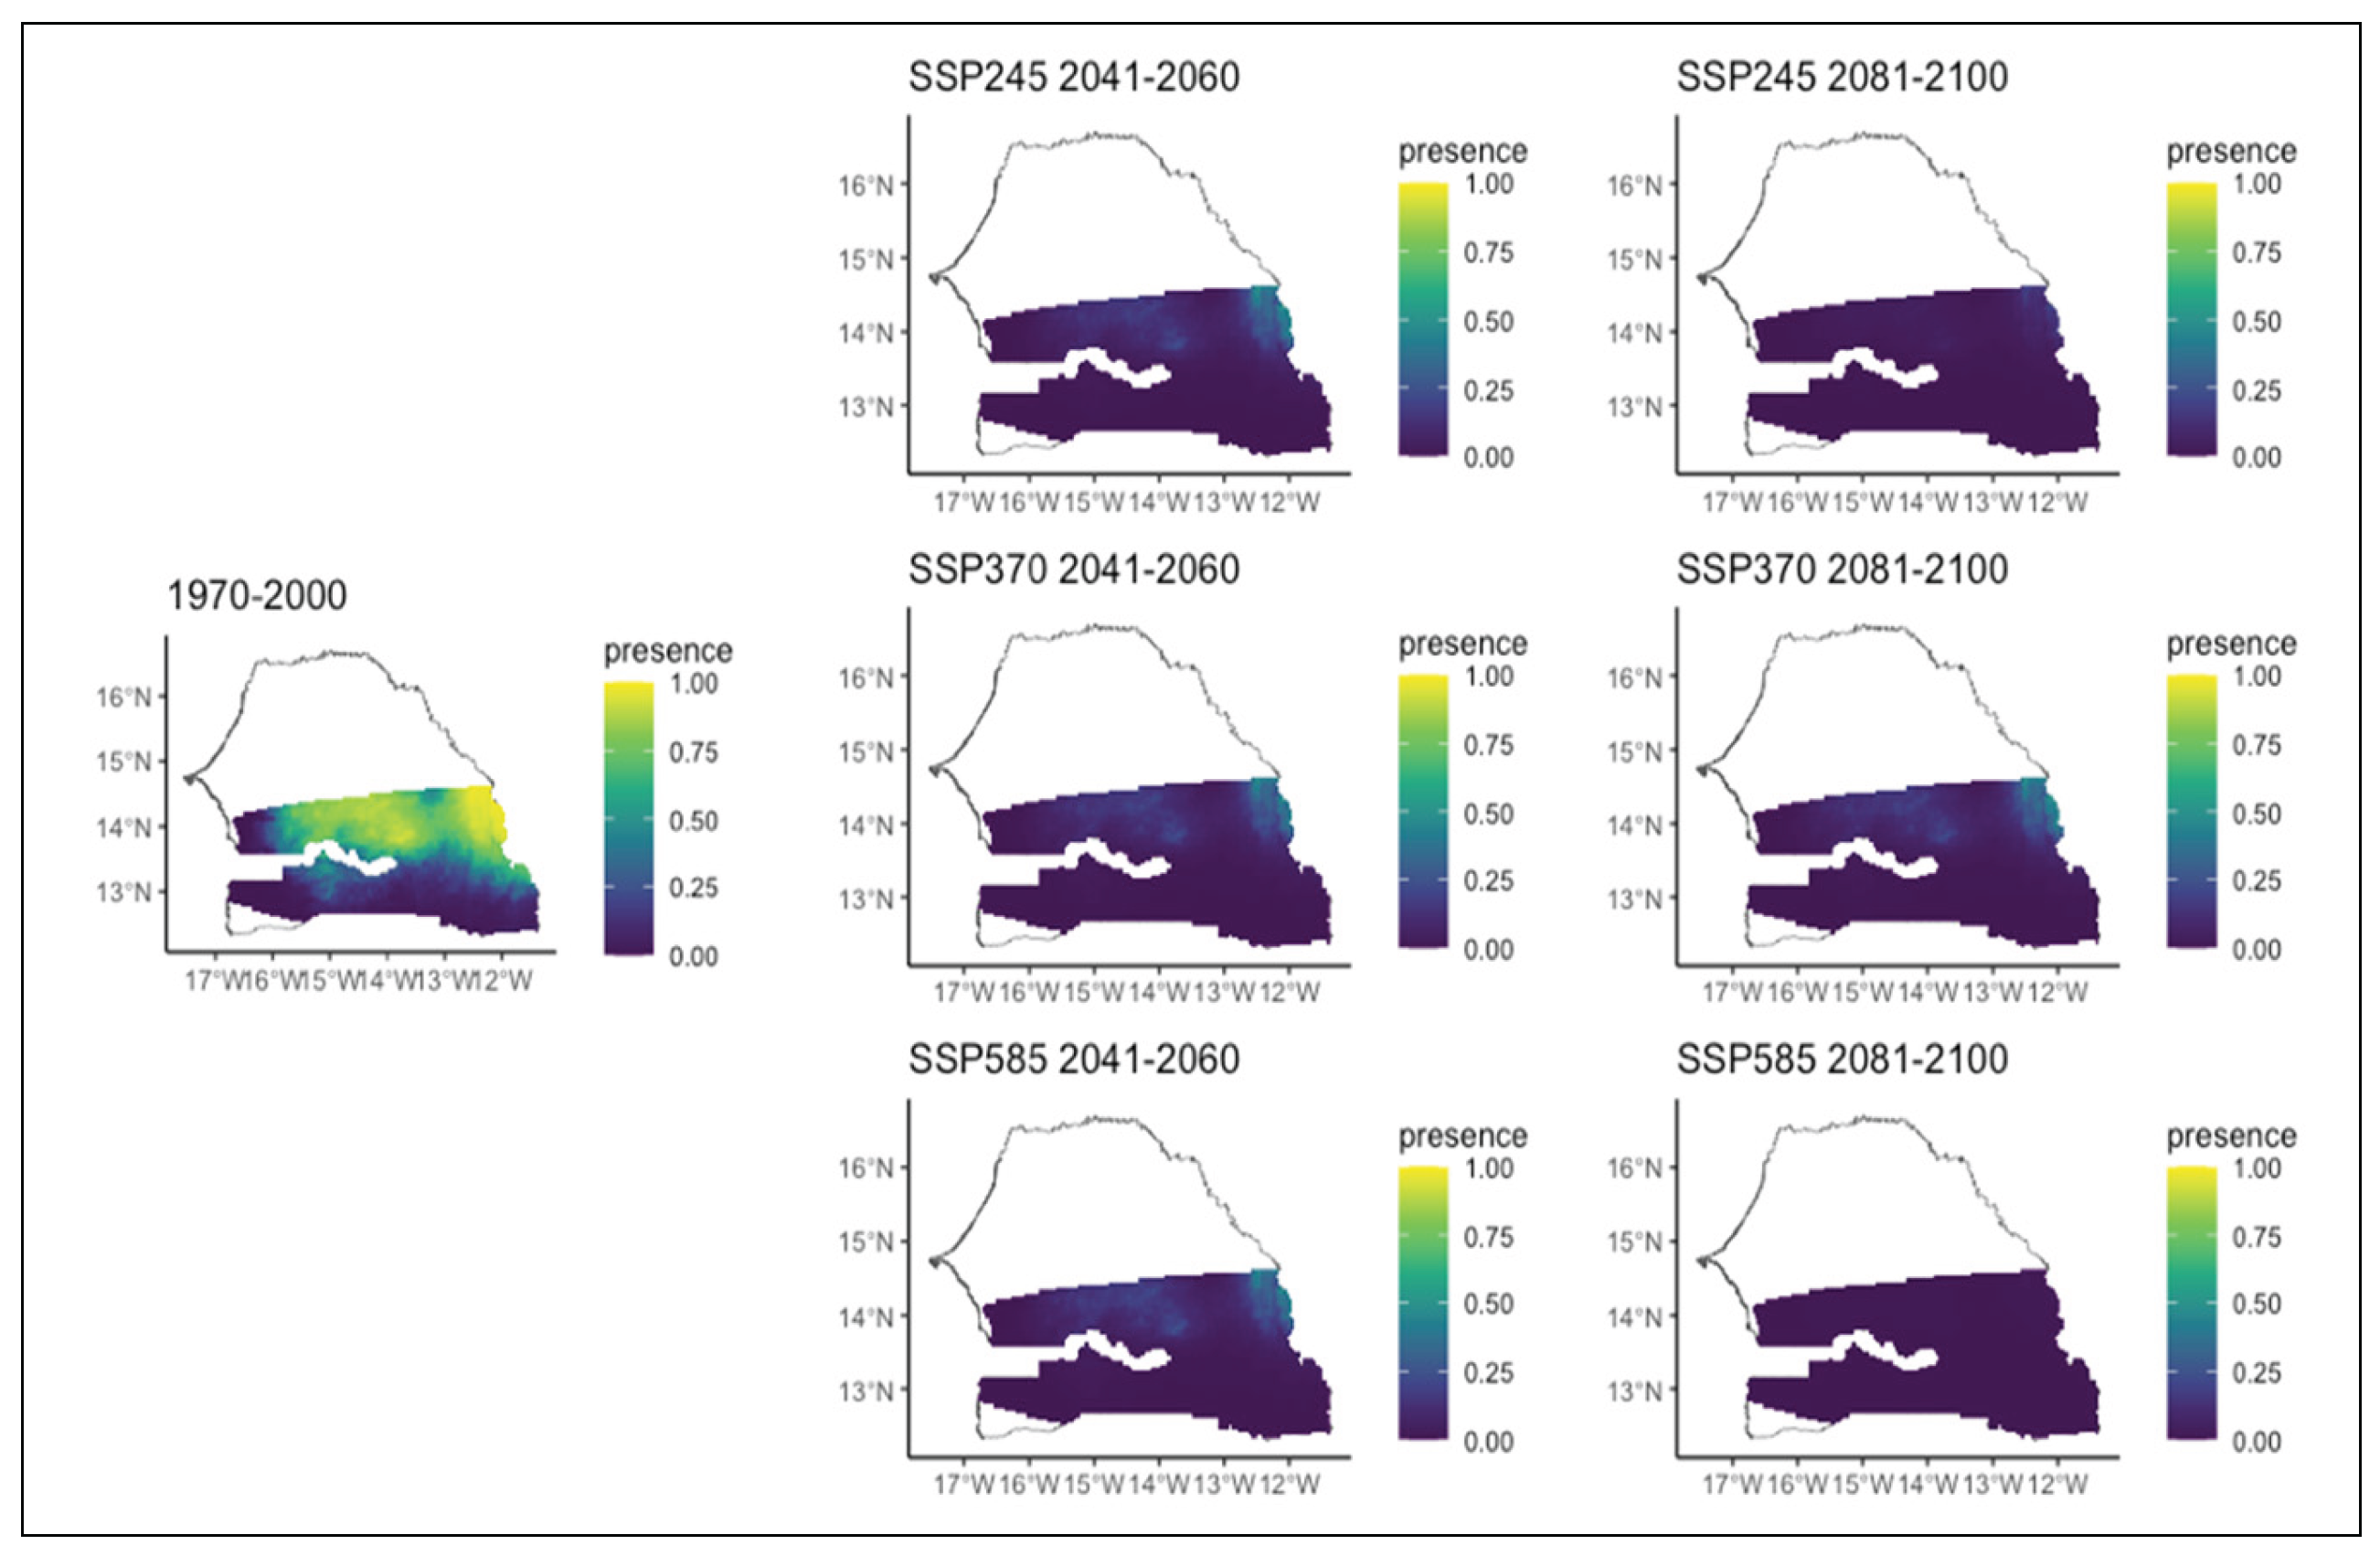
Figure 4.
Potential distributions of Anogeissus leiocarpus for the present (1970-2000) and for the future under three different climate change scenarios (SSP245, SSP370, SSP585) for two periods (2041-2060 and 2081-2100).
Figure 4.
Potential distributions of Anogeissus leiocarpus for the present (1970-2000) and for the future under three different climate change scenarios (SSP245, SSP370, SSP585) for two periods (2041-2060 and 2081-2100).
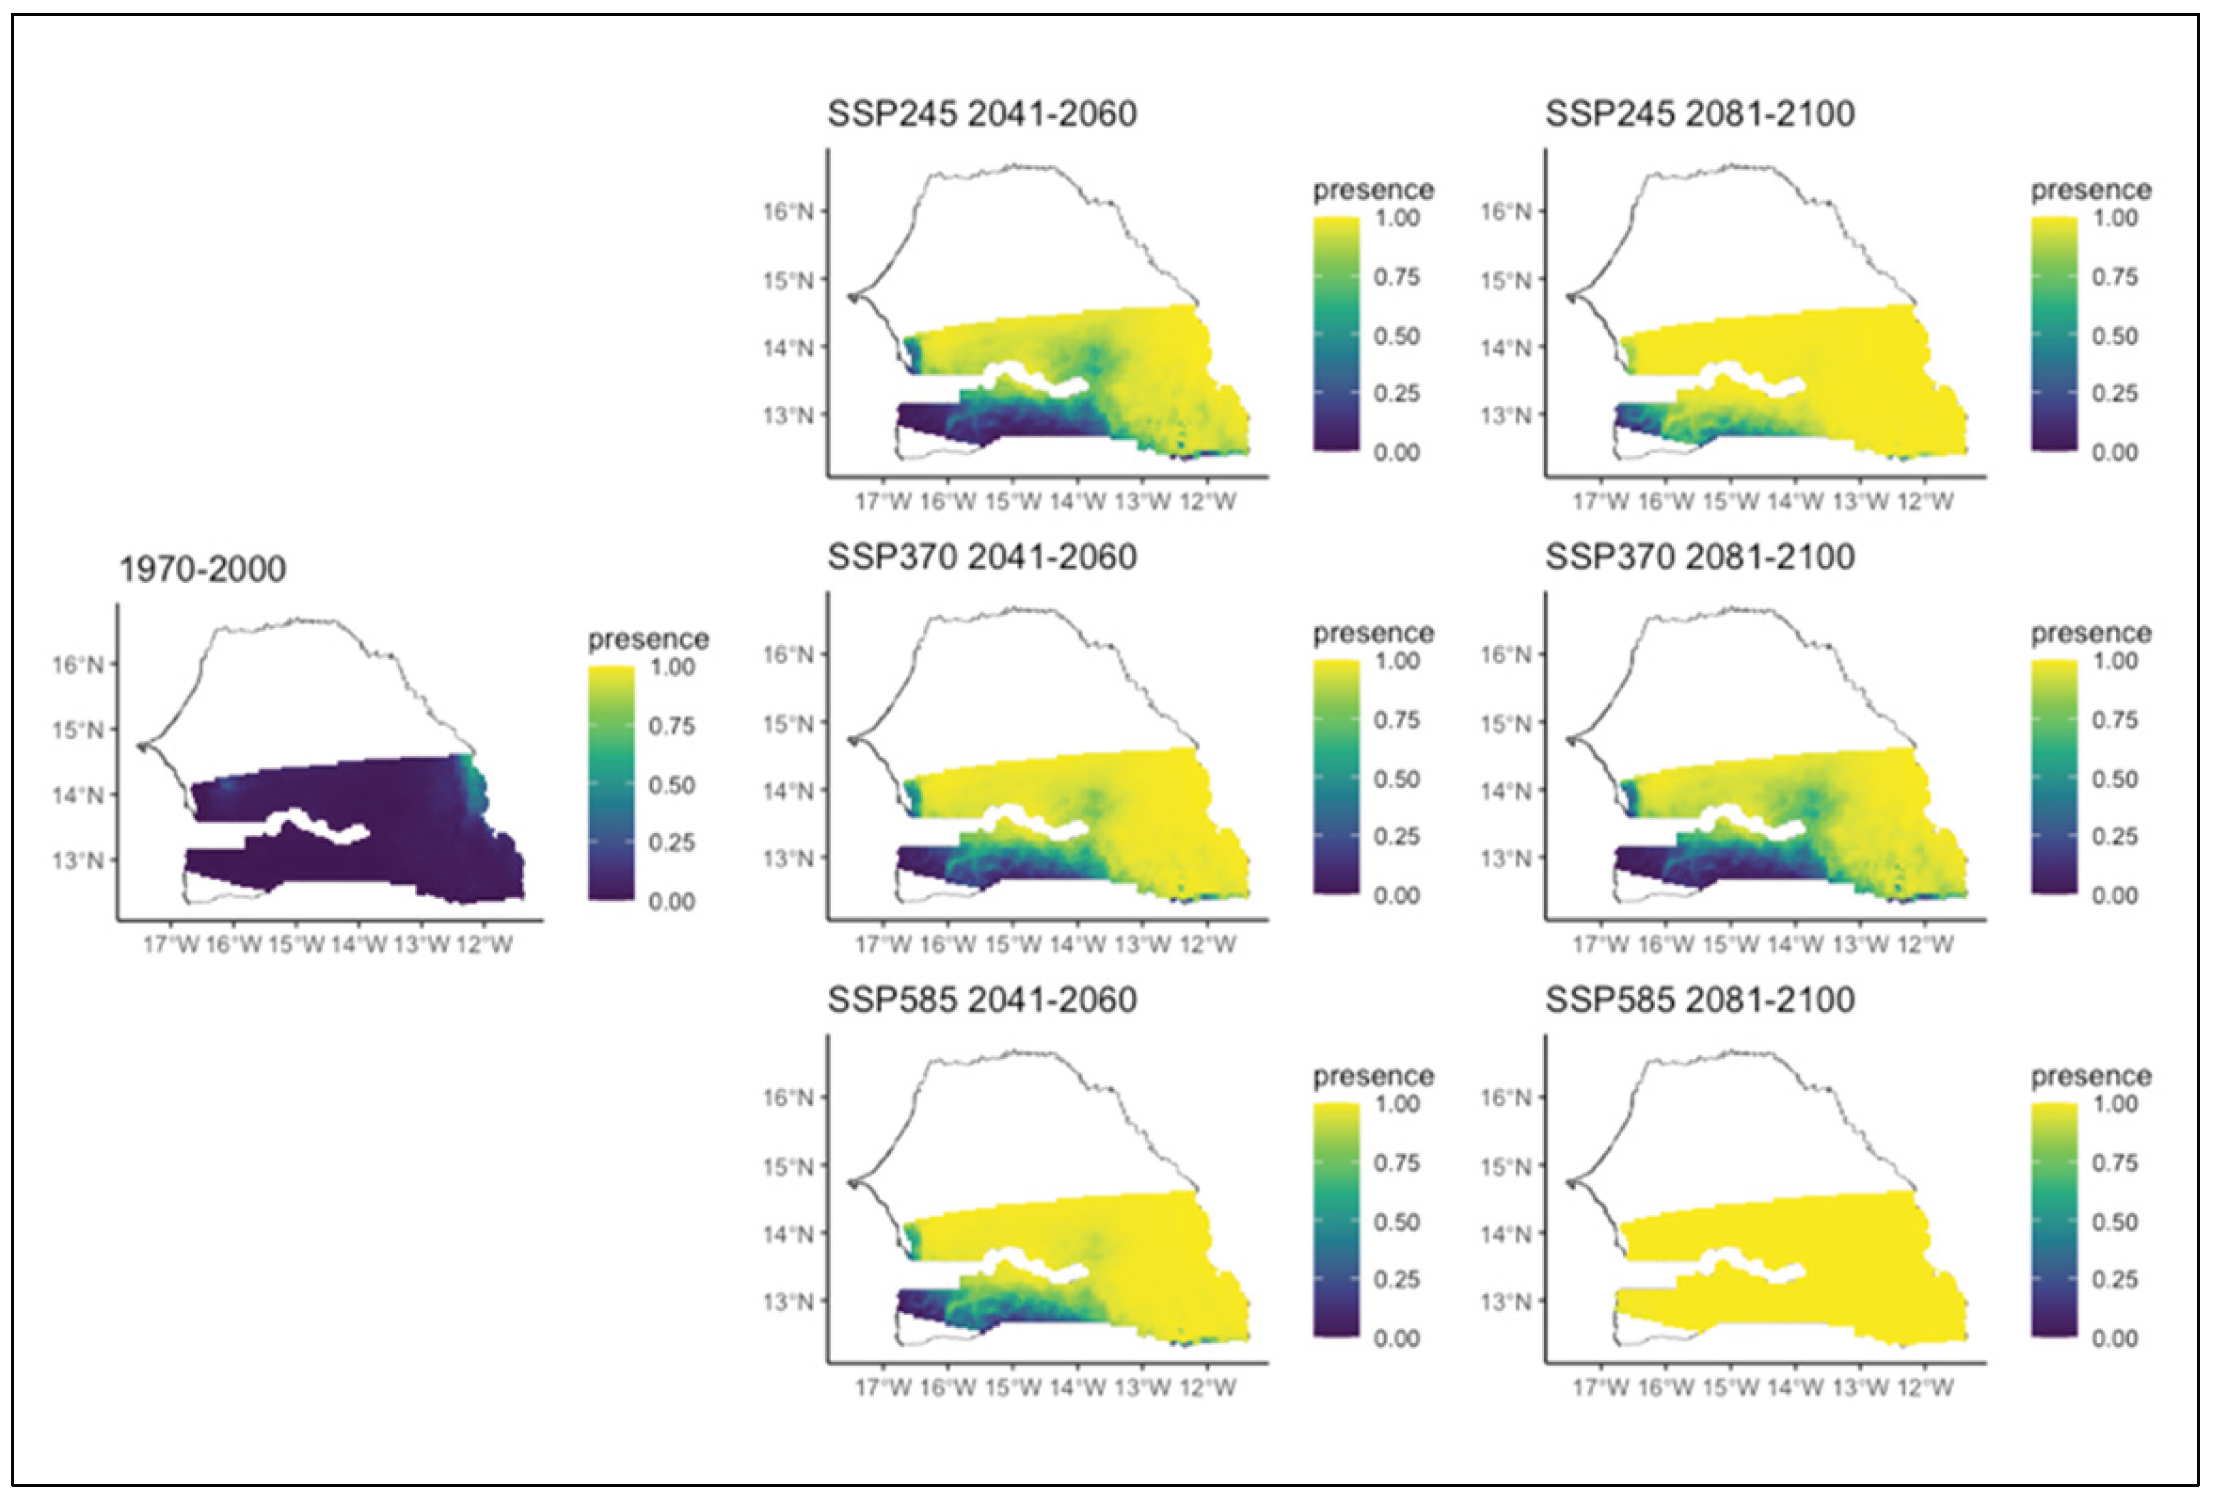
Figure 5.
Potential distributions of Bombax costatum for the present (1970-2000) and for the future under three different climate change scenarios (SSP245, SSP370, SSP585) for two periods (2041-2060 and 2081-2100).
Figure 5.
Potential distributions of Bombax costatum for the present (1970-2000) and for the future under three different climate change scenarios (SSP245, SSP370, SSP585) for two periods (2041-2060 and 2081-2100).
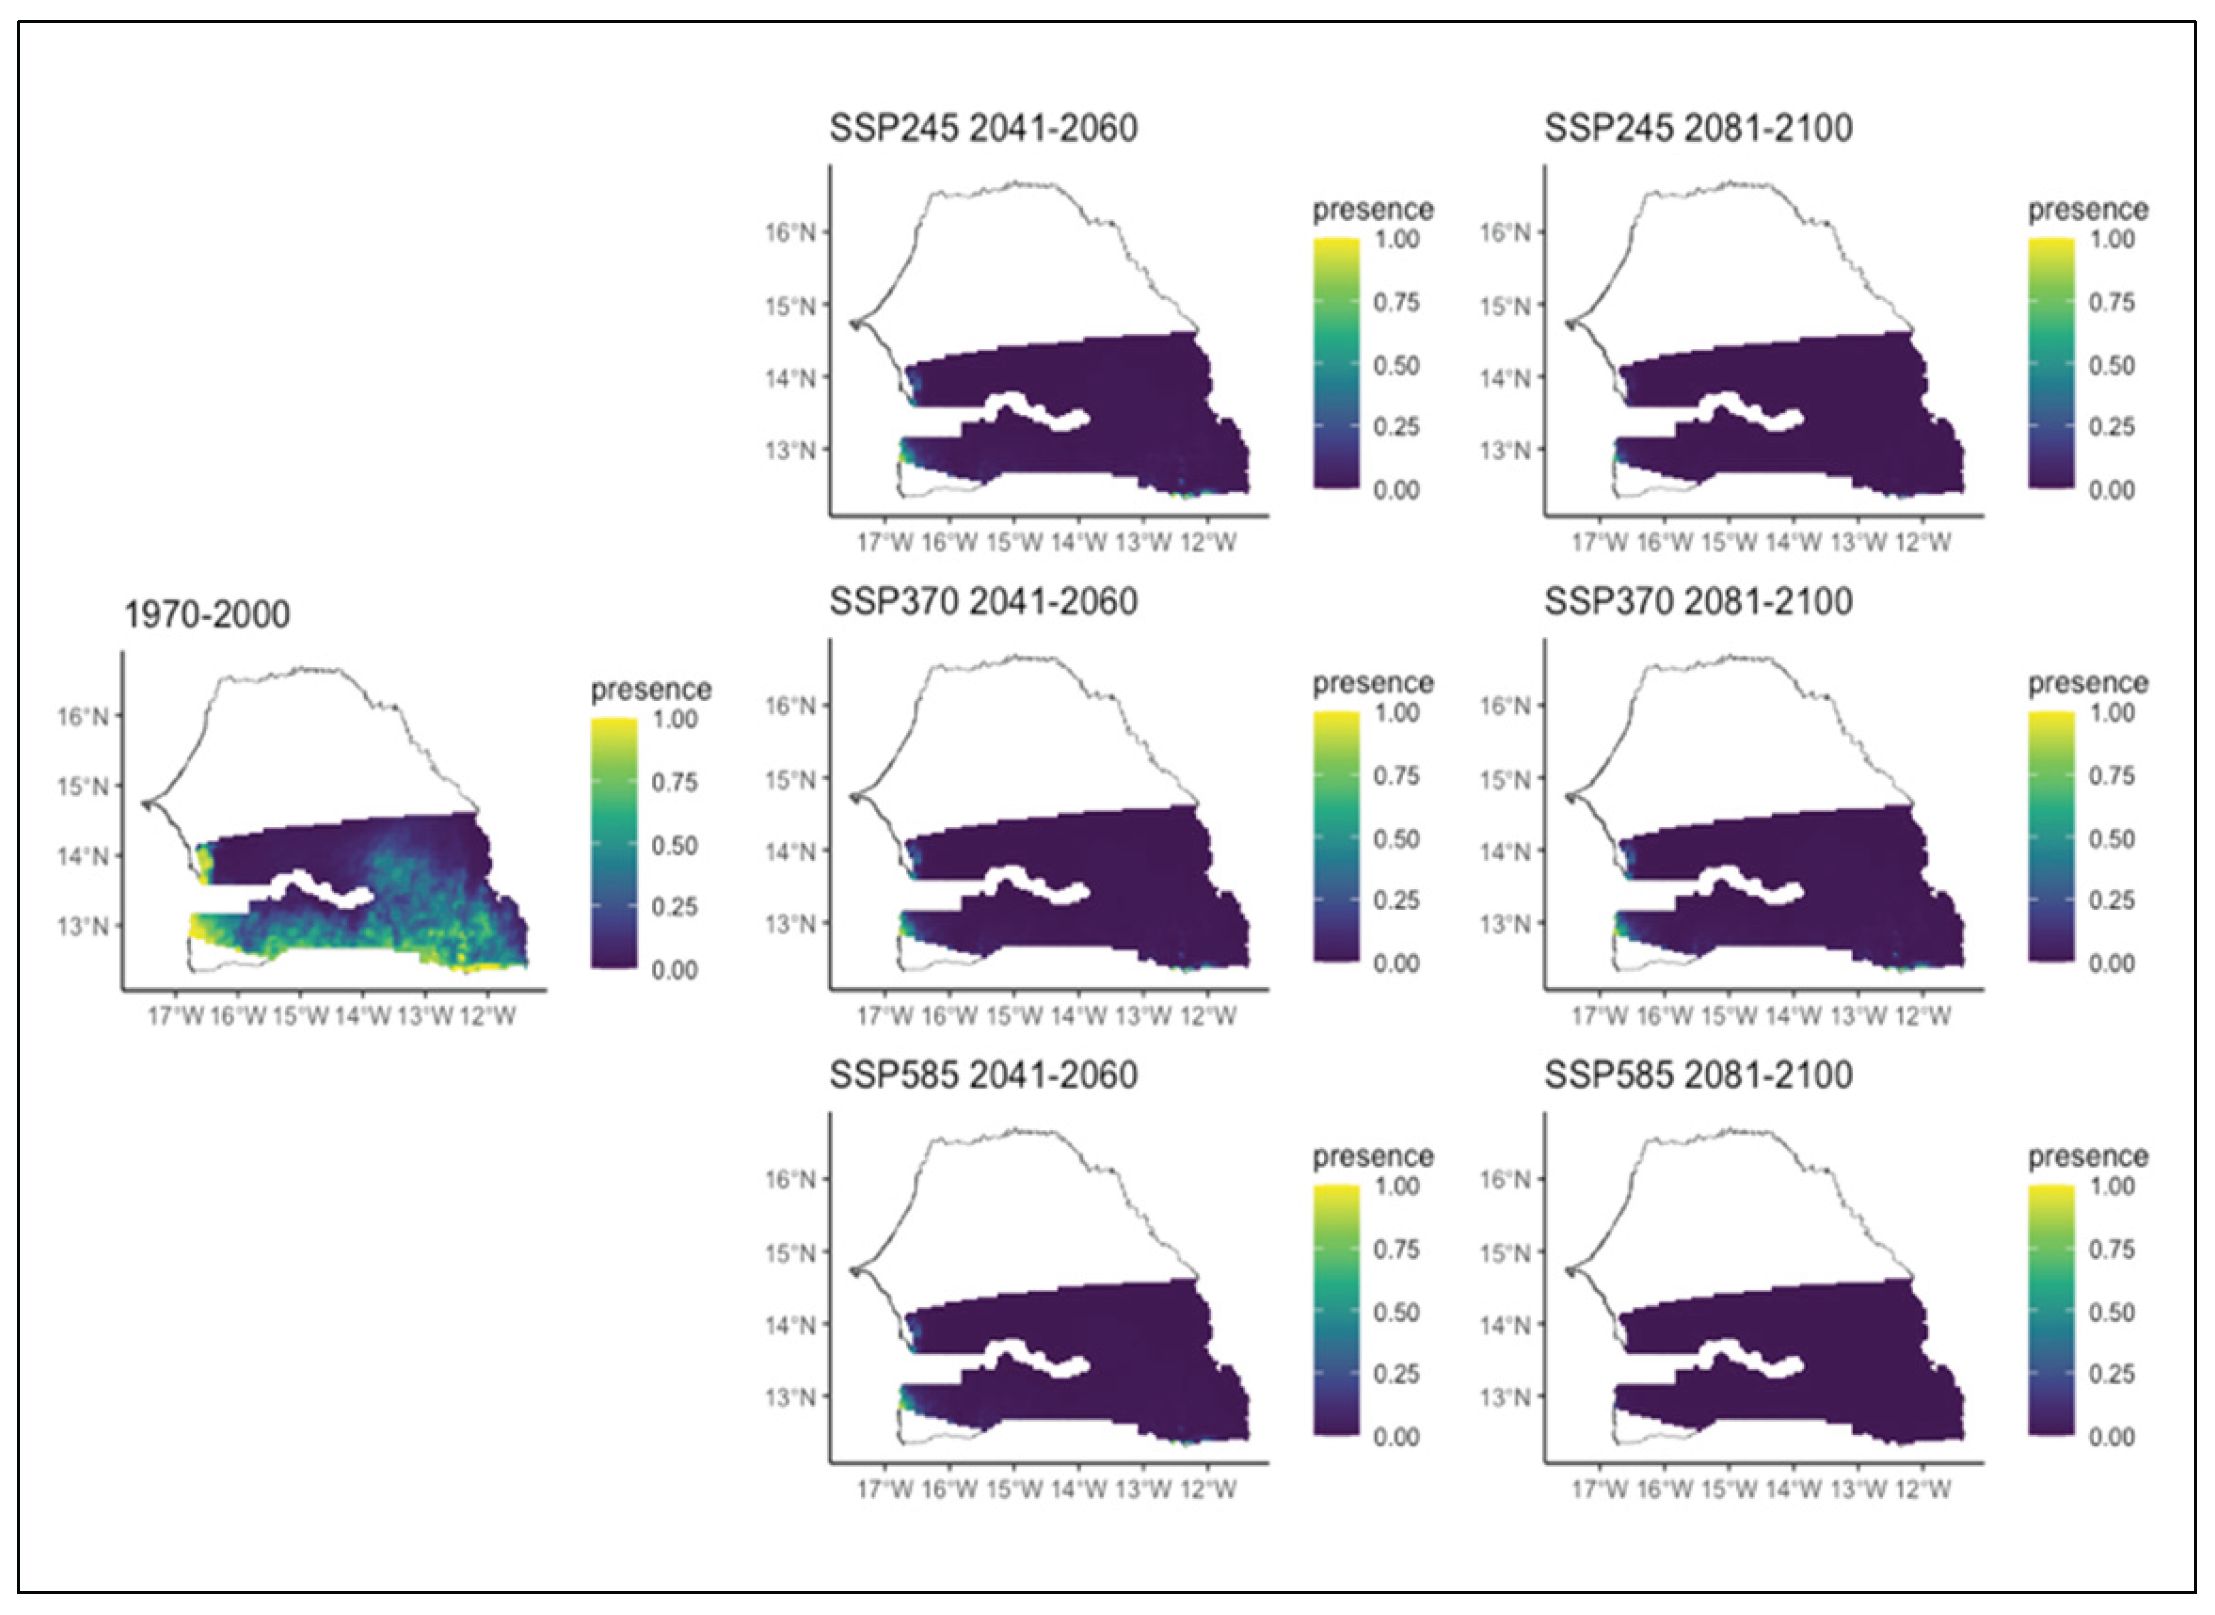
Figure 6.
Potential distributions of Combretum glutinosum for the present (1970-2000) and for the future under three different climate change scenarios (SSP245, SSP370, SSP585) for two periods (2041-2060 and 2081-2100).
Figure 6.
Potential distributions of Combretum glutinosum for the present (1970-2000) and for the future under three different climate change scenarios (SSP245, SSP370, SSP585) for two periods (2041-2060 and 2081-2100).
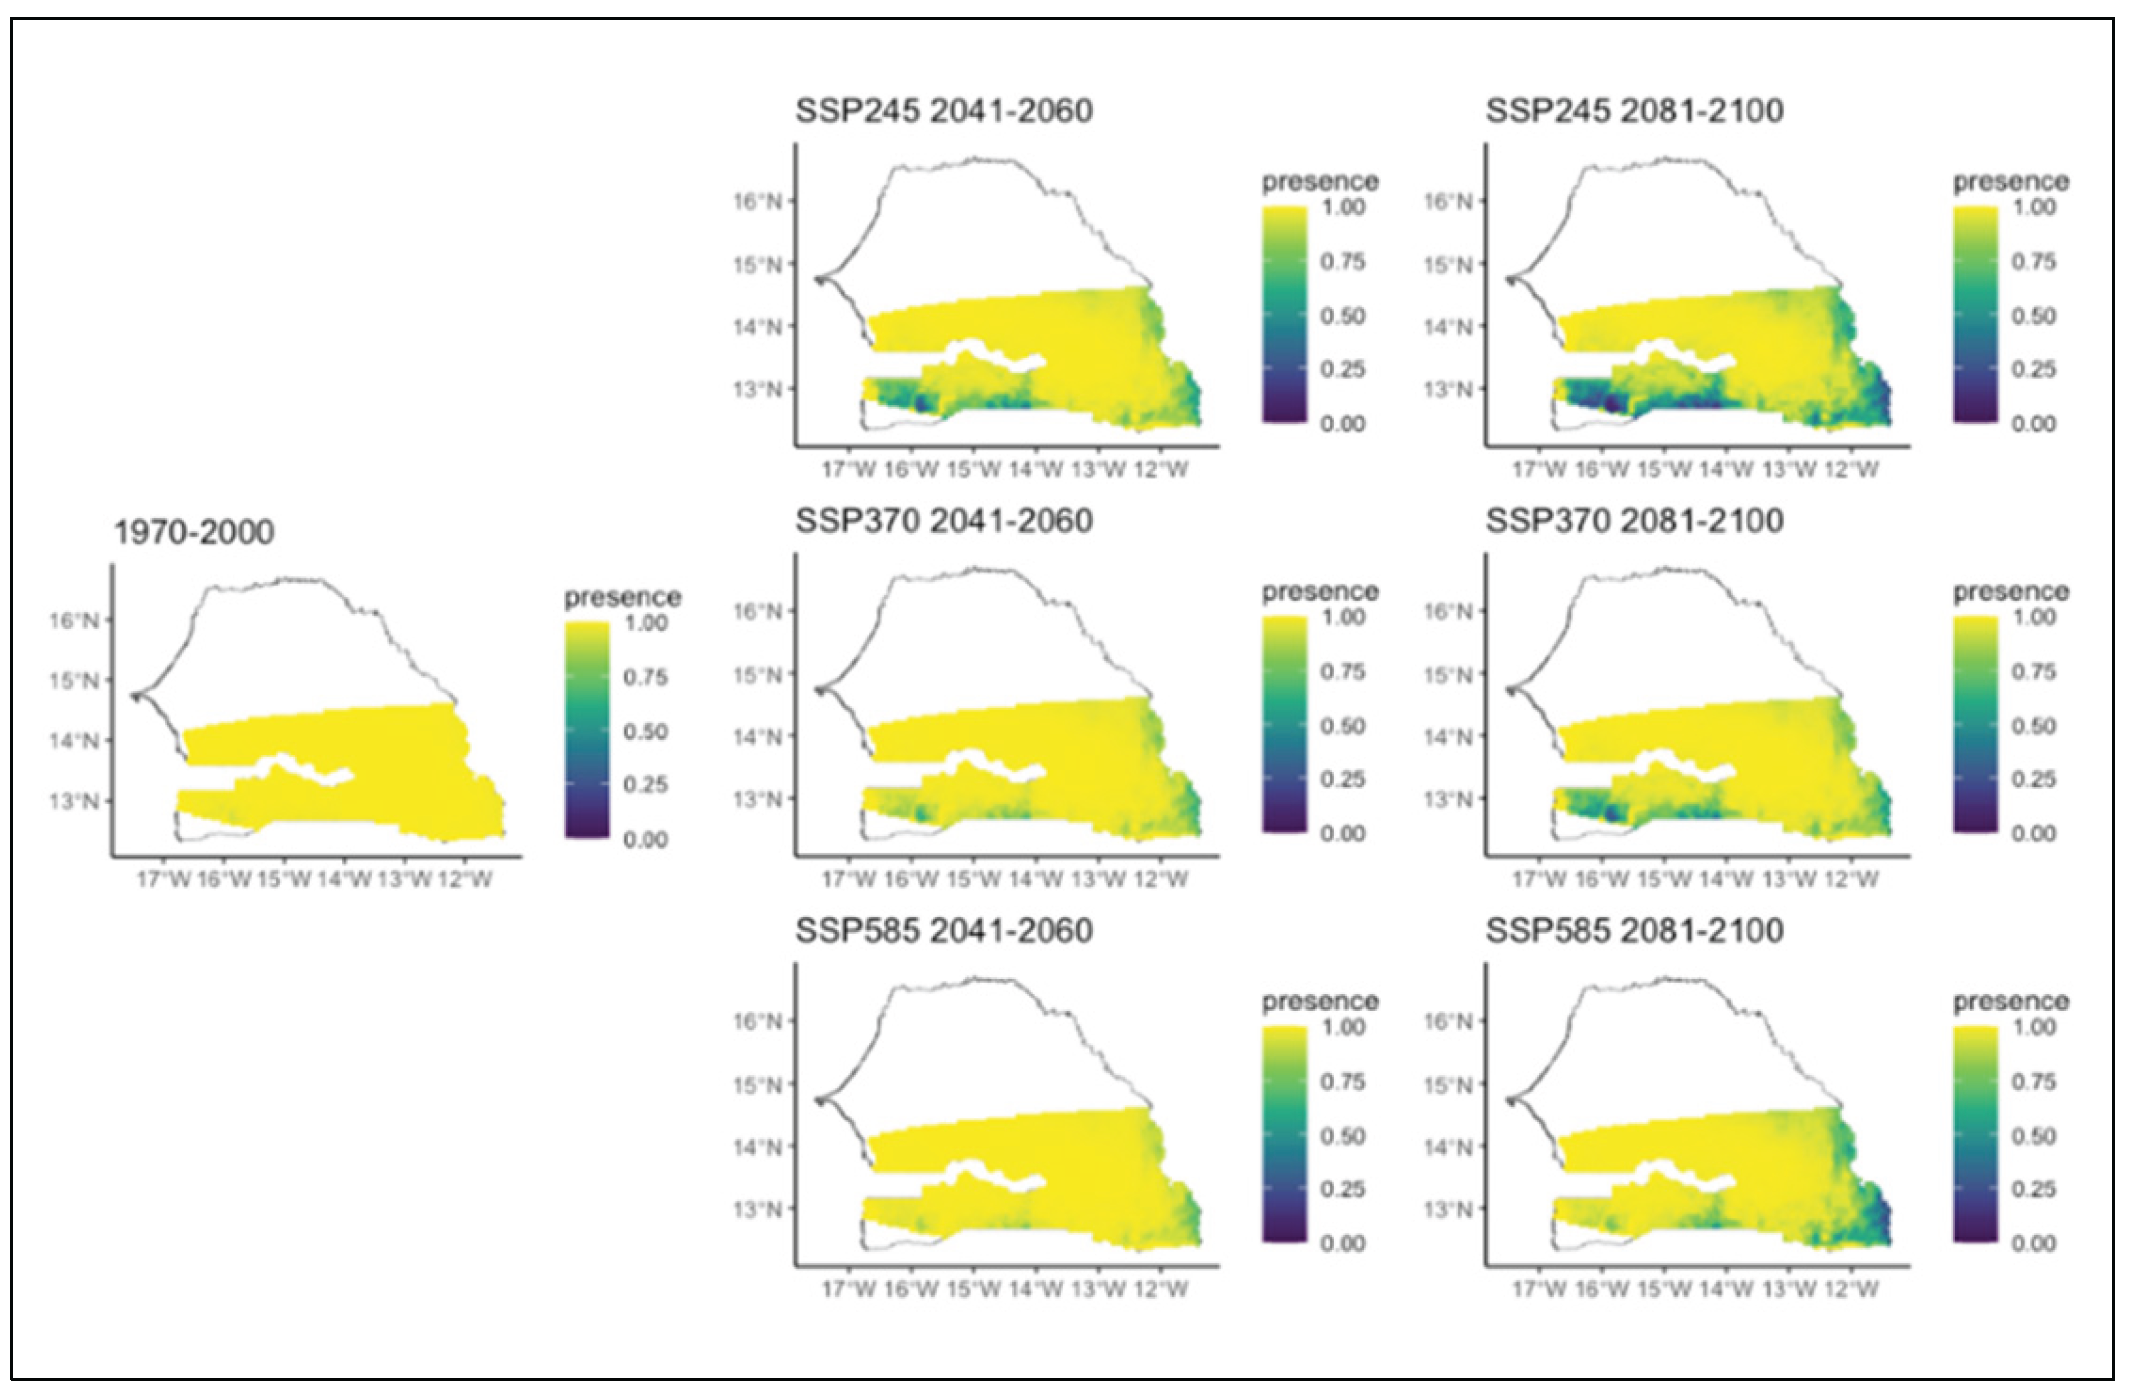
Figure 7.
Potential distributions of Combretum micranthum for the present (1970-2000) and for the future under three different climate change scenarios (SSP245, SSP370, SSP585) for two periods (2041-2060 and 2081-2100).
Figure 7.
Potential distributions of Combretum micranthum for the present (1970-2000) and for the future under three different climate change scenarios (SSP245, SSP370, SSP585) for two periods (2041-2060 and 2081-2100).
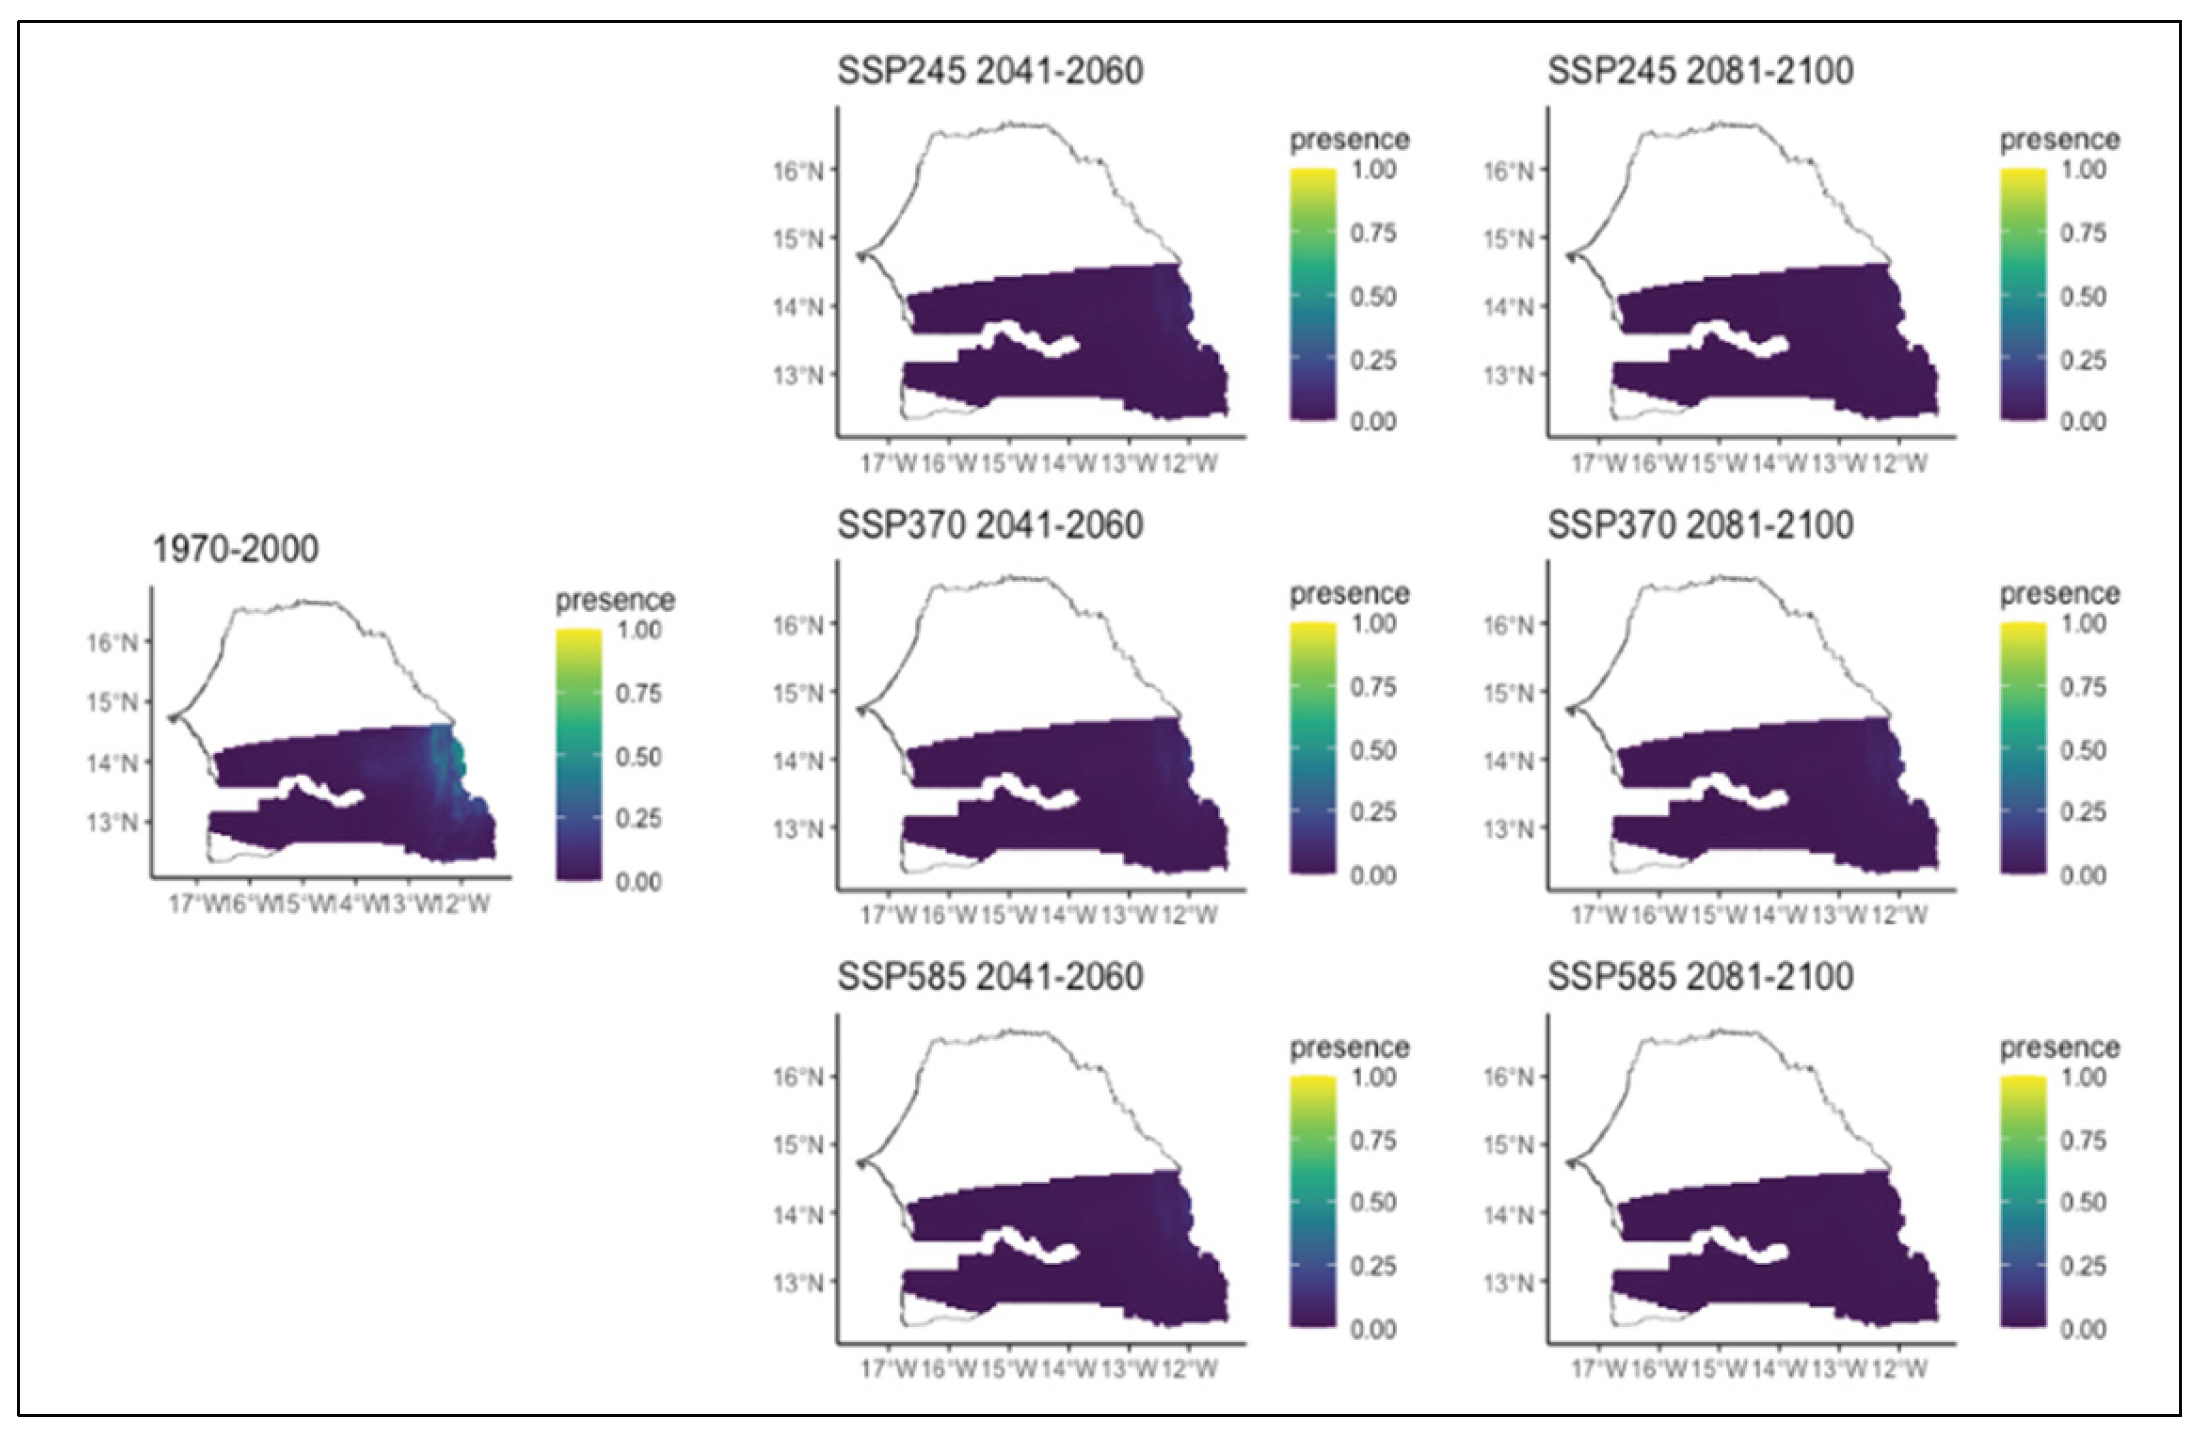
Figure 8.
Potential distributions of Combretum nigricans for the present (1970-2000) and for the future under three different climate change scenarios (SSP245, SSP370, SSP585) for two periods (2041-2060 and 2081-2100).
Figure 8.
Potential distributions of Combretum nigricans for the present (1970-2000) and for the future under three different climate change scenarios (SSP245, SSP370, SSP585) for two periods (2041-2060 and 2081-2100).
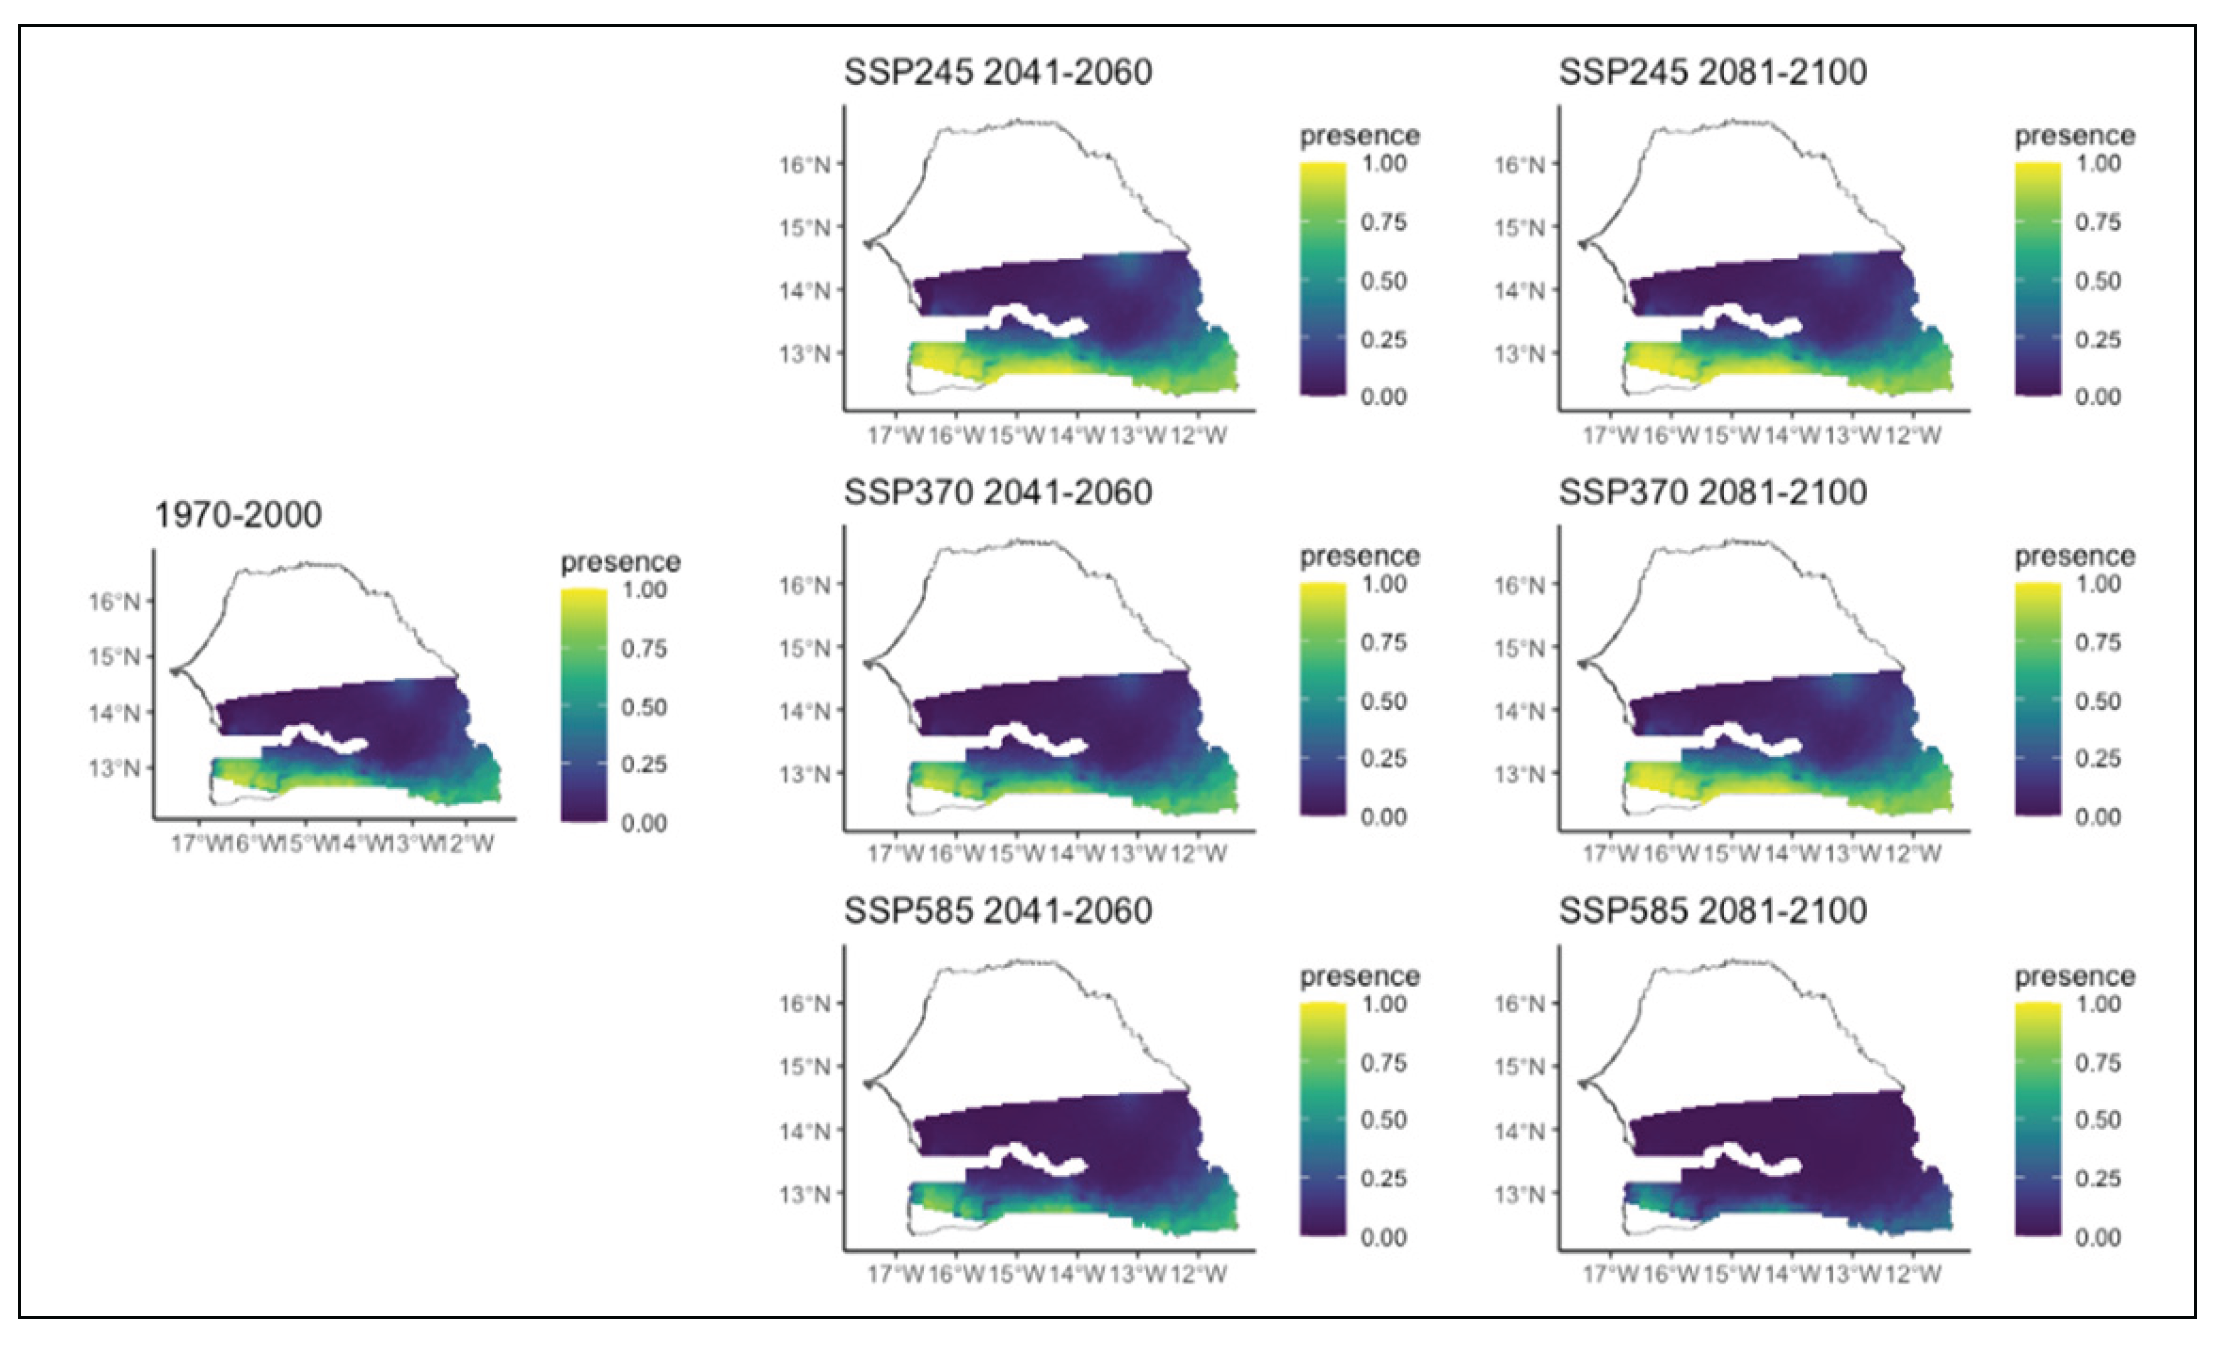
Figure 9.
Potential distributions of Cordyla pinnata for the present (1970-2000) and for the future under three different climate change scenarios (SSP245, SSP370, SSP585) for two periods (2041-2060 and 2081-2100).
Figure 9.
Potential distributions of Cordyla pinnata for the present (1970-2000) and for the future under three different climate change scenarios (SSP245, SSP370, SSP585) for two periods (2041-2060 and 2081-2100).
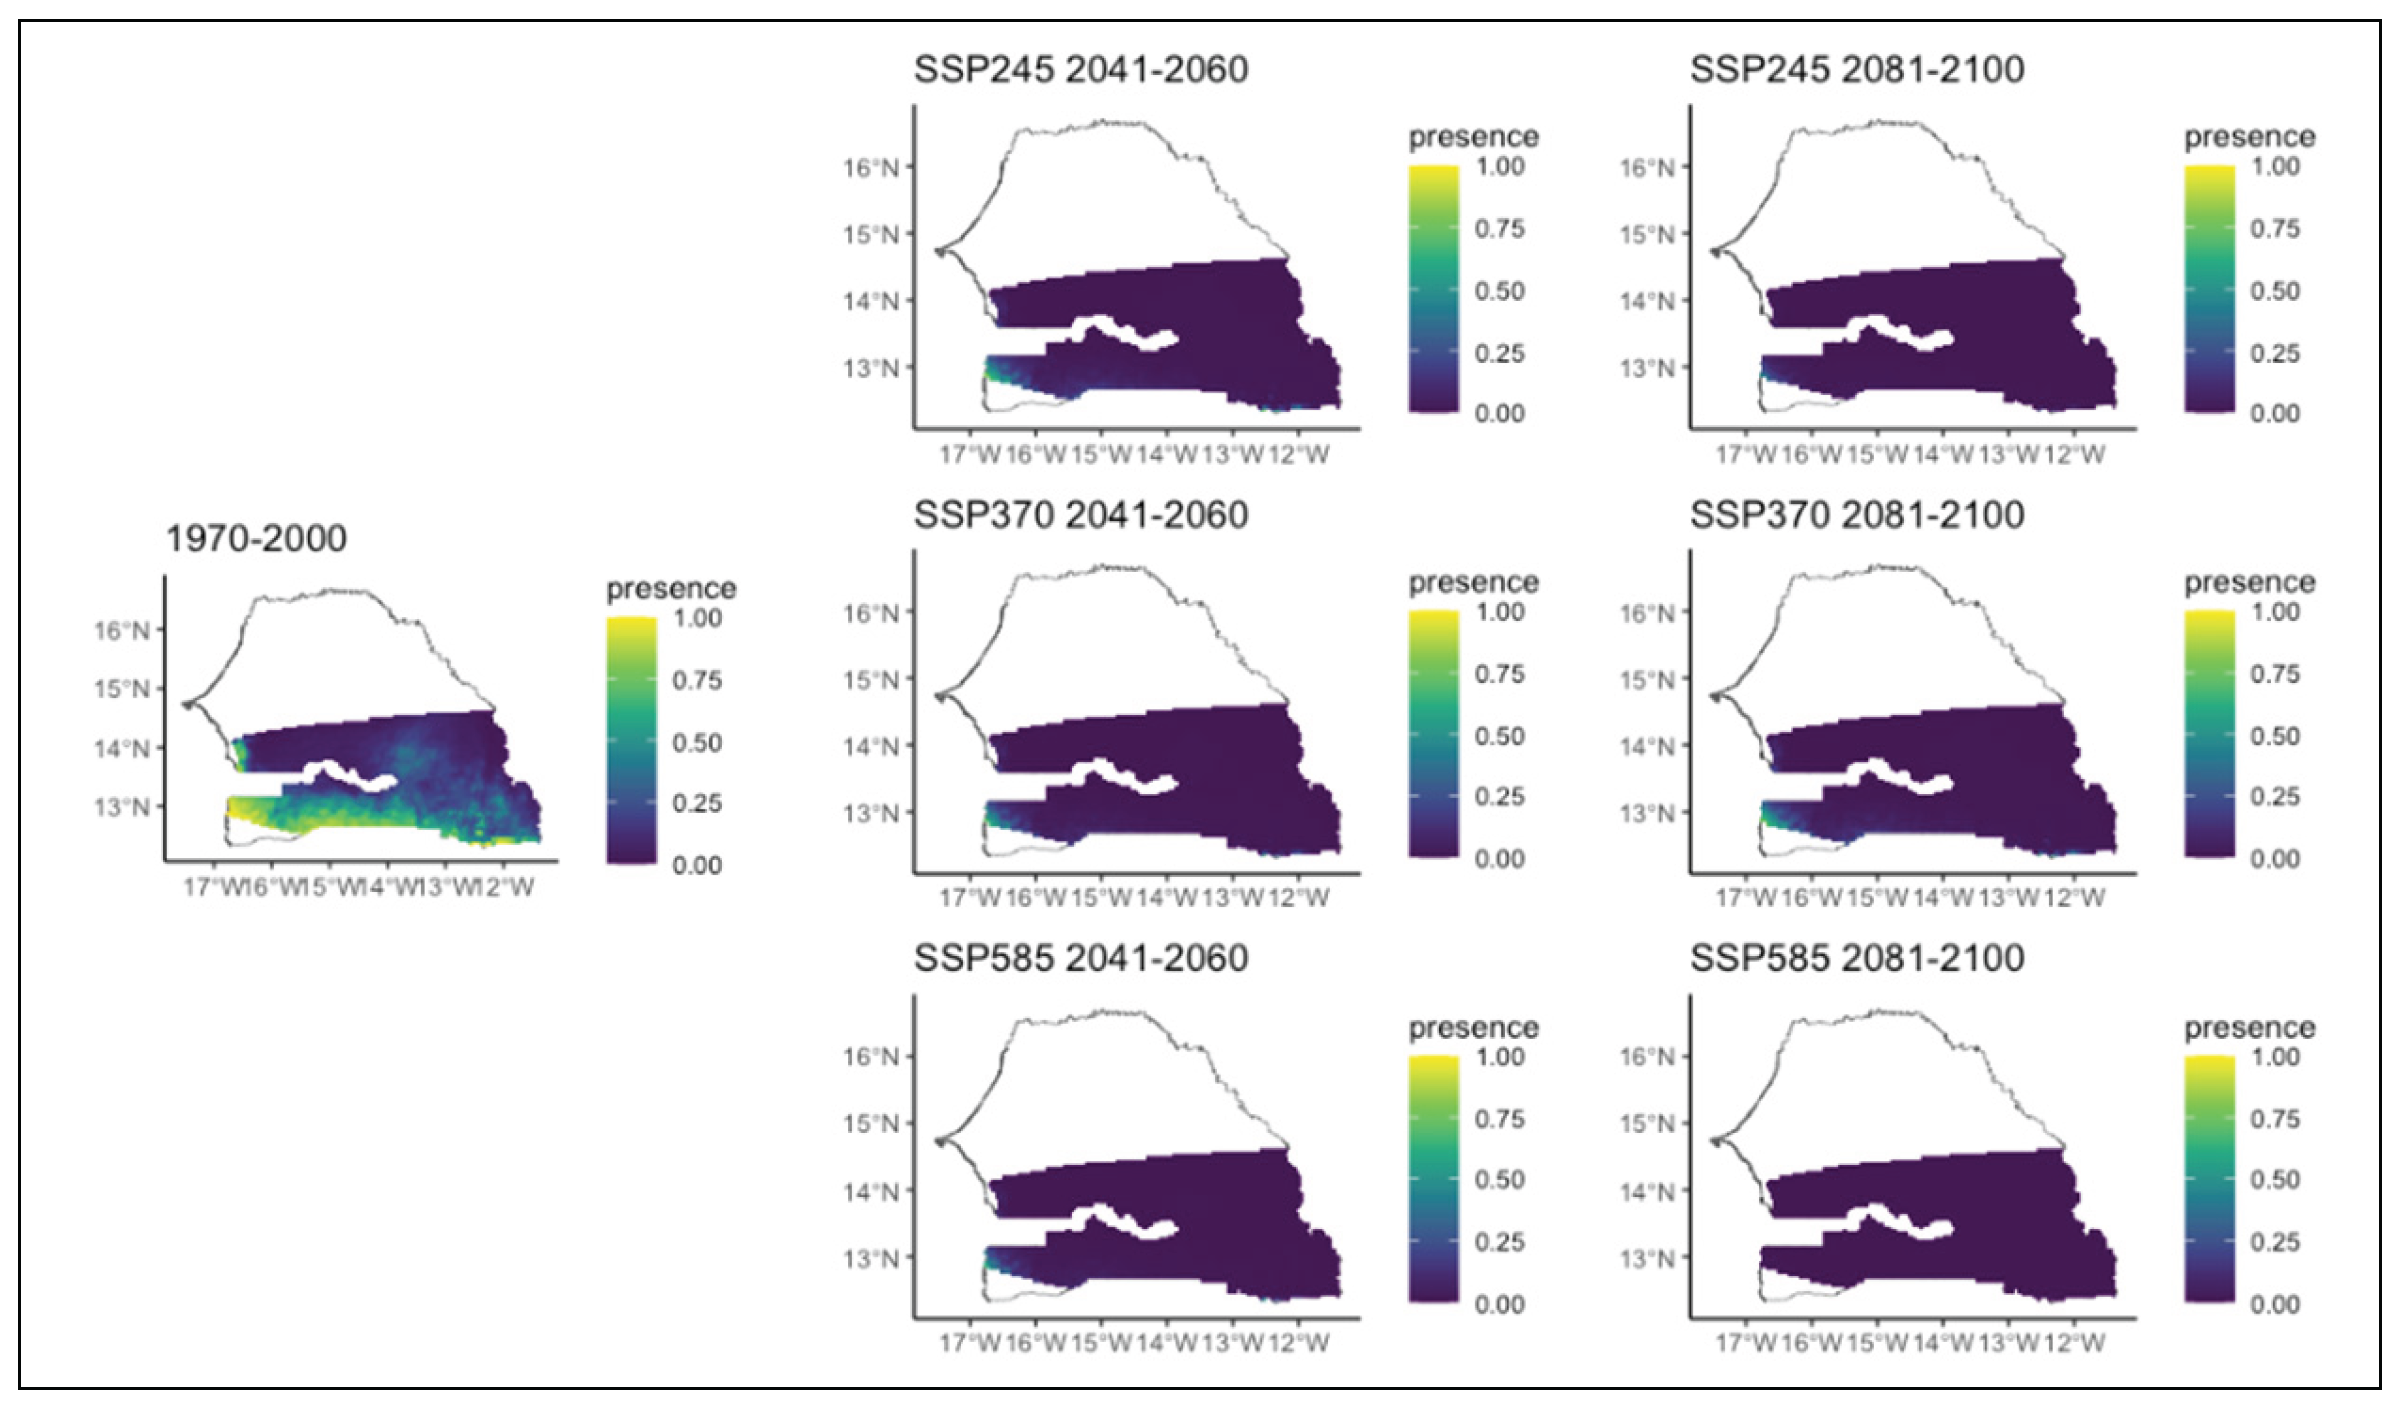
Figure 10.
Potential distributions of Daniellia oliveri for the present (1970-2000) and for the future under three different climate change scenarios (SSP245, SSP370, SSP585) for two periods (2041-2060 and 2081-2100).
Figure 10.
Potential distributions of Daniellia oliveri for the present (1970-2000) and for the future under three different climate change scenarios (SSP245, SSP370, SSP585) for two periods (2041-2060 and 2081-2100).
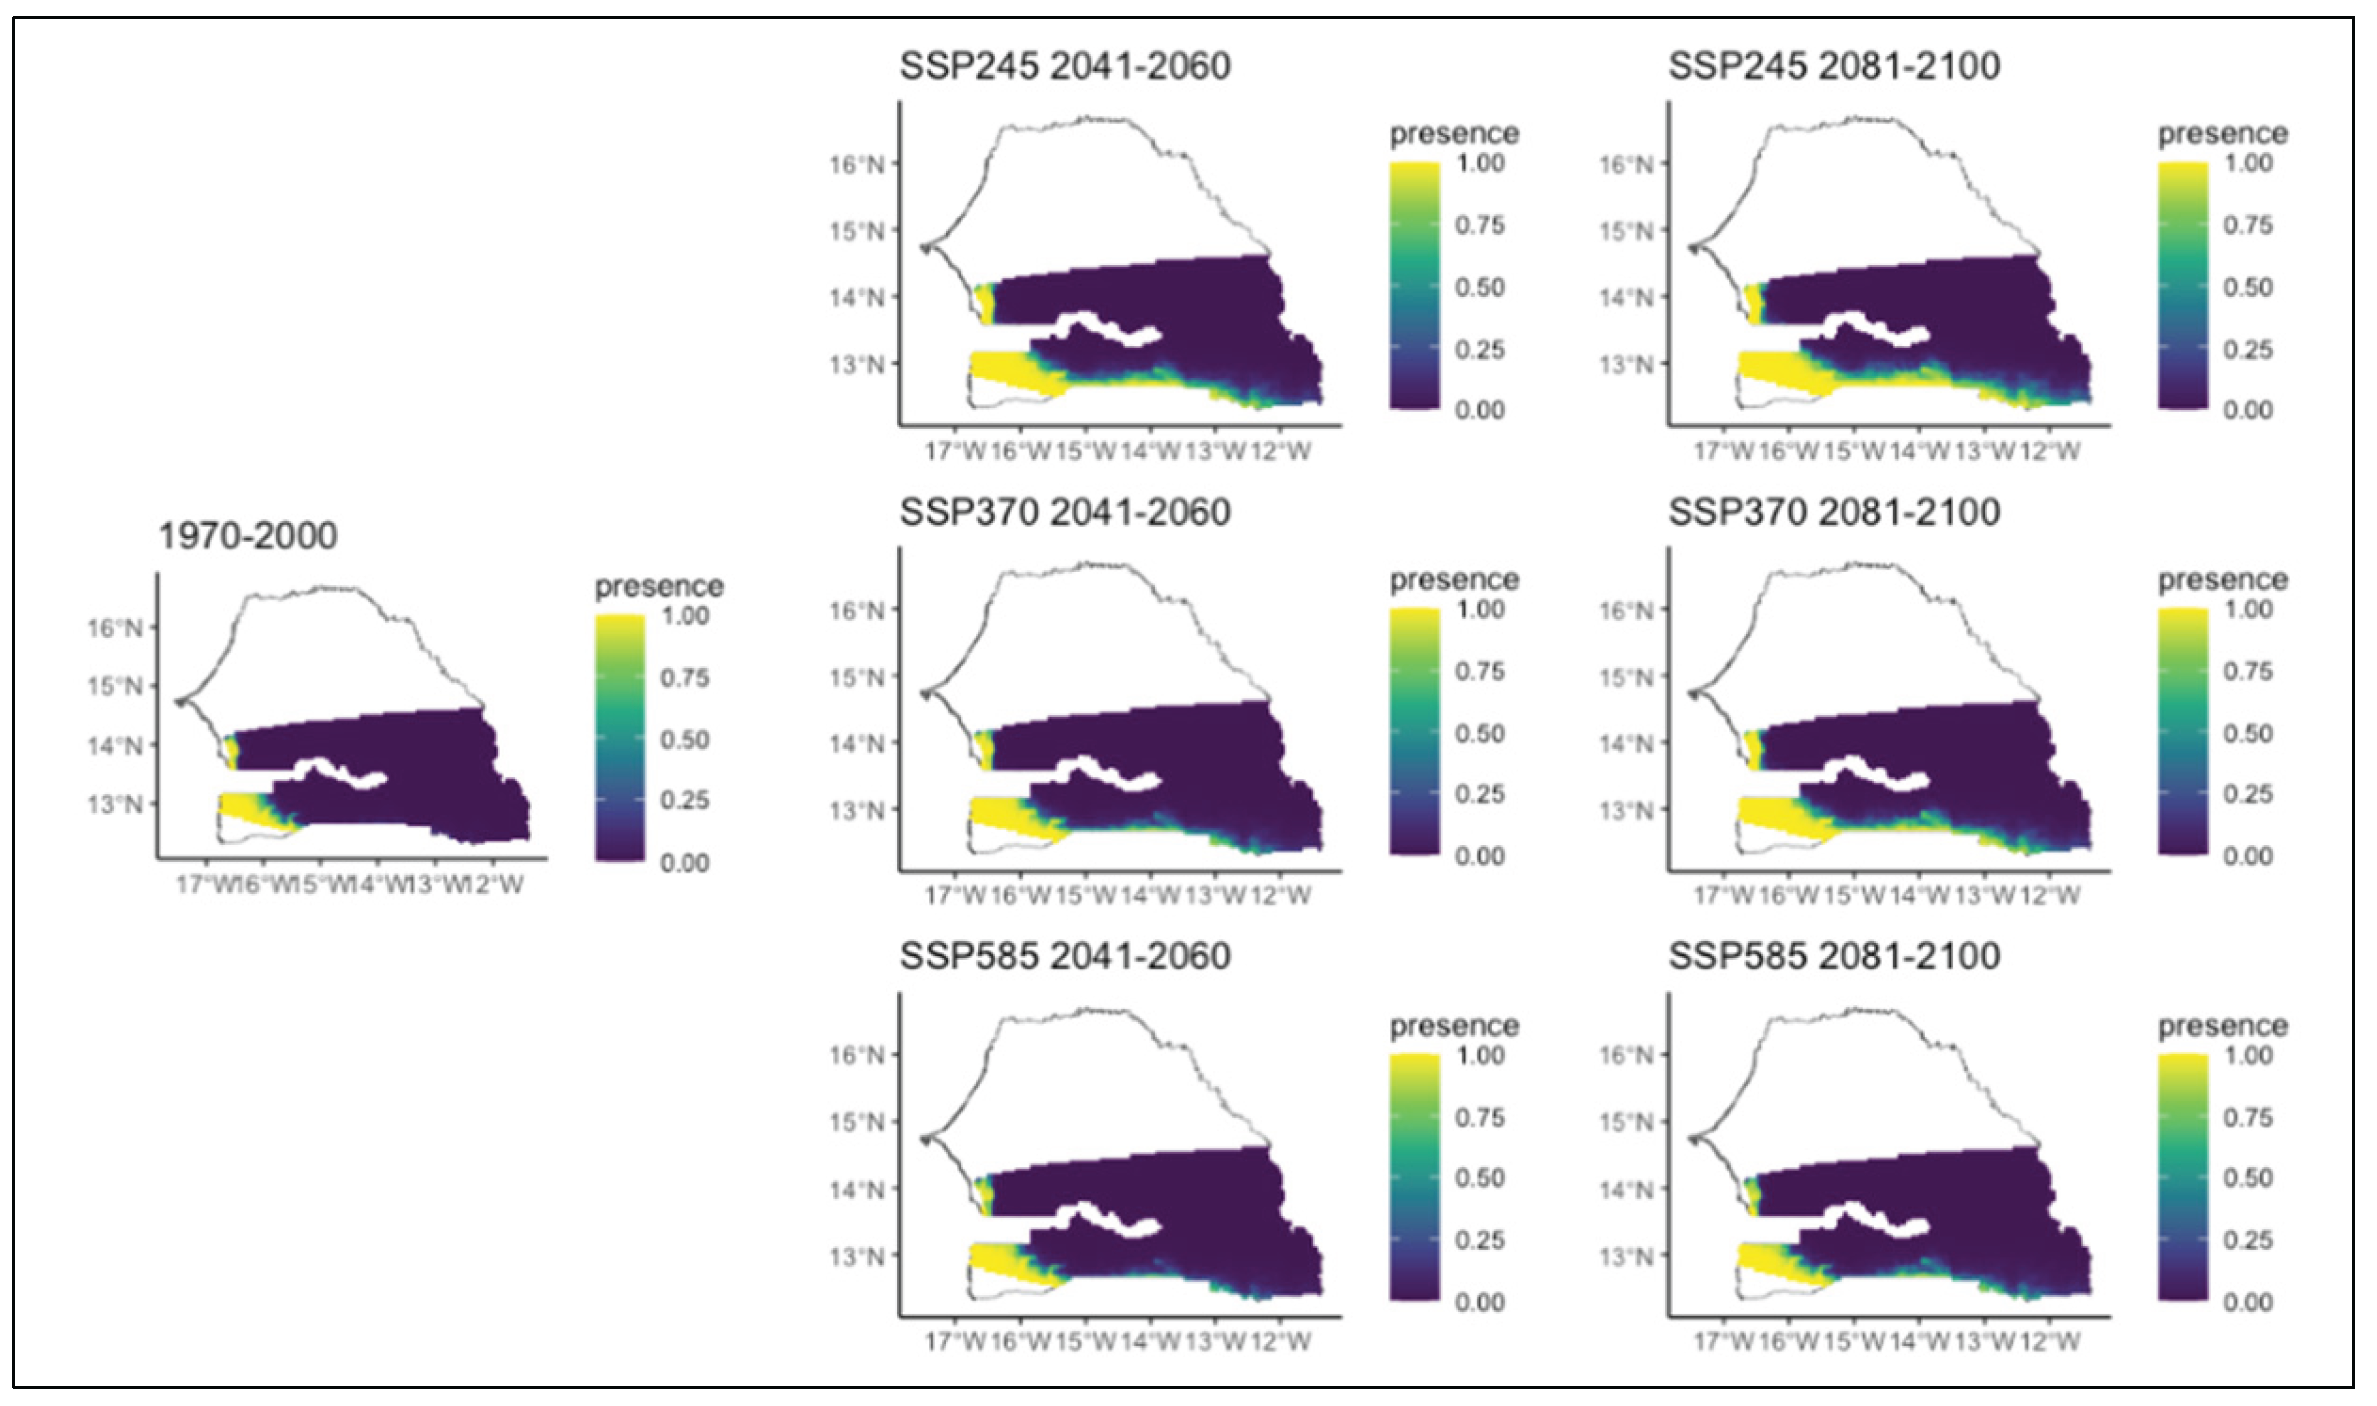
Figure 11.
Potential distributions of Detarium microcarpum for the present (1970-2000) and for the future under three different climate change scenarios (SSP245, SSP370, SSP585) for two periods (2041-2060 and 2081-2100).
Figure 11.
Potential distributions of Detarium microcarpum for the present (1970-2000) and for the future under three different climate change scenarios (SSP245, SSP370, SSP585) for two periods (2041-2060 and 2081-2100).
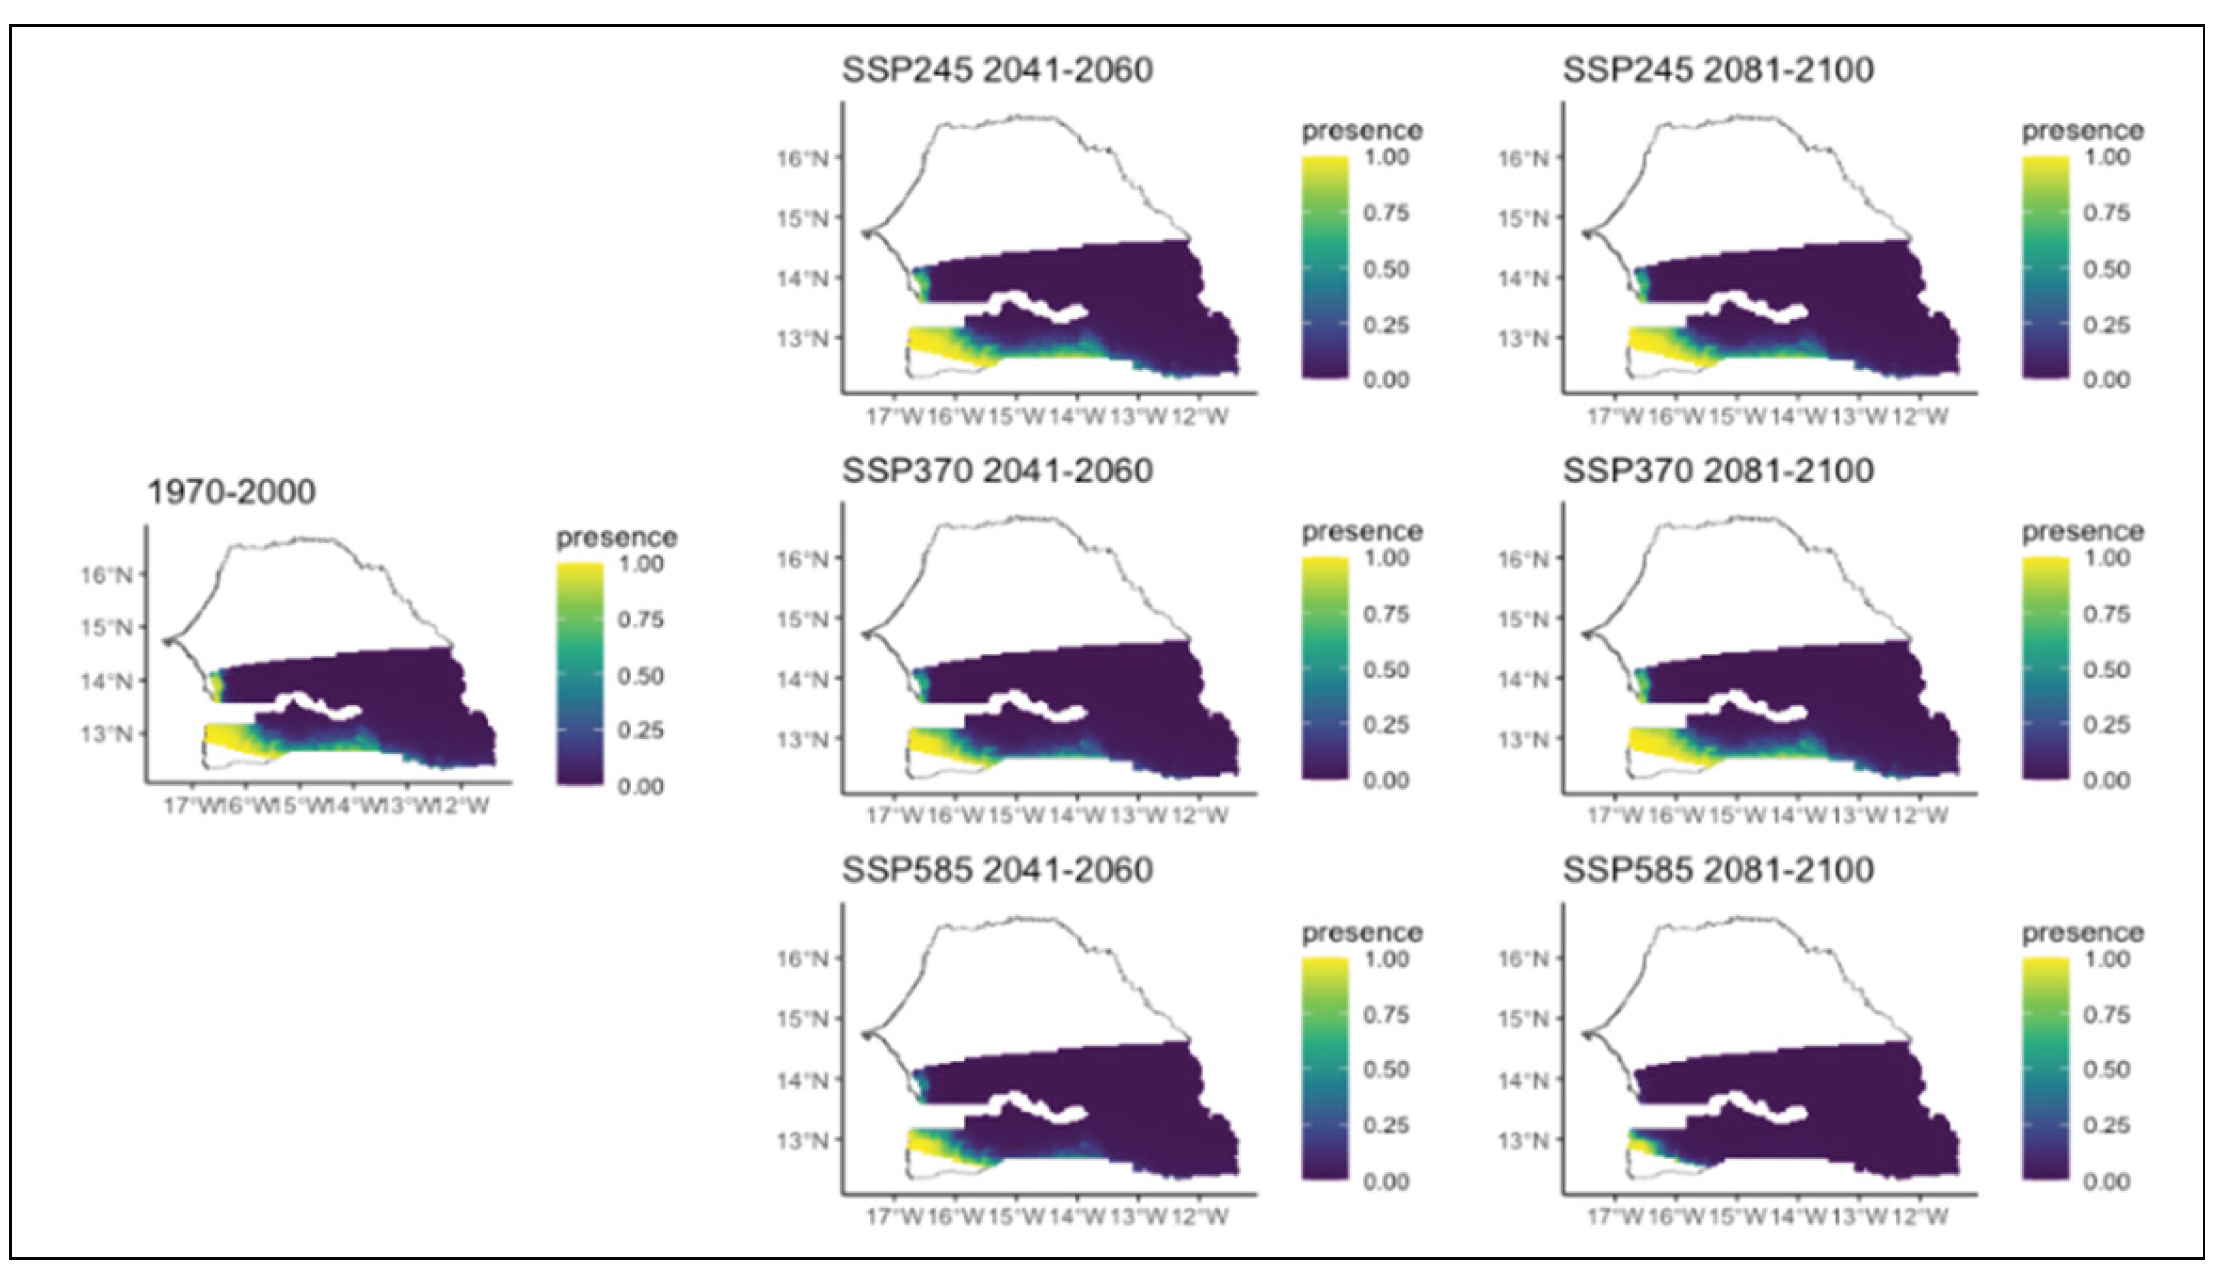
Figure 12.
Potential distributions of Lannea acida for the present (1970-2000) and for the future under three different climate change scenarios (SSP245, SSP370, SSP585) for two periods (2041-2060 and 2081-2100).
Figure 12.
Potential distributions of Lannea acida for the present (1970-2000) and for the future under three different climate change scenarios (SSP245, SSP370, SSP585) for two periods (2041-2060 and 2081-2100).
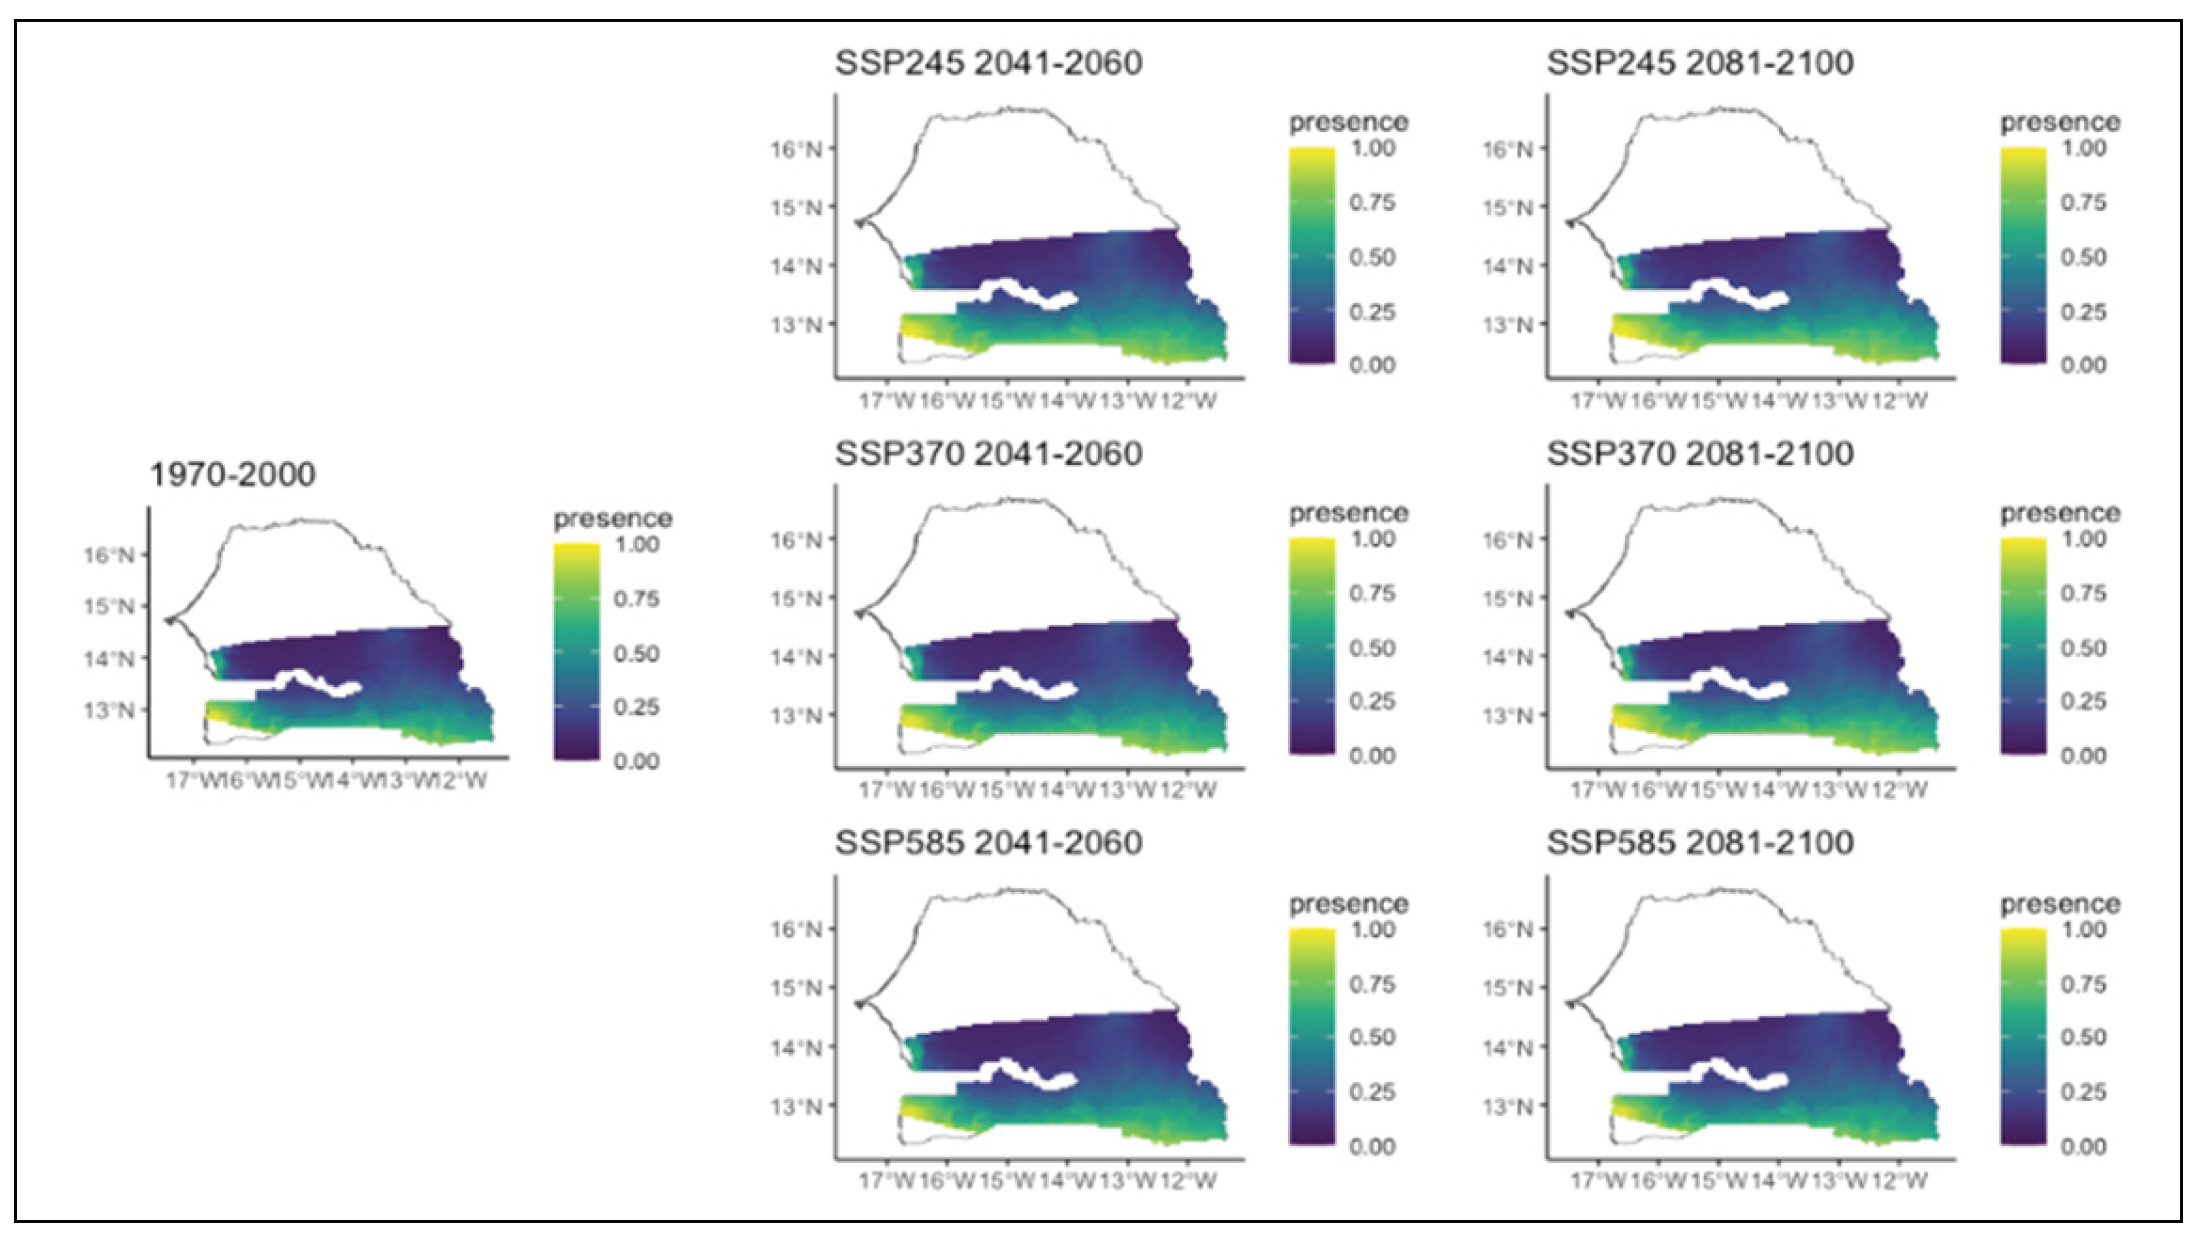
Figure 13.
Potential distributions of Parkia biglobosa for the present (1970-2000) and for the future under three different climate change scenarios (SSP245, SSP370, SSP585) for two periods (2041-2060 and 2081-2100).
Figure 13.
Potential distributions of Parkia biglobosa for the present (1970-2000) and for the future under three different climate change scenarios (SSP245, SSP370, SSP585) for two periods (2041-2060 and 2081-2100).
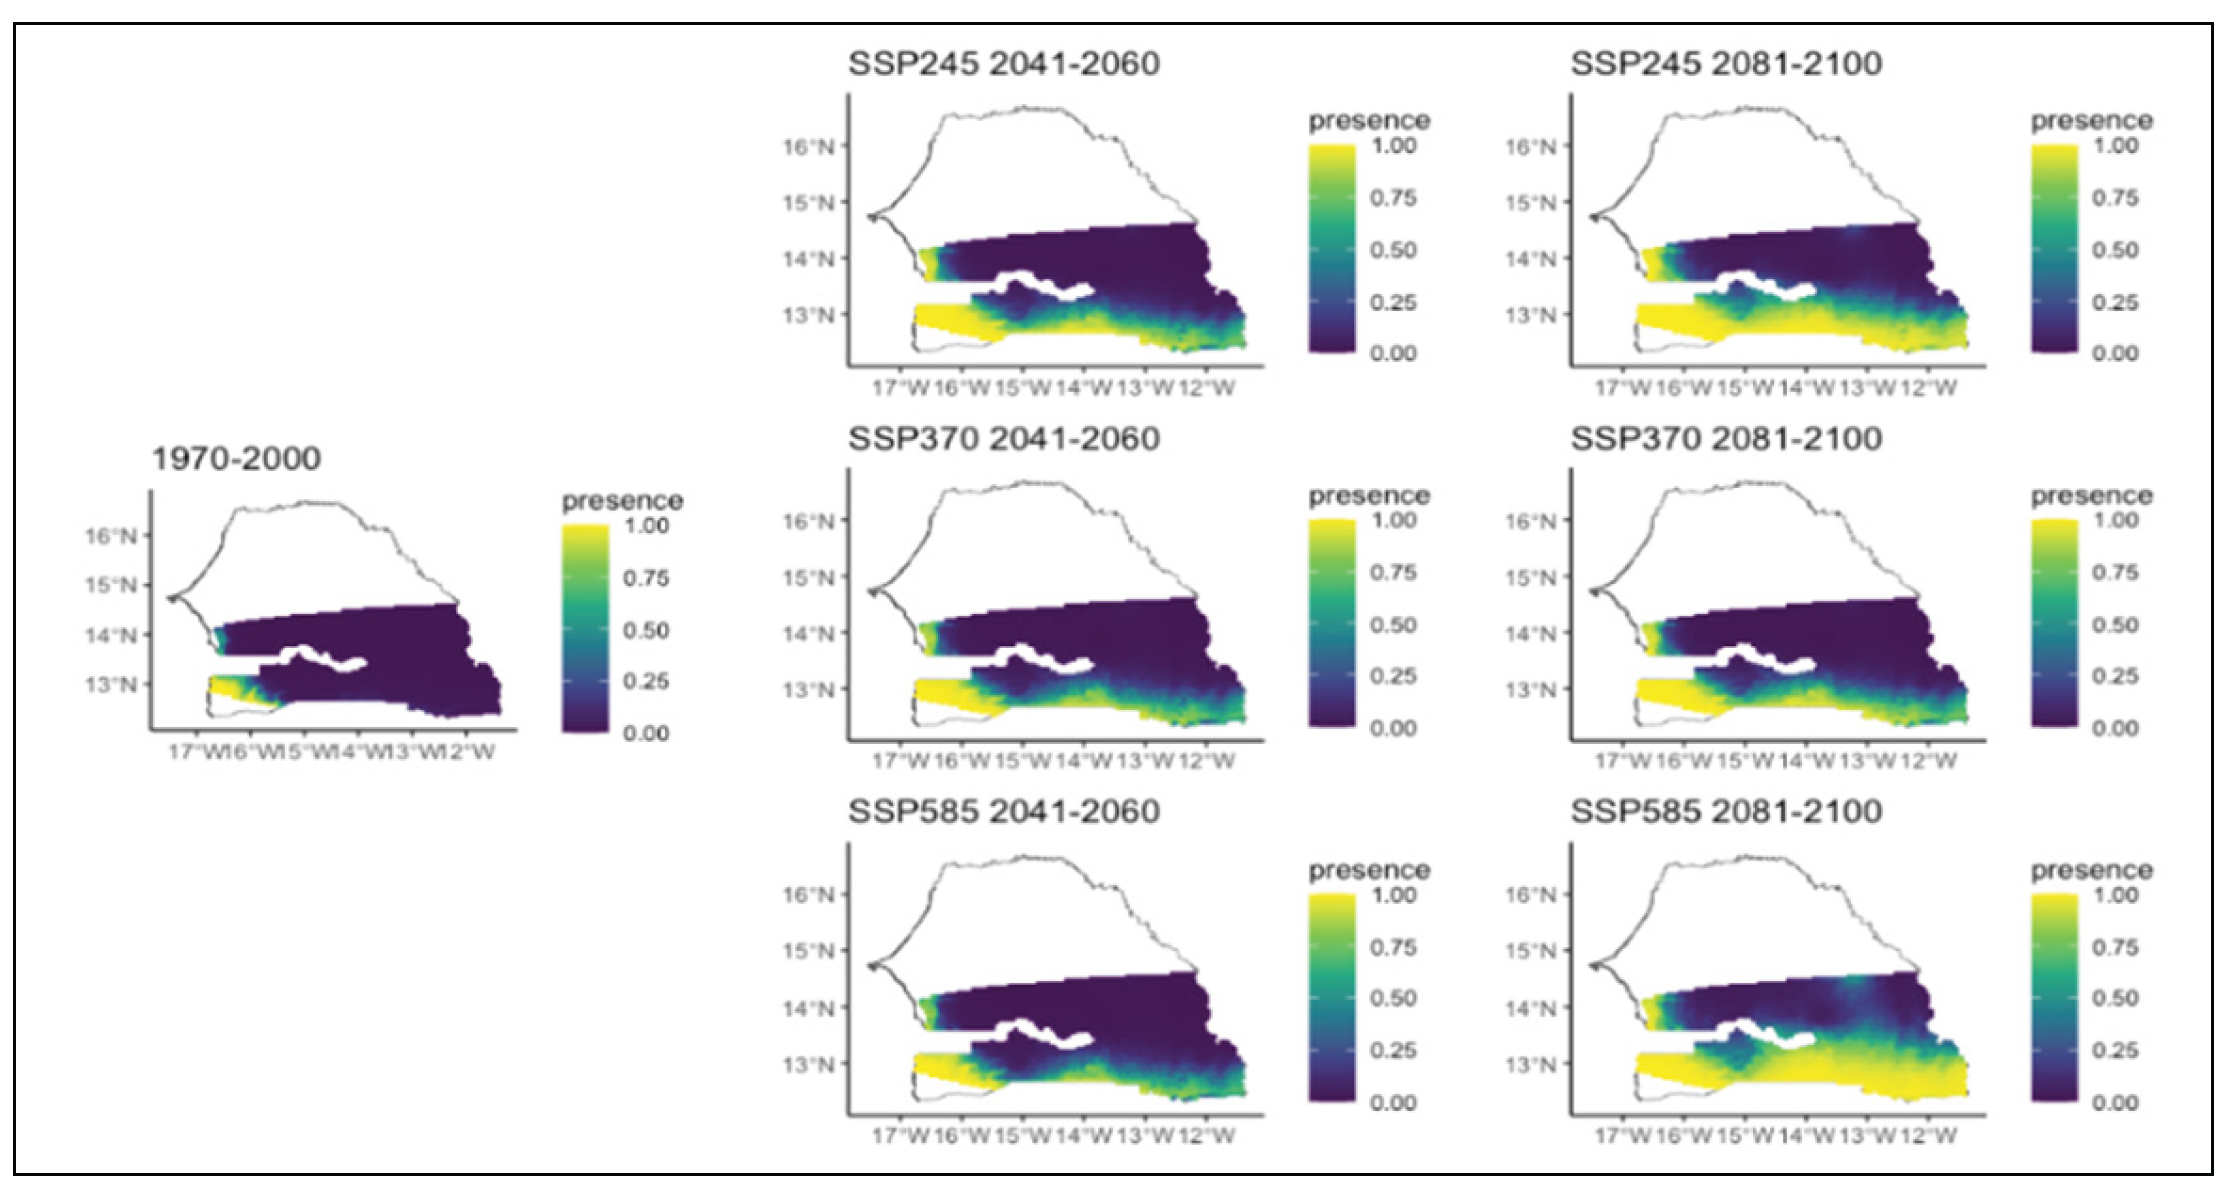
Figure 14.
Potential distributions of Prosopis africana for the present (1970-2000) and for the future under three different climate change scenarios (SSP245, SSP370, SSP585) for two periods (2041-2060 and 2081-2100).
Figure 14.
Potential distributions of Prosopis africana for the present (1970-2000) and for the future under three different climate change scenarios (SSP245, SSP370, SSP585) for two periods (2041-2060 and 2081-2100).
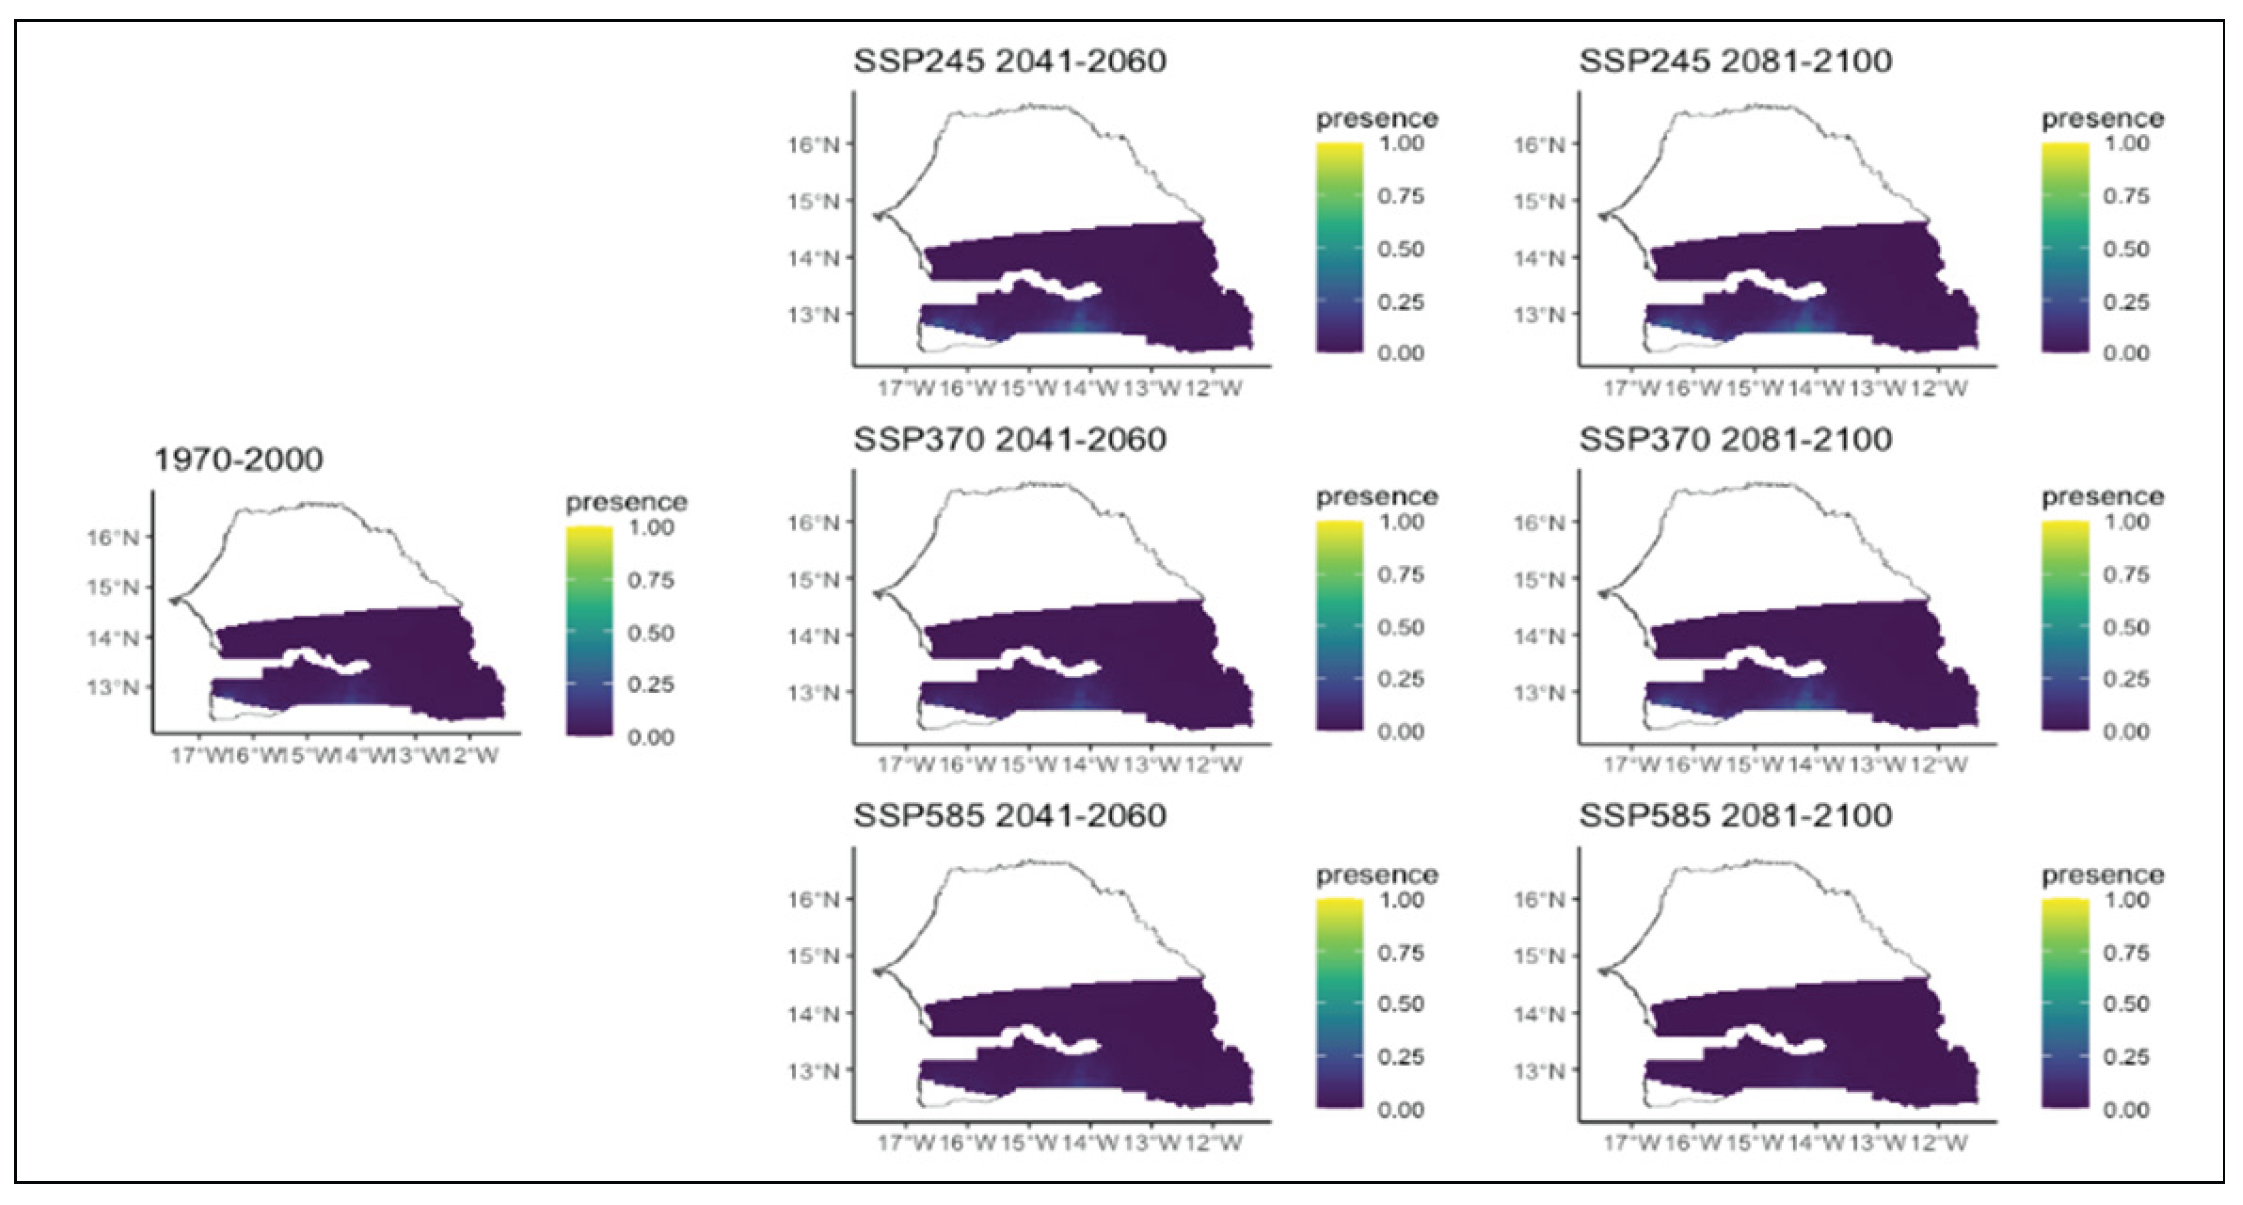
Figure 15.
Potential distributions of Pterocarpus erinaceus for the present (1970-2000) and for the future under three different climate change scenarios (SSP245, SSP370, SSP585) for two periods (2041-2060 and 2081-2100).
Figure 15.
Potential distributions of Pterocarpus erinaceus for the present (1970-2000) and for the future under three different climate change scenarios (SSP245, SSP370, SSP585) for two periods (2041-2060 and 2081-2100).
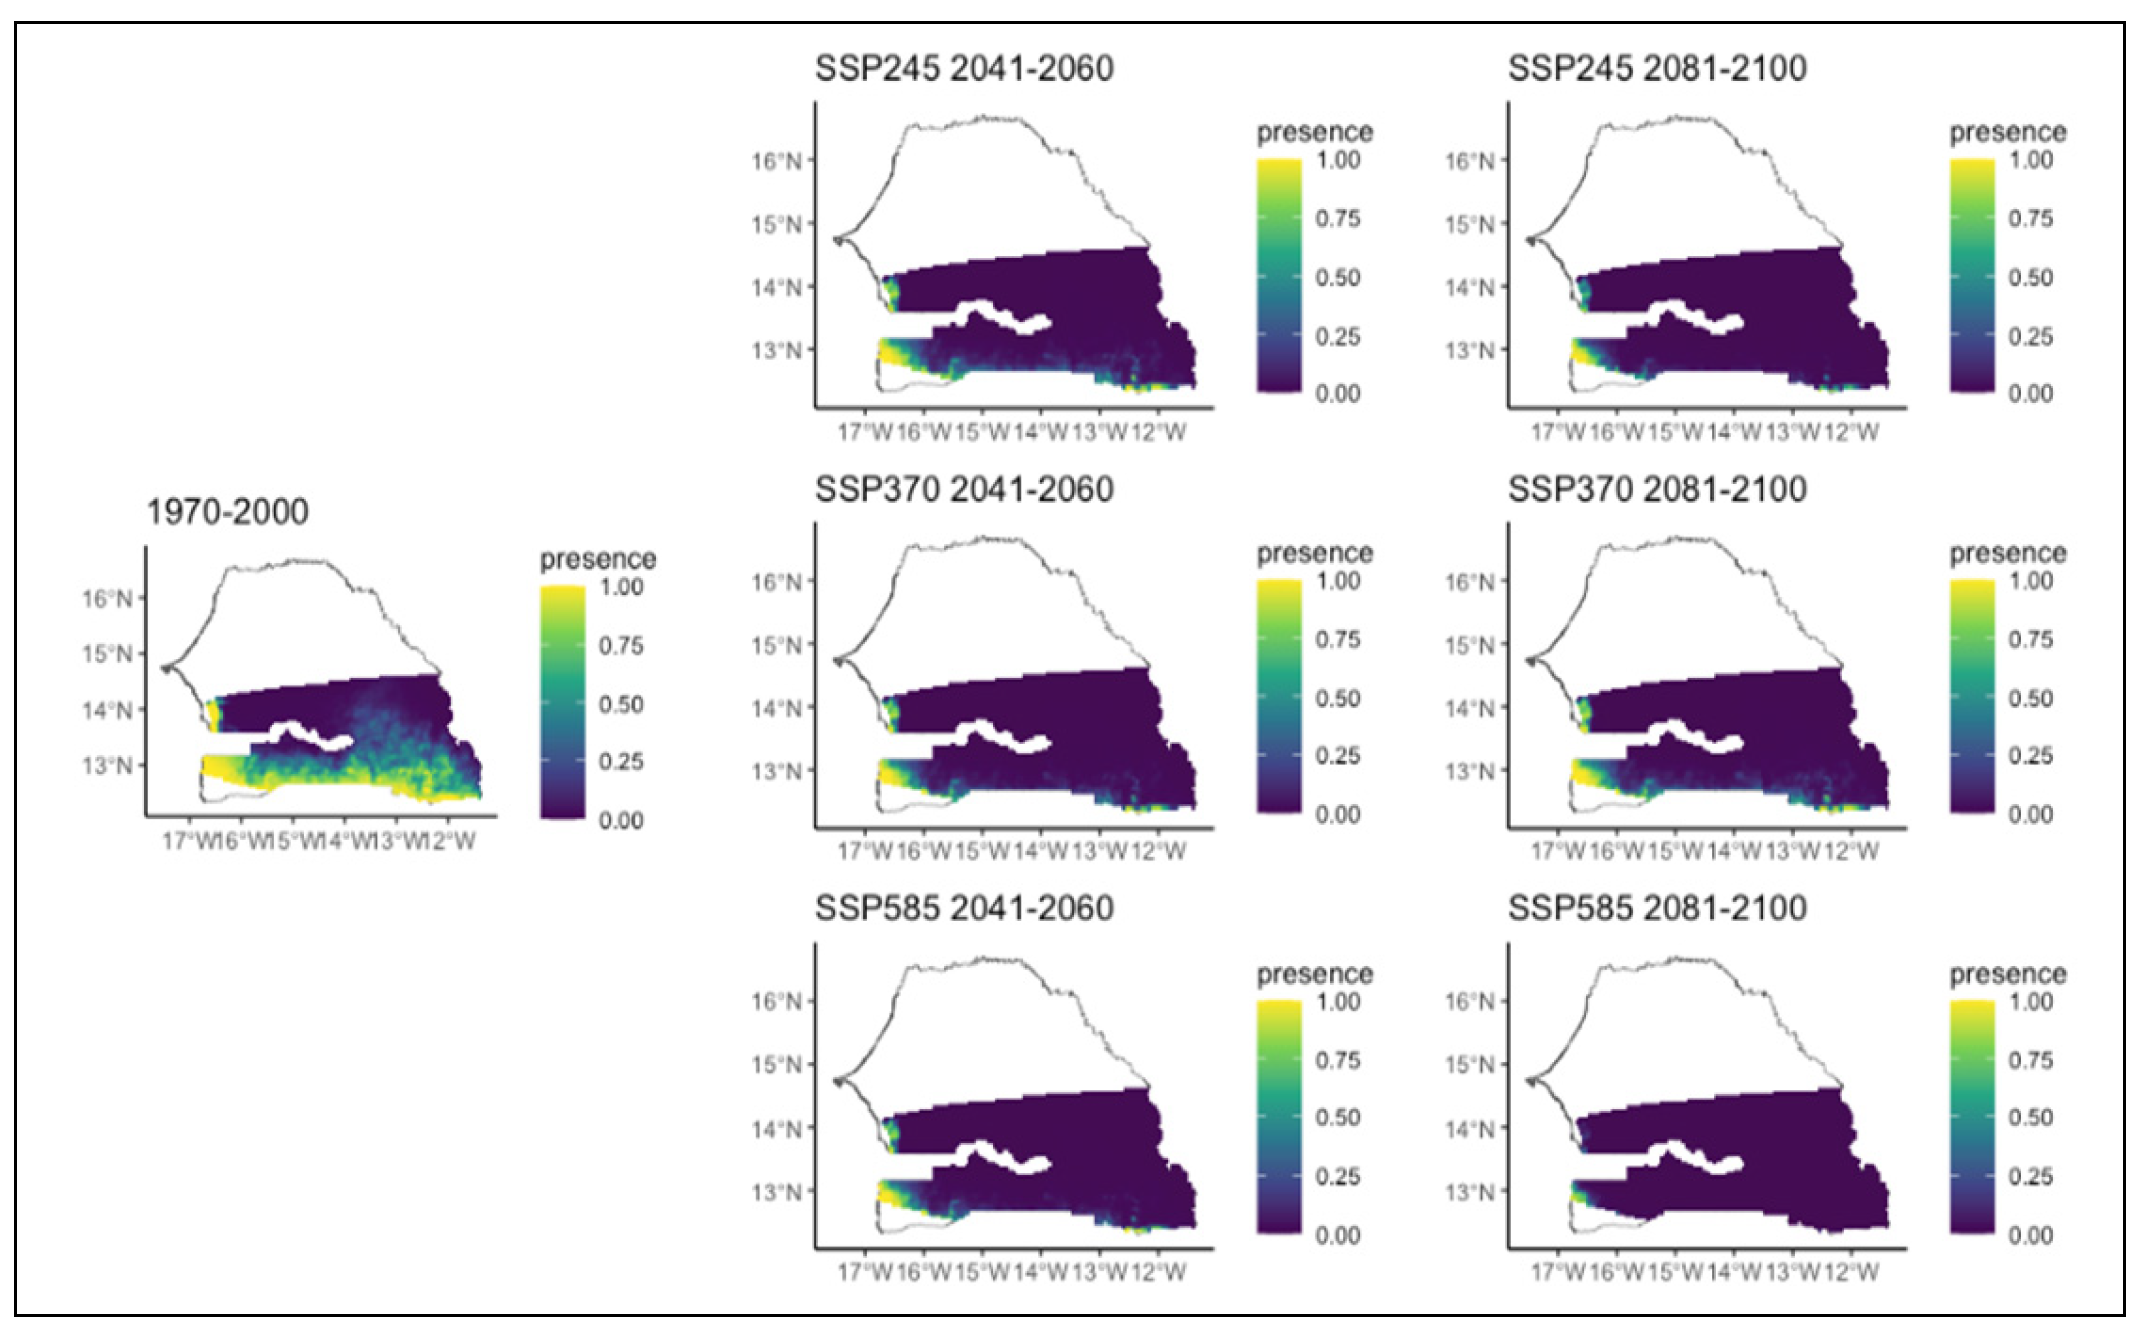
Figure 16.
Potential distributions of Sterculia setigera for the present (1970-2000) and for the future under three different climate change scenarios (SSP245, SSP370, SSP585) for two periods (2041-2060 and 2081-2100).
Figure 16.
Potential distributions of Sterculia setigera for the present (1970-2000) and for the future under three different climate change scenarios (SSP245, SSP370, SSP585) for two periods (2041-2060 and 2081-2100).
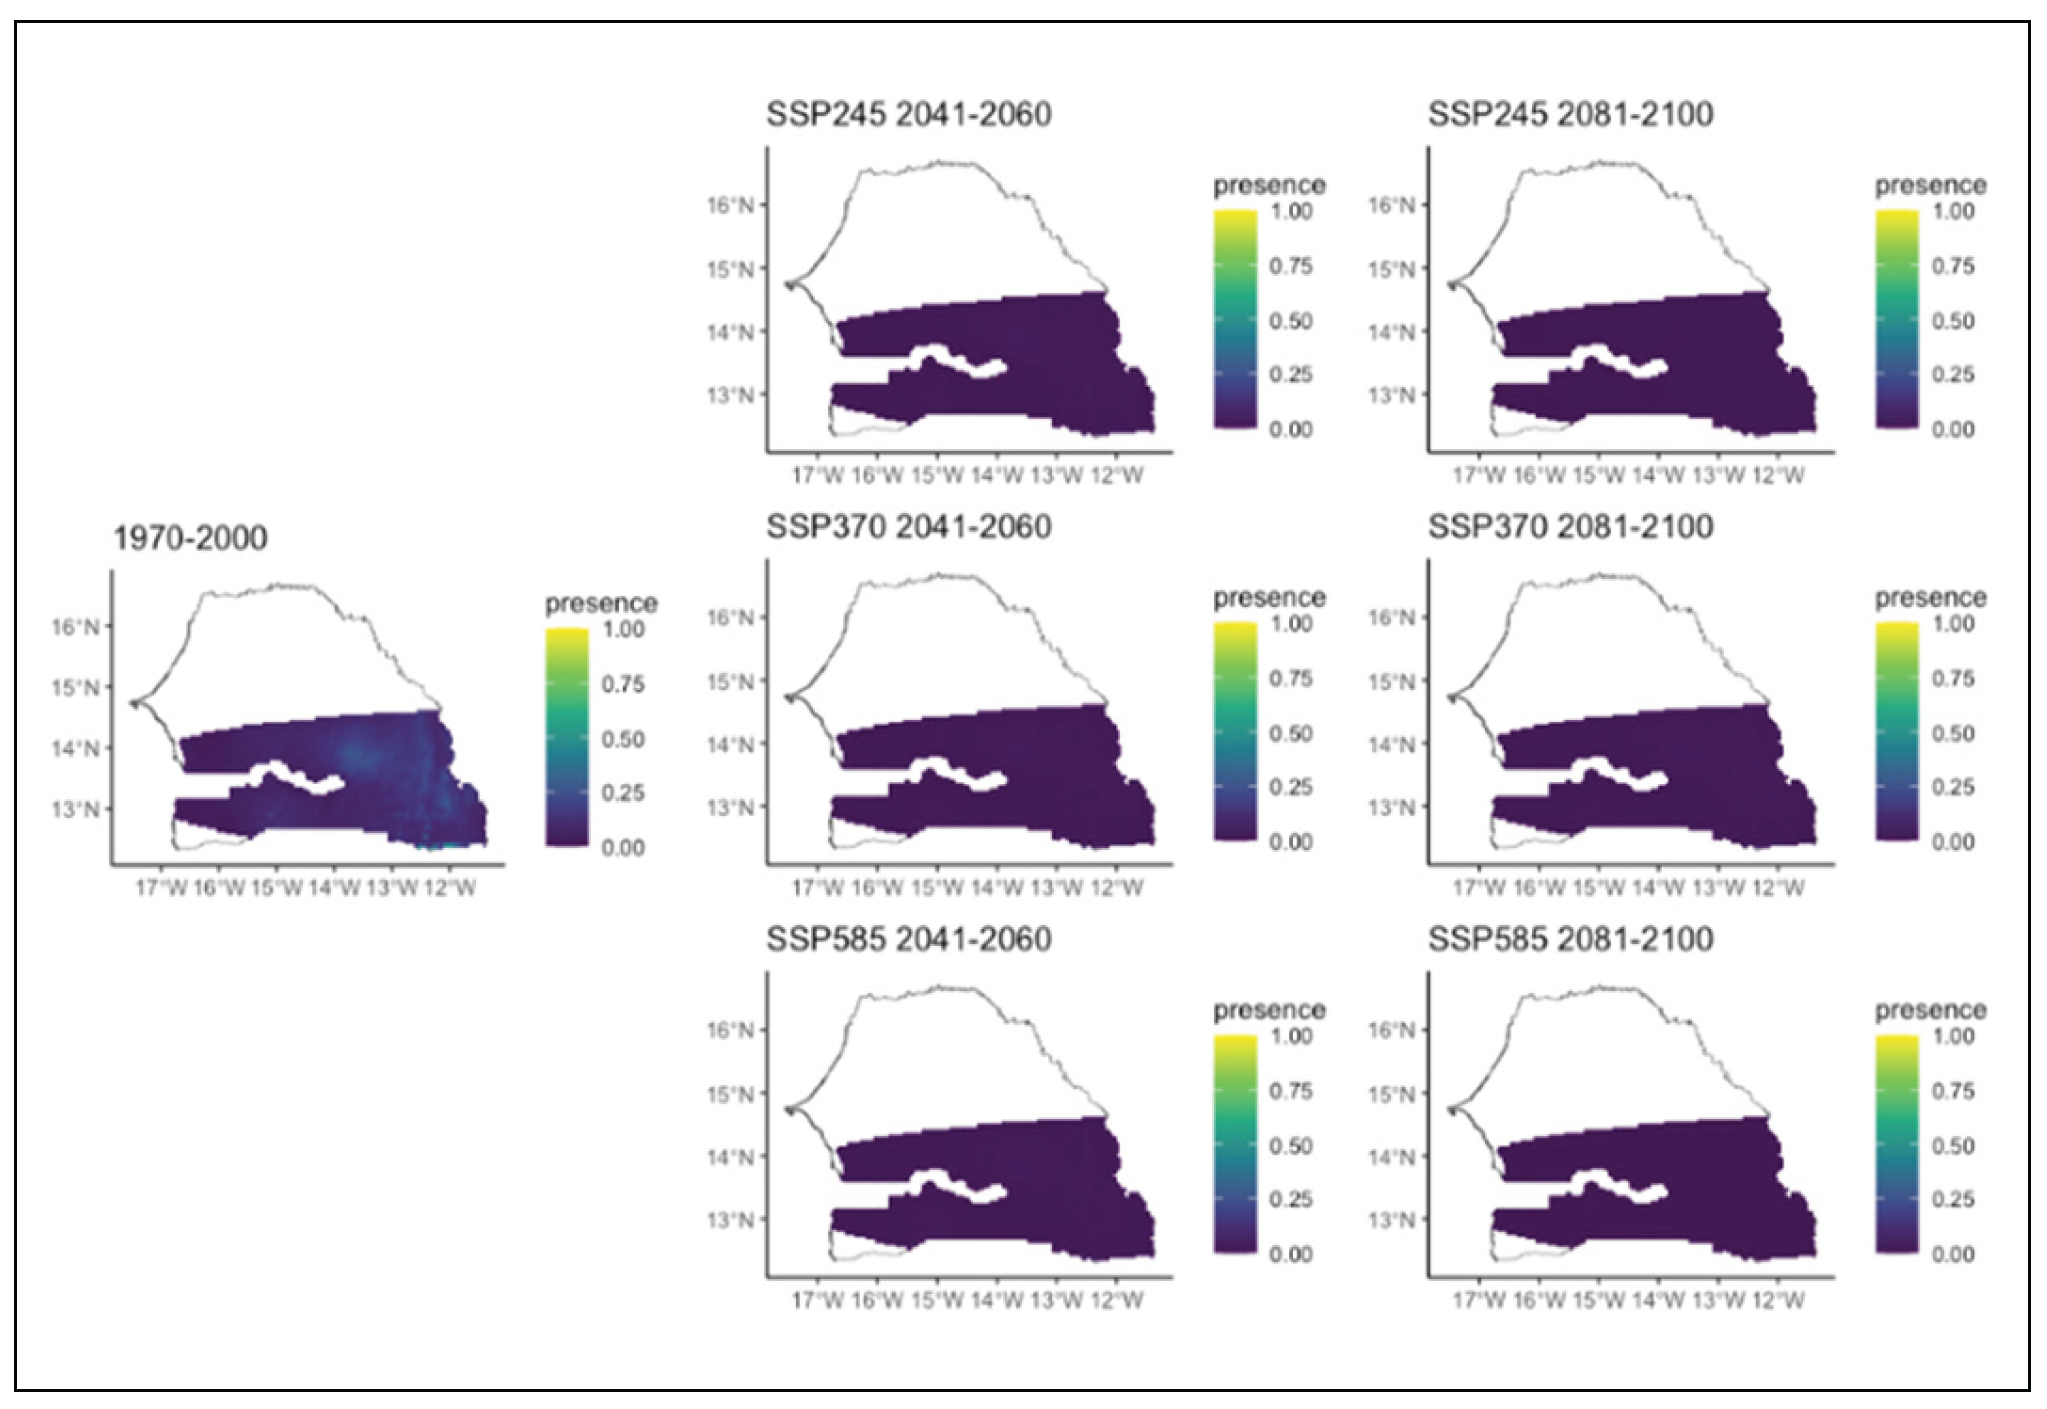
Figure 17.
Potential distributions of Terminalia avicennioides for the present (1970-2000) and for the future under three different climate change scenarios (SSP245, SSP370, SSP585) for two periods (2041-2060 and 2081-2100).
Figure 17.
Potential distributions of Terminalia avicennioides for the present (1970-2000) and for the future under three different climate change scenarios (SSP245, SSP370, SSP585) for two periods (2041-2060 and 2081-2100).
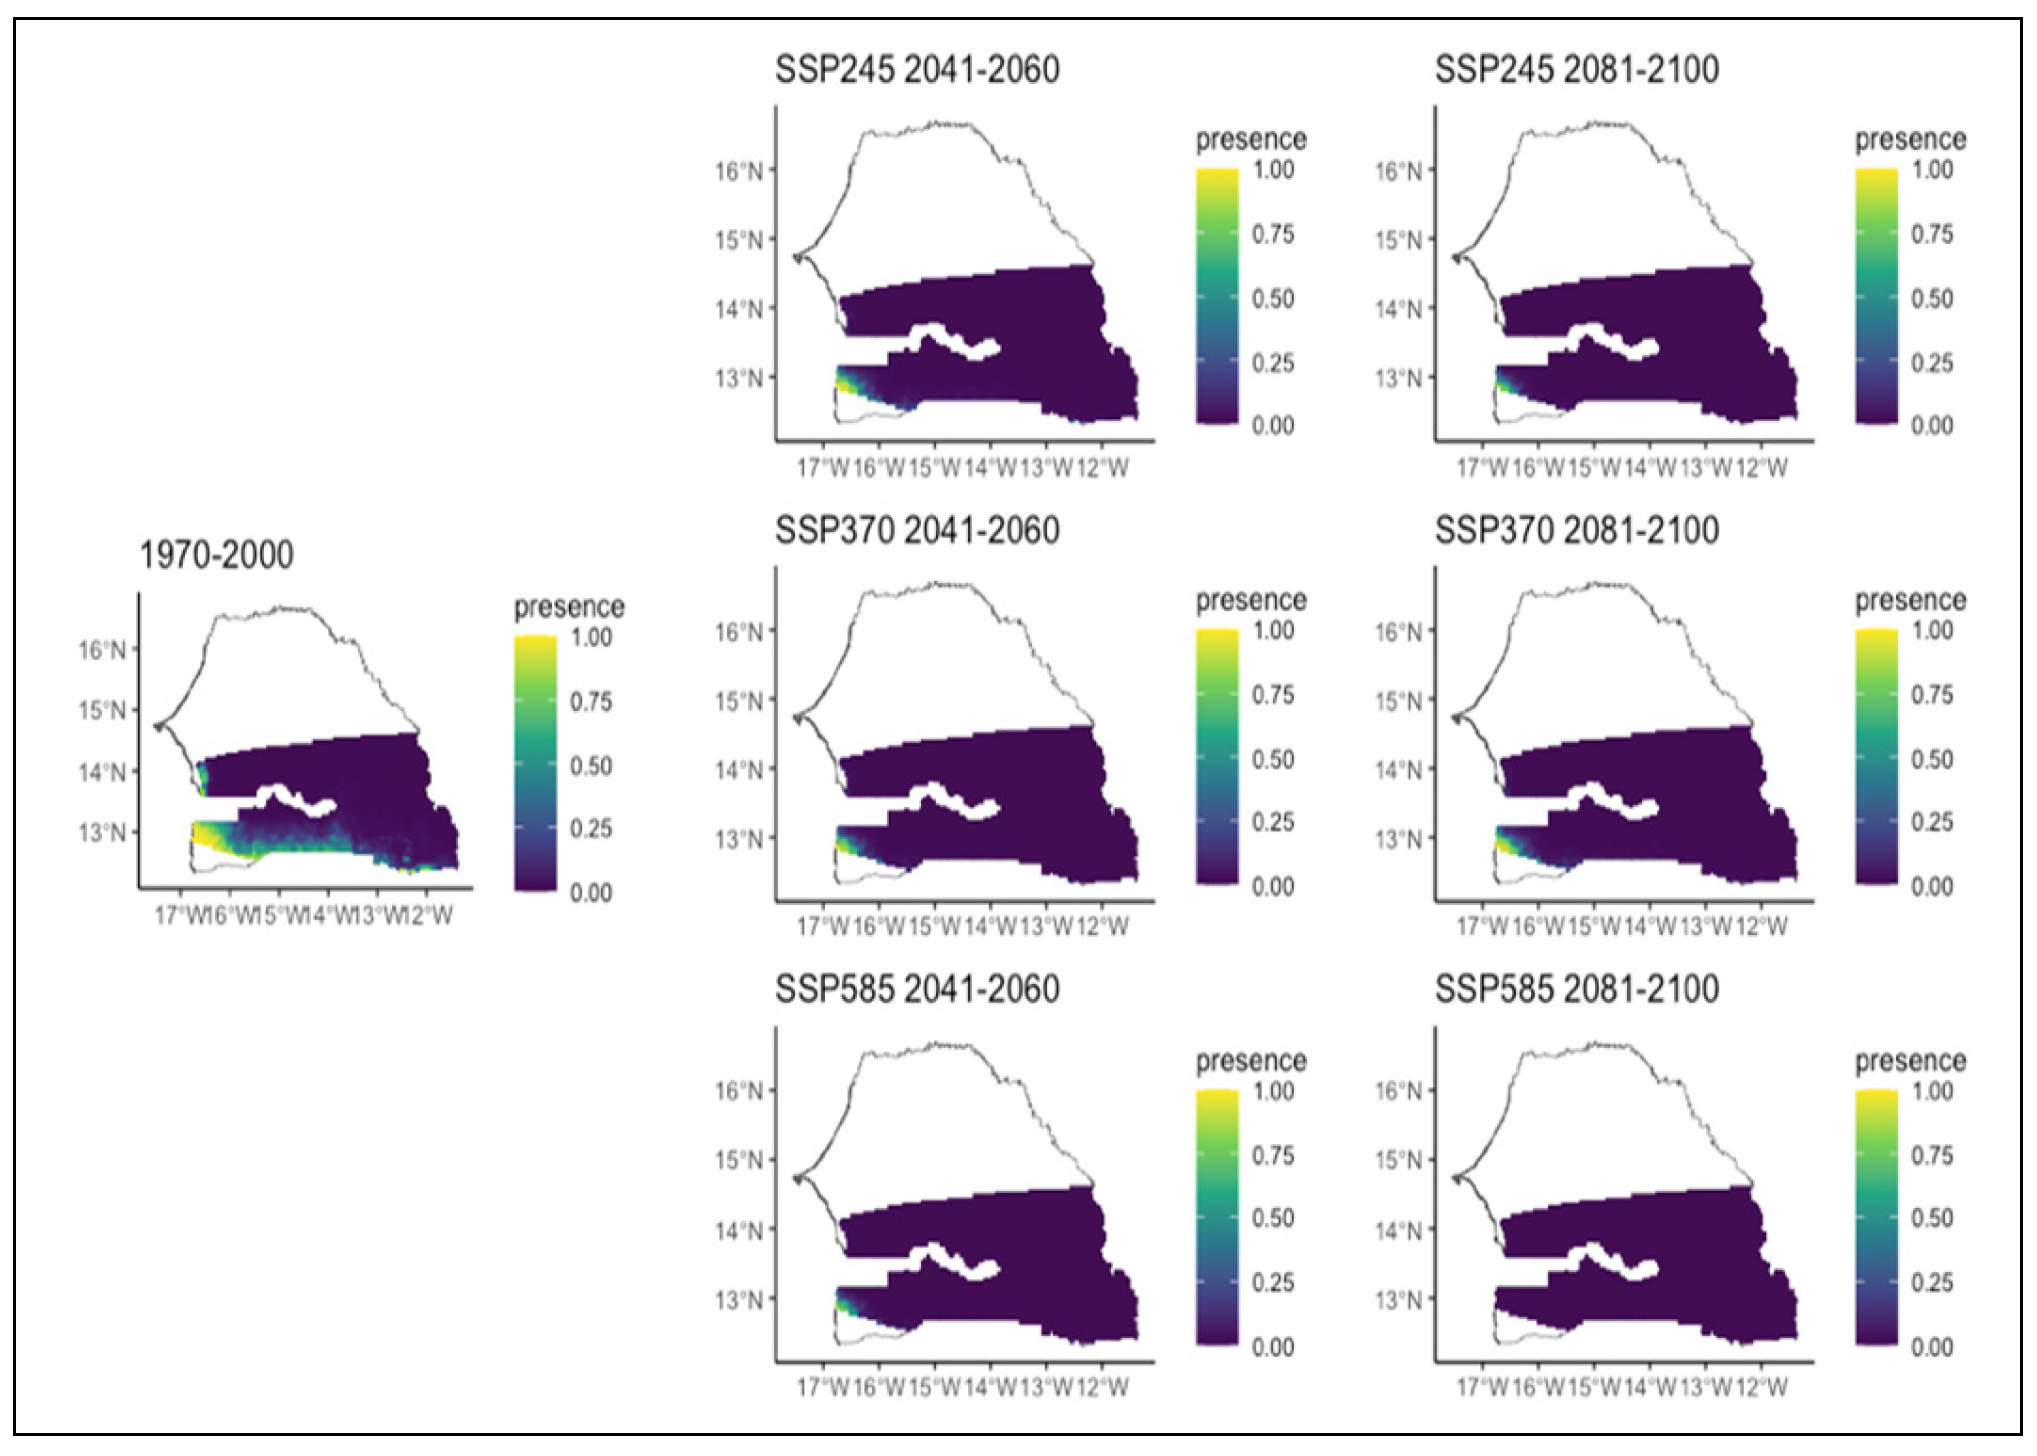

Table 1.
Bioclimatic variables used to generate models of potential distribution of species.
| WorldClim Code | Abbreviated Name | Description |
|---|---|---|
| BIO1 | temp_mean_ann | Annual Mean Temperature (oC) |
| BIO2 | temp_diff_day | Mean Diurnal Temperature Range (Mean of monthly (max temp - min temp), oC)) |
| BIO3 | temp_iso | Isothermality (BIO2/BIO7) (×100) |
| BIO4 | temp_season | Temperature Seasonality (standard deviation ×100) |
| BIO5 | temp_max_mon | Max Temperature of Warmest Month (oC) |
| BIO6 | temp_min_mon | Min Temperature of Coldest Month (oC) |
| BIO7 | temp_diff_ann | Temperature Annual Range (BIO5-BIO6, oC)) |
| BIO8 | temp_wetq | Mean Temperature of Wettest Quarter (oC) |
| BIO9 | temp_dryq | Mean Temperature of Driest Quarter (oC) |
| BIO10 | temp_warmq | Mean Temperature of Warmest Quarter (oC) |
| BIO11 | temp_coldq | Mean Temperature of Coldest Quarter (oC) |
| BIO12 | prec_ann | Annual Precipitation (mm) |
| BIO13 | prec_max_mon | Precipitation of Wettest Month (mm) |
| BIO14 | prec_min_mon | Precipitation of Driest Month (mm) |
| BIO15 | prec_season | Precipitation Seasonality (Coefficient of Variation, %) |
| BIO16 | prec_wetq | Precipitation of Wettest Quarter (mm) |
| BIO17 | prec_dryq | Precipitation of Driest Quarter (mm) |
| BIO18 | prec_warmq | Precipitation of Warmest Quarter (mm) |
| BIO19 | prec_coldq | Precipitation of Coldest Quarter (mm) |
Table 2.
Mean value across the study area of the bioclimatic variables used in the species distribution models. See Table 8 for variable definitions.
Table 2.
Mean value across the study area of the bioclimatic variables used in the species distribution models. See Table 8 for variable definitions.
| Scenarios | temp_mean_ann | temp_max_mon | temp_min_mon | prec_ann | prec_season |
|---|---|---|---|---|---|
| 1970-2000 | 27.6 | 38.8 | 16.3 | 850.5 | 135.7 |
| SSP2, 2041-2060 | 29.5 | 40.6 | 18.4 | 887.5 | 137.4 |
| SSP2, 2081-2100 | 30.4 | 41.5 | 19.2 | 886.0 | 137.4 |
| SSP3, 2041-2060 | 29.8 | 40.8 | 18.6 | 851.3 | 136.2 |
| SSP3, 2081-2100 | 31.7 | 42.6 | 20.8 | 783.7 | 133.7 |
| SSP5, 2041-2060 | 30.0 | 41.0 | 18.8 | 824.8 | 134.6 |
| SSP5, 2081-2100 | 32.7 | 43.5 | 21.8 | 762.5 | 133.2 |
Table 3.
Coefficients values (standard error in parentheses) for the effect of bioclimatic variables on the logit of the probability of presence of each species. The standardized coefficients represent the effect of an increase of one standard deviation (calculated across the study area for the 1970-2000 reference period) for each variable. Asterisks denote levels of significance (* 0.01< p < 0.05, ** 0.001 < p < 0.01, *** p < 0.001).
| Species | temp_mean _ann |
temp_max _mon |
temp_min _mon |
prec_ann | prec_season |
|---|---|---|---|---|---|
| Acacia macrostachya | -2.1* (0.9) | 1.9* (0.8) | 0.8 (0.7) | -2.1** (0.8) | -0.7 (0.9) |
| Anogeissus leiocarpus | 1.7** (0.6) | -0.3 (0.5) | -0.3 (0.4) | -0.6 (0.5) | 0.3 (0.6) |
| Bombax costatum | -1.3**(0.5) | -0.3(0.4) | 1.1**(0.4) | 0.2(0.4) | -1.5**(0.5) |
| Combretum glutinosum | 0.2(0.9) | -1.6(0.8) | 0.4(0.7) | -2.4**(0.8) | -2.8**(1.0) |
| Combretum micranthum | -1.9***(0.5) | 1.5**(0.5) | 1.6***(0.4) | -1.0*(0.4) | -1.0(0.6) |
| Combretum nigricans | -0.5(-0.9) | 0.8(0.) | 0.1(0.6) | 1.9**(0.6) | 1.1(0.8) |
| Cordyla pinnata | -1.2**(0.5) | 0.0(0.4) | 0.6*(0.3) | 0.6(0.4) | -0.6(0.4) |
| Daniellia oliveri | 2.3(2.3) | -2.7*(1.3) | -0.8(2.0) | 4.6*(2.3) | 2.0(2.0) |
| Detarium microcarpum | 0.9(0.5) | -1.4***(0.3) | -0.8(0.5) | 2.3***(0.5) | 0.6(0.5) |
| Lannea acida | 0.2(0.4) | -0.4(0.3) | 0.1(0.3) | 0.8**(0.3) | -0.1(0.3) |
| Parkia biglobosa | 2.3(1.3) | -1.7**(0.6) | -1.2(1.1) | 3.0**(1.1) | 1.6(1.1) |
| Prosopis africana | 0.8(0.9) | -0.3(0.8) | -1.3*(0.7) | 1.2(0.7) | 0.7(0.8) |
| Pterocarpus erinaceus | -0.8(0.6) | -0.9*(0.5) | 0.9***(0.4) | 1.0*(0.4) | -1.4**(0.5) |
| Sterculia setigera | -1.1(0.4) | 0.4(0.3) | 0.7*(0.3) | -0.5(0.3) | -0.8*(0.4) |
| Terminalia avicennioides | -0.8(0.6) | -0.7(0.4) | 0.2(0.5) | 1.4***(0.4) | -0.5(0.7) |
Table 4.
Probability of high-value species occurrence according to the different scenarios.
| Species | 1970-2000 | SSP2 | SSP3 | SSP5 | |||
|---|---|---|---|---|---|---|---|
| 2041-2060 | 2081-2100 | 2041-2060 | 2081-2100 | 2041-2060 | 2081-2100 | ||
| Acacia macrostachya | 0.41 | 0.05 | 0.01 | 0.05 | 0.05 | 0.05 | 0.00 |
| Anogeissus leiocarpus | 0.04 | 0.75 | 0.93 | 0.82 | 0.99 | 0.87 | 0.99 |
| Bombax costatum | 0.27 | 0.01 | 0.00 | 0.01 | 0.00 | 0.01 | 0.00 |
| Combretum glutinosum | 0.99 | 0.93 | 0.86 | 0.96 | 0.95 | 0.98 | 0.92 |
| Combretum micranthum | 0.05 | 0.00 | 0.00 | 0.01 | 0.00 | 0.01 | 0.00 |
| Combretum nigricans | 0.25 | 0.33 | 0.33 | 0.25 | 0.12 | 0.19 | 0.08 |
| Cordyla pinnata | 0.27 | 0.02 | 0.00 | 0.01 | 0.00 | 0.01 | 0.00 |
| Daniellia oliveri | 0.07 | 0.15 | 0.19 | 0.11 | 0.09 | 0.09 | 0.10 |
| Detarium microcarpum | 0.12 | 0.12 | 0.10 | 0.08 | 0.03 | 0.06 | 0.02 |
| Lannea acida | 0.31 | 0.37 | 0.38 | 0.35 | 0.33 | 0.33 | 0.33 |
| Parkia biglobosa | 0.06 | 0.28 | 0.42 | 0.24 | 0.38 | 0.21 | 0.51 |
| Prosopis africana | 0.01 | 0.02 | 0.03 | 0.01 | 0.00 | 0.01 | 0.00 |
| Pterocarpus erinaceus | 0.31 | 0.07 | 0.03 | 0.06 | 0.01 | 0.05 | 0.00 |
| Sterculia setigera | 0.10 | 0.01 | 0.00 | 0.01 | 0.00 | 0.01 | 0.00 |
| Terminalia avicennioides | 0.10 | 0.01 | 0.00 | 0.01 | 0.00 | 0.01 | 0.00 |
Disclaimer/Publisher’s Note: The statements, opinions and data contained in all publications are solely those of the individual author(s) and contributor(s) and not of MDPI and/or the editor(s). MDPI and/or the editor(s) disclaim responsibility for any injury to people or property resulting from any ideas, methods, instructions or products referred to in the content. |
© 2025 by the authors. Licensee MDPI, Basel, Switzerland. This article is an open access article distributed under the terms and conditions of the Creative Commons Attribution (CC BY) license (http://creativecommons.org/licenses/by/4.0/).
Copyright: This open access article is published under a Creative Commons CC BY 4.0 license, which permit the free download, distribution, and reuse, provided that the author and preprint are cited in any reuse.


