
Submitted:
15 December 2025
Posted:
16 December 2025
You are already at the latest version
Abstract
Antimicrobial resistance (AMR) poses a global health threat, with urban wastewater systems serving as key reservoirs for resistance dissemination. This study aimed to investigate the relationships among urban environments, bacterial communities, and AMR patterns, and evaluate the specific municipal-scale drivers of resistance gene distribution. Shotgun metagenomic analysis was conducted on 45 wastewater samples collected from 15 municipalities across Latvia to determine the composition of the resistome and its correlation with local factors. The analysis identified 417 distinct antibiotic resistance genes (ARGs) belonging to 108 families, with geographic location serving as the primary driver of ARG distribution, which explained 65.87% of community variation (p = 0.001). Local industrial factors demonstrated significant effects, with food industry wastewater significantly influencing both bacterial taxonomy and ARG profiles (p < 0.05). While the presence of a regional hospital did not shape the overall municipal resistome, hospital-associated wastewater showed 19 overlapping ARGs, including clinically critical carbapenemases. Municipal wastewater systems function as geographically structured reservoirs of AMR that are shaped by localized industrial and healthcare outputs. These findings support wastewater-based AMR surveillance as a valuable tool for tracking specific resistance sources.
Keywords:
metagenomics
; wastewater‐based epidemiology (WBE)
; antibiotic resistance
; resistome
; Latvia
1. Introduction
Antimicrobial resistance (AMR) occurs when infection-causing microorganisms, known as pathogens, evolve to survive antimicrobial treatments, such as antibiotics [1]. However, human activities have accelerated this process through antimicrobial overuse and misuse across healthcare, agricultural, and veterinary sectors. Due to its rapid emergence, AMR has been identified by the World Health Organization (WHO) as one of the most prominent threats to global health. Without effective antimicrobials, our ability to treat infectious diseases is severely compromised, leading to prolonged illness, increased risk of disease spread, and elevated mortality rates. AMR threatens the health of plants and animals, potentially causing significant downstream effects on agricultural productivity, food security and the economy [1,2].
The threat of antibiotic resistance requires increasing global efforts to monitor and limit spread of antibiotic resistant bacteria. Wastewater (WW) often contains hazardous contaminants, including pharmaceuticals, pathogens, and bacteria carrying antibiotic resistance genes (ARGs) [3,4,5,6]. This environment facilitates the transfer of antibiotic resistant bacteria and genes among humans, animals, and the surrounding environment [7,8,9,10]. Previous studies have demonstrated that WW composition can vary between geographical locations [11], depending on the origin of WW, particularly whether it originates from households, industrial factories or rainwater drained from streets, house roofs, or other surfaces. Specific production industries, such as pharmaceutical manufacturing, metallurgy, and animal farming, have considerable impacts on WW composition by supplying large amounts of waste or toxic byproducts [12,13,14,15].
Although WW management practices have vastly improved, microorganisms from sewage systems are still being found in natural water bodies, especially near urban areas [16,17,18,19]. Microorganisms may enter natural water systems through exceptional events such as sewage overflows due to extreme precipitation, and damage in sewer pipes. Treated WW effluent is another source. Although it contains fewer living organisms than untreated WW, it can still alter natural water environments [20,21], caused by the biological and the chemical agents remaining in the effluent after treatment [3,4,5,6,16,19]. Therefore, investigating WW composition as a potential pollution source has become increasingly relevant.
Next generation sequencing (NGS) and metagenomics have emerged as powerful tools for studying the ARGs [22,23]. Technological advancements and the COVID-19 pandemic have accelerated the wider adoption of WW-based epidemiology (WBE), offering insights into societal habits and disease trends [22,23,24,25]. While global initiatives have begun to map the urban resistome, significant geographic disparities in data availability remain. Central and Western Europe have established relatively robust environmental monitoring networks [11,16,24,25], however Latvia has been underrepresented in these global datasets. Latvia presents a unique ecological and demographic context for AMR surveillance. Unlike the densely populated and heavily industrialized regions of Central Europe, Latvia is characterized by a lower population density, a distinct industrial profile dominated by food processing and timber, and specific patterns of antibiotic consumption. Previous studies in the Baltic Sea region have highlighted the presence of macrolide and fluoroquinolone resistance genes in coastal waters and sediments, suggesting that anthropogenic pollution is influencing the marine resistome [26]. However, a systematic, high-resolution analysis of municipal wastewater in Latvia has been lacking.
In this study, we characterized the microbial community and resistome signatures in WW from 15 Latvian municipalities using short-read metagenomic sequencing of untreated samples. We created taxonomic profiling and reconstructed metagenomic assemblies to assess the distribution and diversity of ARGs. City WW systems with their continuous inflow of organic matter, constant temperature, and high microbial density constitute biologically active environments that support robust, relatively stable microbial communities. We expect that the stability and mixing inherent to municipal WW environments will facilitate the persistence and dissemination of ARGs, with distinctive resistome profiles emerging in cities with substantial hospital or industrial contributions.
2. Materials and Methods
Sample Collection
Untreated WW samples were collected from 15 municipalities in Latvia (Figure 1) between August and November 2020. Sampling was conducted once a week for three weeks at each site, resulting in a total of 45 samples. A portable autosampler (Hach Sigma SD900, USA) operating in time-dependent mode (300 mL/h) was used to collect 24-hour composite raw WW samples (7.2 L) at the inlet of the WW treatment plant (WWTP). Samples were immediately transferred to the laboratory, stored at 4 oC, and further processed within 24 hours.
Municipalities were classified based on population size connected to WW systems (Table 1) and the presence and type of healthcare institutions (level 0 to 4 hospitals, including specialized facilities, Red Cross hospitals, and branch institutions) according to the Latvian National Health Service classification [27].
The industrial WW impact was classified as the percentage of industrial WW in the total WW flow reported from each city. The categories were defined as:
- High: ≥30%
- Medium: 15-29.9%
- Low: 1-14.9%
- None: 0%
- Seasonal: Applied to cities with significant seasonal variations.
To evaluate the impact of the food industry while accounting for city size, we created a weighted Food Industry Impact Index (FIII). First, the proportional volume of food industry wastewater was calculated:
To balance the relative impact between large and small cities, a weighting factor (WF) was calculated:
The WF decreases as the total WW volume increases, ensuring that smaller cities receive proportionally more weight. The final FIII was calculated as follows:
allowing for comparison across cities of varying sizes. This combines the food industry’s contribution with the WF to balance the influence of city size. The resulting categories were:
- High Impact: FIII > 0.3
- Medium Impact: 0.1 ≤ FIII ≤ 0.3
- Low Impact: 0 < FIII < 0.1
- None: FIII = 0
- Seasonal: Cities with seasonal variations (e.g., Jūrmala).
- NA: For cities with missing or incomplete data.
Additional binary classifications (presence/absence) were established for specific industrial sectors present in municipality: food processing, dairy production, meat production, metal processing, and automotive washing facilities connected to municipal WW systems.
DNA Extraction and Metagenomic Sequencing
Microbial DNA was isolated from concentrated WW using the FastDNA SPIN Kit for Soil (MP Biomedicals, USA) according to the manufacturer’s guidelines. DNA was normalized to 500 ng and sheared using a Covaris S220 Focused-ultrasonicator (Covaris, USA) to achieve an average fragment size of 400 bp. Libraries were constructed using MGIEasy Universal DNA Library Prep Set V1.0 (MGI Tech Co., China). Quality control was performed using the Qubit High Sensitivity dsDNA assay kit on a Qubit 2.0 instrument and using the Agilent High Sensitivity DNA kit on an Agilent 2100 Bioanalyzer (Agilent Technologies, USA). Sequencing was performed on a DNBSEQ-G400 sequencer using DNBSEQ-G400RS High-Throughput Sequencing Set (MGI Tech Co., China) according to the manufacturer's guidelines to a depth of at least 20 million paired-end reads (150 bp) per sample.
Metagenomic Data Analysis
Quality trimming of the obtained raw paired-end reads was performed by Trimmomatic v.0.39 [28] (parameters: LEADING:Q30, TRAILING:Q30, MINLEN:36). Human host sequences were removed by mapping against the hg19 reference genome using Bowtie2 v.2.4.2 [29]. Unmapped read pairs were extracted using SAMtools v1.9 [30] and then divided into paired-end read files by bedtools2 v.2.18 [31]. Taxonomic profiling was performed using Kraken2 [32] with the RefSeq release 98, and taxonomic agglomeration was performed using the kraken-biom package [33].
Metagenome-Assembled Genome and Mobile Genetic Element reconstruction
Metagenome assembled genome (MAG) and mobile genetic element (MGE) reconstruction was done using EBI assembly, binning and annotation pipelines. De novo assembled contigs were generated with the miassembler pipeline v1.0.0 [36], which orchestrates read quality control (fastp v0.23.4 [37]), decontamination of human and PhiX sequences using BWA-MEM2 v2.2.1 [38], and metagenomic assembly with MEGAHIT [39] assemblers. Assembly quality and coverage statistics were generated using QUAST [40], SeqKit [41], MultiQC [42], and jgi_summarize_bam_contig_depths scripts [43]. QC-filtered and assembled contigs were then used as primary input for binning, genome annotation, and mobile genetic element reconstruction.
MAG reconstruction was done using the genomes-generation pipeline v1.1.0 [44]. The assembly-derived contigs were then binned using three complementary algorithms: MetaBAT2 v2.15 [45], MaxBin2 v2.2.7 [46], and CONCOCT v1.1.0. Resulting bins were refined using the mgbinrefinder subworkflow. Bin quality and taxonomic assessment included CAT [47], GUNC v4 [48], CheckM2 v1.0.1 [49], and dereplication with dRep v3.2.2 [50]. Bins were further evaluated for rRNA and tRNA content using cmsearch v1.1.4 [51] and assigned taxonomy using GTDB-Tk v2.2.6 [52,53]. High-quality MAGs were defined as those meeting thresholds of > 90% completeness and < 5% contamination.
Mobile genetic element identification was performed with the EBI mobilome-annotation pipeline v2.0.2 [54]. This pipeline integrates several specialized tools for comprehensive MGE annotation, including AMRFinderPlus v3.11.4 [55](database version 2023-02-23.1), Diamond v2.0.12 [56], geNomad v1.11.1 [57], ICEfinder v1.0 [58], IntegronFinder2 v2.0.6 [59], ISEScan v1.7.3 [60], MobileOG-DB Beatrix 1.6 v1 [61], PROKKA v1.14.6 [62], and VIRify v3.0.0 [63]. Plasmids were validated using PlasFlow v1.1.0 [64] and PlasmidFinder v2.1.6 [65,66].
Detection of ARGs
ARGs from de novo metagenome contigs generated by IDBA-UD were identified using RGI version 6.0.3 against Comprehensive Antibiotic Resistance Database (CARD) release 2023-10-02 [67], restricting analysis to high-confidence hits (Best_Identity > 90%). For MGEs and MAGs, nf-funcscan version 2.0.0 [68] annotated ARGs and associated functional genes from assembled contigs, with a 90% sequence identity threshold. Quality-controlled reads were mapped using BWA-MEM2 v2.2.1, and ARG coverage was determined by HTSeq-count v.2.0.3 [69] in union mode.
Normalization and Statistical Analysis
Statistical analysis was conducted in R version 4.4.0 [70] using the phyloseq package version 1.48.0 [71] to process ARG and taxonomic abundance data. Initially, the distribution of reconstructed taxa and ARG counts per sample was assessed to identify and remove outliers. The sequencing depth differences between samples were evaluated, confirming that the maximum variation did not exceed ten-fold. To assess how sequencing depth might influence the detection and recall of ARGs, rarefaction curves were generated using the rarecurve() function from the vegan package version 2.7-1 [72].
Alpha diversity metrics (Shannon, Inverse Simpson) were calculated with estimate_richness() function from the phyloseq package using unnormalized and unfiltered ARG counts. This approach preserves rare features such as singletons and doubletons as recommended by phyloseq tutorials [73]. Differences between groups were statistically evaluated using the Kruskal-Wallis rank sum test for multi-level factors and the Wilcoxon rank-sum test for binary comparisons from R package stats v.4.4.2. Post-hoc pairwise comparisons for significant Kruskal-Wallis results were performed with Dunn’s test applying Benjamini-Hochberg correction to control false discovery rate.
For beta diversity, singleton ARGs were removed to reduce noise, and counts were normalized using Cumulative Sum Scaling (CSS) using the normalize function in the microbiomeMarker package version 1.10.0 [74] to correct for differences in sequencing depth and compositional effects across samples. Non-rarefied, CSS-normalized count data were used for ordination and statistical testing to preserve the integrity of the relative abundance information. Ordination was visualized using Non-metric Multidimensional Scaling (NMDS) based on Bray-Curtis dissimilarity. Differences in community structure were tested using PERMANOVA with the adonis2 function from the vegan package. Multivariate homogeneity of group dispersions, a prerequisite for valid PERMANOVA interpretation, was confirmed using the betadisper function from the same package.
For the identification of differentially abundant ARGs associated with environmental or categorical variables, the SIAMCAT [75] framework was utilized. Analysis was performed on total sum scaled normalized data derived from the phyloseq object. This method enables robust supervised machine learning and statistical association testing tailored for microbiome compositional datasets.
Core Elements
Core microbiome membership was determined using the Microbiome Analytics R package [76]. Taxa or genes were considered part of the core microbiome if they were consistently detected in at least 70% of samples (prevalence threshold), with a minimum relative abundance of 0.1% for taxonomic features. For ARGs, core status required detection of more than one gene copy per sample. This framework integrates both abundance and occupancy (prevalence) data, following established methods for ecological synthesis of microbiome data [77].
3. Results
The wastewater samples yielded high-quality sequencing data that facilitated a robust de novo metagenome assembly suitable for ARG identification. Sequencing produced an average depth of 23 million 150-bp paired-end reads per sample, with a final retention rate of 99.97% after quality trimming and host sequence removal (Supplementary materials sequencing_reads_par_sample.tsv). Input sequences generated over 3 million contigs longer than 1,000 bp, characterized by an N50 of 1,426 bp and an average length of 2,397 bp. The assembly demonstrated significant continuity, producing 62,572 scaffolds longer than 10,000 bp and a maximum contig length of 956,861 bp, with an average duplication ratio of 1.24 (Supplementary materials Assembly_stats.csv). These quality metrics indicate the successful reconstruction of microbial scaffolds, ensuring a solid foundation for the subsequent metagenomic analysis.
Microbial Community Composition and Clinical Relevance
Taxonomy profiles consisted of 6,837 distinct bacterial operational taxonomic units (OTUs), accounting for 87% (328,643,695 reads) of all reads used in reconstruction (supplementary materials taxonomy_species.xlsx). Taxonomic classification revealed 1,389 genera and 5,997 species, with 52.7% of quality-filtered reads identified to the species level. However, two samples required exclusion: Salaspils.2, which possessed adequate depth but unrepresentative classification rates affecting species detection, and Talsi.3, which was compromised by dairy wastewater discharge causing an abnormal Lactobacillus helveticus spike (Figure 2). Following the removal of outliers and singletons, a robust dataset of 6,798 OTUs and 361,540,544 sequences was retained.
The municipal wastewater microbiome is characterized by a stable core of anthropogenic-associated genera, although some municipalities displayed distinct taxonomic profiles driven by local activities. The community was dominated by Arcobacter (22.25% ± 6.72%), Bacteroides (6.48% ± 2.57%), Acinetobacter (6.09% ± 2.98%), and Aeromonas (5.52% ± 1.82%), with Arcobacter cryaerophilus (15.36% ± 9.60%) identified as the most abundant species overall (Figure 3). Deviations from this core were observed in Valmiera, where Cloacibacterium normanense (14.74% ± 5.89%) replaced Arcobacter as the dominant species, and in Madona, which exhibited elevated levels of Streptococcus (5.78% vs. mean 0.69%) and Cloacibacterium. Additionally, Lactococcus raffinolactis showed increased abundance in Smiltene (4.42%), Tukums (5.23%), and Talsi (7.09%) compared to other cities. While the high prevalence of Arcobacter reflects the general anthropogenic nature of the environment, the dominance of unique taxa like Cloacibacterium in Valmiera highlights how specific local industrial or environmental factors shape city-specific microbial fingerprints.
Within 78. Genera recognized as multidrug-resistant ESKAPE pathogens, including Klebsiella (0.69% ± 0.93%), Citrobacter (0.58% ± 0.78%), Pseudomonas (3.55% ± 1.31%), and Staphylococcus aureus (0.006%), were observed across all samples (Table 2). Specific clinical correlations appeared in hospital-hosting cities (Tukums, Cesis, and Jelgava), where bacteria from the genus Raoultella (0.41% ± 0.89%) were detected, alongside increased Klebsiella abundance in Cesis (0.70%). High-virulence species such as Acinetobacter baumannii (0.15% ± 0.086%) and Pseudomonas aeruginosa (0.19% ± 0.07%) were also consistently identified. Presence of specific genera and hospital locations indicates that city-specific factors, such as medical effluent, directly influence the diversity of high-risk pathogens entering the wastewater system.
Geographic location was found as the primary driver of microbial community structure, creating statistically significant variations in both species richness and composition among municipalities (Figure 4). Alpha diversity metrics showed variance, with the Shannon index (Kruskal-Wallis χ2 = 29.15, p = 0.01) and Inverse Simpson index (χ2 = 34.69, p = 0.002) revealing significant differences in evenness. Post-hoc testing distinguished Jelgava, Saldus, and Sigulda from other municipalities, with specific pairwise differences noted between Jelgava and Talsi (p = 0.028) and Dobele and Sigulda (p = 0.038). Beta diversity analysis further confirmed spatial clustering, as PERMANOVA indicated that municipality location explained approximately 83% of the total variation (p = 0.001). The stability of these clusters, confirmed by low intragroup variability (Beta dispersion F = 0.60, p = 0.84), demonstrates that local urban infrastructure generates persistent profiles rather than random community fluctuations.
Environmental Resistome Profile
The metagenomic analysis identified a diverse array of ARGs, dominated by tetracycline resistance determinants but also containing critical last-resort mechanisms. A total of 417 distinct ARGs belonging to 108 gene families and conferring resistance to 29 distinct drug classes were identified. The most abundant ARG in resistome was tetracycline resistance, with the ribosomal protection gene tet(Q) being the single most abundant ARG across all samples (11.22% ± 2.79%). Beyond tetracyclines, the most frequently observed resistance determinants included macrolide resistance genes (ErmB 4.71% ± 1.97%, msrE 4.47% ± 1.99%), sulfonamide resistance genes (Sul1 3.58% ± 1.29%), and beta-lactamases (CfxA6 2.88% ± 0.88%). Functional annotation revealed that the resistance mechanisms were primarily dominated by major facilitator superfamily antibiotic efflux pumps, ribosomal protection proteins, RND efflux systems, and OXA-type beta-lactamases. We detected a low but widespread distribution of mobilized colistin resistance MCR phosphoethanolamine transferase genes in Jelgava, Cesis, Smiltene, and Madona, with relative abundances ranging from 0.64% to 3.16% in specific samples (Full supplementary table at output_drugClasses.xlsx).
Figure 5.
Top 10 ARGs and Resistance gene groups. Relative abundance of reads found in contigs.
Similar to the bacterial community, municipal identity was the primary determinant of the resistome, explaining the majority of the variation in ARG composition. Alpha diversity analysis suggested that while the diversity of ARGs varied significantly by location (Shannon χ2 = 28.42,p = 0.013), the relative abundance patterns of dominant ARGs remained consistent (Inverse Simpson p=0.15) (Figure 6). Post-hoc Dunn's test revealed significant differences between municipality pairs, with Jurmala and Kuldiga both showing statistically significant differences to Sigulda (p = 0.024 and p = 0.030, respectively) and Valmiera (p = 0.023 and p = 0.043, respectively). Municipality location accounted for 65.87% of the variation in ARG communities (PERMANOVA R2 = 0.66, p = 0.001), while we could not prove that population size served as a significant factor (Figure 6).
Association testing with SIAMCAT identified statistically significant (p adjusted < 0.05) city-specific ARG profiles:
- Cesis showed differential abundance of both efflux and aminoglycoside resistance genes (aadA6/aadA10, oqxA), Mycobacterium tuberculosis rpsL mutations, and Klebsiella pneumoniae variants (KpnE, OmpK37, acrA),
- Tukums exhibited elevated oqxB, Klebsiella pneumoniae KpnF, APH(3)-IIIa, SAT-4, FOX-5, LCR-1, ramA, and QnrD1,
- Talsi's profile contained FOX-2 and QnrD1,
- Smiltene features tet(B) with its regulator tetR.
- Sigulda uniquely demonstrated IMP-13 metallo-β-lactamase,
- Saldus aadA15, and Salaspils OXA-140 carbapenemase.
- Kuldiga displayed the broadest spectrum including AAC(6)-Ib7, aadA4, OXA-368, APH(3)-Ia, FOX-5, GES-7, MOX-3, dfrB3, and the bifunctional AAC(6)-Ie-APH(2)-Ia.
- Jurmala contained RSA1-1 and YajC, whereas Dobele showed tet(H), Erm(35), tet(T), catB8, and floR.
Hospital Impact on Wastewater Resistance Genes
To assess healthcare contributions to municipal antimicrobial resistance, we first examined the impact of major regional hospitals on ARG diversity in WW systems. Contrary to expectations, municipalities with and without regional hospitals showed no significant differences in ARG or bacterial diversity (Wilcoxon p > 0.05). This result led us to investigate a more nuanced classification of healthcare institutions, as most municipalities contained smaller healthcare facilities that might contribute to AMR pollution through indirect pathways. Analysis by healthcare institution type revealed significant differences in alpha diversity of WW resistomes. While bacterial diversity was different in both evenness and richness, ARGs was only significantly different in evenness. Hospital classification (e.g.,: specialized facilities, Type 2-4 hospitals, Red Cross hospitals, and branch institutions) explained substantial variation in ARG community composition (PERMANOVA R² = 0.364, F = 2.86, p < 0.001). This suggests that healthcare facility specialization and operational scope, rather than mere presence, determines AMR contributions to municipal WW.
Post-hoc analysis identified distinct resistome signatures among hospital types. Type 3 hospitals (medium-complexity facilities) showed the strongest differentiation from specialized hospitals in ARG diversity (Dunn's z = 3.14, p = 0.024), with additional significant differences from Type 4 hospitals (z = 2.69, p = 0.049) and Red Cross facilities (z = 2.51, p = 0.042). Similar patterns emerged for bacterial community diversity, with specialized hospitals consistently differing from branch facilities (z = -3.10, p = 0.027) and other hospital types.
The Hospital-Associated Core Resistome
To understand differences in gene profiles between hospital-associated and non-hospital municipal WW systems we did microbiome comparison between these gene and taxa sets. Out of the 6,798 bacterial taxa identified across all samples, 658 constituted the global core microbiome, with 621 taxa shared between hospital and non-hospital sites. However, 73 core taxa were unique to hospital-influenced WW, compared to only 18 unique to non-hospital municipalities, indicating enrichment of specific bacterial populations in healthcare settings. Similarly, among the 456 ARGs detected, 53 formed the core resistome, with 42 genes shared across both environments. Notably, hospital WW harbored 19 unique core ARGs versus only 6 in non-hospital sites, demonstrating a substantially enriched resistance gene repertoire in healthcare-associated effluents.
While the general core resistome (shared genes) was large, cities with hospital wastewaters contained 19 unique core ARGs, compared to only 6 unique genes in non-hospital sites. This hospital-specific core consisted of high-priority, clinically relevant resistance mechanisms, including:
- Beta-lactamases: OXA-type genes (OXA-205, OXA-20) and carbapenem-hydrolyzing enzymes (CblA-1),
- Aminoglycoside resistance: Multiple modifying enzymes (ANT(6)-Ia, ANT(2'')-Ia, AAC(6')-Ib9),
- Fluoroquinolone resistance: Plasmid-mediated determinants (QnrS2) and efflux pumps (AcrF, acrB),
- Macrolide and Trimethoprim resistance: EreA2, mel, dfrA14, and dfrF.
Associations analysis (SIAMCAT p < 0.05) further linked specific hospital types to distinct genes in comparison to rest of the group:
- Type 2 hospitals with the following ARGs: oqxB, APH(3)-IIIa, FOX-5, Klebsiella pneumoniae KpnF, QnrD1, and ramA regulatory genes,
- Red Cross hospitals showed enrichment of tet(B) and tetR genes,
- specialized hospitals with: IMP-13, and type 3 hospitals with: fluoroquinolone resistance in A. baumannii.
This hospital-unique ARG profile represents high-priority resistance mechanisms commonly associated with healthcare-associated infections and multidrug-resistant pathogens, highlighting hospitals as concentrated sources of clinically relevant antimicrobial resistance in municipal WW networks.
Industrial Factors Shape Resistance Gene Composition
Among industrial factors, the food industry emerged as the strongest differentiator of wastewater composition between samples, significantly impacting both bacterial taxonomy (R2 = 0.169, p = 0.024) and ARG profiles (R2 = 0.168, p = 0.01). Industrial wastewater discharge overall was a significant indicator of group differences, with the food industry sector contributing most substantially to this variation. Other sectors, including metal processing and meat production, showed no significant impact on the resistome profile between groups. The only metric that significantly impacted resistance gene alpha diversity of the sample was car washing facilities.
The direct impact of food production was clearly demonstrated in the municipality of Talsi. During the sampling period, a specific industrial discharge event from a dairy production facility was captured. This event caused a massive spike in Lactobacillus helveticus relative abundance (making the sample an outlier for general analysis). Given the extreme deviation caused by this event, sample Talsi.3 was identified as a statistical outlier. It was excluded from the general beta-diversity and correlation analyses to prevent the skewing of global municipal trends. However, rather than discarding the data point entirely, it was retained for this specific case to investigate the direct impact of industrial discharge on the resistome. Crucially, this taxonomic shift was accompanied by a unique resistance signature: the appearance of Propionibacterium 23S rRNA mutations conferring macrolide resistance. This provides direct evidence that specific industrial discharges can introduce niche-specific resistance determinants into the municipal wastewater system linked to the dairy industry.
ARG Occurrence in Plasmids and MAGs
Analysis of the mobilome revealed a substantial reservoir of horizontal transfer elements, with 9,501 plasmid sequences identified across Latvian municipal wastewater. These plasmids contained 85 unique ARGs with high sequence identity (>90%). The funcscan results combined overlapping findings from multiple tools: deeparg (236 gene locations), RGI (160 gene locations), AMRfinderplus (158 gene locations), and abricate (156 gene locations) (see Figure 7).
The plasmid-associated resistome contigs consisted of multidrug resistance genes (88 occurrences) and clinically critical resistance classes, including aminoglycosides (125 counts) and tetracyclines (245 combined counts) (supplementary tables plasmid_genes.xlsx and plasmids_funcscan.gtf). Crucially, last-resort colistin resistance determinants mcr-10.1 and mcr-9.1 were identified within reconstructed plasmid sequences, indicating that these high-risk genes are circulating via mobile elements.
To determine the chromosomal and genomic context of these resistance markers, we reconstructed 210 dereplicated Metagenome-Assembled Genomes (MAGs). Among the reconstructed MAGs, we found that 37 of 210 dereplicated genomes (17.6%) contained ARGs. In total, the 210 reconstructed bins belonged to 151 taxa according to the GTDB database or 139 taxa based on NCBI majority vote classification (Supplementary materials MAGS_taxonomy.tsv and hamronization_MAGs_report.tsv). Notably, resistance genes were concentrated within genera comprising opportunistic pathogens frequently associated with healthcare-associated infections, including Pseudomonas, Acinetobacter, Klebsiella, Citrobacter, Aeromonas, Enterococcus, Streptococcus, and Clostridium.
The same gene in plasmids and genomes were detected. We identified 41 ARGs present in both MAGs and plasmids, indicating bacteria and plasmids carrying identical resistance genes. Of these shared genes, 20 were annotated as multidrug resistant, followed by six beta-lactam resistance genes, five tetracycline resistance genes, six macrolide resistance genes, and three MLS-class resistance genes. This co-occurrence of clinically important ARGs highlights bacteria active in potential horizontal transfer, as multidrug and clinically critical resistance determinants are readily mobilized.
4. Discussion
This metagenomic analysis of 15 Latvian municipalities demonstrates that urban WW systems function as geographically differentiated reservoirs of antimicrobial resistance. Our results indicate that municipal identity is the primary driver of resistome composition, explaining 65.87% of variation in ARG composition. We implemented WW-based surveillance at an epidemiologically relevant scale between local clinical patterns and global environmental reservoirs. These results align with emerging evidence for geographic structuring of global resistomes [11,79], yet our findings reveal that these distinctions persist even at the local municipal scale. Overall, municipalities as a factor demonstrated significant differences in both bacterial community composition and ARG profiles. There was observed divergence between resistome richness and evenness. While local conditions influenced the presence of rare ARGs (significant Shannon diversity variation), the relative abundance of dominant resistance determinants remained stable across municipalities. This stability suggests that urban WW systems function as selective ecosystems where "core" resistance genes persist despite fluctuations in the underlying bacterial community caused by local environmental factors.
The influence of healthcare on the resistome was defined not by the mere presence of a hospital, but by the institution's specialization and operational scope. While the presence of a regional hospital alone did not significantly alter the resistome, the classification of hospital type explained substantial variation (R2 = 0.364, p < 0.001), with specialized facilities contributing unique high-risk markers like IMP-13 carbapenemases. This suggests that specific medical activities drive the release of last-resort resistance genes. Furthermore, the general resistome profile reflected national antibiotic consumption patterns; the dominance of tet(Q) (11.22% ± 2.79%) aligns with European Medicines Agency reports identifying tetracyclines as the highest-sold antimicrobials in Latvia [80]. Additionally, the widespread detection of mcr phosphoethanolamine transferase genes in cities like Jelgava and Cesis indicates the circulation of plasmid-mediated colistin resistance, highlighting the utility of wastewater surveillance in tracking the environmental dissemination of restricted antibiotics.
Food production WW emerged as the strongest industrial driver of both bacterial taxonomy (R² = 0.168, p = 0.024) and ARG profiles (R² = 0.168, p = 0.01), with the Talsi dairy discharge event providing compelling evidence for industry-specific surveillance. The unique detection of Propionibacterium freudenreichii and associated macrolide resistance genes exclusively in Talsi samples, alongside elevated Lactobacillus abundance, demonstrates direct traceability between industrial discharges and municipal resistome alterations. These findings position food processing facilities as contributors to urban AMR reservoirs.
A key finding of this study is that ARG profiles displayed higher similarity across sites than bacterial communities, suggesting that resistance genes are shared from specific taxonomic hosts. We reconstructed a vast mobile reservoir comprising 9,501 plasmid sequences and 710 ARG locations, with 44 resistance genes occurring in both plasmids and chromosomal MAGs. This mobilization was evident in the prevalence of multidrug-resistant opportunistic pathogens, such as Acinetobacter, Pseudomonas, and Arcobacter, which are capable of thriving in environmental, wastewater, and clinical contexts [81]. The occurrence of same resistance genes in both mobile elements and bacterial genomes supports the hypothesis that municipal wastewater systems serve as active evolutionary hubs, facilitating the rapid spread of diverse resistance strategies from efflux pumps to fluoroquinolone determinants across bacterial populations.
Although with our analyses we were able to detect clinically relevant bacteria and resistance genes, the pathways between these elements remains unclear. First, the origin of detected ARGs remains obscure and it is not clear whether detected levels and repertoire are typical for the studied environment and how much are they directly influenced by studied factors, and whether the studied industries are the source of these genes. The main limitation of this comparison is sample size in factor groups and repeats for each city. Based on current analysis it is hard to make concrete statements about influence of a factor, since new samples could drastically change the results of statistical analysis. Other longitudinal studies have shown that seasonal climatic changes can significantly alter wastewater microbiomes [23]. Longer sampling periods would allow us to differentiate if the same factors are consistent throughout the year. In addition, the whole metagenome sequencing based ARG study approaches are strongly dependent on available databases and the majority of these, like CARD, are strongly biased toward culturable bacteria with clinical relevance. As it was seen with FuncScan pipeline different resistance gene detection tools do not produce the same results. Metagenomic assembly is still one of the bottlenecks in identification of mobile genetic elements [82], which is why it is hard to establish the pattern in resistance gene transfer between bacteria.
5. Conclusions
This metagenomic analysis revealed that municipal WW systems have unique microbiome signatures shaping the ARG repertoire. We found that microbial composition is more influenced than ARG composition by different factors, which shows that resistance genes are linked to community not to specific taxonomies. While population density demonstrated only marginal effect, we did not detect a significant correlation between ARG distribution and the presence of regional hospitals. These results set a baseline for the resistance and microbial background found in WW for this region. This study provides valuable insights into region-specific ARG diversity, yet several questions remain unanswered regarding the underlying mechanisms that are driving these differences. The dominance of certain bacterial species and ARGs requires further investigation to understand their selective advantages.
While our metagenomic approach generated comprehensive data on ARG repertoire, more detailed methods are needed to fully discover these complex relationships. Further research should focus on longitudinal studies across different geographical locations and temporal scales to better understand the dynamics of ARG distribution and validate the influence of the factors that were identified in this study. Such extended investigations would help to establish whether these patterns are consistent across different urban environments and seasons in Latvia, ultimately contributing to our understanding on evolution of antibiotic resistance and its spread in diverse environments.
Supplementary Materials
The following supporting information can be downloaded at the website of this paper posted on Preprints.org, Table S1: sequencing_reads_par_sample.tsv; Table S2: Assembly_stats.csv; Table S3: taxonomy_species.xlsx; Table S4: output_drugClasses.xlsx; Table S5: plasmid_genes.xlsx; Table S6: plasmids_funcascan.gtf; Table S7: MAGS_taxonomy.tsv; Table S8: hamronization_MAGs_report.tsv.
Author Contributions
Conceptualization, D.F, D.G, V.B, A.B, U.G, and T.H.; methodology, M.U., D.G, A.R, I.K., B.D., S.D., M.S., L.E.R. and J.K.; software, E.L., D.G. and M.U., .; validation, E.L., M.U., B.D., S.D., and D.G.; formal analysis, E.L.; investigation, E.L.; data curation, E.L.; writing—original draft preparation, E.L. and M.U.; writing—review and editing, D.F, D.G., J.K., S.D., B.D.; visualization, E.L. and M.U.; supervision, D.F.; project administration, D.F.; funding acquisition, D.F., V.B., A.B., U.D., T.J. All authors have read and agreed to the published version of the manuscript.
Funding
This research was funded by the Latvian Council of Science, project No. VPP-COVID-2020/1-0008: “Multidisciplinary approach to monitor, control and confine the COVID-19 and other future epidemics in Latvia”. E.L was funded by project No.5.2.1.1.i.0/2/24/I/CFLA/001 "Consolidation of the Latvian Institute of Organic Synthesis and the Latvian Biomedical Research and Study Centre".
Institutional Review Board Statement
Not applicable.
Informed Consent Statement
Not applicable.
Data Availability Statement
The Whole Metagenome Shotgun Sequencing Data is available in the ENA repository and can be accessed via the following DOI: https://identifiers.org/ena.embl/PRJEB79273. The Metagenome Assembled Genome (MAG) Assemblies are also stored in the ENA repository and can be accessed using the DOI: https://identifiers.org/ena.embl/PRJEB80484. Supplementary materials are available under Zenodo DOI accession 10.5281/zenodo.17912239. A full record of all statistical analysis is included as Additional file (Publication_ARG.pdf, Publication_tax.pdf and Publication_mobilome.pdf), and were created using the knitr package in R. R analysis scripts are available in GitHub (https://github.com/EdgarsLiepa/wastewater_LV). Taxonomic Classification Data is available in the supplementary information, specifically in the file waste_water.biome. AMR Classification Data is available in the supplementary information, specifically in the file AMR_genes_RGI_scaffolds_filtered.csv, hamronization_MAGs_report.tsv and hamronization_combined_report_fixed_names.tsv. Metadata is available in the supplementary information, specifically in the file sampleMetadata.csv.
Acknowledgments
We thank the High Performance Computing Center at Riga Technical University for providing computational resources and the Microbiome Informatics group at EMBL-EBI that provided training and computational resources for data analysis. In addition, we thank Latvian Water and Wastewater Works Association for supporting the sampling and access to wastewater plants.
Conflicts of Interest
The authors declare no conflicts of interest.
Abbreviations
The following abbreviations are used in this manuscript:
| ARG | Antimicrobial resistance genes |
| AMR | Antimicrobial resistance |
| CARD | Comprehensive Antibiotic Resistance Database |
| CSS | Cumulative Sum Scaling |
| EMBL-EBI | European Bioinformatics Institute |
| FIII | Food Industry Impact Index |
| HGT | Horizontal gene transfer |
| NMDS | Non-metric Multidimensional Scaling |
| NGS | Next generation sequencing |
| MAGs | Metagenome Assembled Genomes |
| OTUs | Operational taxonomic units |
| WBE | WW-based epidemiology |
| WHO | World Health Organization |
| WW | Wastewater |
| WWTP | WW treatment plant |
References
- Ventola, C.L. The Antibiotic Resistance Crisis. Pharm. Ther. 2015, 40, 277–283.
- Naghavi, M.; Vollset, S.E.; Ikuta, K.S.; Swetschinski, L.R.; Gray, A.P.; Wool, E.E.; Robles Aguilar, G.; Mestrovic, T.; Smith, G.; Han, C.; et al. Global Burden of Bacterial Antimicrobial Resistance 1990–2021: A Systematic Analysis with Forecasts to 2050. The Lancet 2024, 404, 1199–1226. [CrossRef]
- Reinholds, I.; Muter, O.; Pugajeva, I.; Rusko, J.; Perkons, I.; Bartkevics, V. Determination of Pharmaceutical Residues and Assessment of Their Removal Efficiency at the Daugavgriva Municipal Wastewater Treatment Plant in Riga, Latvia. Water Sci. Technol. 2016, 75, 387–396. [CrossRef]
- Cabral, J.P.S. Water Microbiology. Bacterial Pathogens and Water. Int. J. Environ. Res. Public. Health 2010, 7, 3657–3703. [CrossRef]
- Varela, A.R.; Manaia, C.M. Human Health Implications of Clinically Relevant Bacteria in Wastewater Habitats. Environ. Sci. Pollut. Res. 2013, 20, 3550–3569. [CrossRef]
- Yadav, B.; Pandey, A.K.; Kumar, L.R.; Kaur, R.; Yellapu, S.K.; Sellamuthu, B.; Tyagi, R.D.; Drogui, P. 1 - Introduction to Wastewater Microbiology: Special Emphasis on Hospital Wastewater. In Current Developments in Biotechnology and Bioengineering; Tyagi, R.D., Sellamuthu, B., Tiwari, B., Yan, S., Drogui, P., Zhang, X., Pandey, A., Eds.; Elsevier, 2020; pp. 1–41 ISBN 978-0-12-819722-6.
- Larsson, D.G.J.; Flach, C.-F. Antibiotic Resistance in the Environment. Nat. Rev. Microbiol. 2022, 20, 257–269. [CrossRef]
- Slizovskiy, I.B.; Mukherjee, K.; Dean, C.J.; Boucher, C.; Noyes, N.R. Mobilization of Antibiotic Resistance: Are Current Approaches for Colocalizing Resistomes and Mobilomes Useful? Front. Microbiol. 2020, 11. [CrossRef]
- Galhano, B.S.P.; Ferrari, R.G.; Panzenhagen, P.; de Jesus, A.C.S.; Conte-Junior, C.A. Antimicrobial Resistance Gene Detection Methods for Bacteria in Animal-Based Foods: A Brief Review of Highlights and Advantages. Microorganisms 2021, 9, 923. [CrossRef]
- Forster, S.C.; Liu, J.; Kumar, N.; Gulliver, E.L.; Gould, J.A.; Escobar-Zepeda, A.; Mkandawire, T.; Pike, L.J.; Shao, Y.; Stares, M.D.; et al. Strain-Level Characterization of Broad Host Range Mobile Genetic Elements Transferring Antibiotic Resistance from the Human Microbiome. Nat. Commun. 2022, 13, 1445. [CrossRef]
- Munk, P.; Brinch, C.; Møller, F.D.; Petersen, T.N.; Hendriksen, R.S.; Seyfarth, A.M.; Kjeldgaard, J.S.; Svendsen, C.A.; van Bunnik, B.; Berglund, F.; et al. Genomic Analysis of Sewage from 101 Countries Reveals Global Landscape of Antimicrobial Resistance. Nat. Commun. 2022, 13, 7251. [CrossRef]
- Bielen, A.; Šimatović, A.; Kosić-Vukšić, J.; Senta, I.; Ahel, M.; Babić, S.; Jurina, T.; González Plaza, J.J.; Milaković, M.; Udiković-Kolić, N. Negative Environmental Impacts of Antibiotic-Contaminated Effluents from Pharmaceutical Industries. Water Res. 2017, 126, 79–87. [CrossRef]
- Oladimeji, T.E.; Oyedemi, M.; Emetere, M.E.; Agboola, O.; Adeoye, J.B.; Odunlami, O.A. Review on the Impact of Heavy Metals from Industrial Wastewater Effluent and Removal Technologies. Heliyon 2024, 10, e40370. [CrossRef]
- Manyi-Loh, C.; Mamphweli, S.; Meyer, E.; Okoh, A. Antibiotic Use in Agriculture and Its Consequential Resistance in Environmental Sources: Potential Public Health Implications. Molecules 2018, 23, 795. [CrossRef]
- Li, X.; Rensing, C.; Vestergaard, G.; Arumugam, M.; Nesme, J.; Gupta, S.; Brejnrod, A.D.; Sørensen, S.J. Metagenomic Evidence for Co-Occurrence of Antibiotic, Biocide and Metal Resistance Genes in Pigs. Environ. Int. 2022, 158, 106899. [CrossRef]
- Garner, E.; Maile-Moskowitz, A.; Angeles, L.F.; Flach, C.-F.; Aga, D.S.; Nambi, I.; Larsson, D.G.J.; Bürgmann, H.; Zhang, T.; Vikesland, P.J.; et al. Metagenomic Profiling of Internationally Sourced Sewage Influents and Effluents Yields Insight into Selecting Targets for Antibiotic Resistance Monitoring. Environ. Sci. Technol. 2024, 58, 16547–16559. [CrossRef]
- Harnisz, M.; Kiedrzyńska, E.; Kiedrzyński, M.; Korzeniewska, E.; Czatzkowska, M.; Koniuszewska, I.; Jóźwik, A.; Szklarek, S.; Niestępski, S.; Zalewski, M. The Impact of WWTP Size and Sampling Season on the Prevalence of Antibiotic Resistance Genes in Wastewater and the River System. Sci. Total Environ. 2020, 741, 140466. [CrossRef]
- Wakelin, S.A.; Colloff, M.J.; Kookana, R.S. Effect of Wastewater Treatment Plant Effluent on Microbial Function and Community Structure in the Sediment of a Freshwater Stream with Variable Seasonal Flow. Appl. Environ. Microbiol. 2008, 74, 2659–2668. [CrossRef]
- Rodriguez-Mozaz, S.; Chamorro, S.; Marti, E.; Huerta, B.; Gros, M.; Sànchez-Melsió, A.; Borrego, C.M.; Barceló, D.; Balcázar, J.L. Occurrence of Antibiotics and Antibiotic Resistance Genes in Hospital and Urban Wastewaters and Their Impact on the Receiving River. Water Res. 2015, 69, 234–242. [CrossRef]
- Chu, B.T.T.; Petrovich, M.L.; Chaudhary, A.; Wright, D.; Murphy, B.; Wells, G.; Poretsky, R. Metagenomics Reveals the Impact of Wastewater Treatment Plants on the Dispersal of Microorganisms and Genes in Aquatic Sediments. Appl. Environ. Microbiol. 2018, 84, e02168-17. [CrossRef]
- Drury, B.; Rosi-Marshall, E.; Kelly, J.J. Wastewater Treatment Effluent Reduces the Abundance and Diversity of Benthic Bacterial Communities in Urban and Suburban Rivers. Appl. Environ. Microbiol. 2013, 79, 1897–1905. [CrossRef]
- Aljeldah, M.M. Antimicrobial Resistance and Its Spread Is a Global Threat. Antibiotics 2022, 11, 1082. [CrossRef]
- Becsei, Á.; Fuschi, A.; Otani, S.; Kant, R.; Weinstein, I.; Alba, P.; Stéger, J.; Visontai, D.; Brinch, C.; de Graaf, M.; et al. Time-Series Sewage Metagenomics Distinguishes Seasonal, Human-Derived and Environmental Microbial Communities Potentially Allowing Source-Attributed Surveillance. Nat. Commun. 2024, 15, 7551. [CrossRef]
- Buriánková, I.; Kuchta, P.; Molíková, A.; Sovová, K.; Výravský, D.; Rulík, M.; Novák, D.; Lochman, J.; Vítězová, M. Antibiotic Resistance in Wastewater and Its Impact on a Receiving River: A Case Study of WWTP Brno-Modřice, Czech Republic. Water 2021, 13, 2309. [CrossRef]
- Markkanen, M.A.; Haukka, K.; Pärnänen, K.M.M.; Dougnon, V.T.; Bonkoungou, I.J.O.; Garba, Z.; Tinto, H.; Sarekoski, A.; Karkman, A.; Kantele, A.; et al. Metagenomic Analysis of the Abundance and Composition of Antibiotic Resistance Genes in Hospital Wastewater in Benin, Burkina Faso, and Finland. mSphere 2023, 8, e00538-22. [CrossRef]
- Gyraitė, G.; Kataržytė, M.; Espinosa, R.P.; Kalvaitienė, G.; Lastauskienė, E. Microbiome and Resistome Studies of the Lithuanian Baltic Sea Coast and the Curonian Lagoon Waters and Sediments. Antibiotics 2024, 13, 1013. [CrossRef]
- Slimnīcas | Nacionālais veselības dienests Available online: https://www.vmnvd.gov.lv/lv/slimnicas-0 (accessed on 4 November 2025).
- Bolger, A.M.; Lohse, M.; Usadel, B. Trimmomatic: A Flexible Trimmer for Illumina Sequence Data. Bioinformatics 2014, 30, 2114–2120. [CrossRef]
- Langmead, B.; Salzberg, S.L. Fast Gapped-Read Alignment with Bowtie 2. Nat. Methods 2012, 9, 357–359. [CrossRef]
- Danecek, P.; Bonfield, J.K.; Liddle, J.; Marshall, J.; Ohan, V.; Pollard, M.O.; Whitwham, A.; Keane, T.; McCarthy, S.A.; Davies, R.M.; et al. Twelve Years of SAMtools and BCFtools. GigaScience 2021, 10, giab008. [CrossRef]
- Quinlan, A.R.; Hall, I.M. BEDTools: A Flexible Suite of Utilities for Comparing Genomic Features. Bioinformatics 2010, 26, 841–842. [CrossRef]
- Wood, D.E.; Lu, J.; Langmead, B. Improved Metagenomic Analysis with Kraken 2. Genome Biol. 2019, 20, 257. [CrossRef]
- Dabdoub, S. Smdabdoub/Kraken-Biom 2025.
- Peng, Y.; Leung, H.C.M.; Yiu, S.M.; Chin, F.Y.L. IDBA-UD: A de Novo Assembler for Single-Cell and Metagenomic Sequencing Data with Highly Uneven Depth. Bioinformatics 2012, 28, 1420–1428. [CrossRef]
- Mikheenko, A.; Saveliev, V.; Gurevich, A. MetaQUAST: Evaluation of Metagenome Assemblies. Bioinformatics 2016, 32, 1088–1090. [CrossRef]
- EBI-Metagenomics/Miassembler 2025.
- Fastp 1.0: An Ultra-fast All-round Tool for FASTQ Data Quality Control and Preprocessing - Chen - 2025 - iMeta - Wiley Online Library Available online: https://onlinelibrary.wiley.com/doi/10.1002/imt2.70078 (accessed on 7 November 2025).
- Vasimuddin, Md.; Misra, S.; Li, H.; Aluru, S. Efficient Architecture-Aware Acceleration of BWA-MEM for Multicore Systems. In Proceedings of the 2019 IEEE International Parallel and Distributed Processing Symposium (IPDPS); May 2019; pp. 314–324.
- Li, D.; Liu, C.-M.; Luo, R.; Sadakane, K.; Lam, T.-W. MEGAHIT: An Ultra-Fast Single-Node Solution for Large and Complex Metagenomics Assembly via Succinct de Bruijn Graph. Bioinformatics 2015, 31, 1674–1676. [CrossRef]
- Mikheenko, A.; Saveliev, V.; Hirsch, P.; Gurevich, A. WebQUAST: Online Evaluation of Genome Assemblies. Nucleic Acids Res. 2023, 51, W601–W606. [CrossRef]
- SeqKit2: A Swiss Army Knife for Sequence and Alignment Processing - Shen - 2024 - iMeta - Wiley Online Library Available online: https://onlinelibrary.wiley.com/doi/10.1002/imt2.191 (accessed on 7 November 2025).
- Ewels, P.; Magnusson, M.; Lundin, S.; Käller, M. MultiQC: Summarize Analysis Results for Multiple Tools and Samples in a Single Report. Bioinformatics 2016, 32, 3047–3048. [CrossRef]
- Kang, D.D.; Froula, J.; Egan, R.; Wang, Z. MetaBAT, an Efficient Tool for Accurately Reconstructing Single Genomes from Complex Microbial Communities. PeerJ 2015, 3, e1165. [CrossRef]
- EBI-Metagenomics/Genomes-Generation 2025.
- Kang, D.D.; Li, F.; Kirton, E.; Thomas, A.; Egan, R.; An, H.; Wang, Z. MetaBAT 2: An Adaptive Binning Algorithm for Robust and Efficient Genome Reconstruction from Metagenome Assemblies. PeerJ 2019, 7, e7359. [CrossRef]
- Wu, Y.-W.; Simmons, B.A.; Singer, S.W. MaxBin 2.0: An Automated Binning Algorithm to Recover Genomes from Multiple Metagenomic Datasets. Bioinformatics 2016, 32, 605–607. [CrossRef]
- von Meijenfeldt, F.A.B.; Arkhipova, K.; Cambuy, D.D.; Coutinho, F.H.; Dutilh, B.E. Robust Taxonomic Classification of Uncharted Microbial Sequences and Bins with CAT and BAT. Genome Biol. 2019, 20, 217. [CrossRef]
- Orakov, A.; Fullam, A.; Coelho, L.P.; Khedkar, S.; Szklarczyk, D.; Mende, D.R.; Schmidt, T.S.B.; Bork, P. GUNC: Detection of Chimerism and Contamination in Prokaryotic Genomes. Genome Biol. 2021, 22, 178. [CrossRef]
- Chklovski, A.; Parks, D.H.; Woodcroft, B.J.; Tyson, G.W. CheckM2: A Rapid, Scalable and Accurate Tool for Assessing Microbial Genome Quality Using Machine Learning. Nat. Methods 2023, 20, 1203–1212. [CrossRef]
- Olm, M.R.; Brown, C.T.; Brooks, B.; Banfield, J.F. dRep: A Tool for Fast and Accurate Genomic Comparisons That Enables Improved Genome Recovery from Metagenomes through de-Replication. ISME J. 2017, 11, 2864–2868. [CrossRef]
- Cui, X.; Lu, Z.; Wang, S.; Jing-Yan Wang, J.; Gao, X. CMsearch: Simultaneous Exploration of Protein Sequence Space and Structure Space Improves Not Only Protein Homology Detection but Also Protein Structure Prediction. Bioinformatics 2016, 32, i332–i340. [CrossRef]
- Chaumeil, P.-A.; Mussig, A.J.; Hugenholtz, P.; Parks, D.H. GTDB-Tk v2: Memory Friendly Classification with the Genome Taxonomy Database. Bioinformatics 2022, 38, 5315–5316. [CrossRef]
- Parks, D.H.; Chuvochina, M.; Chaumeil, P.-A.; Rinke, C.; Mussig, A.J.; Hugenholtz, P. A Complete Domain-to-Species Taxonomy for Bacteria and Archaea. Nat. Biotechnol. 2020, 38, 1079–1086. [CrossRef]
- Release v2.0.2 · EBI-Metagenomics/Mobilome-Annotation-Pipeline Available online: https://github.com/EBI-Metagenomics/mobilome-annotation-pipeline/releases/tag/v2.0.2 (accessed on 7 November 2025).
- Feldgarden, M.; Brover, V.; Gonzalez-Escalona, N.; Frye, J.G.; Haendiges, J.; Haft, D.H.; Hoffmann, M.; Pettengill, J.B.; Prasad, A.B.; Tillman, G.E.; et al. AMRFinderPlus and the Reference Gene Catalog Facilitate Examination of the Genomic Links among Antimicrobial Resistance, Stress Response, and Virulence. Sci. Rep. 2021, 11, 12728. [CrossRef]
- Buchfink, B.; Reuter, K.; Drost, H.-G. Sensitive Protein Alignments at Tree-of-Life Scale Using DIAMOND. Nat. Methods 2021, 18, 366–368. [CrossRef]
- Camargo, A.P.; Roux, S.; Schulz, F.; Babinski, M.; Xu, Y.; Hu, B.; Chain, P.S.G.; Nayfach, S.; Kyrpides, N.C. Identification of Mobile Genetic Elements with geNomad. Nat. Biotechnol. 2024, 42, 1303–1312. [CrossRef]
- Liu, M.; Li, X.; Xie, Y.; Bi, D.; Sun, J.; Li, J.; Tai, C.; Deng, Z.; Ou, H.-Y. ICEberg 2.0: An Updated Database of Bacterial Integrative and Conjugative Elements. Nucleic Acids Res. 2019, 47, D660–D665. [CrossRef]
- Néron, B.; Littner, E.; Haudiquet, M.; Perrin, A.; Cury, J.; Rocha, E. IntegronFinder 2.0: Identification and Analysis of Integrons across Bacteria, with a Focus on Antibiotic Resistance in Klebsiella. Microorganisms 2022, 10, 700. [CrossRef]
- Xie, Z.; Tang, H. ISEScan: Automated Identification of Insertion Sequence Elements in Prokaryotic Genomes. Bioinformatics 2017, 33, 3340–3347. [CrossRef]
- Brown, C.L.; Mullet, J.; Hindi, F.; Stoll, J.E.; Gupta, S.; Choi, M.; Keenum, I.; Vikesland, P.; Pruden, A.; Zhang, L. mobileOG-Db: A Manually Curated Database of Protein Families Mediating the Life Cycle of Bacterial Mobile Genetic Elements. Appl. Environ. Microbiol. 2022, 88, e00991-22. [CrossRef]
- Seemann, T. Prokka: Rapid Prokaryotic Genome Annotation. Bioinformatics 2014, 30, 2068–2069. [CrossRef]
- Rangel-Pineros, G.; Almeida, A.; Beracochea, M.; Sakharova, E.; Marz, M.; Reyes Muñoz, A.; Hölzer, M.; Finn, R.D. VIRify: An Integrated Detection, Annotation and Taxonomic Classification Pipeline Using Virus-Specific Protein Profile Hidden Markov Models. PLOS Comput. Biol. 2023, 19, e1011422. [CrossRef]
- Krawczyk, P.S.; Lipinski, L.; Dziembowski, A. PlasFlow: Predicting Plasmid Sequences in Metagenomic Data Using Genome Signatures. Nucleic Acids Res. 2018, 46, e35. [CrossRef]
- Camacho, C.; Coulouris, G.; Avagyan, V.; Ma, N.; Papadopoulos, J.; Bealer, K.; Madden, T.L. BLAST+: Architecture and Applications. BMC Bioinformatics 2009, 10, 421. [CrossRef]
- Carattoli, A.; Zankari, E.; García-Fernández, A.; Voldby Larsen, M.; Lund, O.; Villa, L.; Møller Aarestrup, F.; Hasman, H. In Silico Detection and Typing of Plasmids Using PlasmidFinder and Plasmid Multilocus Sequence Typing. Antimicrob. Agents Chemother. 2014, 58, 3895–3903. [CrossRef]
- Alcock, B.P.; Huynh, W.; Chalil, R.; Smith, K.W.; Raphenya, A.R.; Wlodarski, M.A.; Edalatmand, A.; Petkau, A.; Syed, S.A.; Tsang, K.K.; et al. CARD 2023: Expanded Curation, Support for Machine Learning, and Resistome Prediction at the Comprehensive Antibiotic Resistance Database. Nucleic Acids Res. 2023, 51, D690–D699. [CrossRef]
- Yates, J.A.F.; Ibrahim, A.; Frangenberg, J.; Perelo, L.; bot, nf-core; Ramji, V.; andreirie; Beber, M.E.; Hörtenhuber, M.; Tavares, H.; et al. Nf-Core/Funcscan: V3.0.0 - French Chocolatine - 2025-10-04 2025.
- Putri, G.H.; Anders, S.; Pyl, P.T.; Pimanda, J.E.; Zanini, F. Analysing High-Throughput Sequencing Data in Python with HTSeq 2.0. Bioinformatics 2022, 38, 2943–2945. [CrossRef]
- R Core Team R: A Language and Environment for Statistical Computing; R Foundation for Statistical Computing: Vienna, Austria;
- McMurdie, P.J.; Holmes, S. Phyloseq: An R Package for Reproducible Interactive Analysis and Graphics of Microbiome Census Data. PLOS ONE 2013, 8, e61217. [CrossRef]
- Oksanen, J.; Simpson, G.L.; Blanchet, F.G.; Kindt, R.; Legendre, P.; Minchin, P.R.; O’Hara, R.B.; Solymos, P.; Stevens, M.H.H.; Szoecs, E.; et al. Vegan: Community Ecology Package 2025.
- Alpha Diversity Graphics 2025.
- Cao, Y.; Dong, Q.; Wang, D.; Zhang, P.; Liu, Y.; Niu, C. microbiomeMarker: An R/Bioconductor Package for Microbiome Marker Identification and Visualization. Bioinformatics 2022, 38, 4027–4029. [CrossRef]
- Wirbel, J.; Zych, K.; Essex, M.; Karcher, N.; Kartal, E.; Salazar, G.; Bork, P.; Sunagawa, S.; Zeller, G. Microbiome Meta-Analysis and Cross-Disease Comparison Enabled by the SIAMCAT Machine Learning Toolbox. Genome Biol. 2021, 22, 93. [CrossRef]
- Lahti, L.; Sudarshan, S. Microbiome R Package 2025.
- Custer, G.F.; Gans, M.; van Diepen, L.T.A.; Dini-Andreote, F.; Buerkle, C.A. Comparative Analysis of Core Microbiome Assignments: Implications for Ecological Synthesis. mSystems 2023, 8, e01066-22. [CrossRef]
- Miller, W.R.; Arias, C.A. ESKAPE Pathogens: Antimicrobial Resistance, Epidemiology, Clinical Impact and Therapeutics. Nat. Rev. Microbiol. 2024, 22, 598–616. [CrossRef]
- Zhu, C.; Wu, L.; Ning, D.; Tian, R.; Gao, S.; Zhang, B.; Zhao, J.; Zhang, Y.; Xiao, N.; Wang, Y.; et al. Global Diversity and Distribution of Antibiotic Resistance Genes in Human Wastewater Treatment Systems. Nat. Commun. 2025, 16, 4006. [CrossRef]
- SALES TRENDS (MG/PCU) OF ANTIMICROBIAL VMPs FOR FOOD-PRODUCING ANIMALS 2010-2020 in Latvia; European Surveillance of Veterinary Antimicrobial Consumption (ESVAC); European Medicines Agency, 2021;
- Varela, A.R.; Manaia, C.M. Human Health Implications of Clinically Relevant Bacteria in Wastewater Habitats. Environ. Sci. Pollut. Res. 2013, 20, 3550–3569. [CrossRef]
- Kerkvliet, J.J.; Bossers, A.; Kers, J.G.; Meneses, R.; Willems, R.; Schürch, A.C. Metagenomic Assembly Is the Main Bottleneck in the Identification of Mobile Genetic Elements. PeerJ 2024, 12, e16695. [CrossRef]
Figure 1.
Sampling locations and size of connected population of the WW system.
Figure 2.
Samples before filtering outliers. (a) Sample size distribution of bacterial reads. The figure shows that one sample is a clear outlier, which comes from Salaspils.2 . (b) Barplot of relative abundance of species among cities, showing that Talsi and Salspils differ in species composition from other repeated samples.
Figure 3.
Relative taxonomic composition at the genus level per municipality.
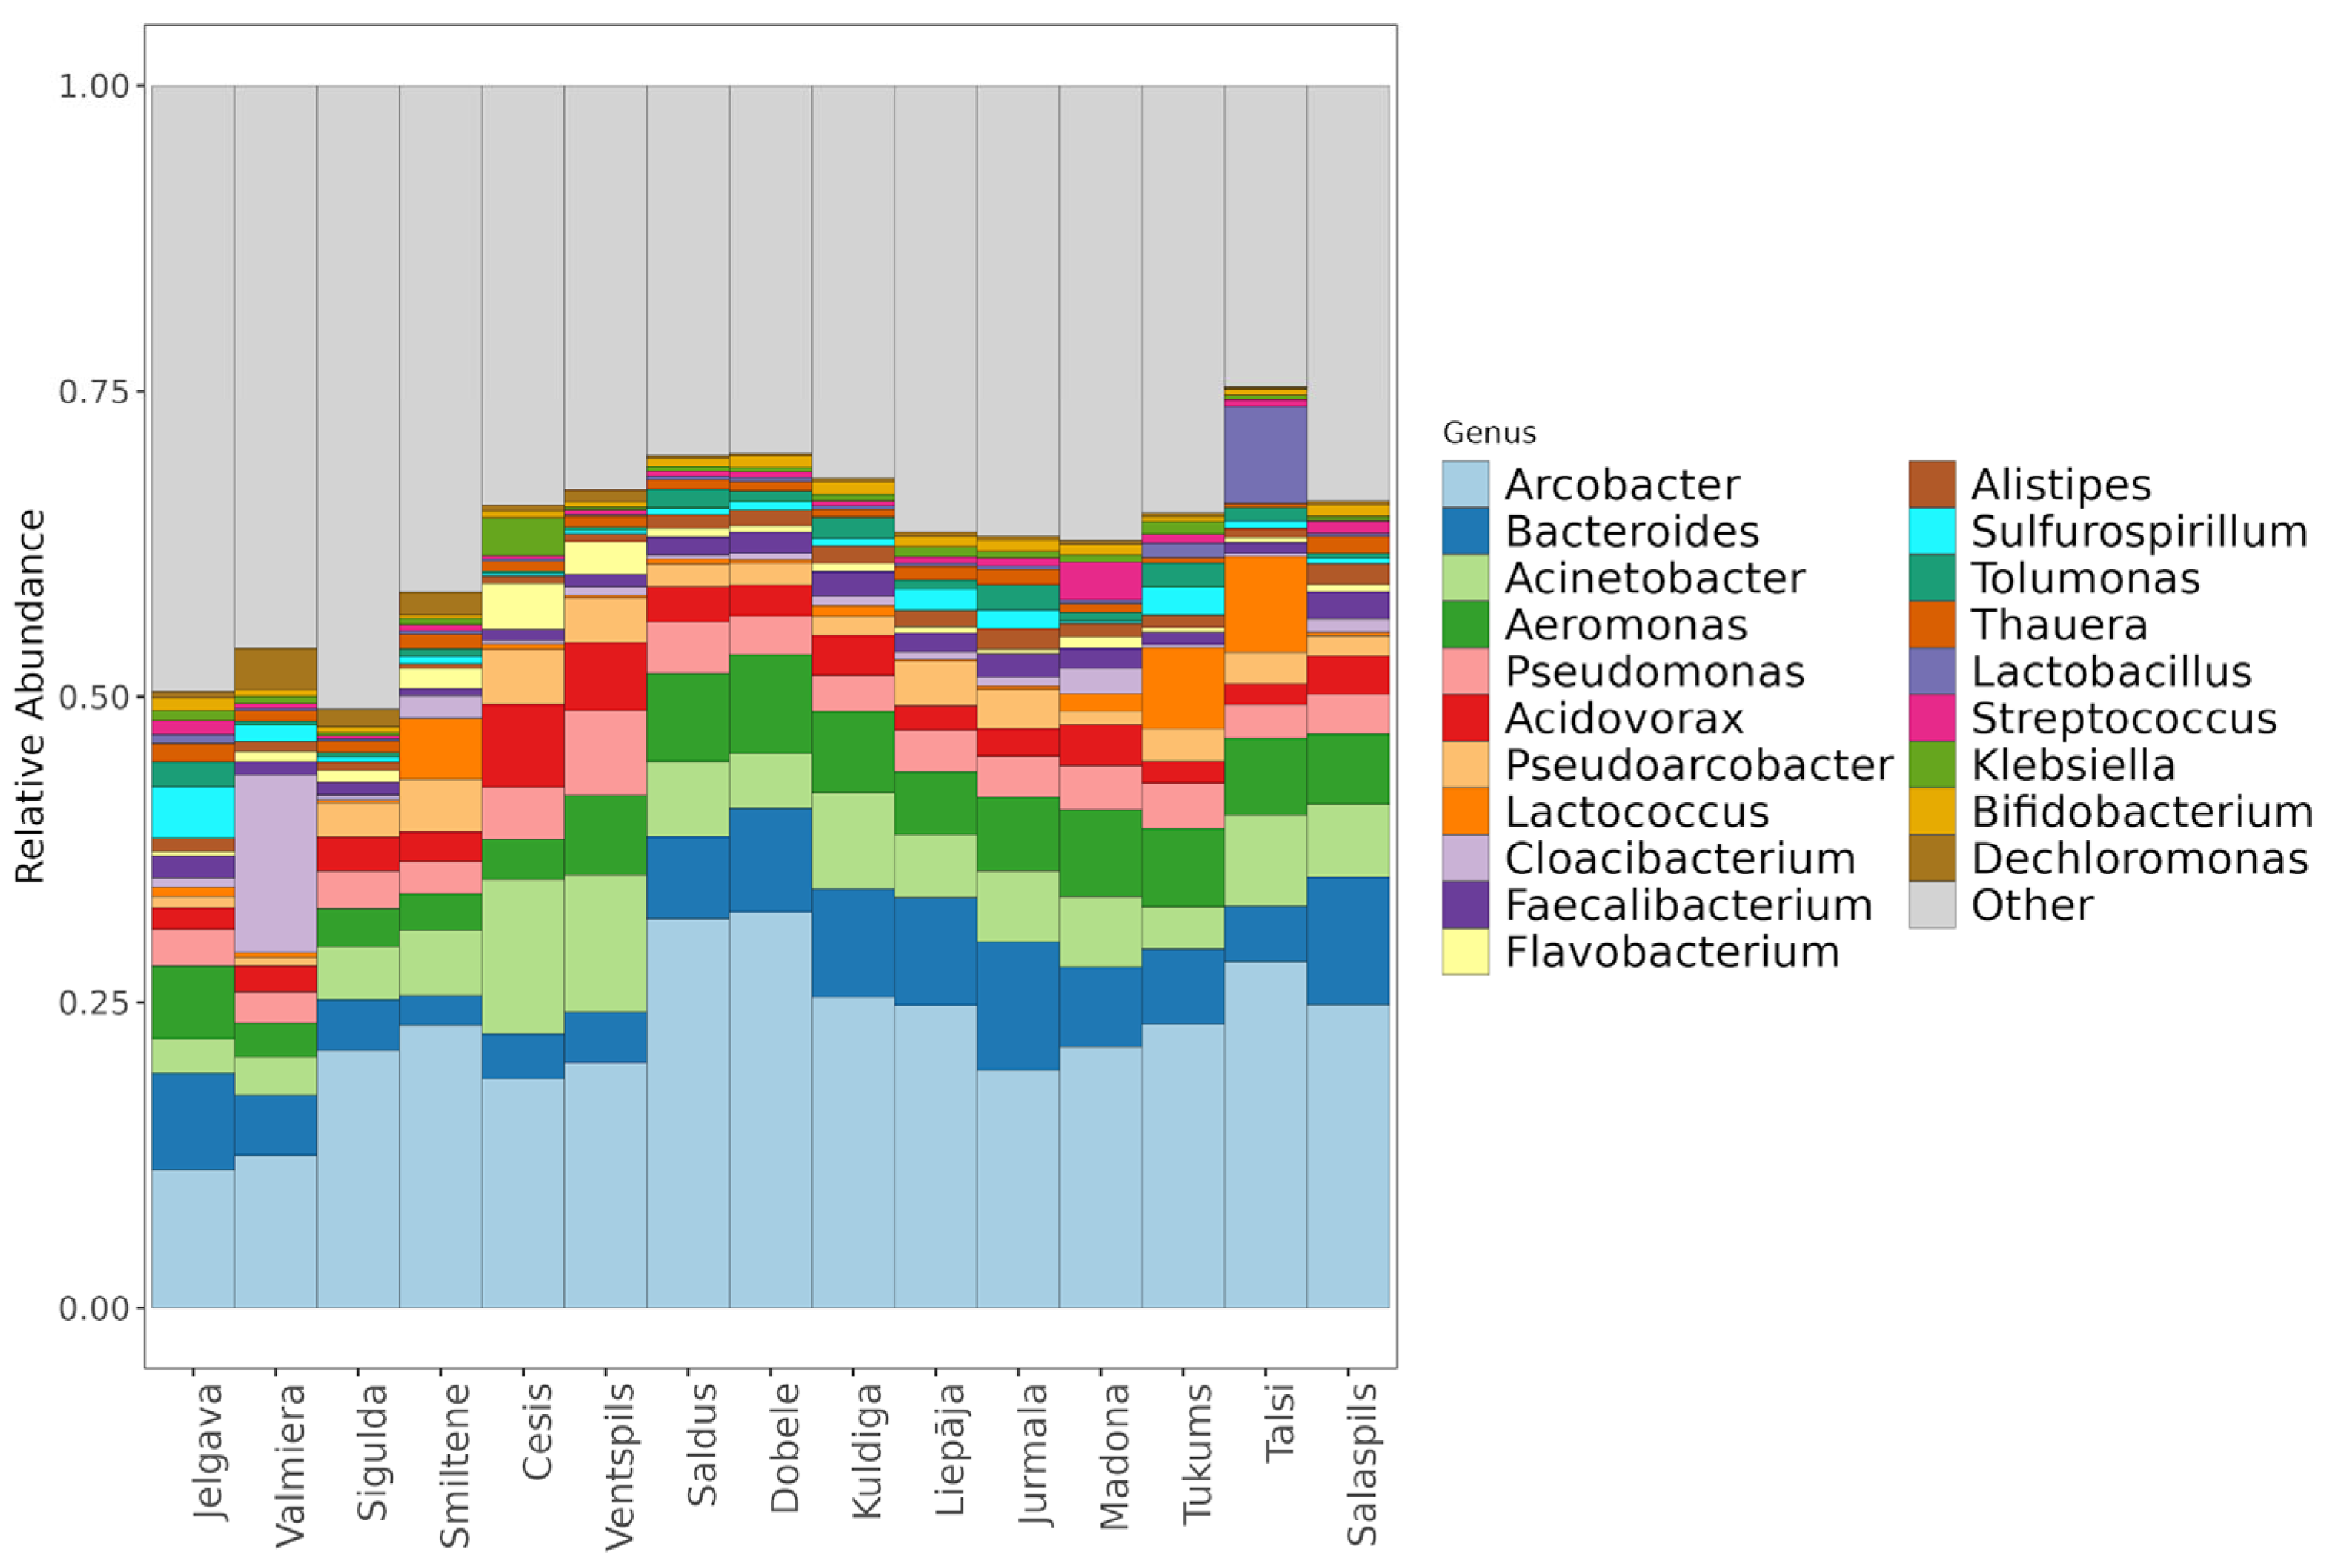
Figure 4.
(a) species diversity between cities. (b) Species beta diversity plot. Non-metric multidimensional scaling (NMDS) ordination from Bray-Curtis distances with the resulting ordination stress value 0.099.
Figure 4.
(a) species diversity between cities. (b) Species beta diversity plot. Non-metric multidimensional scaling (NMDS) ordination from Bray-Curtis distances with the resulting ordination stress value 0.099.
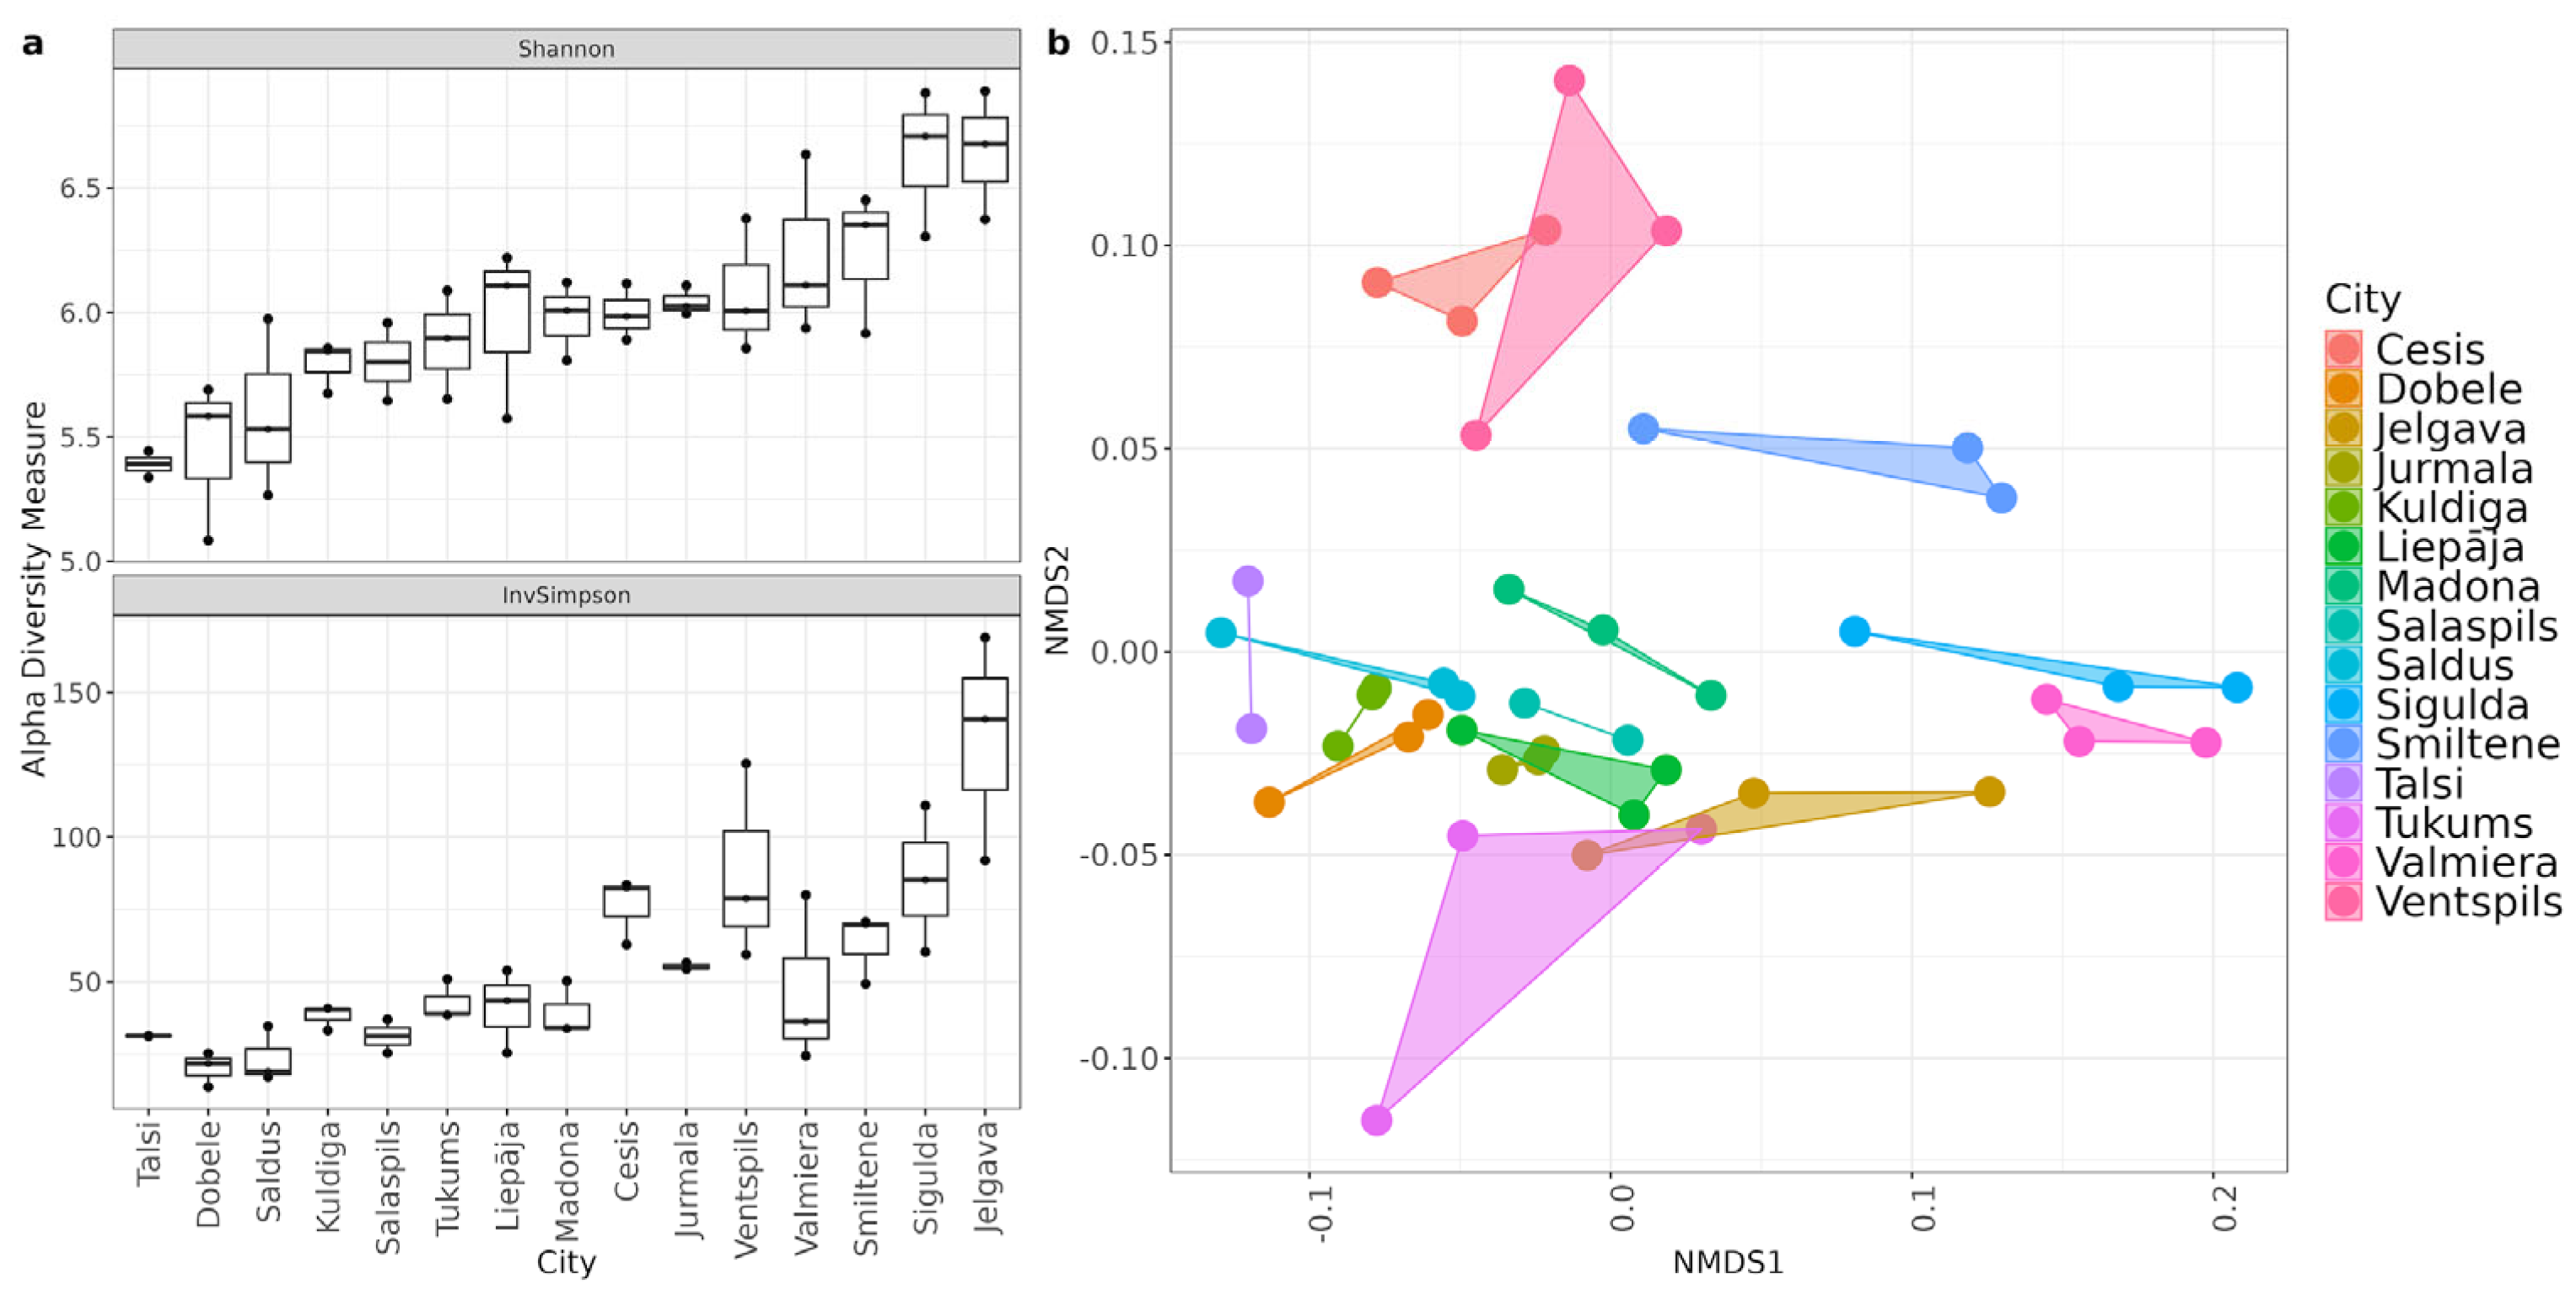
Figure 6.
(a) Alpha diversity indices of ARG counts in cities by Shannon, InvSimpson sorted from lowest to highest by Shannon values. (b) NMDS plot of Bray–Curtis distances between samples. Samples are colored by size of the connected population and municipalities are represented by different shapes.
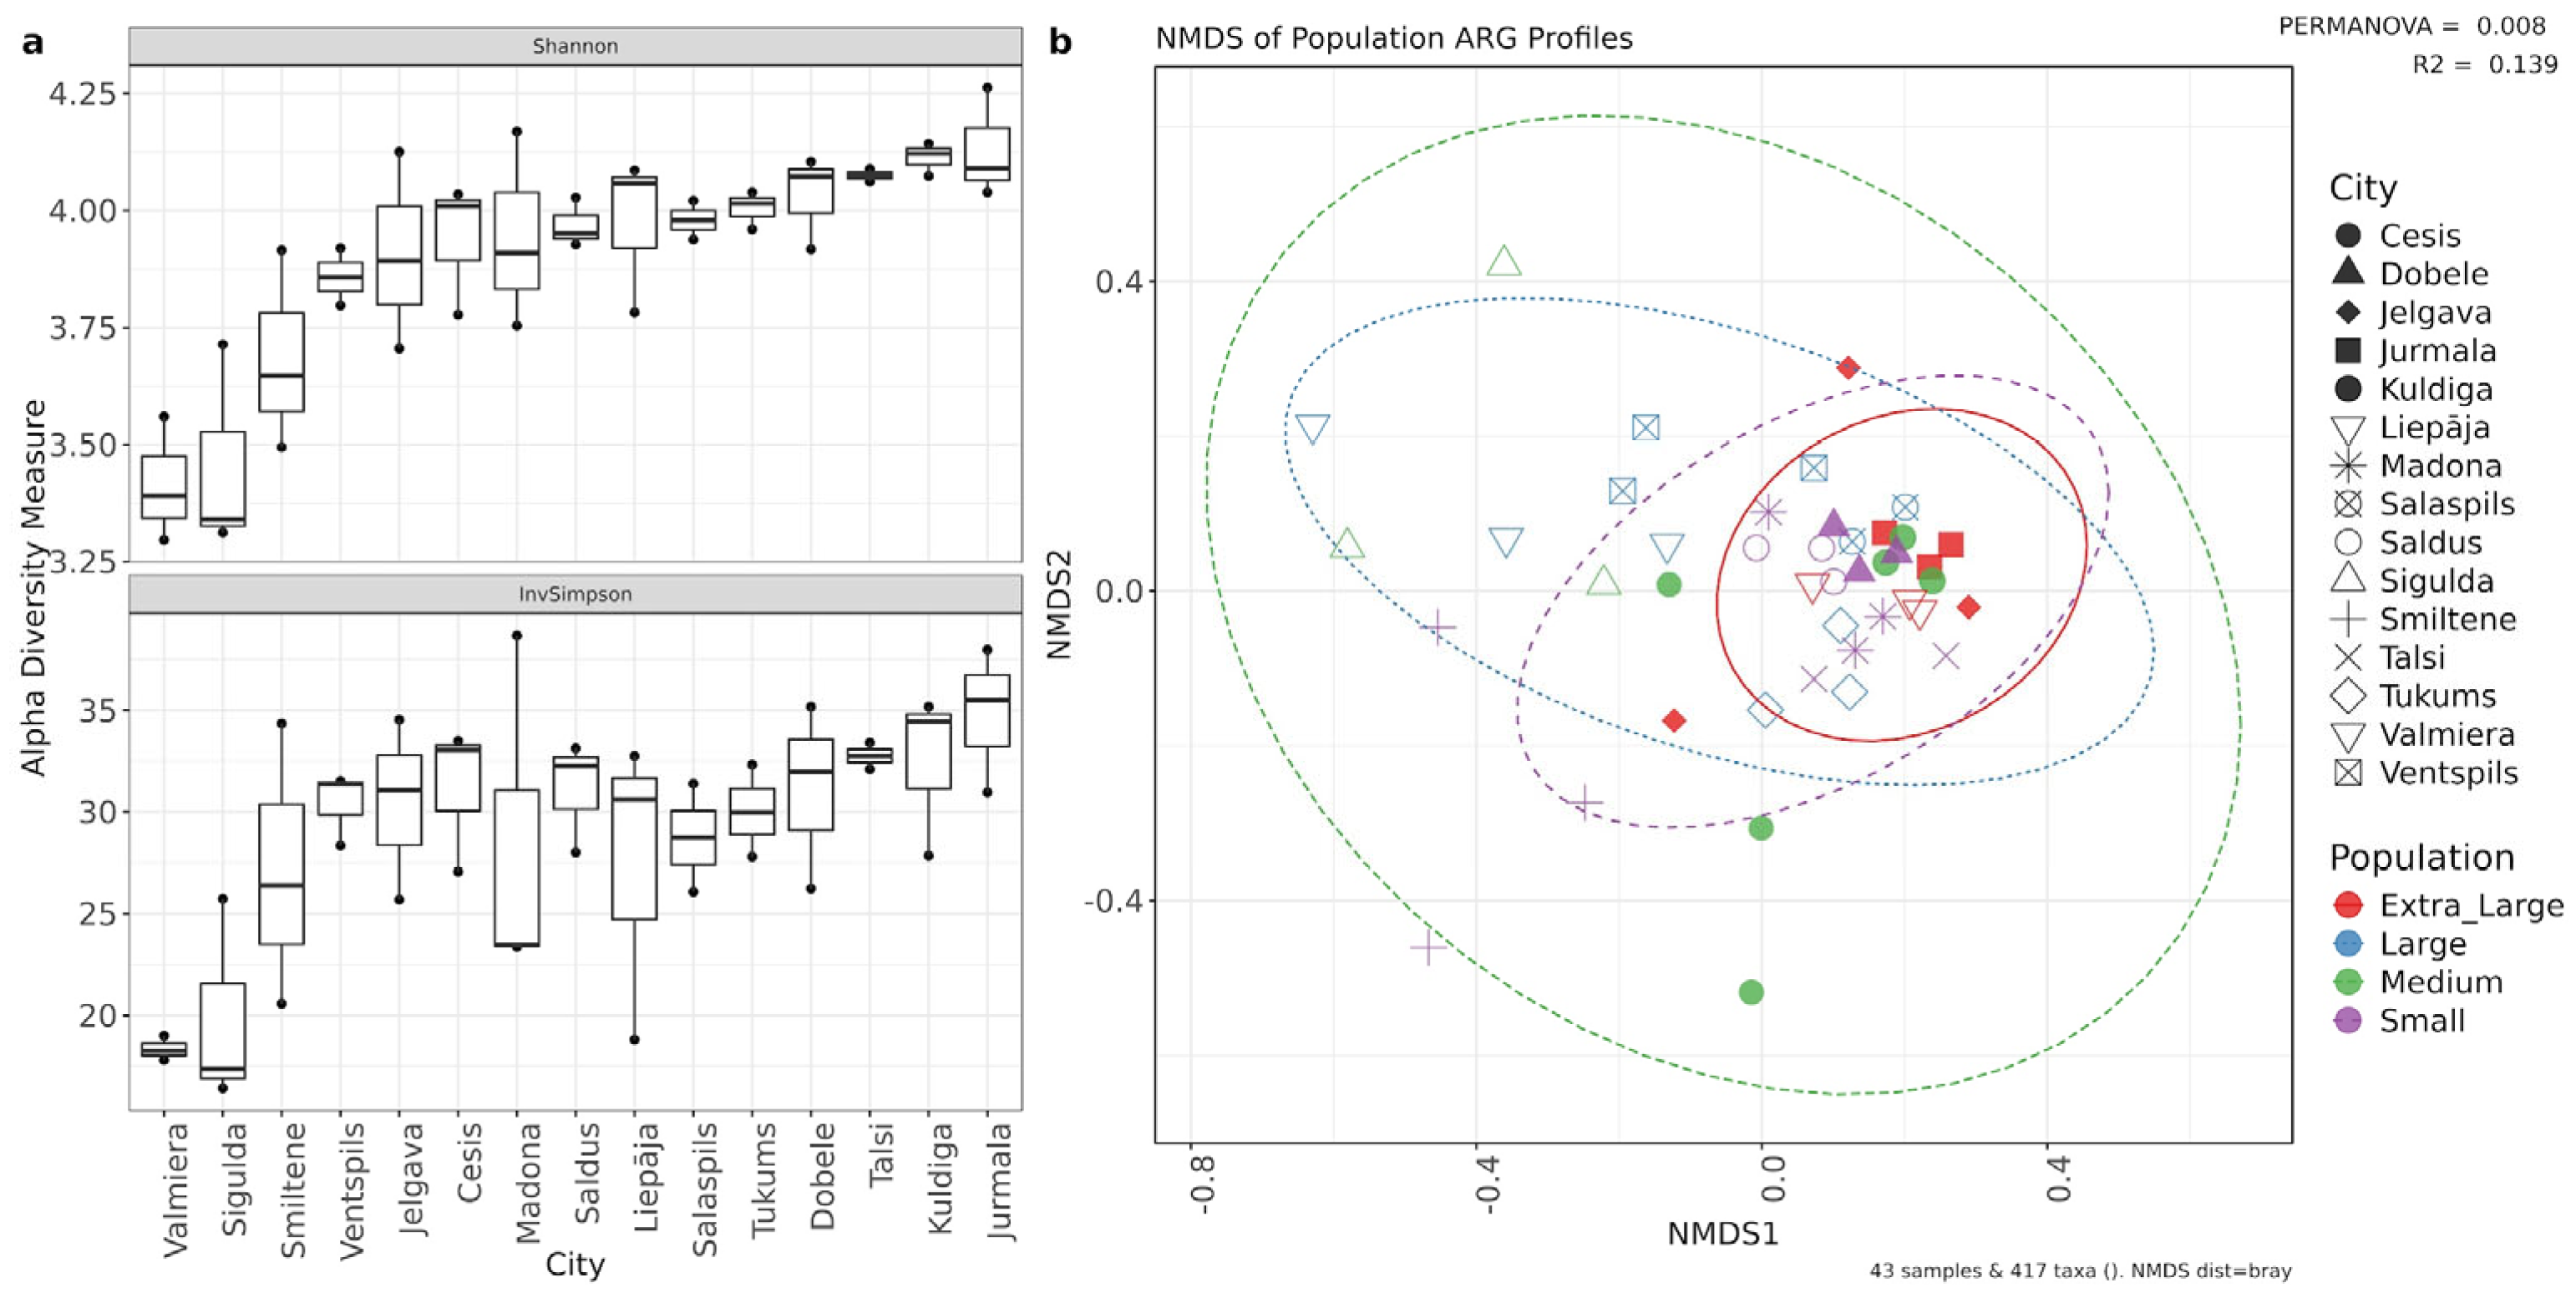
Figure 7.
Top 10 most common Drug classes and genes found in plasmids, analyzed using multiple tools in FuncScan pipeline with duplicates.
Figure 7.
Top 10 most common Drug classes and genes found in plasmids, analyzed using multiple tools in FuncScan pipeline with duplicates.
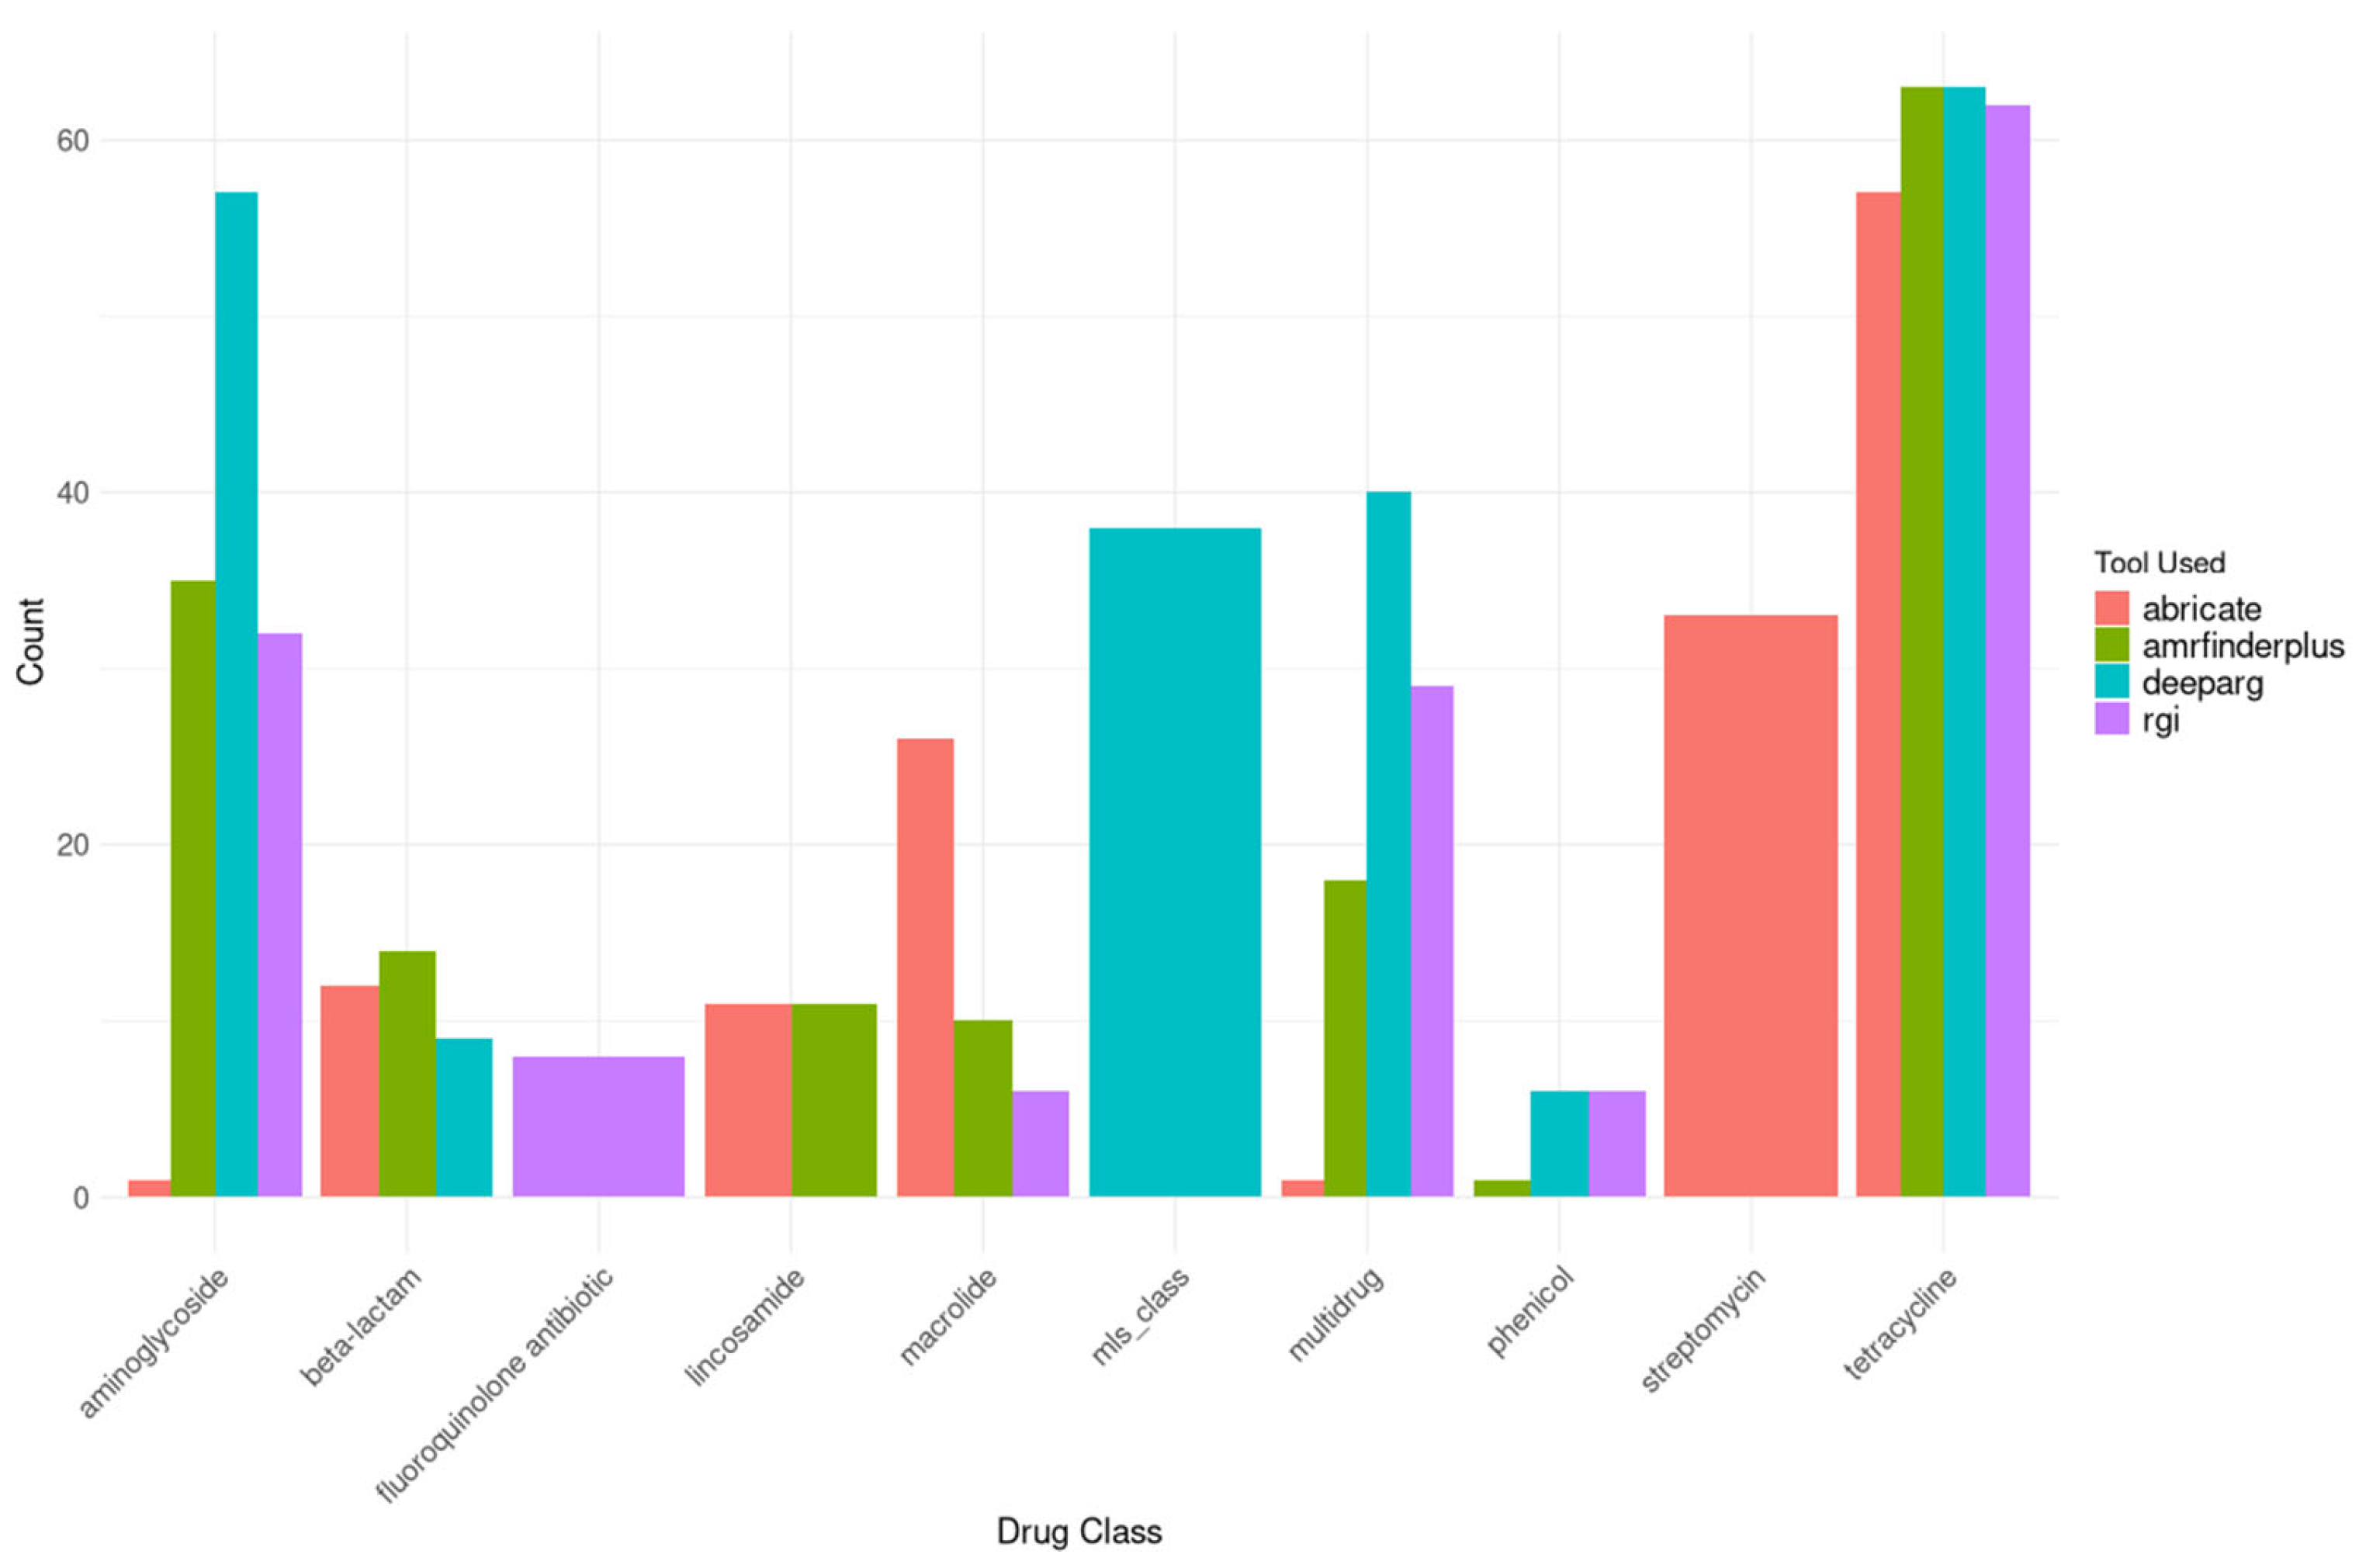

Table 1.
Municipalities grouped by population size.
| City | Population Category | Population Range |
|---|---|---|
| Smiltene | Small | Up to 10,000 |
| Madona | Small | Up to 10,000 |
| Talsi | Small | Up to 10,000 |
| Kuldīga | Small | Up to 10,000 |
| Saldus | Medium | 10,001-16,000 |
| Dobele | Medium | 10,001-16,000 |
| Sigulda | Medium | 10,001-16,000 |
| Tukums | Medium | 10,001-16,000 |
| Cesis | Medium | 10,001-16,000 |
| Salaspils | Large | 16,001-35,000 |
| Valmiera | Large | 16,001-35,000 |
| Ventspils | Large | 16,001-35,000 |
| Jelgava | Extra Large | Over 35,001 |
| Liepāja | Extra Large | Over 35,001 |
| Jūrmala | Extra Large | Over 35,001 |
Table 2.
Highlighted bacteria with clinical relevance and high virulence. Mean relative abundance and standard deviation of genera and species identified in the sample set.
Table 2.
Highlighted bacteria with clinical relevance and high virulence. Mean relative abundance and standard deviation of genera and species identified in the sample set.
| Genus/Species | Mean relative abundance | Genus/Species | Mean relative abundance |
|---|---|---|---|
| Klebsiella | 0.696% ± 0.930% | Citrobacter | 0.587% ± 0.782% |
| Klebsiella pneumoniae | 0.1547% ± 0.1785% | Citrobacter freundii | 0.147% ± 0.140% |
| Klebsiella huaxiensis | 0.0699% ± 0.0648% | Citrobacter portucalensis | 0.108% ± 0.280% |
| Acinetobacter | 6.086% ± 2.975% | Citrobacter braakii | 0.019% ± 0.010% |
| Acinetobacter baumannii | 0.150% ± 0.086% | Aeromonas | 5.516% ± 1.818% |
| Acinetobacter johnsonii | 1.213% ± 0.525% | Aeromonas caviae | 0.299% ± 0.158% |
| Pseudomonas | 3.554% ± 1.313% | Aeromonas dhakensis | 0.012% ± 0.005% |
| Pseudomonas aeruginosa | 0.194% ± 0.073% | Aeromonas veronii | 0.821% ± 0.432% |
| Pseudomonas alcaligenes | 0.275% ± 0.157% | Enterobacter | 0.285% ± 0.276% |
| Escherichia | 0.287% ± 0.094% | Enterobacter cloacae | 0.100% ± 0.225% |
| Escherichia coli | 0.268% ± 0.101% | Enterococcus faecium | 0.052% ± 0.024% |
| Staphylococcus aureus | 0.006% ± 0.002% |
Disclaimer/Publisher’s Note: The statements, opinions and data contained in all publications are solely those of the individual author(s) and contributor(s) and not of MDPI and/or the editor(s). MDPI and/or the editor(s) disclaim responsibility for any injury to people or property resulting from any ideas, methods, instructions or products referred to in the content. |
© 2025 by the authors. Licensee MDPI, Basel, Switzerland. This article is an open access article distributed under the terms and conditions of the Creative Commons Attribution (CC BY) license (http://creativecommons.org/licenses/by/4.0/).
Copyright: This open access article is published under a Creative Commons CC BY 4.0 license, which permit the free download, distribution, and reuse, provided that the author and preprint are cited in any reuse.


