Submitted:
16 December 2025
Posted:
17 December 2025
You are already at the latest version
Abstract
This article applies the Fama-MacBeth two-step regression technique to investigate the effect of excess cash holdings on stock returns. By integrating both theoretical and empirical methods, the study explores how excess cash impacts stock valuations. Analyzing financial data from non-financial firms listed on the Shanghai and Shenzhen A-share markets between 2011 and 2020, the research estimates the influence of excess cash holdings. It creates a long-short investment portfolio based on excess cash holdings using monthly trading data from A-shares spanning July 2012 to June 2022. Evaluations using the Fama-MacBeth three-factor, five-factor, and Carhart four-factor framework reveal that companies possessing elevated levels of surplus cash tend to experience notably greater monthly equity returns than their counterparts with limited excess liquidity. This result holds true across various models. Additionally, the study shows a significant positive correlation between excess cash holdings and stock returns, affirming that excess cash can reliably predict future stock performance. Market conditions, the quality of information disclosure, financing constraints, and ownership type also significantly influence this relationship. Both state-owned and private companies with higher excess cash holdings tend to outperform those with lower cash reserves. This study enhances our understanding of the determinants of stock returns and confirms the positive correlation between excess cash holdings and anticipated returns in the Chinese stock market.
Keywords:
excess cash holdings
; stock returns
; long short investment portfolios
; Fama MacBeth regression
1. Introduction
Against the background of slowing global economic growth and increasing uncertainty, enterprises have successively experienced the impact of the financial crisis and the COVID-19. At present, research on corporate cash holding behavior in China mostly starts from the perspective of corporate governance, exploring the relationship between excess cash holding, investment, and company value. Although there is relatively little research on this topic domestically, there is relatively abundant research based on developed capital markets abroad. Compared to others, China's capital market started relatively late, the system is not yet perfect, information disclosure is insufficient, and investor behavior is relatively irrational. This article aims to analyze the relationship between excess cash holdings and stock returns in the Chinese market, and explore their unique performance in the Chinese capital market. Cash holdings are not only crucial for the survival and development of enterprises, but also a focus of attention for the market and investors. The theoretical framework resolves existing debates on the link between excess cash and firm value, addressing gaps in domestic studies related to this issue. The empirical results reveal a positive relationship between excess cash and stock returns within the Chinese market, a trend that persists across both state-owned and private companies. This effect is particularly pronounced under favorable market conditions, with transparent information disclosure, and amid strong financing constraints. Additionally, the study investigates how excess cash holdings impact future investments and growth potential, and it summarizes various factors influencing stock returns in China, such as financial metrics, industry features, ownership structure, investor sentiment, corporate social responsibility, and macroeconomic policies.At the practical level, the research findings of this article help listed companies evaluate the market's response to excess cash holdings and provide guidance for their cash management decisions; Meanwhile, investors can also better understand asset pricing models through the research presented in this article and construct more effective investment portfolios based on them. This article also applied the investment portfolio method to the constituent stocks of the CSI 800 Index, further verifying its feasibility and practicality in practical operations.
2. Related Research
2.1. Fama Macbeth Regression Model
In order to interpret risk papers, research is mainly focused on identifying new factors, such as macroeconomic indicators or firm characteristics. The question is whether these factors help predict stock returns, which is still an operational area of finance and computer research. HW Teng and colleagues conducted a comprehensive comparative analysis using various pricing factors[1]. They evaluated the out-of-sample predictive capabilities of neural networks, the conventional Fama-MacBeth regression approach, and several supervised learning techniques, including regression models and tree-based algorithms, for forecasting stock and portfolio returns. The study found that neural networks, particularly deeper architectures, provided slight enhancements in prediction accuracy. In a separate paper, T. Zhang and colleagues examined how global oil price uncertainty affects the cross-sectional pricing of stocks in the Chinese market, utilizing the intertemporal capital asset pricing model for their analysis[2]. Using Fama-MacBeth regression and multi-factor time-series analysis, they discovered that stocks facing greater uncertainty in oil prices had notably reduced expected returns related to their beta coefficients. In the article[3], W. Zhang and Y. Li used the Amihud measure to represent liquidity. Their analysis, which included univariate and bivariate portfolio assessments as well as Fama-MacBeth regression, revealed a negative relationship between liquidity and returns on cryptocurrencies. In their study[4], WL Du utilized panel and Fama-MacBeth regression techniques to find a negative relationship between returns on CDS indices and stock returns.
2.1. Factor Pricing Model
In their research, OH Chol and colleagues transformed a two-factor model into a terminal boundary value problem of the Black-Scholes equation with time-varying coefficients, deriving an analytical pricing formula[5].Using this formula, they provided pricing expressions for callable bonds with credit risk and putable bonds. In their study, Y. Hong and colleagues introduced a manageable three-factor model incorporating self-exciting jumps[6], tailored for the S&P 500 index and its variance. Unlike the optimal investment strategy in the two-factor model, which involves two variance swaps, investors implement a trading approach structured as a long-short-long position sequence across three distinct swap agreements.
2.1. Data Warehousing and Data Mining
AH Carlson employed a regression framework utilizing Heckman’s two-step consistent estimator[7], which accommodates heteroscedasticity in the first stage and adopts a more flexible control function approach. Similarly, AC Jaures, in their research on the Indigenous Seasonal Climate Forecast (ISCF) in Benin, implemented the travel cost method[8], descriptive statistical tools, and the Heckman two-step procedure to assess both its adoption and economic significance. Krishnan et al. adopted the Heckman selection model (1979) and concluded that the European Central Bank (ECB) plays a facilitative role in promoting firms’ outward foreign direct investment (OFDI)[9], particularly among highly leveraged firms. Furthermore, MA Ji-Liang and colleagues applied the Heckman two-stage technique to explore the determinants influencing household engagement in commercial legume cultivation and further incorporated the endogenous treatment regression (ETR) approach to evaluate the impact of such agricultural activity on household economic well-being[10].
3. Method
3.1. Measurement of Excess Cash Holdings
During the sample period, the average year-end cash holding ratio of Chinese listed companies was 22%, but there were significant differences between companies, ranging from 1% to 100%. The average debt to asset ratio is 0.428, indicating a generally high level of debt, although the highest value reaches 0.894. Risk assessment needs to be conducted in conjunction with specific companies and industries. The average ratio of capital expenditures to total assets is 0.0489, indicating less long-term investment. The ratio of net working capital and operating cash flow to total assets is relatively low, and some companies are negative, indicating poor financial condition. The standard deviation of MB value is relatively large, reflecting significant differences in market premiums. The average value of Div is 0.688, and about 70% of companies have issued cash dividends, indicating an improvement in the situation of not issuing cash dividends. Regression analysis shows that the asset liability ratio, net working capital after excluding monetary current assets, and capital expenditures have a notable negative correlation with cash holdings. Conversely, net cash flow from operations, the MB ratio, and cash dividend payouts show a strong positive correlation with cash reserves. However, the link between company size and cash holdings is relatively weak.
The industry average excess cash holdings data calculated based on regression results shows significant differences between different industries. Many industries, such as wholesale and retail, accommodation and catering, health and social work, and agriculture, forestry, animal husbandry, and fisheries, typically have high levels of excess cash holdings. In contrast, the excess cash holdings in the resident service, repair, and other service industries, as well as the cultural, sports, and entertainment industries, are relatively low. While firms in the information transmission, software, and IT services sector maintain the highest levels of cash reserves compared to other industries, its excess cash holdings are negative, which may be related to its significant R&D investment. The cash holdings in the manufacturing industry are at a moderate level, but excess cash holdings are relatively low. Overall, the annual average value of excess cash holdings of listed companies has not changed much, and has been positive for most of the time in recent years, with higher values in 2017 and 2018.As shown in Figure 1 and Figure 2.
3.1. Sorting Method and Factor Model
This article uses sorting method to construct an investment portfolio. The specific steps include: firstly, sorting all sample stocks in ascending order according to the value of the excess cash holdings indicator in the past year. Subsequently, the stocks were divided into five groups, and the weighted return on circulating market value for each group was calculated based on their rankings. The investment strategy is to buy stocks from the highest ranked group and short sell stocks from the lowest ranked group, constructing a long short investment portfolio and calculating its monthly return. At the beginning of July each year, the grouping will be updated based on the excess cash holdings indicator. The Fama French three factor and five factor models are classic tools used for income analysis, while the Carhart four factor model adds a mid-term momentum factor to the three factor model to evaluate the impact of past 11 months' income on current income. The descriptive statistics of the relevant factors involved in the three models are shown in Table 1, during the research period from July 2012 to June 2022, the average monthly risk-free rate was 0.16%, and the monthly excess return rate in the A-share market was 0.70%. The mean values of market, scale, and momentum factors are relatively high, while the mean values of value, profit, and investment factors are relatively low, especially the mean value of profit factors is negative.
3.1. Cross Sectional Regression
The Fama Macbeth regression method is of great significance in asset pricing as it can effectively handle cross-sectional correlations. This method first performs cross-sectional regression on the returns at each time point, and then processes these regression results with time series mean to obtain an overall estimate. This article uses Fama Macbeth regression to explore the impact of excess cash holdings on stock returns, referencing relevant studies such as Bi and Zhu (2020). Control variables include turnover rate, book to market ratio, company size, and beta value. The model settings are as follows:
Turnover rate measures the activity of stock trading, which is the ratio of the number of traded shares to the number of outstanding shares. Research has found that high turnover rates are often negatively correlated with stock returns, possibly due to high volatility and irrational investment behavior leading to higher prices, thereby reducing expected returns. The book to market ratio (BM) and company size are derived from the Fama French three factor model, where BM is positively correlated with stock returns. A high BM indicates poor financial condition and requires higher returns to compensate for risks. Behavioral finance suggests that high BM value companies are often undervalued, while low BM value companies may be overvalued. The size of a company is negatively correlated with its profitability, and small companies typically offer higher returns and can continue to operate in a sluggish economy. Beta values indicate the sensitivity of stocks to market risks. In the Chinese market, stocks with low Beta values often have higher returns, as investors prefer low-risk stocks, which in turn leads to lower than expected returns for stocks with high Beta values. The average annual excess return of the stocks in the sample is 13.8%, with a standard deviation of 0.496, ranging from -57.2% to 213.1%. The average level of excess cash holdings is -0.1%, with the highest reaching 81.3%; The turnover rate increased from 0.535 to 25.722, with a standard deviation of 4.852 and significant differences in liquidity; The average book to market ratio is 0.338, the average company size is 22.244, and the average Beta value is 1.174, which is higher than the overall market level.

Table 2.
Table of descriptive analysis of Fama-Macbeth regression.
| Variables | mean | sd | min | max |
|---|---|---|---|---|
| Y | 0.138 | 0.496 | -0.572 | 2.131 |
| C | -0.001 | 0.194 | -0.391 | 0.813 |
| TURN | 5.945 | 4.852 | 0.535 | 25.722 |
| BM | 0.338 | 0.158 | 0.044 | 0.782 |
| SIZE | 22.244 | 1.291 | 19.936 | 26.240 |
| BETA | 1.174 | 0.284 | 0.458 | 2.053 |
4. Results and Discussion
4.1. Fama Macbeth Regression Test
This study applied the Fama Macbeth regression method, which eliminates the interference of cross-sectional correlation on standard error through "regression first, then mean" and allows for multi feature variable control to improve the reliability of the results. Due to the fact that the excess cash holdings data is only annual, the analysis is based on the data of A-share listed companies from 2011 to 2020, and the regression results have been adjusted by Newey West to handle autocorrelation and heteroscedasticity issues. Regression analysis shows that there is a significant positive correlation between excess cash holdings and future stock returns, whether regressed separately or with control variables added, indicating that it is an effective indicator for predicting returns. Turnover rate is significantly negatively correlated with expected returns, consistent with high volatility and speculative expectations, indicating that the market provides liquidity compensation for stocks with poor liquidity. The book to market ratio (BM value) is positively correlated with stock returns, and a high BM value may reflect higher financial risks or market undervaluation, leading to future increases in returns. From the perspective of behavioral finance, low BM value growth stocks may be overvalued, while high BM value stocks may be undervalued and perform beyond expectations in the future. The scale effect and beta effect were not shown to be significant in this analysis.
4.1. Excess Cash Holdings in Different States
The macroeconomic situation significantly affects corporate behavior and market performance. The trend of the stock market often reflects macroeconomic changes. When the market rises, most stocks also rise accordingly, otherwise, most stocks perform weakly. The Shanghai Composite Index, as a representative of the market, showcases both bull and bear markets during the research period. For example, from the end of 2014 to mid-2015, the market saw a significant increase due to policy support, central bank easing, and leverage effects. In the middle and late 2015, the bursting of the market foam triggered a sharp decline. Later, as the macro-economy gradually stabilized, the overall index rebounded. In 2018, the trade conflict between China and the United States and the depreciation of the Chinese yuan led to a market downturn. At the beginning of 2022, due to geopolitical tensions and rising energy prices, the market experienced slight fluctuations. As shown in Figure 3.
Referring to Simutin (2010), this article divides the market into two states: active and sluggish, to analyze the performance of excess cash holding strategies under different market conditions. During market downturns, the monthly average returns of each group were significantly lower than zero. Although the returns of the high excess cash holding group were higher than those of the low excess cash holding group, the difference was not significant. When the market is active, the monthly average return of all groups is significantly higher than zero, and the monthly average return of the portfolio invested in the high excess cash holding group reaches 0.93%, which is better than the overall sample of 0.59%. This result is consistent with the investment channel theory, indicating that in times of economic prosperity, companies have more high-quality investment opportunities, thereby increasing their returns and growth potential; When the market is sluggish, the investment environment for high excess cash holding companies deteriorates, expected returns decrease, and stock returns also decrease accordingly.
4.1. Application of Investment Portfolio in Component Stocks of CSI 800 Index
In order to evaluate investment strategies based on excess cash holdings, this article applies them to the constituent stocks of the CSI 800 Index and analyzes their returns. The data in Figure 4 shows that the cumulative return rate of the investment portfolio based on excess cash holdings has gradually increased, reaching 130.686% as of June 2022, while the cumulative return rate of the CSI 800 Index was 82.690%. Although the CSI 800 Index performed better between 2015 and 2017, in the long run, this investment portfolio has higher returns and stronger stability. The monthly average return rate of this portfolio is 0.753%, and the annualized return rate is 8.718%, both of which are better than the CSI 800 index, and its Sharpe ratio and annualized standard deviation show better investment performance.
5. Conclusion
This research analyzes the financial data of non-financial firms listed on China's Shanghai and Shenzhen A-share markets covering the period from 2011 to 2020, as well as monthly trading data from July 2012 to June 2022, combined with theoretical analysis and empirical testing, to explore the impact of excess cash holdings on expected stock returns.By sorting the excess cash holdings and constructing an investment portfolio, the stock returns of the high holding group were significantly better than those of the low holding group, and the monthly average return of the constructed investment portfolio reached 0.59%, significantly higher than zero. After adjusting for the three factor, four factor, and five factor models, the monthly average excess returns were 0.61%, 0.60%, and 0.47%, respectively. In addition, the positive correlation between excess cash holdings and stock returns is significant in both individual regression and control variables, and remains robust in different sample spaces and measurement methods. In the constituent stocks of the CSI 800 Index, the annualized return and Sharpe ratio of the long short investment portfolio constructed based on excess cash holdings are also better than the index, indicating that during public crises, stocks with high excess cash holdings perform better in terms of returns. At the same time, it is recommended to strengthen the research on factor models for the Chinese market. Although foreign factor models (such as Fama French three factor and five factor models) perform well in explaining stock returns, the domestic market has unique characteristics, and existing models may not be fully applicable. Developing factor models suitable for the Chinese market will help further enhance the depth and effectiveness of asset pricing research.
References
- Teng H W , Li Y H , Kou S ,et al. Can deep neural networks outperform Fama-MacBeth regression and other supervised learning approaches in stock returns prediction with asset-pricing factors?[J]. Digital Finance, 2023. [CrossRef]
- Zhang T , Xu Z , Li J .The asset pricing implications of global oil price uncertainty: Evidence from the cross- section of Chinese stock returns[J]. Energy, 2023(Dec.15):285.
- Zhang W , Li Y .Liquidity risk and expected cryptocurrency returns[J]. International journal of finance & economics: IJFE, 2023. [CrossRef]
- Du L , Flaherty S M V .Inclusion of debt claims in asset pricing models: Evidence from the CDS Index[J].Investment Management and Financial Innovations, 2023. [CrossRef]
- Chol O H , Choe D S , Rim G D .Analytical Pricing of 2 Factor Structural PDE model for a Puttable Bond with Credit Risk[J]. arXiv e-prints, 2022.
- Hong Y , Jin X .Pricing of variance swap rates and investment decisions of variance swaps: Evidence from a three-factor model[J]. European Journal of Operational Research, 2022, 303.
- Carlson A H .GTSHECKMAN: Stata module to compute a generalized two-step Heckman selection model[J]. Statistical Software Components, 2022.
- Amegnaglo Cocou Jaurès, Akwasi M B , Asomanin A K .Use and economic benefits of indigenous seasonal climate forecasts: evidence from Benin, West Africa[J].Climate and Development, 2022.
- Krishnan A , Padmaja M .External Commercial Borrowings and Outward Foreign Direct Investment: Evidence From Indian Manufacturing Firms[J]. Asian Economics Letters, 2023. [CrossRef]
- Ji-Liang M A , Fan L I , Hui-Jie Z ,et al. Commercial cash crop production and households'economic welfare:Evidence from the pulse farmers in rural China[J].Journal of Agricultural Sciences: English edition, 2022, 21(11):3395-3407.
Figure 1.
Industry cash holdings and excess cash holdings mean graph.
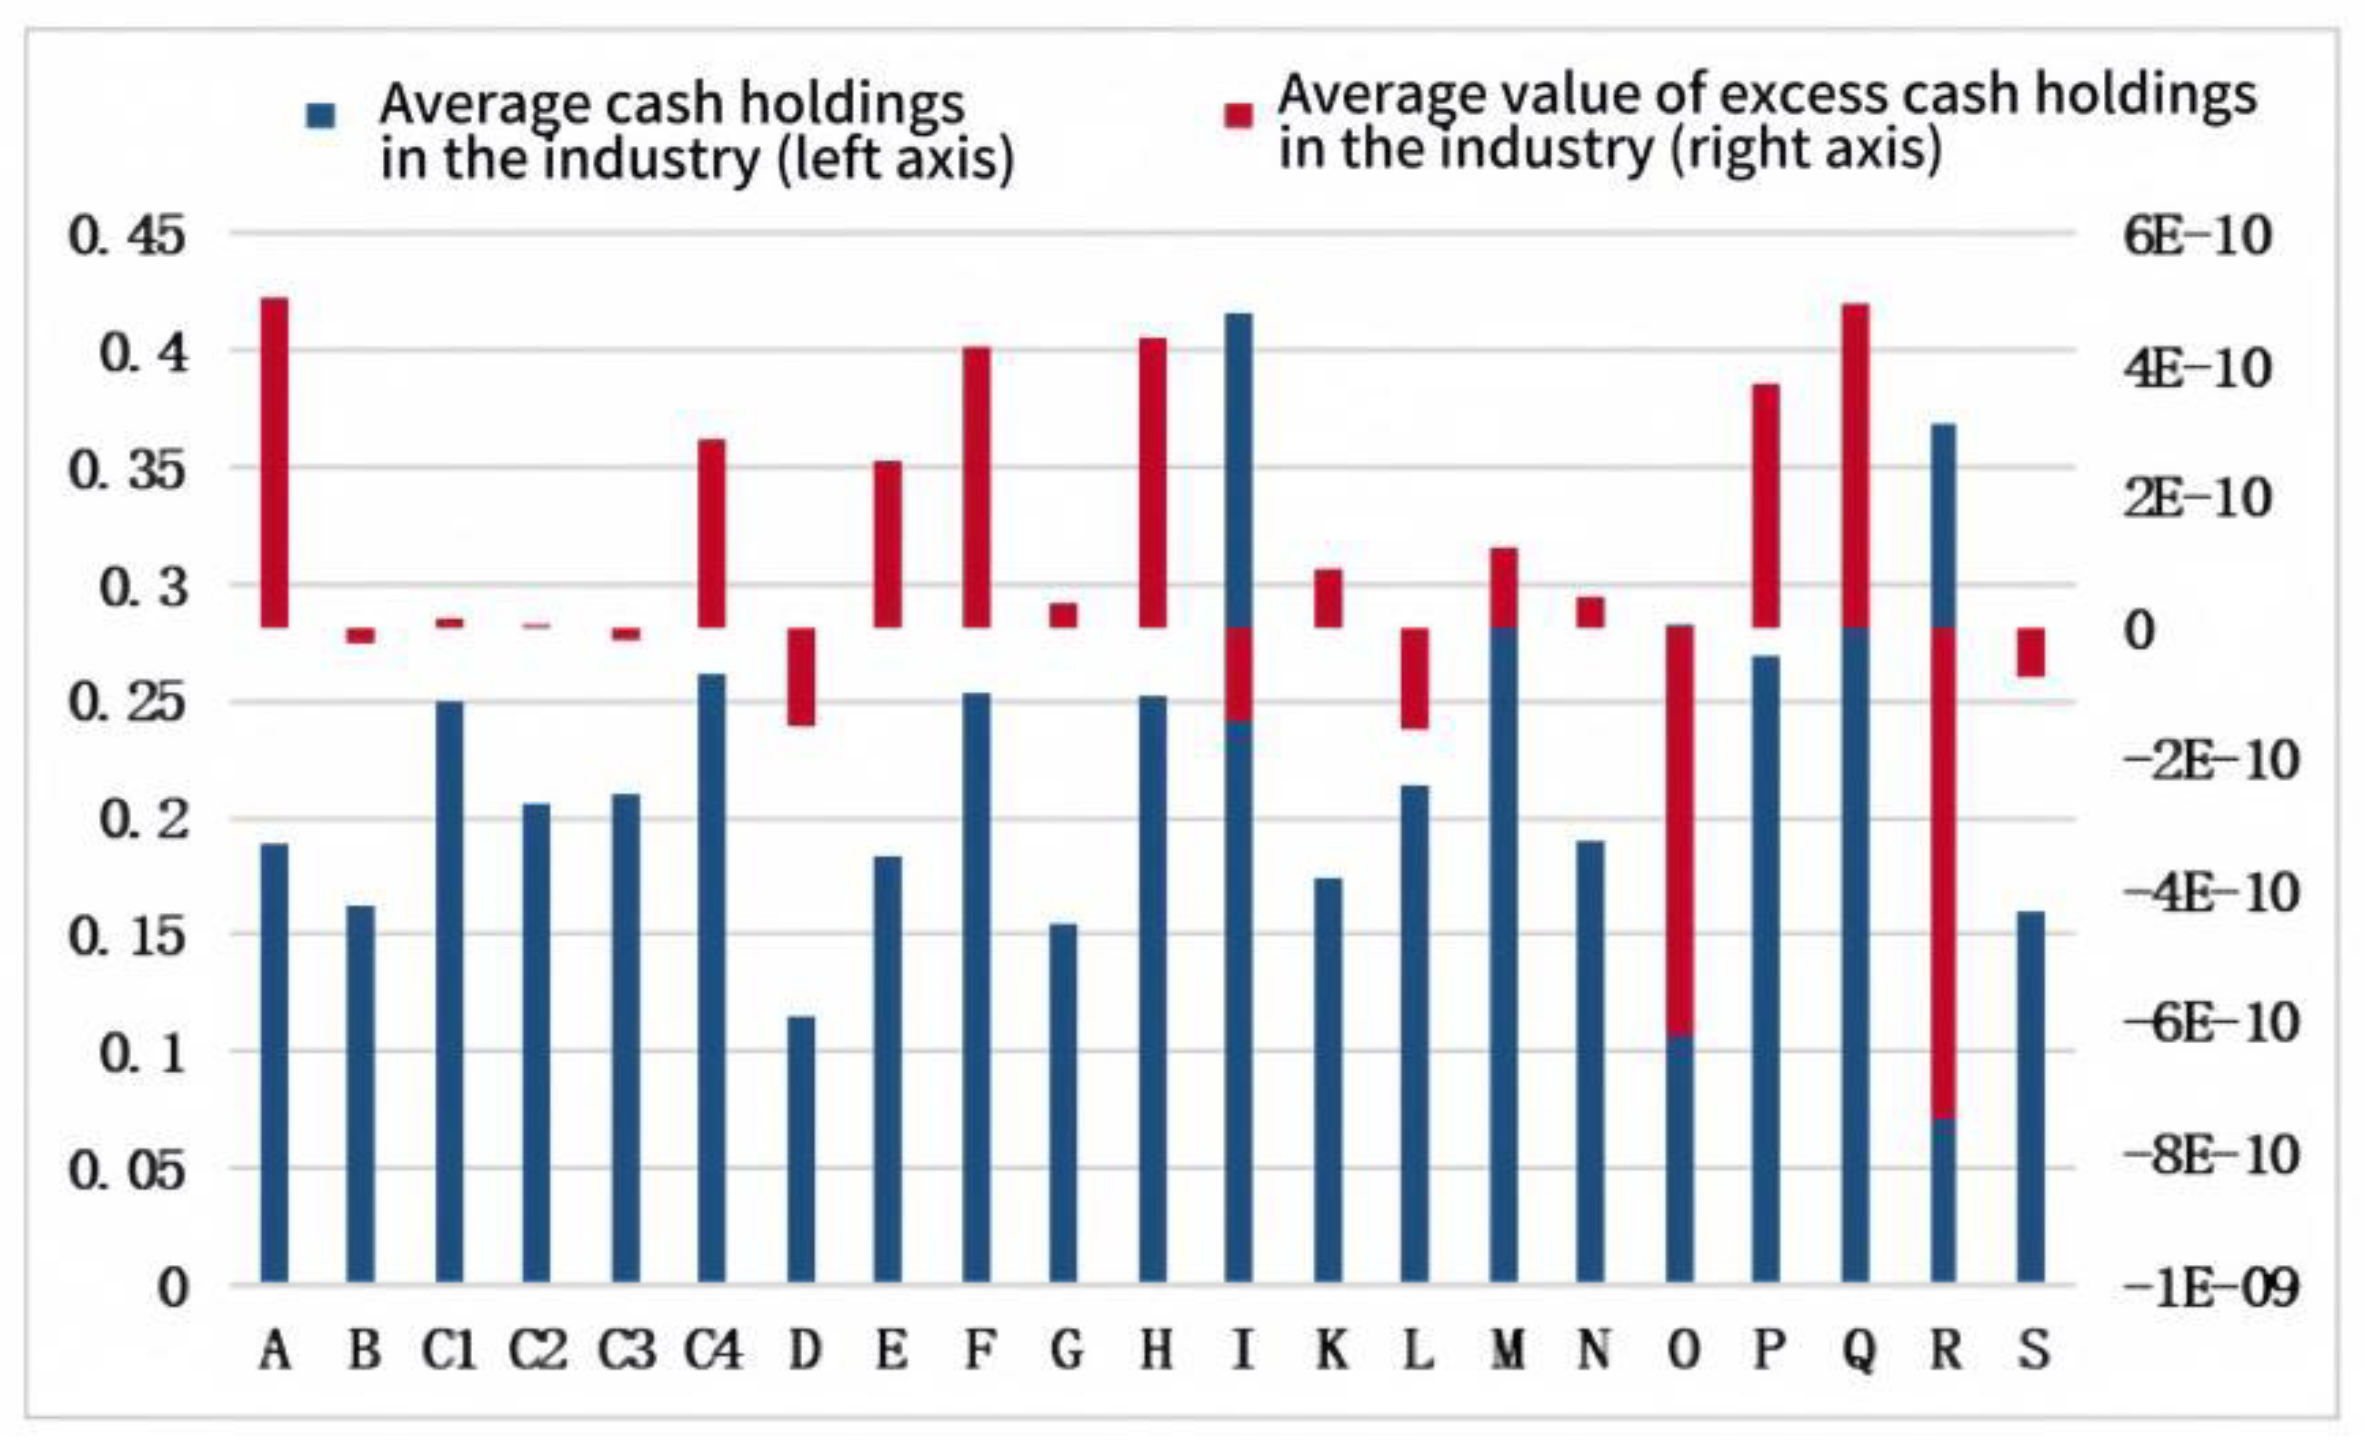
Figure 2.
Average annual excess cash holdings graph.
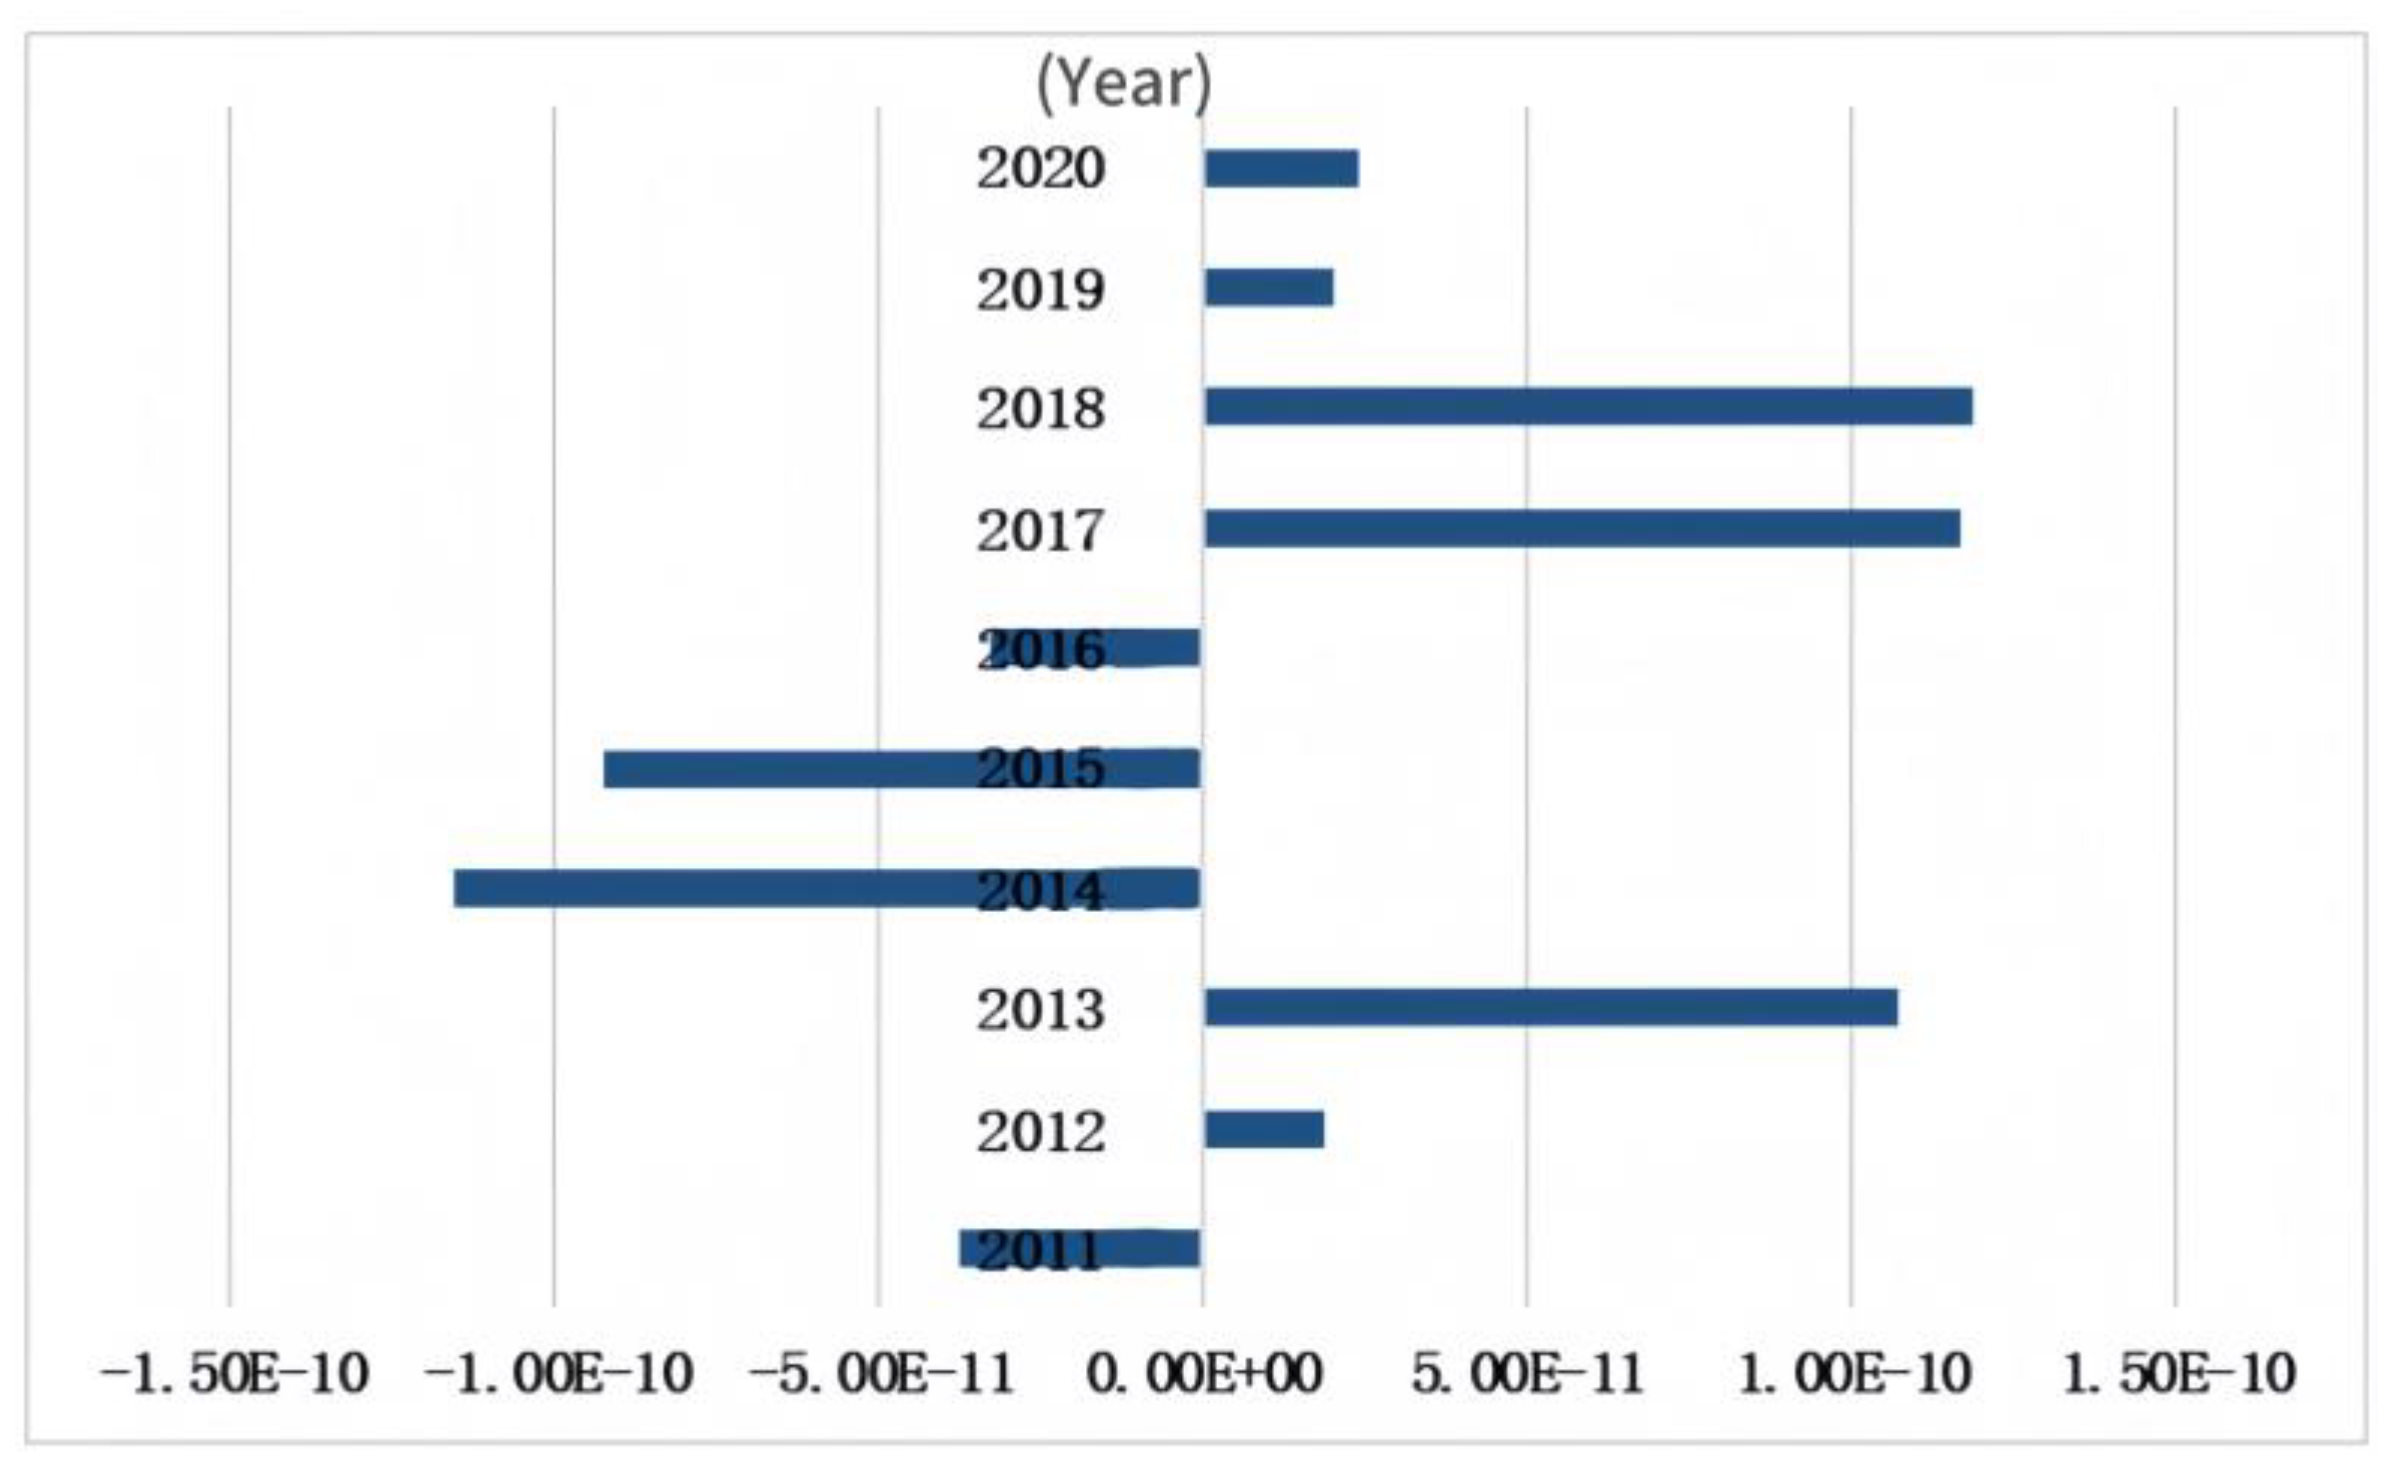
Figure 3.
Shanghai Composite Index Closing Index Chart.
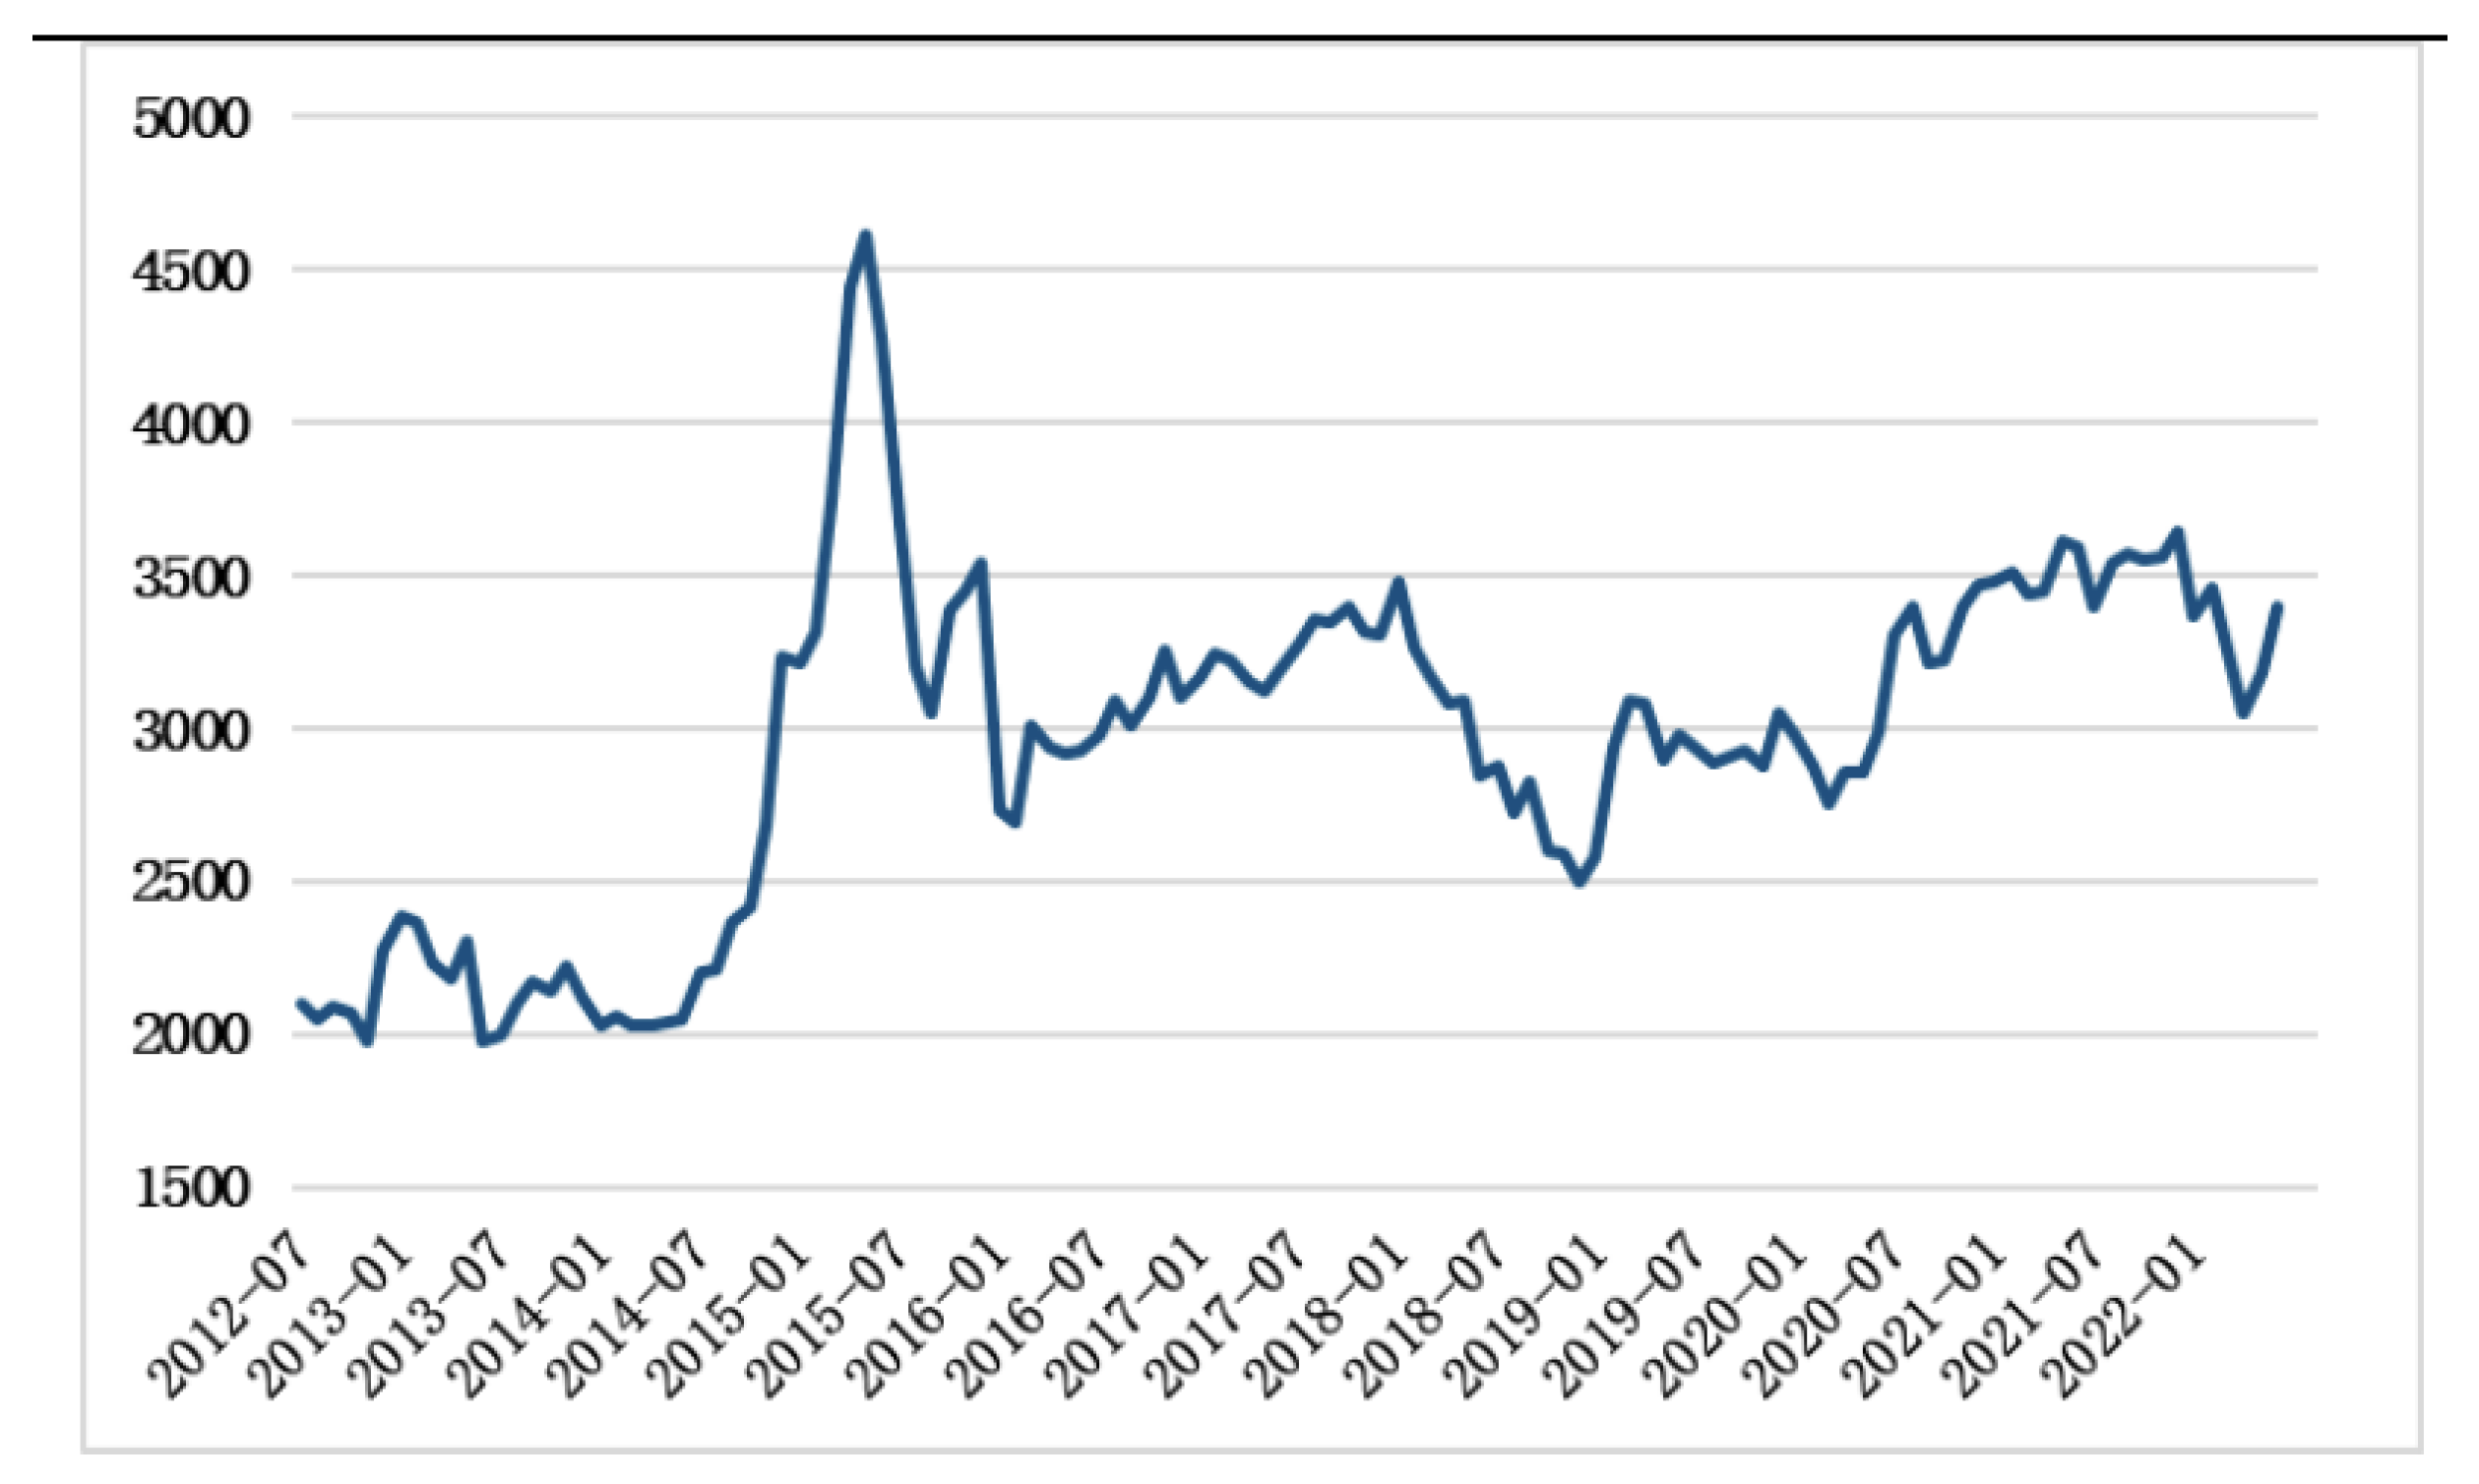
Figure 4.
Cumulative Return Chart of Investment Portfolio and Index.
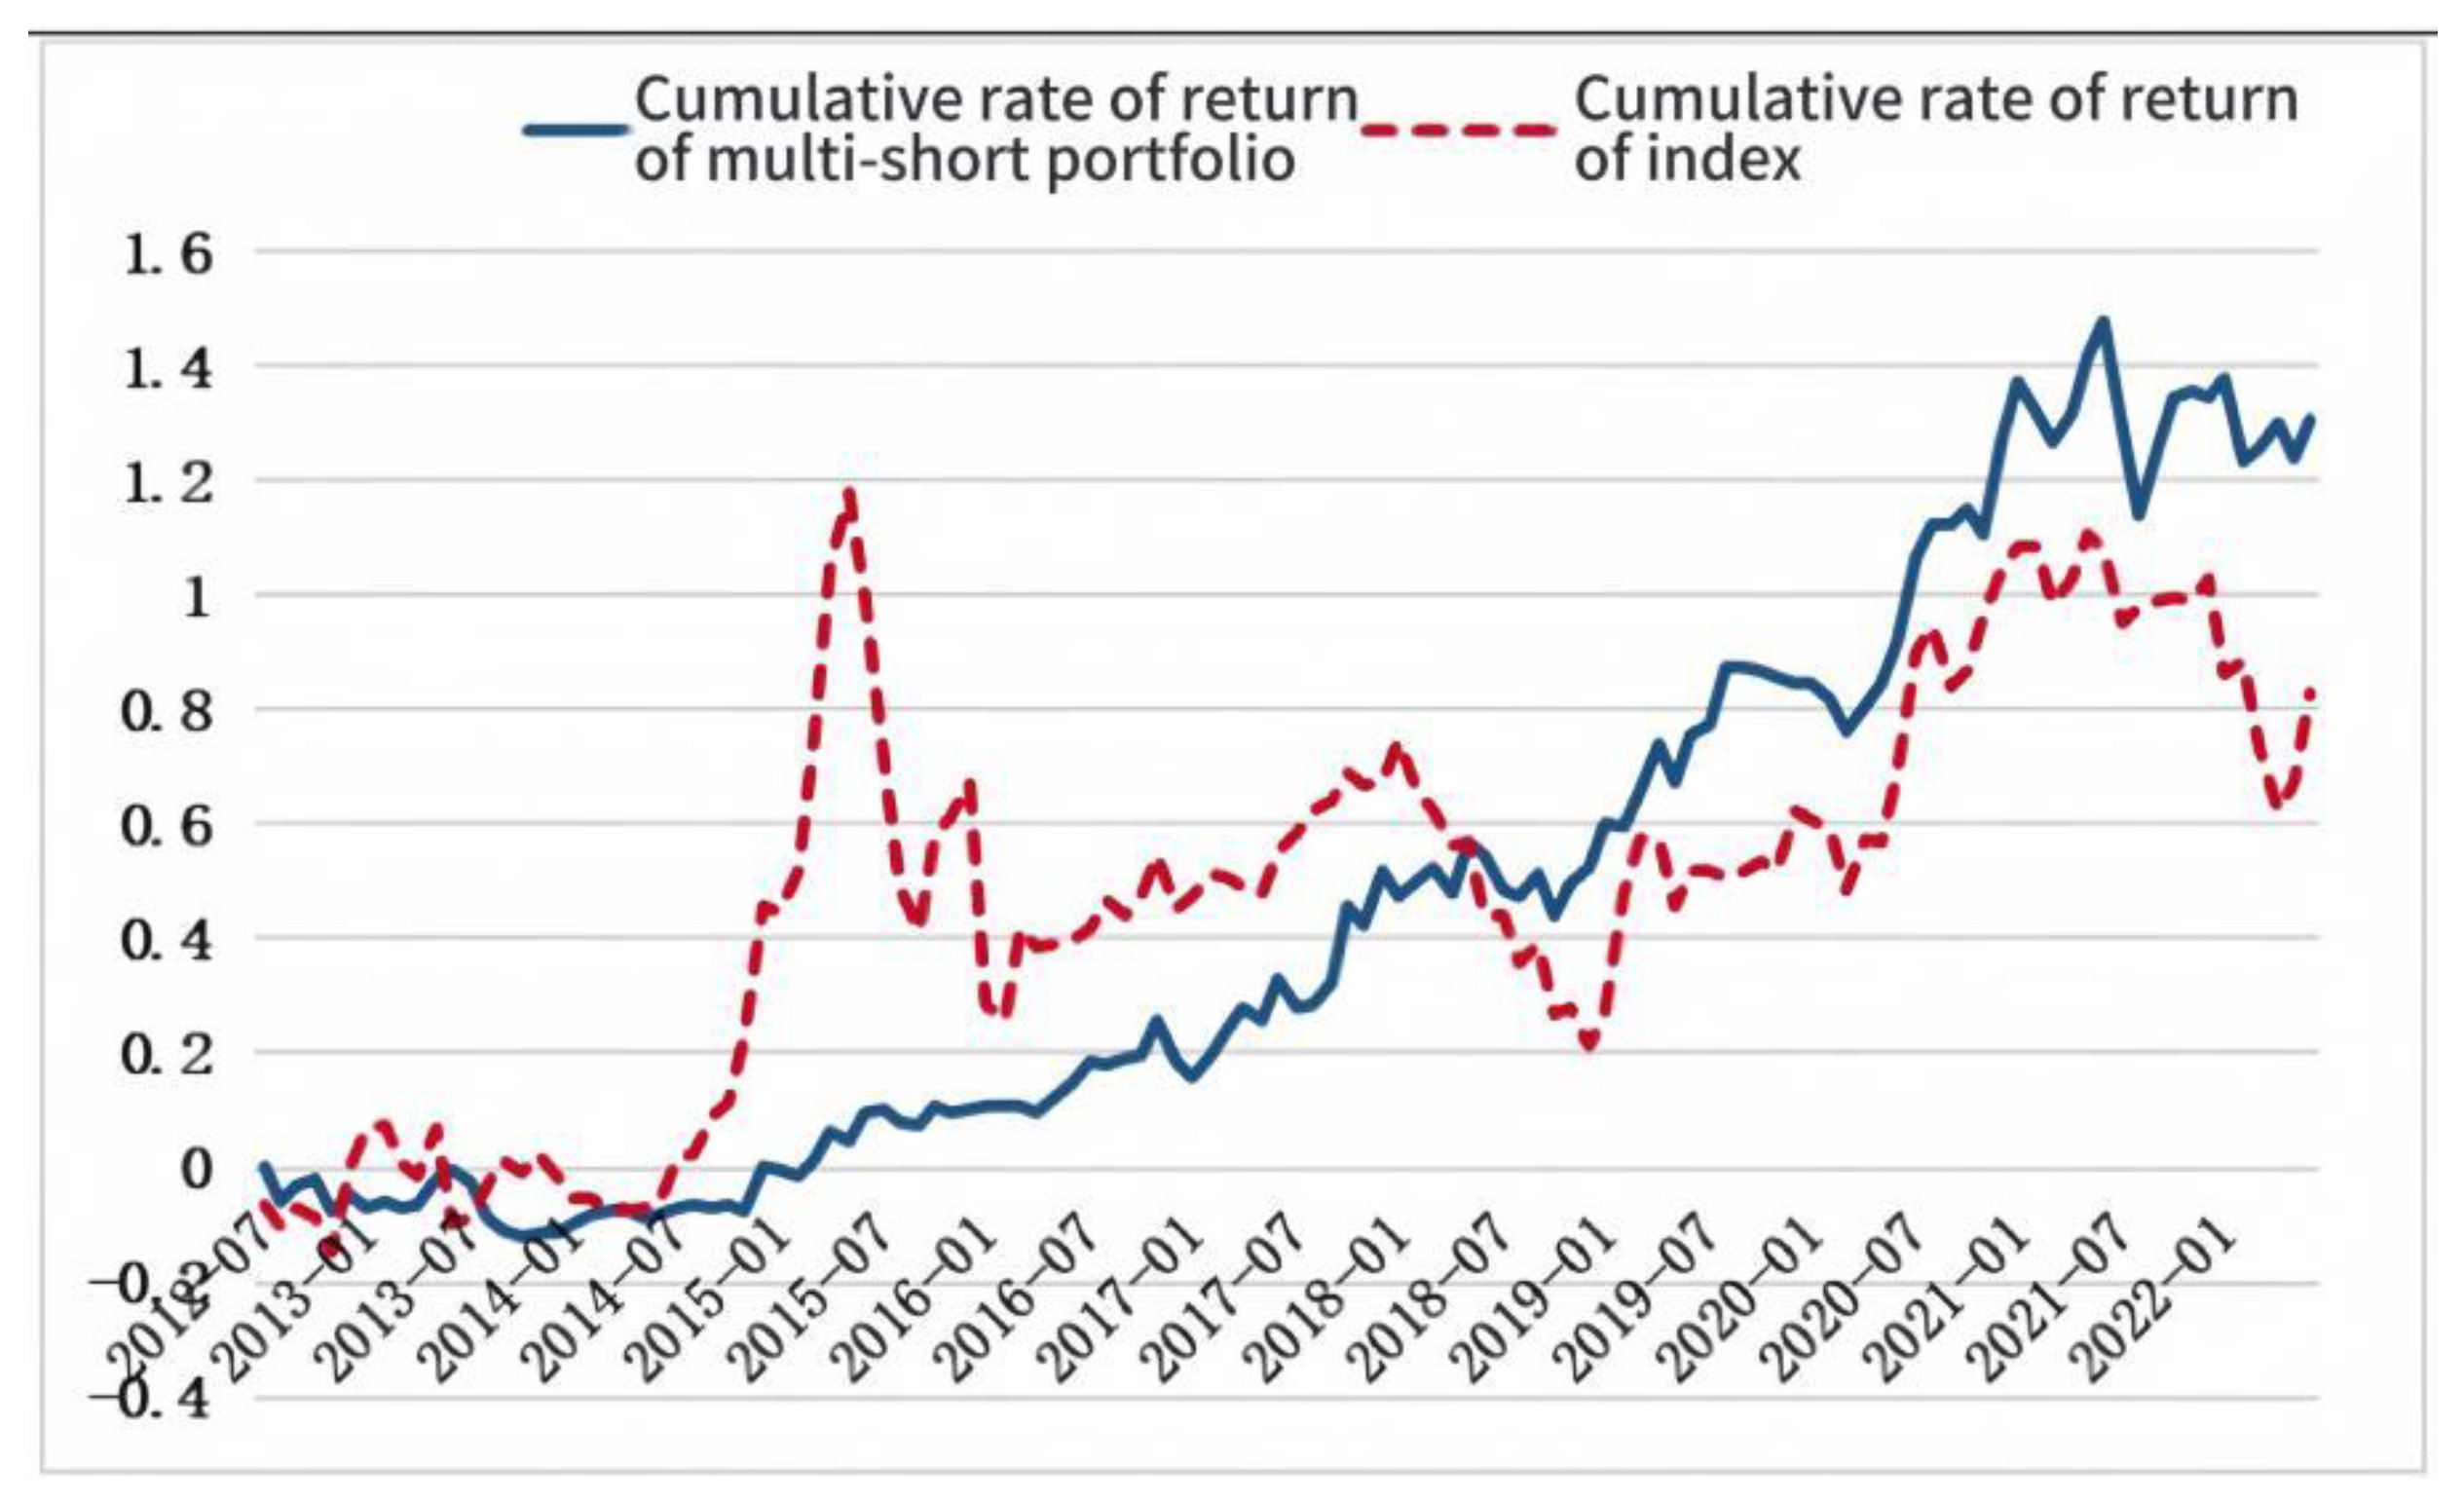
Table 1.
XG-CatBoost Fusion Model Architecture Design.
| Variables | mean | sd | min | max |
|---|---|---|---|---|
| Rf | 0.0016 | 0.0005 | 0.0012 | 0.0025 |
| Rm-Rf | 0.0070 | 0.0636 | -0.2506 | 0.1778 |
| SMB | 0.0073 | 0.0504 | -0.2212 | 0.2285 |
| HML | 0.0003 | 0.0388 | -0.1437 | 0.1595 |
| MOM | 0.0081 | 0.0543 | -0.1947 | 0.1736 |
| RMW | -9.67e-06 | 0.0280 | -0.0821 | 0.1002 |
| CMA | 0.0001 | 0.0214 | -0.0489 | 0.0603 |
Disclaimer/Publisher’s Note: The statements, opinions and data contained in all publications are solely those of the individual author(s) and contributor(s) and not of MDPI and/or the editor(s). MDPI and/or the editor(s) disclaim responsibility for any injury to people or property resulting from any ideas, methods, instructions or products referred to in the content. |
© 2025 by the authors. Licensee MDPI, Basel, Switzerland. This article is an open access article distributed under the terms and conditions of the Creative Commons Attribution (CC BY) license (http://creativecommons.org/licenses/by/4.0/).
Copyright: This open access article is published under a Creative Commons CC BY 4.0 license, which permit the free download, distribution, and reuse, provided that the author and preprint are cited in any reuse.


