Submitted:
15 December 2025
Posted:
16 December 2025
You are already at the latest version
Abstract
Growth of food online delivery to serve the modern life pattern of customer in urban. Plastic waste increased and had problems with waste management. The aim of this study is to investigate the urban waste composition related to online food delivery in Bangkok metropolitan, food delivery consumption behavior, and plastic waste generated from food delivery. Data from online food delivery customers were collected by online questionnaires from 385 participants. Proportion of plastic waste increased in municipal solid waste. Increase of order food delivery in online platforms about 76.6% of the total participants. The single-use plastic (SUP) generation related to online food delivery in household waste. Participants did not choose the green choices to decline the SUP when ordering food in platforms. These findings suggest reducing SUP from online food delivery, close-loop management requiring cooperation of producer-platform-customer-government. Extended producer responsibility (EPR) should apply for producers to make environmentally friendly products, online food delivery platform increase more incentive for merchants and customers to reduce SUP. Polluter-pay-principle (PPP) might be applied for customers. Government must adopt policy to ban SUP and design system for plastic waste management.
Keywords:
municipal solid waste
; online food delivery
; plastic waste
; urban waste
; single-use plastic
1. Introduction
Waste generation is continuously growing around the world as a result of economic growth and unsustainable consumption [1]. The municipal solid waste (MSW) generates more than two billion tons per year globally [2]. MSW is projected to grow from 2.1 billion tonnes to 3.8 billion tonnes from 2020 to 2050. In 2020, when compared to other regions uncontrolled MSW was highest in East and South Asia. Inadequate waste management contributed to environmental pollution; greenhouse gases emitted from waste disposal site, hazardous compound contaminated on land for long-term effected on ecosystem, and open burning of waste releases unintentional persistent organic pollutants (UPOPs) such as dioxin compounds which can cause of human health risk of carcinogen [2] Waste management is an important issue linking to sustainable development goals (SDGs) which address Goal 3: good health and well-being; the negative impacts of public health due to inadequate MSW management such as vector-borne diseases, nuisance of odor, respiratory system impact from emission from open burning. Goal 12: Responsible consumption and production is related to production and consumption patterns that directly impact MSW generation. Goal 13: Climate action is related to poorly managed waste by releasing greenhouse gases (GHGs) from open burning and uncontrolled dumpsites that contribute to climate change [3].
Currently, due to urbanization, modern life is shifting, the consumption pattern of the world’s population has changed. The key domains of urbanization included population shift from rural to urban areas, city expansion in terms of area and infrastructure, economic shift from agriculture-based to industry and services, social changes in lifestyle, education, employment, consumption patterns, and increase of environmental impacts. Rapid urbanization has positive and negative impacts, although it contributes to economic and social development, but it poses challenges to the natural environment and social system [4]. The rapid expansion of urban areas, combined with the growing population reflect an increase in the amount of waste generation as reported in megacities; Ho Chi Minh city [5], Beijing [6], China [7], and Brazil, Vietnam [1]. Most of the plastic waste pollution has resulted from urbanization due to the new pattern of consumers. In addition, the outbreak of the COVID-19 pandemic has also significantly affected the world and human life pattern [8]. As a result, delivery and online businesses, or e-commerce, are replaced by offline services. For example, the demand for online food delivery services has increased in various countries during the pandemic [9]. According to Statista Digital Market Outlook, global revenues for online food delivery services were approximately 91 million USD in 2018 and 107 million USD in 2019 [10]. Also, compared to before the COVID-19 pandemic the food delivery platforms in Thailand grew by 78–84% during the lockdown [11].
The trends of food delivery service are still increasing, especially in urban areas. Food delivery requires greater use of packaging and containers, most of which are made of plastic, especially single-use plastic (SUP). Reported plastic waste generation was to be 6,300 tons per day during COVID-19 or about 15% higher than normal in Thailand [12]. A material flow analysis of plastic consumption associated with food delivery in South Korea showed 600,000 tonnes of disposed plastics annually, including bottles, cups, and plastic bags [13]. About 8–12 million metric tonnes of plastic generated on land ended up in oceans in 2018, contributing to plastic pollution [14]. Macroplastics can break down into microplastics and accumulate in the environment, organisms, and food products. Several initiatives worldwide have been proposed to prevent plastic from entering the environment [15]. The ban on SUP and the use of reusable bags has been found to be effective preventive measures in reducing plastic waste [16].
Thailand is one the countries facing municipal solid waste management (MSWM) problems. In 2024, Thailand generated a total MSW of 27.2 million tonnes, or 74,529 tonnes per day, with the generation rate of 1.15 kg/capital/day [17]. Approximately 10.42 million tonnes (38%) were properly disposed of, and 10.51 million tonnes (39%) were utilized. The remaining 6.27 million tonnes (23%) were disposed of by improper methods, such as open dumping and open burning. The MSW composition analysis at a disposal site found that the highest component was food waste (36.79%) and was followed by plastic waste (29.38%). In 2022, the reported SUP was 2.83 million tonnes of the total waste generated, which was higher than the 2.76 million tonnes generated in 2021. Although Thailand has a roadmap of plastic waste management during 2018-2030, the plastic waste. The objective of the roadmap is to reduce and ultimately eliminate the use of plastic by replacing it with more environmentally friendly materials. According to the roadmap, Phase-1 aimed to ban the uses of OXO-degradable plastic and microbeads by the end of 2019. Phase-2, aims to ban four types of SUPs by the end of 2022. The progress report of the roadmap in 2023 found that Thailand did not achieve some targets of plastic waste management [18].
Due to job opportunities, facilities support, and destination of tourists Bangkok is the capital city of Thailand with lot of population. Solid waste problem has increased and causing pollution problem as reported by Pollution Control Department of Thailand [17]. The problem of solid waste is not only the huge amount of waste generation but also the composition of urban waste has significantly changed due to change the consumption pattern. With the convenience of online platforms, consumers increasingly rely on food delivery via application, resulting in single-use packaging materials such as plastic containers, bags, and utensils. These materials served in short-term convenience but pose long-term problems of urban waste management. Food packaging is a major source of SUP, typically contaminated by food residues. Most SUP is discarded with other MSW, ultimately ending up in landfills.
Understanding the urban waste composition and trends of online food delivery consumption is necessary for urban waste management. Therefore, this research aimed to assess the urban waste composition associated with online food delivery in Bangkok metropolitan, focusing on food delivery consumption behavior, and plastic waste generated from food delivery. The waste composition was collected and sorted at a transfer station of authority in Bangkok metropolitan. Online questionnaires were employed to collect data from customers about online food delivery consumption and waste generation. The results of this research were used to provide data-driven recommendations for improving urban waste management and reducing the environmental footprint of food delivery consumption.
2. Materials and Methods
2.1. Data Collection
2.2. MSW Sampling and Sorting
MSW samples were collected at some residential areas prior to loading garbage trucks during January to December 2024 and were collected by following sorted according to ASTM D 5231-92 [20]. The physical composition was analyzed using the quartering method. The manual sorting is classified into ten categories: food waste, plastics, paper and cardboard, rubber and leather, textile, wood and yard waste, glass, metal and aluminium, hazardous waste, and others. Each category was weighted and calculated in percentage proportion.
2.3. Questionnaire Design for Data Collection
The questionnaires were divided into three sections; Section-1 demographic information of participants (gender, age, income, educational level, residence type, number of household member), Section-2 online food delivery consumption and waste generation related to food delivery ordering, and Section-3 attitude on plastic waste consumption on food delivery service. The content of online questionnaires was developed and reviewed for accurate [21,22]. The content validation of the questionnaires was approved by three experts in the study field, resulting in an Index of Item Objective Congruence of 0.98. The questionnaires were approved by the Human Research Ethics Committee, Thammasat University (Ref. COA No. 094/2564). The data were collected via the online platform of Microsoft Forms and a link created to share this questionnaire with those interested. Non-probability sampling was employed, specifically accidental sampling. Any participant who experienced discomfort while responding to the questionnaire had the right to discontinue participation at any point. The data was not recorded until the questionnaires were fully completed and the participants confirmed submission.
2.4. Sampling Size and Criteria
The number of sample sizes was calculated using Equation (1), which was 385 participants.
(1)
where,
n is the number of sample size
z is z-score with a 95% confidence level, 1.96
e is 5% margin of error, 0.05
p is 50% population proportion, 0.5
The inclusion criteria required participants to be of Thai nationality aged 18 years or older and residing in Bangkok metropolitan, and to have previously used an online food delivery platform. Participants’ personal information was protected in accordance with the approved ethical protocol.
2.5. Data Analysis
The waste composition was reported as average values. Descriptive statistics were employed to summarize participants’ demographic characteristics, food delivery consumption behavior, plastic waste generation associated with food delivery, and attitude on plastic waste from food delivery. All data were anonymized to ensure that no individual participant could be identified.
3. Results
3.1. Population Number of Bangkok City
3.2. MSW Generation and Generation Rate
MSW generated in Bangkok was increased by 4.9% from 2021 to 2024 (Figure 2), with the generation rate about double of Thailand as shown in Figure 3. Waste generation rates were 2.1, 1.2, 0.79, and 0.6 kg/capita/day with high income, upper middle income, lower middle income, and low-income countries, respectively. Waste generation per capita in the high-income countries were 3.5 times higher than the waste generated in the low-income countries [23]. The waste generation rates in urban areas and rural areas in Mandalay, Myanmar, were found to be 0.91, and 0.37, respectively [24].
3.3. MSW Composition Analysis
The MSW was collected from residential areas that represented household sources in Bangkok metropolitan by following ASTM D 5231-92 [20]. The represent physical composition was analyzed using the quartering method and manual sorted into ten categories (Figure 4). The Bangkok MSW composition was shown in Table 1. The major MSW was food waste (39.3%), followed by plastic (26.9%), paper and cardboard (16.1%). The waste composition in this study was similarly to the reported waste composition of Thailand in 2024, food waste (36.79%) and plastics (29.38%), and paper (4.58%) [17]. Whereas, MSW composition was changed from the last five years, as reported the city municipality in Thailand was food waste (65.17%), plastic (17.0%), and paper (7.21%) [25]. Also, the most of MSW composition was food waste (43.1%), plastic (16.6%), and paper (13.0%) in Bangkok city [26]. Food waste composition was noticed decreasing, otherwise the plastic and paper trends to increase. Plastic and paper wastes increased may cause the consumption behavior changed or life pattern changed. The urbanization provided the online service platform, all things can deliver to the customer required. A lot of packaging waste increased in waste composition, SUP, paper and cardboard. This waste type increased the proportion of non-degradable waste which ended up to landfilling. The result of this study varied from previous report in group of upper middle income with organic waste (54%), paper (14%), and plastic (11%) [23]. In addition, the major of waste composition in all income levels were organic waste and highest composition in low-income countries and followed by low middle income countries of 64%, and 59%, respectively. Physical composition in urban areas was organic waste (82.7%), plastic (10.4%), and paper and cardboard (3.2%) [24]. Additionally, it was found that the hazardous waste contamination in MSW is without separation such as chemical containers, batteries, infectious waste including medical masks and antigen test kits. The direct exposure of hazardous and infectious wastes may be affected by the health risk of waste pickers. Increasing awareness of health hazards and environmental contamination must be required.
3.4. Demographics Information of Participants
Online questionnaire collected data of demographic information of participants. The survey resulted in a total of 385 participants was obtained from January to December 2024. as shown in Table 2. More than half of participants was female (55.3%) and male (42.9%). The major participant was aged in the range of 26–35 years (37.3%), monthly income of 25,001 to 50,000 THB or 730 to 1,460 USD (39.5%). In terms of the education level, the participants have graduate qualifications, about 47.3% of the total. Approximately 51.4% of participants lived in detached houses, and family member of 3–5 persons (40.5%). As the results, gender and age range of participants who have experienced food ordering via online delivery was similarly to a previous study which observed in various countries [22,27]. Monthly income was influenced by consumer behavior for online food delivery during the COVID-19 pandemic in Bangkok [27]. However, the level of education showed that 61.4% had post-graduate qualifications and 33.2% were graduates of the total participants [22]. The types of residence varied in each location studied. For example, in the Bangkok area, most respondents lived in dormitories or shared houses, comprising 33.0% of the total [28].
3.5. Online Food Delivery Consumption Behavior
A total of 385 participants has experiences with food delivery via online platforms. As the results, the food delivery consumption increased by 76.6% of the total participants, since the COVID-19 pandemic. The reasons for selecting food delivery services were convenience and fast delivery, cited by 71.1% of participants, followed by price (22.1%), and other reasons (6.8%), discount coupons and multi-order from various restaurants. The competition of online platforms would like to show the campaign for customers via online ordering, which was an attractive option. This result was similarly to the reported by Liu for increasing food delivery since COVID-19 pandemic [28]. The frequency of food delivery with 51.4% ordering 3–5 times per week, 27.3% ordering 1–2 times per week, and 21.3% ordering more than 5 times per week. Effects of platform brand had not an influence on food ordering of 65.5%. The results of the food delivery consumption survey as presented in Figure 5. The results of this study were similarly to those reported by Filho; food delivery consumption increased by 46.0% of the total survey participants [22]. The estimated number of platform-to-consumer users is expected to reach 427 million in 2024, up from 263 million users in 2019 [8]. During the COVID-19 pandemic, the food deliver platform grew by 78–84% in Thailand [11]. Although, it in return to the normal situation, the lifestyle and consumption pattern have changed. The online platform or e-commerce was served and supported new patterns of human life.
3.6. Waste Generation Related to Online Food Delivery
According to the survey results of waste generation that related to food delivery, about 66.0% of the participants confirmed that household waste generation increased, no change 20.8%, and decreased 13.2%. It has been reported that there has been an increased demand for food delivery and an increase in waste generation, especially plastic waste [29]. The composition of household waste generation observed by participants indicates notable changes since the COVID-19 outbreak. As the results, there was about 75.4% increase in SUP and 62.1% increase in food waste among participants in the household waste category, as presented in Figure 6. Trends in plastic waste generation were similarly to a previous report of increased plastic waste in Bangkok during the COVID-19 pandemic [30]. The highest increase was observed for plastic packaging and food waste, with an increase of 53% and 45%, respectively, during the lockdown [22]. About 76% of participants indicated that the amount of food waste generation increased with the rise of online food delivery [28]. Additionally, increased use of SUP occurred in the form of items like take-away packaging from restaurants [31]. This result was confirmed that growth of food delivery business contributed to increase of household waste generation and changed in household waste composition.
3.7. SUP from Online Food Delivery
Ordering food from online platforms result in produce waste packaging, especially plastic waste. SUP generated from order of beverage delivery included plastic cup, plastic bottle, plastic straw, plastic lid, plastic bag, and plastic wrap. SUP from order of food delivery includes at least food packaging, plastic bag, plastic film, plastic cutlery, plastic cup, plastic lid, and others; condiments or seasoning packages (Figure 7). Solid waste from online food delivery is not only plastic but also paper, cardboard, rubber, wood, etc. The variation of SUP generation is related to type of order. Most participants agreed with the increase in SUP due to the high demand for food delivery since the COVID-19 outbreak. SUP has increased along with food delivery in Thailand [32]. The top four wastes generated from food delivery were plastic bags, followed by hot-and-cold food bags, plastic food containers, and food waste [28]. A total of 72.93 kt of plastic packaging was consumed by online food delivery in 2020, especially SUP in South Korea [33]. The COVID-19 pandemic has exacerbated the consumption of SUP in restaurants due to the growing preference for food delivery services [8]. Typically, food plastic packaging waste is contaminated by food residues, making it difficult to separate for further benefit. Therefore, most plastic packaging is disposed by landfilling method [34,35]. Despite efforts by the Thai government to reduce the SUP from food delivery platforms through memorandum of understanding (MOU) with the popular platforms such as LINE MAN, GrabFood, Foodpanda, and GetFood, the amount of SUP wastes has not decreased [18]. Figure 8 shows green choice of SUP decline in online food delivery platform. This choice would like to make an option to reduce SUP waste from food ordering.
Approximately 75.0% of the total food delivery packaging waste in weight is made of polypropylene (PP) and polystyrene (PS) foam [34]. Most plastic packaging is used only once and then discard because it is not suitable for reuse or recycling. Consequently, these plastic materials from food delivery become wasteful and end up in landfills or are mismanaged, without proper environmental protection. These macroplastics can break down into plastic debris (microplastics or nanoplastics), contaminating the environment and accumulating in the food chain and food web [36]. As the results, online food delivery was the major source of SUP generation which changed in plastic waste composition in household waste. Therefore, an increased awareness to declined plastic consumption from online food delivery may reduce plastic waste from household sources.
3.8. Attitude on SUP Consumption from Online Food Delivery
Table 3 presents the survey results regarding the attitude of SUP consumption. Approximately 71.4% of the total participants know that online platforms offer an option for SUP reject (e.g. plastic spoon, plastic cutlery, plastic straw, etc.). However, only 58.9% of these participants choose this option. Among this group, the majority declined plastic spoon (42.0%) and plastic cutlery (36.4%) when ordering online food delivery. Although the reduction of SUP through the green choice option on platform is promising, food packaging remains the primary source of SUP waste from online food delivery. The suggestion from previously, food packaging or containers should be made of biodegradable or environmentally friendly materials [22]. Based on the results of this study, 51.7% of participants did not agree with the sustainable policy of fee for SUP when ordering online food delivery. Generally, customers expected to receive service similarly to dining at a restaurant as well as same quality service standard of customers.
3.9. Plastic Waste Management from Online Food Delivery
Plastic waste generated from online food delivery, approximately 24.9% of participants separated recyclable plastic waste from other wastes. Non-recyclable SUP is mixed discard with others waste types. Due to the SUP packaging quality, participants of 86.9% did not reuse food containers. Most of participants (74.5%) did not segregate food waste before discarding plastic waste, resulting in bad odor by organic compound degradation.
4. Discussion
The urbanization effects on MSW generation and compositions in Bangkok metropolitan. Based on the results, MSW increased from 2020 to 2024, and physical compositions changed with plastic waste increased. Growth of online food delivery in urban areas is resulting in negative effect in terms of plastic waste packaging. Survey information from participant’ customers of online food delivery shows used online food delivery increased by 76.6% of the total participants. Due to convenience for the life pattern in urban areas, participants choose online food delivery.
Participants confirmed that online food delivery increases generating of SUP in household waste. SUP from food delivery was not necessitate, plastic film, spoon, and cutlery. In adequate of SUP waste caused of plastic pollution that contaminates in environment and health impacts. Although online food delivery platforms have green choice to decline SUP consumption, the participants did not check the option. The food packaging is made from PP and PS that are non-degradable and fragment microplastic in environment. Plastic waste management is challenge in Thailand, the plastic waste management road map during 2018 to 2030 did not achieve the target.
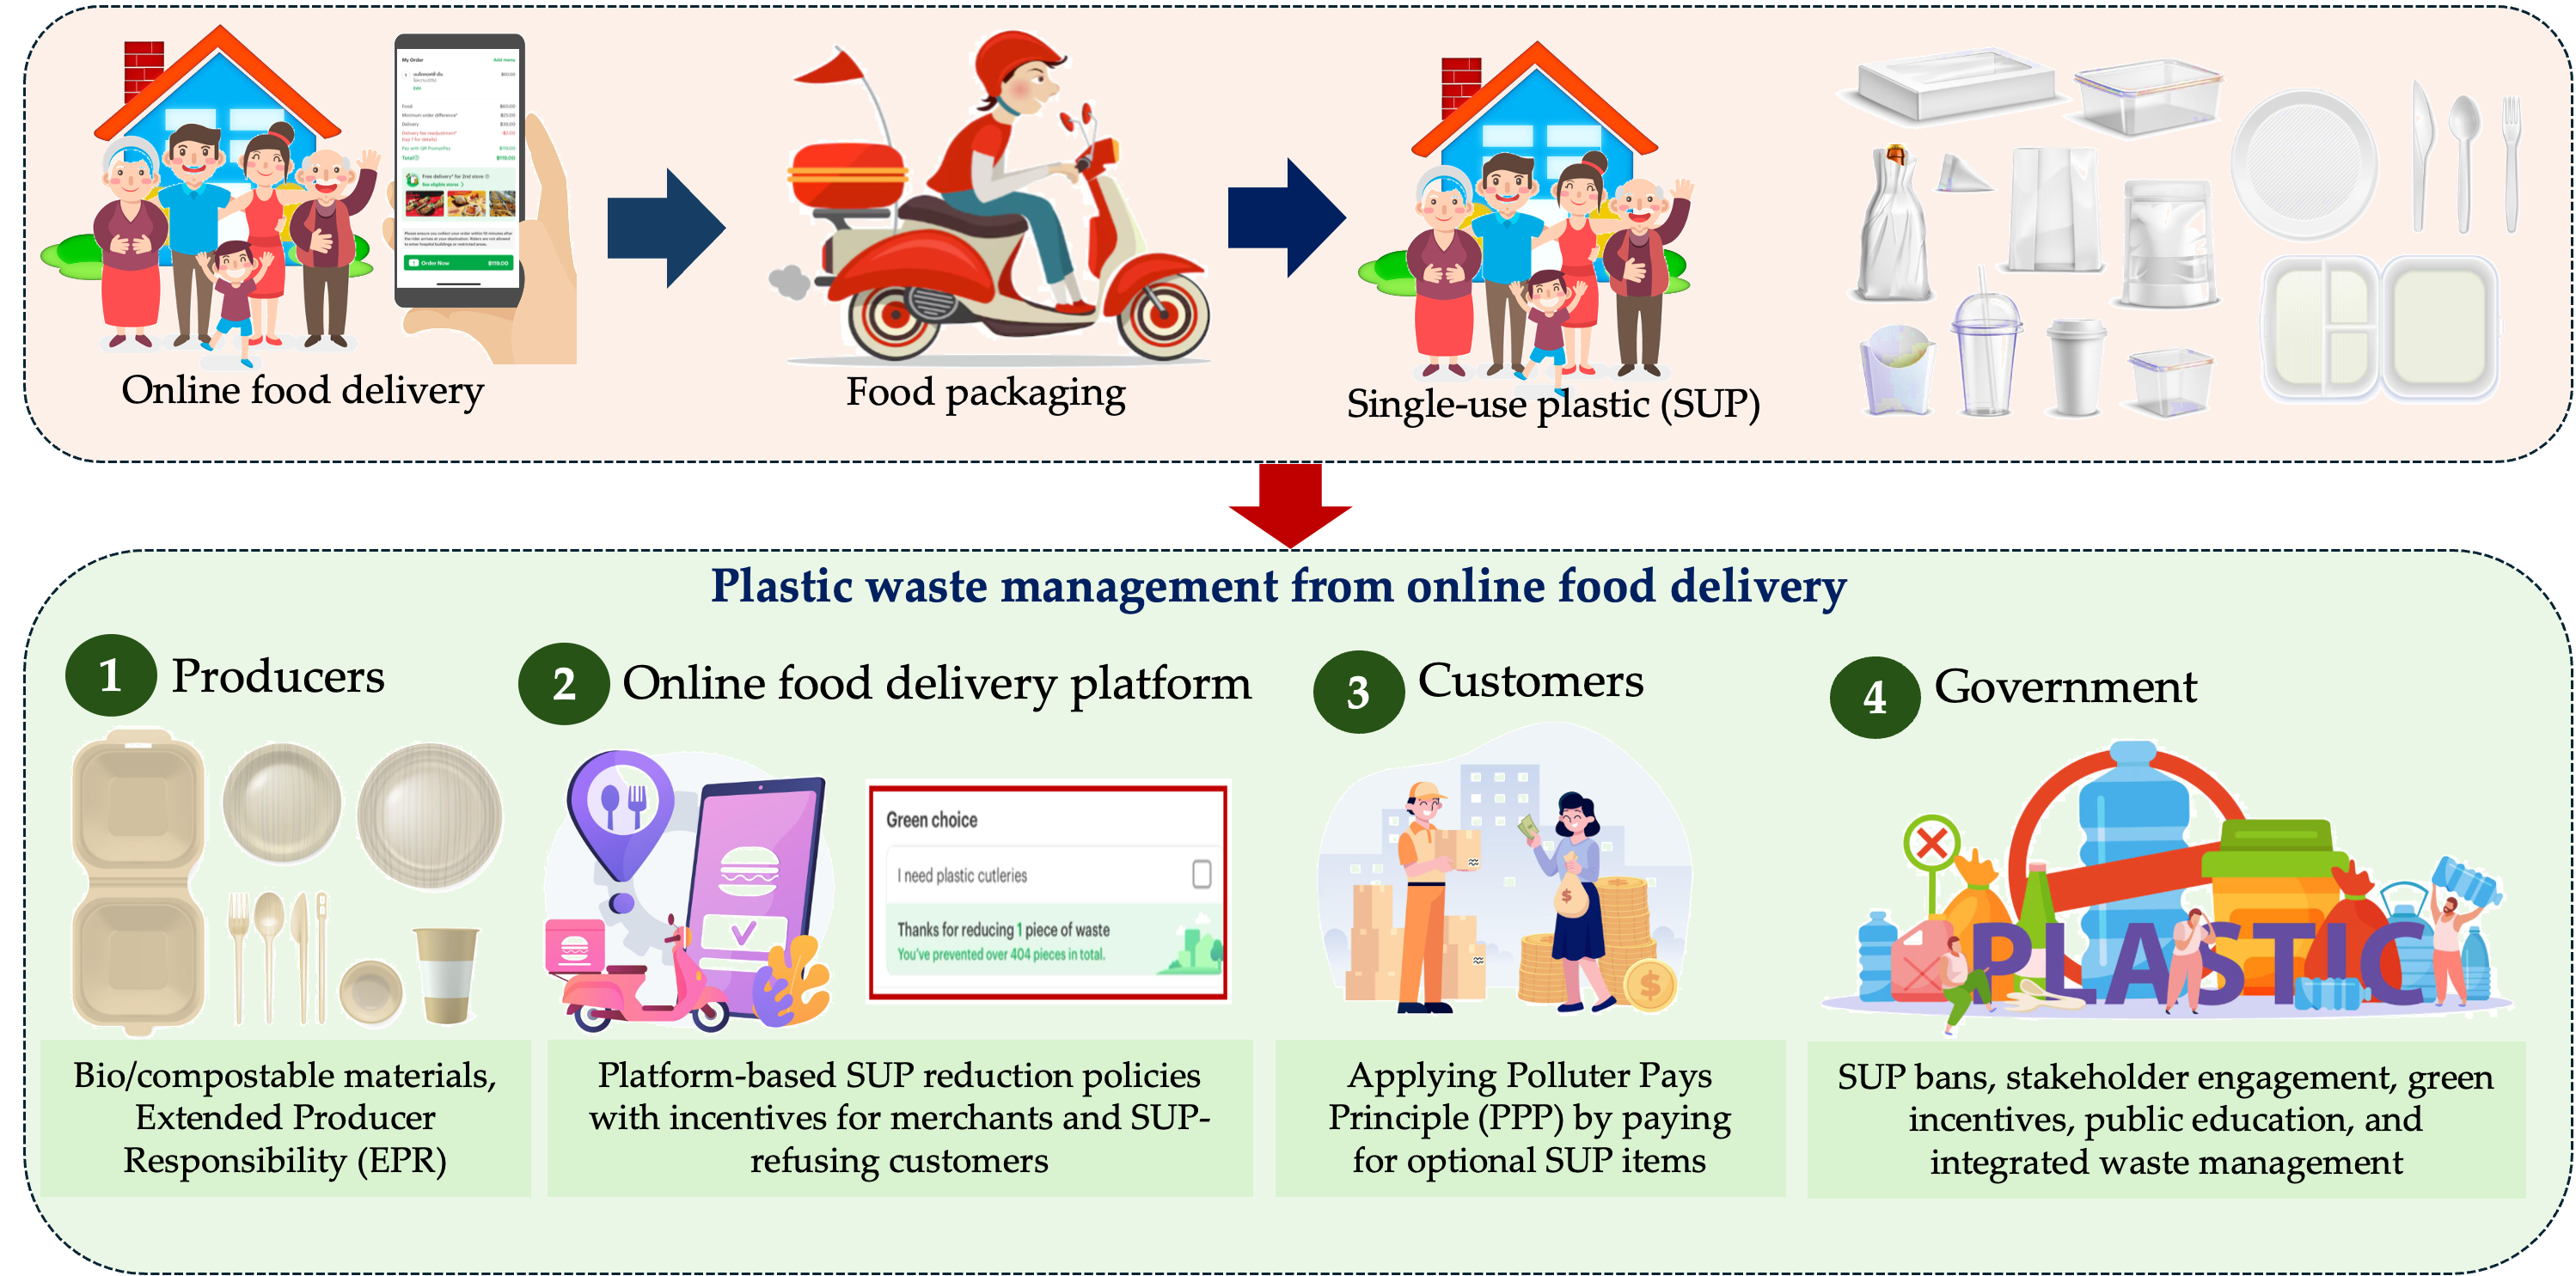
Based on this study, suggestion to plastic waste management is include 4 sectors; 1) producers: develop the alternative of food packaging product made by bio-material, composable-material or environmental friendly, the producer must be response on their product at the end of use in concept of extended producer responsibility (EPR), 2) online food delivery platform: deliver policy to reduce SUP in online platforms and increase incentive for online merchants in cooperation, as well as customer incentive who decline SUP, 3) customers: part of SUP consumption must be response on plastic waste pollution by apply concept of polluter-pay-principle (PPP), customers must pay for special require of SUP for food delivery (e.g. spoon, straw, cutlery), and 4) government: ban SUP policy and announce to all stakeholders (e.g. non-governmental organization (NGO), people, and producers), and enhance incentive in producer groups; tax reduce in environmental friendly products, educate to people in plastic waste reduction and separation at source. Moreover, government should design and plan for SUP management and final disposal methods. Plastic waste management required various stakeholders to achieve the loop of management. The suggestion for future research should include sub-urban area to prepare the plastic waste management and the MSWM system in effectively.
5. Conclusions
Based on these results, the following could be concluded.
- 1)
- MSW generation in Bangkok metropolitan increased during 2020-2024.
- 2)
- The proportion of plastic waste increased in MSW composition.
- 3)
- Online food delivery consumption increased with life pattern in urbanization.
- 4)
- SUP generation in households increased that related to online food delivery.
- 5)
- Choices to decline SUP in online food delivery platforms are not effective for customers.
- 6)
- Enhance efficiency of plastic waste management in online food delivery platforms, require various stakeholders including producers, food delivery platforms, customers, government, NGOs and people.
Author Contributions
Conceptualization, Y.S. and N.E.; methodology, N.E.; data curation, Y.S. and N.E.; writing—original draft preparation, C.P., Y.S. and N.E.; writing—review and editing, Y.S. and N.E.; supervision, C.P.; funding acquisition, N.E. All authors have read and agreed to the published version of the manuscript.
Funding
This study received support from the Thammasat University Research Fund, Contract No. TUFT 98/2564.
Data Availability Statement
The data presented in this study are available in section MDPI Research Data Policies.
Conflicts of Interest
The authors declare no conflicts of interest.
References
- Silva, L.D.; Prietto, P.D.M.; Korf, E.P. Sustainability indicators for urban solid waste management in large and medium-size worldwide cities. J. Clean. Prod. 2019, 237, 117802.
- United Nations Environment Programme (UNEP). Global Waste Management Outlook 2024: Beyond an Age of Waste—Turning Rubbish into a Resource; UNEP: Nairobi, Kenya, 2024; ISBN 978-92-807-4129-2.
- United Nations (UN). The Sustainable Development Agenda. Available online: https://www.un.org/sustainabledevelopment/sustainable-development-goals/(accessed on 15 July 2025).
- Voukkali, I.; Papamichael, I.; Loizia, P.; Zorpas, A. Urbanization and solid waste production: Prospects and challenges. Environ. Sci. Pollut. Res. 2024, 31, 17678–17689.
- Verma, R.L.; Borongan, G. Emissions of greenhouse gases from municipal solid waste management system in Ho Chi Minh City of Viet Nam. Urban Sci. 2022, 6, 78.
- Li, Y.; Zhang, S.; Liu, C. Research on greenhouse gas emission characteristics and emission mitigation potential of municipal solid waste treatment in Beijing. Sustainability 2022, 14, 1–17.
- Pan, A.; Yu, L.; Yang, Q. Characteristics and forecasting of municipal solid waste generation in China. Sustainability 2019, 11, 1433.
- Janairo, J.I.B. Unsustainable plastic consumption associated with online food delivery services in the new normal. Clean. Responsib. Consum. 2021, 2, 1–5.
- Charm, T.; Grimmelt, A.; Kim, H.; Robinson, K.; Lu, N.; Yvonne, M.M.O.; Yamakawa, N. Consumer Sentiment and Behavior Continue to Reflect the Uncertainty of the COVID-19 Crisis. Available online: https://www.mckinsey.com/capabilities/growth-marketing-and-sales/our-insights/a-global-view-of-how-consumer-behavior-is-changing-amid-covid-19#/ (accessed on 15 February 2025).
- Blumtritt, C. Online Food Delivery Report 2020. Available online: https://scholar.google.com/scholar?q=Blumtritt%2C%20C.%20(2020).%20Online%20food%20delivery%20report%202020 (accessed on 1 March 2025).
- Kasikorn Research Center. Competition among Food Delivery Apps Continues to Push Food Delivery Business to THB 33–35 Billion in 2019. Available online: https://www.kasikornresearch.com/en/analysis/k-econ/business/Pages/z2995.aspx (accessed on 16 February 2025).
- Thailand Development Research Institute (TDRI). TDRI Policy Series on Fighting COVID-19. Available online: https://tdri.or.th/tag/tdri-policy-series-on-fighting-covid-19/ (accessed on 4 January 2025).
- Jang, Y.C.; Lee, G.; Kwon, Y.; Lim, J.H.; Jeong, J.H. Recycling and management practices of plastic packaging waste towards a circular economy in South Korea. Resour. Conserv. Recycl. 2020, 158, 104798.
- Bondaroff, T.P.; Cooke, S. Masks on the Beach: The Impact of COVID-19 on Marine Plastic Pollution; OceansAsia: Hong Kong, China, 2020. Available online: https://oceansasia.org/wp-content/uploads/2020/12/Marine-Plastic-Pollution-FINAL.pdf (accessed on 16 February 2025).
- Shams, M.; Alam, I.; Mahbub, S. Plastic pollution during COVID-19: Plastic waste directives and its long-term impact on the environment. Environ. Adv. 2021, 5, 100119.
- Schnurr, R.E.J.; Alboiu, V.; Chaudhary, M.; Corbett, R.A.; Quanz, M.E.; Sankar, K.; Srain, H.S.; Thavarajah, V.; Xanthos, D.; Walker, T.R. Reducing marine pollution from single-use plastics (SUPs): A review. Mar. Pollut. Bull. 2018, 137, 157–171.
- Pollution Control Department (PCD); Ministry of Natural Resources and Environment. Thailand State of Pollution Report 2024; PCD: Bangkok, Thailand, 2024.
- Pollution Control Department (PCD); Ministry of Natural Resources and Environment. Thailand State of Pollution Report 2022; PCD No. 06-077; AP CONNEX Co., Ltd.: Bangkok, Thailand, 2023. Available online: https://www.pcd.go.th/publication/30311/ (accessed on 1 March 2025).
- Bangkok Metropolitan Administration (BMA). Bangkok Population by District. Available online: https://data.bangkok.go.th/dataset/bkkpopulationdistric (accessed on 1 March 2025).
- ASTM International. ASTM D5231-92: Standard Test Method for Determination of the Composition of Unprocessed Municipal Solid Waste; ASTM International: West Conshohocken, PA, USA, 2003.
- Fan, Y.V.; Jiang, P.; Hemzal, M.; Klemeš, J.J. An update of COVID-19 influence on waste management. Sci. Total Environ. 2021, 754, 142014.
- Filho, W.L.; Voronova, V.; Kloga, M.; Paço, A.; Minhas, A.; Salvia, A.L.; Ferreira, C.; Sivapalan, S. COVID-19 and waste production in households: A trend analysis. Sci. Total Environ. 2021, 777, 145997.
- Zaman, A.U. A comprehensive study of environmental and economic benefits of resource recovery from global waste management systems. J. Clean. Prod. 2016, 124, 41–50.
- Win, K.Z.; Yabar, H.; Mizunoya, T. Analysis of household waste generation and composition in Mandalay: Urban–rural comparison and implications for optimizing waste management facilities. Waste 2024, 4, 490–509.
- Sununta, N.; Sampattagul, S. Greenhouse gas emissions evaluation from municipal solid waste management and mitigation planning for municipality in Thailand. In Proceedings of the 8th International Conference on Environmental Engineering, Science and Management, The Twin Tower Hotel, Bangkok, Thailand, 23–24 May 2019; pp. 1–7.
- Eaktasang, N.; Suma, Y.; Kingkeaw, S.; Liang, L.; Mahiphot, J. Energy recovery of refuse-derived fuel components from municipal solid waste in Bangkok, Thailand. EnvironAsia. 2022, 15, 54–64.
- Chalermdan, N. Consumers’ behavior on buying delivery food via mobile application during new species of corona virus 2019 (COVID-19) in Bangkok. J. Ind. Bus. Adm. 2020, 2, 92–106.
- Liu, C.; Bunditsakulchai, P.; Zhuo, Q. Impact of COVID-19 on food and plastic waste generated by consumers in Bangkok. Sustainability 2021, 13, 1–21.
- Sharma, H.B.; Vanapalli, K.R.; Cheela, V.S.; Ranjan, V.P.; Jaglan, A.K.; Dubey, B.; Goel, S.; Bhattacharya, J. Challenges, opportunities, and innovations for effective solid waste management during and post COVID-19 pandemic. Resour. Conserv. Recycl. 2020, 162, 105052.
- Simachaya, W. Solid Waste during COVID-19. Available online: https://www.tei.or.th/en/article_detail.php?bid=49 (accessed on 5 March 2025).
- Ammendolia, J.; Walker, T.R. Citizen science: A way forward in tackling the plastic pollution crisis during and beyond the COVID-19 pandemic. Sci. Total Environ. 2022, 805, 149957.
- Kamvanin, S.; Noosorn, N. Solid waste: What is the situation during COVID-19? J. Public Health Nurs. 2020, 34, 144–157.
- Jang, Y.; Kim, K.N.; Woo, J.R. Post-consumer plastic packaging waste from online food delivery services in South Korea. Waste Manag. 2023, 156, 177–186.
- Song, G.; Zhang, H.; Duan, H.; Xu, M. Packaging waste from food delivery in China’s mega cities. Resour. Conserv. Recycl. 2018, 130, 226–227.
- Khoo, K.S.; Ho, L.Y.; Lim, H.R.; Leong, H.Y.; Chew, K.W. Plastic waste associated with the COVID-19 pandemic: Crisis or opportunity? J. Hazard. Mater. 2021, 417, 126108.
- Mallick, S.K.; Pramanik, M.; Maity, B.; Das, P.; Sahana, M. Plastic waste footprint in the context of COVID-19: Reduction challenges and policy recommendations towards sustainable development goals. Sci. Total Environ. 2021, 796, 148951.
Figure 1.
Population of Bangkok city from 2020 to 2024 [19].
Figure 1.
Population of Bangkok city from 2020 to 2024 [19].
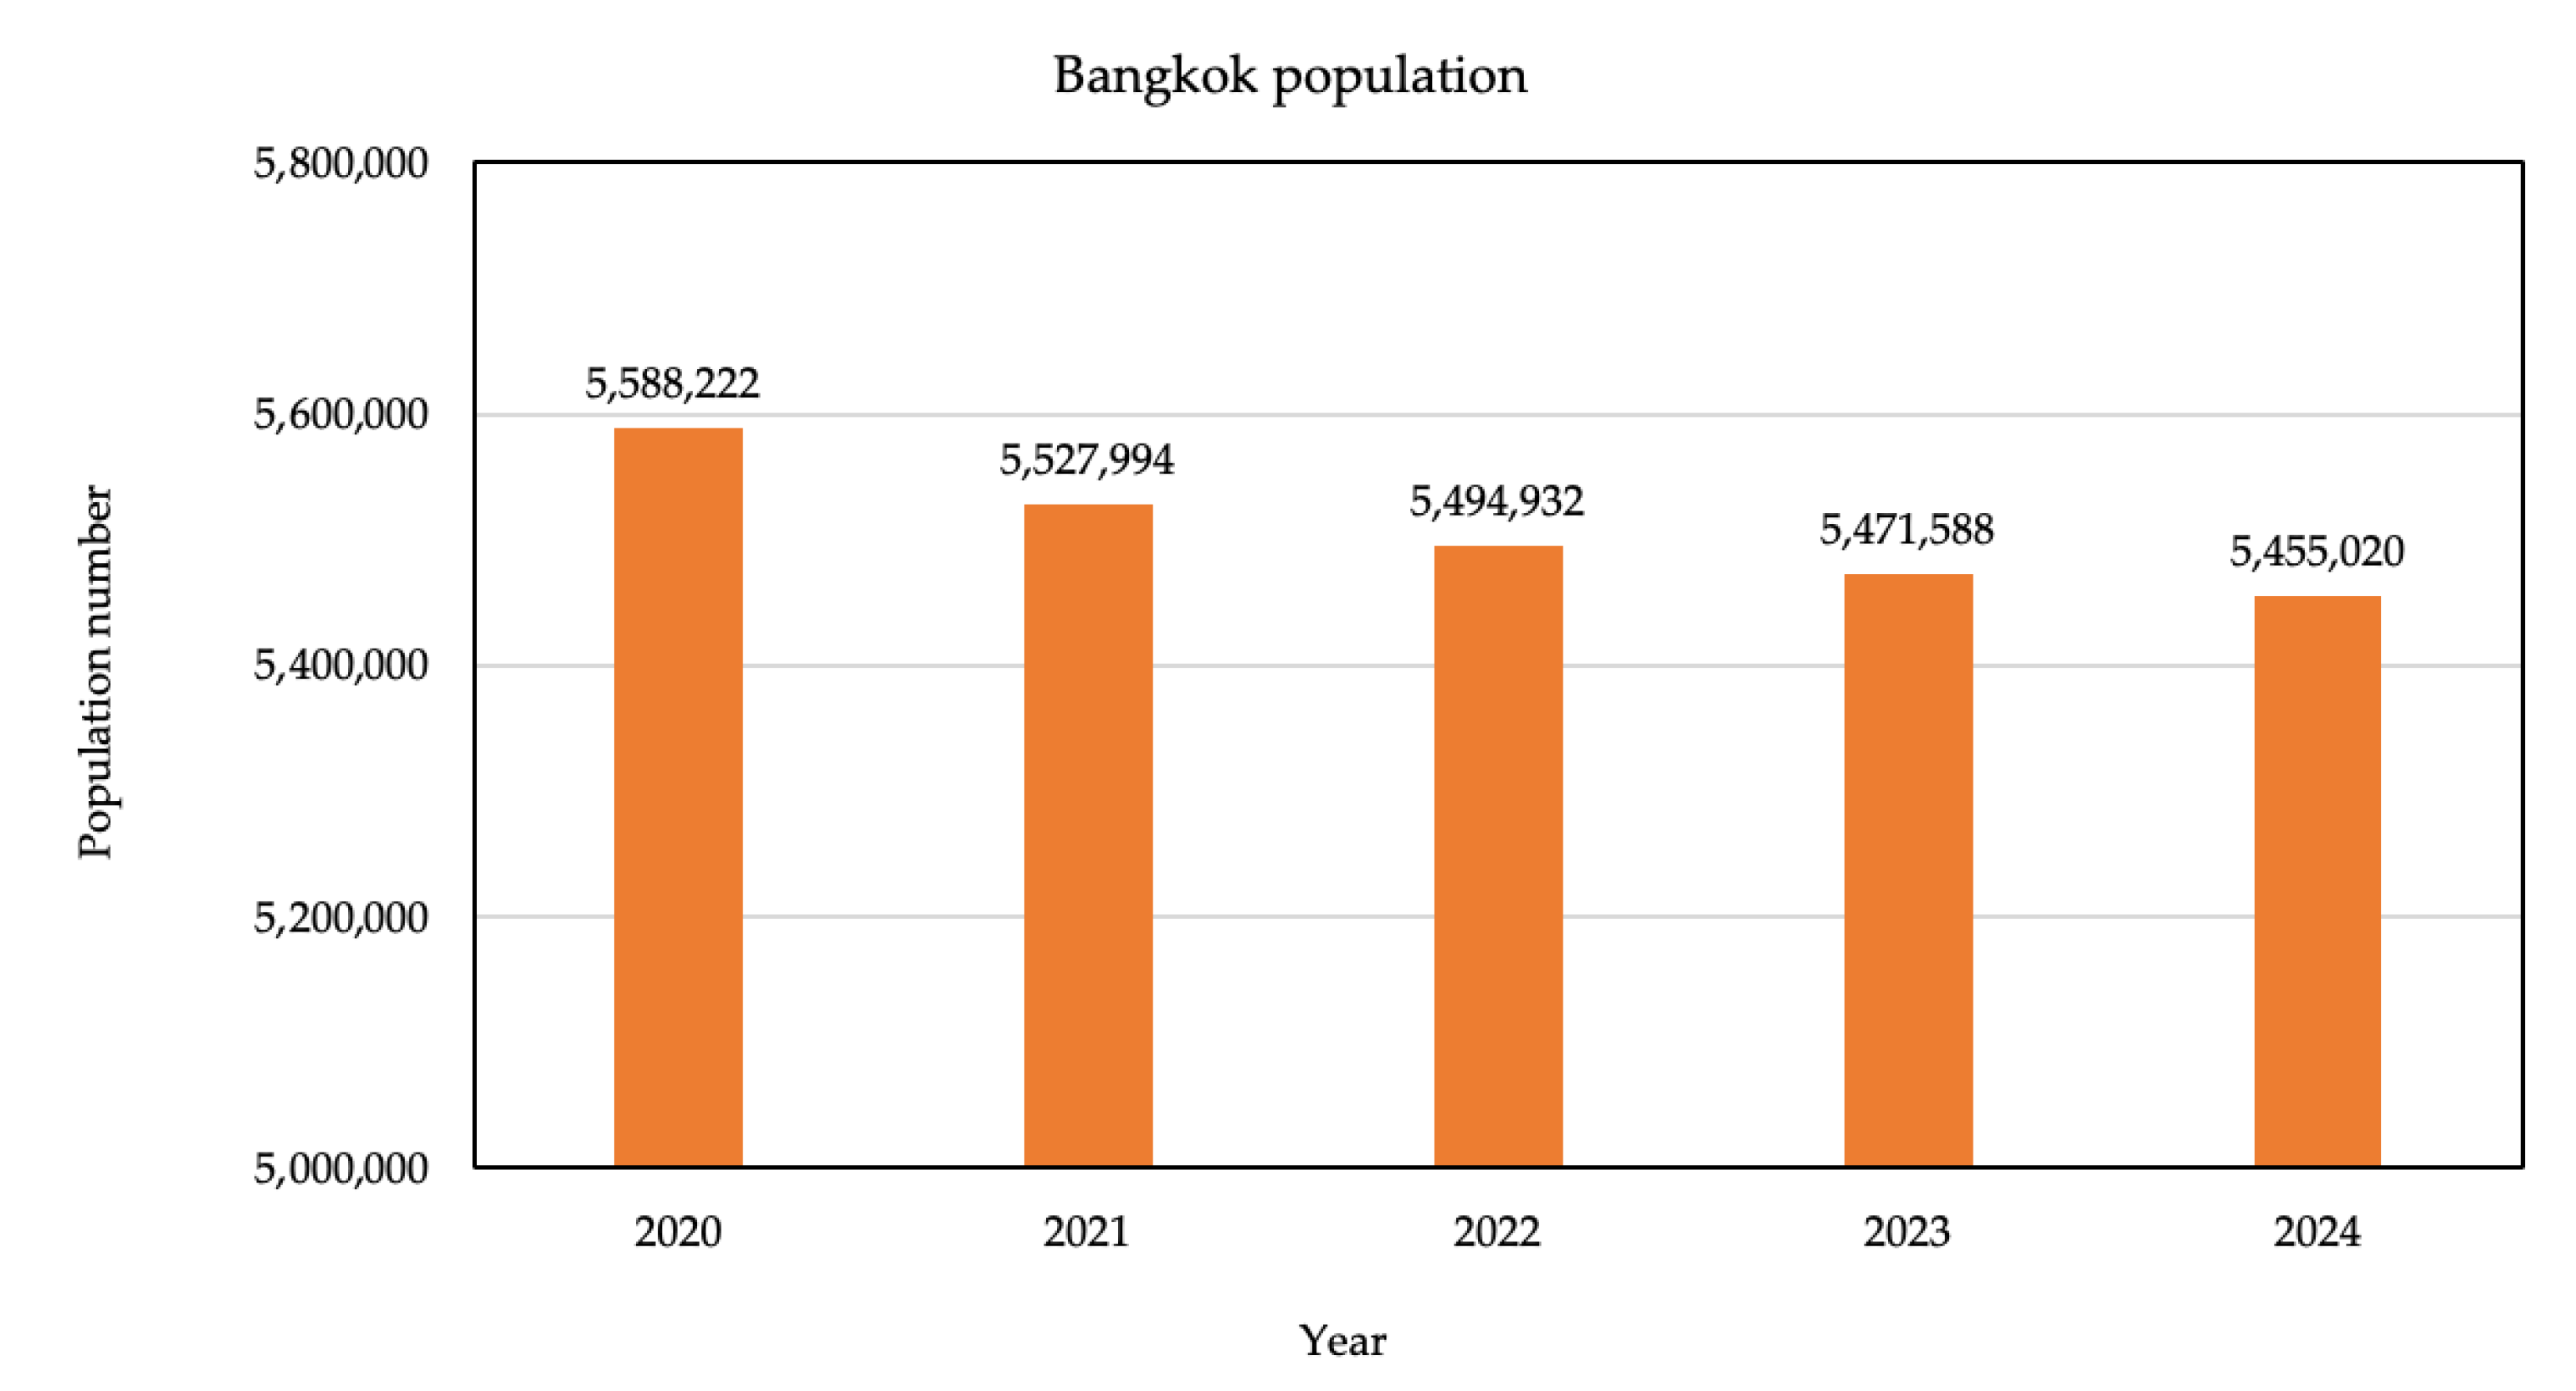
Figure 2.
MSW generation in Bangkok metropolitan from 2020 to 2024 [17].
Figure 2.
MSW generation in Bangkok metropolitan from 2020 to 2024 [17].
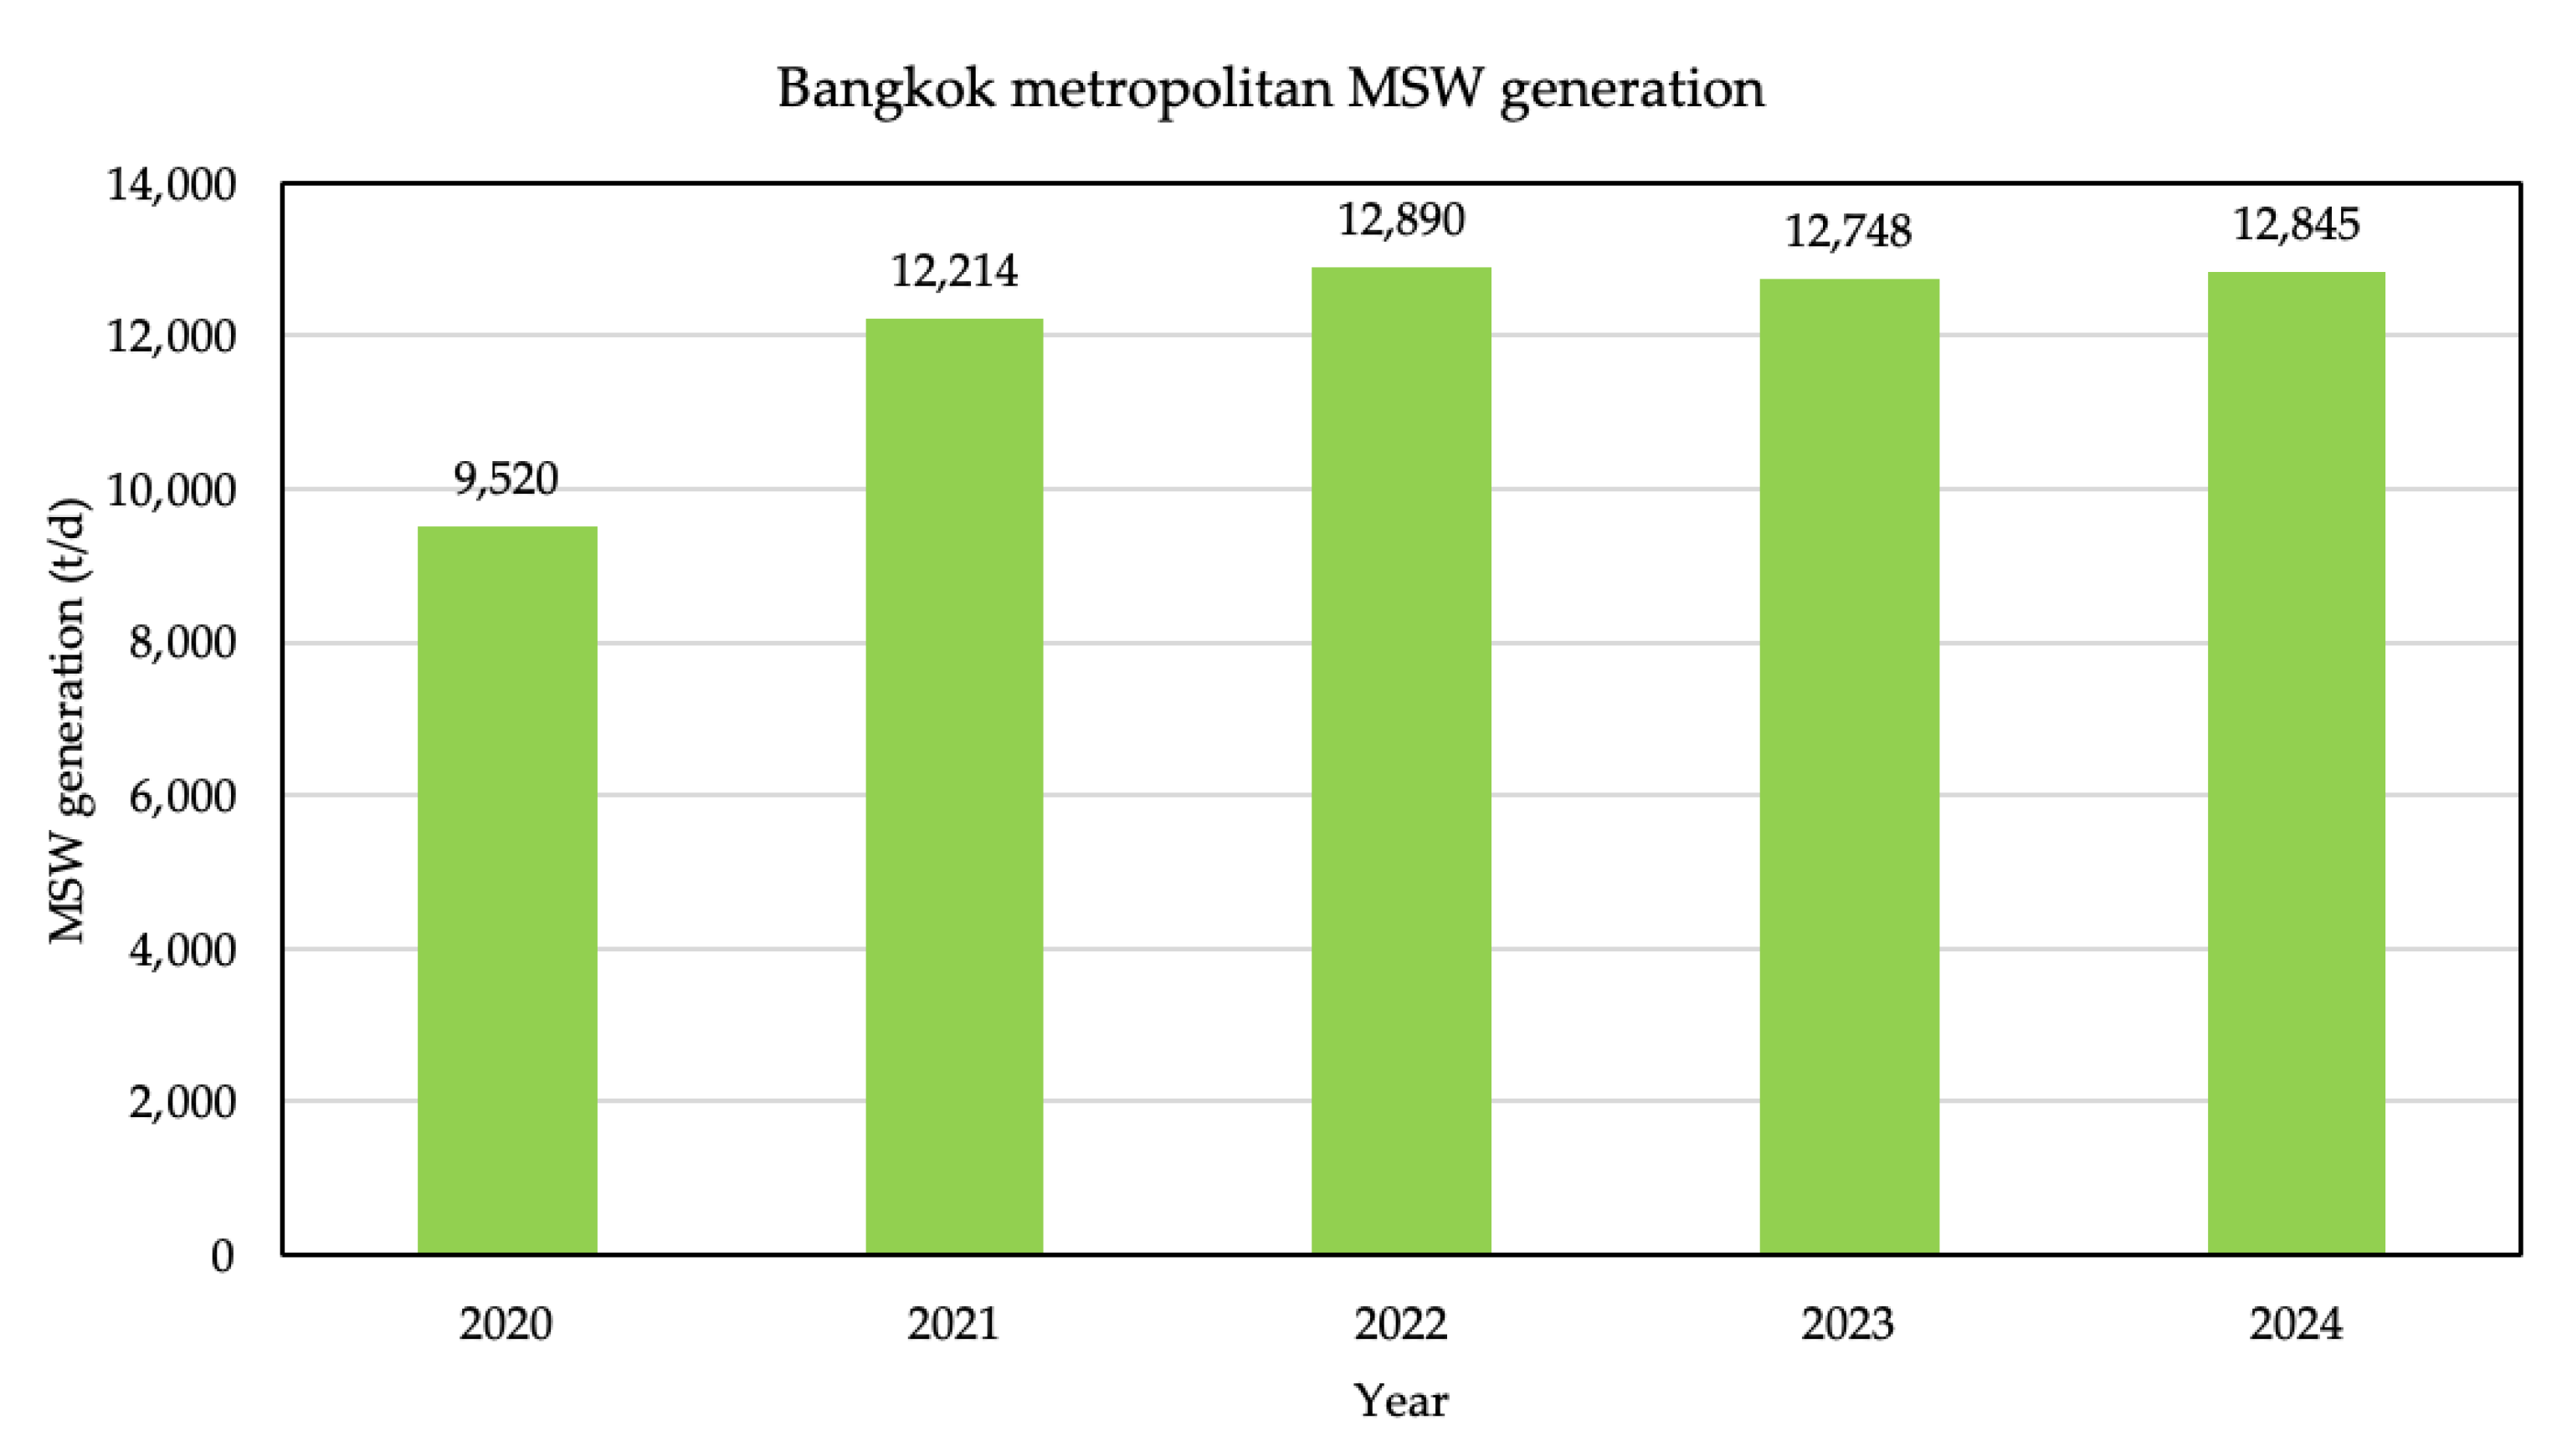
Figure 3.
MSW generation rate in Bangkok metropolitan from 2020 to 2024 [17].
Figure 3.
MSW generation rate in Bangkok metropolitan from 2020 to 2024 [17].
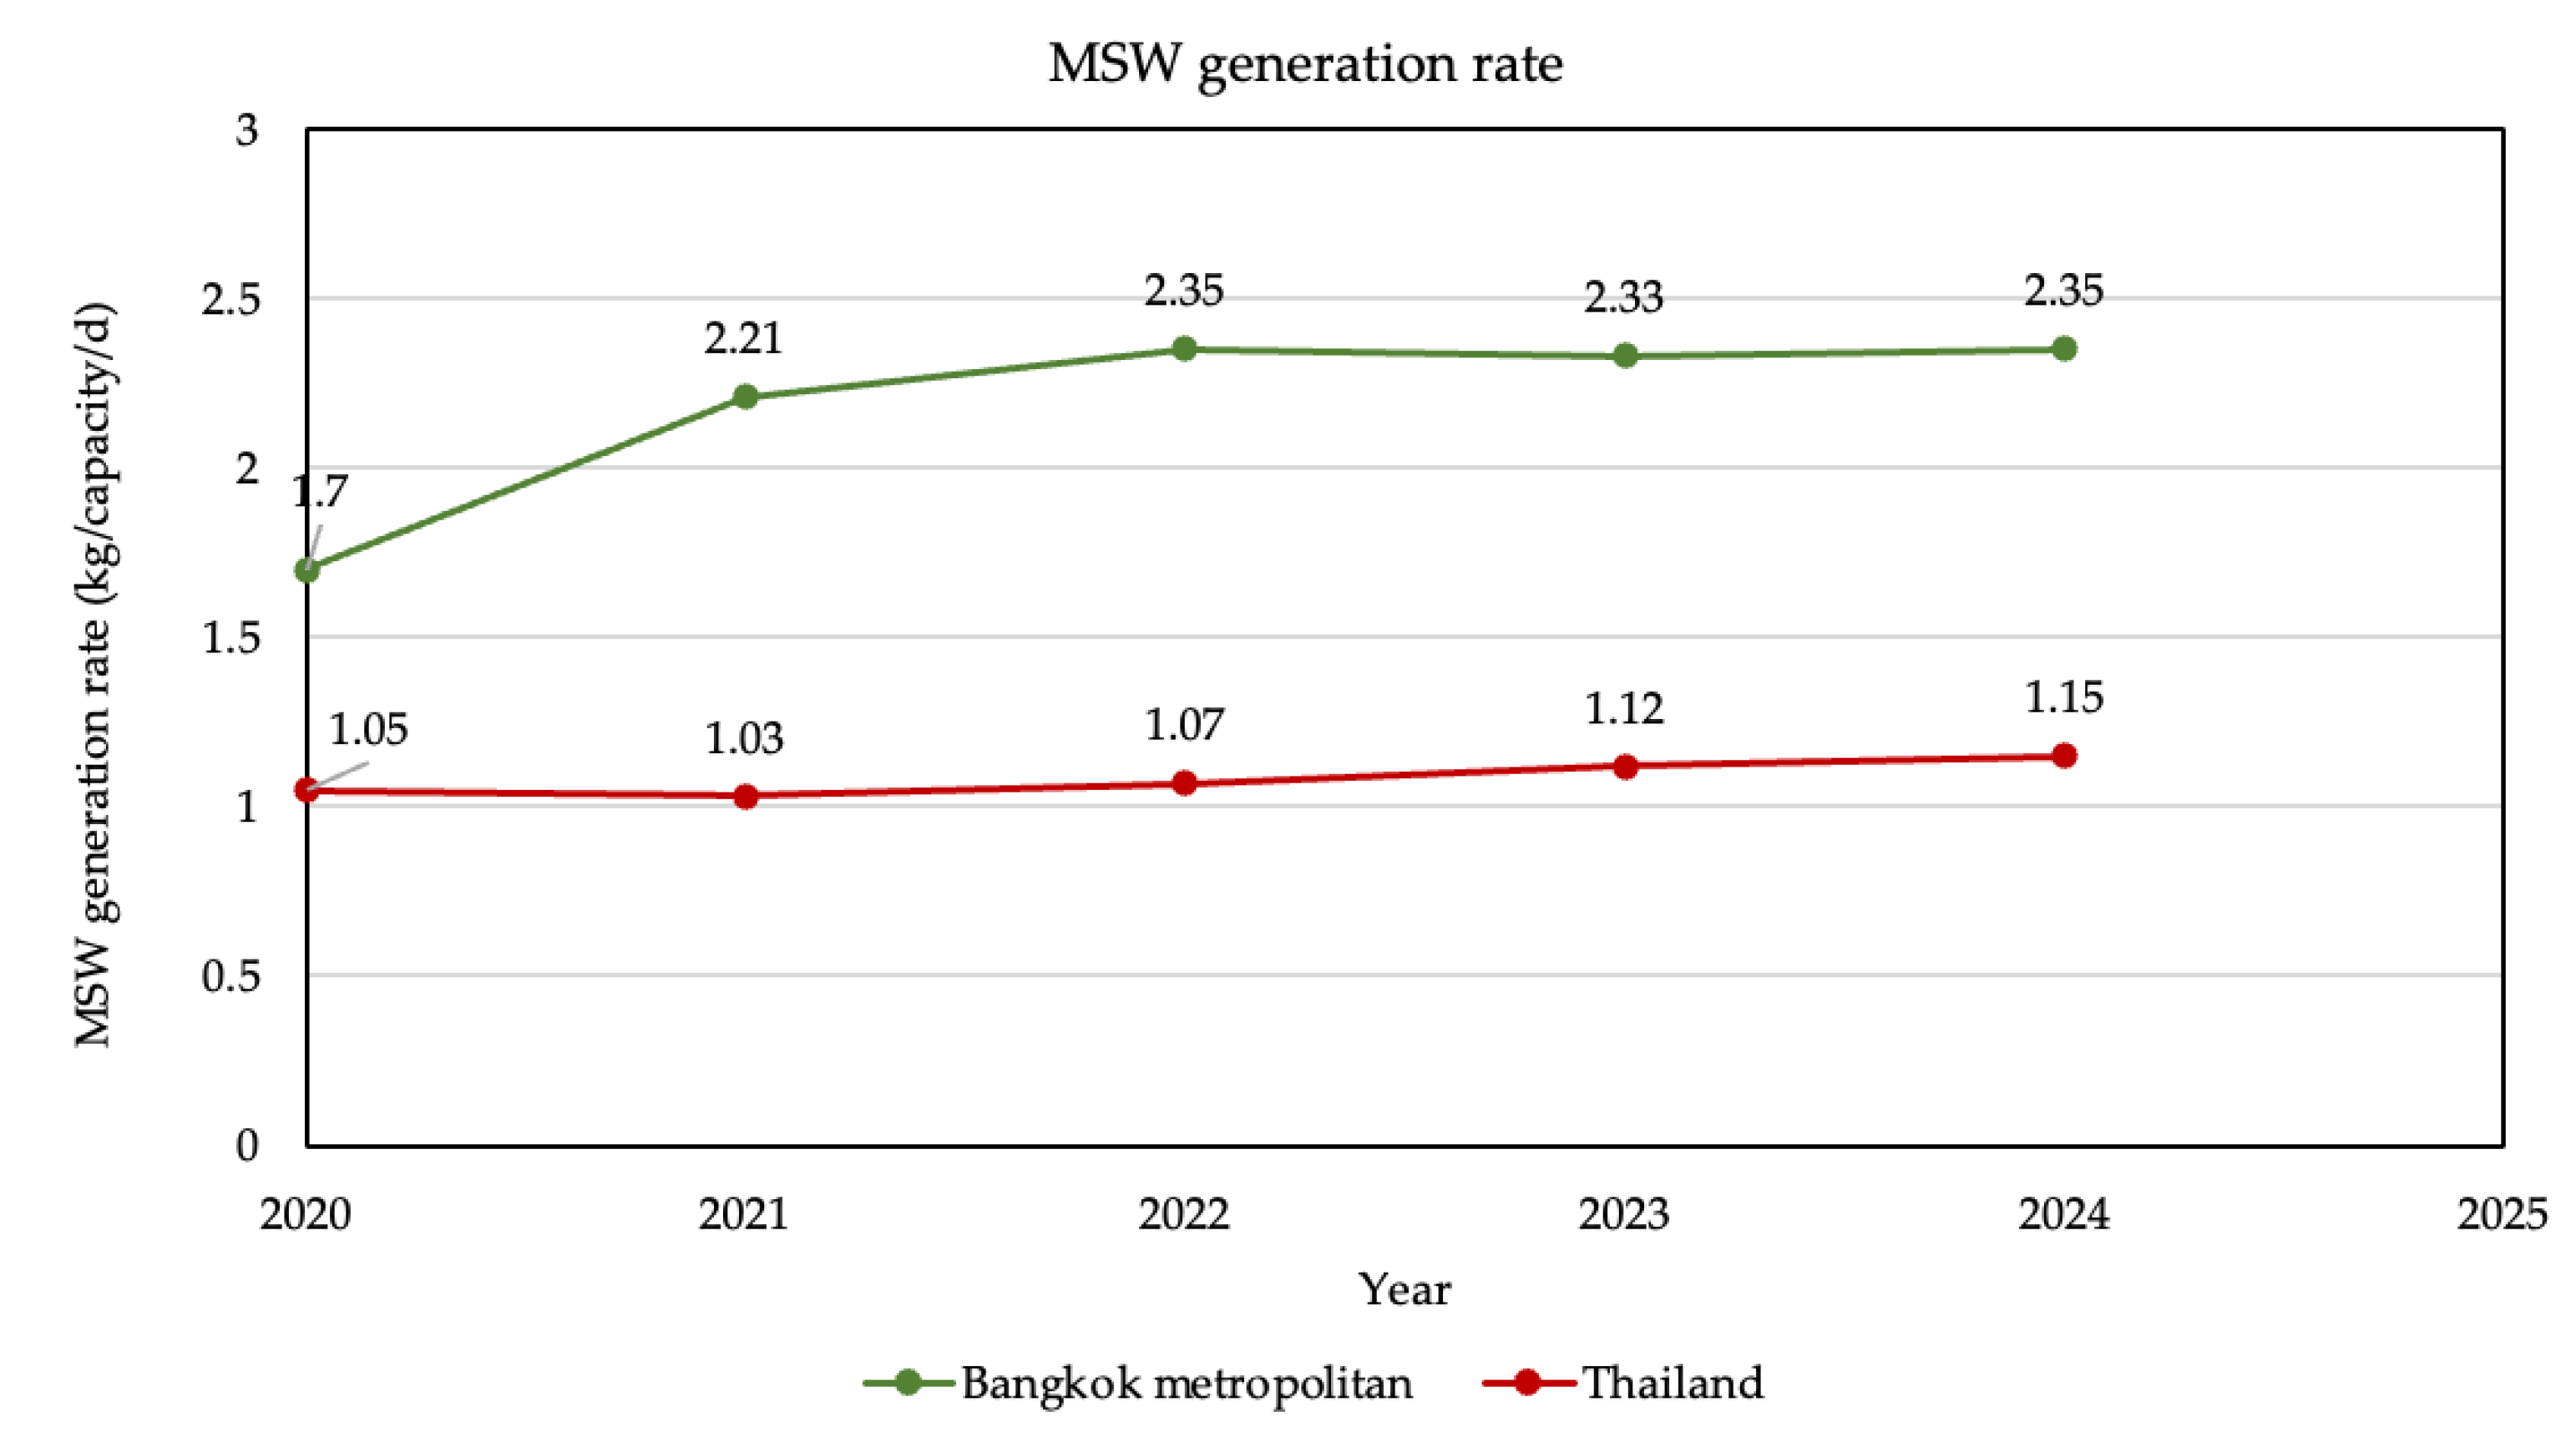
Figure 4.
(a) MSW samples; (b) physical composition analysis.
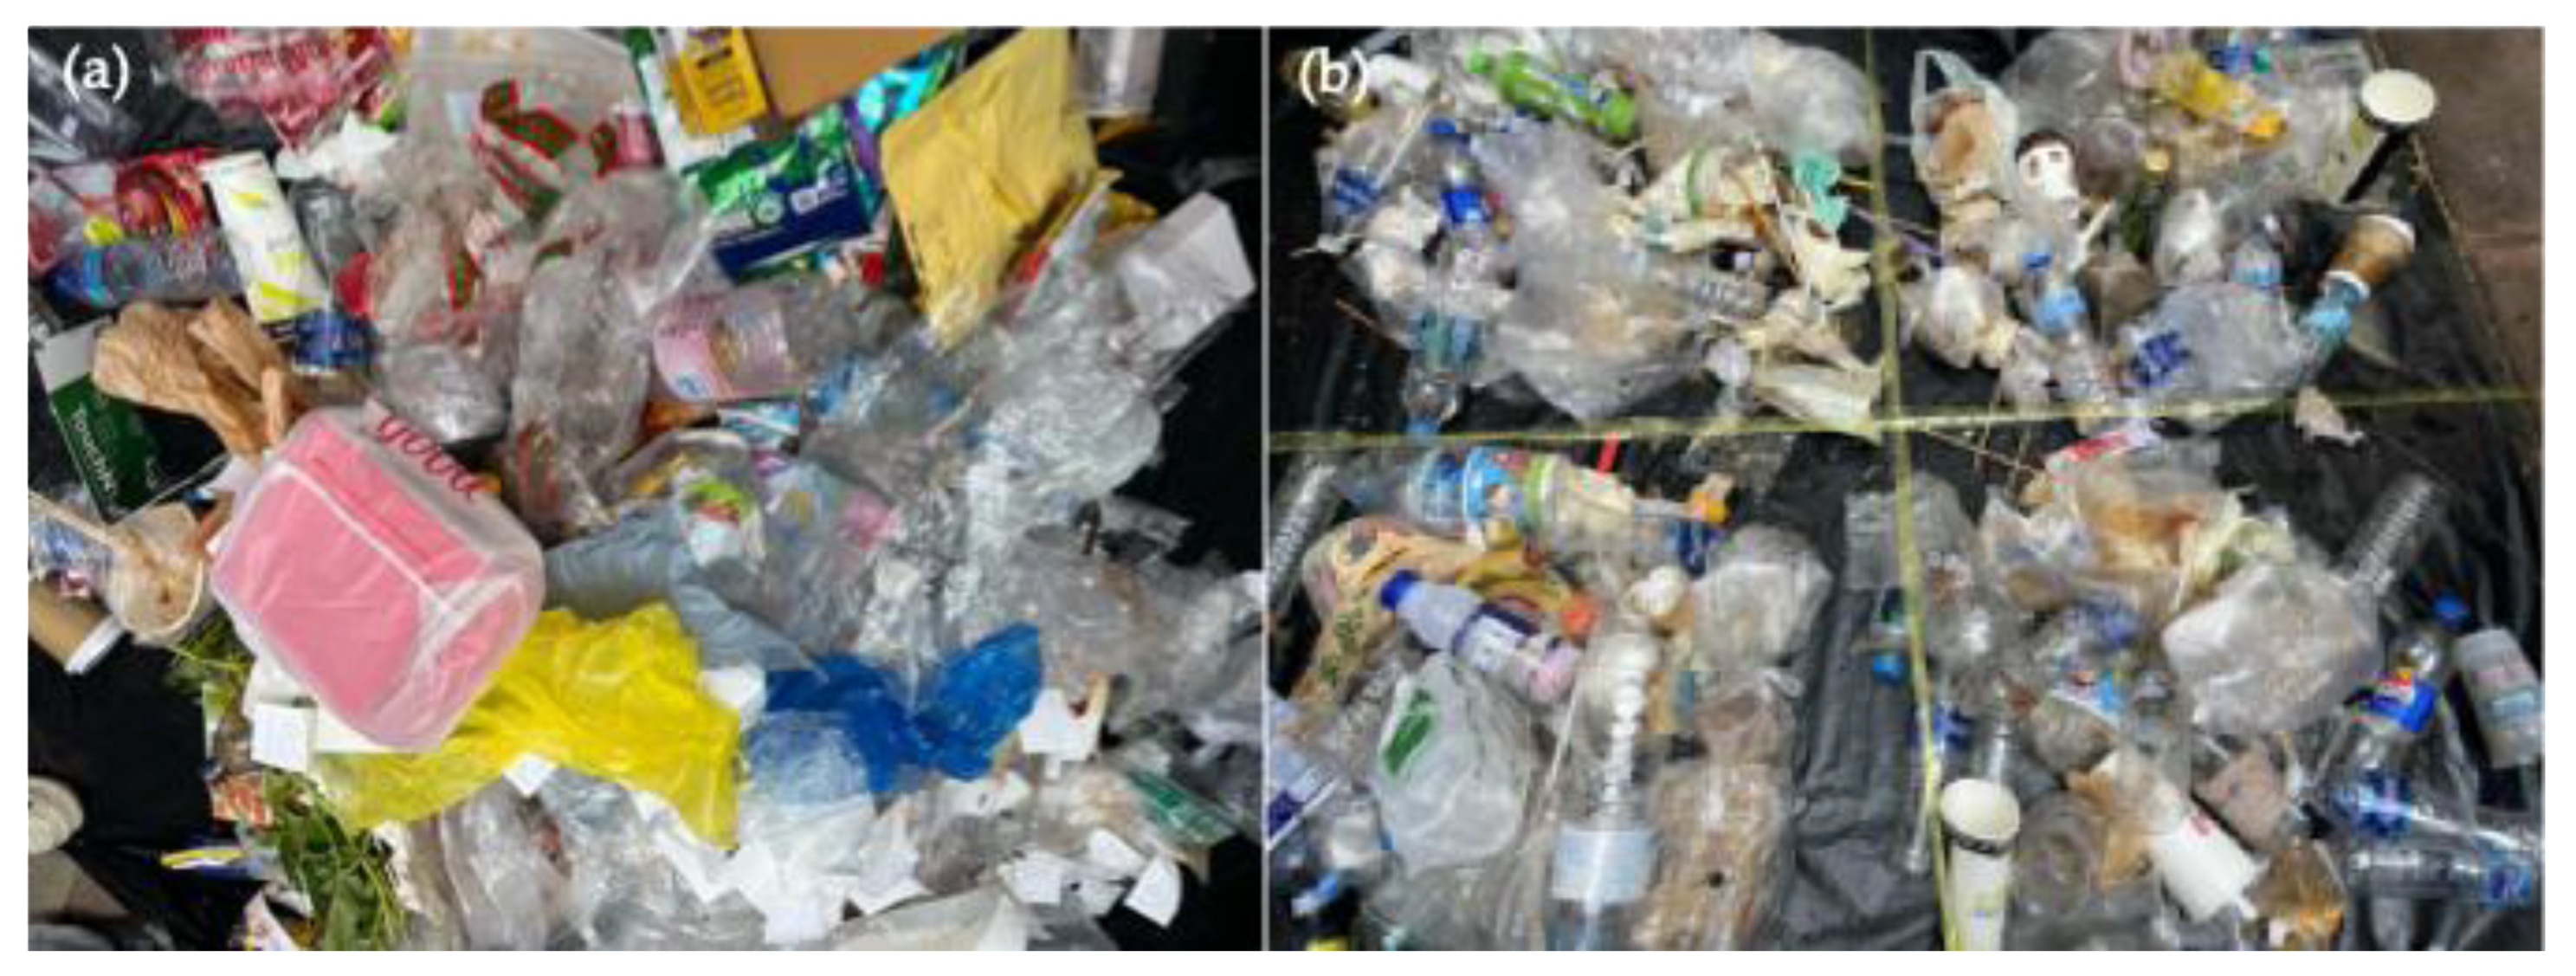
Figure 5.
Online food delivery patterns: (a) increase in food delivery; (b) reason to choose food delivery; (c) frequency of food delivery, and (d) effects of platform brand.
Figure 5.
Online food delivery patterns: (a) increase in food delivery; (b) reason to choose food delivery; (c) frequency of food delivery, and (d) effects of platform brand.
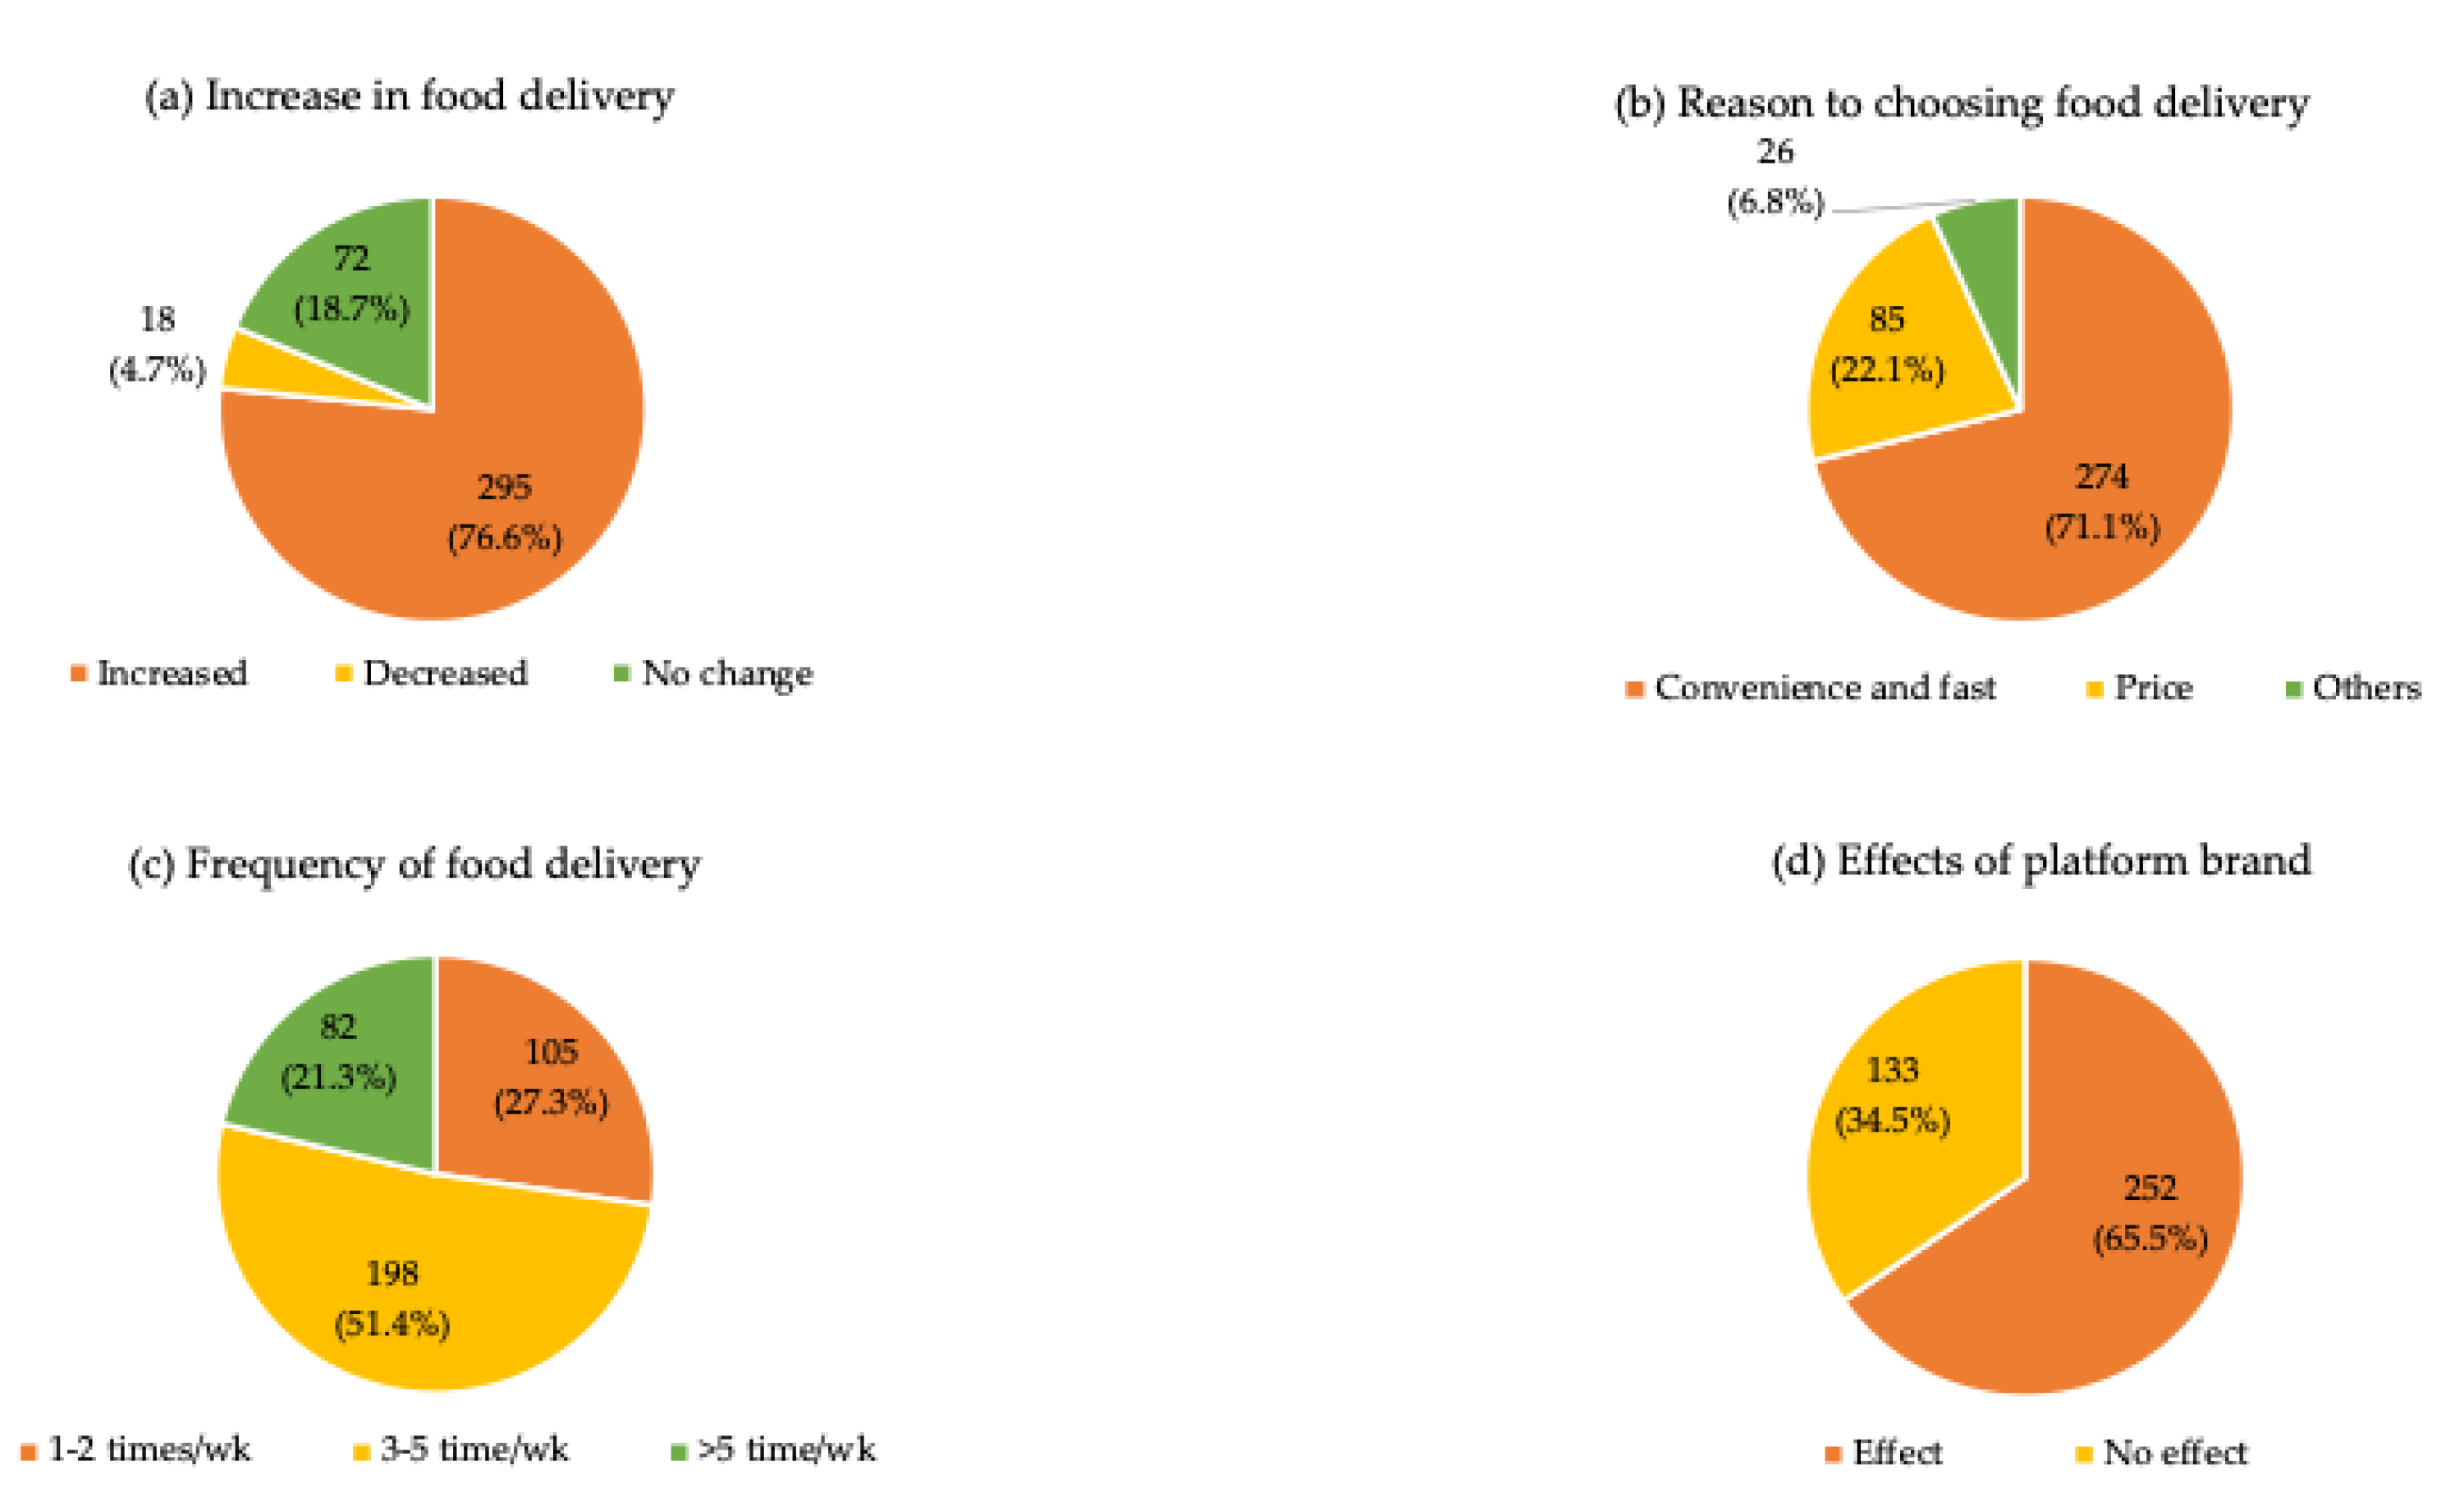
Figure 6.
Waste generation related to online food delivery.
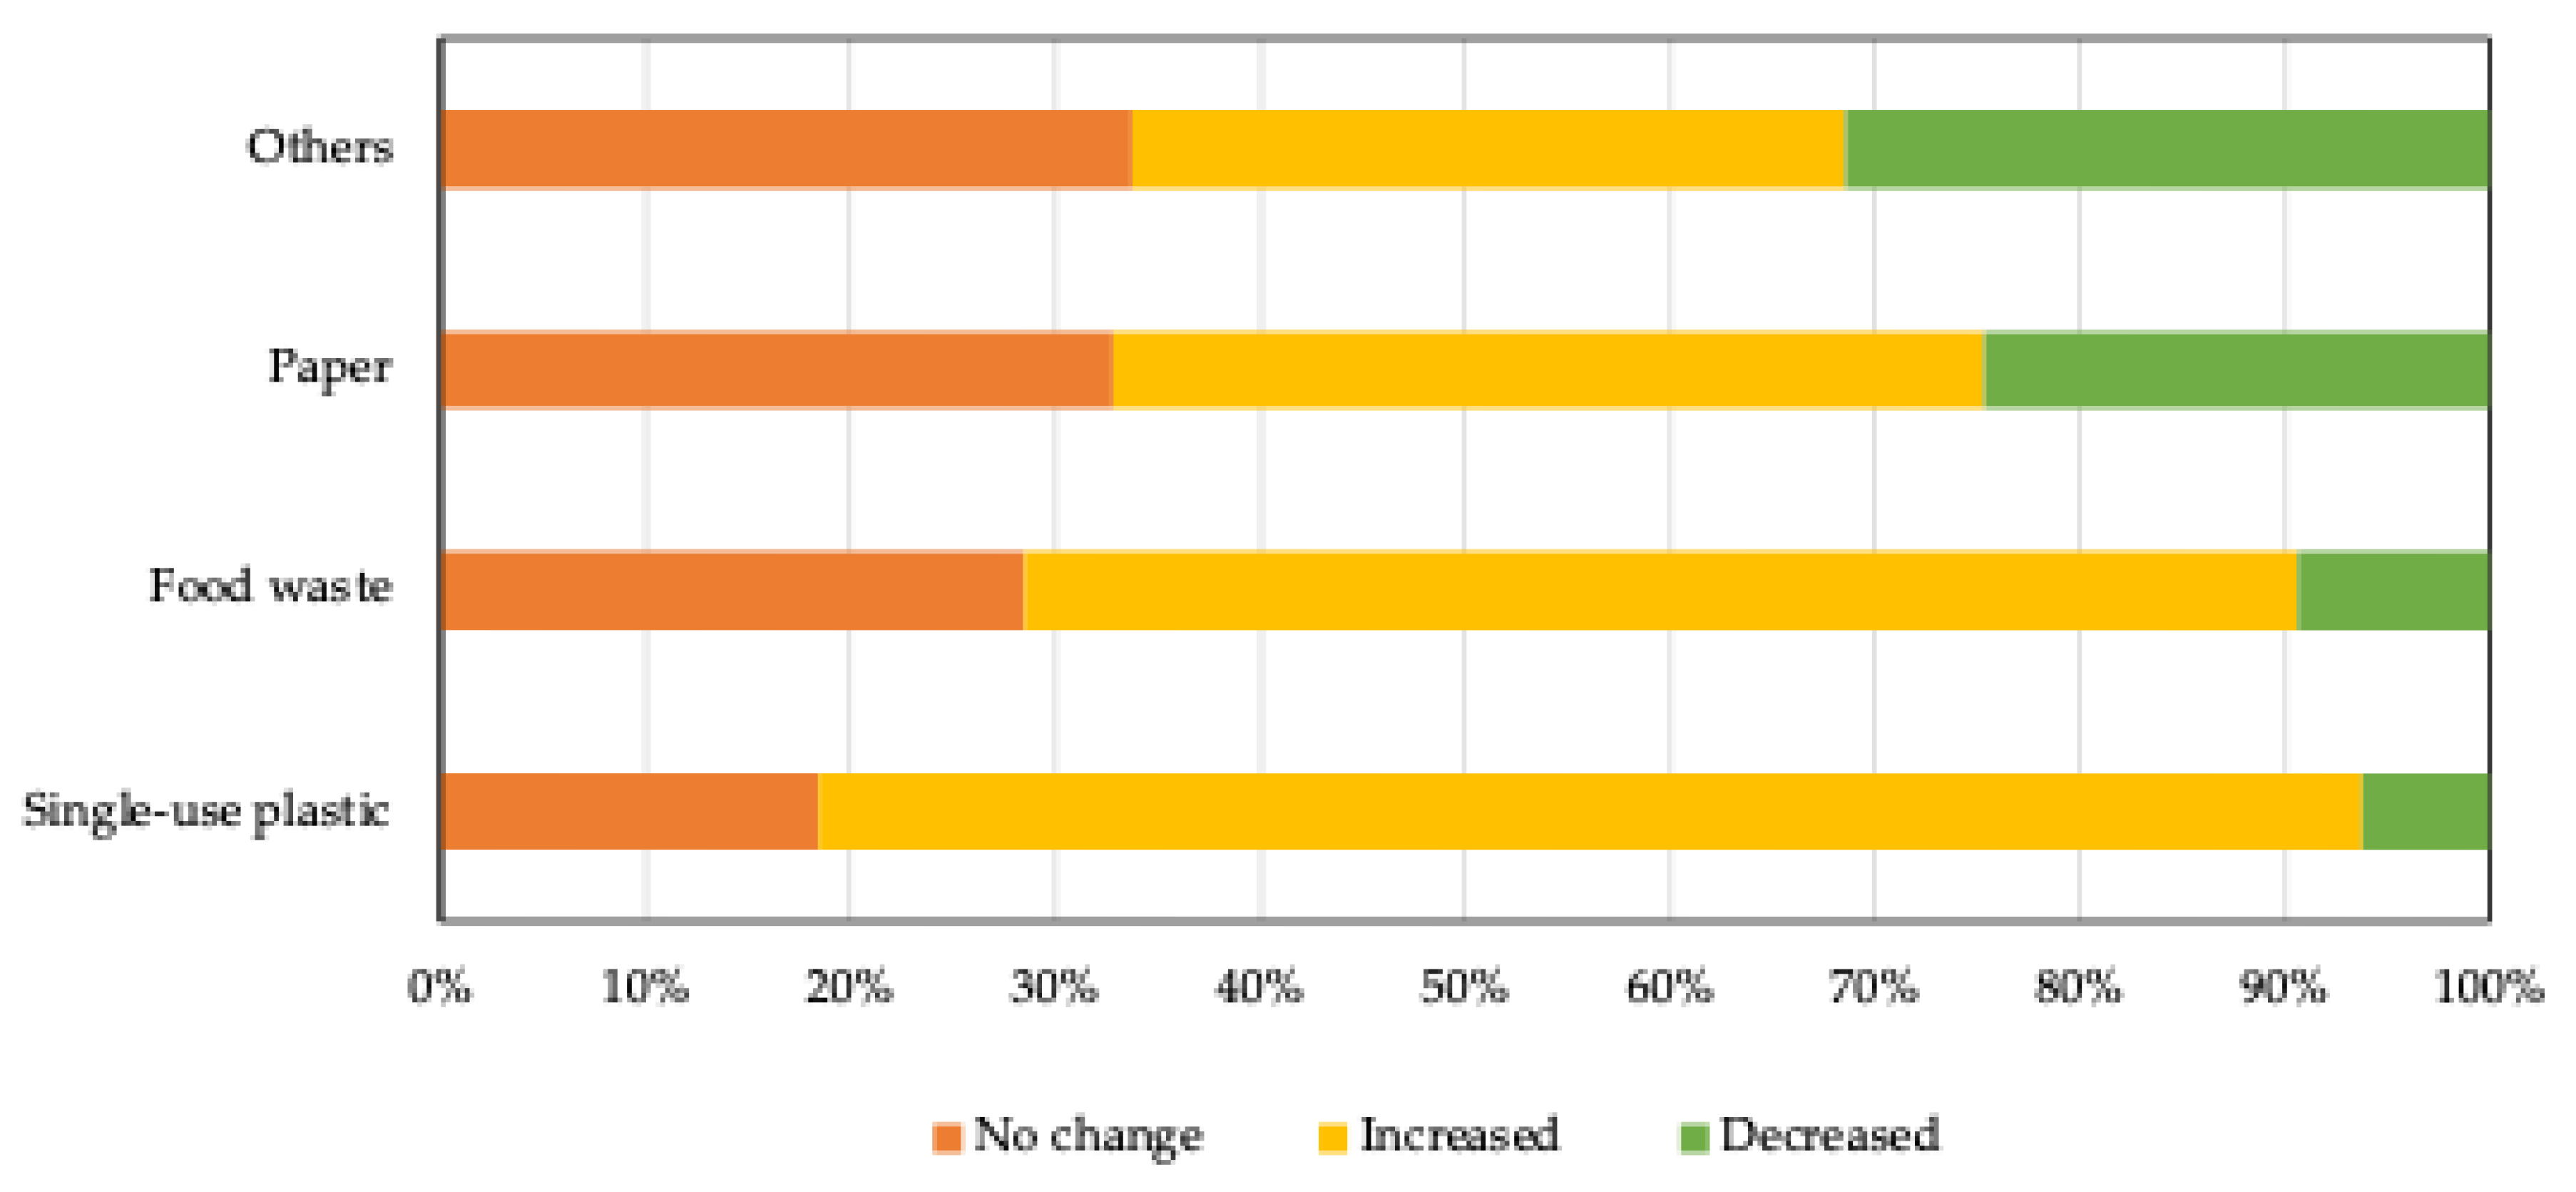
Figure 7.
SUP from online food delivery.
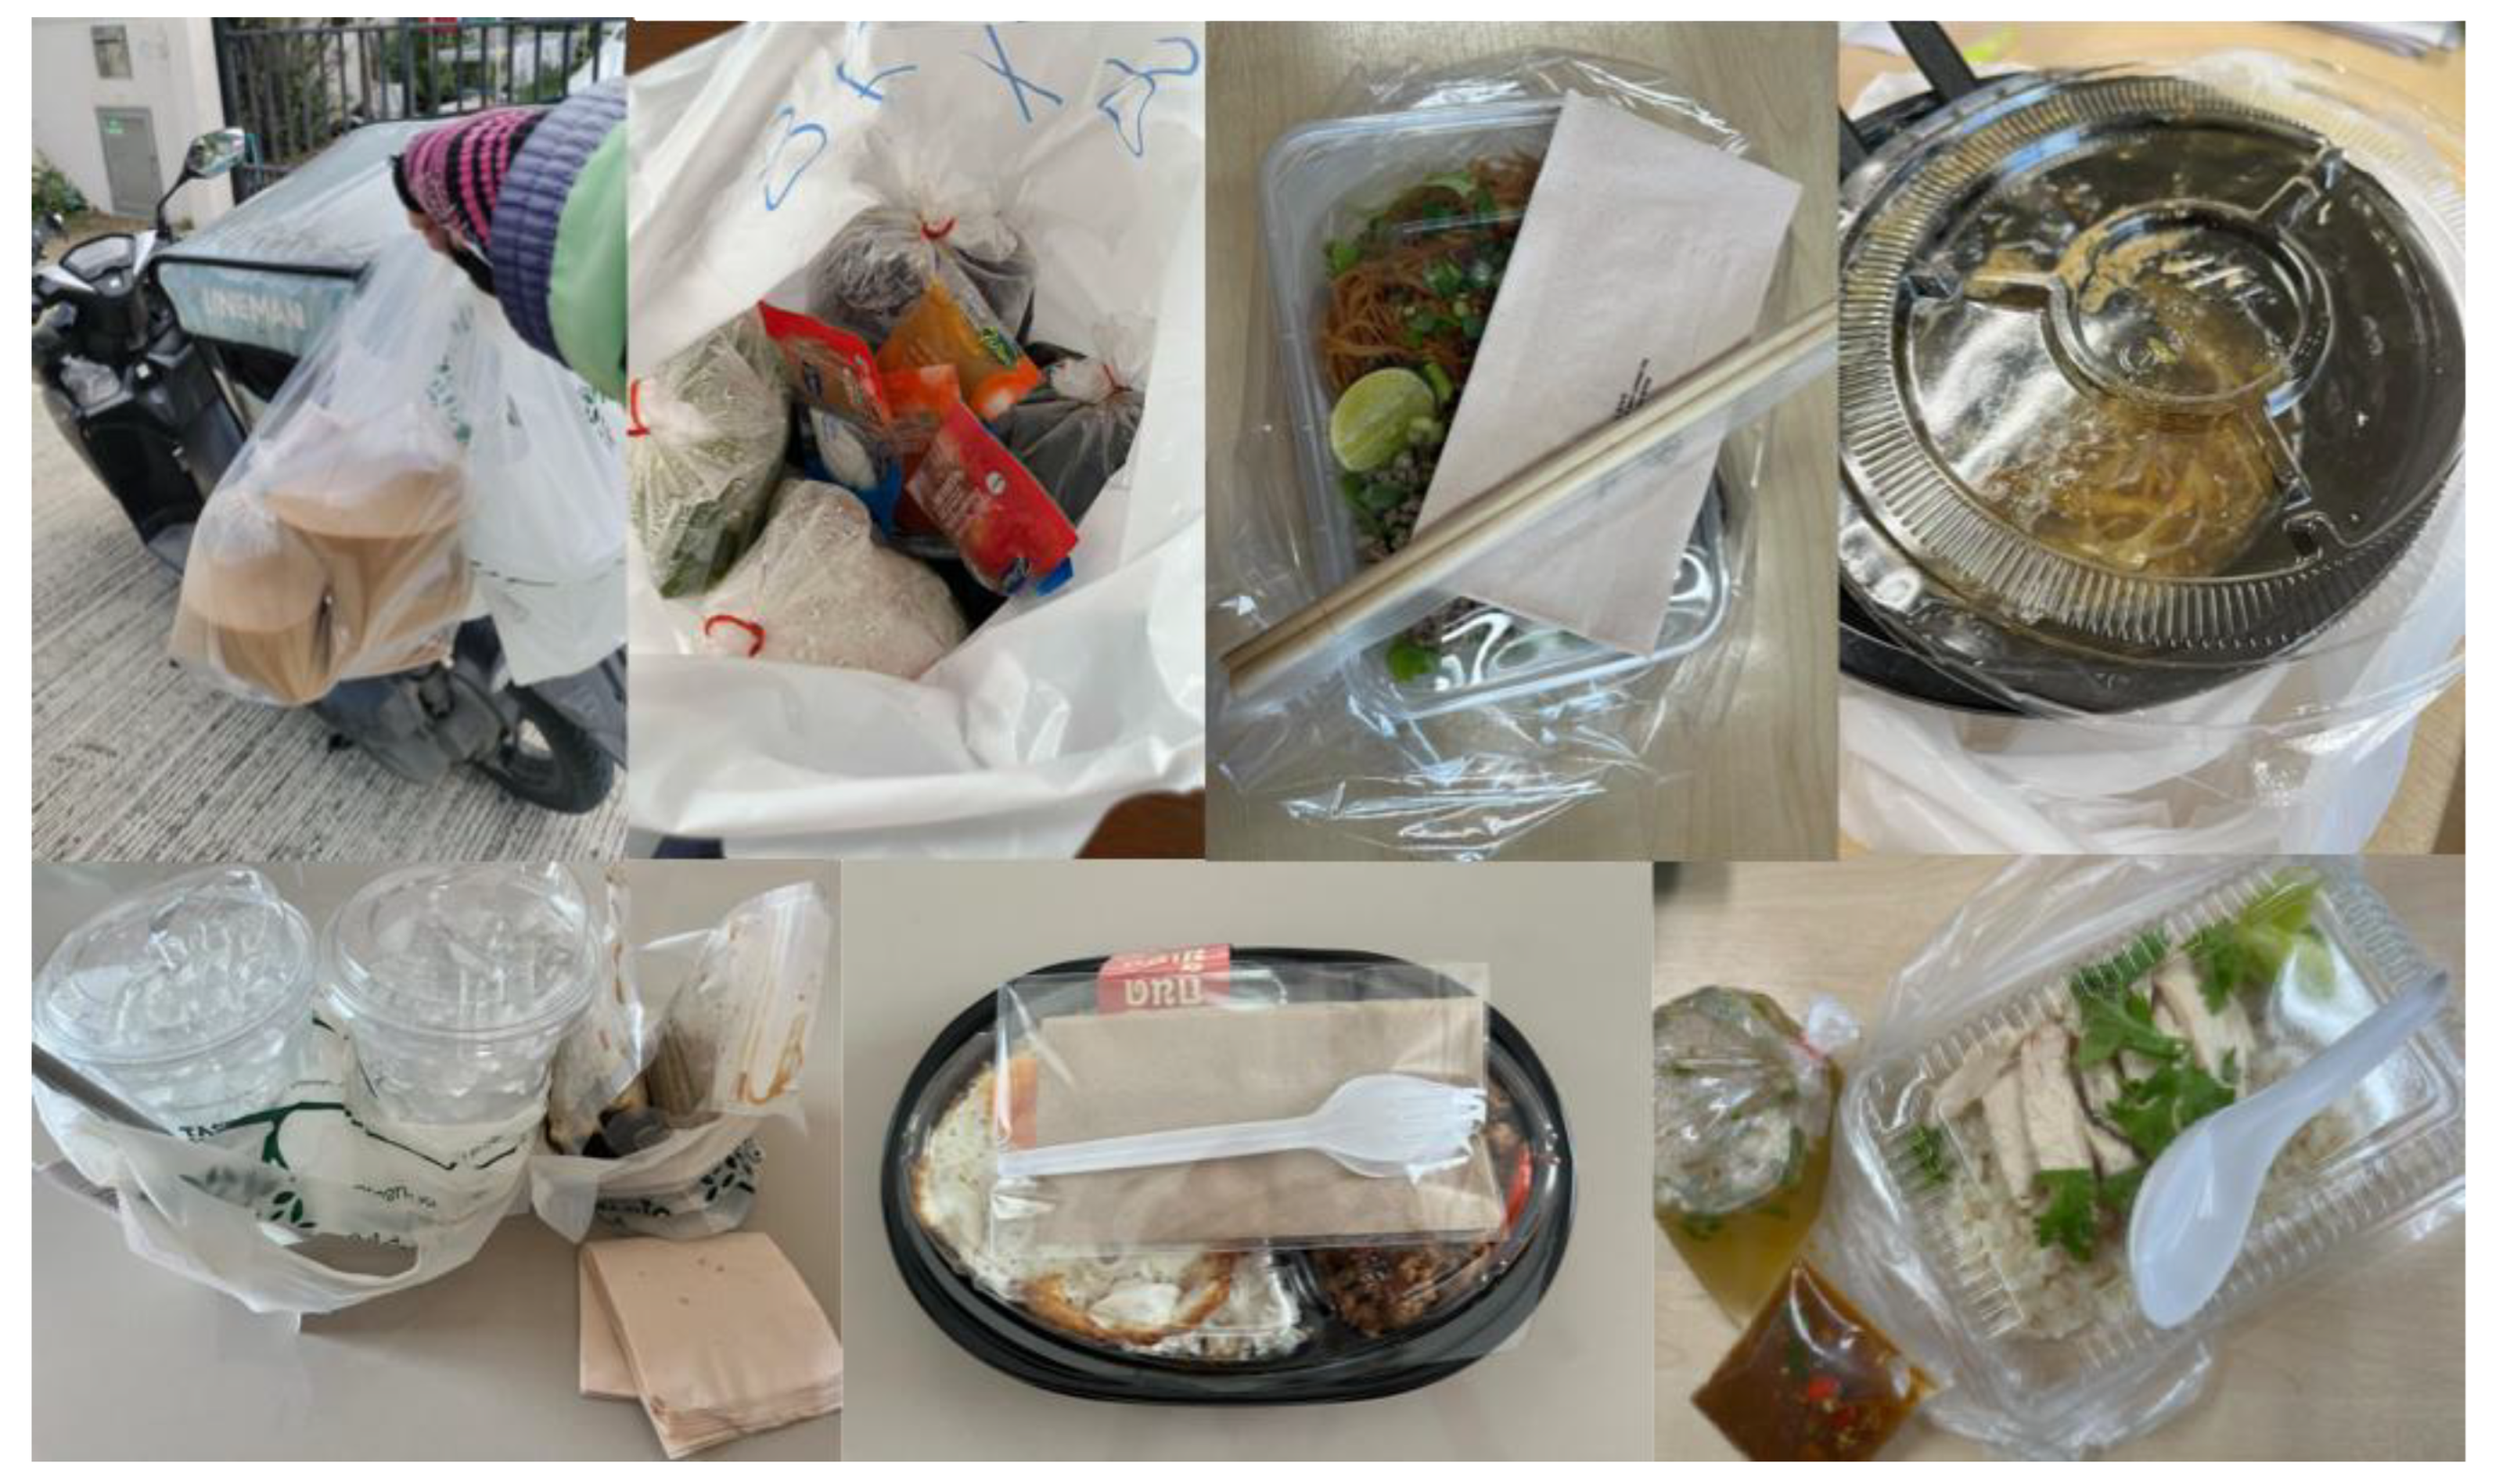
Figure 8.
Choices of SUP consumption from online food delivery.
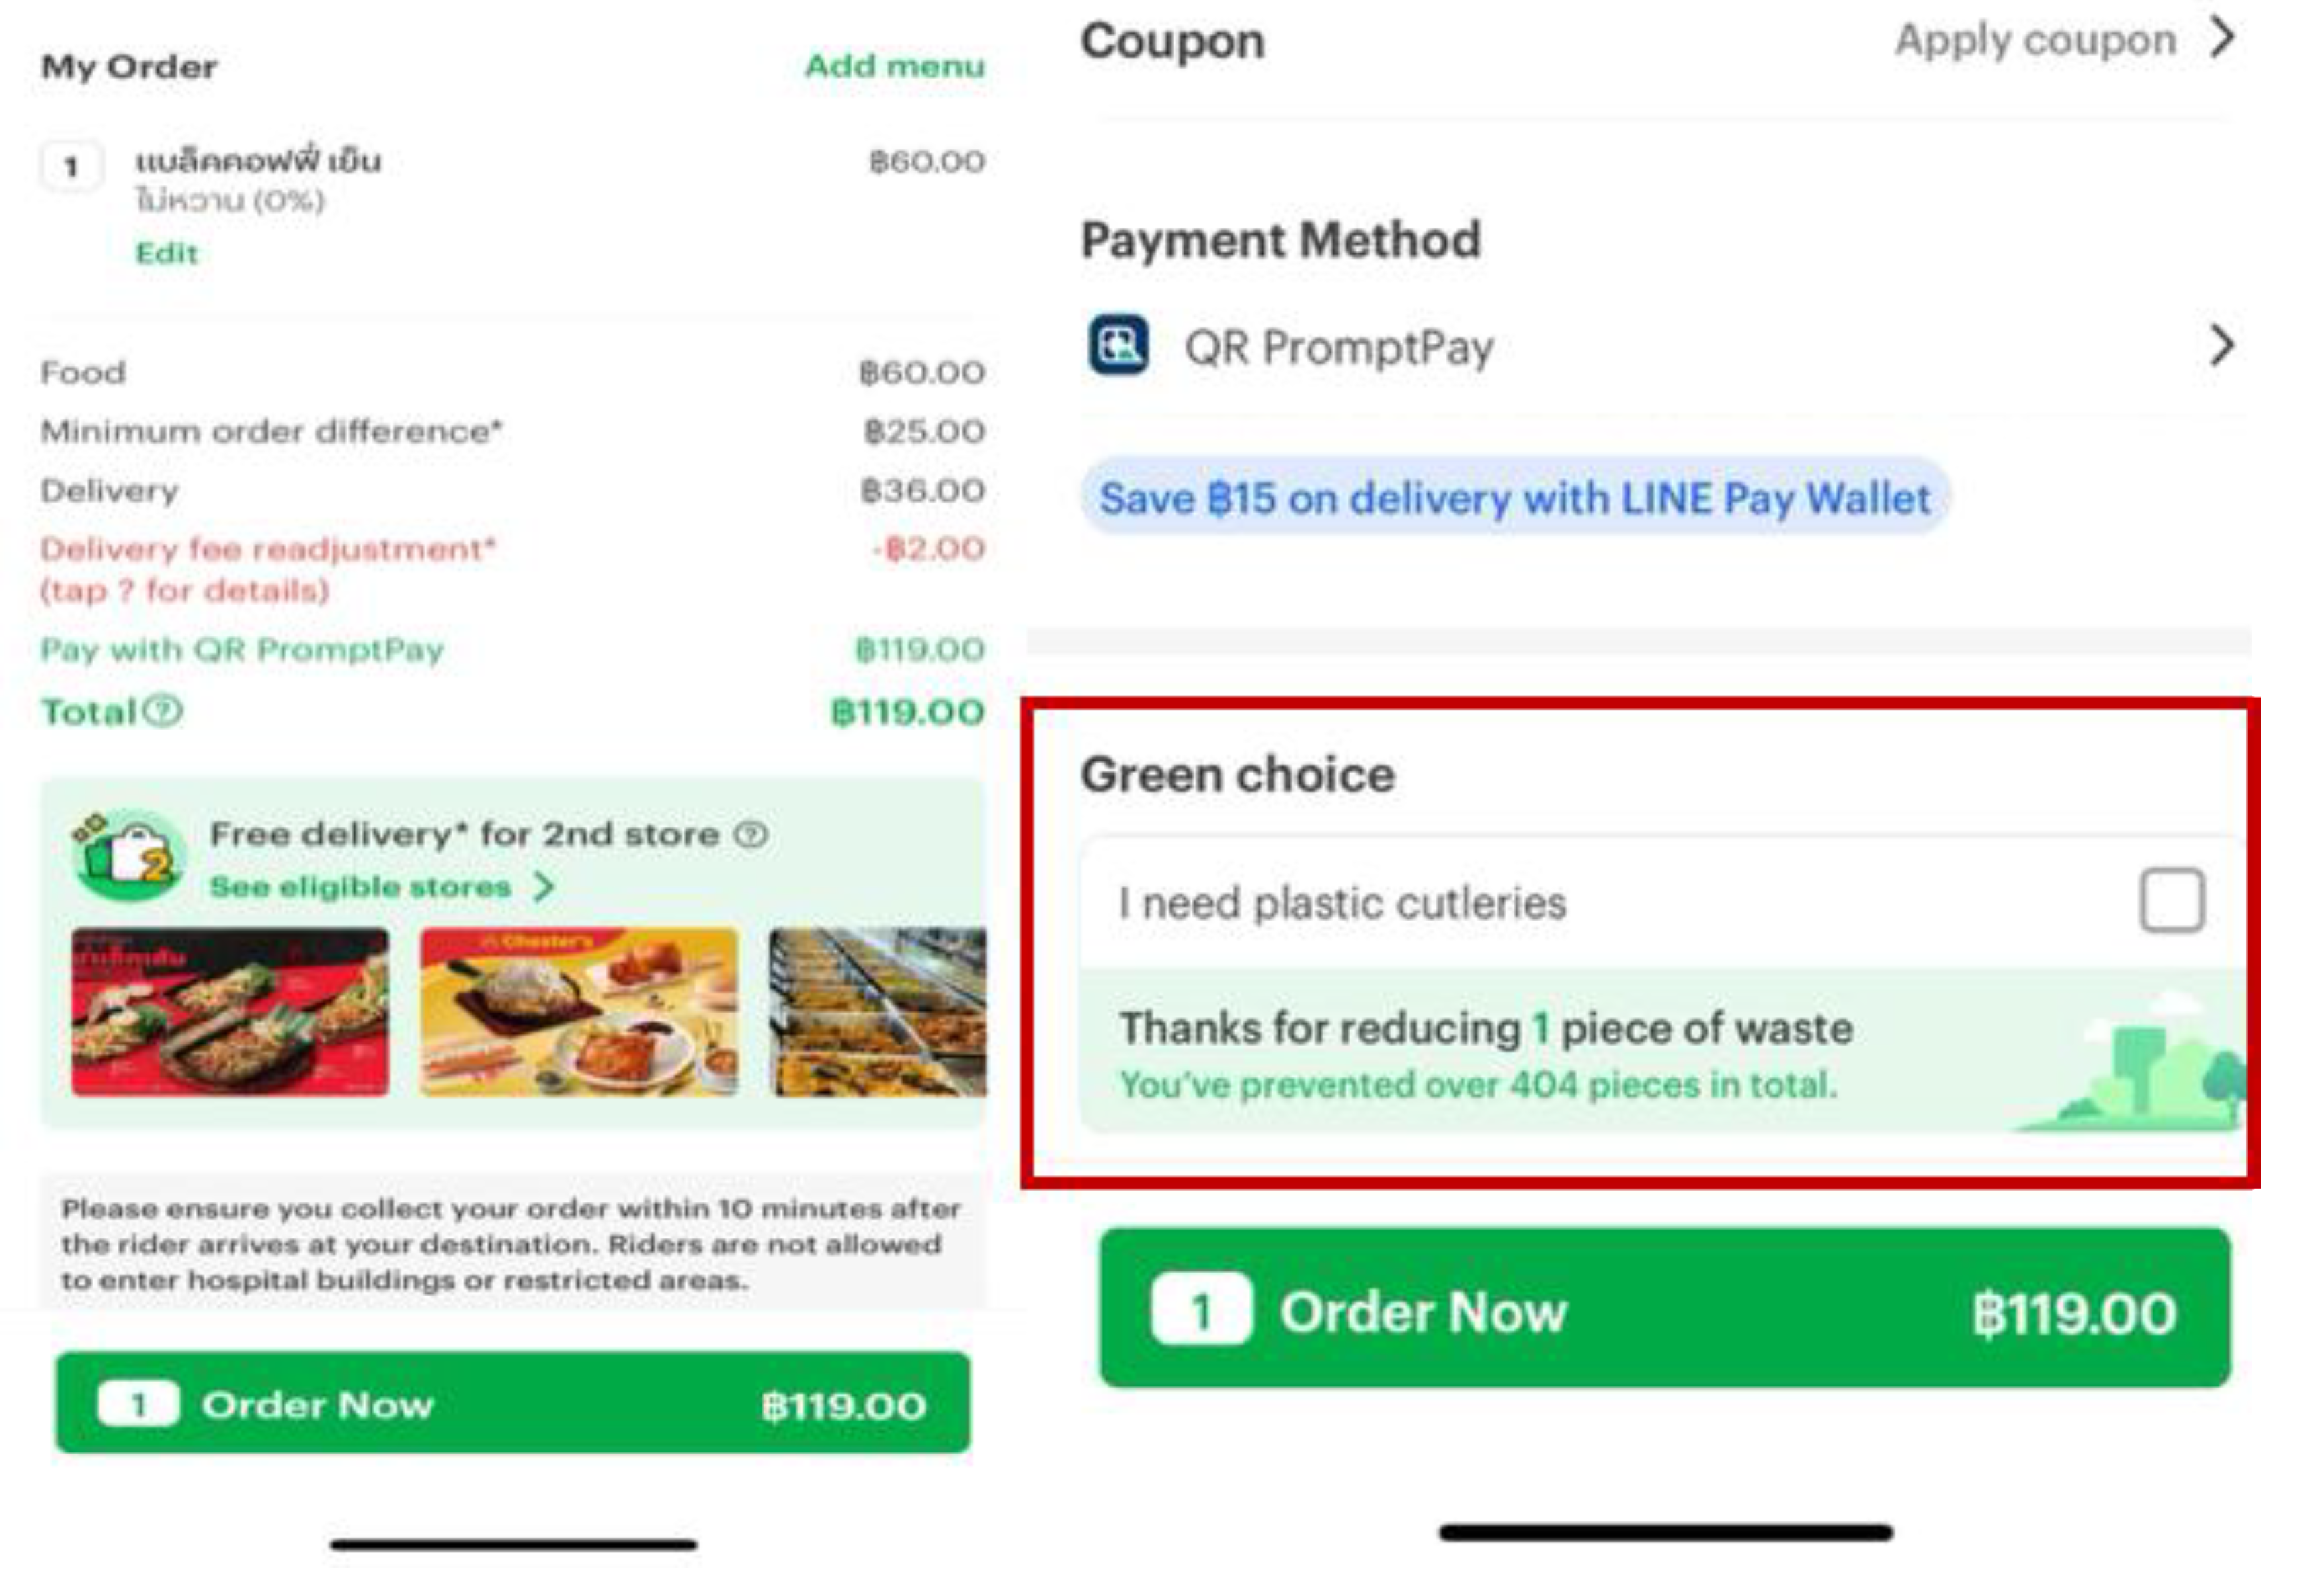

Table 1.
Physical composition of the MSW at source in Bangkok metropolitan.
| Waste category | Composition (wt.%) | |||
| *This study | [25]1 | [26]2 | [17]3 | |
| Food waste | 39.3±2.5 | 65.17 | 43.1 | 36.79 |
| Plastic | 26.9±3.1 | 17.0 | 16.6 | 29.38 |
| Paper and cardboard | 16.1±2.2 | 7.21 | 13.0 | 4.58 |
| Rubber and leather | 3.6±1.4 | 0.45 | 2.8 | 0.91 |
| Textile | 1.4±0.5 | 1.36 | 3.8 | 3.37 |
| Wood and yard waste | 1.5±0.7 | 0.45 | 13.8 | 12.25 |
| Glass | 3.6±1.2 | 3.46 | 5.4 | 2.18 |
| Metal and aluminium | 4.1±0.8 | 1.75 | 3.7 | 0.64 |
| Hazardous waste | 2.5±0.4 | - | - | 1.24 |
| Others | 1.0±0.2 | 3.17 | 4.4 | 8.66 |
| Total | 100.0 | 100.0 | 100.0 | 100.0 |
* n=24; 1 MSW in mega-city, Thailand. 2 MSW in Bangkok city at the transfer station. 3 MSW in Thailand.
Table 2.
Demographics information of participants.
| Demographic data | Participant (n=385) | Percentage (%) |
| Gender | ||
| Female | 213 | 55.3% |
| Male | 165 | 42.9% |
| Not identify | 7 | 1.8% |
| Aged (yrs) | ||
| 18–25 | 112 | 29.1% |
| 26–35 | 145 | 37.7% |
| 36–45 | 82 | 21.3% |
| 46–60 | 35 | 9.1% |
| > 60 | 11 | 2.8% |
| Monthly income (THB) | ||
| ≤ 10,000 | 35 | 9.1% |
| 10,001–25,000 | 136 | 35.3% |
| 25,001–50,000 | 152 | 39.5% |
| > 50,000 | 62 | 16.1% |
| Education level | ||
| High school or under | 59 | 15.3% |
| Graduate | 182 | 47.3% |
| Post-graduate | 144 | 37.4% |
| Residence type | ||
| Detached house | 198 | 51.4% |
| Apartment/Dormitory | 125 | 32.5% |
| Condominium | 51 | 13.2% |
| Others | 11 | 2.9% |
| Number of household members (person) | ||
| 1–2 | 156 | 37.9% |
| 3–5 | 146 | 40.5% |
| > 5 | 83 | 21.6% |
Table 3.
Attitude on SUP consumption from online food delivery.
| Contents | Number of participants (%) | ||
| Yes | No | Not sure | |
| Are you aware of whether online food delivery platforms provide an option to decline SUP? (e.g. plastic spoon, plastic cutlery, plastic straw, etc.)? (n=385) | 275 (71.4%) | 72 (18.7%) | 38 (9.9%) |
| Have you ever utilized the option to decline SUP on online food delivery platforms? (n=275) | 162 (58.9%) | 113 (41.1%) | - |
| Which types of SUP do you choose to decline? (n=162) | |||
| Spoon | 68 (42.0%) | - | - |
| Cutlery | 59 (36.4%) | - | - |
| Straw | 27 (16.7%) | - | - |
| Others | 8 (4.9%) | - | - |
| Do you agree with charging an additional fee for the use of SUP? (n=385) | 152 (39.5%) | 199 (51.7%) | 34 (8.8%) |
Disclaimer/Publisher’s Note: The statements, opinions and data contained in all publications are solely those of the individual author(s) and contributor(s) and not of MDPI and/or the editor(s). MDPI and/or the editor(s) disclaim responsibility for any injury to people or property resulting from any ideas, methods, instructions or products referred to in the content. |
© 2025 by the authors. Licensee MDPI, Basel, Switzerland. This article is an open access article distributed under the terms and conditions of the Creative Commons Attribution (CC BY) license (http://creativecommons.org/licenses/by/4.0/).
Copyright: This open access article is published under a Creative Commons CC BY 4.0 license, which permit the free download, distribution, and reuse, provided that the author and preprint are cited in any reuse.


