Submitted:
13 December 2025
Posted:
15 December 2025
You are already at the latest version
Abstract
Background: Acute respiratory distress syndrome (ARDS) is a severe form of hypoxemic respiratory failure with high morbidity and mortality. Mechanical ventilation is essential for supportive care, but the heterogeneity of lung and chest wall mechanics limits the effectiveness of standardized approaches. Esophageal pressure (Pes) monitoring, as a surrogate of pleural pressure, provides insight into patient-specific physiology and may enable individualized ventilation strategies to minimize ventilator-associated lung injury (VALI).Objective: To determine whether esophageal pressure monitoring improves personalization of mechanical ventilation in patients with ARDS and heterogeneous lung–chest wall mechanics.Methods: A comprehensive PubMed search of English-language literature was conducted. Experimental, physiologic, and clinical studies addressing esophageal manometry in mechanically ventilated patients were reviewed, with emphasis on ARDS. Evidence was synthesized regarding PEEP titration, assessment of patient effort, and applications in complex scenarios such as obesity and COPD overlap. Data extraction focused on proposed physiologic targets, validation techniques, clinical outcomes, and bedside feasibility.Findings: Esophageal manometry enables partitioning of lung and chest wall mechanics, accurate estimation of transpulmonary pressure, and optimization of PEEP settings. Across studies, consistent target ranges were identified: expiratory transpulmonary pressure (Plexp) 0–2 cmH₂O, end-inspiratory transpulmonary pressure (Plinsp) ≤15–20 cmH₂O, and tidal transpulmonary pressure change (ΔPL) ≤10–12 cmH₂O. In assisted ventilation, diaphragmatic-protective thresholds included ΔPes 3–8 cmH₂O, ΔPdi 5–15 cmH₂O, and PTPes 60–150 cmH₂O·s/min. Technique requires careful balloon inflation (Vbest) and confirmation of placement using an occlusion test. Additional clinical uses include detection of intrinsic PEEP, assessment of hemodynamics via transmural pressure measurements, and monitoring of patient–ventilator synchrony. Collectively, these applications support lung- and diaphragm-protective ventilation strategies tailored to individual physiology.Conclusions: Esophageal pressure monitoring represents a promising adjunct for personalizing mechanical ventilation in ARDS, particularly in patients with altered chest wall mechanics such as obesity. Although technical expertise and proper calibration are required, this tool allows more precise adjustment of PEEP, tidal volume, and inspiratory effort. Integration of Pes monitoring into practice may help balance lung- and diaphragm-protective strategies, thereby reducing VALI and improving patient-specific outcomes.
Keywords:
acute respiratory distress syndrome
; esophageal pressure monitoring
; transpulmonary pressure
; transpulmonary driving pressure
; lung protective ventilation
; diaphragm protective ventilation
; patients effort
; work of breathing
; patient-ventilator dyssynchrony
Key Points
1. Esophageal pressure monitoring during mechanical ventilation may help in personalizing ventilation strategies in patients with significant lung and chest wall heterogeneity. It provides bedside insights into lung–chest wall mechanics and patient effort during mechanical ventilation
2. Like any monitoring tool, esophageal pressure monitoring requires confirmation of optimal position, and calibration. Optimal balloon inflation with Vbest approach and occlusion test confirm accuracy.
3. In ARDS, proposed targets include Plexp 0–2 cmH₂O, Plinsp ≤15–20 cmH₂O, and ΔPL ≤10–12 cmH₂O, supporting lung-protective ventilation even in patients with obesity or high chest wall elastance
4. During assist/support modes, Pes monitoring guides diaphragmatic-protective ventilation with targets of ΔPes 3–8 cmH₂O, ΔPdi 5–15 cmH₂O, and PTPes 60–150 cmH₂O·s/min.
5. Additional uses include detecting intrinsic PEEP, optimizing hemodynamics through transmural vascular pressure assessment, and improving patient–ventilator synchrony.
Introduction
ARDS is characterized by profound heterogeneity of the lung parenchyma—simultaneous presence of consolidated, collapsed, over-distended, and normally aerated regions—leading to marked variability in compliance and mechanical properties [1] Moreover, lung injury evolves temporally, with dynamic changes in alveolar interstitium and mechanics over the course of disease. This spatial and temporal heterogeneity makes the application of uniform ventilatory strategies challenging to deliver lung-protective ventilation [2].
Traditional global parameters such as plateau pressure and driving pressure, though important, may not adequately capture the interplay between lung and chest wall mechanics or account for patient effort. Driving pressure depends on the rate of pressurization and furthermore, may remain constant at a range of PEEP which further contributes to the complexity of titrating PEEP to an optimal recruitment/over-distention tradeoff [3]. Measurement of pleural pressure, the key determinant of transpulmonary pressure (the true distending pressure of the lung), offers a more individualized approach. Direct pleural pressure measurement is invasive and impractical at the bedside, but esophageal manometry provides a minimally invasive surrogate [4].
In this review, we present the physiological rationale, technique, troubleshooting, and clinical applications and available evidence of esophageal pressure monitoring, emphasizing its role in personalizing mechanical ventilation.
Physiology of Respiratory Mechanics
1. Pressures and modes of ventilation
- Airway pressure (Paw): Airway pressure refers to the pressure measured at the airway opening, typically by the ventilator. It reflects the sum of pressures required to overcome both the resistive load of the conducting airways and the elastic recoil of the lung and chest wall. During positive pressure ventilation, Paw rises during inspiration as gas is delivered, and it falls back toward baseline during expiration. Clinically, Paw is easily monitored and forms the basis for measurements such as peak inspiratory pressure (PIP) and plateau pressure (Pplat). In zero flow static states such as during end-inspiratory or end- expiratory holds, airway pressure approximates the alveolar pressure (Palv) [5].
- Pleural Pressure (Ppl): Pleural pressure represents the pressure within the pleural space, which surrounds the lungs. It is the external pressure acting on the lung parenchyma and is a critical determinant of the mechanics of breathing. Because direct measurement of Ppl is impractical at the bedside, it is commonly estimated using esophageal manometry, under the assumption that esophageal pressure approximates pleural pressure. Ppl varies with the respiratory cycle: becoming more negative during spontaneous inspiration, and more positive during positive pressure ventilation [5].
- Trans-pulmonary Pressure (PL):
Trans-pulmonary pressure is defined as: PL =Paw −Ppl
It represents the distending pressure across the lung, i.e., the pressure difference between the alveolar space and the pleural space. PL is the true determinant of alveolar inflation, as it quantifies the mechanical stress applied to lung tissue. In spontaneous breathing, PL increases as pleural pressure falls during inspiration. Under mechanical ventilation, PL is influenced by both applied airway pressures and the patient’s own inspiratory effort (if present) [6]. See figure 1 for various compartments in the thoracic cavity and sites of measurement of airway, alveolar and pleural pressures.
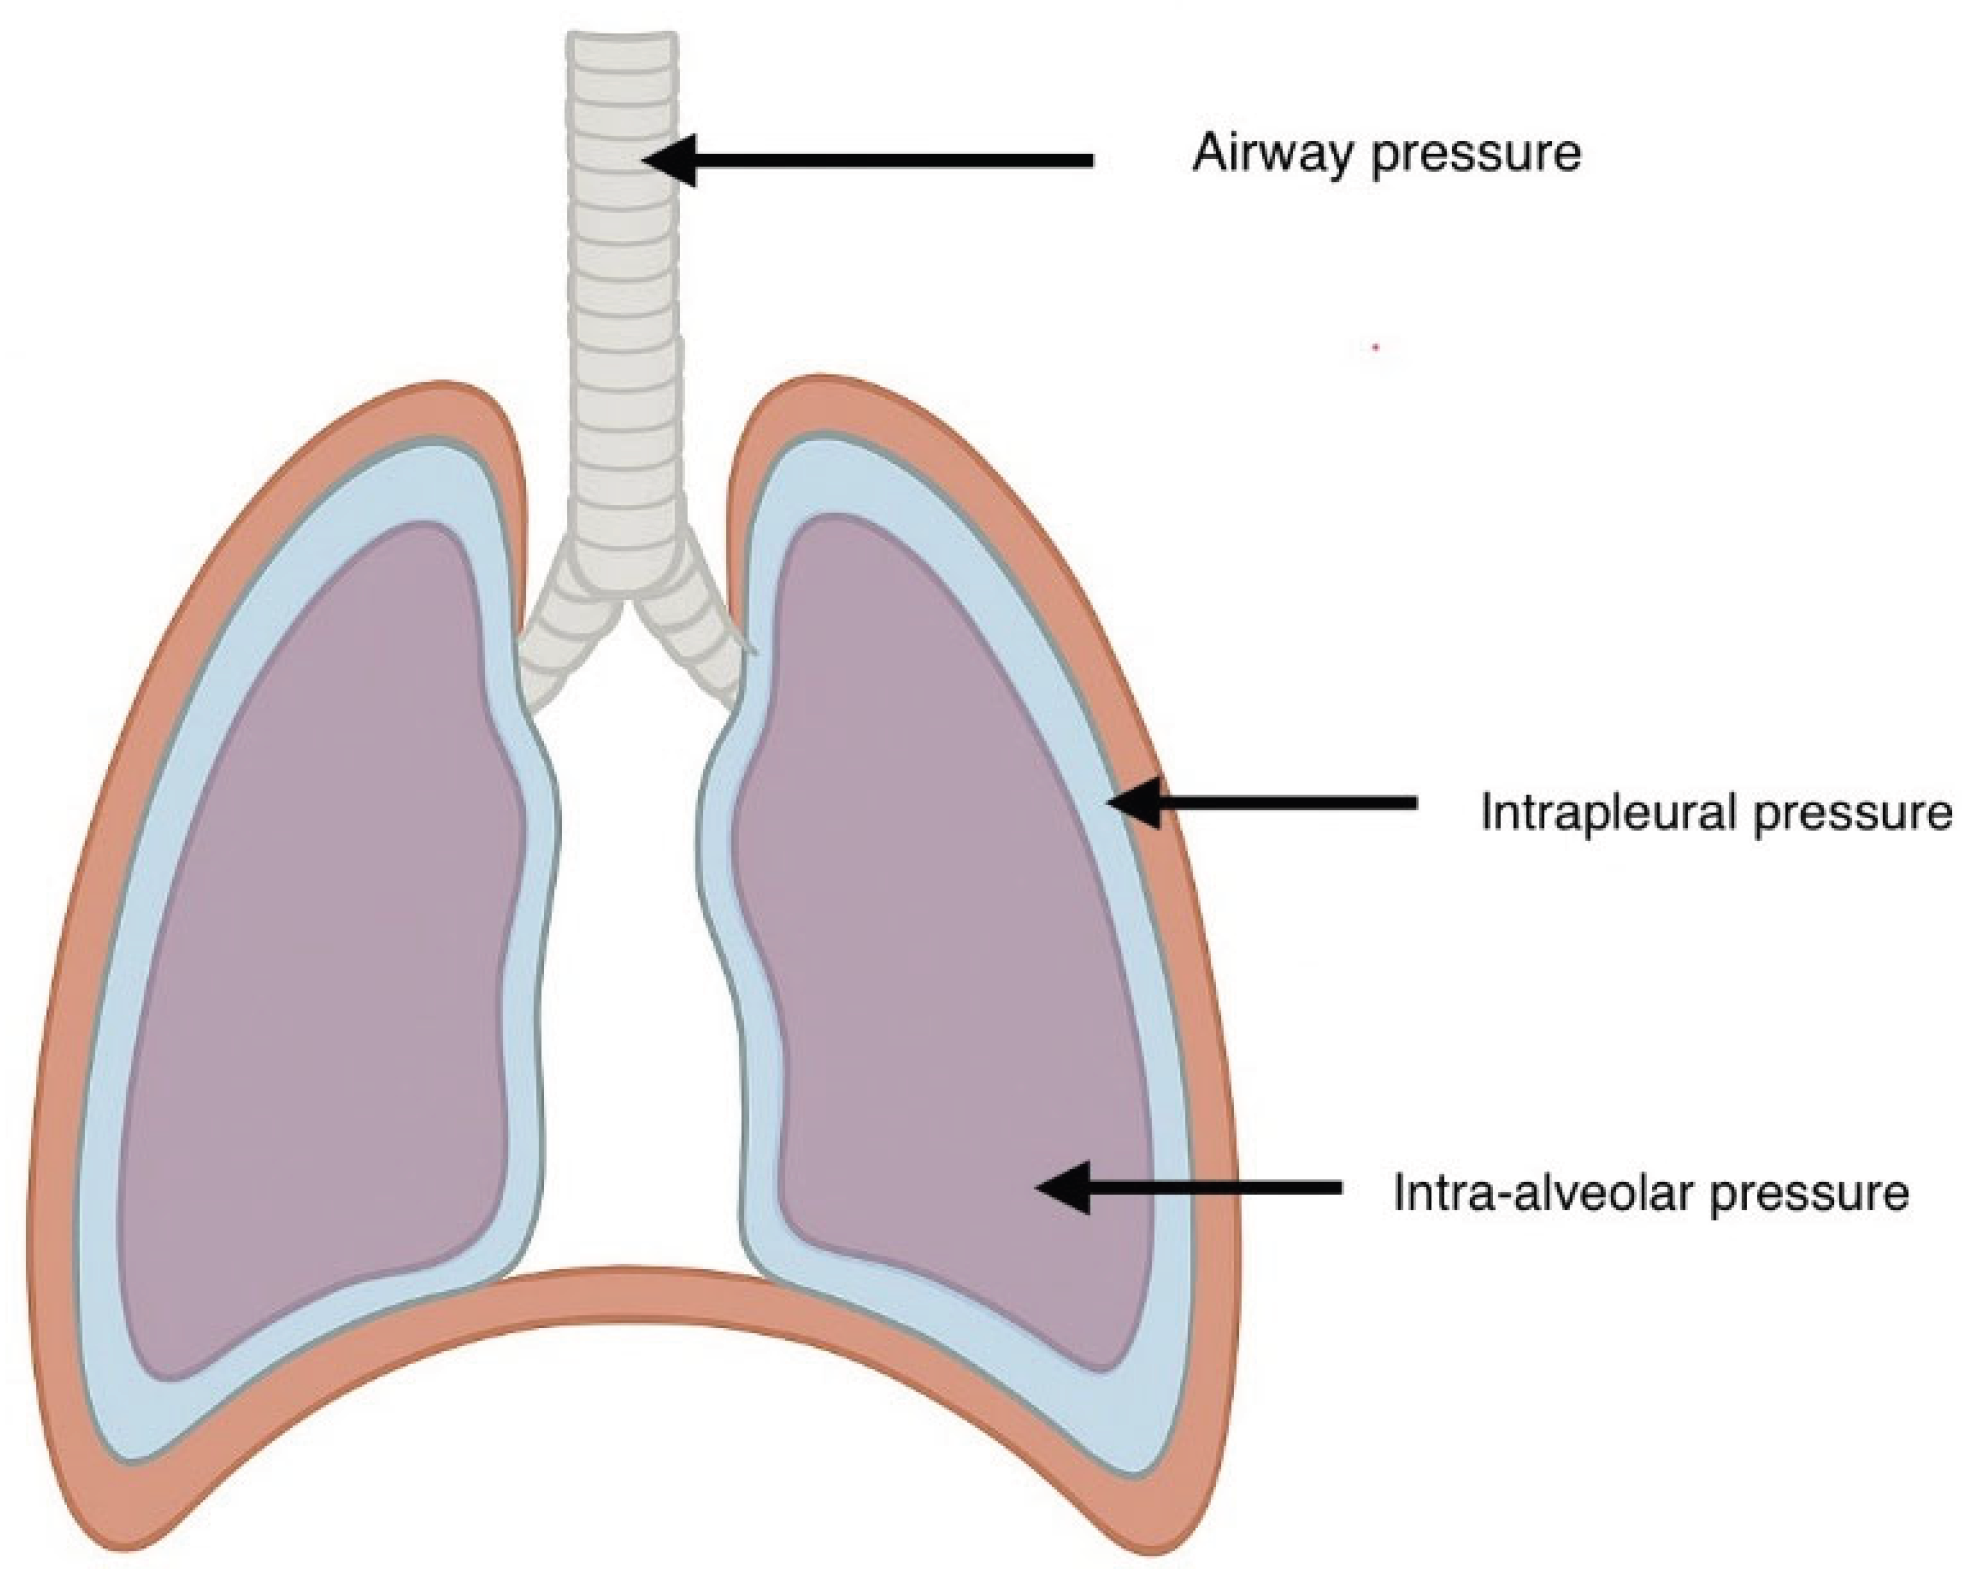
Figure 1.
Schematic illustration of various compartments in thoracic cavity. During a no-flow state the airway pressure approximates the alveolar pressure. The airway pressure forms the basis for monitoring peak and plateau pressures. Pleural pressure acts externally to the lung parenchyma and indirectly measured using esophageal pressure monitor. Transpulmonary pressure is derived by subtracting the pleural pressure from the airway pressure. The value of transpulmonary pressure can approximately tell us the whether the alveoli are collapsed (negative value i.e. < /= 0 cm H2O) or open (positive value i.e > 0 cm H2O).
The changes in airway pressure, pleural pressure and trans pulmonary pressure depend on different modes of ventilation and interplay between native and ventilator assisted breath [7].
Spontaneous Ventilation
Spontaneous ventilation is characterized by the generation of sub-atmospheric intra-thoracic pressure as the diaphragm and inter coastal muscles actively contract with resultant expansion of the thoracic cavity. The descent of the diaphragm, together with the coordinated activity of intercostal and accessory muscles, increases thoracic volume and thereby reduces pleural pressure (Ppl). The more negative pleural pressure thus increases the trans-pulmonary pressure causing lung distension lowering alveolar pressure [7].
This reduction in pleural pressure along with alveolar pressure (Palv) below atmospheric pressure, creates a negative pressure gradient that drives airflow from the airway opening into the alveoli. As lung volume increases, alveolar pressure gradually equilibrates with atmospheric pressure, terminating inspiratory flow. The higher elastic recoil pressure of the expanded lung is said to be in equilibrium with the increased trans-pulmonary pressure at the end of inspiration [5,7].
Passive expiration begins by decreased activity in the inspiratory muscles leading to chest wall recoil with increase in pleural pressure, thus decreasing the trans-pulmonary distending pressure. As the elastic recoil exceeds the trans-pulmonary pressure, the lung volume decreases. This results in higher intra-alveolar pressure compared to atmospheric pressure leading to expiration. However, at the end of expiration, pleural pressure remains slightly negative relative to atmosphere (which is approximately-4 mm Hg at rest), maintaining alveolar patency through a positive trans-pulmonary pressure (PL = Palv – Ppl). This ensures functional residual capacity (FRC) and prevents alveolar collapse. Expiration can be further augmented by active contraction of abdominal and certain inter-coastal muscles
From a hemodynamic standpoint, spontaneous negative pressure breathing enhances venous return to the right atrium by reducing right atrial pressure relative to systemic venous pressure. This physiological mechanism preserves or augments cardiac preload and supports cardiac output, in contrast to positive pressure ventilation, which can impede venous return through elevated intra-thoracic pressures [7].
- Airway Pressure (Paw): At the airway opening, Paw remains close to atmospheric pressure (0 cmH₂O) throughout most of the cycle, with only small variations due to resistance in the conducting airways.
- Pleural Pressure (Ppl): Becomes more negative during inspiration due to diaphragmatic contraction and expansion of the thoracic cavity.
- Trans-pulmonary Pressure (PL): Increases during inspiration because Ppl decreases while Paw remains nearly constant. This rising PL generates alveolar expansion and airflow into the lungs.
In spontaneous ventilation, lung inflation is predominantly driven by the fall in pleural pressure rather than by a rise in Paw. Spontaneous ventilation relies on negative intra-thoracic pressure swings to drive airflow and preserve favorable cardiopulmonary interactions, distinguishing it from positive pressure ventilation [6].
Controlled Ventilation (Positive Pressure Breathing)
Controlled mechanical ventilation is characterized by the application of positive airway pressure (Paw) delivered cyclically by the ventilator. During inspiration, Paw is actively elevated above baseline, generating a pressure gradient that drives airflow into the alveoli. This externally applied pressure simultaneously overcomes the resistive load of the conducting airways and the elastic recoil forces of the lung–thorax system.
Because a fraction of this applied Paw is transmitted through the lung parenchyma to the pleural space, pleural pressure (Ppl) becomes less negative and may even rise above atmospheric levels during inspiration. Despite this increase in Ppl, the trans-pulmonary pressure (PL = Paw − Ppl) increases overall, as the elevation in Paw exceeds the transmitted rise in Ppl. The net effect is alveolar distension and lung inflation [8].
From a cardiovascular perspective, the hemodynamic consequences differ substantially from spontaneous breathing. The elevation in intra-thoracic pressure during positive pressure ventilation can impede systemic venous return by increasing right atrial pressure and reducing the pressure gradient for venous inflow. Consequently, cardiac preload may be compromised, and in some cases, cardiac output decreases [9].
While controlled ventilation ensures precise control of tidal volume and gas exchange, it introduces risks such as barotrauma, volutrauma, and hemodynamic impairment, particularly if Paw and transpulmonary pressures are excessive. Thus, careful titration of tidal volume, plateau pressure, and positive end-expiratory pressure (PEEP) is required to balance oxygenation needs against the risk of ventilator-induced lung injury (VILI) and circulatory compromise.
- Airway Pressure (Paw): Actively raised above baseline during inspiration by the ventilator. This positive pressure overcomes airway resistance and elastic recoil.
- Pleural Pressure (Ppl): Rises slightly (becomes more positive) during inspiration, since part of Paw is transmitted to the pleural space.
- Trans-pulmonary Pressure (PL): Increases because Paw rises more than Ppl, leading to alveolar inflation.
Lung inflation is driven by a rise in Paw applied externally, rather than by pleural pressure changes. Controlled mechanical ventilation relies on externally applied positive airway pressure to inflate the lungs [8].
Assisted Ventilation (Patient–Ventilator Interaction)
Assisted ventilation represents ahybrid modeof breathing in which the patient initiates the respiratory cycle through inspiratory effort, while the ventilator subsequently augments that effort with positive pressure support. At the onset of inspiration, the patient generates anegative swing in pleural pressure (Ppl), loweringairway pressure (Paw)transiently below baseline. This pressure change serves as the trigger for the ventilator to deliver a pre-set level of positive pressure.
Once triggered, Paw rises as the ventilator provides gas flow, while Ppl remains more negative than in passive mechanical ventilation due to continued patient muscular effort. The interaction of these forces leads to a synergistic increase in trans-pulmonary pressure (PL = Paw − Ppl): both the patient’s negative intra-thoracic pressure and the ventilator’s positive Paw contribute to alveolar distension. As a result, alveolar inflation may exceed that achieved by either spontaneous effort or controlled mechanical ventilation alone [10].
From a hemodynamic perspective, assisted ventilation tends to preserve some of the favorable effects of negative pressure breathing (enhanced venous return, maintained cardiac preload) while simultaneously providing ventilatory support that reduces the patient’s work of breathing (WOB). However, the superimposition of negative pleural swings on positive Paw may generate excessive trans-pulmonary pressure gradients, predisposing to regional over-distension, patient self-inflicted lung injury (P-SILI), or ventilator-induced lung injury (VILI) [11].
Furthermore, patient–ventilator asynchrony—occurring when ventilator timing or pressure delivery is mismatched with the patient’s neural respiratory drive—can lead to inefficient ventilation, increased metabolic demand, and patient discomfort. Optimal management of assisted modes therefore requires careful adjustment of trigger sensitivity, flow delivery, and pressure targets to balance support with physiologic safety.
- Airway Pressure (Paw): Initially falls slightly as the patient generates a negative inspiratory effort, which triggers the ventilator. Once triggered, Paw rises as positive pressure is delivered.
- Pleural Pressure (Ppl): Drops due to patient effort, often more negative than in spontaneous breathing alone, then partially countered by the delivered Paw.
- Trans-pulmonary Pressure (PL): May rise synergistically: both falling Ppl (patient effort) and rising Paw (ventilator assistance) increase PL together, leading to enhanced alveolar distension.
Assisted ventilation combines patient-generated negative intra-thoracic pressures with ventilator-delivered positive airway pressures, producing a synergistic increase in trans-pulmonary pressure. While this approach can improve comfort and reduce WOB, it carries risks of excessive alveolar stress and patient–ventilator asynchrony if not carefully managed [10]. See Table 1 for comparison of respiratory mechanics during spontaneous, controlled and assisted ventilation.
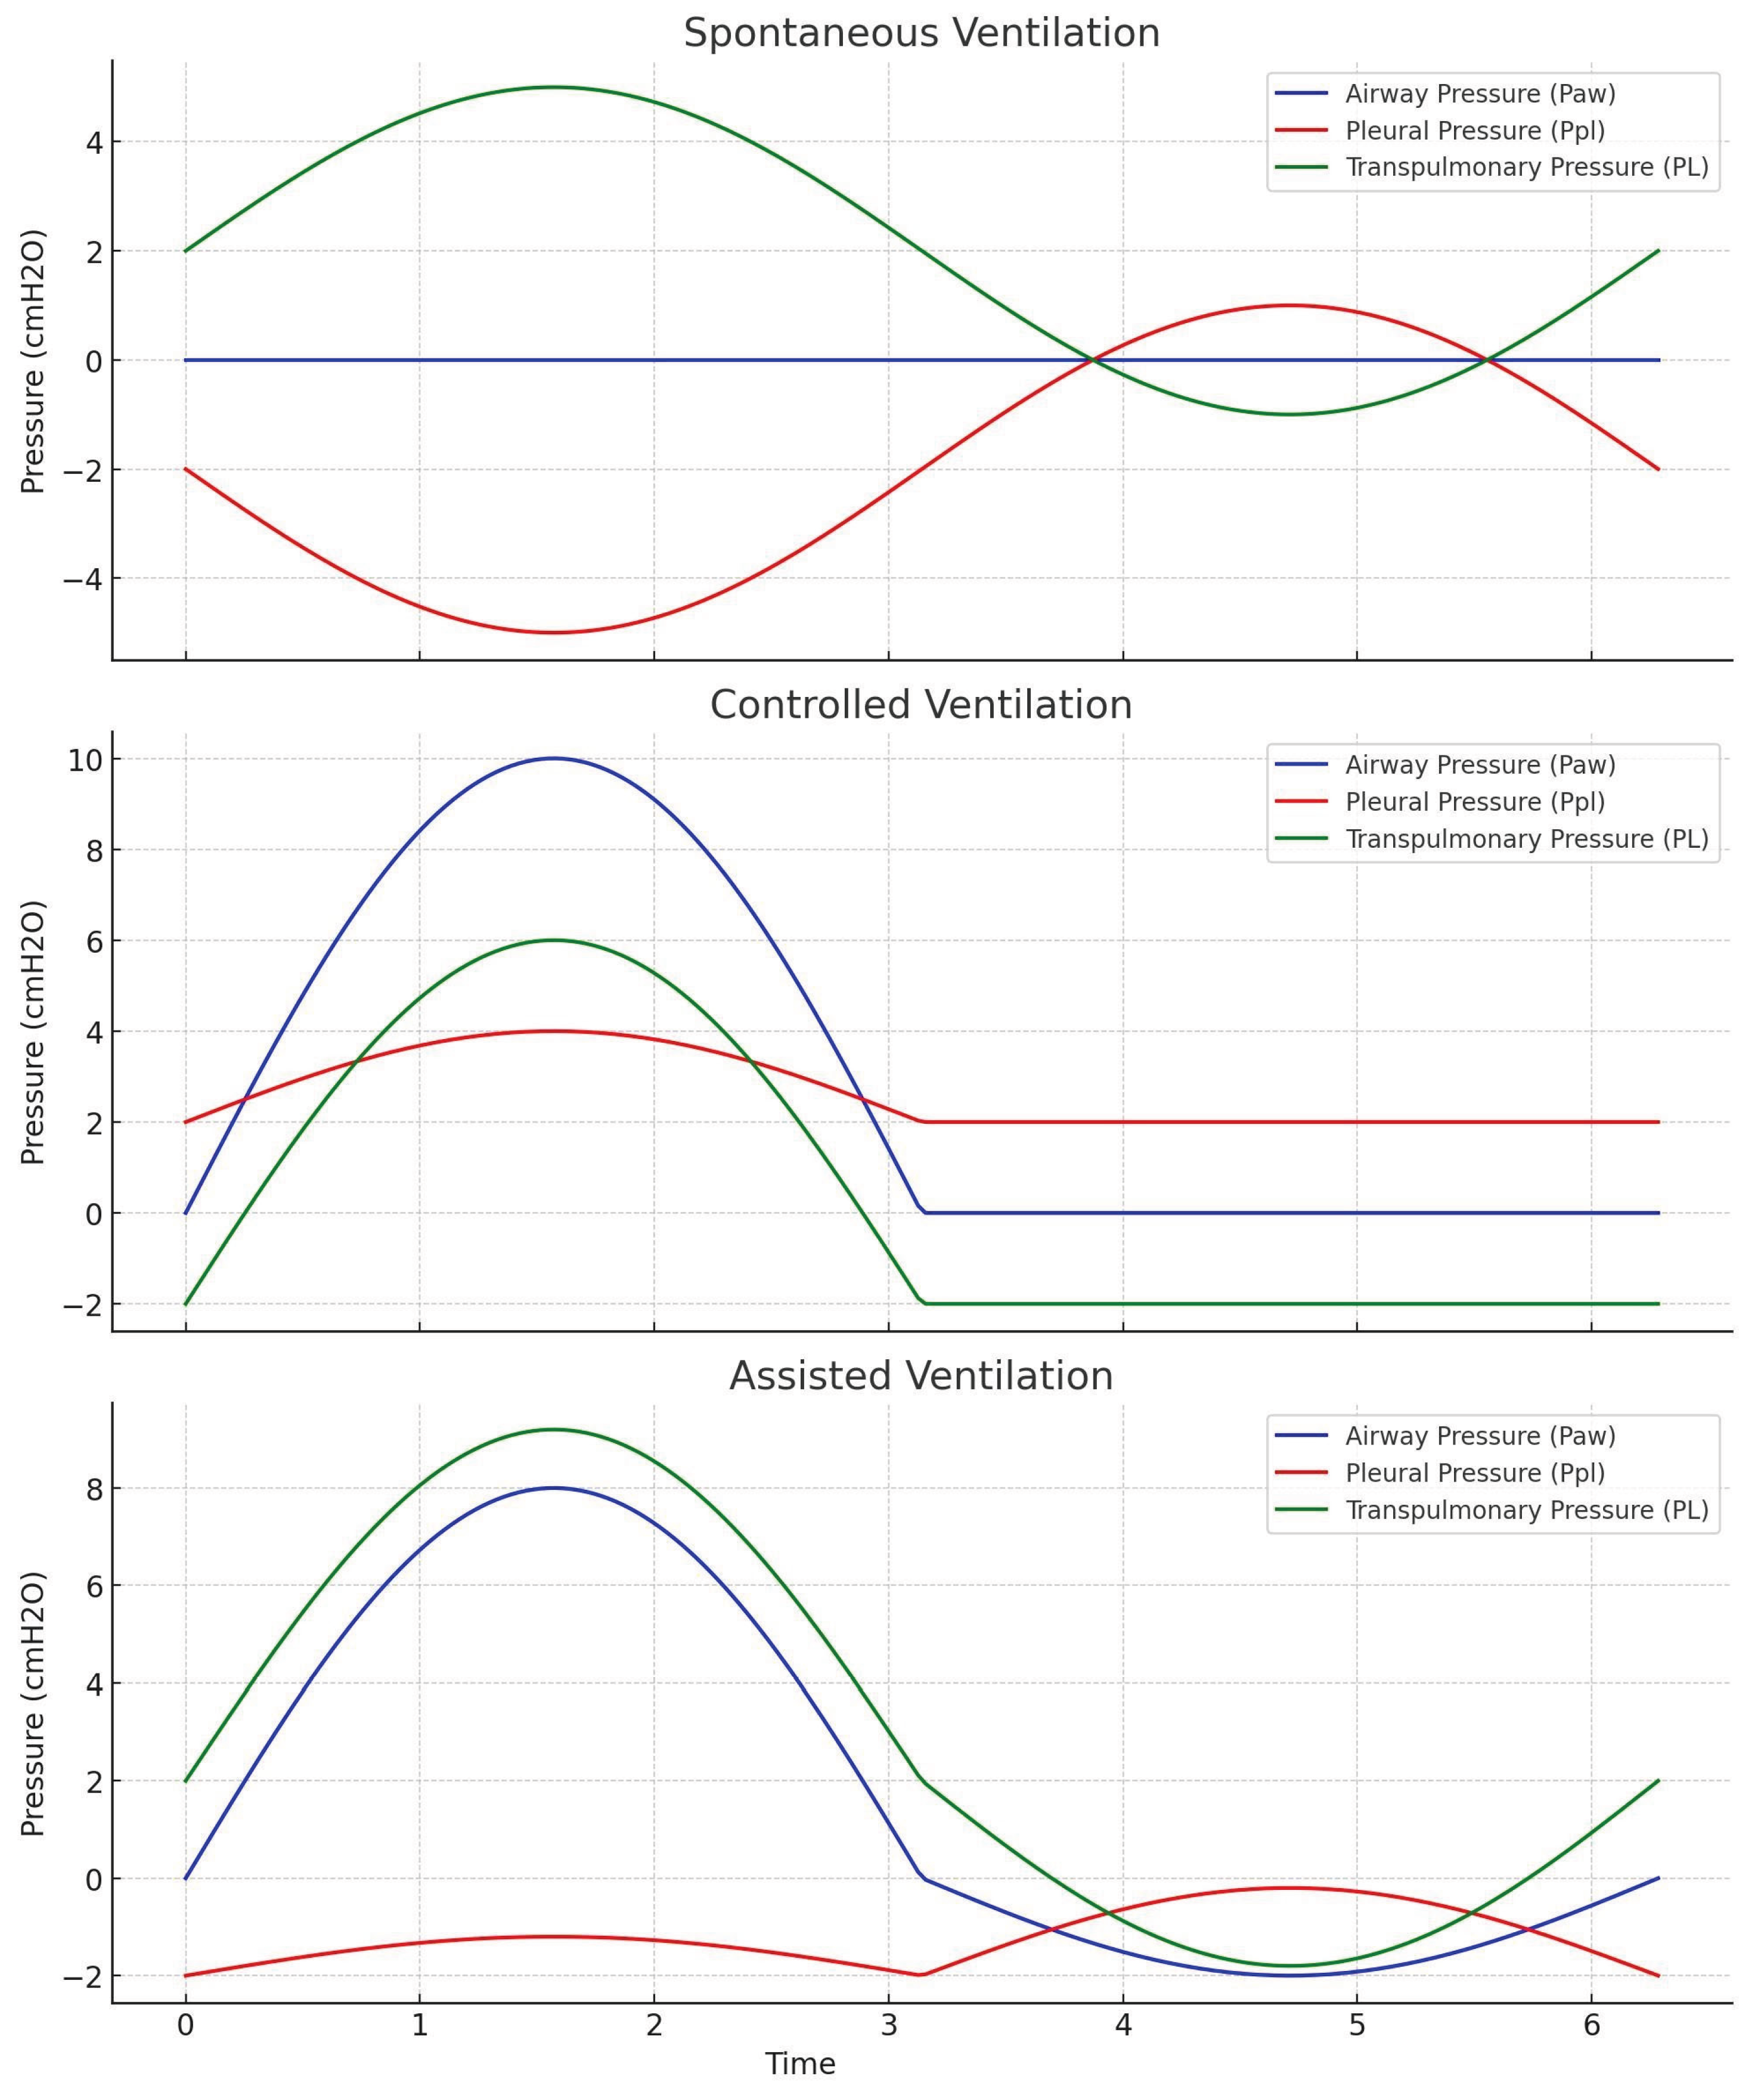
Figure 2.
Schematic illustration of changes in the airway pressure, pleural pressure and transpulmonary pressure on a pressure-time scalar during spontaneous, controlled and assisted ventilation. During spontaneous ventilation, the more negative pleural pressure thus increases the trans-pulmonary pressure causing lung distension lowering alveolar pressure. Controlled mechanical ventilation is characterized by the application of positive airway pressure (Paw) delivered cyclically by the ventilator. This also results in increase in Ppl, however the trans-pulmonary pressure (PL = Paw − Ppl) also increases overall, as the elevation in Paw exceeds the transmitted rise in Ppl. Assisted ventilation combines patient-generated negative intra-thoracic pressures with ventilator-delivered positive airway pressures, producing a synergistic increase in trans-pulmonary pressure. (Please note the scale on the Y-axis has not been adjusted. This is for illustration purposes only).
2. Static and Dynamic Trans-pulmonary Pressure
During periods of no (or zero) airflow—achieved clinically with an inspiratory or expiratory hold maneuver—airway pressure (Paw) equilibrates with alveolar pressure (Palv). Under these static conditions, the pressure difference between the alveoli and the pleural space directly represents the static trans-pulmonary pressure (PL), defined as:
Plstatic=Palv−Ppl
This measurement reflects the true distending pressure of the lung parenchyma when resistive pressure components are absent, thereby providing a reliable index of alveolar stress at a given lung volume [12].
In contrast, during active airflow, Paw is influenced not only by the elastic recoil of the respiratory system but also by resistive pressure arising from gas flow through the conducting airways. In this context, the trans-pulmonary pressure is termed dynamic PL, and can be approximated as:
Pldynamic=Paw−Ppl
Here, Paw exceeds Palv by the amount of pressure needed to overcome airway resistance. Thus, dynamic PL incorporates both the elastic and resistive loads, making it dependent on flow conditions and inspiratory effort [12].
Clinically, differentiation between static and dynamic PL is essential:
- Static PL provides insight into alveolar distending pressure and the risk of over distension under set ventilatory conditions.
- Dynamic PL reflects the combined mechanical forces during tidal breathing and is useful for understanding the interaction of airflow, resistance, and patient effort with ventilator-delivered pressure.
Static PL, measured during no-flow conditions, isolates the elastic distending pressure of the lung, whereas dynamic PL, measured during airflow, integrates both resistive and elastic components. Together, they provide complementary perspectives on lung mechanics and ventilator-induced stress [12].
3. Stress, Strain, and Ventilator-Associated Lung Injury (VALI)
The concepts of stress and strain provide a mechanistic framework for understanding ventilator-induced lung injury.
- Stress refers to the distending force per unit area applied to lung tissue. Clinically, this is represented by the trans-pulmonary pressure (PL), which reflects the difference between alveolar and pleural pressures. It is the direct mechanical load experienced by the alveolar walls and interstitium during ventilation [13].
- Strain denotes the resultant deformation of the lung parenchyma, expressed as the ratio of the change in lung volume (ΔV) to the reference resting volume, usually the functional residual capacity (FRC). Thus, strain quantifies how much the lung is inflated relative to its baseline size, independent of absolute volume [13].
When stress and strain remain within physiological ranges, ventilation supports gas exchange without injury. However, excessive stress (over-distending pressure) or excessive strain (volumes far above FRC) can disrupt the structural integrity of alveolar–capillary units. This mechanical overload may lead to epithelial and endothelial cell injury, increased permeability pulmonary edema, biotrauma, with the release of inflammatory mediators and ultimately ventilator-associated lung injury (VALI). This underscore the rationale for monitoring pleural pressure [13].
Esophageal Pressure Monitoring
1. Esophageal pressure as a surrogate of Pleural Pressure
Early esophageal manometry began as a research tool to approximate pleural pressure, and is increasingly being used for lung-protective strategies in Acute respiratory distress syndrome (ARDS). Current adoption remains highest in academic and research ICUs. Barriers include training, setup/calibration time, and perceived complexity [14].
Direct measurement of pleural pressure (Ppl) in vivo is not routinely feasible at the bedside. Instead, esophageal pressure (Pes), obtained via a balloon catheter positioned in the mid-thoracic esophagus, has been established as a practical surrogate. The rationale for this approach is based on the anatomical location of the esophagus within the thoracic cavity, where it is exposed to the surrounding pleural space and thus experiences pressure changes that closely parallel pleural pressure [15].
Experimental and clinical studies have demonstrated a strong correlation between Pes and regional pleural pressure, particularly in the mid-thoracic region where gravitational and chest wall effects are relatively balanced. This makes Pes a valuable tool for estimating trans-pulmonary pressure (PL = Paw – Pes) and for guiding individualized ventilator management. However, limitations exist. The thoracic cavity is not a uniform pressure chamber; pleural pressures vary between dependent lung regions (where pressures tend to be more positive due to the weight of lung tissue and abdominal contents) and non-dependent regions (where pressures are relatively negative) [15]. This regional heterogeneity is especially pronounced in pathological states such as acute respiratory distress syndrome (ARDS), where alterations in compliance and regional collapse amplify the differences. Consequently, Pes represents an average or regional estimate of Ppl rather than an absolute measurement across the entire lung [16].
Despite these limitations, monitoring esophageal pressure provides a clinically relevant approximation of pleural pressure dynamics. When interpreted carefully, it offers unique insight into patient-specific respiratory mechanics, informs the calculation of trans-pulmonary pressures, and supports lung-protective ventilation strategies aimed at minimizing ventilator-associated lung injury (VALI).
2. Factors Influencing the Accuracy of Esophageal Pressure Monitoring
Although esophageal pressure (Pes) serves as a practical surrogate for pleural pressure (Ppl), its accuracy is subject to several technical and physiological considerations:
Balloon Positioning
Correct placement of the esophageal balloon catheter is critical. The most reliable measurements are obtained when the balloon lies in the mid-thoracic esophagus, posterior to the left atrium (retro-cardiac position). Malpositioning, such as placement too high in the cervical esophagus or too low in the gastric fundus, can introduce artifacts that distort the pressure signal [17].
Body Position and Mediastinal Weight
The esophagus is subject to external influences, particularly the weight of mediastinal structures and the heart, which can transmit additional pressure to the balloon. These effects vary with body position; for example, in the supine position, the retro cardiac location may exaggerate Pes readings, whereas lateral or prone positioning may alter pressure transmission differently [16].
Regional Heterogeneity of Pleural Pressure
Pleural pressure is not uniform across the lung. Dependent regions typically experience more positive pressures due to the weight of the lung and abdominal contents, while non-dependent regions are exposed to more negative pressures. In pathological conditions such as acute respiratory distress syndrome (ARDS), regional compliance differences and alveolar collapse further amplify this heterogeneity. Consequently, Pes provides an approximation of average pleural pressure, rather than a direct measure of pressures in all lung regions [15].
3. Contraindications to Esophageal Balloon Placement
The insertion of an esophageal balloon catheter carries similar contraindications to nasogastric tube placement [18]. Situations where the procedure should be avoided include:
- Esophageal varices, due to the risk of rupture and life-threatening hemorrhage.
- Coagulopathy, which increases the risk of bleeding from mucosal trauma.
- Severe facial or basilar skull fractures, where transnasal passage of the catheter may be hazardous [18].
In such cases, alternative approaches to estimate pleural pressure or guide ventilatory management should be considered.
4. Equipment and Catheters for Esophageal Pressure Monitoring
Accurate measurement of esophageal pressure (Pes) requires specialized catheters and monitoring equipment designed to optimize signal fidelity while minimizing patient risk. Several catheter systems are available, each with distinct advantages and limitations [19]:
Balloon Catheters
Traditional air-filled balloon catheters (e.g., Cooper, Nutrivent systems) remain the most commonly used devices. When properly inflated with a small, standardized volume of air, the balloon provides a compliant interface between the esophageal wall and the pressure transduction system. This minimizes the risk of mucosal apposition or occlusion, ensuring that the measured pressure reflects intrathoracic changes rather than localized wall contact [20,21].
Dual-Balloon Catheters
More advanced configurations incorporate two balloons, one positioned in the esophagus and the other in the stomach. This design enables simultaneous measurement of esophageal pressure (Pes) and gastric pressure (Pga), allowing calculation of trans-diaphragmatic pressure (Pdi = Pga – Pes). Such measurements are particularly valuable in evaluating diaphragmatic function and guiding ventilatory strategies in certain critically ill patients.
Microsensor Catheters
Catheters equipped with solid-state microsensors at their distal end provide faster response times and are less prone to signal dampening compared with balloon-based systems. However, they may be more susceptible to artifacts from direct wall contact or secretions, and their cost and fragility can limit widespread use in clinical practice.
Tubing and Transducer Systems
Regardless of catheter type, accurate signal acquisition depends on a rigid, non-compliant pressure transmission system. High-pressure tubing is typically used to connect the catheter to a pressure transducer, which interfaces with either a standard patient monitor or the auxiliary monitoring ports of a mechanical ventilator. Proper calibration and zeroing are essential to ensure valid pressure readings [19].
5. Technique: Insertion and Positioning
Esophageal balloon catheters can be introduced via the nasal or oral route, following a technique similar to nasogastric tube placement. The catheter is typically advanced to a depth of 50–60 cm, positioning the balloon first within the stomach. Correct gastric placement can be confirmed by performing an epigastric pressure test, in which gentle external compression of the epigastrium produces a synchronous rise in recorded pressure.
Once gastric placement is verified, the catheter is gradually withdrawn to a depth of approximately 35–45 cm, allowing the balloon to reside in the mid-thoracic esophagus. At this position, the tracing should display characteristic cardiac oscillations and respiratory pressure fluctuations, confirming its exposure to intrathoracic pressure dynamics [17].
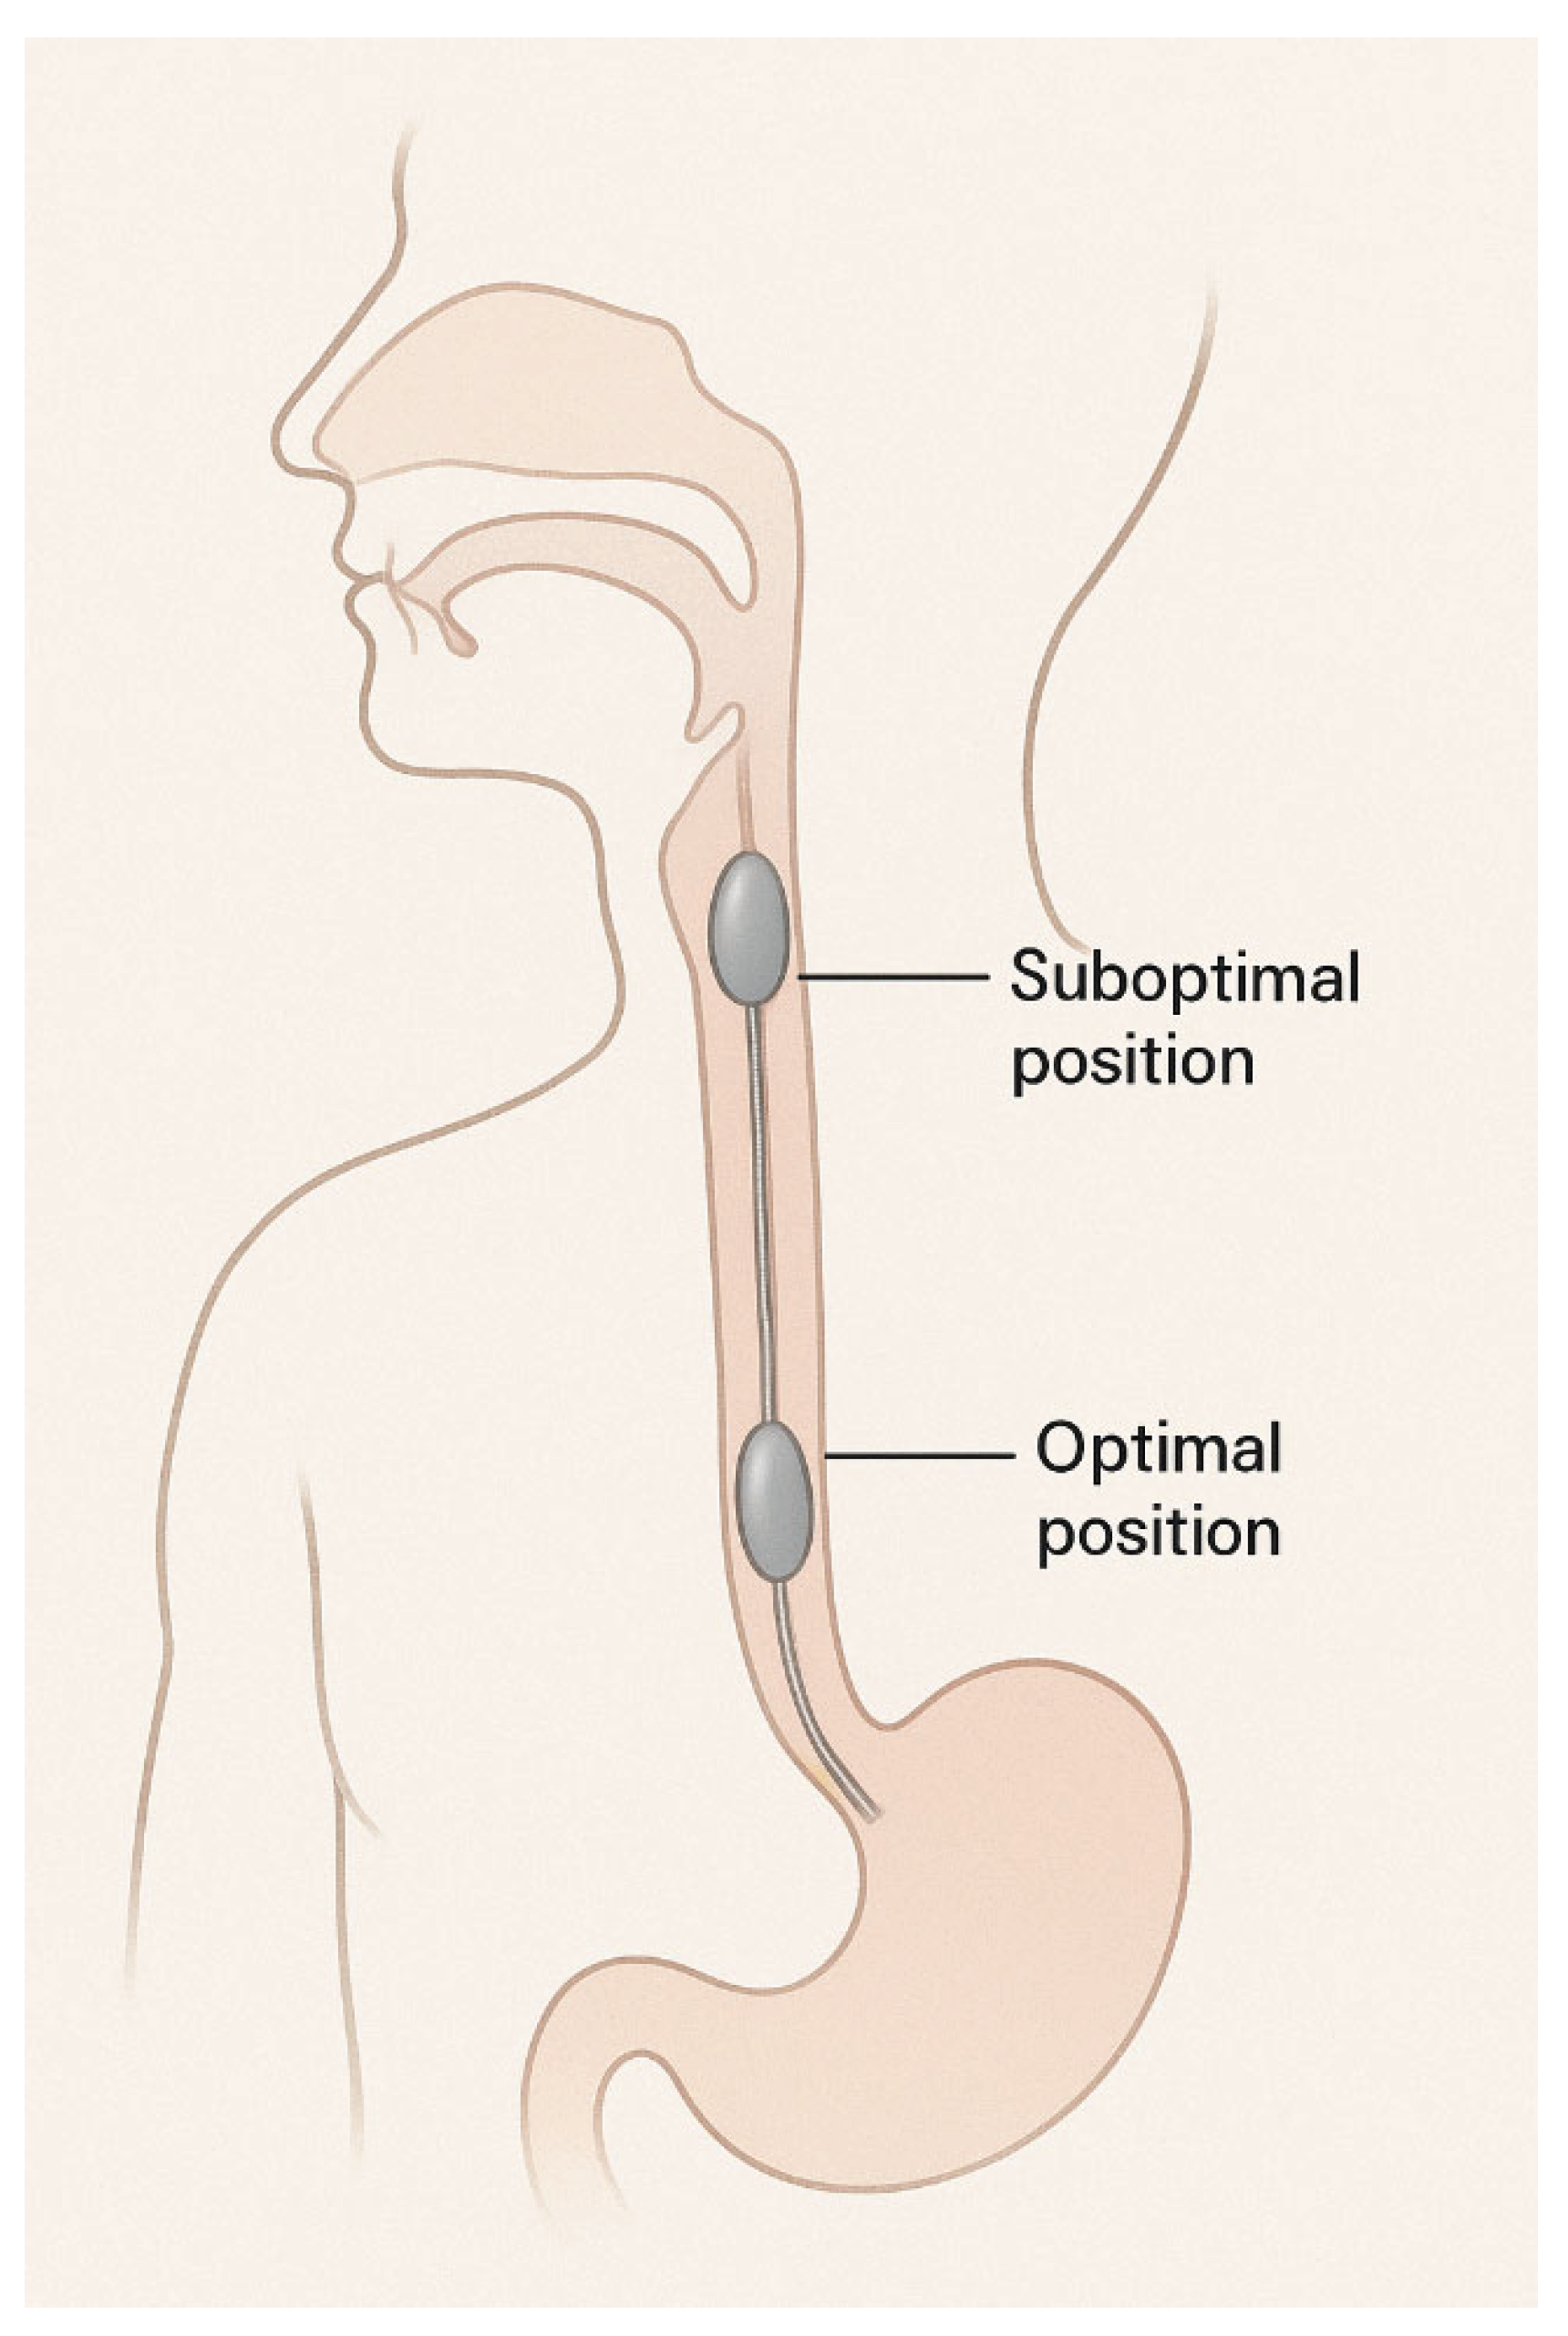
Figure 3.
Schematic illustration of optimal position of esophageal catheter. Suboptimal position can lead to artifacts or loss of signal. Too high in the esophagus as shown in this figure as “suboptimal position” can lead to falsely low pressures. Absence of cardiac oscillations may indicate a suboptimal position.
Confirmation of Correct Positioning
Several methods are used to validate accurate balloon placement and ensure reliable Pes recordings:
Cardiac Oscillations
The presence of small rhythmic fluctuations on the esophageal pressure tracing, synchronous with the cardiac cycle, indicates appropriate retro cardiac positioning [17]. See Figure 3 for schematic illustration of optimal position of esophageal catheter.
Comparison with Airway Pressure Waveforms
Respiratory swings in Pes should closely mirror those in airway pressure (Paw), though with different absolute values, reflecting parallel changes in pleural and airway pressures during the respiratory cycle [19]. See Figure 4 for pressure swings with optimal placement. See Figure 5 for pressure swings with gastric pattern when the catheter is inappropriately positioned in the stomach.
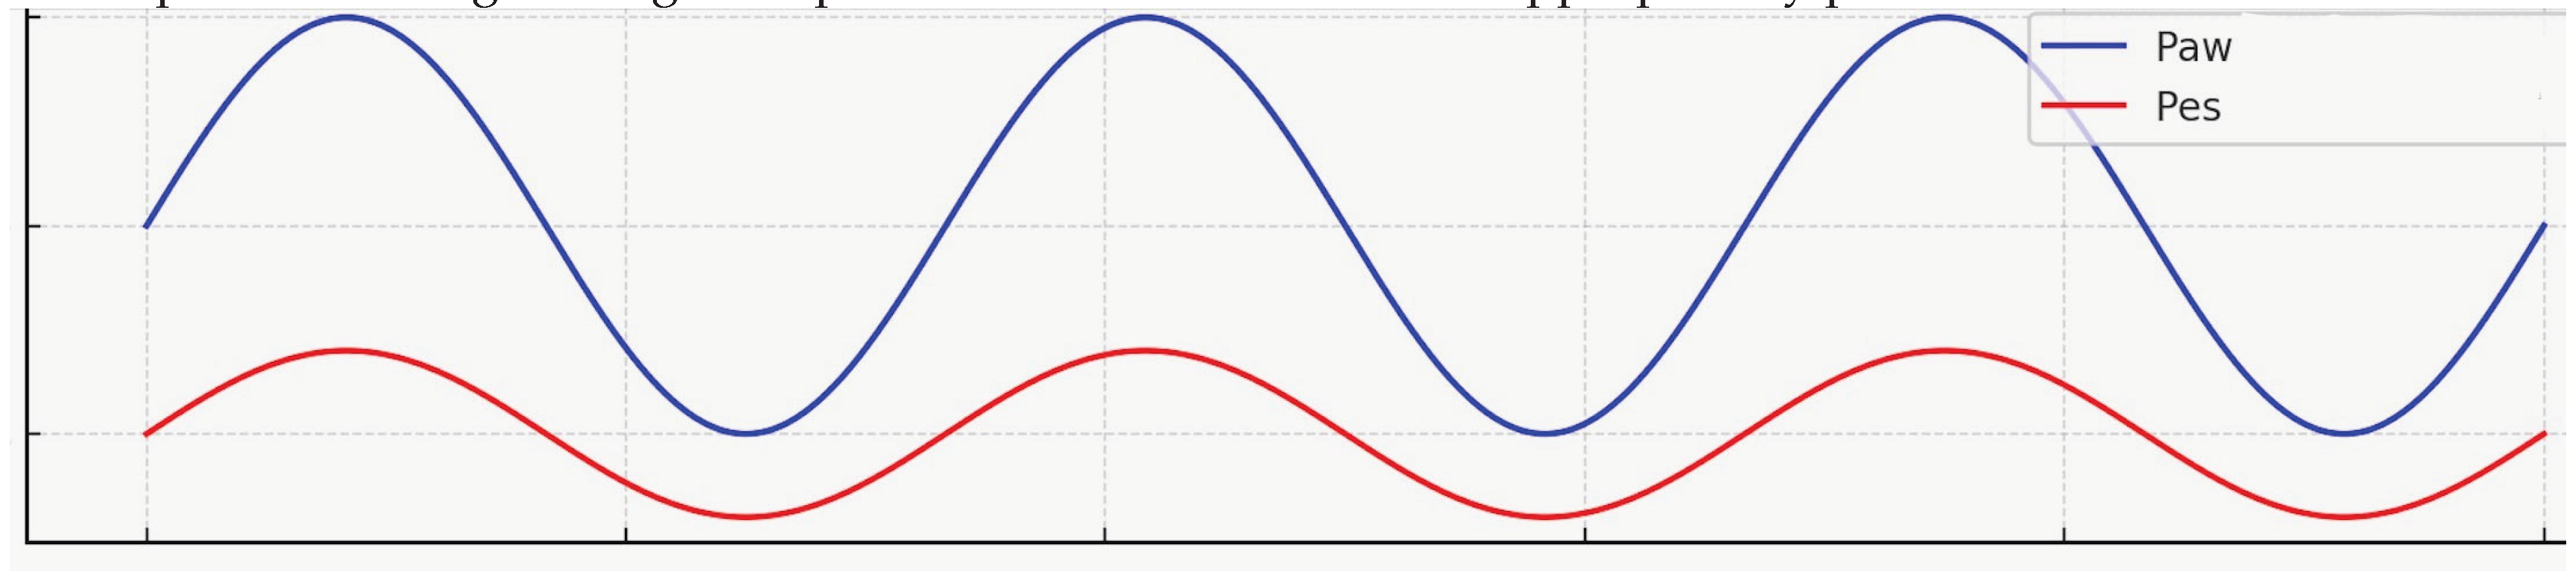
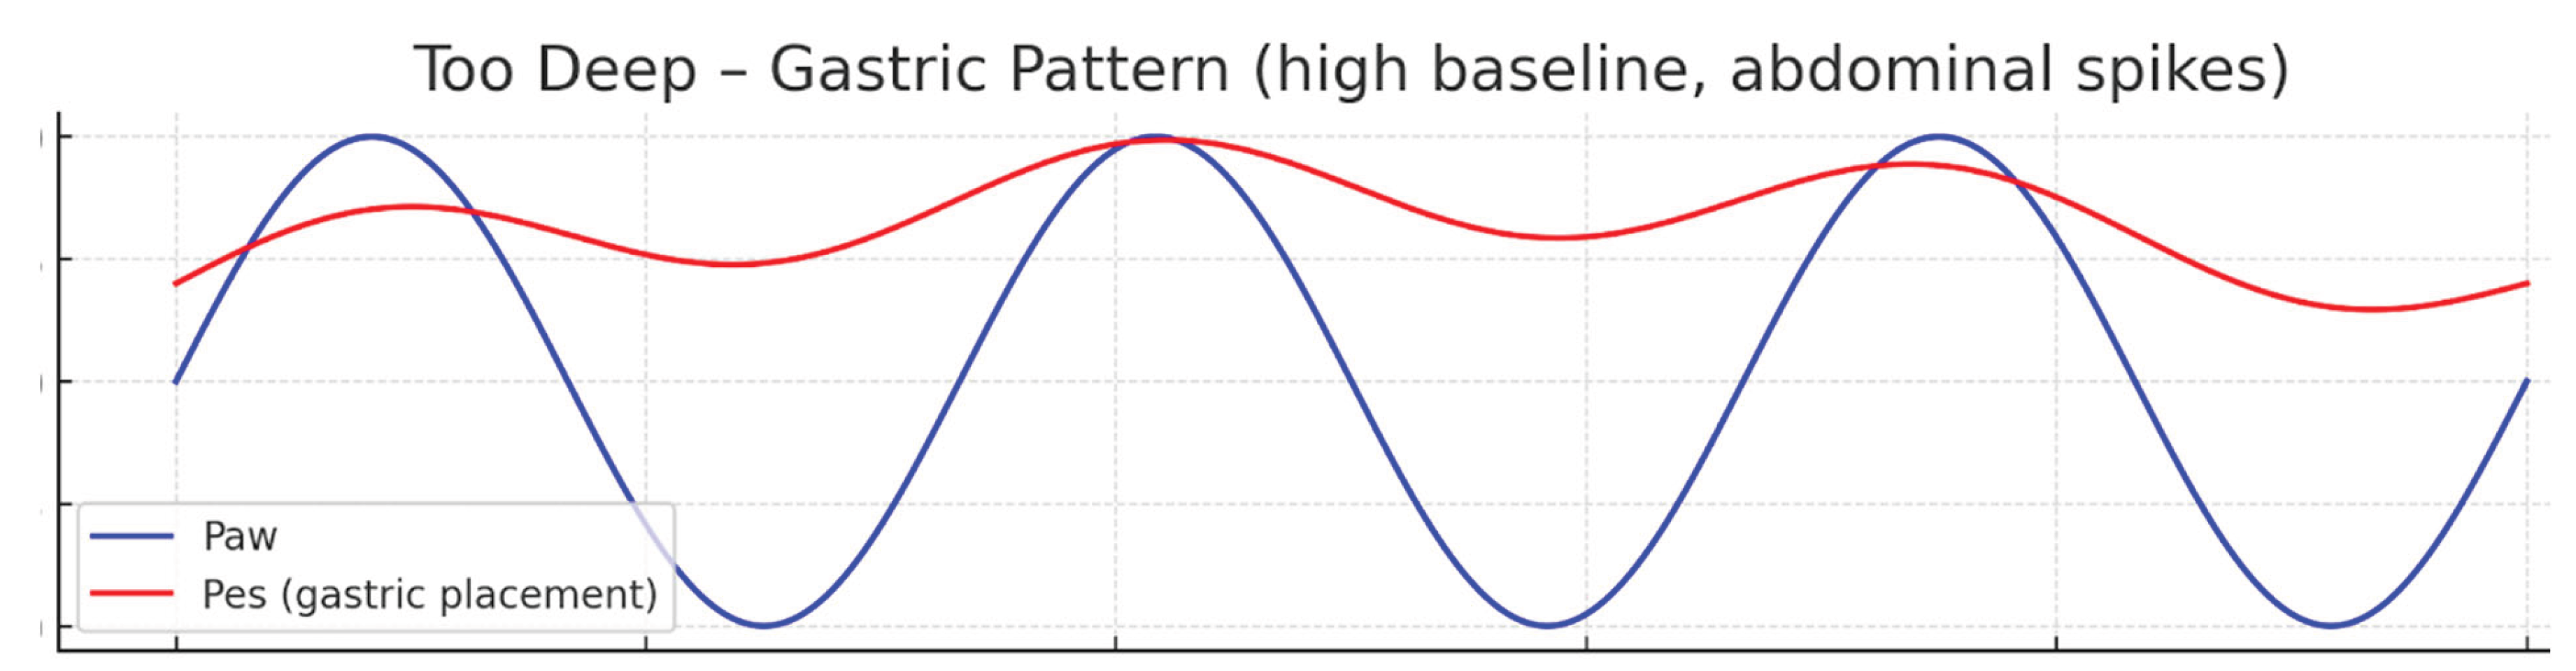
Figure 4.
Schematic illustration of Paw and Pes on pressure time scalar (Pressure on Y axis, time on x axis). Note that the Pes swings closely mirror the Paw swings. This indicates an optimal placement. Cardiac oscillations may be seen on the Pes curve, which is not illustrated here.(Please note the scale on the Y-axis has not been adjusted. This is for illustration purposes only).
Figure 5.
Schematic illustration of Paw and Pes on pressure time scalar (Pressure on Y axis, time on x axis). Note that the Pes has high baseline and abdominal spikes can be seen which are induced by positive pressure ventilation. This is considered a gastric pattern and the catheter should be withdrawn 5 – 10 cm in graded steps. (Please note the scale on the Y-axis has not been adjusted. This is for illustration purposes only). .
Occlusion Test
The most rigorous validation method involves an airway occlusion maneuver. The airway is occluded during an inspiratory effort and ratio of the change in airway pressure (ΔPaw) to the change in esophageal pressure (ΔPes) is measured and should approximate 0.8 to 1.2. A ratio within this range confirms that Pes is accurately reflecting intrathoracic pressure changes. This maneuver can also be performed with gentle external thoracic compression to assess the consistency of pressure transmission [19].
Balloon Inflation and Calibration
Zeroing the System: Before inflation, the pressure monitoring system should be zeroed to atmospheric pressure, ensuring that subsequent readings reflect only physiological pressures
Accurate measurement of esophageal pressure (Pes) depends not only on correct catheter positioning but also on appropriate balloon inflation. Both under inflation and overinflation can distort the pressure signal, either by failing to maintain consistent balloon–wall contact or by transmitting balloon wall tension rather than intrathoracic pressure [22] .
Inflation and Deflation Protocol
The balloon is first fully inflated to eliminate any folds or wall apposition. It is then gradually deflated to a volume recommended by the manufacturer, termed the optimal balloon volume (Vbest). At this volume, the balloon is compliant enough to transmit surrounding pressure changes without introducing significant elastic recoil of its own.
- Cooper catheter: Typically inflated with 2 mL of air and then deflated to approximately 1.2 mL [20].
- Nutrivent catheter: Inflated with 4 mL of air and deflated to approximately 1.5 mL [21].
Definition of Vbest
Vbest is defined as the balloon volume at which the swing in esophageal pressure (ΔPes) is maximal and artifacts from balloon recoil or esophageal wall contact are minimal. At this point, the recorded Pes most accurately represents surrounding pleural pressure.
Selecting the correct balloon inflation volume is critical for obtaining valid Pes measurements. Overinflation risks overestimating pleural pressure due to balloon wall stiffness, whereas under inflation can lead to signal dampening and loss of fidelity. Thus, careful titration to Vbest is a fundamental step in ensuring reliable esophageal pressure monitoring [22]. See figure 6 for the compliance curve of the balloon to determine Vbest and how under inflation and overinflation affects the pressure reading.
Figure 6. Schematic illustration of compliance curve of esophageal balloon. Overinflation or under inflation can affect the pressure signal. The optimal volume of the balloon that transmit the signal with maximum amplitude is called “Vbest”.
Troubleshooting
Even when the catheter is correctly positioned and the balloon optimally inflated, artifacts and technical difficulties can compromise the reliability of esophageal pressure (Pes) measurements. Recognizing and addressing these issues is essential for obtaining physiologically valid data [19].See Figure-7 for a schematic illustration of normal Pes waveform on a simulated ventilator screen.
Prominent Cardiac Oscillations
Excessive cardiac-related pressure fluctuations may dominate the Pes tracing, obscuring respiratory pressure changes. This typically indicates balloon placement immediately posterior to the heart. Troubleshooting strategies include slight withdrawal or advancement of the catheter to relocate the balloon within the mid-thoracic esophagus, or repositioning the patient (e.g., modest changes such as head-of-bed elevation) to reduce mediastinal compression effects [17,23]. See Figure-8 for schematic illustration of prominent cardiac oscillation on Pes monitoring with absent respiratory swings.
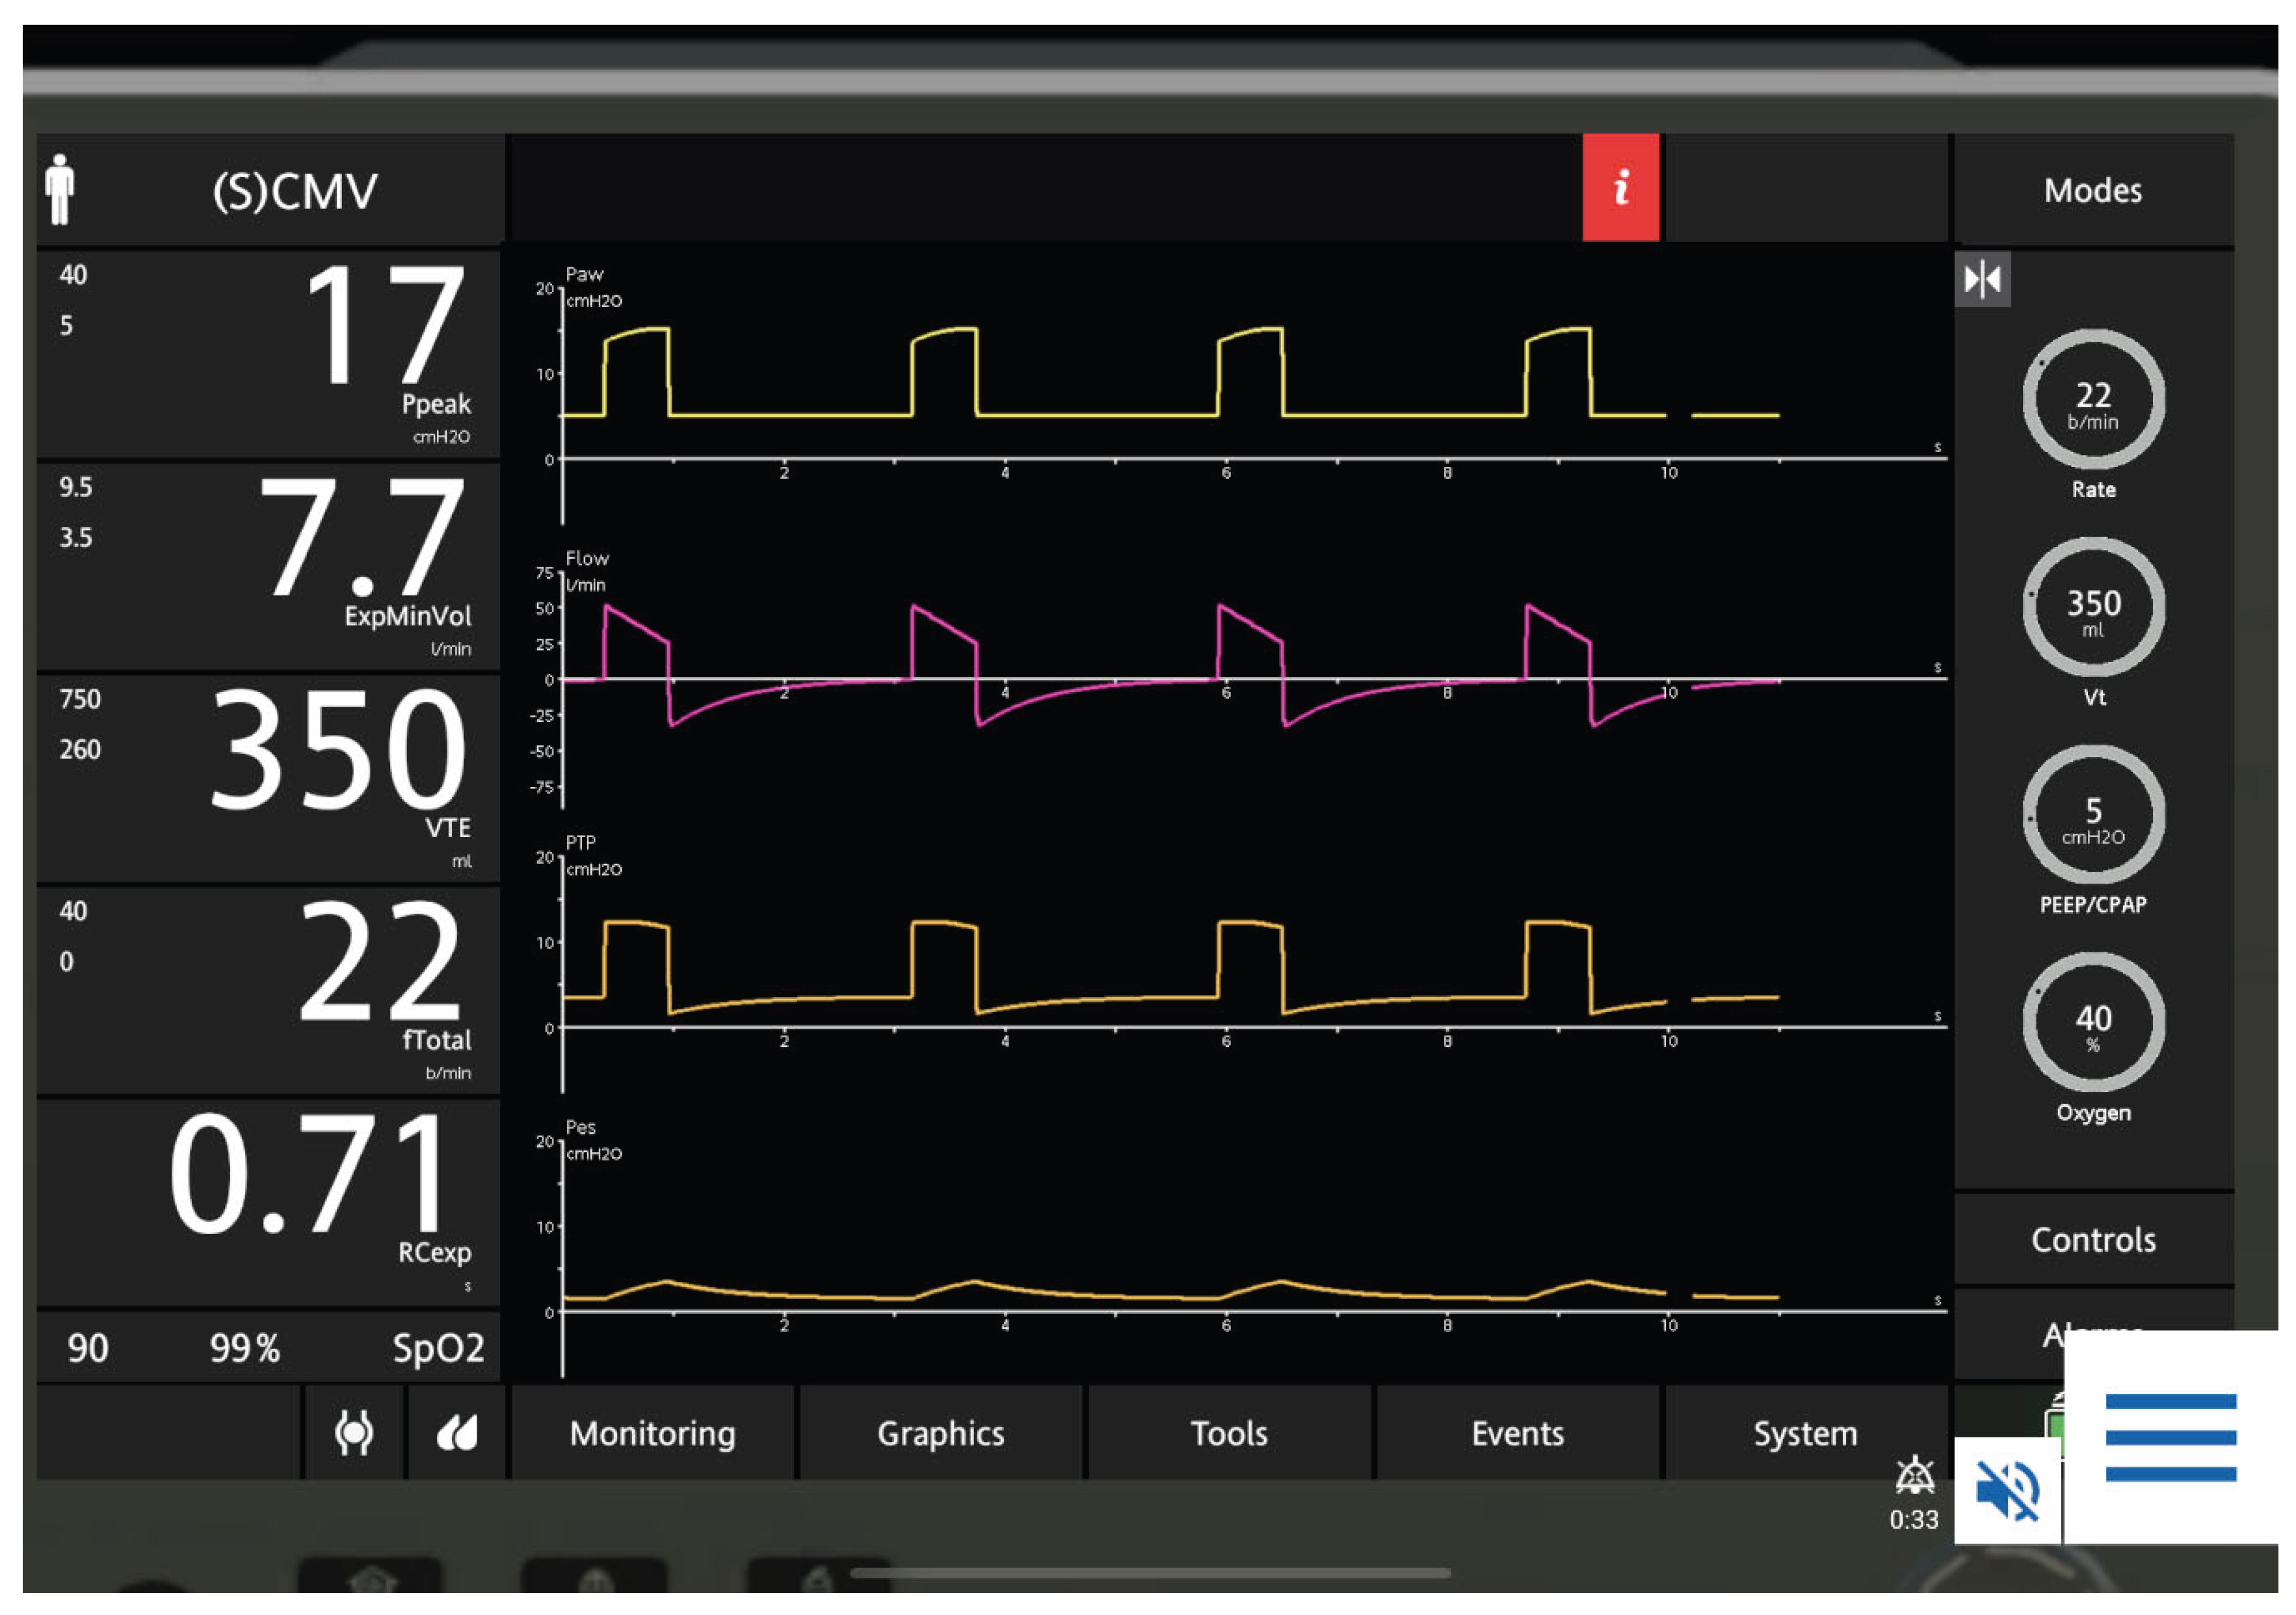
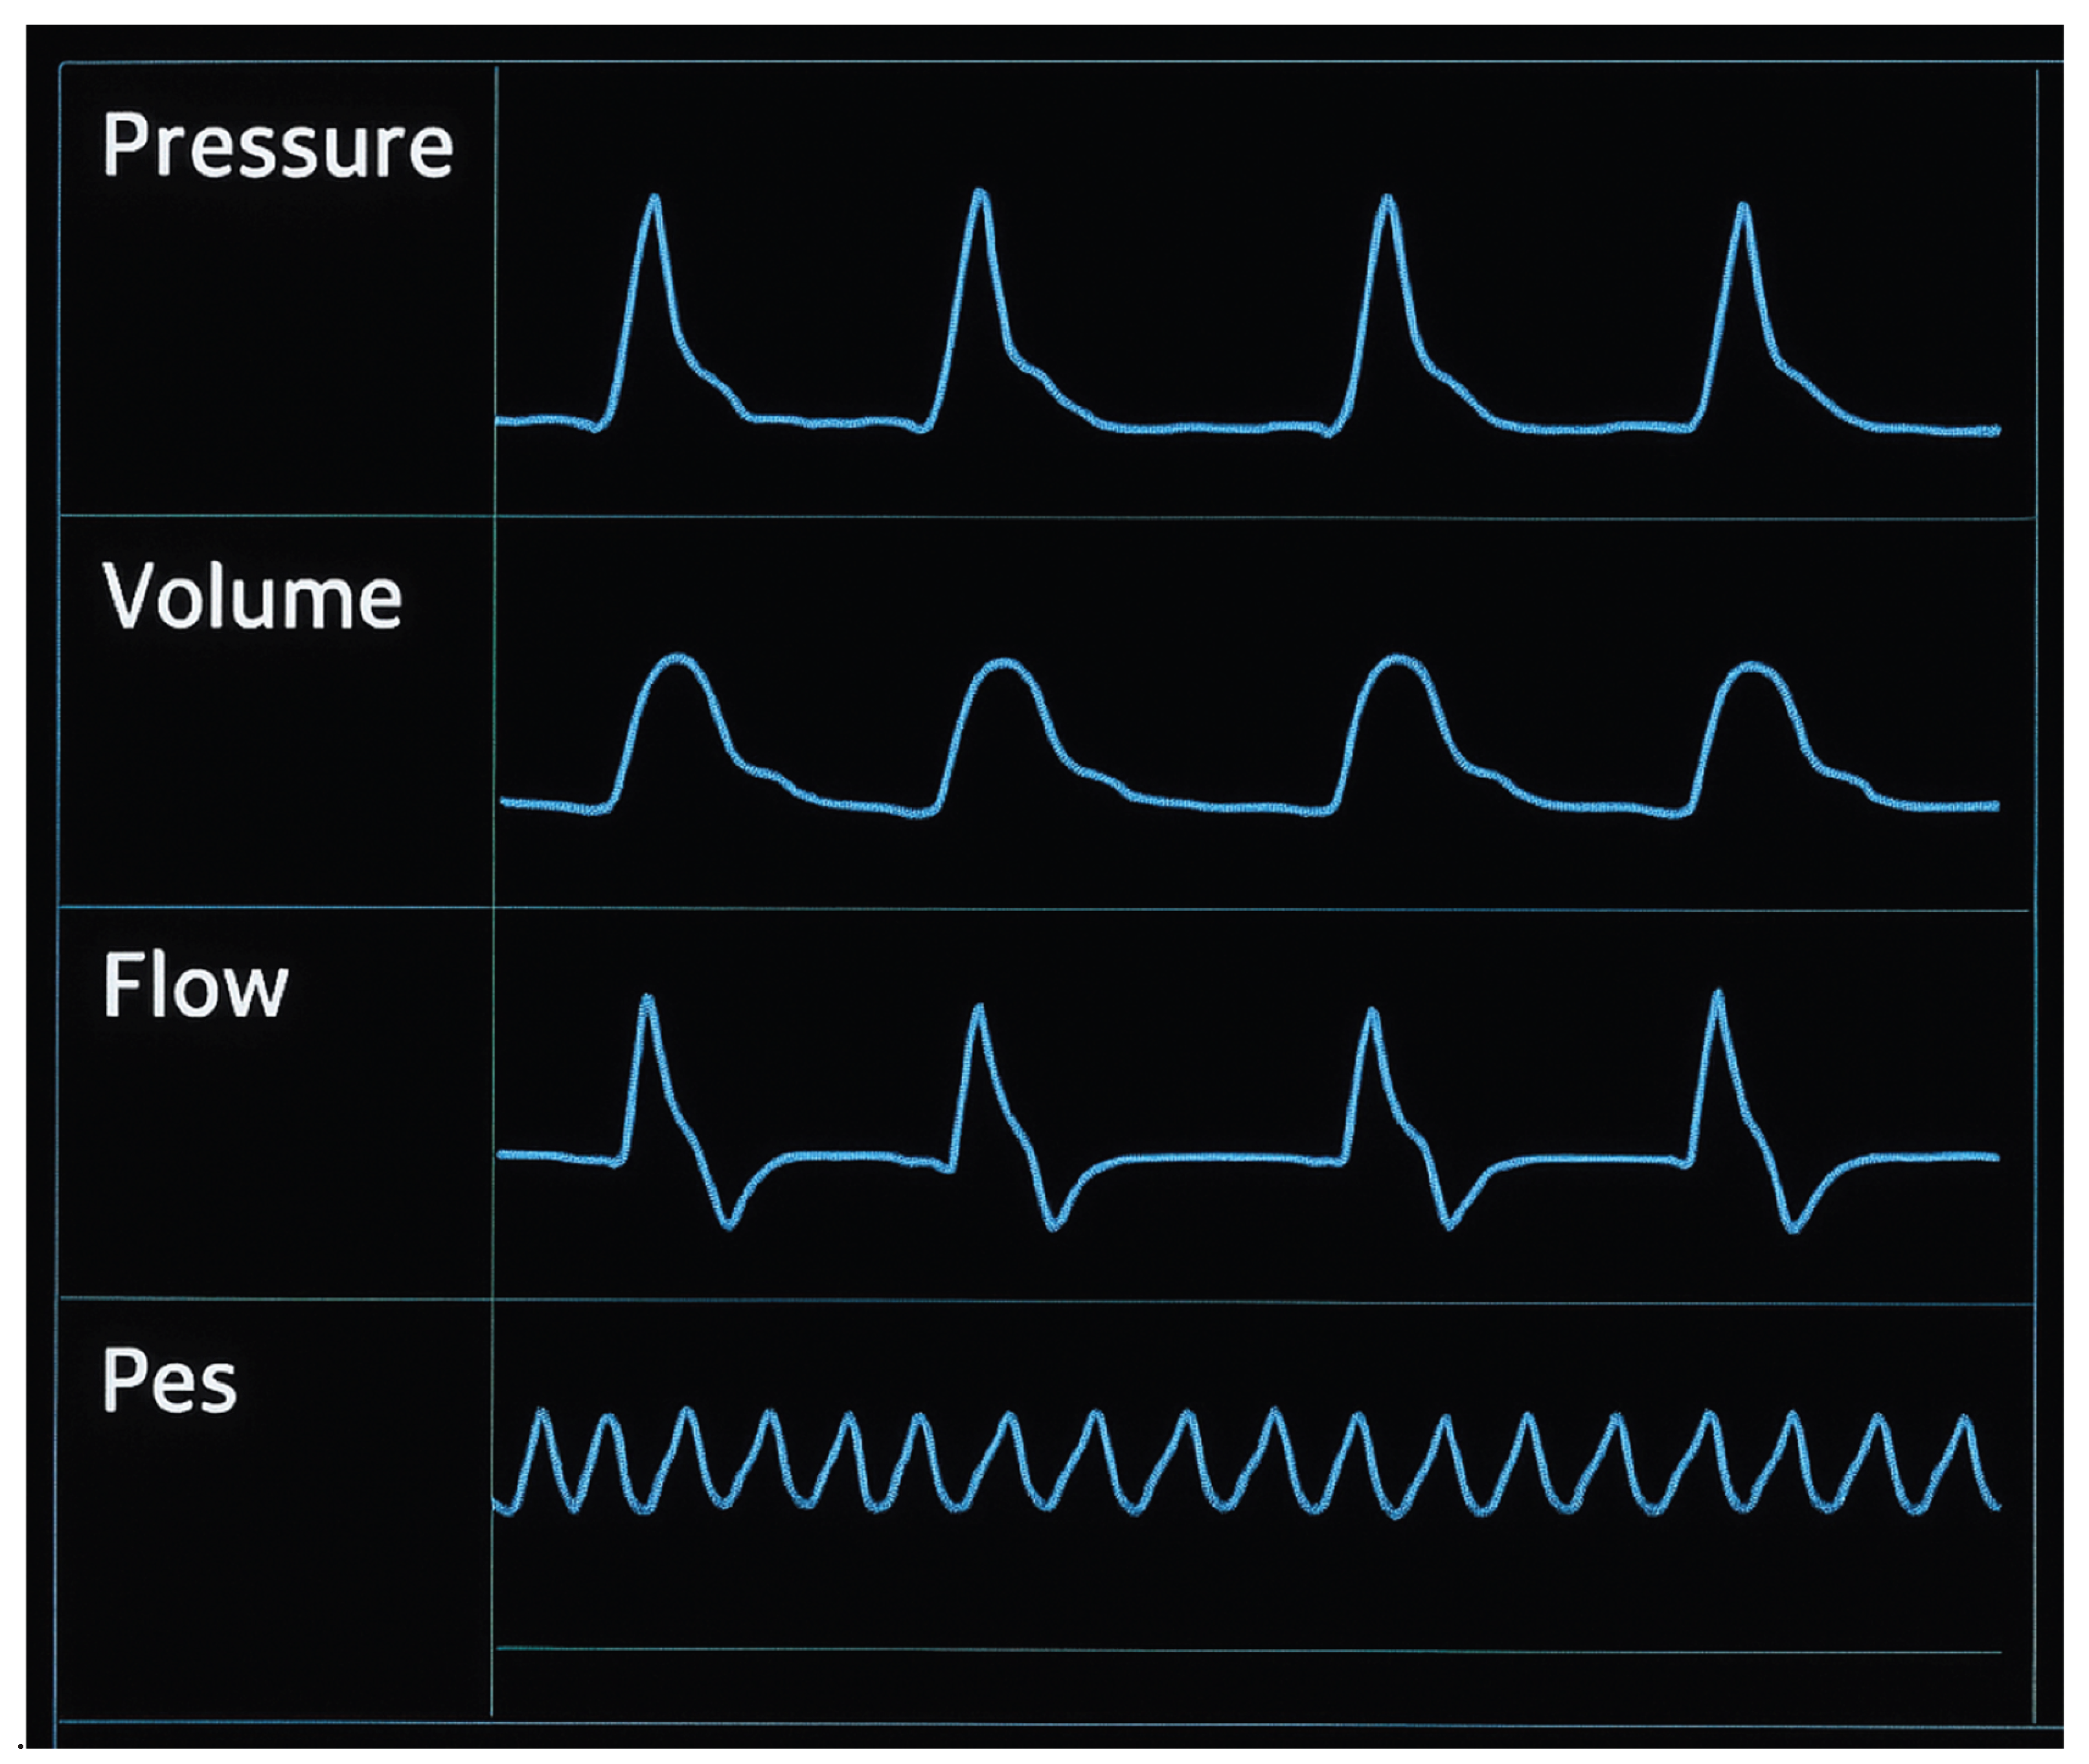
Figure 7.
Schematic illustration of normal Pes waveform on a simulated ventilator screen. Please note the airway swings seen on the esophageal pressure waveform (last line in the scalar figure) during controlled ventilation. Negative deflections if present indicate spontaneous breathing that may be seen in assisted or support ventilation, which are not seen in this ventilator screen. Image obtained from ventrainer module.
Figure 8.
Schematic illustration of prominent cardiac oscillation on Pes monitoring with absent respiratory swings. This requires reposition the patient such as elevation in the head of the bed or slight adjustment to the length of catheter.(Please note the scale on the Y-axis has not been adjusted. This is for illustration purposes only).
Esophageal Spasm
Swallowing and spontaneous esophageal smooth muscle contraction may intermittently generate sharp, high amplitude non-respiratory pressure artifacts on the tracing. These are usually transient, but in some cases can persist even under deep sedation or neuromuscular blockade. A lack of correlation between Pes and Paw changes suggests an artifact. When present, clinicians must interpret Pes data cautiously and, if possible, repeat measurements at a later time when spasm subsides [17].
Loss of Signal
A sudden absence or dampening of pressure fluctuations suggests a circuit air leak, balloon leak, rupture, or migration out of the thoracic esophagus. Mediastinal weight or contact pressures may dampen or distort the signal, particularly in supine or obese patients. Signal drift can occur over time due to temperature, pressure equilibration, or catheter migration. In such cases, the integrity of the catheter should be checked, balloon inflation volume reverified, and the catheter repositioned if migration into the stomach or oropharynx is suspected. Replacement of the catheter may be required if equipment failure is confirmed [22]. See Figure 9 for the appearance of “loss of signal” on the Pes waveform, which could be seen with balloon rupture.
Prone positioning
Esophageal balloon mechanics may change with body orientation. After proning, the optimal balloon inflation volume (Vbest) should be re-established, and an occlusion test repeated to confirm accuracy [24].
Paralysis or sedation
Controlled conditions (no spontaneous effort) provide the most reliable measurements of end-expiratory (Plexp) and end-inspiratory (Plinsp) transpulmonary pressures. Any change in sedation or paralysis level warrants repeat calibration and verification [24,25].
In these cases, sometimes re-calibration and re-verification should be performed. Check the depth of insertion. Absence of cardiac oscillations and flat signals imply oropharyngeal placement indicating a too shallow placement, while a gastric pressure pattern (sharp rises with abdominal compression, high baseline) indicates migration below the diaphragm. Always re-zero the system and repeat an occlusion test (ΔPaw/ΔPes ratio 0.8–1.2) after changes in patient position, sedation, paralysis, or proning. Inflate to the manufacturer’s recommended maximum volume, then gradually deflate to the best-volume (Vbest)—the point at which Pes swings are maximal and free of artifact. Presence of cardiac oscillations in the Pes trace, and maintenance of the expected Pes–Paw relationships during occlusion holds, provide strong assurance of accuracy [26]. See Table 2 for various artifacts that may be seen during Pes monitoring and corrective strategies.
Summary of Technique:
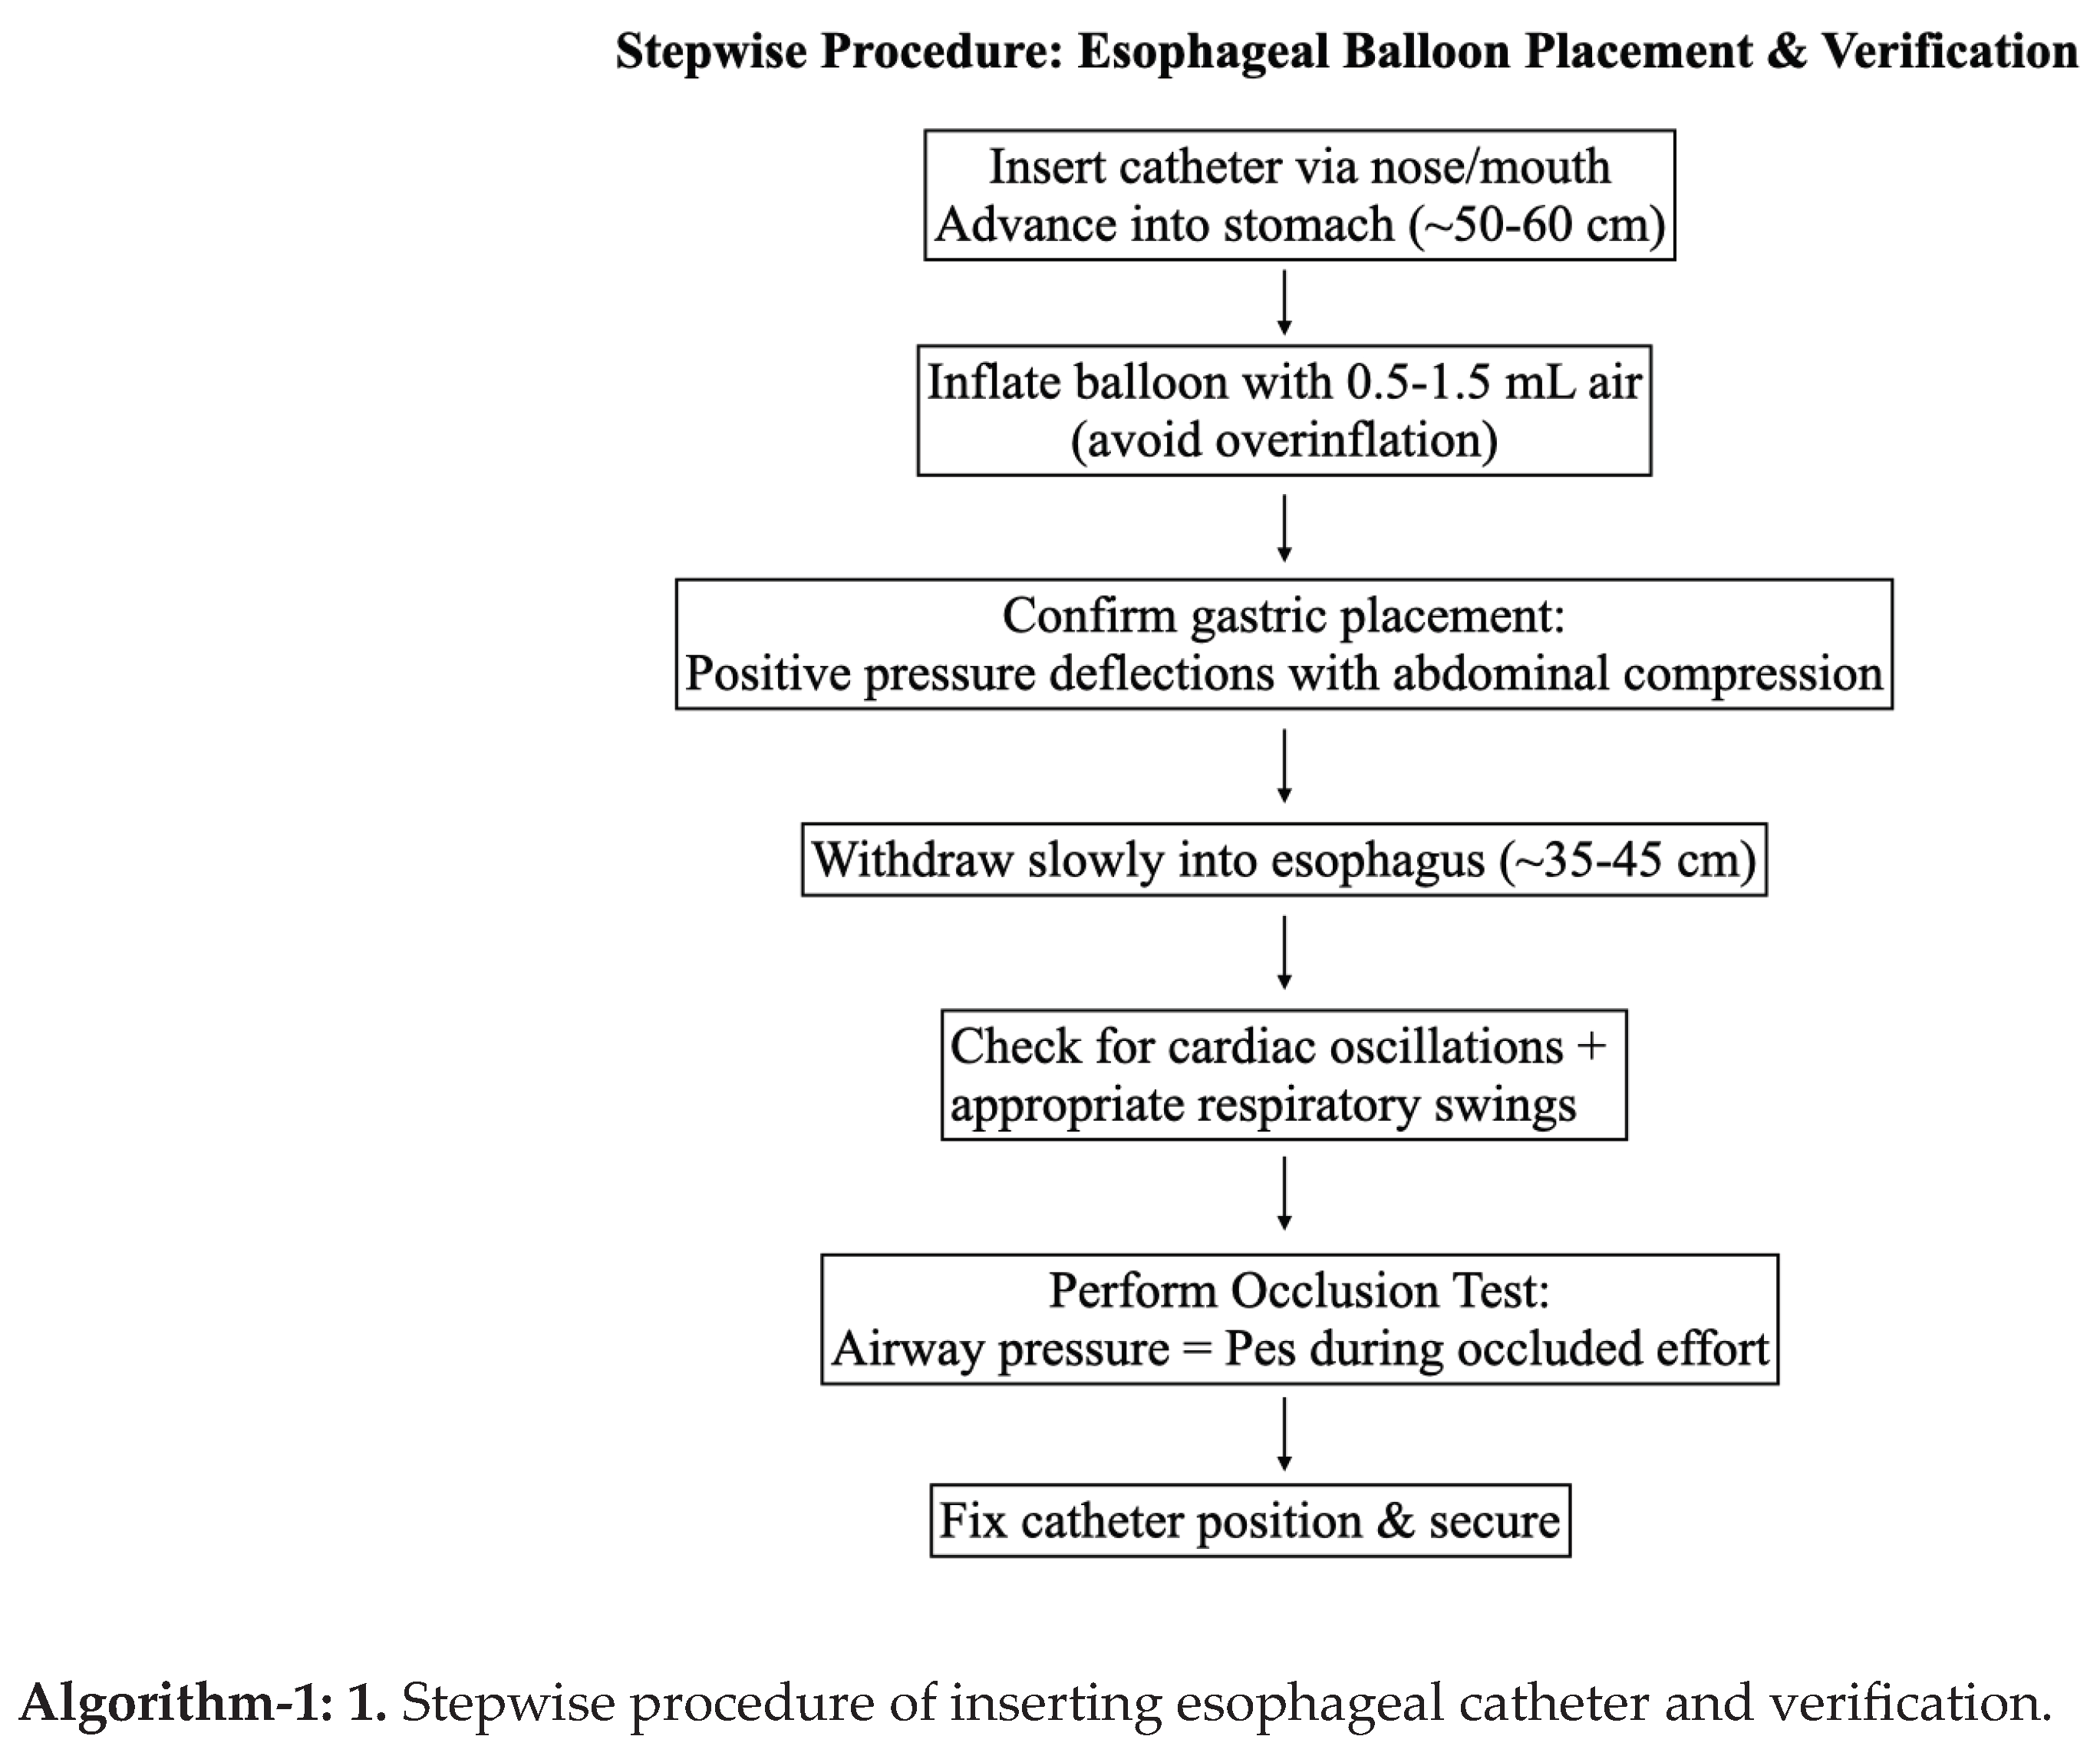
Insertion and Positioning
1. Insert catheter nasally or orally to ~50–60 cm, confirming gastric placement via epigastric pressure test.
2. Withdraw to ~35–45 cm until cardiac oscillations and respiratory swings are visible.
3. Confirm position with:
- Cardiac oscillations
- Comparison of airway and esophageal pressure waveforms
- Occlusion test: ΔPaw/ΔPes ratio 0.8–1.2 (thoracic compression or inspiratory effort during occlusion).
Balloon Inflation
- Zero system to atmosphere.
- Fully inflate balloon, then gradually deflate to manufacturer-recommended volume (Vbest).
- Examples:
- Cooper: inflate 2 ml → deflate to 1.2 ml
- Nutrivent: inflate 4 ml → deflate to 1.5 ml
- Vbest defined as balloon volume yielding maximal ΔPes with minimal artifact.
Troubleshooting
- Large cardiac oscillations → reposition or slightly ramp patient.
- Esophageal spasm → transient artifact, sometimes refractory to paralysis.
- Loss of signal → balloon leak or migration.
- Prone position or Paralysis: may need recalibration.
See algorithm 1 for Summary of stepwise procedure of inserting esophageal catheter and verification.
Clinical Applications of Esophageal Pressure monitoring
Esophageal manometry has been proposed to have myriad of clinical applications during mechanical ventilation, the most important being lung and diaphragm protective ventilation. See Figure 10 for a various clinical applications of esophageal manometry.
1. Patient–Ventilator Dyssynchrony
Dyssynchrony is common in ARDS, particularly when lung mechanics are heterogeneous and patient drive is high. Airway pressure and flow alone often underestimate the problem. Esophageal manometry reveals inspiratory efforts, expiratory muscle activity, and the timing of neural vs. mechanical breaths and often improves detection and classification of dyssynchronies [27].
Double Triggering
Double triggering is a form of patient–ventilator asynchrony in which two consecutive ventilator-delivered breaths occur in response to a single, sustained patient inspiratory effort. Mechanistically, the initial negative Pes deflection represents the patient’s inspiratory effort, which successfully triggers a mechanical breath. However, when the patient’s inspiratory drive persists beyond the ventilator’s inspiratory cycle, a second trigger may occur, resulting in delivery of a subsequent tidal volume without an intervening exhalation. The consequence is breath stacking, in which two tidal volumes are superimposed. This phenomenon is readily identifiable on esophageal pressure (Pes) tracings as a large, prolonged negative swing, reflecting strong diaphragmatic contraction that outlasts the ventilator’s preset inspiratory time.
This pattern is clinically significant because it exposes the lung to excessive stress and strain. Volutrauma from delivery of stacked volumes that exceed the intended tidal volume, barotrauma due to elevated transpulmonary pressures, and potentially biotrauma, as overstretching promotes inflammatory mediator release.
Identification of double triggering via Pes monitoring underscores the value of esophageal pressure as a tool for detecting occult asynchronies. Recognition should prompt adjustment of ventilator settings—such as prolonging inspiratory time, modifying flow patterns, or optimizing sedation and analgesia—to better match ventilator support with patient effort, thereby reducing the risk of ventilator-induced lung injury (VILI) [27].
Reverse Triggering
Reverse triggering is a distinctive form of patient–ventilator asynchrony in which a passive, ventilator-initiated breath elicits a subsequent reflex diaphragmatic contraction. Unlike conventional triggering, in which patient effort initiates a mechanical breath, reverse triggering arises when lung inflation from the ventilator stimulates afferent mechanoreceptors, leading to delayed activation of the patient’s inspiratory muscles via neural reflex pathways. On esophageal pressure (Pes) monitoring, reverse triggering is characterized by an initial rise in airway pressure (Paw) from the passive ventilator breath, with no preceding negative deflection in Pes and a delayed negative swing in Pes that follows the ventilator insufflation, indicating diaphragmatic contraction after lung stretch rather than before it. This sequence reflects the ventilator entraining the patient’s neural respiratory activity, a phenomenon sometimes referred to as “ventilator-induced breathing” [28].
The clinical significance of reverse triggering lies in its potential to contribute to patient–ventilator dyssynchrony and ventilator-induced lung injury (VILI). Depending on the timing and intensity of the diaphragmatic effort, reverse triggering can augment tidal volume and increase transpulmonary pressure, raising the risk of volutrauma. Reverse triggering can generate eccentric diaphragmatic loading, as contraction occurs while the diaphragm is being stretched by the ventilator, potentially leading to muscle injury [28].
Recognition of reverse triggering requires careful waveform analysis, often facilitated by Pes monitoring, since conventional airway pressure and flow tracings may not reveal the underlying diaphragmatic activity. Identifying this pattern highlights the importance of integrating patient neural effort into ventilatory management and considering interventions such as adjusting ventilator mode, synchrony optimization, or, in selected cases, modifying sedation strategies [28].
Ineffective Effort
Ineffective effort is among the most common forms of patient–ventilator asynchrony, characterized by an inspiratory effort generated by the patient that fails to trigger a ventilator-assisted breath. On esophageal pressure (Pes) tracings, this appears as a negative deflection in Pes—reflecting diaphragmatic contraction and pleural pressure reduction—without a corresponding rise in airway pressure (Paw) or delivered tidal volume [29].
The pathophysiology of ineffective effort typically involves a mismatch between the timing of patient neural inspiration and ventilator trigger sensitivity. Contributing factors include:
- High levels of positive end-expiratory pressure (PEEP) or intrinsic PEEP (“auto-PEEP”), which impose an inspiratory threshold load that the patient cannot consistently overcome.
- Over-assistance or deep sedation, leading to reduced patient drive and delayed or insufficient inspiratory effort relative to the ventilator’s trigger window.
- Short inspiratory times or high cycling thresholds, resulting in early termination of mechanical inspiration and difficulty for the patient to reinitiate a breath.
From a clinical standpoint, ineffective efforts are important because they may increase patient work of breathing, as inspiratory efforts fail to produce effective ventilation and contribute to dyssynchrony-related discomfort, manifesting as agitation or tachypnea. Since patient effort does not translate into alveolar ventilation, these are considered wasted efforts decreasing the ventilatory efficiency. Ineffective efforts may lead to diaphragmatic injury from repeated unassisted contractions against a closed system [30] .
Recognition with Pes monitoring is particularly valuable, as airway pressure and flow waveforms alone may obscure these “hidden” efforts. Once identified, management strategies include optimizing trigger sensitivity, adjusting PEEP to counteract intrinsic PEEP, titrating sedation, or modifying ventilator mode to improve synchrony.
Flow Starvation
Flow starvation is a patient–ventilator asynchrony that occurs when the inspiratory flow provided by the ventilator is insufficient to meet the patient’s inspiratory demand. This mismatch leads to increased patient effort and can be detected reliably through a combination of airway pressure (Paw) and esophageal pressure (Pes) monitoring. On the Paw waveform, flow starvation manifests as a concave or “scooped” appearance during inspiration, reflecting the patient’s vigorous attempt to draw in additional flow beyond what the ventilator is delivering. Simultaneously, the Pes tracing demonstrates a deep and exaggerated negative deflection, signifying heightened diaphragmatic contraction and increased inspiratory effort [31].
The underlying mechanisms include:
- Fixed inspiratory flow delivery in volume-controlled modes that is inadequate relative to patient demand.
- Excessively low flow settings or slow rise time in pressure-controlled or pressure-support modes, delaying the attainment of sufficient inspiratory pressure.
- Increased respiratory drive, such as in hypoxemia, hypercapnia, metabolic acidosis, or discomfort, amplifying the disparity between demand and supply [31].
The clinical implications of flow starvation are significant. Patients may experience increased work of breathing (WOB) and respiratory muscle load, which can predispose to fatigue, dyspnea and agitation, often prompting higher sedative or analgesic requirements if unrecognized. Eventually this may lead to asynchrony-related lung injury, since forceful inspiratory efforts may increase transpulmonary pressures, contributing to regional over distension and ventilator-induced lung injury (VILI) [30].
Identification through Pes monitoring is particularly valuable because it reveals the magnitude of patient effort that may not be evident on Paw and flow tracings alone. Management strategies include adjusting inspiratory flow rate, shortening rise time, modifying inspiratory pressure support, or switching to ventilatory modes that better match patient demand (e.g., proportional assist or neurally adjusted ventilatory assist) [30].
Cycling Asynchrony
Cycling asynchrony refers to a mismatch between the neural inspiratory time (the duration of the patient’s diaphragmatic effort) and the mechanical inspiratory time imposed by the ventilator. Esophageal pressure (Pes) monitoring provides a sensitive method to detect this phenomenon, as it directly reflects the timing and magnitude of patient inspiratory effort relative to ventilator-delivered support [32].
Premature Cycling
Premature cycling occurs when the ventilator terminates inspiration before the patient has completed their neural inspiratory effort. On Pes tracings, this is evident as a continued negative deflection beyond the point of ventilator cycling, indicating persistent diaphragmatic contraction without ongoing ventilatory assistance. Clinically, this leads to increased work of breathing (WOB) and dyspnea, as the patient continues inspiratory effort unassisted with the ventilator drive the ventilatory cycle feels truncated relative to their neural drive. This also can lead to Ineffective efforts, if the patient attempts to prolong inspiration by initiating another breath that fails to trigger. Common causes include short inspiratory times, high cycling thresholds, or low levels of pressure support [32].
Delayed Cycling
Delayed cycling occurs when the ventilator continues to deliver inspiratory flow after the patient’s neural inspiratory effort has ceased. On Pes tracings, this is recognized by a return of Pes toward baseline (signifying relaxation of the diaphragm) while Paw remains elevated due to ongoing ventilator insufflation. Consequences include dynamic hyperinflation, as late-phase insufflation may oppose the onset of passive exhalation. Increased expiratory muscle activity may be seen, as the patient recruits abdominal muscles to terminate inspiration. This often leads to discomfort, as mechanical breath timing is out of phase with neural effort. Delayed cycling is often caused by long inspiratory times, low cycling thresholds, or excessive pressure support [32].
Cycling asynchrony contributes to inefficient ventilation, increased patient effort, and potential risk of ventilator-induced lung injury (VILI) through excessive stress and strain. By aligning mechanical support with neural timing—as revealed by Pes monitoring—clinicians can optimize ventilatory synchrony. Adjustments may include modifying inspiratory time, altering cycling criteria, or using advanced ventilator modes (e.g., proportional assist ventilation or neurally adjusted ventilatory assist) that better match patient effort [30,32]. See Figure 11 for Identification of patient ventilator dyssynchrony via Pes waveform.
Normal assisted breath: The airway pressure increases almost simultaneously with the negative deflection of esophageal pressure.
Reverse triggering: On esophageal pressure (Pes) monitoring, reverse triggering is characterized by an initial rise in airway pressure (Paw) from the passive ventilator breath, with no preceding negative deflection in Pes and a delayed negative swing in Pes that follows the ventilator insufflation, indicating diaphragmatic contraction after lung stretch rather than before it
Flow starvation: On the Paw waveform, flow starvation typically manifests as a concave or “scooped” appearance during inspiration or blunted rise in airway pressure. Simultaneously, the Pes tracing demonstrates a deep and exaggerated negative deflection, signifying heightened diaphragmatic contraction and increased inspiratory effort reflecting the patient’s vigorous attempt to draw in additional flow beyond what the ventilator is delivering.
Double triggering: Esophageal pressure (Pes) tracings as a large, prolonged negative swing, reflecting strong diaphragmatic contraction that outlasts the ventilator’s preset inspiratory time, hence ventilator triggers the double breath.
Ineffective effort: On esophageal pressure (Pes) tracings, this appears as a negative deflection in Pes; reflecting diaphragmatic contraction, without a corresponding rise in airway pressure (Paw) or delivered tidal volume.
2. Detection of Dynamic Hyperinflation / Intrinsic PEEP
Dynamic hyperinflation, also termed intrinsic PEEP (PEEPi), arises when insufficient time is available for complete exhalation before the initiation of the next breath. This leads to air trapping, progressive increases in end-expiratory lung volume, and the development of a positive alveolar pressure that persists at end-expiration. It is most commonly encountered in patients with severe obstructive lung disease, such as COPD or asthma, where airflow limitation and prolonged expiratory time constants impair full lung emptying [33].
Airway pressure and flow tracings alone often fail to reveal PEEPi, particularly in assisted ventilation, because expiratory muscle activity can obscure evidence of incomplete exhalation. In such cases, standard techniques like end-expiratory occlusion may underestimate the true degree of dynamic hyperinflation [34].
Esophageal manometry provides a more direct means of detecting and quantifying PEEPi. During inspiration, a patient effort is reflected as a negative deflection in Pes, signifying diaphragmatic contraction and pleural pressure reduction. In the presence of PEEPi, no inspiratory flow occurs initially, because the patient’s inspiratory effort must first overcome the elevated alveolar pressure that persists at end-expiration. Flow begins only once the magnitude of the negative Pes swing exceeds the intrinsic threshold imposed by dynamic hyperinflation [34].
This allows clinicians to detect occult PEEPi that may not be evident on airway waveforms alone and quantify the inspiratory threshold load, defined as the amount of negative pressure the patient must generate to initiate airflow in the presence of hyperinflation [35].
Recognition of PEEPi at the bedside has important therapeutic consequences. Dynamic hyperinflation increases the work of breathing, contributes to dyspnea and ventilator asynchrony, and impairs venous return by elevating intrathoracic pressure. Through Pes monitoring, one can tailor ventilator strategies—such as prolonging expiratory time, adjusting external PEEP, or reducing respiratory rate—to minimize intrinsic PEEP and reduce patient burden [33,35,34]. See Figure 12 for detecting intrinsic PEEP using Pes waveform.
3. PEEP Titration
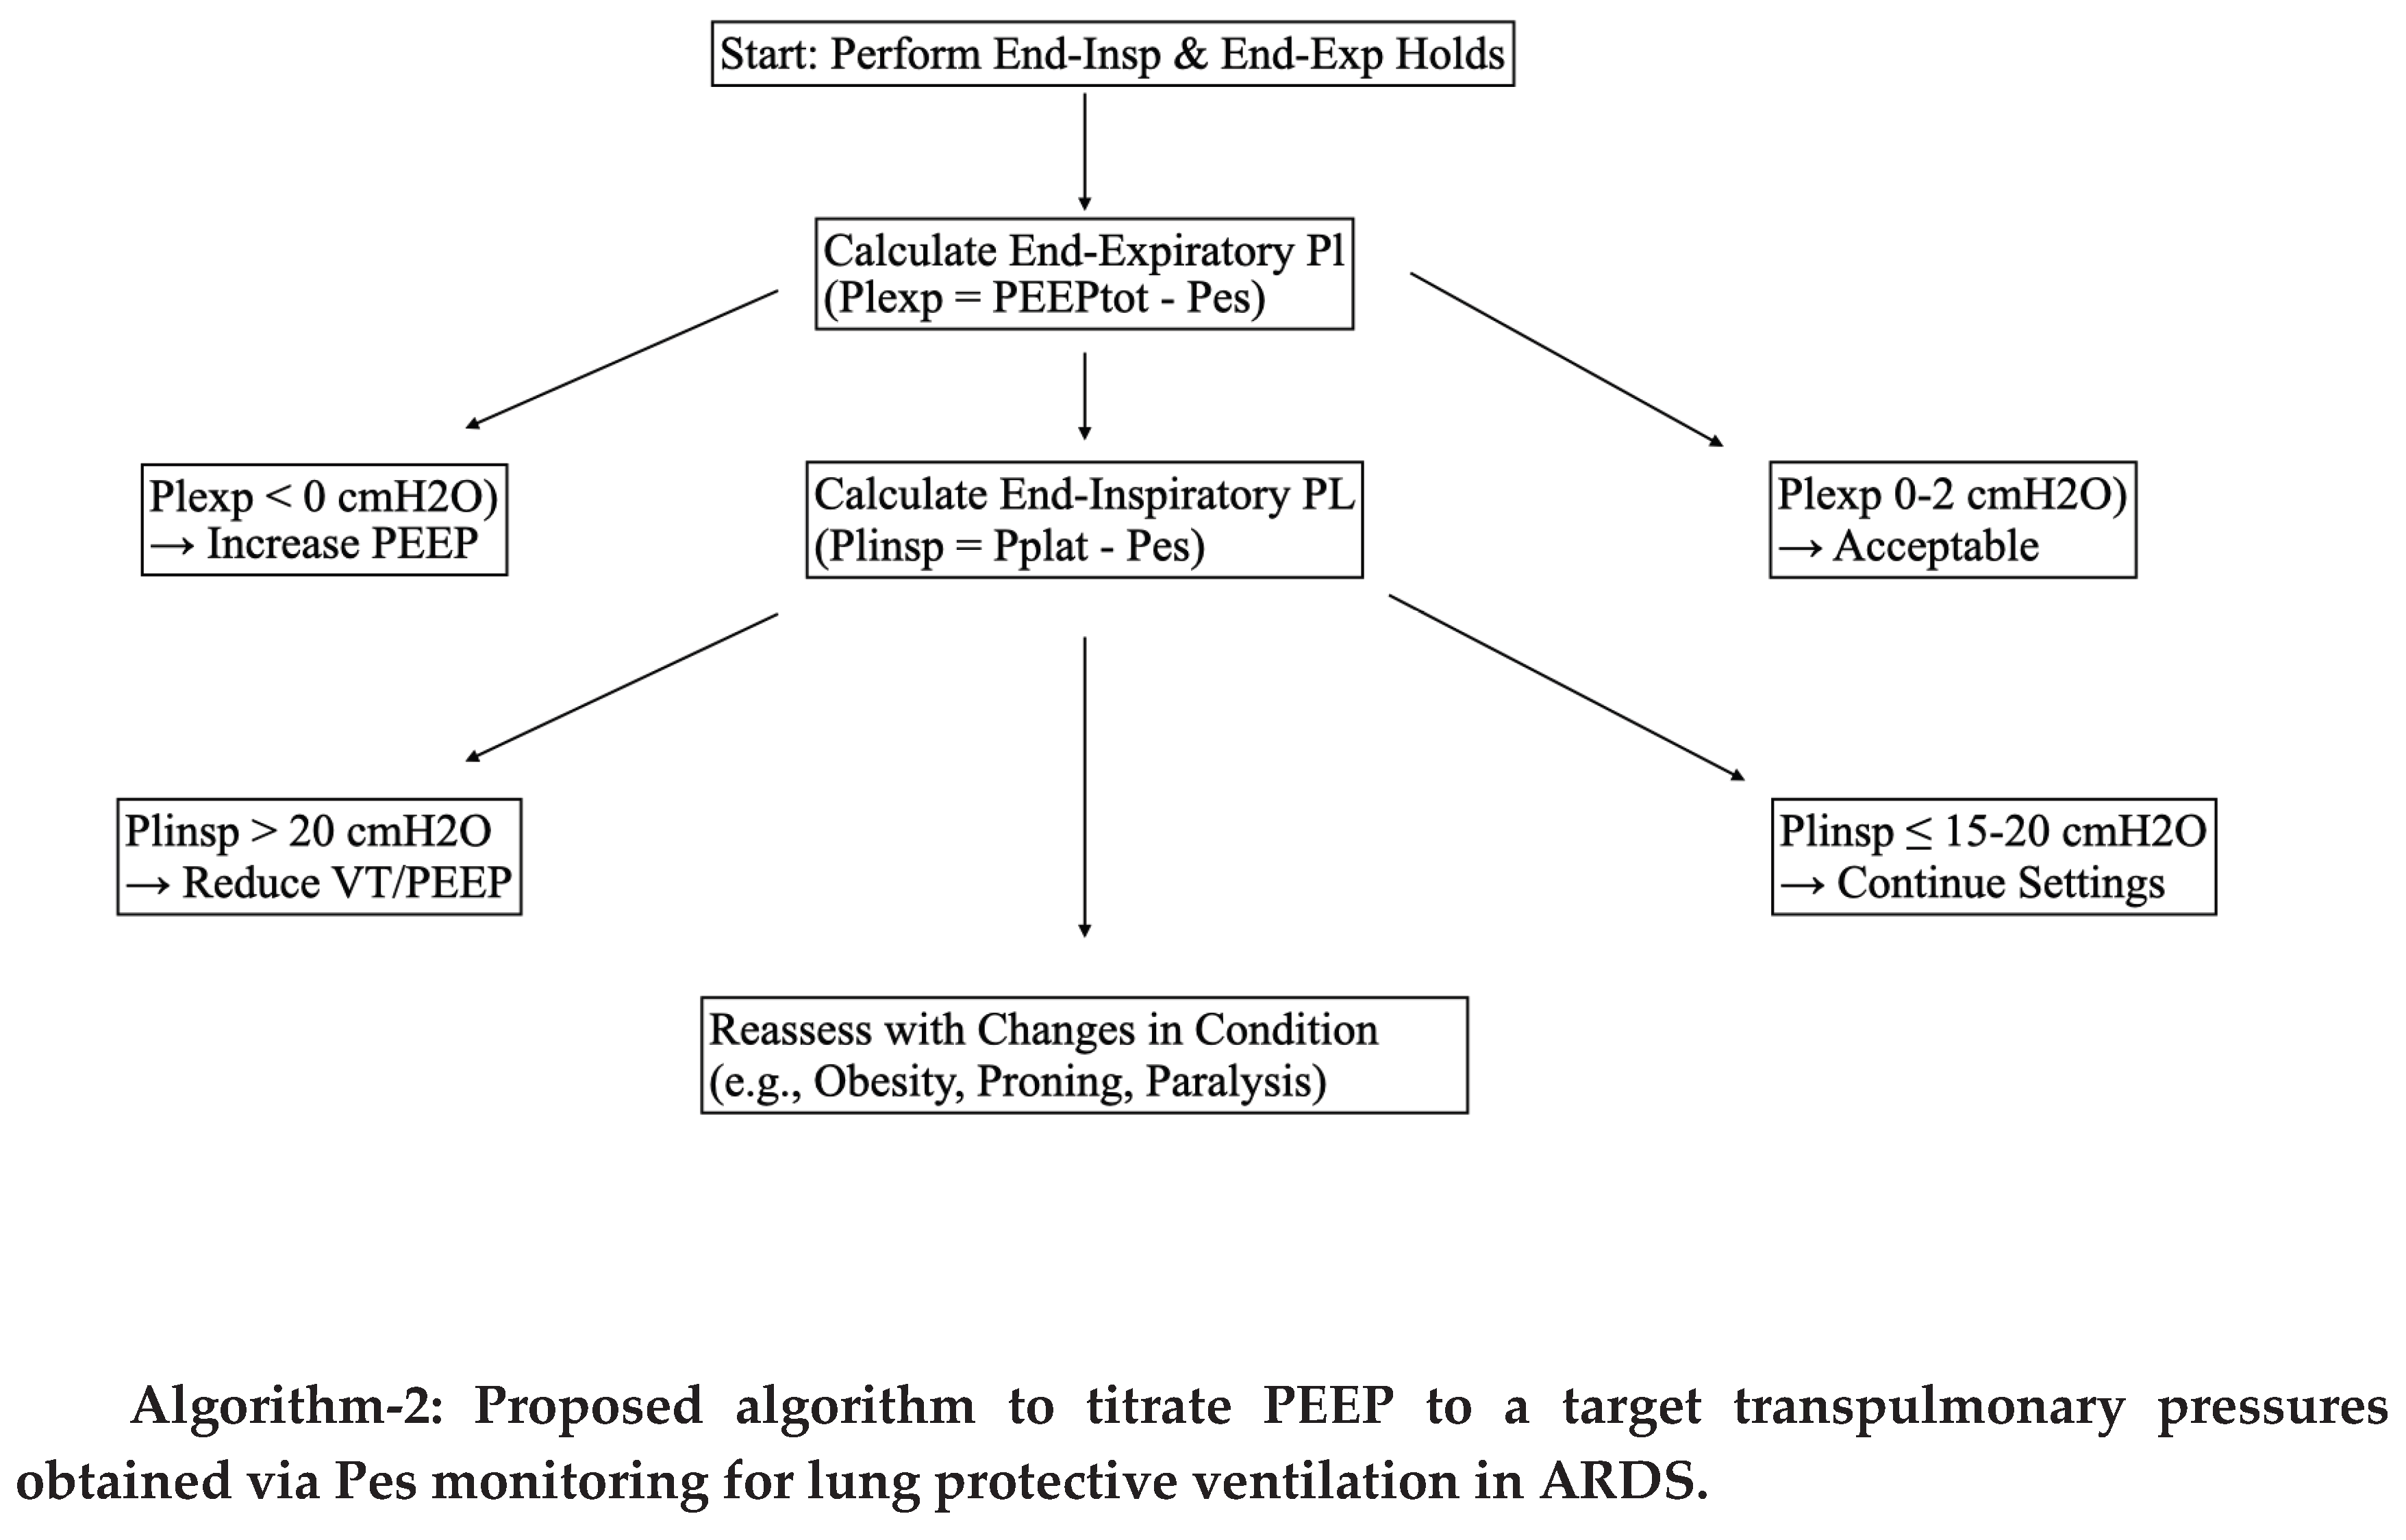
One of the most extensively validated clinical applications of esophageal pressure (Pes) monitoring is the optimization of positive end-expiratory pressure (PEEP) based on estimates of transpulmonary pressure (PL). Pes can decipher the lung parenchymal and pleural components contributing to the airway pressure, thus gives us a better understanding between the pressure required to distend the lung parenchyma versus that required to overcome chest wall elastance. This separation provides a more physiologically sound approach to ventilator management, particularly in patients with heterogeneous respiratory mechanics such as those with acute respiratory distress syndrome (ARDS) or obesity. PEEP titration using esophageal manometry is best guided by measuring transpulmonary pressure and titrating PEEP to a “set” target. As transpulmonary pressure is conceptually the lung distending pressure and the goal is to avoid alveolar collapse at the end of expiration and minimize over distension, certain targets can be defined [36,37].
End-Expiratory Transpulmonary Pressure (Plexp)
Plexp represents the pressure maintaining alveolar patency at the end of expiration. A negative PLexp suggests a tendency toward alveolar collapse, while an excessively positive PLexp risks dynamic tidal hyperinflation. Hence approximately Plexp of 0 to +2 cmH₂O, is just sufficient to keep alveoli open without overdistension [36].
End-Inspiratory Transpulmonary Pressure (Plinsp)
Plinsp reflects the distending pressure applied to lung tissue at peak inspiration. Excessive values predispose to overinflation, volutrauma, and ventilator-induced lung injury (VILI). Hence typically Plinsp is maintained at <15–20 cmH₂O [38].
Transpulmonary Driving Pressure (ΔPL):
Similar to driving pressure, transpulmonary driving pressure is defined as the difference between PLinsp and PLexp, representing the dynamic stress applied during tidal ventilation. Like driving pressure, this may be associated with lung injury risk and outcomes in ARDS. A clinical target of <10–12 cmH₂O is generally considered protective [39]. See Algorithm-2 for Proposed algorithm to titrate PEEP for lung protective ventilation in ARDS using esophageal manometry.
The use of esophageal pressure monitoring for PEEP titration is particularly useful in morbidly obese patients with ARDS. In patients with morbid obesity, airway pressures are often elevated due to reduced chest wall compliance. For instance, plateau pressures may appear dangerously high when measured solely from the airway. Without Pes monitoring, one might reduce PEEP to avoid perceived over distension. However, Pes monitoring may reveal that pleural pressure is also elevated, and thus the transpulmonary pressure is deceptively low or even negative at end-expiration (e.g., PLexp –5 cmH₂O) causing atelectrauma. Despite high Paw, the lungs remain prone to collapse, and higher—not lower—PEEP is required to achieve a safe transpulmonary distending pressure. In this context, Pes-guided titration provides a physiological rationale for maintaining higher PEEP levels to prevent atelectrauma, while still avoiding overdistension by monitoring PLinsp and ΔPL [40].
By tailoring PEEP to achieve “physiological” transpulmonary pressures, Pes monitoring allows clinicians to balance alveolar recruitment against the risk of overinflation, avoid under-recruitment in patients with high chest wall elastance and minimize both atelectrauma and volutrauma, reducing the risk of VILI [38].
This individualized approach underscores the value of Pes monitoring as a tool for precision mechanical ventilation, particularly in complex phenotypes such as obese patients with ARDS, chest wall injury, or abdominal hypertension.
Clinical Evidence for Esophageal Pressure–Guided PEEP Titration
The concept of using esophageal pressure (Pes) monitoring to titrate positive end-expiratory pressure (PEEP) has been evaluated in prospective randomized clinical trials. These studies aimed to determine whether tailoring ventilator settings to achieve physiologically appropriate transpulmonary pressures translates into improved outcomes in patients with acute respiratory distress syndrome (ARDS).
EPVent Trial (2008, Talmor et al.) [39]
The first Esophageal Pressure-Guided Ventilation (EPVent) trial was a single-center, randomized controlled study comparing conventional ARDSNet low-PEEP strategies with Pes-guided PEEP titration.
- Methodology: In the intervention arm, PEEP was adjusted to achieve a transpulmonary pressure at end-expiration (PLexp) of 0 to +2 cmH₂O, thereby preventing alveolar collapse.
- Findings: The Pes-guided group demonstrated:
- Improved oxygenation (higher PaO₂/FiO₂ ratios).
- Better respiratory system compliance.
- A trend toward reduced mortality, though not powered for survival as a primary endpoint.
- Significance: This trial provided proof-of-concept that Pes-guided PEEP titration could physiologically optimize ventilation and potentially improve clinical outcomes.
EPVent-2 Trial (2019, Beitler et al.) [40]
The EPVent-2 trial was a larger, multi center randomized controlled trial designed to validate and extend the findings of EPVent.
- Methodology: Patients with moderate-to-severe ARDS were randomized to Pes-guided PEEP titration (targeting PLexp 0–6 cmH₂O) versus a high-PEEP ARDSNet strategy.
- Findings:
- No significant difference in the primary outcome of 28-day mortality or ventilator-free days between groups.
- Both groups had similar safety profiles, with no excess of barotrauma or hemodynamic compromise.
- Oxygenation and compliance improvements observed in EPVent were not consistently replicated, possibly because the high-PEEP control arm already approximated physiologically appropriate PEEP levels.
- Significance: EPVent-2 suggested that while Pes-guided titration is safe, its benefit may be most pronounced compared with low-PEEP strategies, whereas its advantage over high-PEEP strategies is less clear. Patients in Pes guided PEEP required less rescue therapies and prone position was considered as a rescue therapy rather than a standard of care.
Taken together, these trials highlight that Pes-guided ventilation is feasible and safe in clinical practice. Pes guided PEEP titration may confer a benefit over traditional low-PEEP strategies by improving oxygenation and compliance. However does not clearly outperform high-PEEP strategies, which may already achieve similar physiological effects in many patients. While Pes guided PEEP titration has not been prospectively tested in patients with morbid obesity in these trials specifically, it may be a valuable tool for patients with high chest wall elastance or complex mechanics [39,40]. See Table 3 for comparison of two major trials involving esophageal pressure monitoring during mechanical ventilation in ARDS.
Table 3. Comparison of two major trials involving esophageal pressure monitoring during mechanical ventilation in ARDS.
4. Optimization of Tidal Volume
Protective mechanical ventilation strategies traditionally limit plateau pressure (Pplat) to <30 cmH₂O, based on the assumption that airway pressure approximates alveolar distending pressure. However, this approach does not account for variability in chest wall compliance, and therefore may underestimate or overestimate the true stress experienced by lung tissue [41].
By partitioning airway pressure into its pleural and transpulmonary components, esophageal pressure (Pes) monitoring allows for direct estimation of transpulmonary pressure (PL), which more accurately reflects the mechanical stress applied to the lung parenchyma. This provides a physiologically grounded framework for titrating tidal volume in diverse clinical scenarios [42].
Clinical scenario: Assuming an obese Patient with ARDS on mechanical ventilator the increased chest wall elastance elevates pleural pressure. For example a plateau pressure of 32 cmH20 exceeds the safety threshold, one may want to lower the tidal volume. However if the esophageal pressure Pes of 25 cm H20 is recorded due to obesity, the transpulmonary inspiratory pressure PLinsp is only 7 cmH2O indicating that the lung stress is well within the protective threshold. Reducing tidal volume in this context could lead to unnecessary hypoventilation and hypercapnia.
- Pplat = 32 cmH₂O
- Pes = 25 cmH₂O
- PLinsp = Pplat – Pes = 7 cmH₂O
Alternatively assuming an ARDS patient with highly compliant chest wall. A plateau pressure of 25 cm H2O may appear seemingly benign, but if an esophageal pressure is recorded as 5 cm H2O, his transpulmonary pressures are 20 cm H20, which is dangerously elevated placing the patient at high risk of overdistension and ventilator-induced lung injury (VILI).
- Pplat = 25 cmH₂O
- Pes = 5 cmH₂O
- PLinsp = 20 cmH₂O
These contrasting scenarios underscore the limitations of airway-based thresholds and highlight the value of Pes-guided assessment for individualized tidal volume optimization. By using PL rather than Pplat alone, we can avoid unnecessarily restrictive ventilation in patients with high chest wall pressures (e.g., obesity, abdominal hypertension), detect occult overdistension in patients with compliant chest walls and more accurately tailor tidal volumes to minimize stress and strain, reducing the risk of VILI while maintaining adequate gas exchange. In this way, Pes monitoring provides a precision medicine approach to mechanical ventilation, aligning ventilator settings more closely with the true mechanical environment of the injured lung [41,42].
Suggested protective thresholds include:
- End-inspiratory transpulmonary pressure (PLinsp): Preferably maintained <15 cmH₂O, though values up to <20 cmH₂O may be acceptable in selected cases.
- Transpulmonary driving pressure (ΔPL): Ideally limited to <10–12 cmH₂O, paralleling evidence linking driving pressure to ventilator-induced lung injury (VILI).
5. Quantifying Patient Effort in Assisted Ventilation
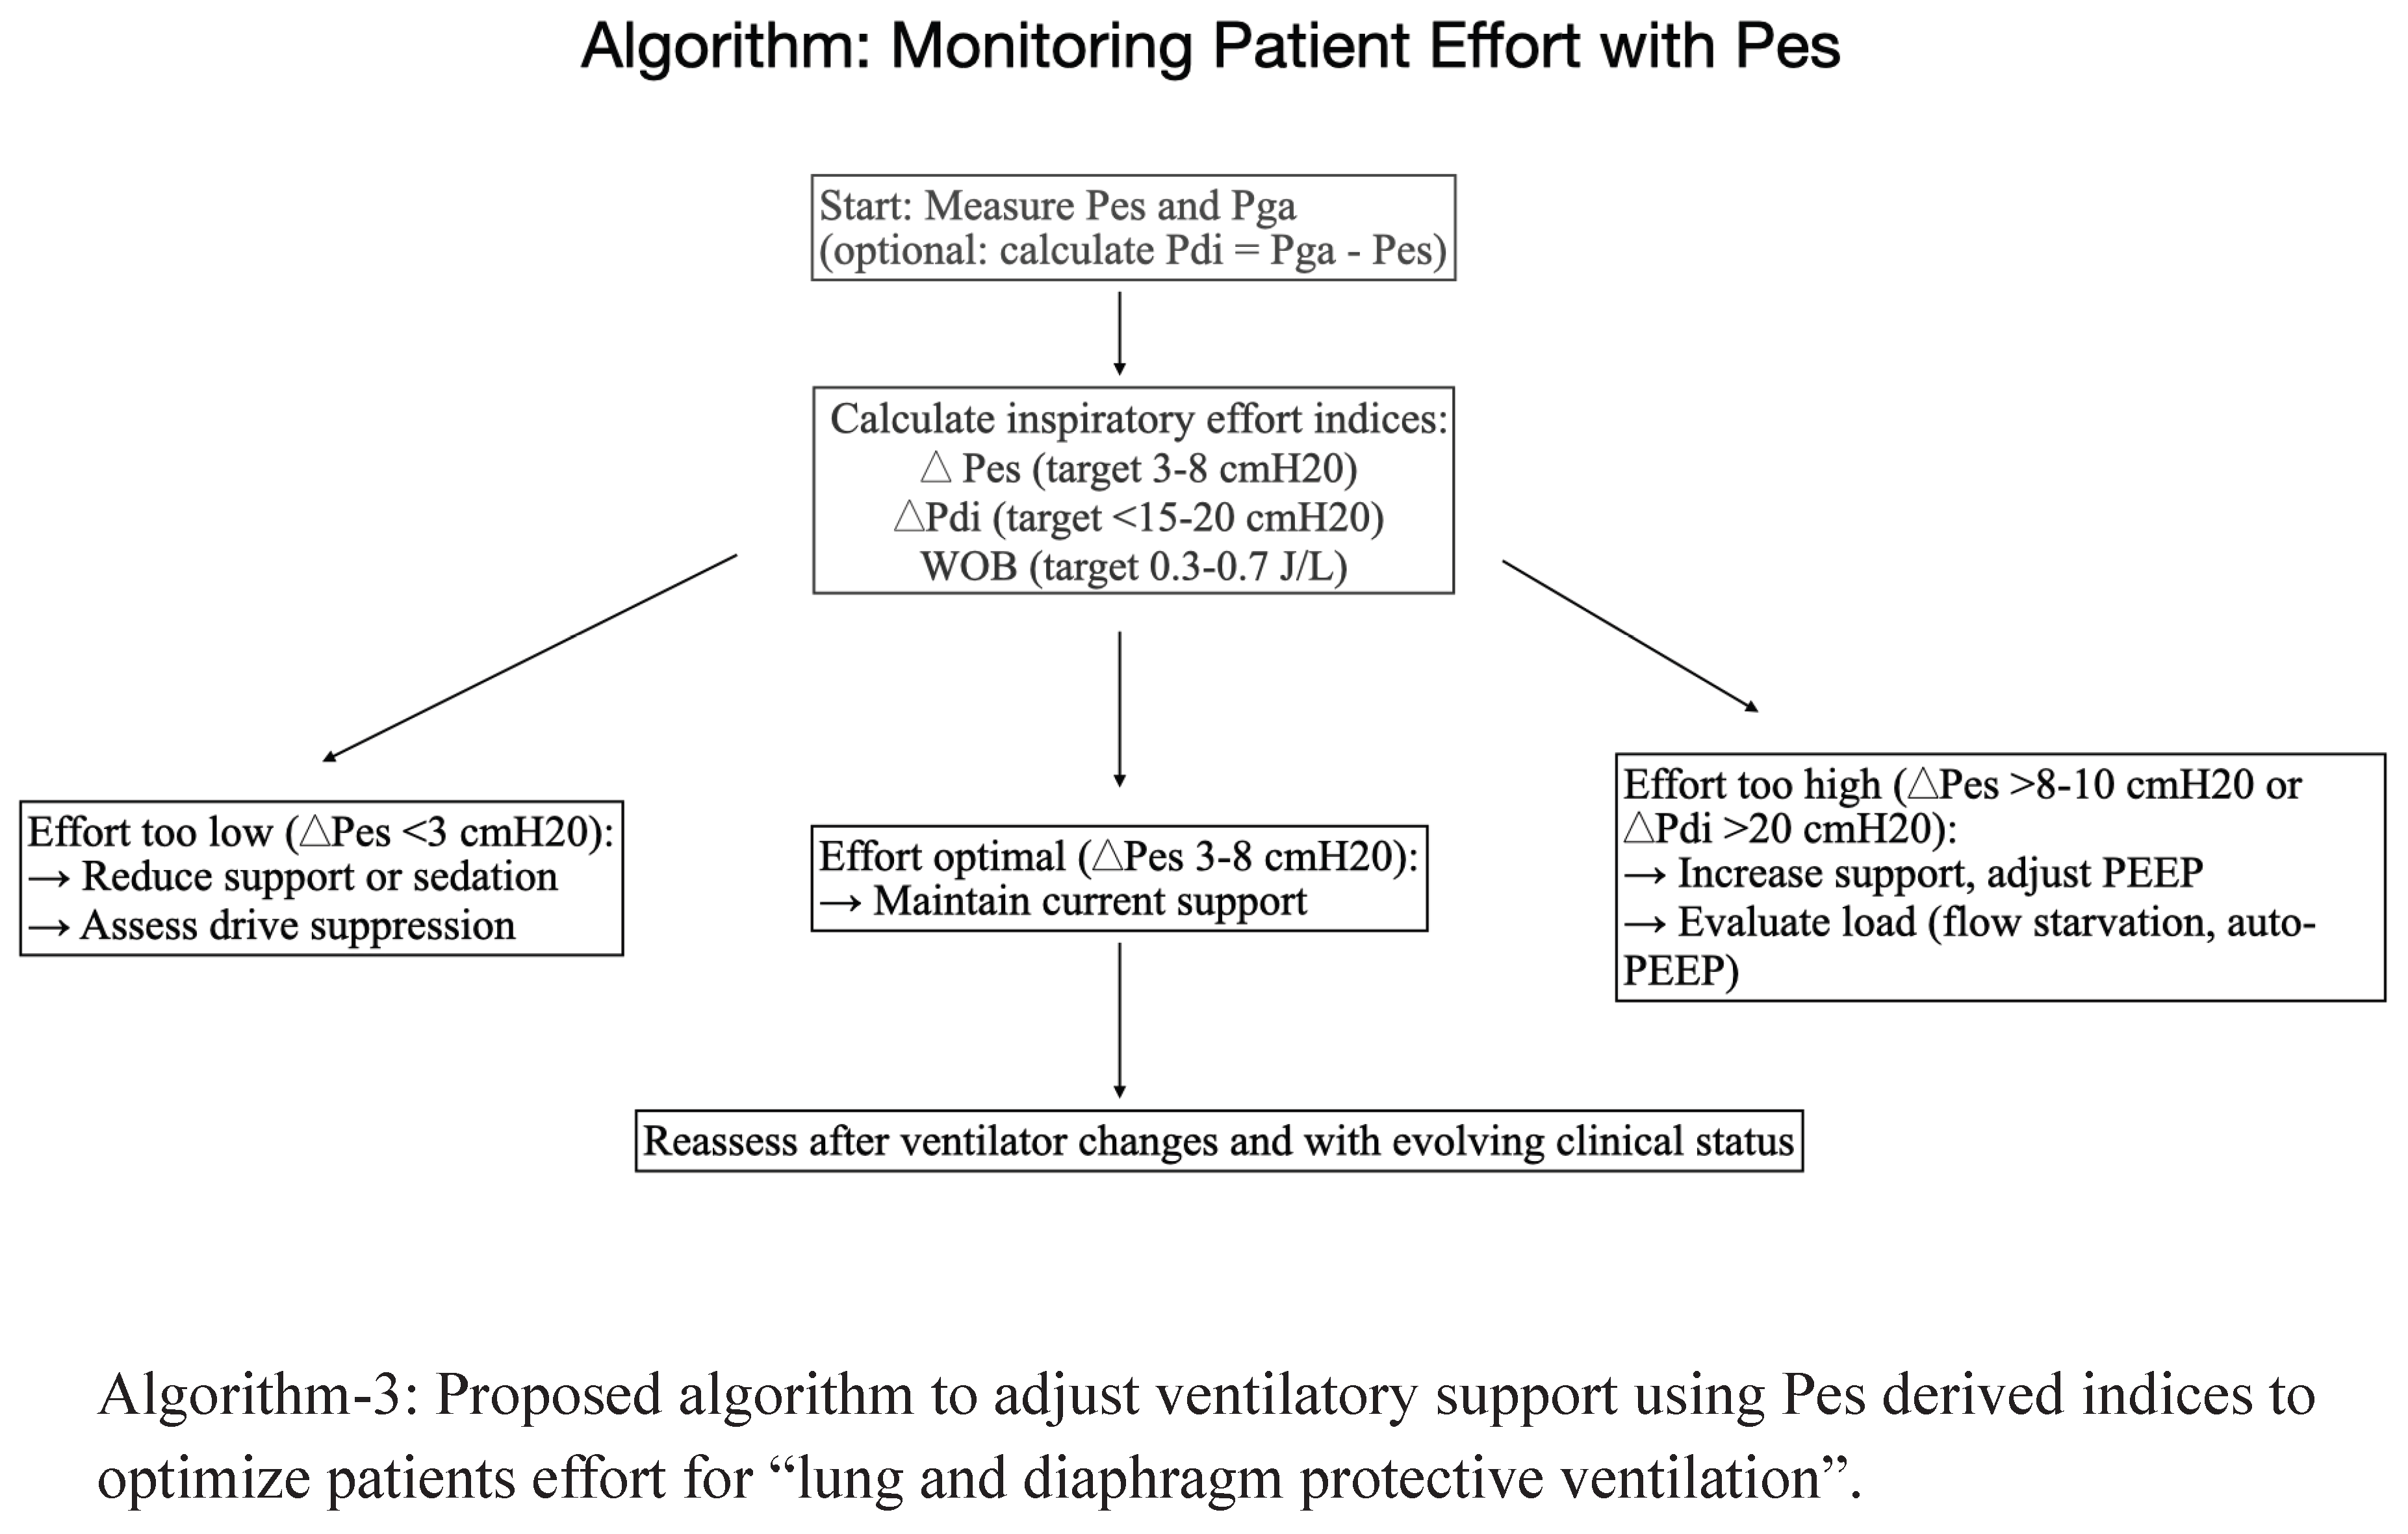
The assessment of patient effort during assisted mechanical ventilation is crucial for balancing the dual risks of patient self-inflicted lung injury (P-SILI) from excessive effort through large transpulmonary pressure swings, while insufficient effort promotes diaphragmatic atrophy and ventilator dependence. Esophageal pressure (Pes) monitoring provides a direct, real-time surrogate of pleural pressure, thereby enabling quantitative evaluation of inspiratory effort [43].
A commonly used index is the tidal swing in esophageal pressure (ΔPes), which reflects the magnitude of patient-generated negative pressure during inspiration. Complementary to this, the transdiaphragmatic pressure (Δpdi); the difference between gastric and esophageal pressures (Pga – Pes) offers a more direct estimate of diaphragmatic workload when dual-balloon catheters are employed [44,45,46]. See Algorithm-3for Proposed algorithm to adjust ventilatory support using Pes derived indices to optimize patients effort for “lung and diaphragm protective ventilation”.
ΔPes (Change in Esophageal Pressure) during inspiration:
This reflects the global inspiratory effort transmitted to the pleural space.
- Suggested Optimal range: A ΔPes of 3–12 cmH₂O is generally considered to represent physiologically appropriate effort. Within this range, the patient contributes to ventilation without incurring undue respiratory muscle strain or alveolar stress.
- Excessive effort: A ΔPes >15 cmH₂O indicates markedly elevated inspiratory drive. Such vigorous efforts can amplify transpulmonary pressures, precipitating regional overdistension, increased shear stress, and ultimately P-SILI.
Thus, Pes monitoring offers a quantitative framework to titrate ventilatory support, guiding clinicians to achieve a balance between avoiding under-assist (preventing overload and injury) and over-assist (preserving diaphragmatic activity). By anchoring patient management to physiologically meaningful effort ranges, this strategy supports lung- and diaphragm-protective ventilation. It has been demonstrated that titrating ventilatory support to optimize inspiratory effort can prevent diaphragmatic dysfunction [44,49,50,51].
ΔPdi (Transdiaphragmatic Pressure = Pga – Pes)
This is more specific to diaphragmatic contractility by isolating pressure generated by the diaphragm itself and calculated by subtracting esophageal pressure (Pes) from gastric pressure (Pga) when dual balloon catheters are used. This may be specifically be helpful in detecting neuromechanical uncoupling (high neural drive but ineffective pressure generation, as seen in severe ARDS or diaphragm weakness) [45,52].
- Suggested Optimal range: 5–15 cmH₂O.
- Excessive effort: >18 cmH₂O, signaling risk of diaphragmatic injury and increased metabolic load.
6. Work of Breathing
The work of breathing (WOB) reflects the energy expenditure required to overcome the elastic and resistive loads of the respiratory system. It represents a critical determinant of both patient comfort and ventilatory adequacy. Precise quantification of WOB enables clinicians to evaluate whether ventilatory support is appropriately matched to patient demand, thereby preventing both fatigue and ventilator-induced complications [5].
An estimated normal WOB is approximately 0.3–0.6 J/L, indicating physiologically sustainable breathing in health. An excessive or unsustainable values exceeding 1.5 J/L denote a level of respiratory muscle load that is unlikely to be sustained, predisposing patients to fatigue, hypercapnia, and potential weaning failure [53].
Esophageal pressure (Pes) monitoring provides a unique means to calculate the pressure–time product of the esophageal pressure (PTPes), which integrates the magnitude and duration of inspiratory effort over time. Pressure time product is thought to strongly correlate with diaphragmatic oxygen consumption and energy expenditure, making it a physiologically robust measure of respiratory muscle workload and work of breathing [54,55].
PTPes (Pressure–Time Product of the Esophagus) [53]
Represents the integrated inspiratory load over time,
- Suggested target range: 60–150 cmH₂O·s/min.
- Low values indicate over-assist and underuse of respiratory muscles.
- High values (>200 cmH₂O·s/min) denote unsustainable loads, predictive of weaning failure and impending fatigue.
By providing an objective index of inspiratory effort, Pes-derived WOB and PTPes can guide the titration of proportional assist ventilation (PAV), neurally adjusted ventilatory assist (NAVA), or optimized levels of pressure support ventilation (PSV). These dynamic, patient-tailored strategies aim to maintain the patient’s effort within the “lung- and diaphragm-protective window”—ensuring sufficient respiratory drive to prevent atrophy, while avoiding injurious levels of strain that risk patient self-inflicted lung injury (P-SILI) [53,55].
7. Weaning from mechanical ventilation
Weaning failure often reflects a load–capacity imbalance, where the mechanical load imposed on the respiratory system exceeds the patient’s neuromuscular capacity. Conventional predictors, such as the rapid shallow breathing index (RSBI), provide only a crude snapshot of breathing pattern and do not directly quantify inspiratory effort or diaphragmatic workload. Esophageal pressure (Pes) monitoring addresses this gap by offering dynamic, physiologic indices that integrate both load and effort, thereby providing a more accurate assessment of readiness to wean. Pes-derived indices allows us to detect load–capacity imbalance during SBTs, even when conventional metrics appear reassuring. It can help us differentiate between respiratory muscle weakness and excessive ventilatory load, informing targeted therapy (e.g., adjusting PEEP, bronchodilation, or rehabilitation strategies) and ultimately guide timing of extubation, improving safety and reducing the risk of failure and potentially consider unloading strategies such as Non-invasive ventilation or heated high flow nasal cannula after extubation. A few Pes-derived indices are briefly mentioned for perusal [4,56,57].
Pes-Derived Indices
- ΔPes (Swing in Esophageal Pressure): Directly measures patient inspiratory effort during spontaneous breathing trials (SBTs). This is calculated as the difference between lowest Pes value just before the beginning and during inspiration. This is considered as a surrogate of muscle power, as this does not incorporate recoil of the chest wall.
Suggested target ΔPes between -2 cm H20 and -12 cmH20.
Excessive ΔPes indicates that the patient is generating abnormally high negative pressures to overcome resistive or elastic loads, suggestive of impending weaning failure. Minimal ΔPes, in contrast, may reflect excessive ventilator assistance during “assisted SBTs,” which can mask underlying respiratory insufficiency [58].
- 2.
- PTPes (Esophageal Pressure–Time Product): This is a time based integral of Pmus (pressure generated by the inspiratory muscles) which captures both the magnitude and duration of inspiratory effort, making it a robust indicator of the energetic cost of breathing. This is calculated as an area bounded by the negative esophageal pressure during inspiration and the chest wall elastance slope multiplied by the respiratory rate. This seems to co-relate with the oxygen consumption of respiratory muscles better than the work of breathing.
Suggested target PTPes: between 50-150 cm H2O.s/min
Elevated PTPes during an SBT indicates unsustainable work of breathing, correlating strongly with weaning failure. Studies have shown that PTP outperforms RSBI because it measures true diaphragmatic load rather than relying on indirect surrogates like respiratory rate and tidal volume [59].
- 3.
- Pi/Pimax: This is the ratio of change in esophageal pressure during inspiration to the maximum change during occlusion.
Suggested target Pi/Pimax: 0.15 to 0.25
A high Pi/Pimax (> 0.46) is associated with re-intubation. A disadvantage to this index is that it does not capture the inspiratory time which contributes to the work of breathing [60].
- 4.
- Tension-time index (TTI): calculated as a ratio of (Pdi/Pdimax) to (TI/Ttot). This is the ratio of fractional diaphragmatic pressure to the inspiratory duty cycle.
Suggested TTI > 0.15
A TTI of < 0.15 correlated with respiratory muscle fatigue [61].
Pdi: mean transdiaphragmatic pressure during inspiration (Pes-Pgastric)
Pdimax: transdiaphragmatic pressure during maximum inspiration
TI: inspiration time
Ttot: time for one respiratory cycle
- 5.
Suggested target PRP: between 200-400 cm H2O/min.
This range seems to correspond to PTP range of 50–150cm H2O·s/min.
- 6.
- Trend Index: Unlike RSBI (RR/VT), which ignores effort, TI incorporates ΔPes, providing a more direct measure of patient work. This is a composite Pes-derived parameter that integrates ΔPes swings in the first 9-10 minutes, reflecting the trajectory of effort rather than a single time-point measurement. Progressive increases in ΔPes or PTPes during an SBT (even if within acceptable ranges at initiation) may signal fatigue and impending failure, allowing earlier intervention [64,65,66].
Pes trend index = 0.240 + 0.241* X1- 0.111*X2- 0.067*X3 + 0.055*X4
- X1 = max (0, 7.411 –∆Pes 9);
- X2 = max (0, ∆Pes 9- 5.967);
- X3 = max (0, ∆Pes 1-0.094) * max(0, ∆Pes 9-7.411);
- X4 = max (0, ∆Pes 1 + 1.679) * max(0, ∆Pes 9-10.729)
- ∆Pes 9 represents the estimated value of Pes at the ninth-to-tenth minute transition, and ∆Pes 1 represents the slope of the swings in Pes throughout the first minute
Pes trend index of less than or equal to 0.44 after 9 minutes of spontaneous breathing was associated with weaning failure.
8. Hemodynamic Assessment
Esophageal pressure (Pes) monitoring has important implications beyond respiratory mechanics, particularly in the realm of hemodynamic assessment. Because the esophagus lies within the thoracic cavity, Pes reflects changes in intrathoracic pressure, which directly influences the transmural pressures experienced by the heart and great vessels [9].
During spontaneous breathing, negative Pes swings augment venous return and reduce left ventricular afterload, whereas positive intrathoracic pressures during controlled ventilation can impede venous return and elevate right ventricular afterload. These dynamics are critical when interpreting invasive pressure measurements such as central venous pressure (CVP) and pulmonary artery occlusion pressure (PAOP).
A positive Pes (elevated intrathoracic pressure), as may occur during positive-pressure ventilation or in obesity, is transmitted to the intravascular compartment. This transmission causes CVP and PAOP values to appear artificially elevated, even though the true transmural (effective) filling pressures of the heart may be normal or even reduced. Conversely, negative Pes swings during strong inspiratory efforts can artifactually lower measured filling pressures, potentially masking inadequate preload [67].
To correctly interpret hemodynamic data in this context, intravascular pressures should be adjusted by accounting for Pes [68]. The transmural pressure, the true distending pressure of a cardiac chamber or vessel—is obtained by subtracting Pes (or intrathoracic pressure) from the measured intravascular pressure:
Ptransmural=Pmeasured−Pesophageal
This correction is particularly valuable in critically ill patients with acute respiratory distress syndrome (ARDS), obesity, or those receiving high levels of positive end-expiratory pressure (PEEP), where chest wall mechanics significantly distort intravascular pressure readings. Pes monitoring thus provides a means to disentangle cardiac preload and afterload from the confounding influence of intrathoracic pressures, thereby improving the accuracy of hemodynamic assessment and guiding fluid and vasoactive therapy in complex critically ill patients [69,70].
Clinical Example
Consider a patient with moderate-to-severe ARDS, managed on high levels of PEEP (e.g., 16 cmH₂O). Standard invasive monitoring shows a CVP of 18 mmHg and a PAOP of 20 mmHg, both of which would typically suggest elevated preload and possible risk of pulmonary congestion. However, simultaneous esophageal pressure (Pes) monitoring reveals an average Pes of +12 cmH₂O, reflecting markedly elevated pleural pressure due to both chest wall mechanics and applied PEEP. When corrected for Pes, the transmural filling pressures are significantly lower than the measured values suggest:
CVP transmural= CVP measured−Pes=18−12=6 mmHg
PAOP transmural=PAOP measured−Pes=20−12=8 mmHg
These corrected values demonstrate that, despite apparently elevated intravascular pressures, the true preload is low, and the patient may in fact benefit from cautious fluid administration or adjustment of vasoactive support. Without Pes monitoring, reliance on uncorrected CVP/PAOP could lead to erroneous clinical decisions—such as withholding fluids or even initiating unnecessary diuresis—potentially worsening perfusion.
9. Utility in special populations
A. Obesity and Elevated Intra-Abdominal Pressure
In patients with obesity or elevated intra-abdominal pressure (IAP), baseline esophageal pressure (Pes) is typically elevated due to reduced chest wall compliance and upward displacement of the diaphragm. This phenomenon leads to higher measured airway pressures (Paw), which may be misinterpreted as reflecting injurious lung stress if Pes is not accounted for. By partitioning lung and chest wall mechanics, Pes monitoring allows for differentiation between elevated Paw driven by chest wall loading versus true transpulmonary pressure (PL).The elevated airway plateau pressures (Pplat) can be misleading. In such patients, higher Paw is acceptable provided that the end-inspiratory transpulmonary pressure (Plinsp) remains within the safe range (<15–20 cmH₂O). Because elevated Pes often translates into a negative end-expiratory PL (Plexp), higher levels of PEEP are frequently necessary to achieve a Plexp near 0–2 cmH₂O, thereby preventing alveolar collapse. Adequate PEEP counteracts external compressive forces imposed by the chest wall and abdominal pressure, ensuring that alveoli especially in dependent regions remain open without excessive distension of non-dependent lung regions [72,73].
B. Severe COPD (Chronic obstructive pulmonary disease) /Asthma
In severe airflow obstruction, slow expiratory time constants and dynamic airway collapse trap gas at end-expiration, elevating alveolar pressure (Palv) above the airway opening (Paw) when the next inspiration begins. This intrinsic PEEP (PEEPi, “auto-PEEP”) imposes a threshold load and thereby patient must first generate enough negative pleural pressure to bring Palv down to Paw before any inspiratory flow can occur.
With esophageal manometry, the start of an assisted or spontaneous breath classically displays a downward Pes deflection without flow, Paw and flow remain flat until the negative Pes equals the trapped pressure. The magnitude of this pre-flow Pes drop approximates dynamic PEEPi. During an end-expiratory occlusion (“no-flow” hold), the negative Pes required to deflect Paw equals static PEEPi and quantifies the threshold load. External PEEP may be gradually increased while observing pre-flow Pes drop during assisted or support mode. Typically external PEEP is targeted to 70–85% of measured PEEPi to reduce threshold load while avoiding additional hyperinflation. Other ways to treat auto-PEEP include lengthening expiratory time (↓RR, adjusting Inspiratory: expiratory ratio), reduce VT/flow demand, lowering circuit resistance, treating bronchospasm and clearing secretions. Mose sensitive flow trigger or neural triggering may be used [74].
Occasionally, in COPD/asthma, abdominal/expiratory muscle activity may persist into end-expiration, raising gastric pressure (Pga) and thus Pes even when lungs are still hyperinflated. This can overestimate PEEPi if an elevated end-expiratory Pes is interpreted purely as pleural pressure [34].
Clues to detect this overestimation includes:
- Phasic Pga rises during expiration and a positive end-expiratory Pdi (Pga–Pes).
- Abdominal paradox or visible abdominal muscle recruitment.
Measurement during relaxed breathing and brief expiratory occlusions to eliminate flow-dependent artifacts and track Pga with a dual-balloon catheter, and interpret Pes in conjunction with flow/volume tracings (ensure complete exhalation is not occurring) may mitigate some of these problems [75,76].
It must be remembered that PEEPi varies regionally and Pes reflects a mid-thoracic average when a true threshold loads can be higher in dependent lung. Furthermore, very weak inspiratory muscles may not overcome PEEPi; the pre-flow Pes drop will then underestimate the true auto-PEEP [77,78].
C. ECMO (Extra Corporeal Membrane Oxygenation)
During venovenous ECMO, gas exchange (especially CO₂ removal) is largely off-loaded to the circuit, allowing the ventilator to be set for minimal lung stress and strain. Because airway pressures (Paw) are confounded by chest-wall mechanics—often markedly abnormal in ARDS, obesity, or elevated intra-abdominal pressure—transpulmonary pressure (PL = Paw − Pes) is the most direct bedside surrogate of alveolar distending pressure. Targeting PL rather than Paw operationalizes lung rest by capping true tissue stress [79] . Definitive randomized data specifically linking Pes-guided PL targets to ECMO outcomes are limited; current support is physiologic and pragmatic rather than trial-proven.
Proposed “lung rest” ventilation strategy at bedside:
- End-inspiratory stress (PLinsp). Use paralysis or deep sedation (at least during measurement) to eliminate patient effort, then titrate VT/pressure support to keep PLinsp low (commonly ≤10–12 cmH₂O, and even 5–10 cmH₂O in the early “ultraprotective” phase).
- End-expiratory stability (Plexp). Adjust PEEP to maintain Plexp ≈ 0 to +2 cmH₂O, preventing cyclic collapse without overdistending non-dependent lung.
- Driving pressure. Minimize ΔPL (PLinsp − Plexp)—ideally <10–12 cmH₂O. With sweep gas handling CO₂, accept very low VT (3–4 mL/kg PBW or less) and lower respiratory rates as needed to achieve these PL targets.
- Obesity/high IAP. Expect higher measured Paw at any given PL because Pes is elevated. With Pes guidance, accept higher Pplat/Paw (and often higher PEEP) so long as PL targets are respected—a strategy that sustains recruitment in dependent lung without exceeding safe distending pressures.
Other clinical applications include
“Pre-ECMO candidacy assessment”: When high Paw appears “unsafe” in obese ARDS, Pes may reveal acceptable PL, supporting continuation of non-ECMO strategies or more confident use of higher PEEP while monitoring PL [79].
10. Integration with other monitoring for comprehensive assessment
Electrical Activity of the Diaphragm (EAdi): Neuro-mechanical coupling
The electrical activity of the diaphragm (EAdi) represents the integrated neural output from the respiratory centers in the brainstem to the diaphragm via the phrenic nerves. It is captured using specialized esophageal catheters equipped with multiple electrodes. Unlike Pes, which measures the mechanical consequence of inspiratory effort, EAdi quantifies the neural command itself. Thus, EAdi provides a direct link between central respiratory drive and ventilatory effort, bridging physiology with patient–ventilator interaction. Eadi (neuro-ventilatory drive) reflects the intensity of central drive to breathe, integrating chemical (PaCO₂, PaO₂, pH) and mechanical (load, stretch receptor input) stimuli. EAdi provides precise temporal information, marking inspiratory onset and termination. Elevated EAdi signals heightened respiratory drive, often in response to hypoxemia, hypercapnia, or increased mechanical load (e.g., in ARDS or COPD). Low EAdi may reflect over sedation, excessive ventilator assist, or impaired central drive. Whereas Pes reflects pressure transmission and mechanical consequences, EAdi reflects the central respiratory command. Together, they offer a more holistic assessment of patient effort, synchrony, and ventilatory support adequacy [48].
By comparing EAdi with Pes or tidal volume, one can assess the efficiency of translating neural drive into mechanical output (neuro-mechanical coupling), a measure that becomes particularly relevant in conditions like neuromuscular weakness or diaphragm dysfunction [81].
Integrating EAdi with Pes monitoring improves detection of patient–ventilator asynchronies such as delayed triggering, premature cycling, or reverse triggering and can be used to titrate ventilator output proportionally to neural effort, aligning mechanical assistance with patient demand especially in proportional assist ventilation (PAV) or neurally adjusted ventilatory assist (NAVA) modes. This can help avoid both over-assist (leading to diaphragm unloading and atrophy) and under-assist (leading to excessive effort and potential patient self-inflicted lung injury, P-SILI). Furthermore can be used to assess readiness to wean [82].
Diaphragm Ultrasound
Diaphragm ultrasound provides a noninvasive, real-time assessment of diaphragmatic structure and function. Two main parameters typically evaluated include diaphragmatic thickening and displacement [83].
1. Diaphragmatic thickening (TF, thickening fraction):
Measured at the zone of apposition, typically between the 8th and 10th intercostal space. Thickening during inspiration reflects active fiber recruitment.
TF = (Thickness at end-inspiration − Thickness at end-expiration) / Thickness at end-expiration × 100%.
Moderate thickening fractions (typically 20–40%) during spontaneous breathing trials correlate with successful extubation, while minimal or absent thickening suggests diaphragmatic weakness or fatigue.
2. Excursion (displacement)
Measured in M-mode, reflecting diaphragmatic caudal displacement during inspiration.
These ultrasound-derived indices are indirect surrogates of diaphragmatic effort and contractility, though they measure movement and morphology, not pressure generation. Serial measurements can track changes in diaphragmatic activity, particularly during prolonged mechanical ventilation. Reduced excursion or thickening may indicate ventilator-induced diaphragmatic dysfunction (VIDD), phrenic nerve injury, or myopathic changes. Unlike Pes, diaphragm ultrasound requires no invasive equipment and can be repeated frequently. However there are some limitations. The relationship between thickening fraction/excursion and true inspiratory effort (quantified via Pes or pressure–time product [PTPes]) is modest. Thickening reflects regional recruitment but does not directly quantify pressure generation. Excursion may be influenced by passive lung mechanics, ventilator support, or patient positioning. Ultrasound is dependent on operator expertise, probe placement, patient body habitus, and intercostal window. Ultrasound measures a limited region of the diaphragm (zone of apposition), which may not represent global diaphragmatic activity [84,85].
Diaphragm ultrasound is best viewed as a qualitative and trend tool for diaphragm activity, with value in predicting weaning success and identifying dysfunction. However, for accurate quantification of inspiratory effort and work of breathing, Pes-derived indices (ΔPes, PTPes) remain superior. Integrating Diaphragm ultrasound with Pes monitoring may be used for more comprehensive assessment for diaphragmatic function [83,84,85].
Electrical Impedance Tomography (EIT)
Electrical Impedance Tomography (EIT) is a noninvasive, radiation-free imaging modality that provides real-time, bedside monitoring of regional ventilation distribution. A belt containing multiple surface electrodes is placed circumferentially around the patient’s thorax. Low-amplitude alternating electrical currents are applied between electrode pairs, and the resulting voltage changes are measured. Because air has much higher impedance than surrounding tissues, variations in thoracic impedance correspond to regional changes in lung aeration throughout the respiratory cycle. Unlike global airway pressure measurements (Paw, Pes, PL), which provide averaged data, EIT captures spatial heterogeneity of lung inflation. It identifies regions of collapse, under-ventilation, or overdistension, guiding more individualized ventilator settings. By observing recruitment vs. overdistension in real time, EIT is believed to allow titration of PEEP to balance alveolar opening with avoidance of hyperinflation [86,87].
Pes-derived transpulmonary pressure reflects global lung stress, but cannot differentiate regional ventilation patterns. EIT complements this by identifying regional strain and overdistension, ensuring that maintaining “safe” global pressures (e.g., Plinsp <15–20 cmH₂O) does not mask harmful regional mechanics. This can be important as EIT can reveal non-dependent lung overdistension even when Pes-guided PL values remain within target ranges. Furthermore, EIT can show delayed emptying, regional air trapping, or asymmetric ventilation, and may be useful in COPD and asthma. However EIT provides only a cross-sectional slice of the lung (typically at the 4th–6th intercostal space), which may not fully represent global lung mechanics. Image resolution is modest compared to CT, though temporal resolution is superior (real-time monitoring) and is not yet universally standardized [88,89,90,91].
Occlusion pressure indices (P0.1 and Pocc)
P0.1 (Occlusion Pressure at 100 ms) is defined as the negative airway pressure generated during the first 100 milliseconds of an inspiratory effort against an occluded airway. It reflects the neural respiratory drive, independent of patient effort duration or respiratory system mechanics, because it is measured before significant lung or chest wall displacement occurs [92].
High P0.1 (>3.5–4 cmH₂O): Suggests excessive respiratory drive, which may predispose to patient self-inflicted lung injury (P-SILI) [93].
Low P0.1 (<1 cmH₂O): May indicate over-assist, deep sedation, or central suppression [93].
Pocc (Maximum Occlusion Pressure) is measured during a brief airway occlusion, Pocc represents the maximal inspiratory pressure a patient can generate. It provides an estimate of patient inspiratory effort and load–capacity balance, capturing the combined effect of neural drive, muscle strength, and chest wall mechanics [94].
High Pocc: Reflects strong inspiratory effort, suggesting under-assistance or increased mechanical load [94].
Low Pocc: Suggests diaphragmatic weakness, over-assist, or impaired neural drive [95].
Both P0.1 and Pocc can be measured easily using standard ventilators without specialized equipment and are useful as rapid adjuncts to measure respiratory drive. Abnormal values of P0.1 and Pocc may signal excessive effort or insufficient drive, both of which increase the risk of weaning failure. However these indices do not distinguish neural drive from mechanical load (e.g., high P0.1 may reflect either strong drive or high resistance) and could be sensitive to sedation, ventilator settings, and patient–ventilator synchrony. Additionally they lack the precision of Pes or EAdi for quantifying effort and transpulmonary stress, hence together, they provide more pragmatic assessment of respiratory drive [96,97,98].
See Table 4 for summary of various physiological (proposed) targets for esophageal derived indices during mechanical ventilation for lung and diaphragm protective strategy.
Limitations and Cautions for Esophageal Pressure Monitoring
While esophageal pressure (Pes) monitoring provides unique physiologic insights into transpulmonary mechanics, its application carries several important limitations and caveats that must be acknowledged for accurate interpretation and safe use in clinical practice.
1. Regional Representation of Pleural Pressure:
Pes primarily reflects pleural pressure in the dependent, mid-thoracic regions of the lung. However, pleural pressure is heterogeneous across the thorax, especially in acute respiratory distress syndrome (ARDS), where gravitational and structural forces create marked regional differences. Thus, while Pes offers a useful approximation of pleural pressure, it may underestimate the stress in non-dependent lung regions, where overdistension can occur even when transpulmonary pressure appears within “safe” limits [25,99].
2. Technical Sources of Artifact
Accurate Pes measurement is highly dependent on technique. Common sources of error include, esophageal spasm, which can transiently increase local pressure and distort readings, cardiac oscillations, transmitted to the esophagus, which may obscure respiratory pressure swings, catheter malposition (e.g., gastric placement or shallow esophageal location), which can lead to inaccurate reflection of thoracic pressures [100].
3. Balloon Inflation and Calibration
The accuracy of Pes monitoring is sensitive to balloon volume and calibration technique. Under inflation risks poor transmission of pleural pressure, whereas overinflation can cause esophageal wall apposition and artifactually elevated readings. Manufacturers recommend initial balloon inflation followed by stepwise deflation to a “best volume” (Vbest), the point at which respiratory swings are most faithfully transmitted with minimal artifact. In addition, periodic occlusion tests (ΔPaw/ΔPes ≈ 1 during inspiratory effort against a closed airway) are essential to verify measurement reliability [100].
4. Outcome Evidence and Clinical Individualization
Although Pes-guided strategies consistently improve oxygenation and compliance compared with low-PEEP protocols, evidence for mortality benefit remains mixed. The EPVent-1 trial suggested potential survival advantage, but the larger EPVent-2 trial did not confirm this benefit compared with high-PEEP strategies. Consequently, Pes monitoring should be viewed as a physiologic adjunct, particularly valuable in specific phenotypes (e.g., obesity, altered chest-wall mechanics, equivocal weaning), rather than a universal mandate [101].
See Table 5 for summary on the strengths and limitations of esophageal pressure monitoring during mechanical ventilation. See Figure 13 for the summary of various clinical applications and proposed targets during mechanical ventilation using esophageal pressure monitoring.
Future directions
Targeted trials:
Future research on esophageal pressure (Pes) monitoring should focus on targeted, stratified clinical trials that address patient heterogeneity in chest-wall mechanics, positioning, and spontaneous effort. Prior studies such as EPVent and EPVent-2 suggest physiologic benefits of Pes-guided ventilation but highlight the need for phenotype-specific strategies. Carefully designed multi-center trials should randomize patients to Pes-guided versus standardized approaches while stratifying by obesity or elevated chest-wall elastance (BMI ≥35–40), proning status, and degree of spontaneous effort. Endpoints should include ventilator-free days, mortality, and physiologic measures of lung stress and effort, complemented by mechanistic sub-studies (e.g., EIT for regional strain, biomarkers of biotrauma, diaphragm ultrasound). Such trials would clarify whether individualized, physiology-driven ventilatory management improves outcomes in select populations—particularly obese patients, those requiring prone positioning, and patients with high inspiratory effort—ultimately defining the most clinically impactful and safe role for Pes monitoring in critical care.
Closed-loop ventilation:
Closed-loop ventilation represents a promising future direction by integrating real-time esophageal pressure (Pes) monitoring into automated controllers that titrate PEEP, inspiratory support, and assist levels. Using end-expiratory and end-inspiratory transpulmonary pressures (Plexp, Plinsp) alongside effort-based indices (ΔPes, PTPes), these systems can dynamically balance lung protection, avoiding overdistension and collapse. It can incorporate diaphragm protection preventing both excessive effort and disuse atrophy. Early prototypes of physiologically adaptive modes, such as proportional assist ventilation (PAV) and neurally adjusted ventilatory assist (NAVA), demonstrate feasibility, but true closed-loop systems integrating Pes remain largely experimental. Future development should focus on algorithms that continuously adapt to changes in chest-wall mechanics, spontaneous effort, and patient–ventilator synchrony, with validation in multi-center trials. Such technology has the potential to transform Pes from a specialized monitoring tool into a bedside-integrated, automated controller, delivering individualized lung- and diaphragm-protective ventilation. It may have a role in weaning process.
Catheter advancements
Advances in catheter technology are central to expanding the clinical utility of esophageal pressure (Pes) monitoring. Next-generation designs featuring wide-range, thin-wall balloons can improve signal fidelity across diverse patient populations, including those with altered chest-wall mechanics. Enhanced signal-processing algorithms, particularly improved filtering of cardiac oscillations, would reduce artifacts and allow more reliable interpretation during dynamic conditions. Integration of Pes-derived metrics such as real-time transpulmonary pressures (PL), ΔPes, and PTPes—directly into ventilator displays would streamline workflow, minimize operator dependence, and promote wider adoption. Future innovation should prioritize user-friendly, robust, and artifact-resistant systems that deliver clinically actionable data at the bedside, thereby transforming Pes monitoring from a research tool into a routine standard for precision-guided mechanical ventilation.
11. Conclusions
Esophageal pressure monitoring offers a valuable window into patient–ventilator interaction, lung–chest wall mechanics, and inspiratory effort. It provides a physiologically sound method for tailoring PEEP, tidal volume, and support levels, particularly in complex cases such as ARDS with obesity, COPD, or severe dyssynchrony. While limitations exist including heterogeneity of pleural pressures and technical artifacts, when applied thoughtfully, Pes monitoring facilitates more precise, lung- and diaphragm-protective ventilation. Pes guided ventilation may be helpful in weaning, outperforming conventional indices by quantifying true muscle effort. Further large-scale trials are needed to clarify its impact on clinical outcomes, but its role as a bedside physiological tool is firmly established.
Author Contributions
R.P contributed to the conception and design of the review, formulated the research question, and supervised the overall project. J.K conducted the literature search, screened eligible studies, and assisted with data acquisition and extraction and prepared figures. O.A contributed to analysis and interpretation of physiologic and clinical data; drafted sections on technical aspects and proposed physiological targets. B.K contributed to data synthesis, particularly regarding PEEP titration, patient effort, and complex clinical scenarios; assisted in drafting the findings section. D.D provided critical revision of the manuscript for important intellectual content, ensured consistency across sections, and finalized the manuscript. All authors contributed to the drafting and/or critical revision of the work, approved the final version for publication, and agree to be accountable for all aspects of the work.
References
- Gattinoni, L.; Tonetti, T.; Quintel, M. Regional physiology of ARDS. Crit Care 2017, 21, 312. [Google Scholar] [CrossRef]
- Otto, C.M.; Markstaller, K.; Kajikawa, O.; et al. Spatial and temporal heterogeneity of ventilator-associated lung injury after surfactant depletion. J Appl Physiol Bethesda Md 1985 2008, 104, 1485–1494. [Google Scholar] [CrossRef] [PubMed]
- Zaidi, S.F.; Shaikh, A.; Khan, D.A.; Surani, S.; Ratnani, I. Driving pressure in mechanical ventilation: A review. World J Crit Care Med. 2024, 13, 88385. [Google Scholar] [CrossRef]
- Shimatani, T.; Kyogoku, M.; Ito, Y.; Takeuchi, M.; KhemaniRG. Fundamental concepts and the latest evidence for esophageal pressure monitoring. J Intensive Care 2023, 11, 22. [Google Scholar] [CrossRef]
- Silva, P.L.; Rocco, P.RM. The basics of respiratory mechanics: ventilator-derived parameters. Ann Transl Med. 2018, 6, 376–376. [Google Scholar] [CrossRef]
- FernandesCR. Importance of pleural pressure for the evaluation of respiratory mechanics. Rev Bras Anestesiol. 2006, 56, 287–303. [Google Scholar] [CrossRef]
- Neupane, K.; Jamil, R.T. Physiology, Transpulmonary Pressure. In StatPearls; StatPearls Publishing, 2025; Available online: http://www.ncbi.nlm.nih.gov/books/NBK559004/ (accessed on 9 September 2025).
- Hickey, S.M.; Sankari, A.; GiwaAO. Mechanical Ventilation. In StatPearls; StatPearls Publishing, 2025; Available online: http://www.ncbi.nlm.nih.gov/books/NBK539742/ (accessed on 9 September 2025).
- Corp, A.; Thomas, C.; Adlam, M. The cardiovascular effects of positive pressure ventilation. BJA Educ. 2021, 21, 202–209. [Google Scholar] [CrossRef] [PubMed]
- Mora Carpio, A.L.; Mora, JI. Assist-Control Ventilation. In StatPearls; StatPearls Publishing, 2025; Available online: http://www.ncbi.nlm.nih.gov/books/NBK441856/ (accessed on 9 September 2025).
- Mahmood, S.S.; Pinsky, MR. Heart-lung interactions during mechanical ventilation: the basics. Ann Transl Med. 2018, 6, 349. [Google Scholar] [CrossRef] [PubMed]
- Pinto, E.F.; Santos, R.S.; Antunes, M.A.; et al. Static and Dynamic Transpulmonary Driving Pressures Affect Lung and Diaphragm Injury during Pressure-controlled versus Pressure-support Ventilation in Experimental Mild Lung Injury in Rats. Anesthesiology 2020, 132, 307–320. [Google Scholar] [CrossRef]
- Modesto i Alapont, V.; Aguar Carrascosa, M.; Medina, V. Stress, strain and mechanical power: Is material science the answer to prevent ventilator induced lung injury? Med Intensiva Engl Ed. 2019, 43, 165–175. [Google Scholar] [CrossRef]
- Florio, G.; Carlesso, E.; Mojoli, F.; et al. Esophageal pressure as estimation of pleural pressure: a study in a model of eviscerated chest. BMC Anesthesiol. 2024, 24, 415. [Google Scholar] [CrossRef] [PubMed]
- Bastia, L.; Engelberts, D.; Osada, K.; et al. Role of Positive End-Expiratory Pressure and Regional Transpulmonary Pressure in Asymmetrical Lung Injury. Am J Respir Crit Care Med. 2021, 203, 969–976. [Google Scholar] [CrossRef] [PubMed]
- Katira, B.H.; Osada, K.; Engelberts, D.; et al. Positive End-Expiratory Pressure, Pleural Pressure, and Regional Compliance during Pronation. An Experimental Study. Am J Respir Crit Care Med. 2021, 203, 1266–1274. [Google Scholar] [CrossRef]
- Esophageal catheter placement | Hamilton Medical. Available online: http://www.hamilton-medical.com/en_US/Article-page~knowledge-base~7e2f2536-5057-4307-ae54-4eacfd81071b~Esophageal-catheter-placement~.html (accessed on 9 September 2025).
- Sigmon, D.F.; An, J. Nasogastric Tube. In StatPearls; StatPearls Publishing, 2025; Available online: http://www.ncbi.nlm.nih.gov/books/NBK556063/ (accessed on 9 September 2025).
- Mireles-Cabodevila, E.; Fischer, M.; Wiles, S.; Chatburn, RL. Esophageal Pressure Measurement: A Primer. Respir Care 2023, 68, 1281–1294. [Google Scholar] [CrossRef]
- https://www.coopersurgical.com/product/esophageal-balloon-catheter-set/. Available online: https://www.coopersurgical.com/product/esophageal-balloon-catheter-set/ (accessed on 9 September 2025).
- e-Catalog | Hamilton Medical. Available online: http://www.hamilton-medical.com/en_US/E-catalog.html?category=aed4b027-8713-4747-8d16-24b69f76fa3a&tab=7b4882e0-13b1-406a-a224-7ba7480a8b71&product=c7529755-4ea7-4fac-994f-07c54f1fee46 (accessed on 9 September 2025).
- Rudolph, M.W.; Koopman, A.A.; Blokpoel, R.G.T.; KneyberMCJ. Evaluation of Optimal Esophageal Catheter Balloon Inflation Volume in Mechanically Ventilated Children. Respir Care 2024, 22 69, 325–332. [Google Scholar] [CrossRef]
- Pham, T.; Telias, I.; Beitler, JR. Esophageal Manometry. Respir Care 2020, 65, 772–792. [Google Scholar] [CrossRef]
- Cheng, W.; Jiang, J.; Long, Y.; et al. Phenotypes of esophageal pressure response to the change of positive end-expiratory pressure in patients with moderate acute respiratory distress syndrome. J Thorac Dis. 2024, 16, 979–988. [Google Scholar] [CrossRef]
- The Application of Esophageal Pressure Measurement in Patients with Respiratory Failure | American Journal of Respiratory and Critical Care Medicine. Available online: https://www.atsjournals.org/doi/10.1164/rccm.201312-2193CI (accessed on 9 September 2025).
- Sun, X.M.; Chen, G.Q.; Huang, H.W.; et al. Use of esophageal balloon pressure-volume curve analysis to determine esophageal wall elastance and calibrate raw esophageal pressure: a bench experiment and clinical study. BMC Anesthesiol. 2018, 18, 21. [Google Scholar] [CrossRef] [PubMed]
- Enrico, B.; Cristian, F.; Stefano, B.; Luigi, P. Patient-ventilator asynchronies: types, outcomes and nursing detection skills. Acta Bio Medica Atenei Parm. 2018, 89 Suppl 7, 6–18. [Google Scholar] [CrossRef]
- Jackson, R.; Kim, A.; Moroz, N.; et al. Reverse triggering ? a novel or previously missed phenomenon? Ann Intensive Care 2024, 14, 78. [Google Scholar] [CrossRef]
- Ciorba, C.; Gonzalez-Bermejo, J.; Salva, M.A.Q.; et al. Flow and airway pressure analysis for detecting ineffective effort during mechanical ventilation in neuromuscular patients. Chron Respir Dis. 2018, 16, 1479972318790267. [Google Scholar] [CrossRef]
- Saavedra, S.N.; Barisich, P.V.S.; Maldonado, J.B.P.; Lumini, R.B.; Gómez-González, A.; Gallardo, A. Asynchronies during invasive mechanical ventilation: narrative review and update. Acute Crit Care 2022, 37, 491–501. [Google Scholar] [CrossRef]
- de Haro, C.; Santos-Pulpón, V.; Telías, I.; et al. Flow starvation during square-flow assisted ventilation detected by supervised deep learning techniques. Crit Care 2024, 28, 75. [Google Scholar] [CrossRef] [PubMed]
- Parthasarathy, S.; Jubran, A.; Tobin, MJ. Cycling of Inspiratory and Expiratory Muscle Groups with the Ventilator in Airflow Limitation. Am J Respir Crit Care Med. 1998, 158, 1471–1478. [Google Scholar] [CrossRef]
- Coppola, S.; Caccioppola, A.; Froio, S.; et al. Dynamic hyperinflation and intrinsic positive end-expiratory pressure in ARDS patients. Crit Care 2019, 23, 375. [Google Scholar] [CrossRef] [PubMed]
- Lessard, M.R.; Lofaso, F.; Brochard, L. Expiratory muscle activity increases intrinsic positive end-expiratory pressure independently of dynamic hyperinflation in mechanically ventilated patients. Am J Respir Crit Care Med. 1995, 151 2 Pt 1, 562–569. [Google Scholar] [CrossRef]
- van Oosten, J.P.; Akoumianaki, E.; Jonkman, AH. Monitoring respiratory muscles effort during mechanical ventilation. Curr Opin Crit Care 2025, 31, 12. [Google Scholar] [CrossRef]
- Somhorst, P.; Mousa, A.; Jonkman, AH. Setting positive end-expiratory pressure: the use of esophageal pressure measurements. Curr Opin Crit Care 2024, 30, 28–34. [Google Scholar] [CrossRef] [PubMed]
- Jonkman, A.H.; Telias, I.; Spinelli, E.; Akoumianaki, E.; Piquilloud, L. The oesophageal balloon for respiratory monitoring in ventilated patients: updated clinical review and practical aspects. Eur Respir Rev. 2023, 32, 220186. [Google Scholar] [CrossRef]
- Alvey, N.J.; Hlaing, M.; Piccoli, J.; Kukreja, N.; Tran, TT. Positive end-expiratory pressure titration via esophageal balloon monitoring in a morbidly obese patient undergoing laparoscopic nephrectomy. Can J Anaesth. 2020, 67, 1086–1087. [Google Scholar] [CrossRef]
- Talmor, D.; Sarge, T.; Malhotra, A.; et al. Mechanical ventilation guided by esophageal pressure in acute lung injury. N Engl J Med. 2008, 359, 2095–2104. [Google Scholar] [CrossRef]
- Effect of Titrating Positive End-Expiratory Pressure (PEEP) With an Esophageal Pressure–Guided Strategy vs an Empirical High PEEP-Fio2 Strategy on Death and Days Free From Mechanical Ventilation Among Patients With Acute Respiratory Distress Syndrome: A Randomized Clinical Trial | Critical Care Medicine | JAMA | JAMA Network. Available online: https://jamanetwork.com/journals/jama/fullarticle/2725206 (accessed on 9 September 2025).
- Lung protective ventilation strategy for the acute respiratory distress syndrome - Petrucci, N - 2013 | Cochrane Library. Available online: https://www.cochranelibrary.com/cdsr/doi/10.1002/14651858.CD003844.pub4/full (accessed on 9 September 2025).
- De Santis Santiago, R.; Teggia Droghi, M.; Fumagalli, J.; et al. High Pleural Pressure Prevents Alveolar Overdistension and Hemodynamic Collapse in Acute Respiratory Distress Syndrome with Class III Obesity. A Clinical Trial. Am J Respir Crit Care Med. 2021, 203, 575–584. [Google Scholar] [CrossRef] [PubMed]
- Carteaux, G.; Parfait, M.; Combet, M.; Haudebourg, A.F.; Tuffet, S.; Mekontso, D.e.s.s.a.p A. Patient-Self Inflicted Lung Injury: A Practical Review. J Clin Med. 2021, 10, 2738. [Google Scholar] [CrossRef] [PubMed]
- Cornejo, R.; Telias, I.; Brochard, L. Measuring patient’s effort on the ventilator. Intensive Care Med. 2024, 50, 573–576. [Google Scholar] [CrossRef] [PubMed]
- Benditt, JO. Esophageal and gastric pressure measurements. Respir Care discussion 75-77. 2005, 50, 68–75. [Google Scholar]
- Gell, L.K.; Reynolds, K.J.; McEvoy, R.D.; Nguyen, D.P.; Catcheside, PG. A novel method to quantify breathing effort from respiratory mechanics and esophageal pressure. J Appl Physiol Bethesda Md 1985 2024, 136, 1418–1428. [Google Scholar] [CrossRef]
- Mojoli, F.; Pozzi, M.; Orlando, A.; et al. Timing of inspiratory muscle activity detected from airway pressure and flow during pressure support ventilation: the waveform method. Crit Care 2022, 26, 32. [Google Scholar] [CrossRef]
- Goligher, E.C.; Fan, E.; Herridge, M.S.; et al. Evolution of Diaphragm Thickness during Mechanical Ventilation. Impact of Inspiratory Effort. Am J Respir Crit Care Med. 2015, 192, 1080–1088. [Google Scholar] [CrossRef]
- Vries Hde Jonkman, A.; Shi, Z.H.; Man ASde, H.e.u.n.k.s L. Assessing breathing effort in mechanical ventilation: physiology and clinical implications. Ann Transl Med. 2018, 6, 387–387. [Google Scholar] [CrossRef]
- Mojoli, F.; Iotti, G.A.; Torriglia, F.; et al. In vivo calibration of esophageal pressure in the mechanically ventilated patient makes measurements reliable. Crit Care Lond Engl. 2016, 20, 98. [Google Scholar] [CrossRef]
- Mauri, T.; Yoshida, T.; Bellani, G.; et al. Esophageal and transpulmonary pressure in the clinical setting: meaning, usefulness and perspectives. Intensive Care Med. 2016, 42, 1360–1373. [Google Scholar] [CrossRef]
- Wu, W.; Zhang, X.; Lin, L.; et al. Transdiaphragmatic pressure and neural respiratory drive measured during inspiratory muscle training in stable patients with chronic obstructive pulmonary disease. Int J Chron Obstruct Pulmon Dis. 2017, 12, 773–781. [Google Scholar] [CrossRef]
- Calzia, E.; Lindner, K.H.; Witt, S.; et al. Pressure-time product and work of breathing during biphasic continuous positive airway pressure and assisted spontaneous breathing. Am J Respir Crit Care Med. 1994, 150, 904–910. [Google Scholar] [CrossRef]
- Bertoni, M.; Spadaro, S.; Goligher, EC. Monitoring Patient Respiratory Effort During Mechanical Ventilation: Lung and Diaphragm-Protective Ventilation. Crit Care 2020, 24, 106. [Google Scholar] [CrossRef]
- Banner, M.J.; Kirby, R.R.; Gabrielli, A.; Blanch, P.B.; Layon, AJ. Partially and totally unloading respiratory muscles based on real-time measurements of work of breathing. A clinical approach. Chest 1994, 106, 1835–1842. [Google Scholar] [CrossRef]
- Jubran, A.; Grant, B.J.B.; Laghi, F.; Parthasarathy, S.; Tobin, MJ. Weaning prediction: esophageal pressure monitoring complements readiness testing. Am J Respir Crit Care Med. 2005, 171, 1252–1259. [Google Scholar] [CrossRef]
- Albashir, S.M.; Robert, R.C.; Jairath, N.N.; Raub, C.B.; Alzumai, O.A.; Salem, SS. The rapid shallow breathing index (RSBI) as a predictor for extubation success in medical and surgical ICU patients: A retrospective cohort study. Heart Lung J Crit Care 2025, 70, 321–328. [Google Scholar] [CrossRef] [PubMed]
- Vaporidi, K.; Soundoulounaki, S.; Papadakis, E.; Akoumianaki, E.; Kondili, E.; Georgopoulos, D. Esophageal and transdiaphragmatic pressure swings as indices of inspiratory effort. Respir Physiol Neurobiol. 2021, 284, 103561. [Google Scholar] [CrossRef] [PubMed]
- Sassoon, C.S.; Light, R.W.; Lodia, R.; Sieck, G.C.; Mahutte, CK. Pressure-time product during continuous positive airway pressure, pressure support ventilation, and T-piece during weaning from mechanical ventilation. Am Rev Respir Dis. 1991, 143, 469–475. [Google Scholar] [CrossRef] [PubMed]
- Khemani, R.G.; Sekayan, T.; Hotz, J.; et al. Risk Factors for Pediatric Extubation Failure: The Importance of Respiratory Muscle Strength. Crit Care Med. 2017, 45, e798–e805. [Google Scholar] [CrossRef]
- Harikumar, G.; Egberongbe, Y.; Nadel, S.; et al. Tension-time index as a predictor of extubation outcome in ventilated children. Am J Respir Crit Care Med. 2009, 180, 982–988. [Google Scholar] [CrossRef] [PubMed]
- Bellemare, F.; Grassino, A. Effect of pressure and timing of contraction on human diaphragm fatigue. J Appl Physiol. 1982, 53, 1190–1195. [Google Scholar] [CrossRef]
- McGregor, M.; Becklake, MR. THE RELATIONSHIP OF OXYGEN COST OF BREATHING TO RESPIRATORY MECHANICAL WORK AND RESPIRATORY FORCE. J Clin Invest. 1961, 40, 971–980. [Google Scholar] [CrossRef]
- Bellani, G.; Pesenti, A. Assessing effort and work of breathing. Curr Opin Crit Care 2014, 20, 352. [Google Scholar] [CrossRef]
- Carteaux, G.; Mancebo, J.; Mercat, A.; et al. Bedside Adjustment of Proportional Assist Ventilation to Target a Predefined Range of Respiratory Effort. Crit Care Med. 2013, 41, 2125. [Google Scholar] [CrossRef]
- Khemani, R.G.; Hotz, J.; Morzov, R.; et al. Pediatric extubation readiness tests should not use pressure support. Intensive Care Med. 2016, 42, 1214–1222. [Google Scholar] [CrossRef]
- Spinelli, E.; Scaramuzzo, G.; Slobod, D.; Mauri, T. Understanding cardiopulmonary interactions through esophageal pressure monitoring. Front Physiol. 2023, 14, 1221829. [Google Scholar] [CrossRef]
- Jardin, F.; Genevray, B.; Brun-Ney, D.; Bourdarias, JP. Influence of lung and chest wall compliances on transmission of airway pressure to the pleural space in critically ill patients. Chest 1985, 88, 653–658. [Google Scholar] [CrossRef] [PubMed]
- Slobod, D.; Assanangkornchai, N.; Alhazza, M.; Mettasittigorn, P.; Magder, S. Right Ventricular Loading by Lung Inflation during Controlled Mechanical Ventilation. Am J Respir Crit Care Med. 2022, 205, 1311–1319. [Google Scholar] [CrossRef] [PubMed]
- Repessé, X.; Vieillard-Baron, A.; Geri, G. Value of measuring esophageal pressure to evaluate heart-lung interactions—applications for invasive hemodynamic monitoring. Ann Transl Med. 2018, 6, 351. [Google Scholar] [CrossRef]
- Rankin, J.S.; Olsen, C.O.; Arentzen, C.E.; et al. The effects of airway pressure on cardiac function in intact dogs and man. Circulation 1982, 66, 108–120. [Google Scholar] [CrossRef] [PubMed]
- Khirfan, G.; Melillo, C.A.; Al Abdi, S.; et al. Impact of Esophageal Pressure Measurement on Pulmonary Hypertension Diagnosis in Patients With Obesity. Chest 2022, 162, 684–692. [Google Scholar] [CrossRef]
- Thind, G.S.; Mireles-Cabodevila, E.; Chatburn, R.L.; Duggal, A. Evaluation of Esophageal Pressures in Mechanically Ventilated Obese Patients. Respir Care 2022, 67, 184–190. [Google Scholar] [CrossRef] [PubMed]
- Reddy, VG. Auto-PEEP: how to detect and how to prevent--a review. Middle East J Anaesthesiol. 2005, 18, 293–312. [Google Scholar]
- Chen, L.; Grieco, D.L.; Beloncle, F.; et al. Partition of respiratory mechanics in patients with acute respiratory distress syndrome and association with outcome: a multicentre clinical study. Intensive Care Med. 2022, 48, 888–898. [Google Scholar] [CrossRef]
- Tonelli, R.; Fantini, R.; Tabbì, L.; et al. Early Inspiratory Effort Assessment by Esophageal Manometry Predicts Noninvasive Ventilation Outcome in De Novo Respiratory Failure. A Pilot Study. Am J Respir Crit Care Med. 2020, 202, 558–567. [Google Scholar] [CrossRef]
- Ahmed, S.M.; Athar, M. Mechanical ventilation in patients with chronic obstructive pulmonary disease and bronchial asthma. Indian J Anaesth. 2015, 59, 589. [Google Scholar] [CrossRef]
- Mein, S.A.; Ferrera, MC. Management of Asthma and COPD Exacerbations in Adults in the ICU. CHEST Crit Care 2025, 3. [Google Scholar] [CrossRef] [PubMed]
- Rehder, K.J.; Alibrahim, OS. Mechanical Ventilation during ECMO: Best Practices. Respir Care 2023, 68, 838–845. [Google Scholar] [CrossRef]
- Bishop, M.A.; Moore, A. Extracorporeal Membrane Oxygenation Weaning. In StatPearls; StatPearls Publishing, 2025; Available online: http://www.ncbi.nlm.nih.gov/books/NBK570564/ (accessed on 10 September 2025).
- Beck, J.; Reilly, M.; Grasselli, G.; et al. Patient-ventilator interaction during neurally adjusted ventilatory assist in low birth weight infants. Pediatr Res. 2009, 65, 663–668. [Google Scholar] [CrossRef]
- Liu, L.; Liu, S.; Xie, J.; et al. Assessment of patient-ventilator breath contribution during neurally adjusted ventilatory assist in patients with acute respiratory failure. Crit Care 2015, 19, 43. [Google Scholar] [CrossRef]
- Vassilakopoulos, T. Ultrasonographic Monitoring of the Diaphragm during Mechanical Ventilation: The Vital Pump Is Vivid, Plastic, and Vulnerable. Am J Respir Crit Care Med. 2015, 192, 1030–1032. [Google Scholar] [CrossRef]
- Laguado-Nieto, M.A.; Roberto-Avilán, S.L.; Naranjo-Junoy, F.; et al. Diaphragmatic Dynamics and Thickness Parameters Assessed by Ultrasonography Predict Extubation Success in Critically Ill Patients. Clin Med Insights Circ Respir Pulm Med. 2023, 17, 11795484231165940. [Google Scholar] [CrossRef]
- Umbrello, M.; Formenti, P. Ultrasonographic Assessment of Diaphragm Function in Critically Ill Subjects. Respir Care 2016, 61, 542–555. [Google Scholar] [CrossRef]
- Tomicic, V.; Cornejo, R. Lung monitoring with electrical impedance tomography: technical considerations and clinical applications. J Thorac Dis. 2019, 11. [Google Scholar] [CrossRef] [PubMed]
- Kobylianskii, J.; Murray, A.; Brace, D.; Goligher, E.; Fan, E. Electrical impedance tomography in adult patients undergoing mechanical ventilation: A systematic review. J Crit Care 2016, 35, 33–50. [Google Scholar] [CrossRef]
- Maciejewski, D.; Putowski, Z.; Czok, M.; Krzych, ŁJ. Electrical impedance tomography as a tool for monitoring mechanical ventilation. An introduction to the technique. Adv Med Sci. 2021, 66, 388–395. [Google Scholar] [CrossRef] [PubMed]
- Reinartz, S.D.; Imhoff, M.; Tolba, R.; et al. EIT monitors valid and robust regional ventilation distribution in pathologic ventilation states in porcine study using differential DualEnergy-CT (ΔDECT). Sci Rep. 2019, 9, 9796. [Google Scholar] [CrossRef] [PubMed]
- PEEP titration guided by ventilation homogeneity: a feasibility study using electrical impedance tomography | Critical Care | Full Text. Available online: https://ccforum.biomedcentral.com/articles/10.1186/cc8860 (accessed on 10 September 2025).
- Costa, E.L.V.; Borges, J.B.; Melo, A.; et al. Bedside estimation of recruitable alveolar collapse and hyperdistension by electrical impedance tomography. Intensive Care Med. 2009, 35, 1132–1137. [Google Scholar] [CrossRef]
- Beloncle, F.; Piquilloud, L.; Olivier, P.Y.; et al. Accuracy of P0.1 measurements performed by ICU ventilators: a bench study. Ann Intensive Care 2019, 9, 104. [Google Scholar] [CrossRef]
- Kuhlen, R.; Mohnhaupt, R.; Slama, K.; et al. Validation and clinical application of a continuous P0.1 measurement using standard respiratory equipment. Technol Health Care Off J Eur Soc Eng Med. 1996, 4, 415–424. [Google Scholar] [CrossRef]
- Le Marec, J.; Hajage, D.; Decavèle, M.; et al. High Airway Occlusion Pressure Is Associated with Dyspnea and Increased Mortality in Critically Ill Mechanically Ventilated Patients. Am J Respir Crit Care Med. 2024, 210, 201–210. [Google Scholar] [CrossRef]
- Pérez, J.; Telias, I. Airway Occlusion Pressure and Dyspnea during Mechanical Ventilation: Giving Words to the Pleas of the Respiratory Centers. Am J Respir Crit Care Med. 2024, 210, 139–141. [Google Scholar] [CrossRef]
- Tonelli, R.; Protti, A.; Spinelli, E.; et al. Assessing inspiratory drive and effort in critically ill patients at the bedside. Crit Care 2025, 29, 339. [Google Scholar] [CrossRef] [PubMed]
- Whitelaw, W.A.; Derenne, J.P.; Milic-Emili, J. Occlusion pressure as a measure of respiratory center output in conscious man. Respir Physiol. 1975, 23, 181–199. [Google Scholar] [CrossRef] [PubMed]
- Pata, R.; Kristeva, J.; Stocks, J.; Mian, I.S.; Guadarrama, D.; Datar, P. Occlusion Pressure at 100msec for Predicting Outcomes in Patients Ventilated Via Pressure Regulated Volume Control Mode in Moderate Adult Respiratory Distress Syndrome (Oculus Study). In B38: OPTIMIZING MECHANICAL VENTILATION AND VENTILATOR LIBERATION; American Thoracic Society, 2024; pp. A3428–A3428. [Google Scholar] [CrossRef]
- Terzi, N.; Bayat, S.; Noury, N.; et al. Comparison of pleural and esophageal pressure in supine and prone positions in a porcine model of acute respiratory distress syndrome. J Appl Physiol. 2020, 128, 1617–1625. [Google Scholar] [CrossRef]
- Dostal, P.; Dostalova, V. Practical Aspects of Esophageal Pressure Monitoring in Patients with Acute Respiratory Distress Syndrome. J Pers Med. 2023, 13, 136. [Google Scholar] [CrossRef] [PubMed]
- Beitler, J.R.; Sarge, T.; Banner-Goodspeed, V.M.; et al. Effect of Titrating Positive End-Expiratory Pressure (PEEP) With an Esophageal Pressure–Guided Strategy vs an Empirical High PEEP-Fio2 Strategy on Death and Days Free From Mechanical Ventilation Among Patients With Acute Respiratory Distress Syndrome: A Randomized Clinical Trial. JAMA 2019, 321, 846–857. [Google Scholar] [CrossRef]
Figure 9.
Schematic illustration of Paw and Pes on pressure time scalar (Pressure on Y axis, time on x axis). The sudden absence of Pes fluctuation may indicate a balloon rupture or migration out of thoracic esophagus. In such cases, the integrity of the catheter should be checked, balloon inflation volume reverified, and the catheter repositioned if migration into the stomach or oropharynx is suspected. Replacement of the catheter may be required if equipment failure is confirmed. (Please note the scale on the Y-axis has not been adjusted. This is for illustration purposes only).
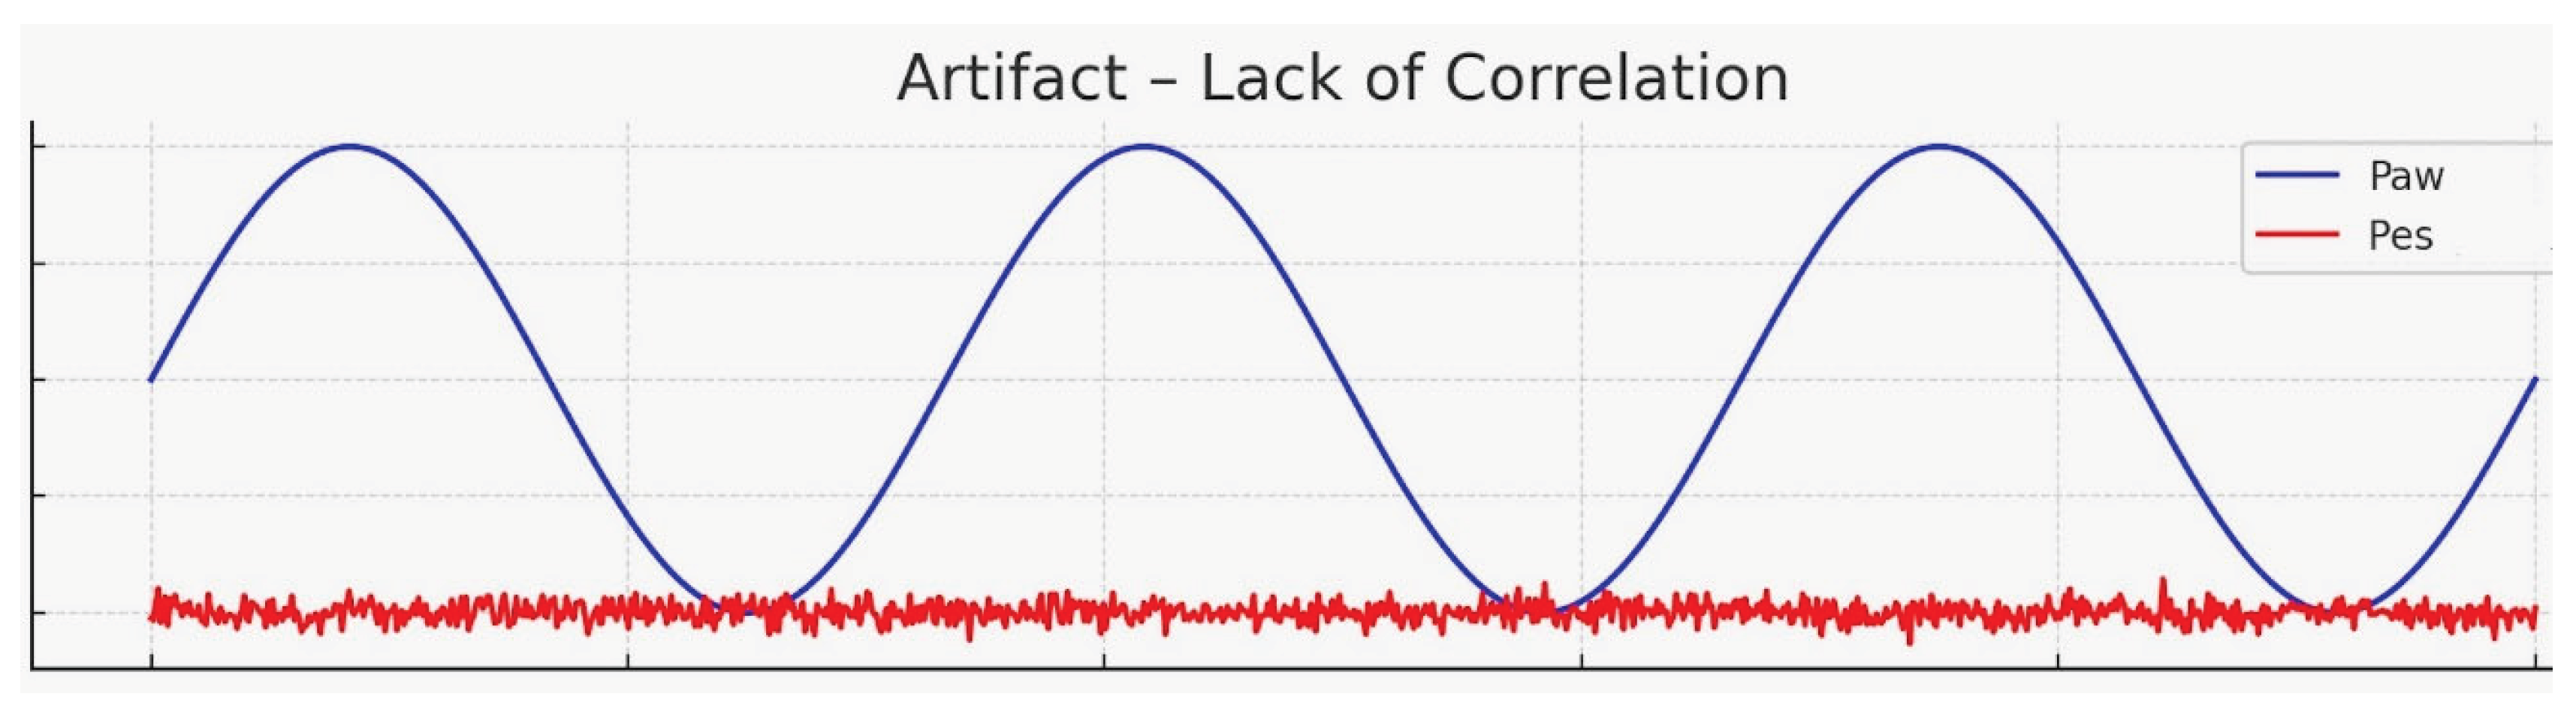
Figure 10.
Clinical utility of esophageal pressure monitoring.
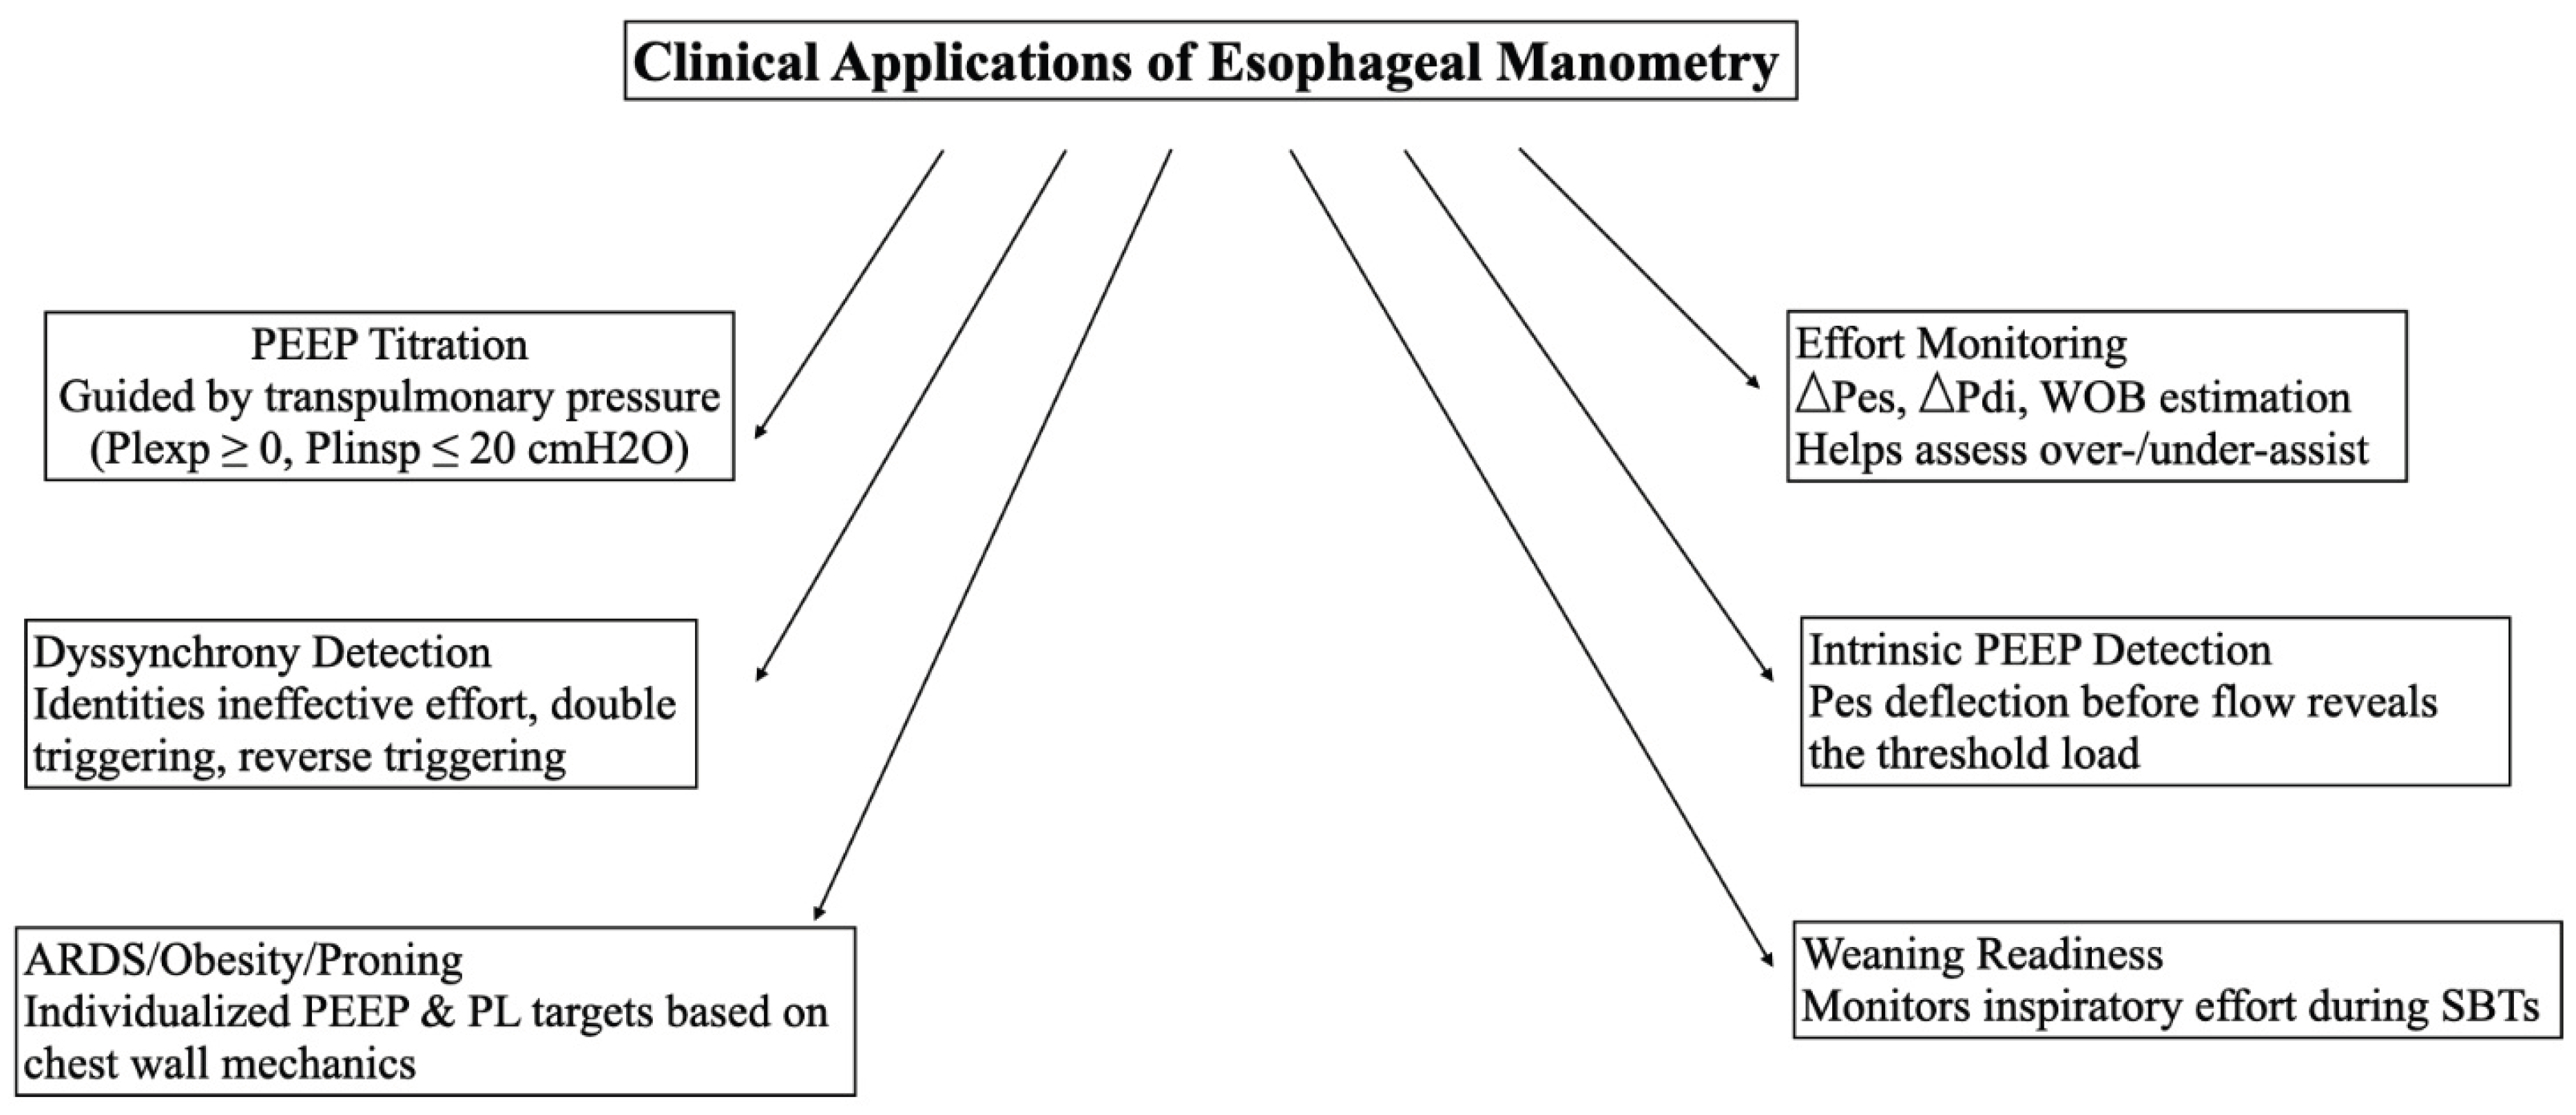
Figure 11.
Schematic illustration: Utility of Pes monitoring in identifying patient ventilator dyssynchrony. (Please note the scale on the Y-axis has not been adjusted. This is for illustration purposes only).
Figure 11.
Schematic illustration: Utility of Pes monitoring in identifying patient ventilator dyssynchrony. (Please note the scale on the Y-axis has not been adjusted. This is for illustration purposes only).
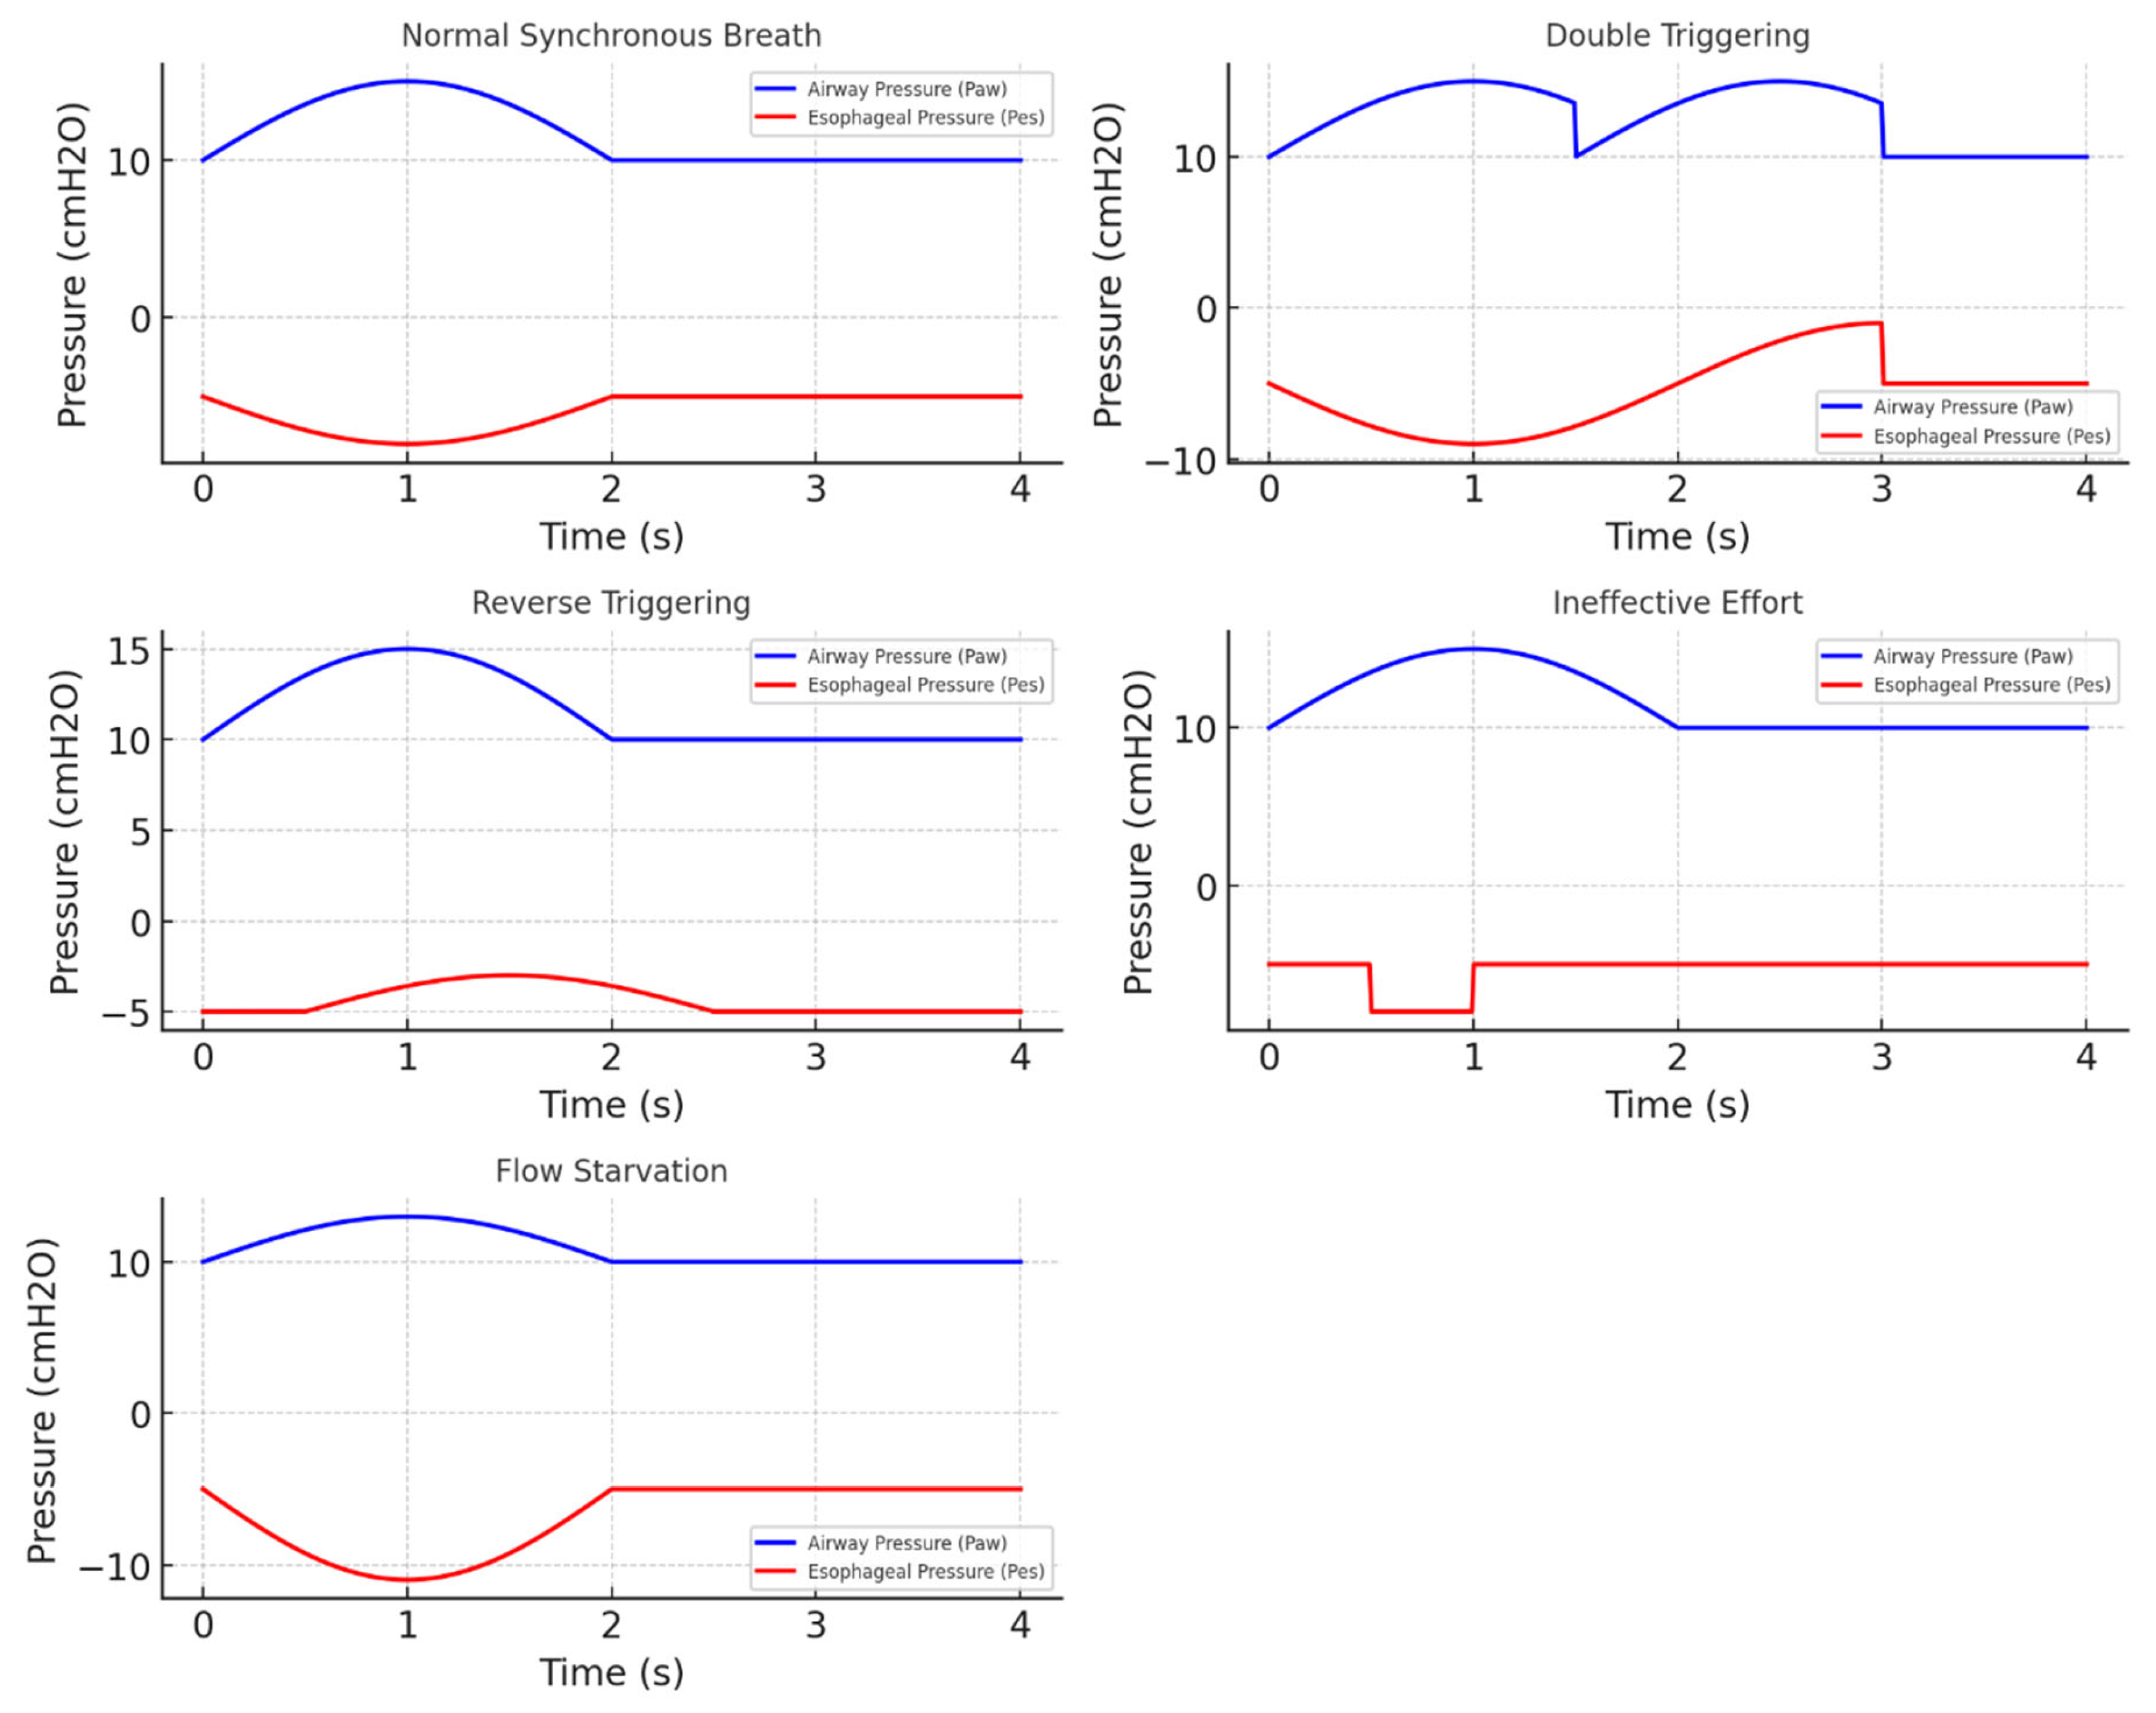
Figure 12.
Schematic illustration: Utility of detecting intrinsic PEEP using esophageal pressure monitoring. On the left side, flow (blue line) can be seen rising almost simultaneously with the negative deflection of esophageal pressure. On the right side, the flow initiation is delayed when compared to the negative deflection of esophageal pressure indicating that patient needs to overcome his intrinsic PEEP before the flow begins. Increasing extrinsic PEEP in such cases may decrease the work of breathing. (Please note the scale on the Y-axis has not been adjusted. This is for illustration purposes only).
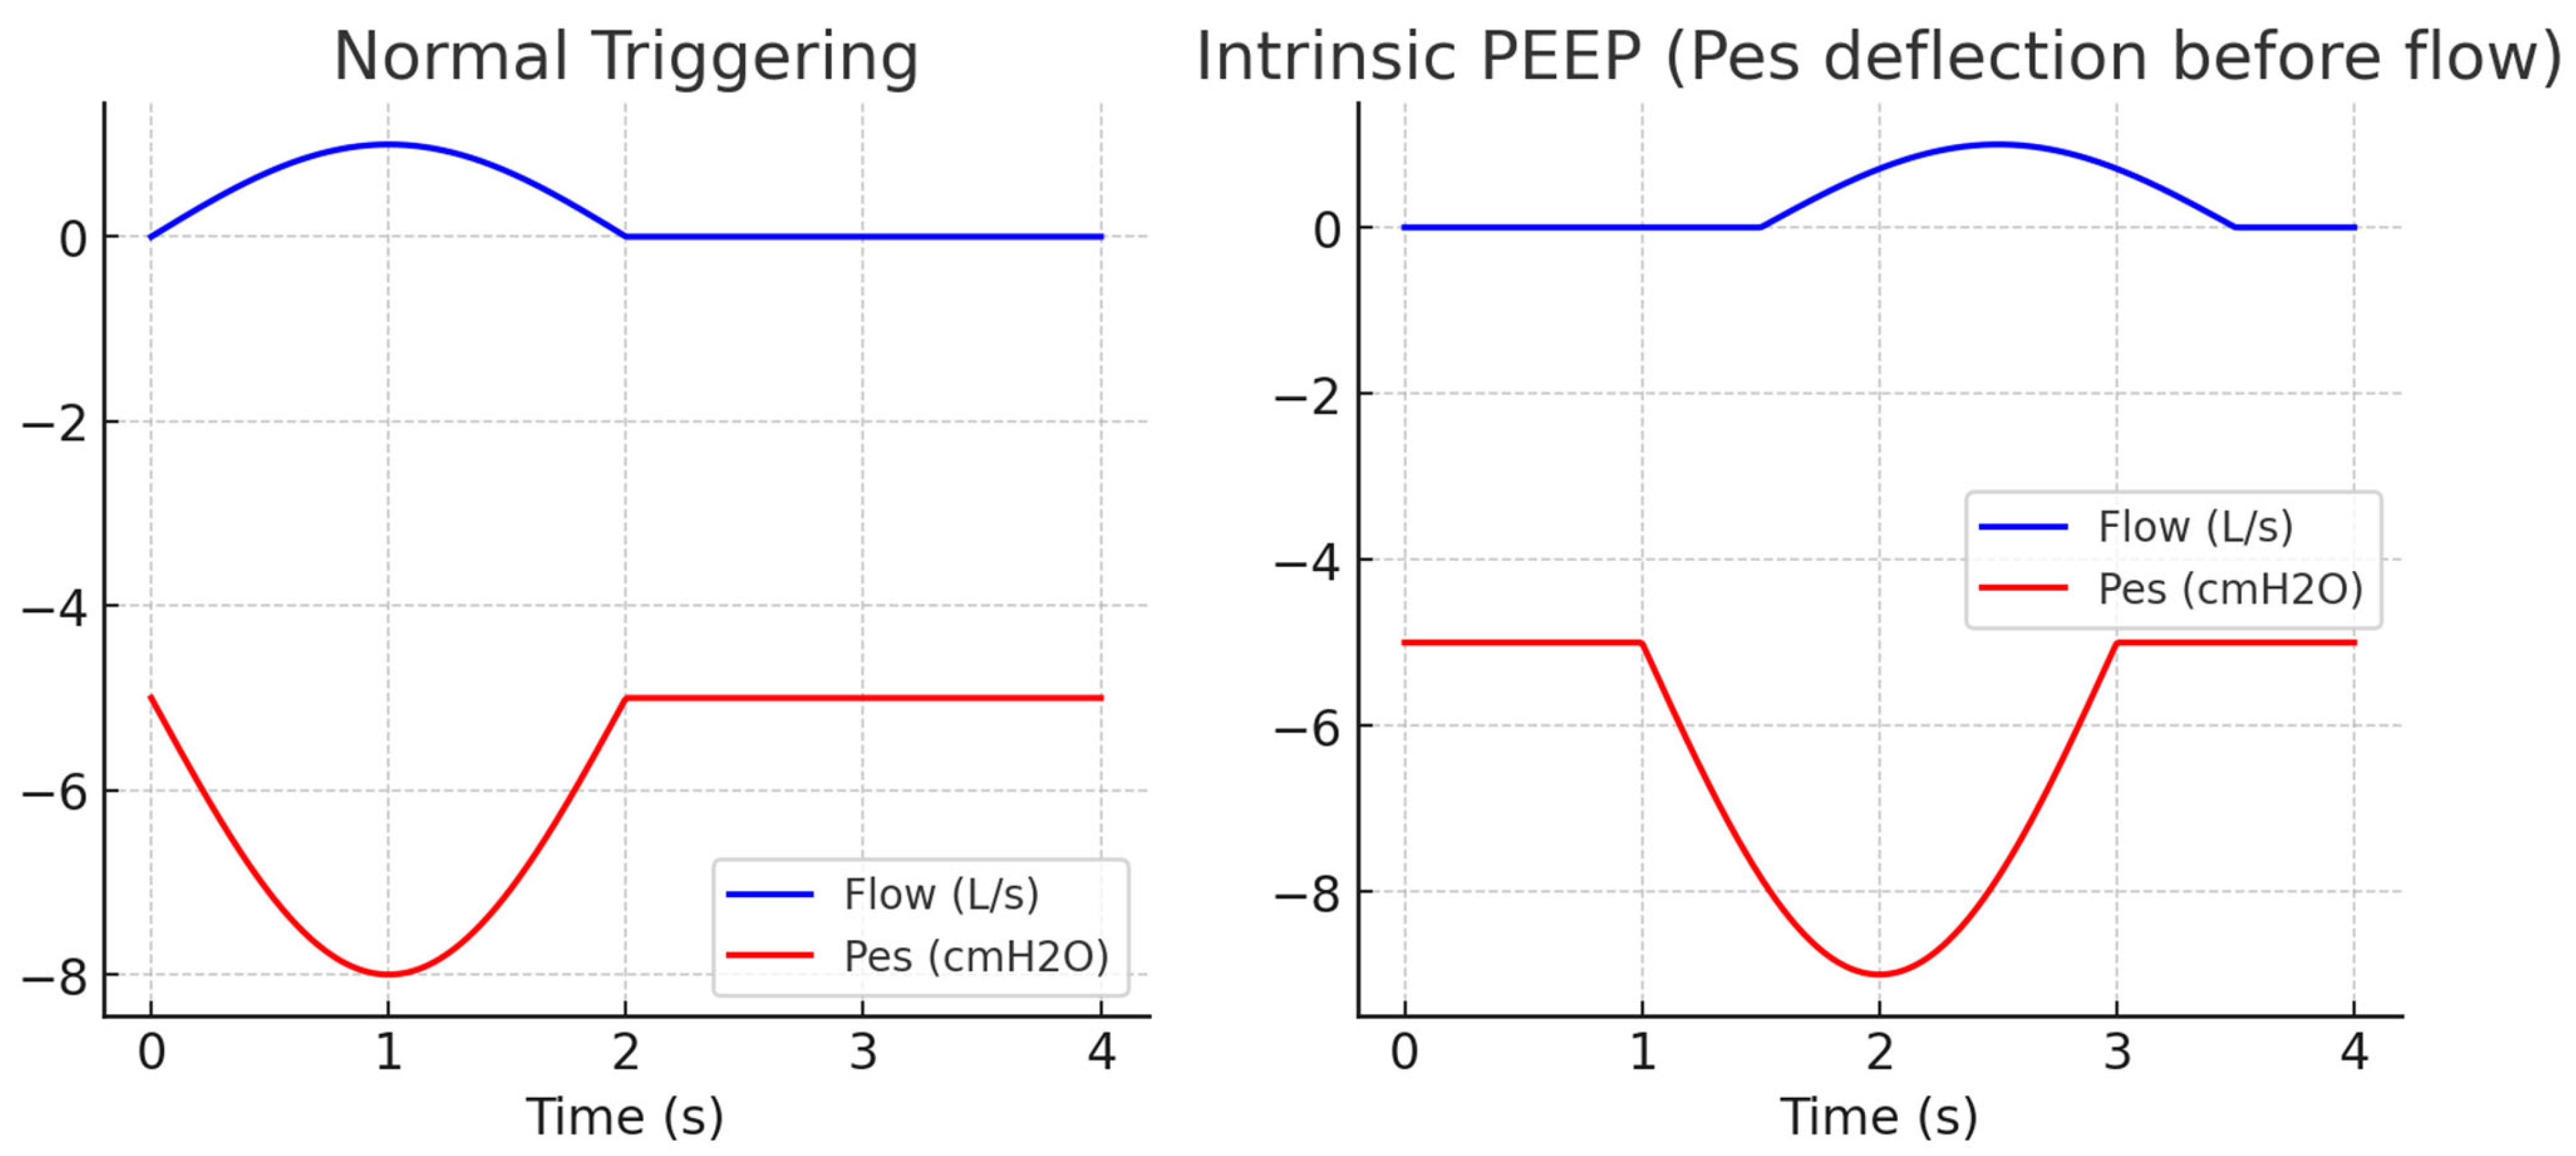
Figure 13.
Summary of various clinical applications and proposed targets during mechanical ventilation using esophageal pressure monitoring.
Figure 13.
Summary of various clinical applications and proposed targets during mechanical ventilation using esophageal pressure monitoring.
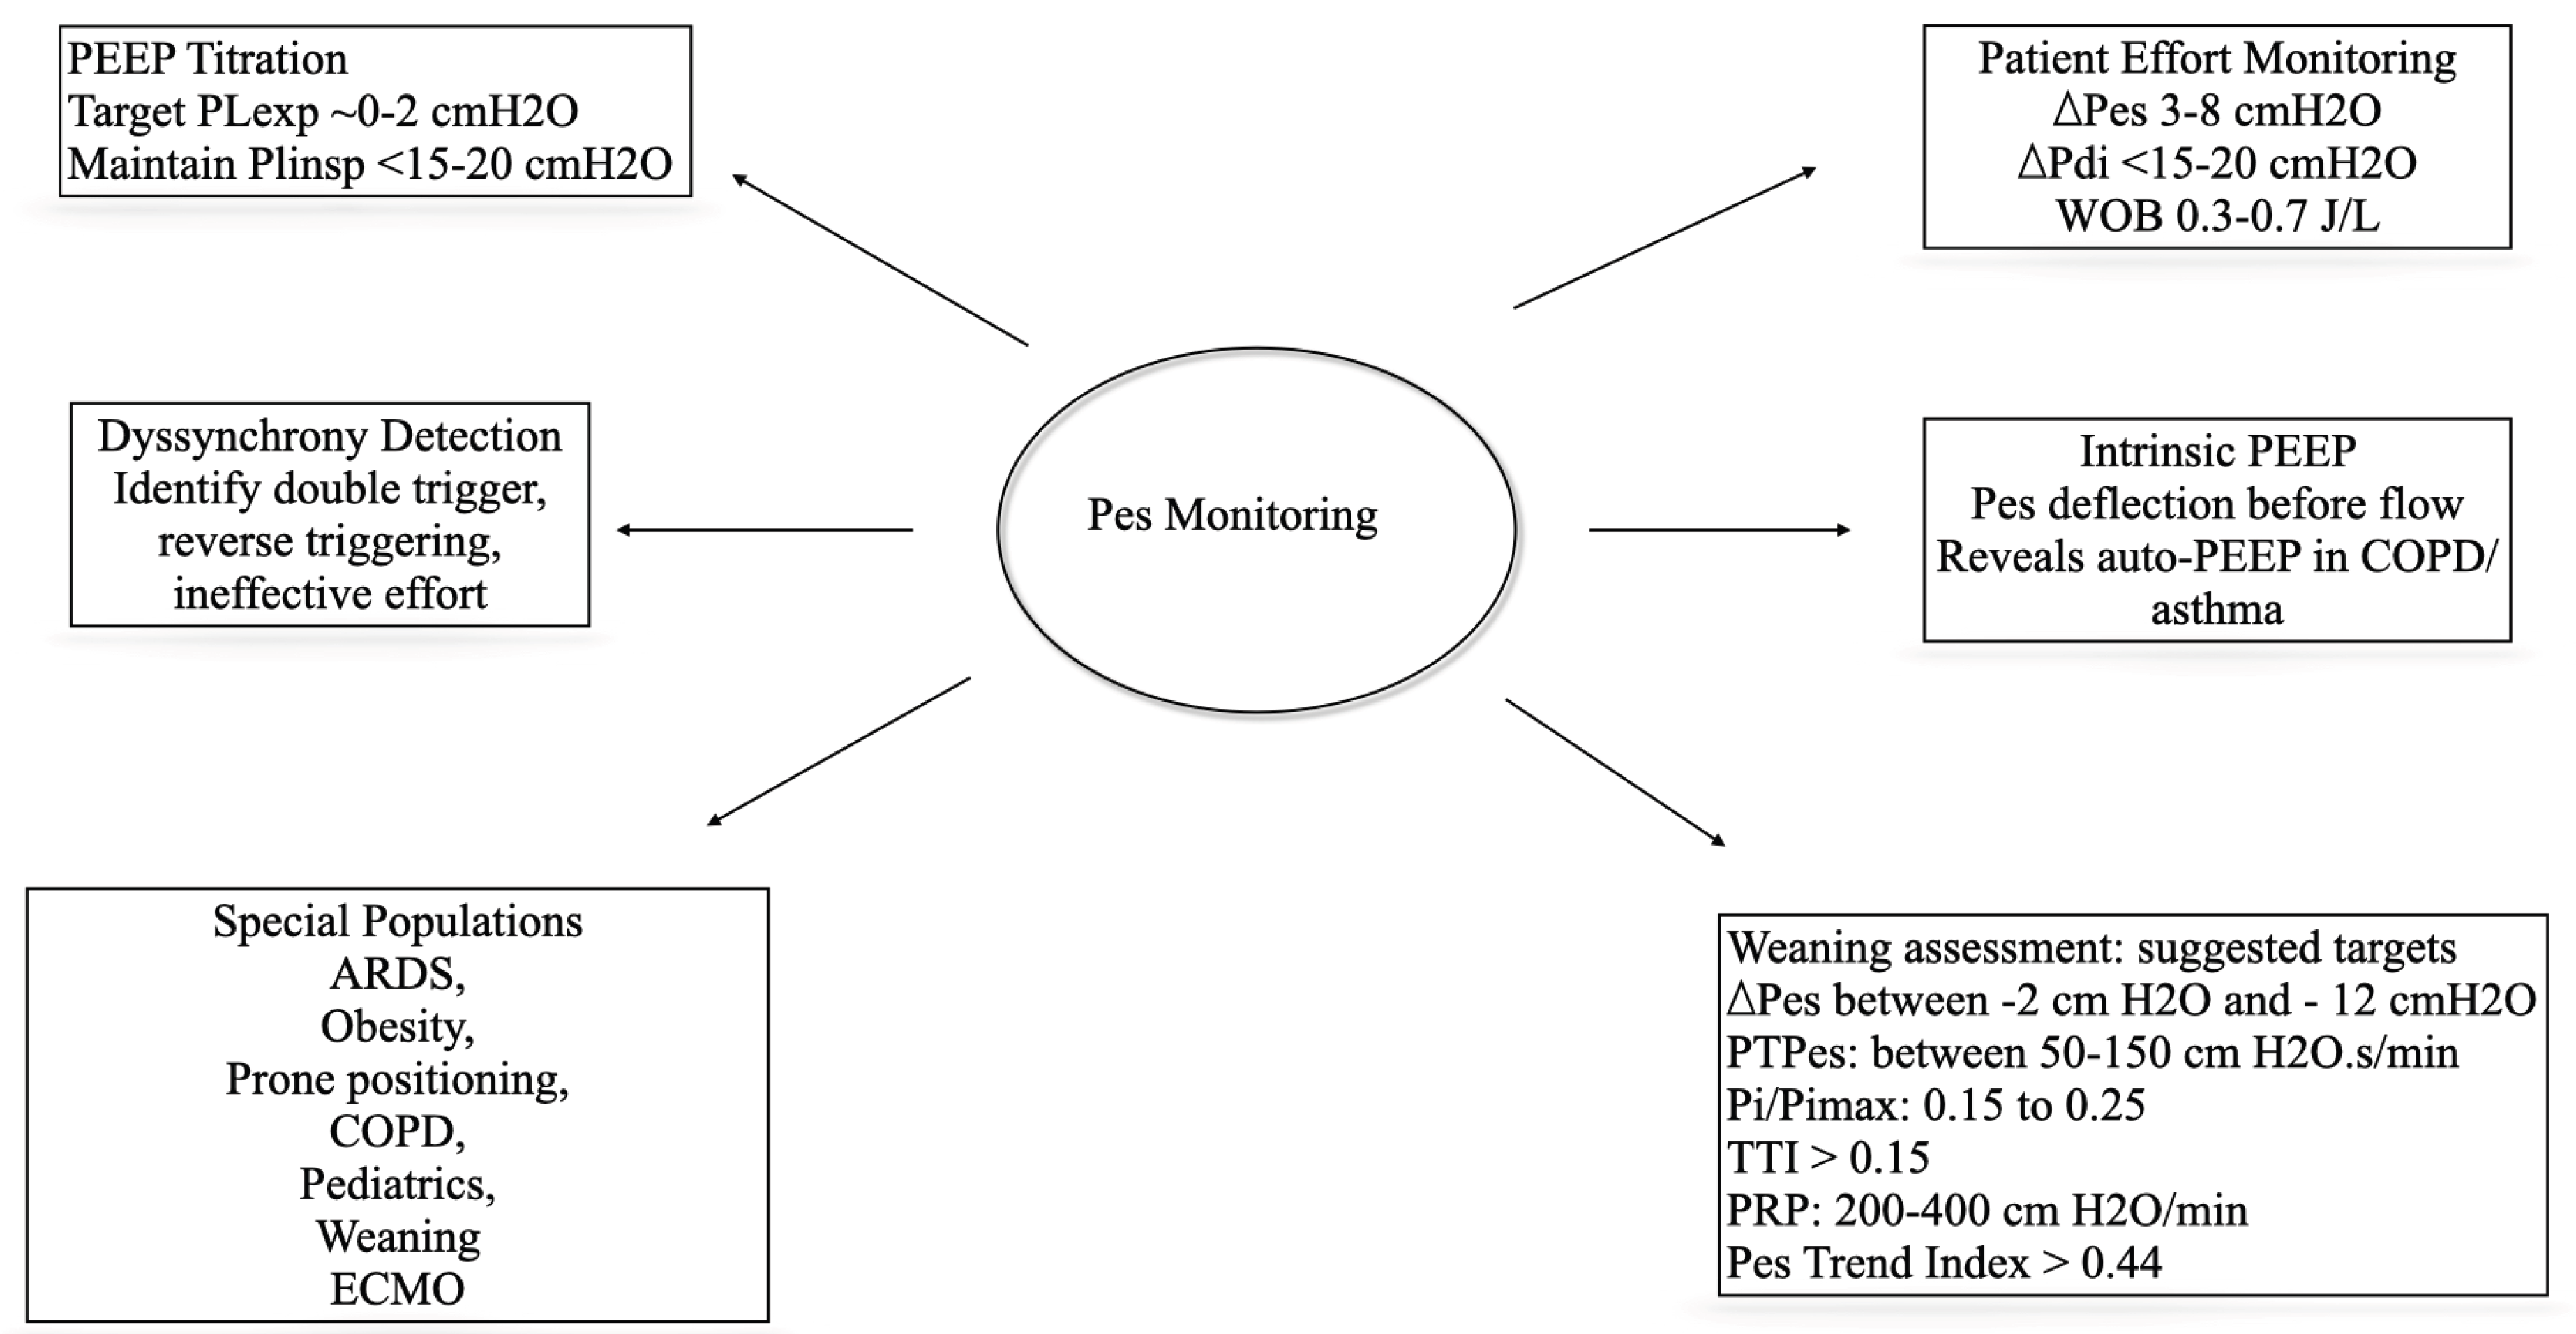

Table 1.
Physiology of respiratory mechanics during spontaneous, controlled and assisted ventilation. Alterations in the airway pressure and pleural pressure are considerable different between spontaneous and controlled ventilation. Assisted ventilation is a hybrid form and is dependent on the contribution of native breath versus ventilator delivered breath. See Figure-2 for Schematic illustration of changes in the airway pressure, pleural pressure and transpulmonary pressure on a pressure-time scalar during spontaneous, controlled and assisted ventilation.
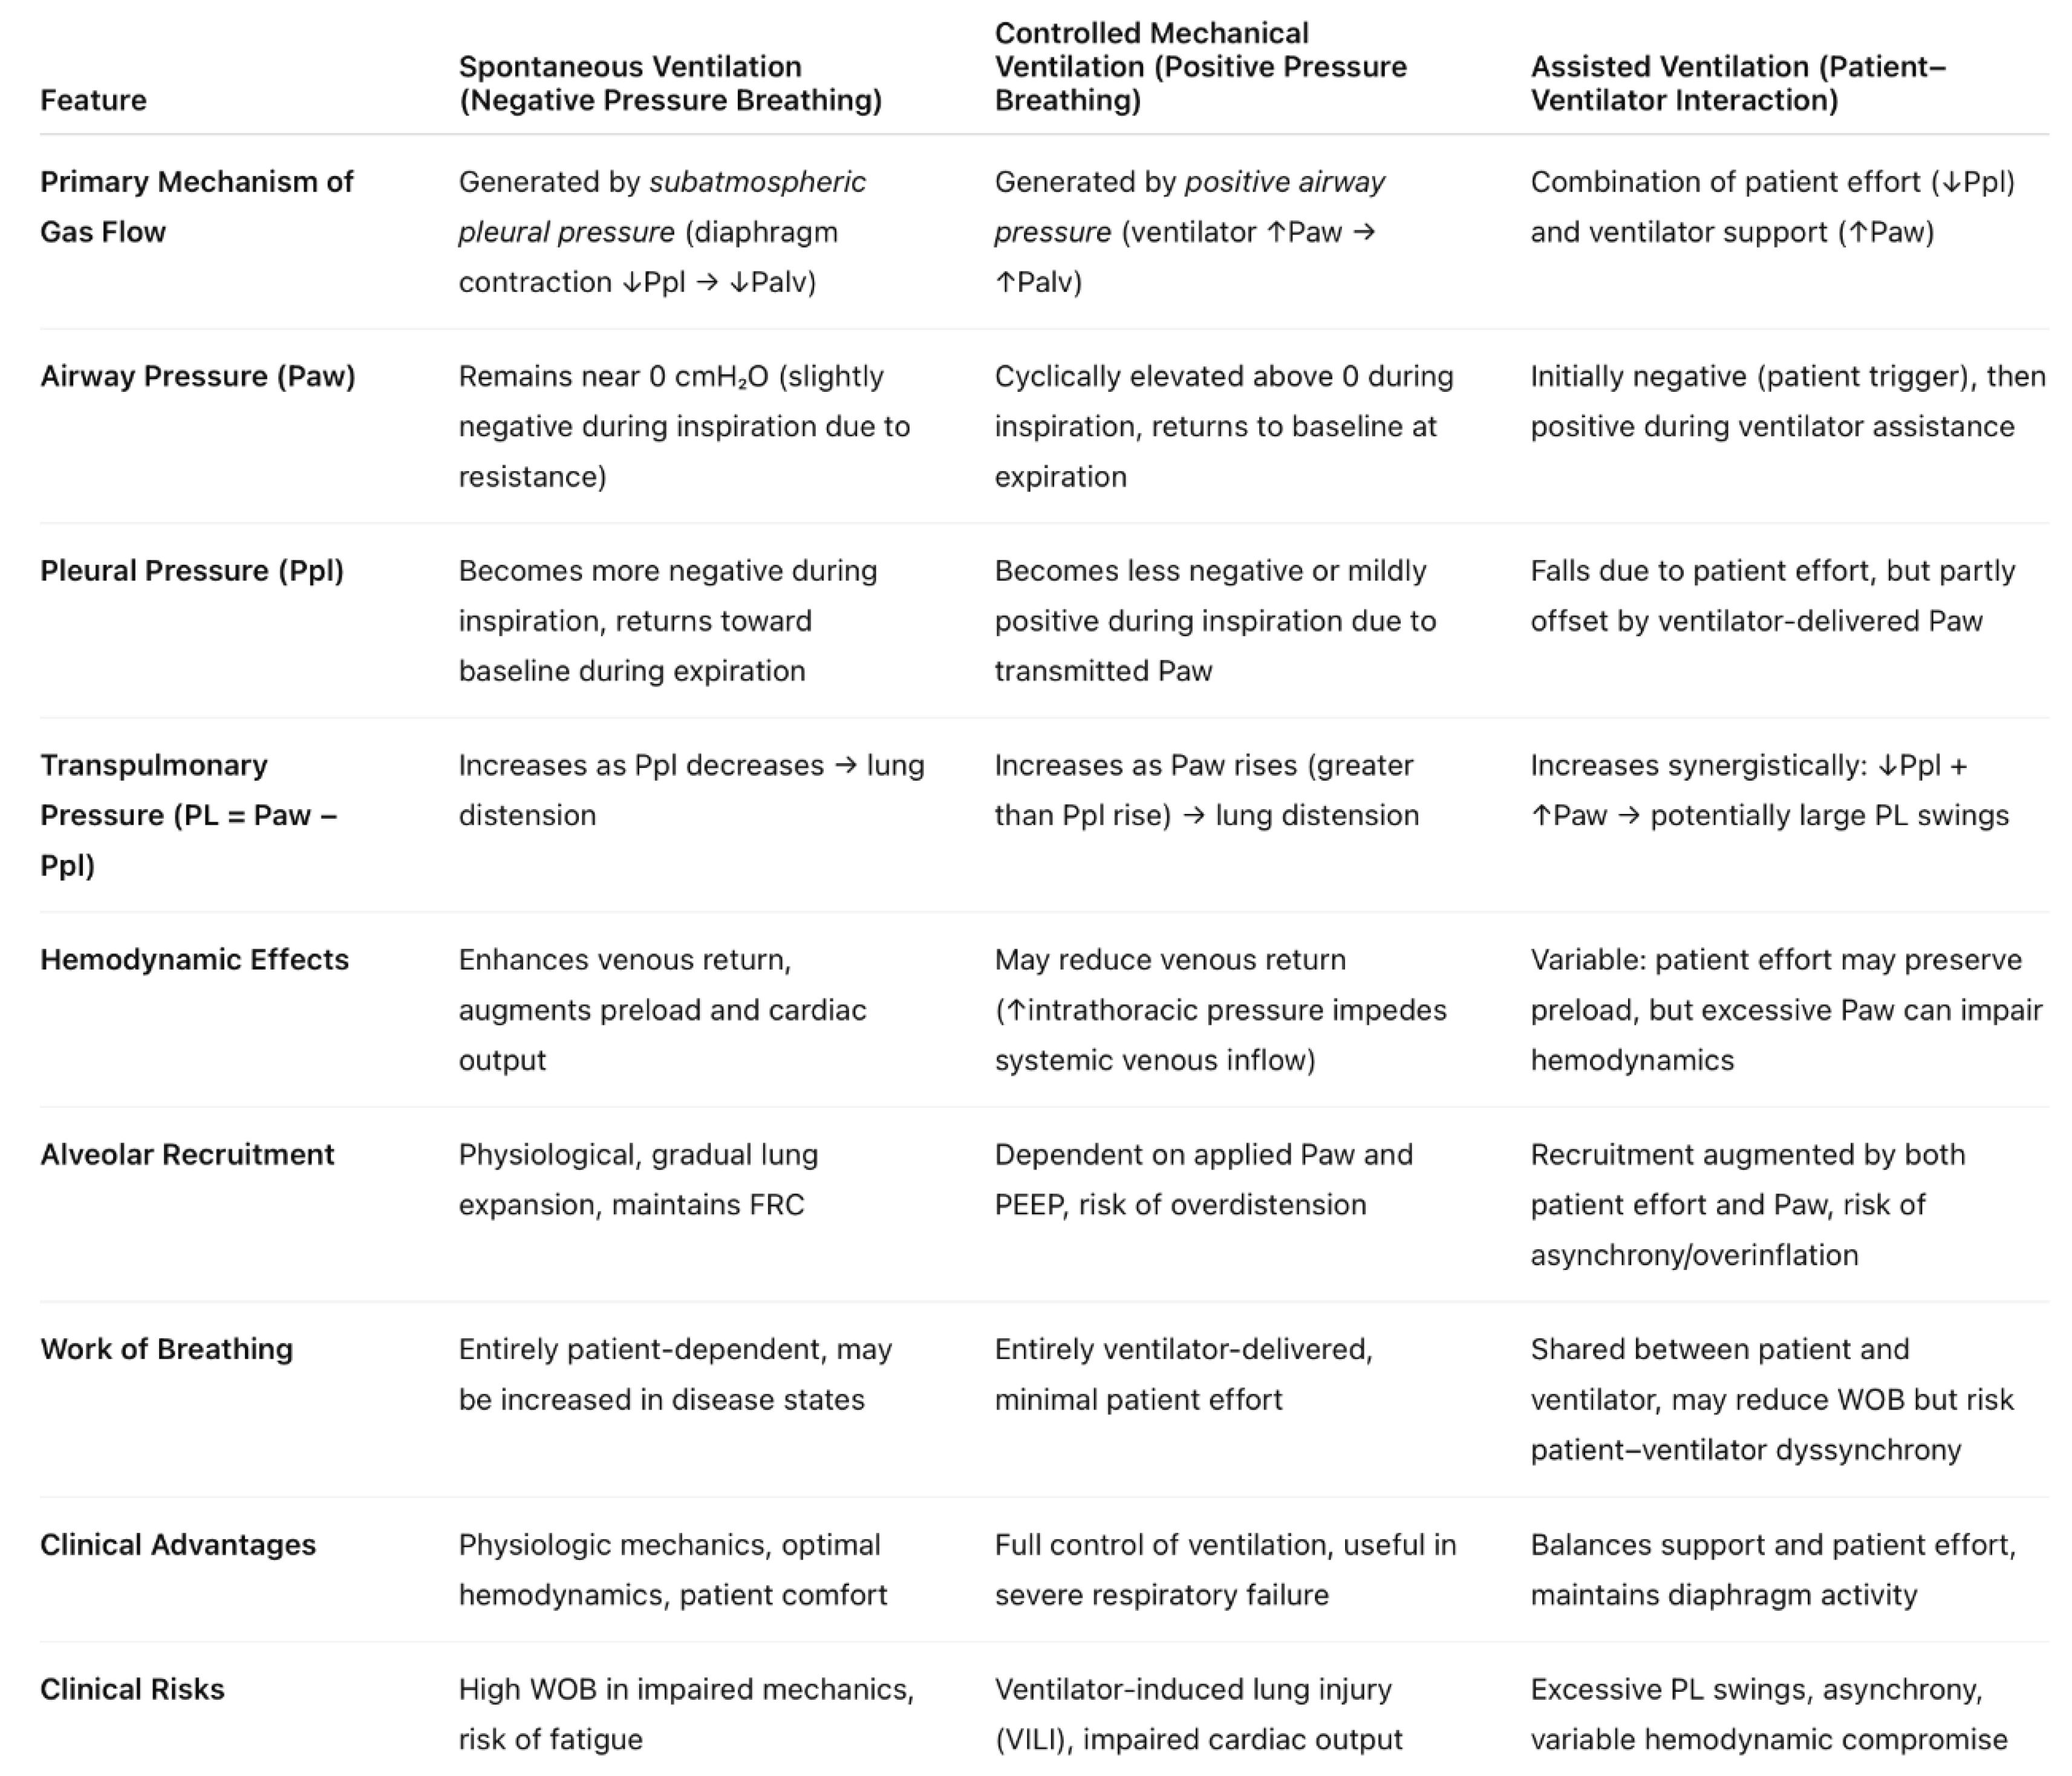 |
Table 2.
Artifacts and corrective strategies during esophageal pressure monitoring. Some of them include esophageal spasm, balloon overinflation, balloon rupture, gastric pattern and catheter migration.
Table 2.
Artifacts and corrective strategies during esophageal pressure monitoring. Some of them include esophageal spasm, balloon overinflation, balloon rupture, gastric pattern and catheter migration.
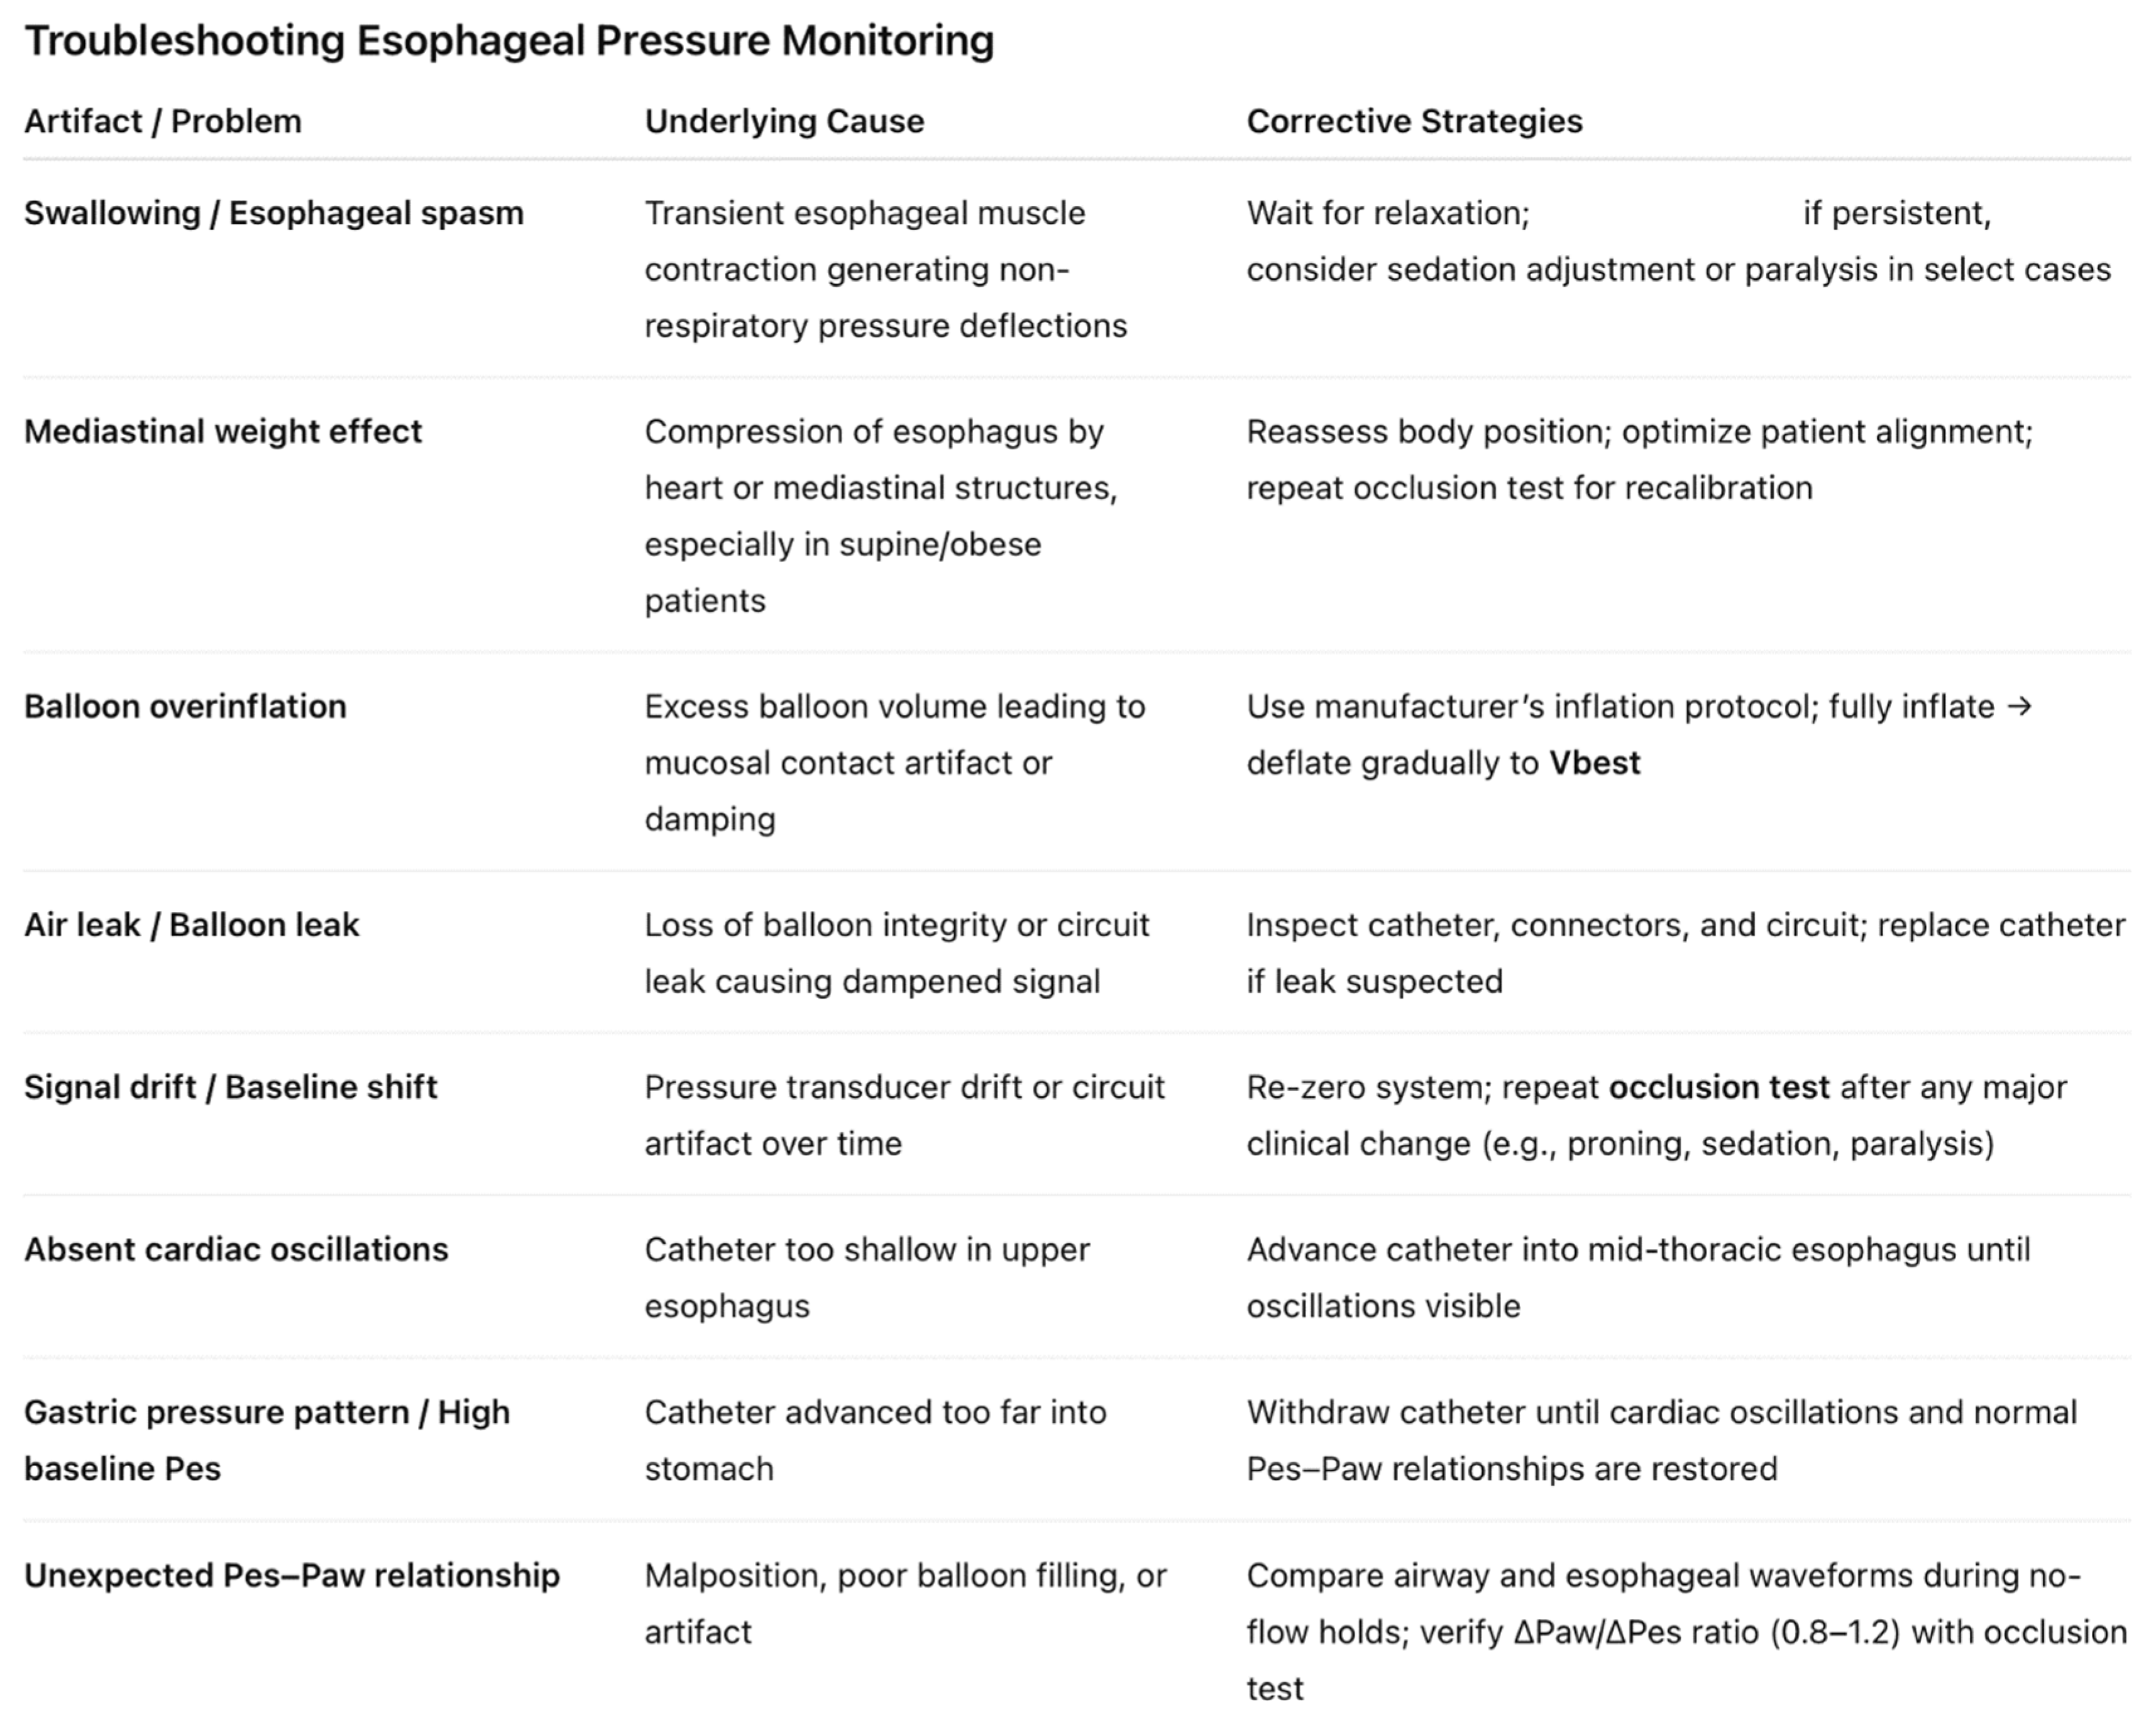 |
Table 4.
Proposed physiological targets for esophageal derived indices during mechanical ventilation for lung and diaphragm protective strategy. Effort monitoring is done by monitoring Pes swings, trans-diaphragmatic pressure, work of breathing and pressure time product. Optimal effort ensures diaphragm protection. Lung protection is predominantly achieved by setting targets for transpulmonary pressures.
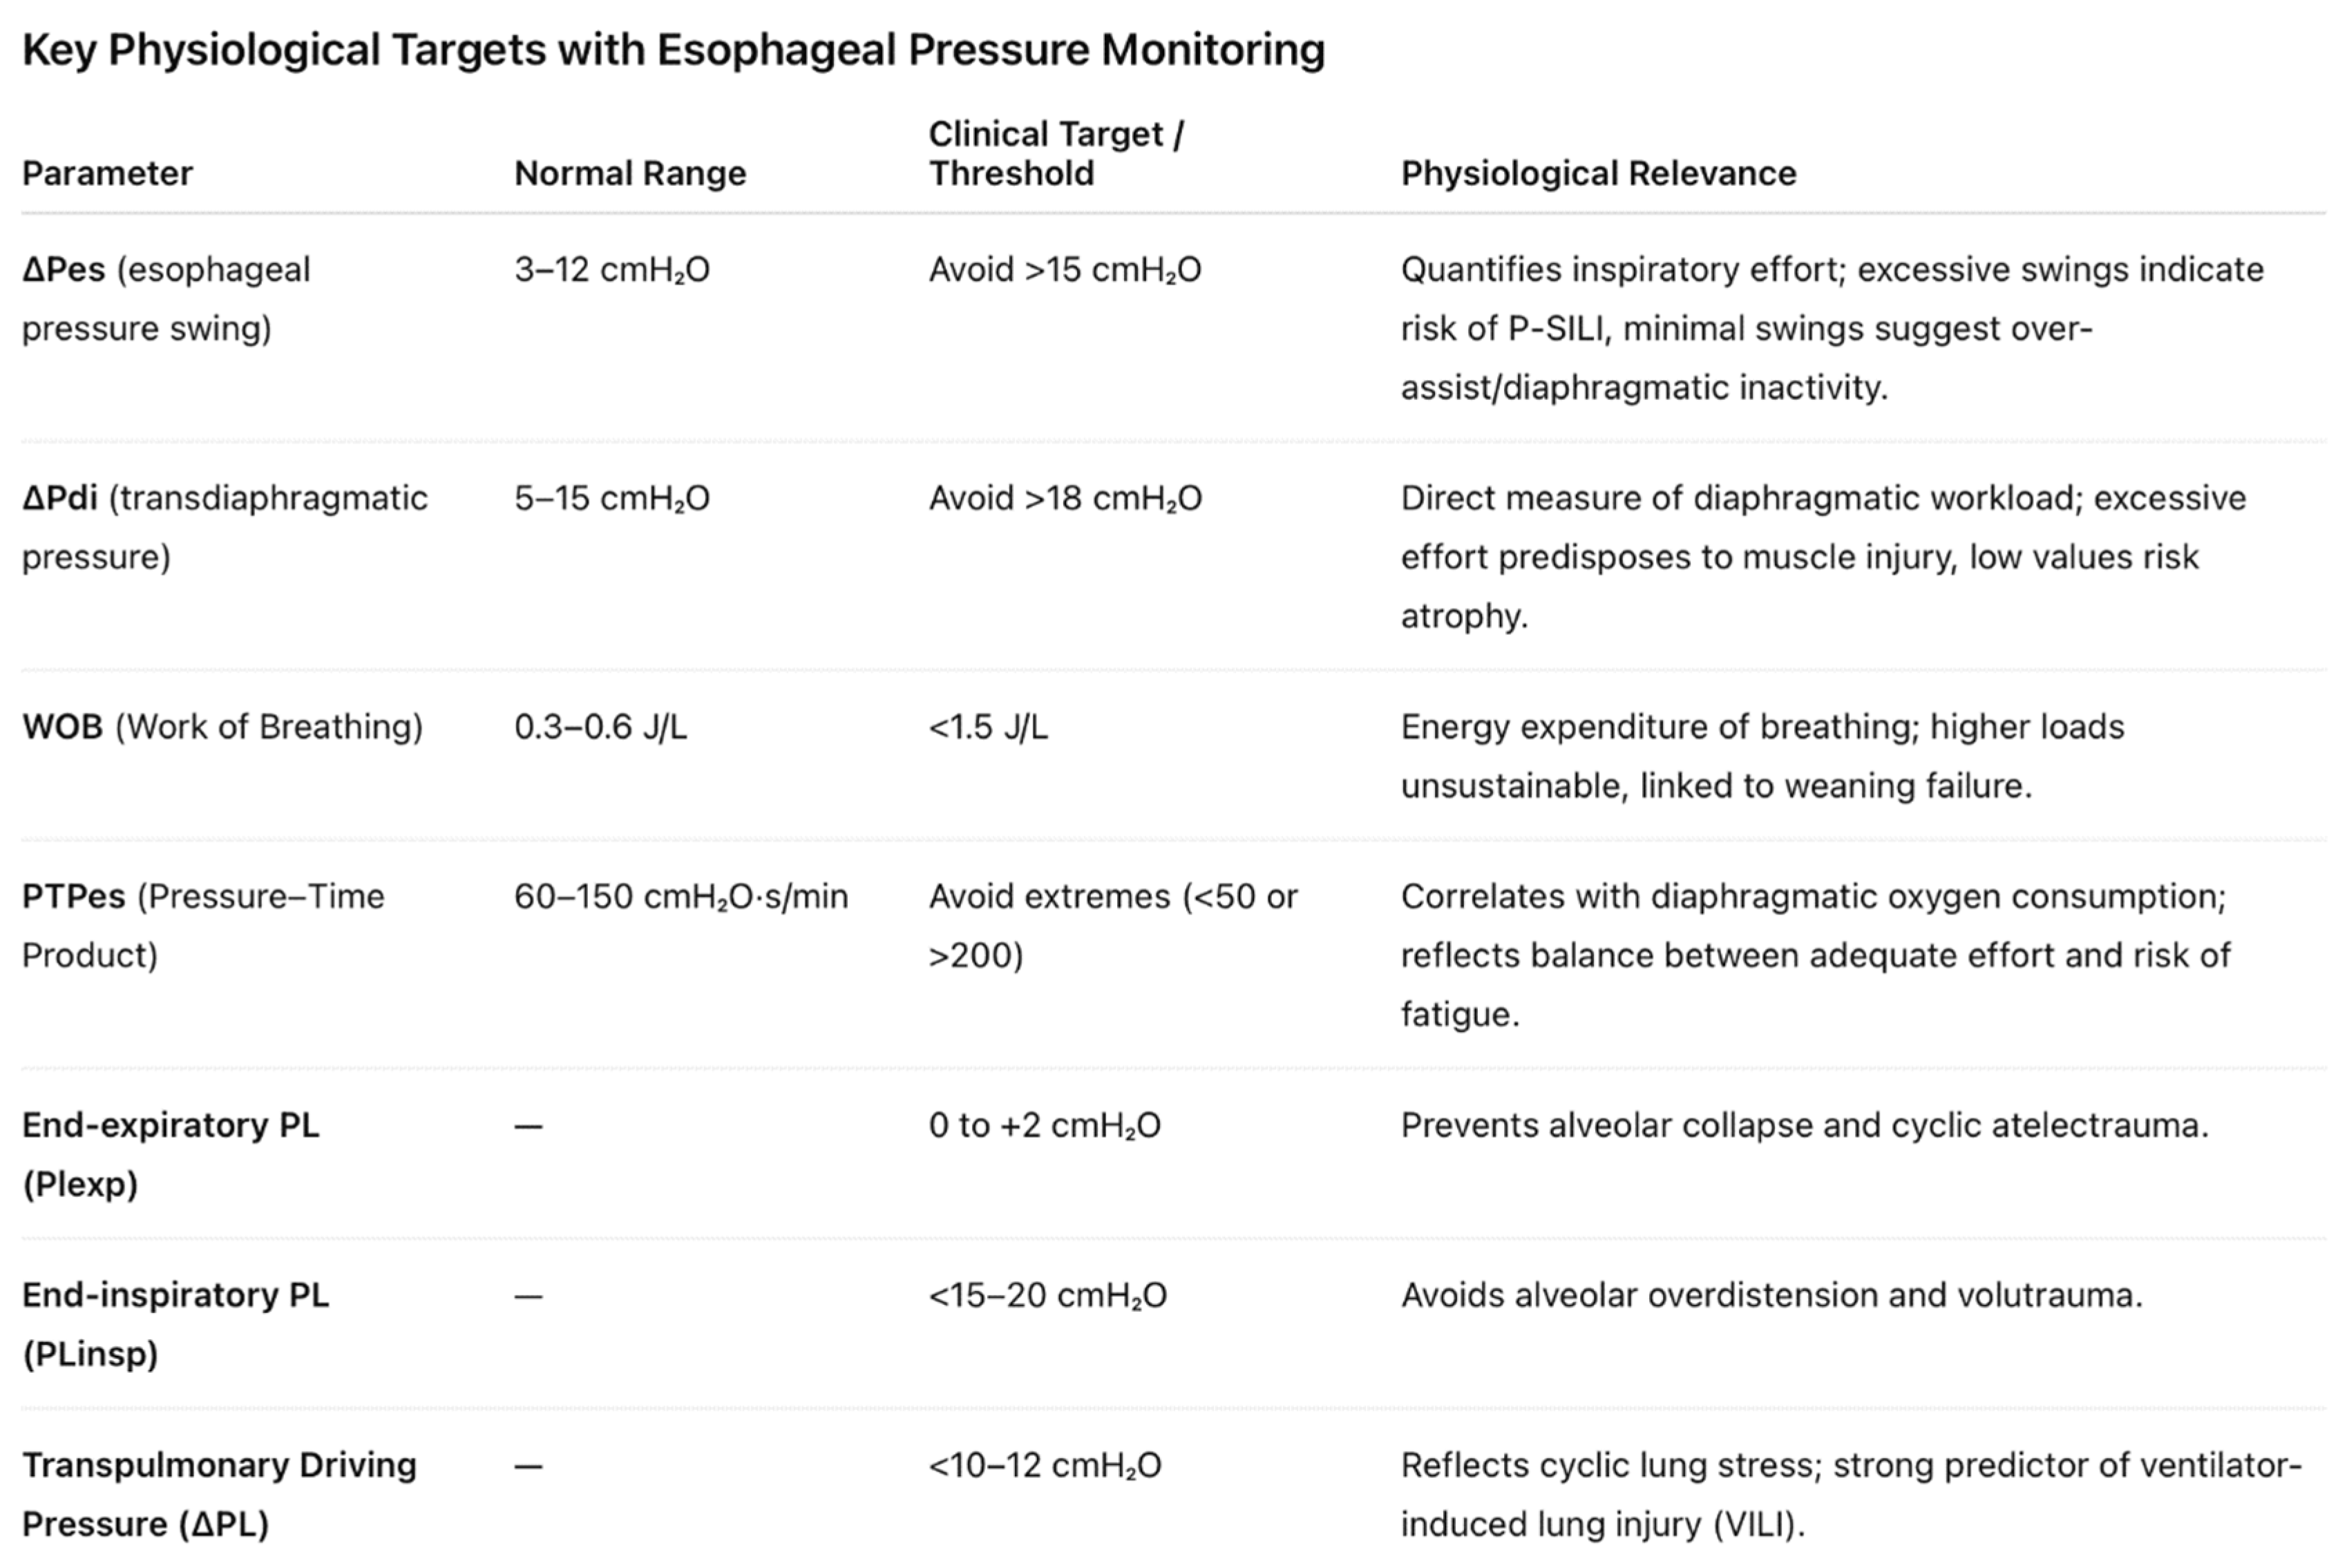 |
Table 5.
Strengths and limitations of esophageal pressure monitoring during mechanical ventilation.
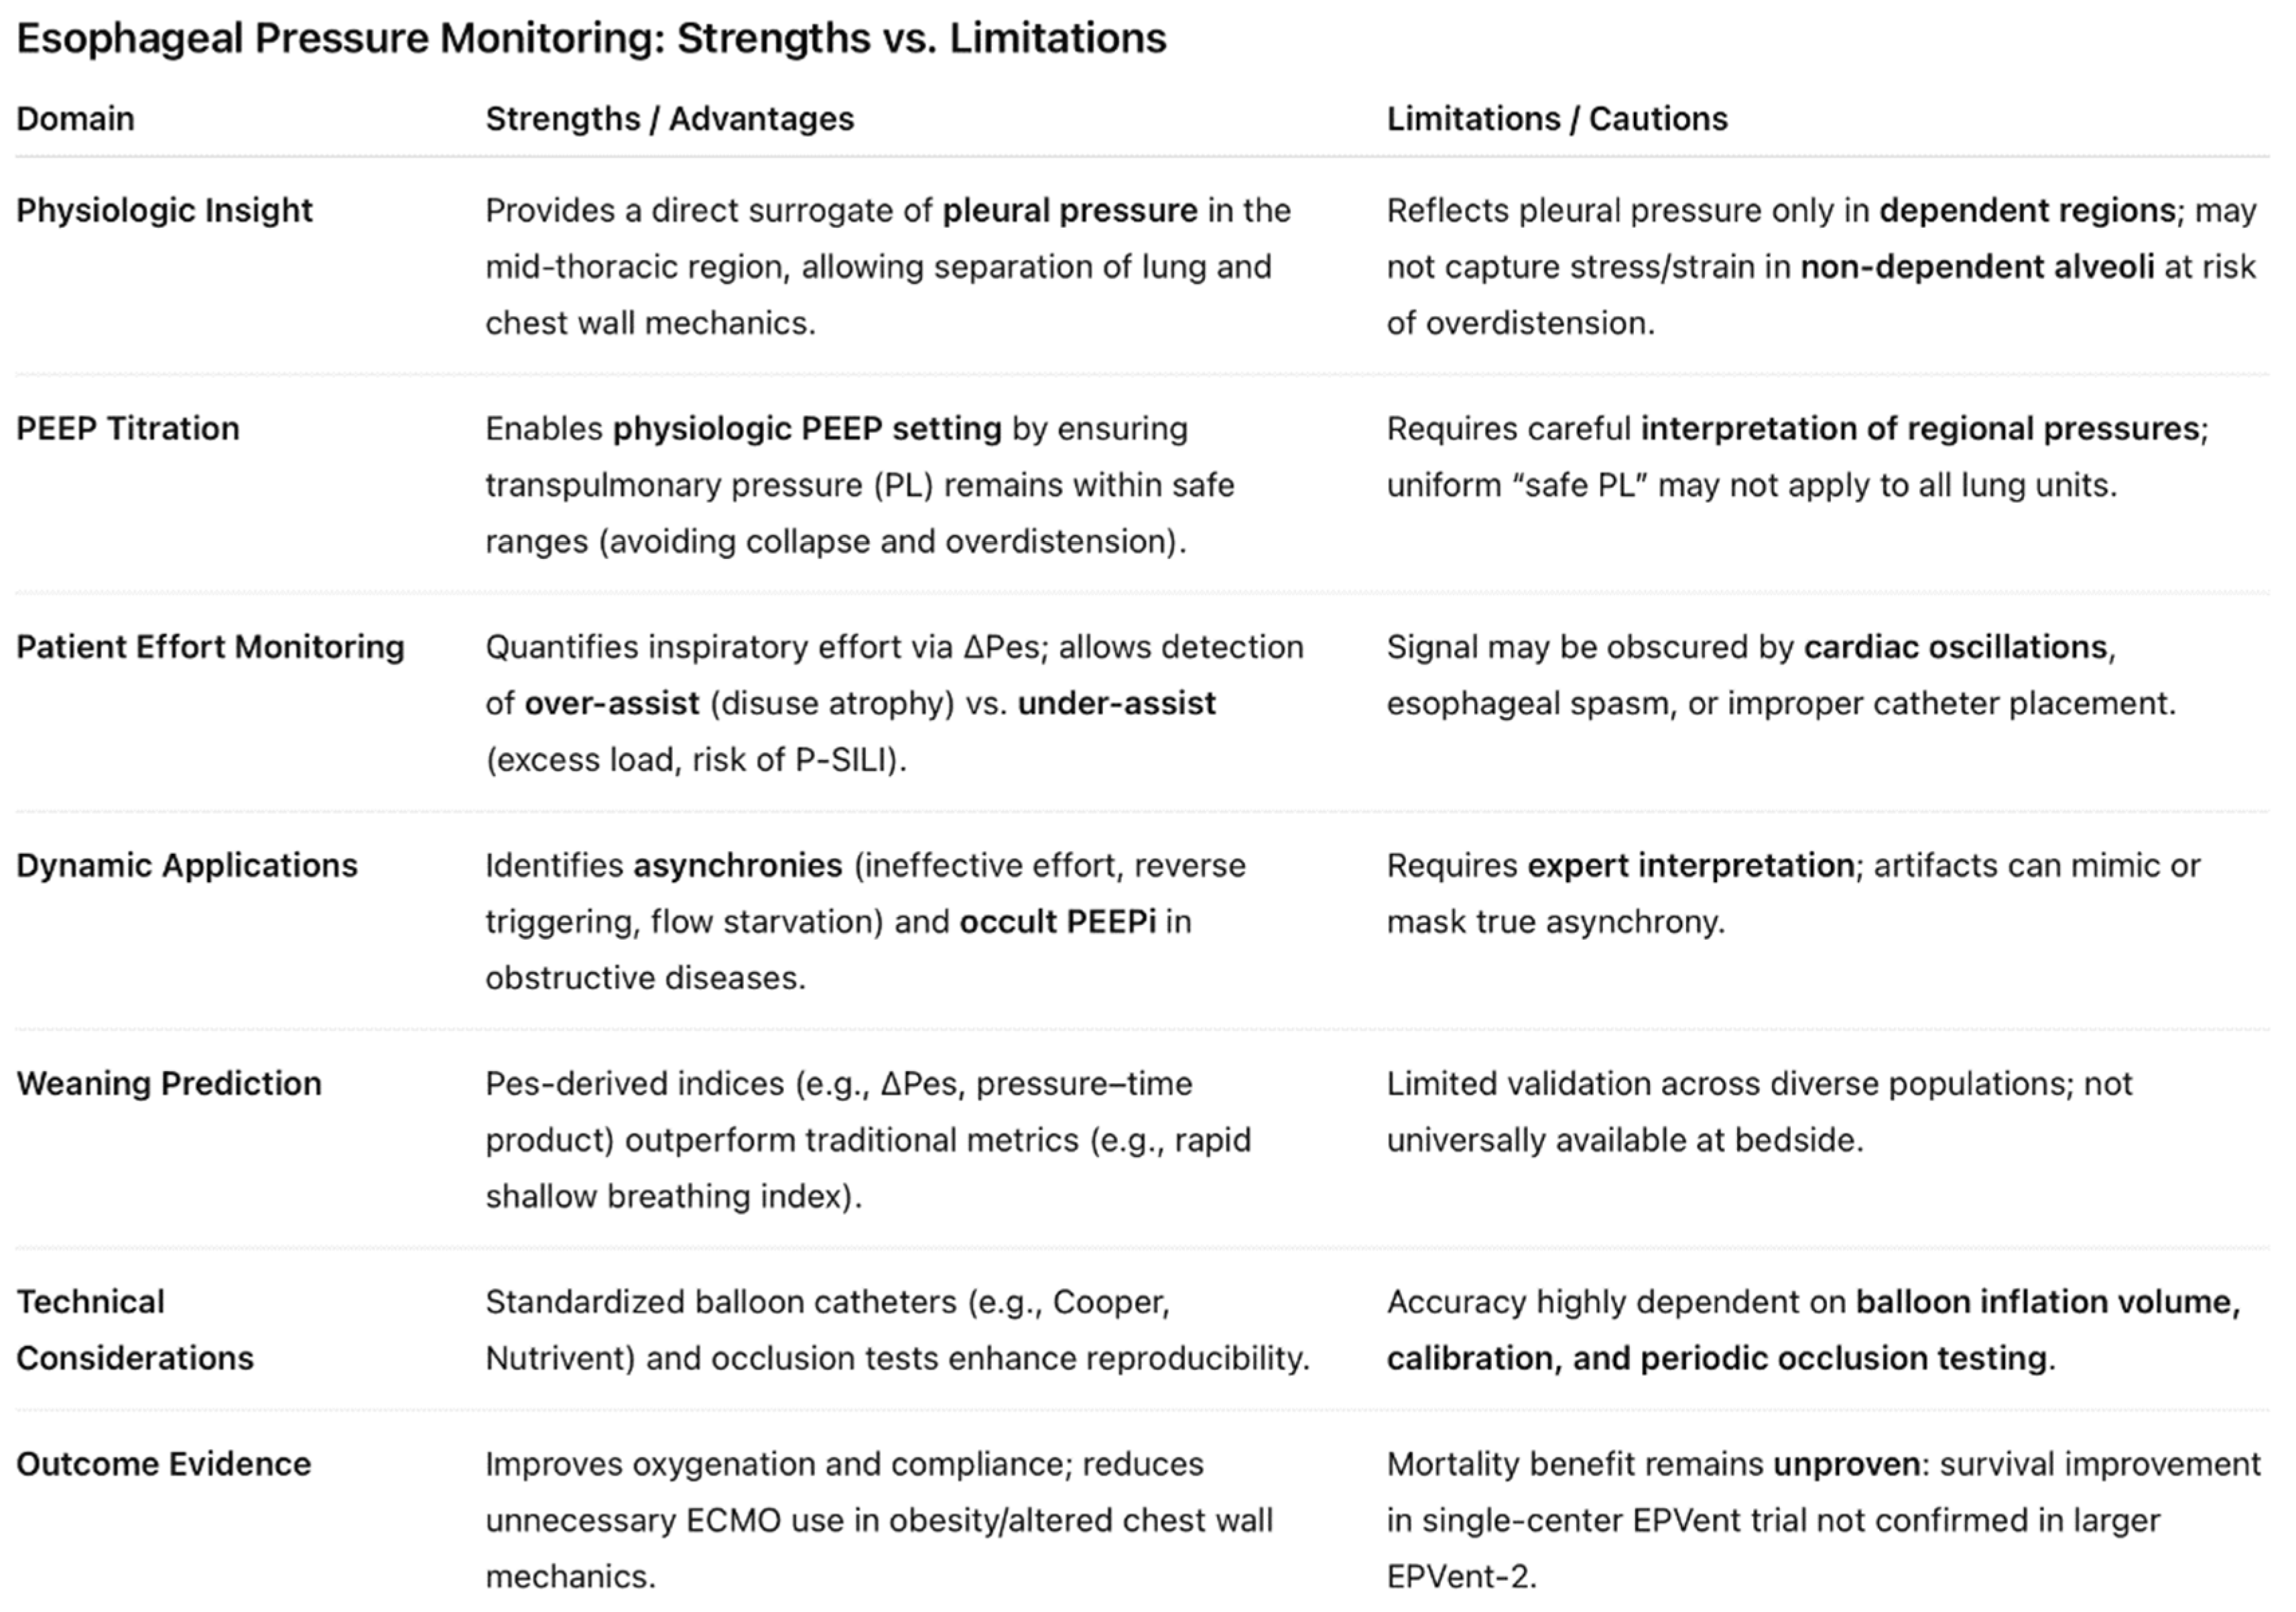 |
Disclaimer/Publisher’s Note: The statements, opinions and data contained in all publications are solely those of the individual author(s) and contributor(s) and not of MDPI and/or the editor(s). MDPI and/or the editor(s) disclaim responsibility for any injury to people or property resulting from any ideas, methods, instructions or products referred to in the content. |
© 2025 by the authors. Licensee MDPI, Basel, Switzerland. This article is an open access article distributed under the terms and conditions of the Creative Commons Attribution (CC BY) license (http://creativecommons.org/licenses/by/4.0/).
Copyright: This open access article is published under a Creative Commons CC BY 4.0 license, which permit the free download, distribution, and reuse, provided that the author and preprint are cited in any reuse.


