1. Introduction
Newborns admitted to the neonatal intensive care unit (NICU) often require respiratory support. Considering the potential for ventilator-induced lung injury (VILI) in underdeveloped lungs, it is critical to implement lung-protective strategies, including selecting the appropriate level of positive end-expiratory pressure (PEEP) for newborns [
1,
2]. Currently, the biggest challenge in implementing this strategy is identifying the optimal PEEP to prevent end-expiratory lung collapse and alveolar overinflation, the two primary factors contributing to VILI [
3,
4]. Additionally, an incorrect PEEP may result in hemodynamic instability due to right ventricle dysfunction [
5,
6]. However, there is insufficient evidence to guide the selection of the appropriate PEEP level in premature infants receiving mechanical ventilation due to the inadequate availability of appropriate bedside instruments for evaluating respiratory mechanics in these patients [
7].
Volumetric capnography (V
cap) can provide clinically relevant volumetric parameters, such as the pulmonary elimination of carbon dioxide (CO
2), respiratory dead space, and alveolar ventilation [
8]. Several studies have demonstrated its efficacy for predicting acute respiratory distress syndrome-related mortality, diagnosis and therapeutic efficacy of pulmonary embolism, quantification of ventilation-perfusion mismatch, and PEEP titration [
8]. Blankman, et al. [
9] reported that high PEEP levels increased the airway dead space volume (V
d,aw) in a V
cap study of 15 adults. Furthermore, numerous animal studies on V
cap have indicated that high PEEP levels contribute to an increase in V
d,aw [
10,
11]. While some studies have investigated the clinical efficacy of V
cap in newborns, the limited clinical applicability for newborns, coupled with the requirement for specialized equipment with a significant apparatus dead space volume (V
d,app), has resulted in minimal V
cap use among this population [
12]. Although the molar mass signal from the ultrasonic flowmeter without an additional V
d,app is well suited for measuring dead space in infants, conventional ultrasonic flow sensors are too heavy and bulky for extensive clinical use in the NICU [
12,
13]. To our knowledge, no prior reports utilizing V
cap have described the impact of PEEP in infants.
In a prior study, we discussed a V
cap technique appropriate for newborns using a combination of ventilator and capnometer graphic waveforms [
14,
15,
16]. However, this approach was not suitable for clinical application because it required the manual acquisition of partial pressure expiratory CO
2 (P
ECO
2) and expired tidal volume (V
T,E) data from the capnometer and respiratory ventilator waveforms. Therefore, we developed a novel V
cap technique for newborns that involved the automatic collection of P
ECO
2 and V
T,E data by linking a computer to a bedside monitor that aggregates all relevant information. This study aimed to assess the validity of this novel V
cap based on the patient monitor (V
cap,PM) and explore the impact of PEEP on term and preterm infants.
2. Materials and Methods
2.1 Study Design
This single-center, prospective, nonrandomized, consecutive enrolment study was approved by the Kyoto Prefectural University of Medicine Clinical Ethics Committee in Kyoto, Japan (approval number ERB-C-2145-1). This research was conducted in accordance with the Declaration of Helsinki. All methods were performed according to the relevant guidelines and regulations. Written informed consent was obtained from each participant’s legal guardians. We included patients receiving mechanical ventilation with a VN500 ventilator (Dräger Medical, Lübeck, Germany; maximum tidal volume [VT], 300 mL) using the synchronous intermittent mandatory ventilation mode. All patients had a stable general condition, especially in terms of respiratory status, and were deemed appropriate for inclusion by the attending clinicians. The exclusion criteria were as follows: > 10% leaks, fighting the ventilator, pneumothorax, bronchial asthma, and respiratory tract disease. The respiratory circuits used in this study were selected according to body weight.
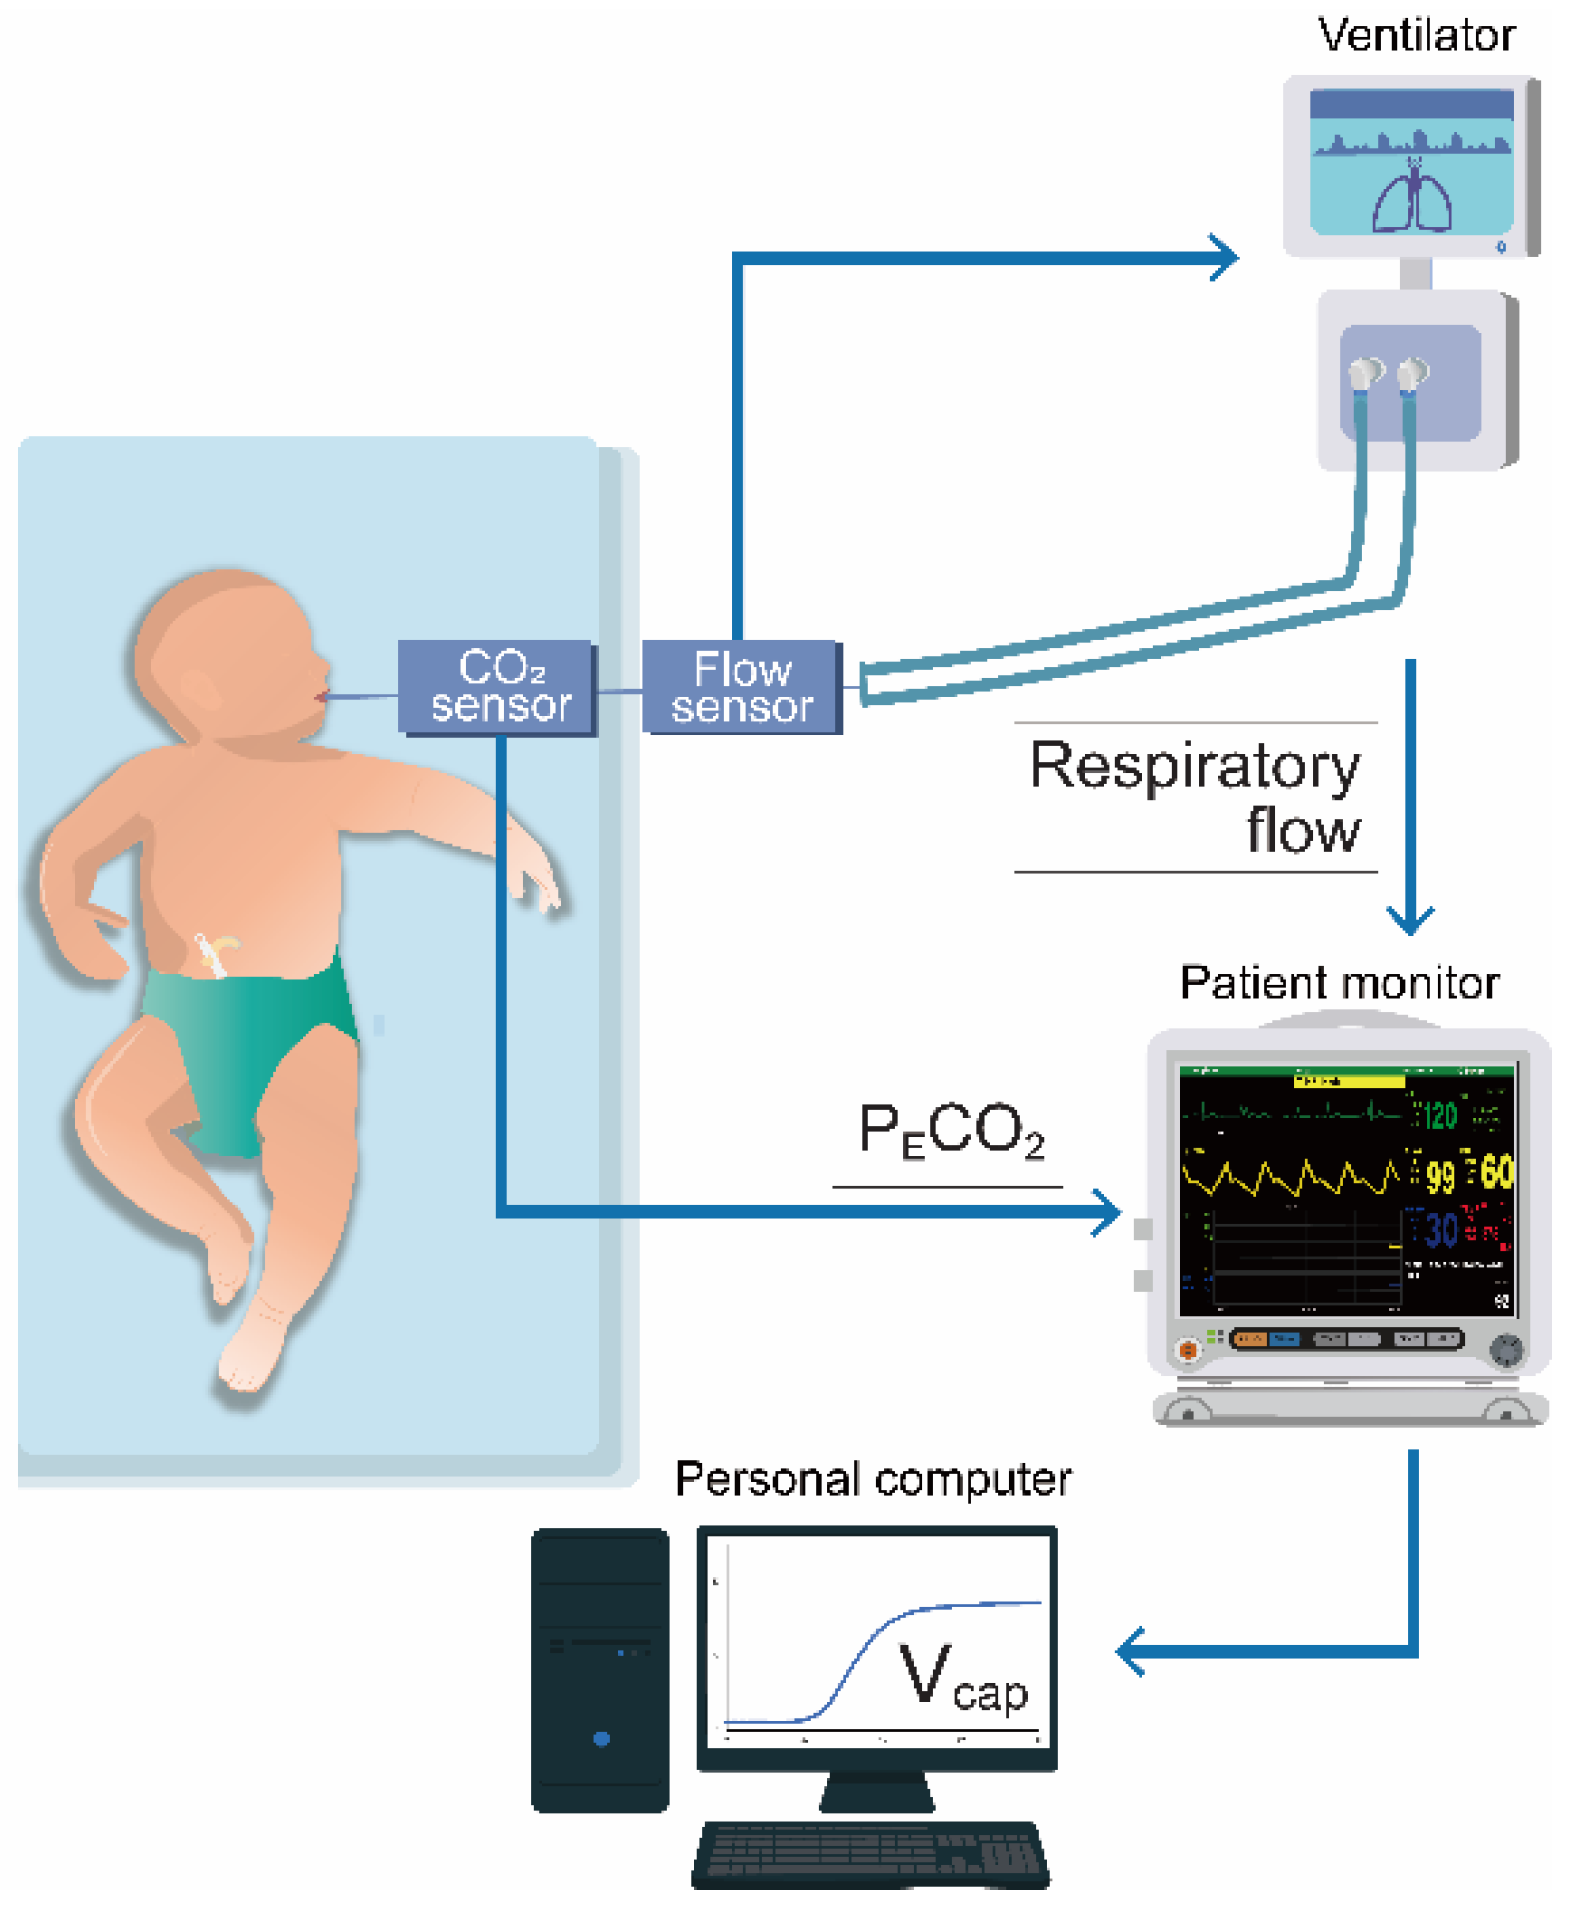
2.2 Methodology of Vcap,PM
A schematic of the V
cap,PM is shown in
Figure 1. A cap-ONE (TG-980P, Nihon Kohden, Tokyo, Japan; sampling frequency, 40 Hz; dead space, 1.8 mL) was placed between the flow sensor of the ventilator circuit and endotracheal tube. This lightweight mainstream capnometer is commonly used in NICUs and pediatric ICUs (PICUs). The cap-ONE and VN500 were both connected to the patient monitor (BSM-6000; Nihon Kohden, Tokyo, Japan); P
ECO
2 and respiratory flow data were obtained, which were upsampled to 125 Hz, in the patient monitor. We collected these data as CSV files and converted them into Excel files (Microsoft Excel, version 2409, Microsoft Corporation, Redmond, WA, USA) using a personal computer linked to the patient monitor. We then performed V
cap,PM, for which P
ECO
2 was plotted against V
T,E, as obtained by numerically integrating the flow from the beginning to the end of expiration. The Fowler dead space volume (V
d,Fowler), the sum of V
d,aw and V
d,app, was calculated from the resulting curve, as described previously [
14,
17]. V
d,app was calculated using the water displacement technique, while V
d,aw and alveolar V
T (V
A) were computed as follows:
The capnographic slopes of phases II (S
II) and III (S
III) were calculated by fitting linear regression lines over the volume-based capnograms and then normalized (Sn
II and Sn
III) with V
T to account for anthropometric differences. We calculated the capnographic index (KPIv) as S
III / S
II to quantify the degree of small airway obstruction [
18]. Median values were calculated from ≥ 100 consecutive breaths and corrected for body weight at measurement.
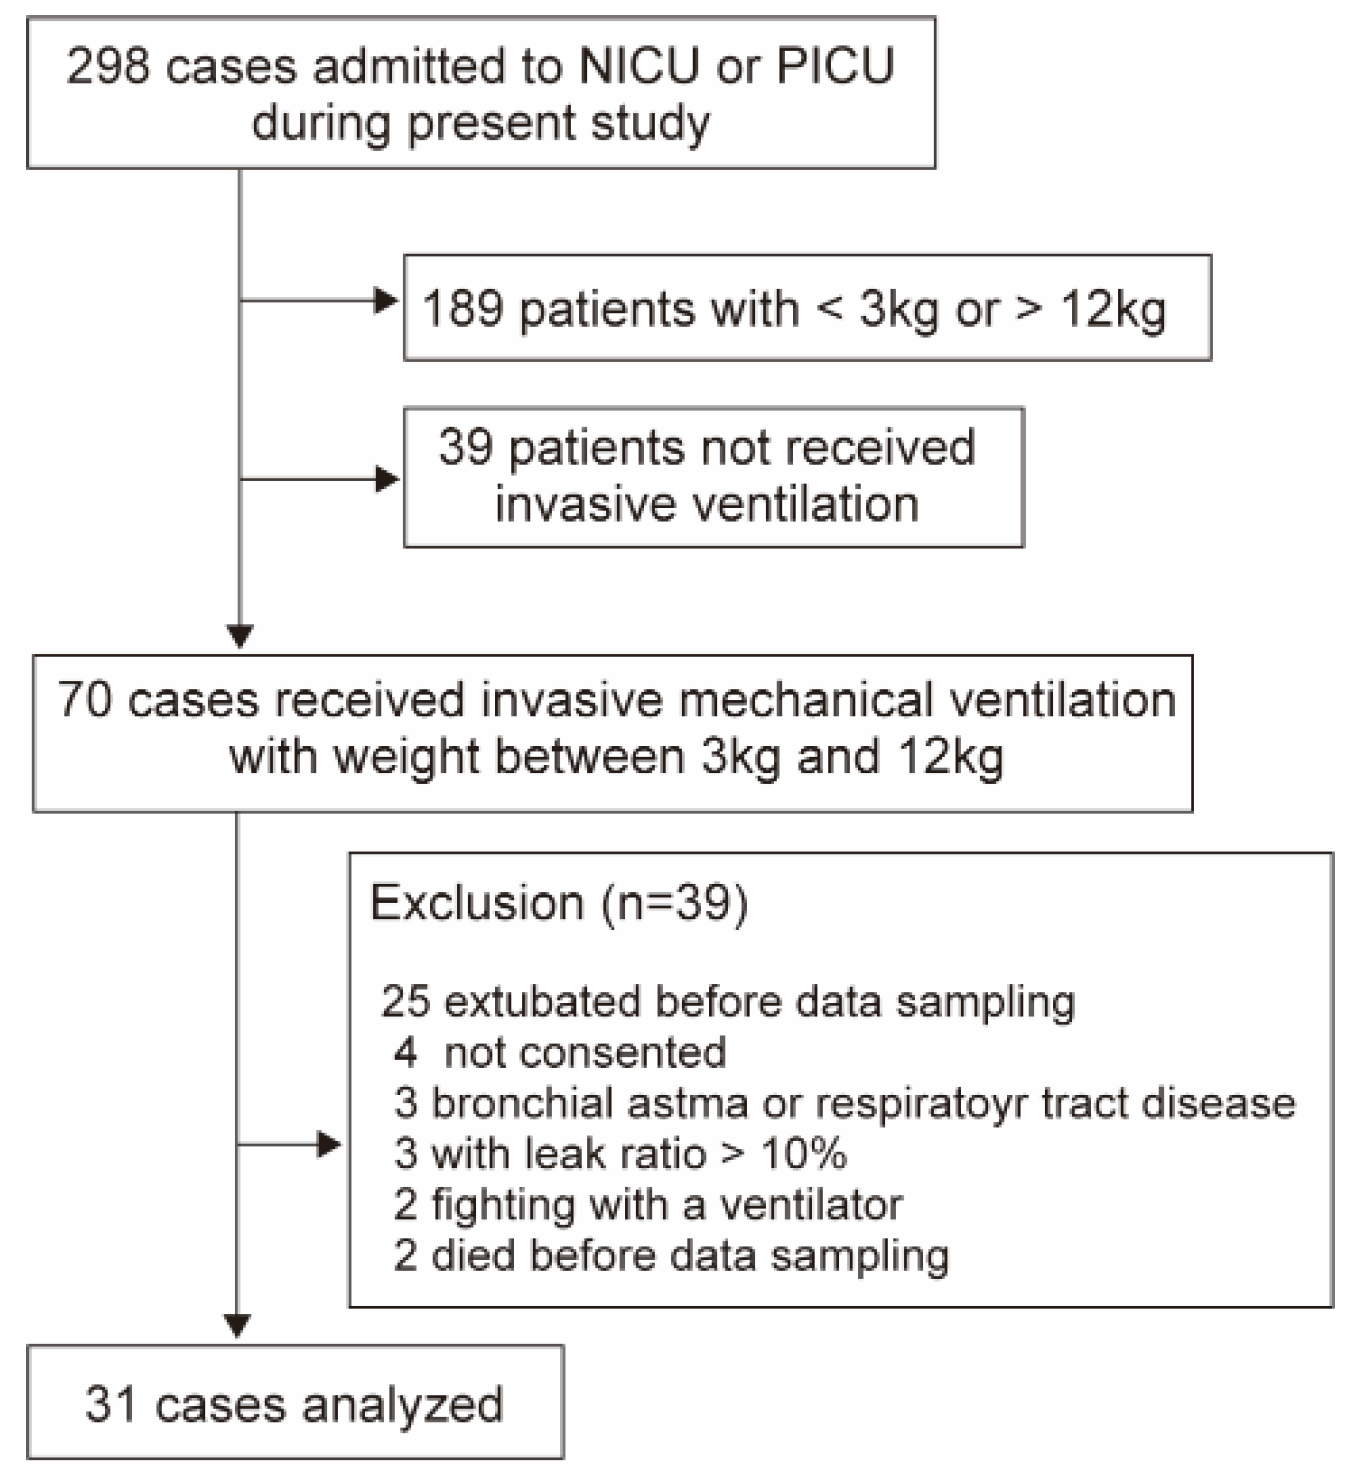
2.3 Examination for Validity of Vcap,PM (Analysis 1)
To assess the accuracy of the V
cap,PM measurements, we compared the data obtained from both the V
cap,PM and HAMILTON-C1 (Hamilton Medical, Bonaduz, Switzerland), which was equipped with V
cap functionality. The CAPNOSTAT 5 (Philips, Philadelphia, PA, USA; sampling frequency, 100 Hz; dead space, 5 mL), a capnometer widely used in conjunction with the HAMILTON-C1, is not suitable for small infants primarily due to the impact of the V
d,app. Therefore, Analysis 1 included ventilated newborns and children admitted to the NICU or PICU between December 2023 and August 2024 with body weights ranging from 3 to 12 kg, all of whom were suitable for the use of both the VN500 and HAMILTON-C1 (
Figure 2). Upon the clinician’s assessment that extubation could be achieved, V
cap,PM was conducted, followed by V
cap with HAMILTON-C1 for 5 min. Subsequently, linear regression and Bland–Altman analyses were conducted to assess the accuracy of V
cap,PM for the median values of V
d,aw, S
II, S
III, and P
ECO
2 derived from each method.
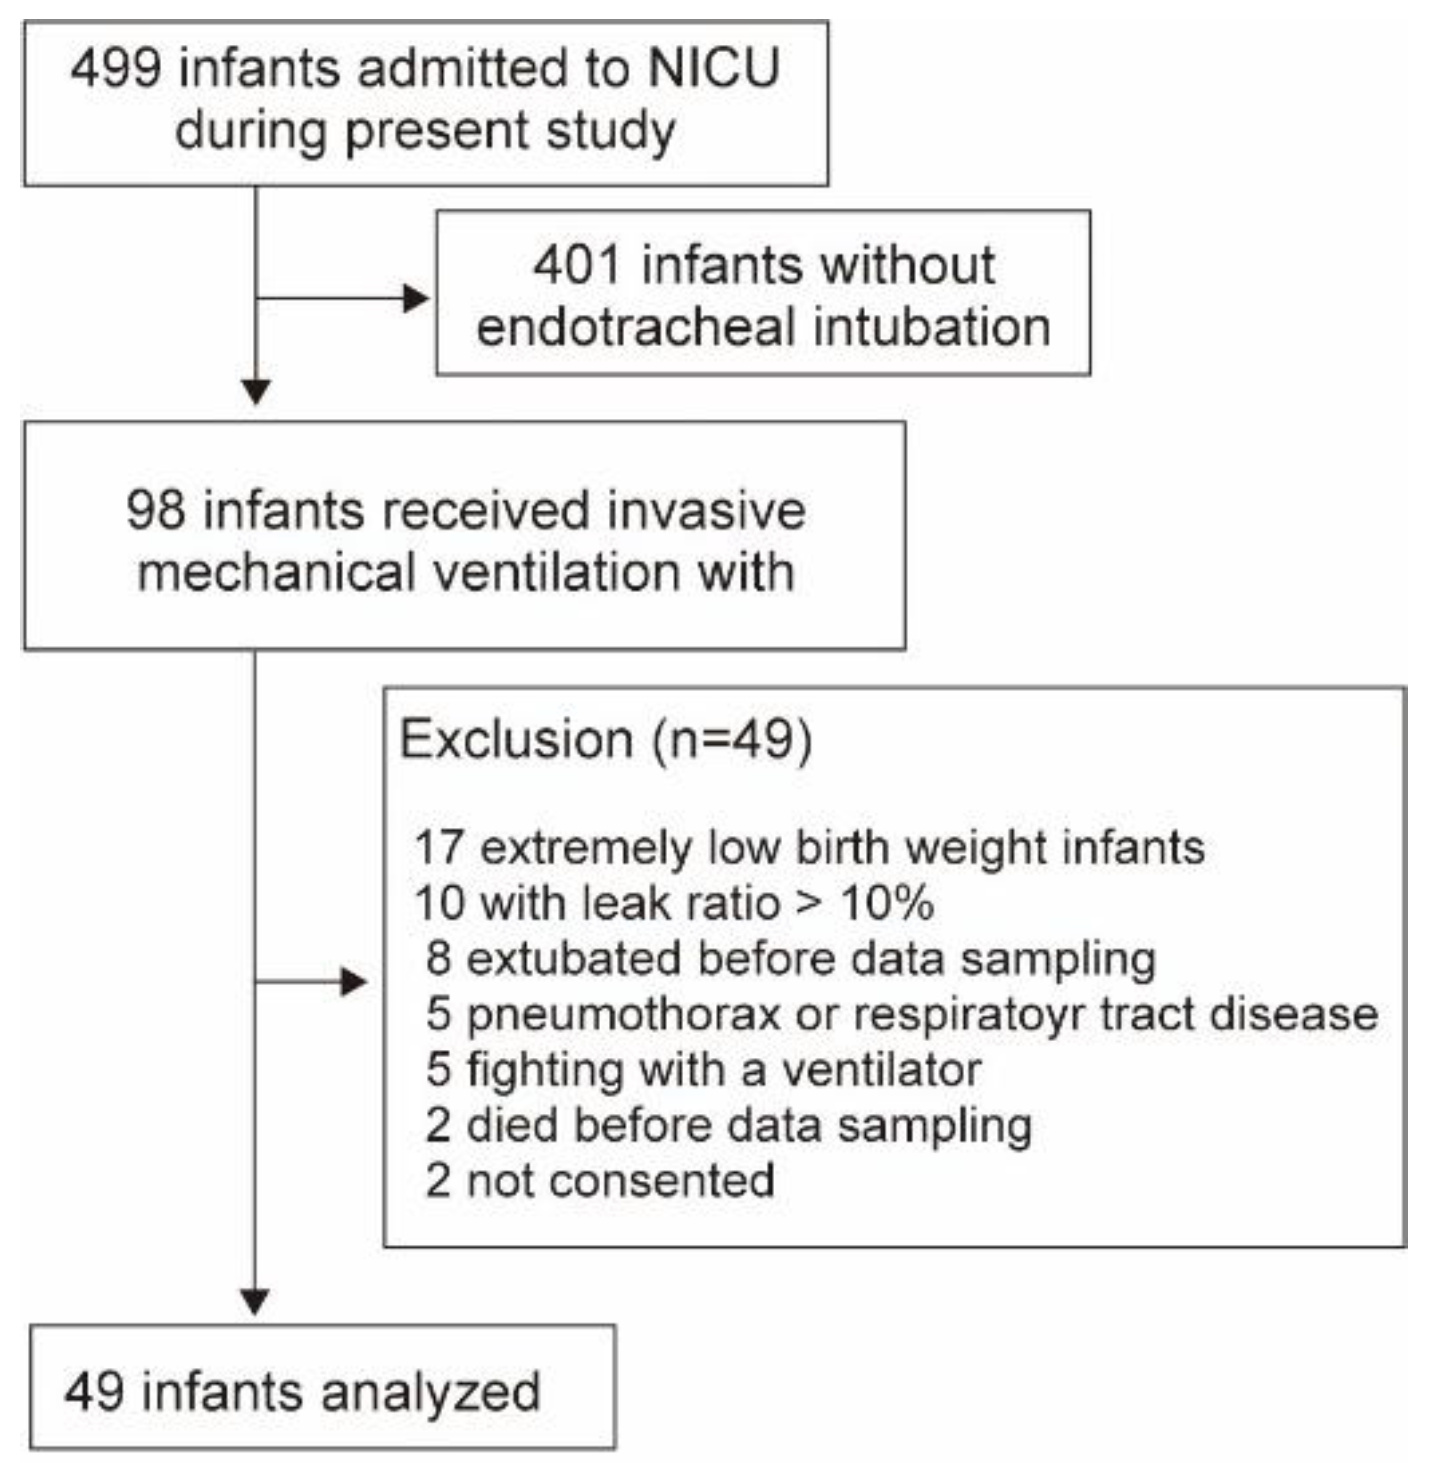
2.4 Impact of PEEP on Term and Preterm Newborns (Analysis 2)
Newborns admitted to the NICU between April 2022 and August 2024 were included; however, those with extremely low birth weight were excluded due to the possible adverse impacts of the cap-ONE V
d,app (
Figure 3). Ventilator settings were adjusted to a fixed V
T of 5–7 mL/kg predicted body weight with a volume guarantee feature to circumvent a change in V
T due to differences in lung compliance at different PEEP levels. Throughout the procedure, the fraction of inspired oxygen, inspiratory time, and respiratory rate remained consistent with baseline values established prior to starting. For cases in which the respiratory condition was stable, we maintained the PEEP at 5 cmH
2O (mild level) for 15–20 min and incrementally increased it every 10 min to 7 cmH
2O (moderate level) and 10 cmH
2O or peak inspiratory pressure not exceeding 25 cmH
2O (high level) during the execution of V
cap,PM (incremental phase). Following a 10 min stabilization period, the PEEP was reduced from high to moderate and mild levels (decremental phase), and the corresponding changes in the V
cap,PM measurements were assessed. Changes in V
cap,PM due to PEEP in term and preterm infants were compared during each phase.
2.5 Statistical Analyses
In Analysis 1, we evaluated the correlation between the Vcap,PM and HAMILTON-C1 measurements using Spearman’s correlation coefficient. The Bland–Altman technique was used to assess the agreement of the measurements by plotting the difference (D) of the average for each measurement. The 95% limits of agreement (D ± 2 standard deviations [SD]) depicted a range that included most of the differences in the methods. In Analysis 2, we first compared the Vd,aw and VA at PEEP 5 cmH2O of term and preterm infants using the Mann–Whitney U test. Next, data on ventilator settings and Vcap,PM in each infant were compared among the three groups (mild, moderate, and high PEEP) using Friedman’s analysis of variance after Bonferroni adjusted for multiple comparisons. All the statistical analyses were performed using EZR software (Saitama Medical Centre, Jichi Medical University, Saitama, Japan).
3. Results
3.1 Analysis 1
The population in Analysis 1 consisted of 31 patients, including 8 newborns and 11 infants (mean age, 9 [interquartile range (IQR), 0–36] months; weight, 6.0 [IQR, 3.8–10.5] kg; sex, 39% male) (
Table 1). The indications for intubation included asphyxia or encephalopathy (n = 17; 55%), respiratory failure (n = 7; 23%), and surgery (n = 7; 23%). The ventilator settings at the time of the investigation are shown in
Table 1.
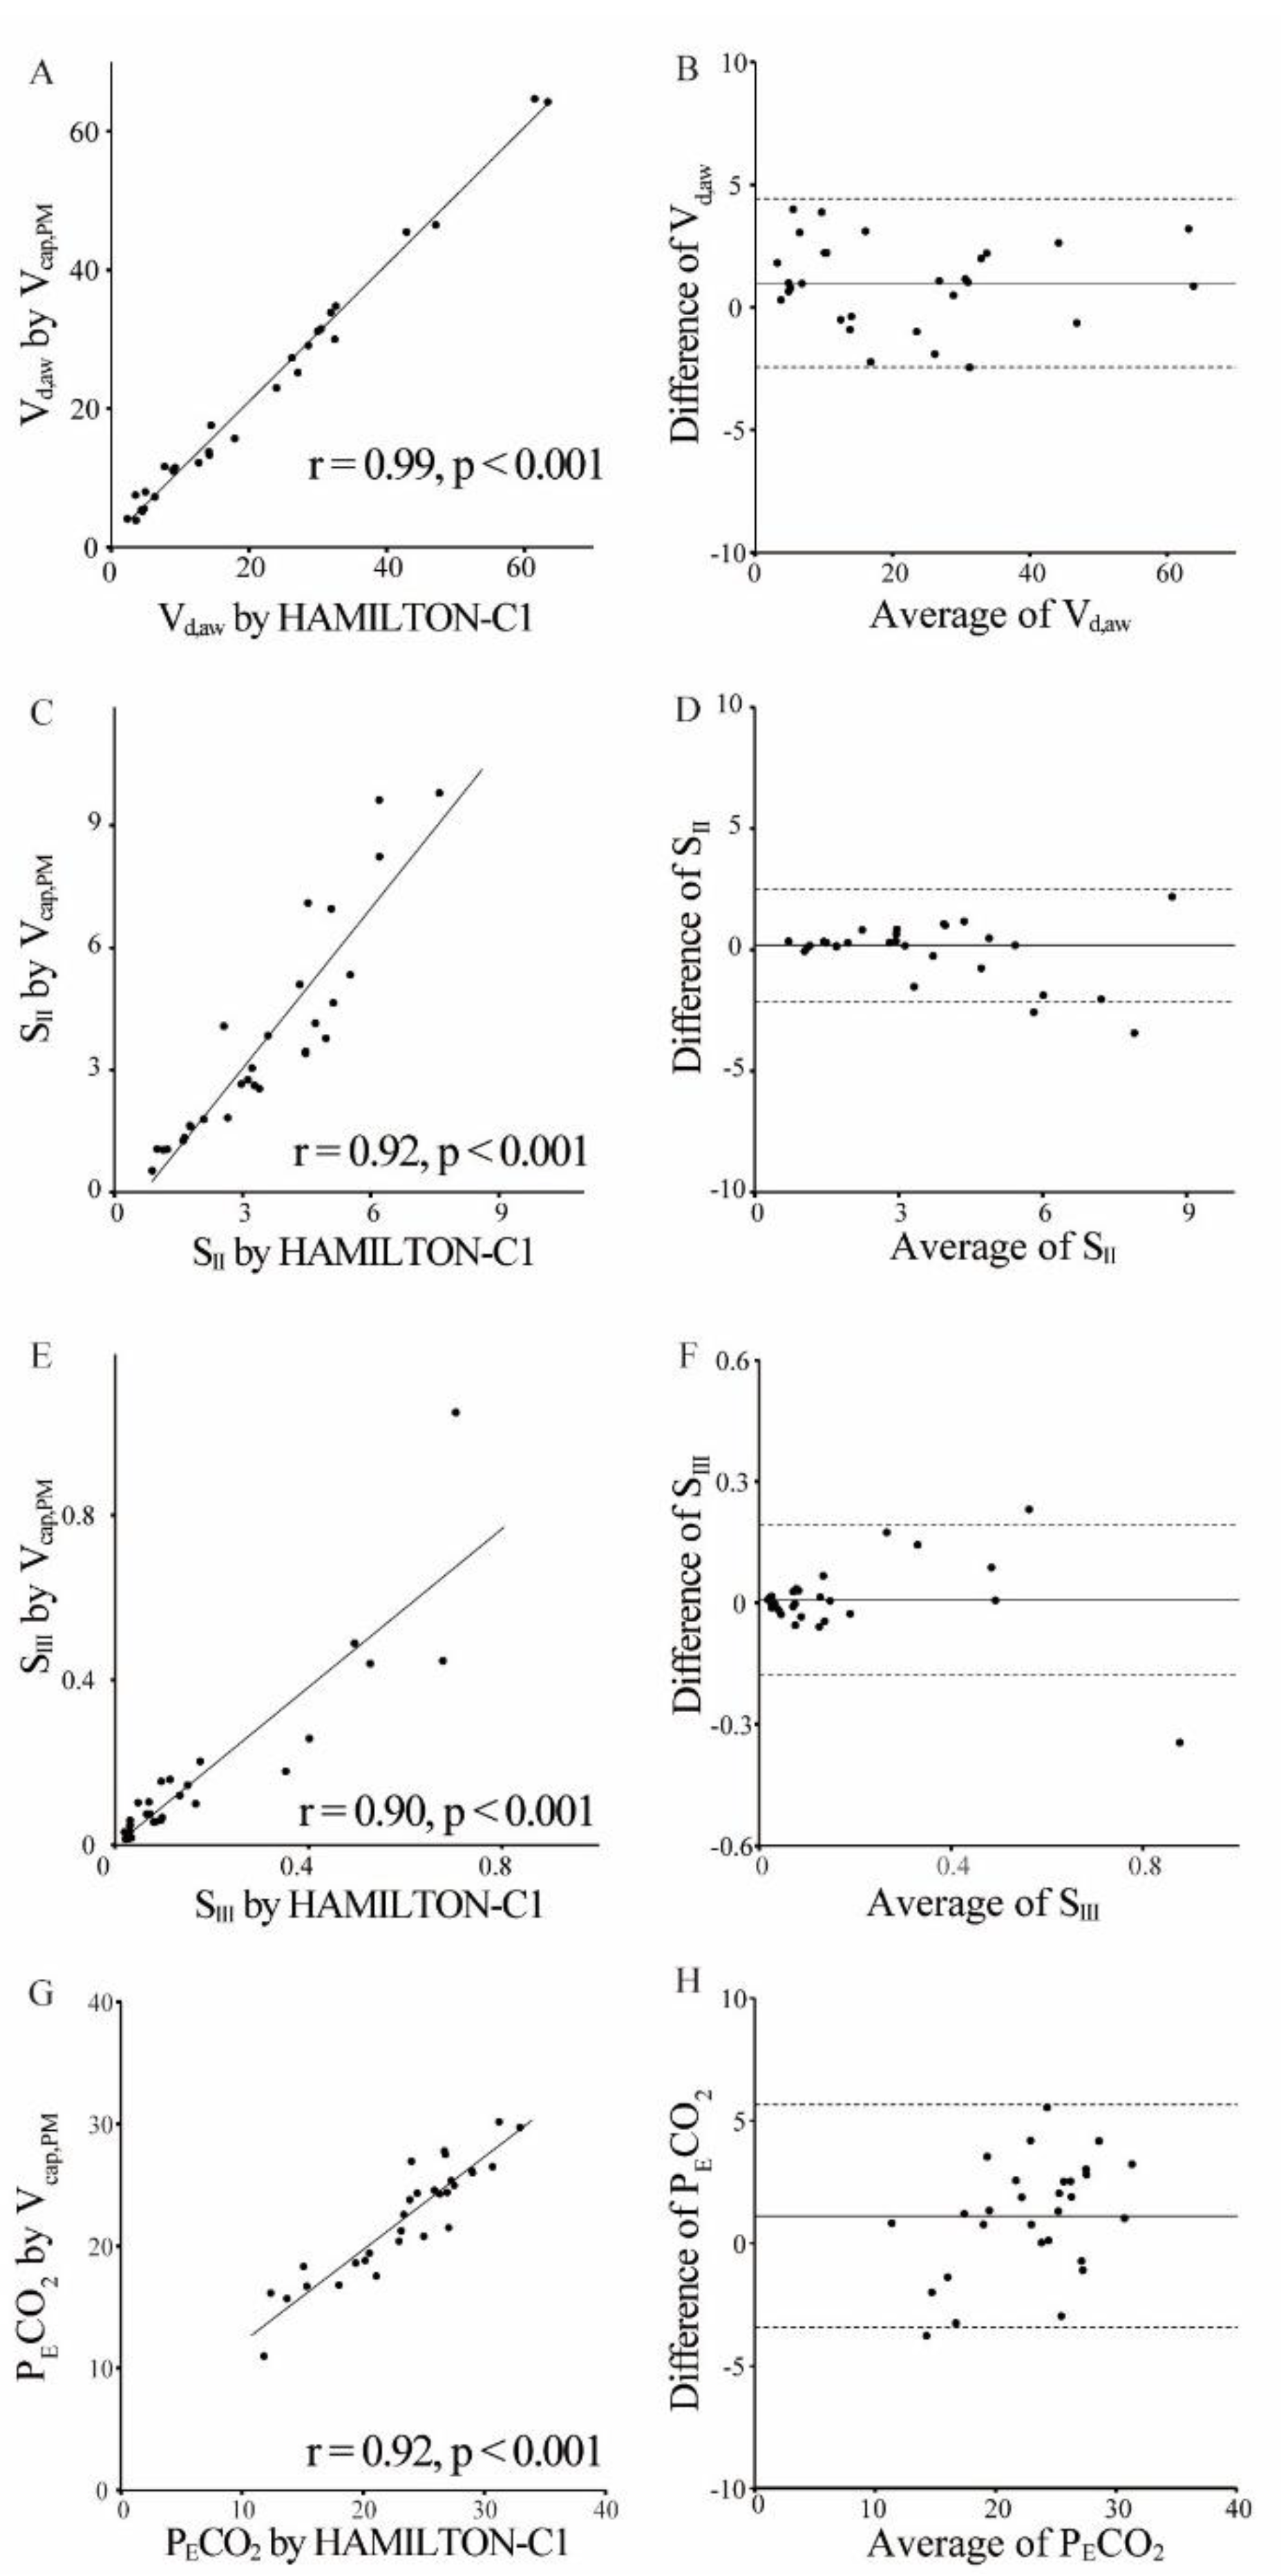
Figure 4 illustrates the significant correlations among V
cap,PM and HAMILTON-C1 (V
d,aw: r = 0.99,
P < 0.001; S
II: r = 0.92,
P < 0.001; S
III: r = 0.90,
P < 0.001; P
ECO
2: r = 0.92,
P < 0.001). Bland–Altman plots revealed good agreement between the measurements, with a mean bias of 0.99 (V
d,aw), 0.19 (S
II), 0.01 (S
III), and 1.1 (P
ECO
2); the 95% limits of agreement (± 2 SD) were 1.72 (V
d,aw), 1.16 (S
II), 0.09 (S
III), and 2.27 (P
ECO
2).
3.2 Analysis 2
Analysis 2 included 28 term (median gestational age, 38 [IQR, 38–40] weeks; median birth weight, 2,924 [IQR, 2,725–3,109] g), and 21 preterm (median gestational age, 33 [IQR, 31–34] weeks; weight, 1,918 [IQR, 1,356–2,186] g) newborns, 41% of whom were male, with mean Apgar scores of 5 (IQR, 3–8) and 7 (IQR, 5–8) points at 1 and 5 min, respectively (
Table 2). The median age at the time of measurement was 2 (IQR, 1–4) days in term and 4 (IQR, 3–5) days in preterm infants. The ventilator settings immediately before the analysis are presented in
Table 2.
Table 3 shows the changes of different V
cap,PM parameters during the incremental phase. Despite there being no difference in V
T, term infants exhibited lower V
d,aw and higher V
A at 5 cmH
2O than preterm infants: V
d,aw, 2.0 (IQR, 1.8–2.2) mL/kg vs. 2.6 (IQR, 2.2–2.8) mL/kg, respectively,
P = 0.0037; V
A, 3.6 (IQR, 3.2–4.2) vs. 3.1 (IQR, 2.7–3.7), respectively,
P = 0.014. Additionally, although V
T remained constant throughout the procedure, high PEEP significantly increased V
d,aw and decreased V
A compared with mild PEEP in both term and preterm newborns. In the decremental phase, the restoration of a lower PEEP resulted in the normalization of both V
d,aw and V
A (
Table 4). Furthermore, in both the incremental and decremental phases, the Sn
Ⅲ and KPIv were greater in preterm newborns with mild PEEP compared to high PEEP. However, these differences were not evident in term patients. No complications, including changes in the percutaneous oxygen saturation, were detected during all procedures.
4. Discussion
In this study, we introduced a novel Vcap technique utilizing patient monitors and provided evidence of its consistency with the HAMILTON-C1 measurements. Furthermore, our findings indicate that higher PEEPs in newborns can be associated with increased airway dead space, resulting in a reduction in alveolar ventilation.
In this study, we found that the V
d,aw was 2.0 (IQR, 1.8–2.2) mL/kg in term newborns and 2.6 (IQR, 2.2–2.8) mL/kg in preterm newborns at a PEEP of 5 cmH
2O. Although the normal range of V
d,aw in ventilated newborns remains controversial, premature infants reportedly have higher V
d,aw. Dassios, et al. [
19] found a median V
d,aw of 2.4 (IQR, 1.9–2.9) mL/kg in term infants and 3.7 (IQR, 3.0–4.5) mL/kg in preterm infants. In another study, the V
d,aw was determined to be 1.47 ± 0.53 mL/kg for infants weighing ≥ 2,500 g, compared with 1.84 ± 0.65 mL/kg for those with a weight ≤ 2500 g [
20]. In preterm infants born between 22 and 32 weeks of gestation, during the end of the canalicular and saccular stages of lung development, the conducting airways are fully formed, and the formation of the respiratory bronchioles is nearly complete. However, these immature structures have limited support for collagen [
21]. Additionally, alveolar proliferation and development occurred during the alveolar phase after 36 weeks [
22,
23]. Therefore, mechanical ventilation may induce airway dilation in premature infants with relatively stiff lungs.
To our knowledge, no previous study has demonstrate that high PEEP increases V
d,aw and reduces V
A in ventilated newborns, as reported in the present study, suggesting that airway dilation occurs during alveolar overdistension in these patients. It is typically recommended that newborns be ventilated with a relatively low V
T, between 4 and 5 mL/kg, to prevent lung injury [
2]. Therefore, we suggest a higher respiratory rate setting be used when managing newborns with relatively high PEEP because of the reduction in effective alveolar ventilation. Furthermore, in this study, KPIv, which is widely used to evaluate ventilation inhomogeneity and ventilation-perfusion mismatch, increased at a PEEP of 5 cmH
2O compared with higher PEEP in preterm infants [
18,
24]. Therefore, we believe that V
cap, which can predict alveolar collapse and hyperinflation, enables the establishment of more accurate PEEP settings in intubated newborns.
Numerous strategies exist for determining bedside PEEP settings in adult patients, including V
cap, mechanical parameters such as transpulmonary pressure, and imaging techniques such as computed tomography (CT) or electrical impedance tomography (EIT) [
25]. However, there are a limited number of studies on PEEP titration in neonatal and pediatric populations. Although transpulmonary pressure measurements offer theoretical benefits in PEEP management, there are technical limitations to consider in young infants and children [
26]. Furthermore, studies focusing on PEEP titration in children are scarce, and the only studies that have used transpulmonary pressure targeted PEEP titration are case reports [
27,
28]. EIT, a non-invasive imaging method for producing cross-sectional images of electrical conductivity distributions inside the human body, has been employed to titrate PEEP in children [
29]. Despite its potential, it has not yet been widely adopted, particularly in NICUs. Recently, the utility of dynamic CT and flexible bronchoscopy techniques for PEEP titration in newborns has been demonstrated; however, the effects of PEEP on respiratory mechanics have not been demonstrated [
30,
31]. Dellacà et al. [
32] demonstrated the feasibility of forced oscillation for non-invasive bedside PEEP titration in ventilated preterm newborns. Although this method can identify the optimal PEEP level, it requires equipment that is not widely used in the clinical setting, such as a servo-controlled linear motor. V
cap,PM has the potential to enhance suitable PEEP settings for newborns determination and contribute to lung protection strategies at a low cost because our methodology does not necessitate the use of specialized equipment.
This study has a few limitations. First, Vcap,PM was only validated for the combination of VN500 and cap-ONE. By assessing alternative combinations of ventilators and capnometers, our novel technique has the potential to yield a Vcap applicable to pediatric and adult patients undergoing ventilatory management in ICUs or operating rooms. Second, we were unable to assess the impact of PEEP in cases of comparatively severe respiratory conditions. Third, the present study had a relatively small sample size. However, we performed a post-hoc power analysis with a difference in the Vd,aw due to PEEP and found a power of 96%, which is significant. Finally, alveolar dead space (Vd,alv), the volume of ventilated alveoli that did not receive blood flow and subsequently no gas exchange, was not measured in this study. A previous study on PEEP titration using Vcap showed that high PEEP increases the Vd,alv. Consequently, more accurate PEEP titration in newborns may be accomplished by assessing the physiological dead space, the sum of Vd,Folwer and Vd,alv.
5. Conclusions
We have shown that high PEEP induces airway dilation in newborns using a novel Vcap technique involving the automatic collection of PECO2 and VT,E data by linking a computer to the patient’s bedside monitor. We believe that this technique, without the need for special equipment, has the potential for wider clinical application in neonatal care.
Author Contributions
Conceptualization, M.Z.; methodology, M.Z.; software, M.Z.; validation, M.Z. and RM; formal analysis, M.Z.; investigation, M.Z.; resources, M.Z.; data curation, M.Z.; writing—original draft preparation, M.Z.; writing—review and editing, M.Z., K.W., N.I., R.M., M.K., A.Y., E.I., H.M., K.H., T.H., and T.I.; visualization, M.Z.; supervision, T.I.; project administration, M.Z.; funding acquisition, M.Z. All authors have read and agreed to the published version of the manuscript.
Funding
This research was funded by JSPS KAKENHI. grant number JP23K14985.
Institutional Review Board Statement
The study was conducted in accordance with the Declaration of Helsinki and approved by the Clinical Ethics Committee of the University Hospital Kyoto Prefectural University of Medicine, approval number ERB-C-2145-1.
Informed Consent Statement
Written informed consent was obtained from the legal guardians of each participant.
Data Availability Statement
The datasets used and/or analyzed during the current study are available from the corresponding author on reasonable request.
Acknowledgments
We thank Nihon Kohden Corporation for supporting the implementation of novel Vcap. We also thank Toshiki Aoki for his support and assistance with data acquisition and analysis.
Conflicts of Interest
The authors declare no conflicts of interest. The funders had no role in the design of the study; in the collection, analyses, or interpretation of data; in the writing of the manuscript; or in the decision to publish the results.
Abbreviations
The following abbreviations are used in this manuscript:
| CO2 |
Carbon dioxide |
| IQR |
Interquartile range |
| KPIV |
Capnographic index |
| NICU |
Neonatal intensive care unit |
| PECO2 |
Partial pressure expiratory CO2 |
| PEEP |
Positive end-expiratory pressure |
| PICU |
Pediatric ICU |
| SII |
Capnographic slope of phase II |
| SIII |
Capnographic slope of phase III |
| VILI |
Ventilator-induced lung injury |
| Vcap |
Volumetric capnography |
| Vcap,PM |
Vcap based on the patient monitor |
| Vd,alv |
Alveolar dead space |
| Vd,aw |
Airway dead space volume |
| Vd,app |
Apparatus dead space volume |
| Vd,Fowler |
Fowler dead space volume |
| VT |
tidal volume |
| VT,E |
Expired tidal volume |
References
- Thekkeveedu, R.K.; El-Saie, A.; Prakash, V.; Katakam, L.; Shivanna, B. Ventilation-induced lung injury (VILI) in neonates: evidence-based concepts and lung-protective strategies. J. Clin. Med. 2022, 11, 557. [Google Scholar] [CrossRef]
- Keszler, M. Mechanical ventilation strategies. Semin. Fetal. Neonatal. Med. 2017, 22, 267–274. [Google Scholar] [CrossRef]
- Rouby, J.J.; Ferrari, F.; Bouhemad, B.; Lu, Q. Positive end-expiratory pressure in acute respiratory distress syndrome: should the ‘open lung strategy’ be replaced by a ‘protective lung strategy’? Crit. Care 2007, 11, 180. [Google Scholar] [CrossRef] [PubMed]
- Brochard, L. New goals for positive end-expiratory pressure in acute respiratory distress syndrome: a paradigm shift or the end of an area of uncertainty? Am. J. Respir. Crit. Care Med. 2010, 181, 528–530. [Google Scholar] [CrossRef] [PubMed]
- Terragni, P.P.; Rosboch, G.; Tealdi, A.; Corno, E.; Menaldo, E.; Davini, O.; Gandini, G.; Herrmann, P.; Mascia, L.; Quintel, M.; Slutsky, A.S.; Gattinoni, L.; Ranieri, V.M. Tidal hyperinflation during low tidal volume ventilation in acute respiratory distress syndrome. Am. J. Respir. Crit. Care Med. 2007, 175, 160–666. [Google Scholar] [CrossRef]
- Vieillard-Baron, A.; Price, L.C.; Matthay, M.A. Acute cor pulmonale in ARDS. Intensive Care Med. 2013, 39, 1836–1838. [Google Scholar] [CrossRef]
- Bamat, N.; Fierro, J.; Wang, Y.; Millar, D.; Kirpalani, H. Positive end-expiratory pressure for preterm infants requiring conventional mechanical ventilation for respiratory distress syndrome or bronchopulmonary dysplasia. Cochrane Database Syst. Rev. 2019, 2, CD004500. [Google Scholar] [CrossRef] [PubMed]
- Verscheure, S.; Massion, P.B.; Verschuren, F.; Damas, P.; Magder, S. Volumetric capnography: lessons from the past and current clinical applications. Crit. Care 2016, 20, 184. [Google Scholar] [CrossRef]
- Blankman, P.; Shono, A.; Hermans, B.J.; Wesselius, T.; Hasan, D.; Gommers, D. Detection of optimal PEEP for equal distribution of tidal volume by volumetric capnography and electrical impedance tomography during decreasing levels of PEEP in post cardiac-surgery patients. Br. J. Anaesth. 2016, 116, 862–869. [Google Scholar] [CrossRef]
- Tusman, G.; Gogniat, E.; Madorno, M.; Otero, P.; Dianti, J.; Ceballos, I.F.; Ceballos, M.; Verdier, N.; Böhm, S.H.; Rodriguez, P.O. Effect of PEEP on dead space in an Experimental model of ARDS. Respir. Care 2020, 65, 11–20. [Google Scholar] [CrossRef]
- Yang, Y.; Huang, Y.; Tang, R.; Chen, Q.; Hui, X.; Li, Y.; Yu, Q.; Zhao, H.; Qiu, H. Optimization of positive end-expiratory pressure by volumetric capnography variables in lavage-induced acute lung injury. Respiration 2014, 87, 75–83. [Google Scholar] [CrossRef]
- Schmalisch, G. Current methodological and technical limitations of time and volumetric capnography in newborns. Biomed. Eng. OnLine 2016, 15, 104. [Google Scholar] [CrossRef]
- Neumann, R.P.; Pillow, J.J.; Thamrin, C.; Larcombe, A.N.; Hall, G.L.; Schulzke, S.M. Influence of gestational age on dead space and alveolar ventilation in preterm infants ventilated with volume guarantee. Neonatology 2015, 107, 43–49. [Google Scholar] [CrossRef]
- Zuiki, M.; Yamano, A.; Kitamura, K.; Goda, T.; Oya, S.; Komatsu, H. Ventilated Infants Have Increased Dead Space and Lower alveolar Tidal Volumes during the Early versus Recovery Phase of Respiratory Distress. Neonatology 2020, 117, 189–192. [Google Scholar] [CrossRef]
- Zuiki, M.; Naito, Y.; Kitamura, K.; Tsurukawa, S.; Matsumura, U.; Kanayama, T.; Komatsu, H. Reduction in minute alveolar ventilation causes hypercapnia in ventilated neonates with respiratory distress. Eur. J. Pediatr. 2021, 180, 241–246. [Google Scholar] [CrossRef] [PubMed]
- Zuiki, M.; Kume, R.; Matsuura, A.; Mitsuno, K.; Kitamura, K.; Kanayama, T.; Komatsu, H. Large difference between Enghoff and Bohr dead space in ventilated infants with hypoxemic respiratory failure. Pediatr. Pulmonol. 2021, 56, 2102–2107. [Google Scholar] [CrossRef] [PubMed]
- Fowler, W.S. Lung function studies; the respiratory dead space. Am. J. Physiol. 1948, 154, 405–416. [Google Scholar] [CrossRef]
- Strömberg, N.O.; Gustafsson, P.M. Ventilation inhomogeneity assessed by nitrogen washout and ventilation-perfusion mismatch by capnography in stable and induced airway obstruction. Pediatr. Pulmonol. 2000, 29, 94–102. [Google Scholar] [CrossRef]
- Dassios, T.; Dixon, P.; Hickey, A.; Fouzas, S.; Greenough, A. Physiological and anatomical dead space in mechanically ventilated newborn infants. Pediatr. Pulmonol. 2018, 53, 57–63. [Google Scholar] [CrossRef]
- Wenzel, U.; Wauer, R.R.; Schmalisch, G. Comparison of different methods for dead space measurements in ventilated newborns using CO2-volume plot. Intensive Care Med 1999: 25:705-13. [CrossRef]
- Mereness, J.A.; Mariani, T.J. The critical role of collagen VI in lung development and chronic lung disease. Matrix Biol. Plus 2021, 10, 100058. [Google Scholar] [CrossRef] [PubMed]
- Bush, D.; Juliano, C.; Bowler, S.; Tiozzo, C. Development and disorders of the airway in bronchopulmonary dysplasia. Children (Basel), 2023, 10, 1127. [Google Scholar] [CrossRef]
- Schittny, J.C. Development of the lung. Cell Tissue Res 2017: 367:427-44. [CrossRef]
- Krauss, B.; Deykin, A.; Lam, A.; Ryoo, J.J.; Hampton, D.R.; Schmitt, P.W.; Falk, J.L. Capnogram shape in obstructive lung disease. Anesth. Analg. 2005, 100, 884–888. [Google Scholar] [CrossRef] [PubMed]
- Sahetya, S.K.; Goligher, E.C.; Brower, R.G. Fifty years of research in ARDS. Setting positive end-expiratory pressure in acute respiratory distress syndrome. Am. J. Respir. Crit. Care Med. 2017, 195, 1429–1438. [Google Scholar] [CrossRef]
- Vedrenne-Cloquet, M.; Khirani, S.; Khemani, R.; Lesage, F.; Oualha, M.; Renolleau, S.; Chiumello, D.; Demoule, A.; Fauroux, B. Pleural and transpulmonary pressures to tailor protective ventilation in children. Thorax 2023, 78, 97–105. [Google Scholar] [CrossRef]
- Pandey, M.; Gupta, D.; Gupta, N.; Sachdev, A. Use of transpulmonary pressure monitoring in the management of extrapulmonary pediatric acute respiratory distress syndrome with multi organ dysfunction syndrome (MODS): are we Peepophobic? Clin. Med. Insights Case Rep. 2019, 12, 1179547619842183. [Google Scholar] [CrossRef]
- Gleich, S.J.; Schiltz, B.M.; Ouellette, Y.; Baker, J.E.; Aganga, D.O. Improvement in oxygenation utilising transpulmonary pressure monitoring for optimal positive end-expiratory pressure in pediatric acute respiratory distress syndrome: a case report. A. A. Pract. 2019, 13, 114–117. [Google Scholar] [CrossRef]
- Ren, H.; Xie, L.; Wang, Z.; Tang, X.; Ning, B.; Teng, T.; Qian, J.; Wang, Y.; Fu, L.; Zhao, Z.; Xiang, L. Comparison of global and regional compliance-guided positive end-expiratory pressure titration on regional lung ventilation in moderate-to-severe pediatric acute respiratory distress syndrome. Front. Med. (Lausanne) 2022, 9, 805680. [Google Scholar] [CrossRef]
- Pugh, C.P.; Ali, S.; Agarwal, A.; Matlock, D.N.; Sharma, M. Dynamic computed tomography for evaluation of tracheobronchomalacia in premature infants with bronchopulmonary dysplasia. Pediatr. Pulmonol. 2023, 58, 3255–3263. [Google Scholar] [CrossRef]
- Hysinger, E.; Friedman, N.; Jensen, E.; Zhang, H.; Piccione, J. Bronchoscopy in neonates with severe bronchopulmonary dysplasia in the NICU. J. Perinatol. 2019, 39, 263–268. [Google Scholar] [CrossRef]
- Dellacà, R.L.; Veneroni, C.; Vendettuoli, V.; Zannin, E.; Matassa, P.G.; Pedotti, A.; Pedotti, A.; Colnaghi, M.; Mosca, F. Relationship between respiratory impedance and positive end-expiratory pressure in mechanically ventilated neonates. Intensive Care Med. 2013, 39, 511–519. [Google Scholar] [CrossRef]
Figure 1.
Schematic presentation of volumetric capnography based on patient monitor information. A capnometer and a ventilator were both connected to a patient monitor. Partial pressure expiratory carbon dioxide (PECO2) and respiratory flow data were obtained using a personal computer linked to the patient monitor. Subsequently, we performed volumetric capnography based on patient monitor information, for which PECO2 was plotted against expiratory tidal volume as obtained by numerically integrating the flow.
Figure 2.
Flow diagram showing the number of included cases in analysis 1
Figure 2.
Flow diagram showing the number of included cases in analysis 1
Figure 3.
Flow diagram showing the number of included infants in analysis 2
Figure 3.
Flow diagram showing the number of included infants in analysis 2
Figure 4.
Validity of volumetric capnography based on patient monitor information. Scatter (A, C, E, G) and Bland–Altman (B, D, F, H) plots show agreement between measurements of volumetric capnography based on patient monitor information (Vcap,PM) and HAMILTON-C1 for the airway dead space (Vd,aw) (A, B), SII (C, D), SIII (E, F), and partial pressure expiratory carbon dioxide (PECO2) (G, H). There was a significant correlation between two methods (Vd,aw: r = 0.99, P < 0.001; SII: r = 0.91, P < 0.001; SIII: r = 0.90, P < 0.001; PECO2: r = 0.92, P < 0.001). In the Bland-Altman analysis, the horizontal lines denote the estimated bias (solid) and the 95% limits of agreement (dotted line). The 95% limits of agreement were as follows: Vd,aw, 0.99 ± 1.72; SII, 0.19 ± 1.16; SIII, 0.01 ± 0.09; and PECO2, 1.1 ± 2.7.
Table 1.
Descriptive characteristics of the enrolled patients of analysis 1
Table 1.
Descriptive characteristics of the enrolled patients of analysis 1
| Parameter |
Clinical data of the study population (n = 31) |
| Age, months |
9 (0-36) |
| neonates, n (%) |
8 (26) |
| infants, n (%) |
11 (35) |
| children, n (%) |
12 (39) |
| Weight, kg |
6.0 (3.8-10.5) |
| Male/ Female, n |
12/ 19 |
| Reason for intubation |
|
| Asphyxia or encephalopathy, n (%) |
17 (55) |
| respiratory failure, n (%) |
7 (23) |
| operation, n (%) |
7 (23) |
| Ventilator settings |
|
| FIO2
|
0.21 (0.21-0.35) |
| PIP, cmH2O |
17.6 ± 2.7 |
| PEEP, cmH2O |
5.9 ± 1.5 |
| RR, /min |
28 ± 7 |
| MAP, cmH2O |
9.0 ± 2.3 |
| VT, ml/kg |
9.8 ± 2.5 |
Table 2.
Descriptive characteristics of the enrolled patients of analysis 2
Table 2.
Descriptive characteristics of the enrolled patients of analysis 2
| Parameter |
Term infants (n=28) |
Preterm infants (n=21) |
| Gestational age, weeks |
38 (38-40) |
33 (31-34) |
| Birth weight, g |
2,924 (2,725-3,109) |
1,918 (1,356-2,186) |
| Male / Female, n |
12 / 16 |
8 / 13 |
| Cesarean section, n (%) |
20 (71) |
18 (86) |
| Twin birth, n (%) |
4 (14) |
4 (19) |
| Apgar score at 1 min |
5 (1-8) |
5 (4-6) |
| Apgar score at 5 min |
6 (4-9) |
7 (6-8) |
| Postnatal surfactant, n (%) |
4 (14) |
10 (48) |
| Days of measurements, days |
2 (1-4) |
4 (3-5) |
| Ventilator settings at baseline |
|
|
| FIO2
|
0.22 ± 0.01 |
0.23 ± 0.02 |
| PIP, cmH2O |
11.8 ± 1.4 |
12.9 ± 1.3 |
| PEEP, cmH2O |
5.4 ± 0.6 |
5.4 ± 0.7 |
| RR, /min |
38 ± 4 |
41 ± 6 |
| MAP, cmH2O |
6.7 ± 0.8 |
7.2 ± 0.9 |
Table 3.
The impact of PEEP during incremental phase.
Table 3.
The impact of PEEP during incremental phase.
| Parameter |
Term (n=28) |
Preterm (n=21) |
| mild |
moderate |
high |
mild |
moderate |
high |
| PEEP, cmH2O |
5.0 ± 0†††
|
7.0 ± 0†††
|
9.8 ± 0.4 |
5.0 ± 0†††
|
7.0 ± 0†††
|
9.6 ± 0.5 |
| PIP, cmH2O |
11.4 ± 1.0†††
|
15.3 ± 1.2†††
|
22.1 ± 1.8 |
12.4 ± 0.9†††
|
15.4 ± 0.8†††
|
22.5 ± 1.8 |
| MAP, cmH2O |
6.4 ± 0.3†††
|
8.8 ± 0.4†††
|
12.6 ± 0.5 |
6.8 ± 0.3†††
|
9.0 ± 0.4†††
|
13.0 ± 0.5 |
| FIO2
|
0.22 ± 0.02 |
0.22 ± 0.02 |
0.22 ± 0.02 |
0.25 ± 0.01 |
0.25 ± 0.01 |
0.25 ± 0.01 |
| SpO2, % |
98.8 ± 1.4 |
98.7 ± 1.5 |
98.5 ± 1.4 |
96.7 ± 1.8 |
96.8 ± 1.8 |
96.9 ± 1.7 |
| VT/kg, ml/kg |
6.5 (5.5-6.6) |
6.2 (5.4-6.6) |
6.5 (5.5-6.7) |
6.1 (5.6–6.8) |
6.3 (5.6–6.5) |
6.2 (5.4–6.5) |
| Vd,aw, ml/kg |
2.0 (1.8-2.2)†††
|
2.1 (1.8-2.4)†††
|
2.4 (2.2-2.7) |
2.6 (2.2–2.8)†††
|
2.8 (2.4–3.1)†††
|
3.1 (2.5–3.4) |
| Vd,aw/VT
|
0.34 (0.27-0.39)†††
|
0.36 (0.30-0.42)†††
|
0.40 (0.34-0.46) |
0.40 (0.36–0.44)†††
|
0.42 (0.39–0.45)†††
|
0.48 (0.44–0.50) |
| VA, ml/kg |
3.6 (3.2-4.2)††
|
3.4 (3.1-3.9) |
3.0 (2.7-3.8) |
3.1 (2.7–3.7)†††
|
2.9 (2.6–3.6)†††
|
2.6 (2.2–3.0) |
| VA/VT
|
0.59 (0.53-0.64)†††
|
0.56 (0.50-0.62)††
|
0.52 (0.46-0.58) |
0.50 (0.46–0.55)††††
|
0.49 (0.45–0.52)†††
|
0.43 (0.40–0.48) |
| SⅡ, mmHg/ml |
8.4 (6.4-9.5) |
9.3 (6.1-10.5) |
9.2 (6.6-10.6) |
12.5 (9.8–15.1) |
13.1 (10.3–18.2) |
13.0 (10.5–18.3) |
| SnⅡ, mmHg |
150 (123-173) |
158 (124-174) |
166 (139-194) |
135 (117–161) |
146 (138–174) |
156 (138–174) |
| SⅢ, mmHg/ml |
0.17 (0.12-0.26) |
0.18 (0.08-0.26) |
0.2 (0.11-0.33) |
0.37 (0.18–0.68) |
0.35 (0.20–0.71) |
0.22 (0.09–0.44) |
| SnⅢ, mmHg |
3.9 (1.9-4.5) |
3.2 (1.6-4.1) |
3.6 (2.2-5.0) |
4.7 (2.7–8.8)†
|
4.2 (2.7–9.8) |
2.3 (1.5–3.7) |
| KPlV
|
24 (12-35) |
20 (11-30) |
22 (11-33) |
35 (17–54)†
|
28 (17–58) |
16 (9–26)
|
Table 4.
The impact of PEEP during decremental phase.
Table 4.
The impact of PEEP during decremental phase.
| Parameter |
Term (n=28) |
Preterm (n=21) |
| high |
moderate |
mild |
high |
moderate |
mild |
| PEEP, cmH2O |
9.8 ± 0.4 |
7.0 ± 0†††
|
5.0 ± 0†††
|
9.6 ± 0.5 |
7.0 ± 0†††
|
5.0 ± 0†††
|
| PIP, cmH2O |
22.0 ± 1.6 |
15.3 ± 1.0†††
|
11.4 ± 0.9†††
|
22.4 ± 1.7 |
15.2 ± 0.7†††
|
12.2 ± 0.8†††
|
| MAP, cmH2O |
12.7 ± 0.5 |
8.9 ± 0.4†††
|
6.4 ± 0.3†††
|
13.0 ± 0.5 |
9.0 ± 0.3†††
|
6.7 ± 0.3†††
|
| FIO2
|
0.22 ± 0.02 |
0.22 ± 0.02 |
0.22 ± 0.02 |
0.23 ± 0.01 |
0.23 ± 0.01 |
0.23 ± 0.01 |
| SpO2, % |
99.0 ± 1.3 |
98.7 ± 1.6 |
98.7 ± 1.6 |
98.1 ± 2.0 |
97.7 ± 2.0 |
97.1 ± 2.0 |
| VT/kg, ml/kg |
6.5 (5.5-6.6) |
6.5 (5.5-6.8) |
6.5 (5.6-6.9) |
6.2 (5.7-6.9) |
6.9 (6.3-7.5) |
6.1 (5.5-7.4) |
| Vd,aw, ml/kg |
2.4 (2.2-2.4) |
2.1 (1.9-2.3)†††
|
2.0 (1.8-2.2)†††
|
3.2 (2.5-3.5) |
2.6 (2.3-3.0)†††
|
2.5 (2.1-2.7)†††
|
| Vd,aw/VT
|
0.40 (0.34-0.46) |
0.36 (0.31-0.39)†††
|
0.33 (0.29-0.37)†††
|
0.48 (0.44-0.5) |
0.39 (0.33-0.44)†††
|
0.39 (0.34-0.42)†††
|
| VA, ml/kg |
2.9 (2.6-3.7) |
3.1 (2.9-3.9) |
3.4 (2.9-4.1)†
|
2.6 (2.2-3.0) |
3.5 (2.7-3.7)†††
|
3.3 (2.8-4.0)†††
|
| VA/VT
|
0.52 (0.46-0.58) |
0.55 (0.52-0.60)††
|
0.56 (0.51-0.62)†††
|
0.42 (0.40-0.47) |
0.52 (0.47-0.57)†††
|
0.52 (0.48-0.57)†††
|
| SⅡ, mmHg/ml |
9.2 (6.6-10.8) |
8.6 (6.1-10.3) |
8.5 (7.0-9.2) |
13.0 (10.4-18.3) |
13.5 (9.5-15.7) |
12.8 (9.3-15.4) |
| SnⅡ, mmHg |
166 (139-193) |
155 (124-176) |
152 (125-164) |
156 (138-174) |
162 (130-191) |
137 (125-164) |
| SⅢ, mmHg/ml |
0.2 (0.11-0.32) |
0.15 (0.09-0.19) |
0.17 (0.06-0.29) |
0.22 (0.09-0.44) |
0.28 (0.12-0.62) |
0.42 (0.25-0.77) |
| SnⅢ, mmHg |
3.6 (2.2-4.9) |
3.0 (1.7-4.0) |
3.5 (1.1-5.2) |
2.3 (1.5-3.7) |
4.3 (1.7-7.1) |
4.7 (3.1-10.1)†
|
| KPlV
|
22 (11-34) |
20 (11-23) |
24 (7-34) |
16 (9-27) |
20 (10-59) |
33 (23-58)†
|
|
Disclaimer/Publisher’s Note: The statements, opinions and data contained in all publications are solely those of the individual author(s) and contributor(s) and not of MDPI and/or the editor(s). MDPI and/or the editor(s) disclaim responsibility for any injury to people or property resulting from any ideas, methods, instructions or products referred to in the content. |
© 2025 by the authors. Licensee MDPI, Basel, Switzerland. This article is an open access article distributed under the terms and conditions of the Creative Commons Attribution (CC BY) license (http://creativecommons.org/licenses/by/4.0/).