Submitted:
25 January 2024
Posted:
26 January 2024
You are already at the latest version
Abstract
Background: Survival and outcome of extremely preterm (EP) infants have improved due to changes in the management of stabilization at birth and respiratory distress syndrome. Methods: In a retrospective study conducted at an academic perinatal level III center in Romania, we compared the effects of different protocols on the early outcomes of EP infants of two different periods (2008-2012 vs. 2018 vs. 2022). Two subgroups were studied in each period, based on gestational age (GA), 22-25 weeks, and 26-28 weeks, excluding those with significant congenital anomalies or missing data. Results: 270 EP infants were included in the study (121/149), with a mean GA 26.1±1.6/26.7±1.1 weeks. Significant improvements were found during period II regarding initial FiO2 (40% vs. 100%; <0.001), nCPAP (55.7% vs. 19.0%; p<0.001) at birth, early rescue surfactant administration (65.8% vs. 34.7%; p<0.001), need of mechanical ventilation (58.4% vs. 98.3%; p<0.001). Survival rates of EP infants significantly improved from 41.3% to 72.5%, particularly in the 26-28 weeks subgroup (63.8% to 83%). The frequency of severe IVH decreased in period II from 30.6% to 14.1%, while the rates of BPD were lower in period II (23.4% vs. 36.6%; p=0.045), in the 26-28 weeks subgroup. We found improvements but no significant differences in NEC, sepsis, PVL, ROP, or PDA frequencies. Conclusions: Using updated guidelines and protocols is crucial for improving outcomes.
Keywords:
extremely preterm infants
; resuscitation
; neonatal respiratory distress syndrome
; outcomes
; guidelines
1. Introduction
Over the last decades, survival of extremely preterm (EP) infants has increased once active strategies during transition and in the management of respiratory distress syndrome (RDS) were implemented and updated. Nevertheless, the increase in survival may lead to higher risks of neonatal morbidity among survivors, like intraventricular hemorrhage (IVH), periventricular leukomalacia (PVL), patent ductus arteriosus (PDA), necrotizing enterocolitis (NEC), early/late-onset sepsis (EOS, LOS), retinopathy of prematurity (ROP), bronchopulmonary dysplasia (BPD), cerebral palsy (CP) and neurodevelopmental impairment [1,2,3,4,5]. There is wide variability in morbidity rates for EP preterm infants due to variations in resuscitation initiation, administration of antenatal corticosteroids, delivery in tertiary centers, respiratory management, medical equipment, team training in the delivery room, and neonatal intensive care unit (NICU) and socioeconomic factors [6]. Thus, strategies to limit major complications of EP infants require special attention. Preterm infants are still at risk of experiencing hypoxia at birth and respiratory difficulties, the concerns of the clinicians being primarily focused on these aspects.
The European Resuscitation Council (ERC), the American Heart Association (AHA), and the American Academy of Pediatrics (AAP) have developed well-known resuscitation guidelines that are followed worldwide. The International Liaison Committee on Resuscitation (ILCOR) was founded in 1992 and publishes evidence-based resuscitation guidelines that reflect international consensus every five years (2000, 2005, 2010, 2015, 2020). Over the years, there have been many debates and controversies surrounding the stabilization of newborns, leading to significant changes in practice [7]. In the guidelines published in 2000 and 2005, elective intubation of EP infants was recommended in the delivery room (DR). The standard approach was to use 100% oxygen to initiate resuscitation in newborns with apnea or bradycardia, regardless of gestational age (GA). However, some preliminary evidence proposing resuscitation with lower oxygen concentrations has been published [7,8,9,10,11,12,13]. In 2015, the ILCOR guidelines specified that preterm infant resuscitation should be initiated with low-concentration oxygen or air, monitored by pulse oximetry [14,15,16,17].
As for RDS, concerns about improving its management have led to the development of consensus recommendations based on a 3-year review of the most recent literature. The European Society for Paediatric Research (ESPR) endorsed the "European Consensus Guidelines for the Management of RDS" in 2007, which have evolved over the years (2010, 2013, 2016, 2019, and 2022). The 2007 edition recommended early intubation and prophylactic administration of natural surfactant to all newborn infants under 27 weeks of gestation, followed by mechanical ventilation (MV) or extubating to nasal continuous positive airway pressure (nCPAP) [18,19]. In 2013, the updated guidelines introduced significant changes in practice, including delaying clamping of the umbilical cord (DCC) for at least 60 seconds, initiating stabilization with 21–30% oxygen, stabilizing spontaneously breathing infants with RDS using nCPAP of at least 6 cm H2O, administering rescue surfactant early via INSURE technique, avoiding MV if possible, and using early caffeine therapy. The guidelines also mention using a less invasive surfactant administration (LISA) method introduced in the 2019 and 2022 editions.
Neonatologists tried to enhance support for the adaptation to the extrauterine life of newborn infants by applying these recommendations. Before 2013, in our NICU, EP infants were prophylactically intubated and resuscitated with 100% oxygen, prophylactically treated with surfactant at birth, and received MV. We had no oxygen blender, but we used pulse oximetry for monitoring SpO2 without target saturation. After 2013, we introduced a locally updated protocol for resuscitation at birth and RDS management according to ILCOR, AHA, ESPR, and AAP recommendations. The purpose of the present study was to evaluate and compare the effects of different protocols on the early outcomes of EP infants in two periods separated by ten years of experience, education, training sessions, and endowment with high-performance equipment.
2. Materials and Methods
2.1. Study group. Inclusion and exclusion criteria
This retrospective study was conducted at Targu Mureș County Emergency Hospital, an academic perinatal level III center in Romania, over two different periods. The first period was from January 1st, 2008, to December 31st, 2012, and the second from January 1st, 2018, to December 31st, 2022. The study was approved by the hospital's ethical committee (No. 6799/15.03.2022). Of 282 infants with GA of 28 weeks or less admitted to NICU during both periods, 270 were considered eligible for the study. Infants with significant congenital and chromosomal anomalies, as well as those with missing data, were excluded. The infants were stratified into two subgroups for each study period based on their GA, 22–25 weeks, and 26–28 weeks (Figure 1).
2.2. Study design and data acquisition
We studied and compared the two cohorts of EP infants managed with different protocols (Table 2) for delivery room stabilization and early management of RDS, analyzing the early outcomes (death before discharge and morbidity).
Data were collected retrospectively from the neonatal written medical NICU records. The following data was recorded for the study: maternal conditions (diabetes, hypertension, chorioamnionitis), prenatal care, antenatal steroid use (at least 2 doses of dexamethasone), premature rupture of membranes (PROM > 18 hours), tocolysis, delivery location (inborn or outborn), delivery mode, gender, gestational age (evaluated according to the New Ballard Score), birth weight (BW), and small for gestational age (SGA) status (defined as BW below the 10th centile on Fenton’s growth chart).
The delivery room management data included Apgar scores, preductal peripheral oxygen saturation (SpO2) and oxygen concentration administered (FiO2) at 5 minutes, cord pH, nCPAP or positive pressure ventilation (PPV) use, intubation in the DR, DCC, and initial hematocrit (Hct).
The management for respiratory distress syndrome (RDS) data included the need for surfactant administration, surfactant prophylaxis (in the first 15 minutes after birth) or early rescue therapy (in the first two hours of life), mode of surfactant administration (conventional – via endotracheal tube, INSURE – extubation on nCPAP after surfactant replacement, LISA – via a thin catheter/feeding tube in spontaneously breathing infant on nCPAP), surfactant dose, need for MV at 72 hours of life, duration of MV, and caffeine therapy. Curosurf (Poractant alpha, Chiesi Pharmaceuticals, Parma, Italy) was used in all patients eligible for surfactant administration.
Early outcome parameters collected included pneumothorax (PTX), BPD, IVH (all grades, grades 1–2 and 3–4), PVL, sepsis or probable sepsis, PDA, NEC, ROP stage ≥2, number of days spent in the NICU, deaths. Bronchopulmonary dysplasia was defined as oxygen requirement at 36 weeks of post-menstrual age [20,21]. Intraventricular Hemorrhage was graded according to the criteria of Papile et al. [22]. Necrotizing enterocolitis was classified by Bell's criteria [23]. Persistent Ductus Arteriosus diagnosis was based on clinical and echocardiographic parameters [24]. Retinopathy of prematurity was defined using the current ICROP classification [25]. Neonatal sepsis was identified by clinical, microbiological, hematological, and biochemical criteria for sepsis. Probable sepsis was defined as clinical signs, altered/abnormal inflammatory and hematological markers, and negative blood culture [26]. Mortality was defined as death before discharge from the maternity hospital. Criteria used for mechanical ventilation were: FiO2 > 0.4 to maintain SpO2 > 90%, or persistent apnea and/or respiratory distress. Severe neonatal morbidity was defined as a composite score of death, or either of the following: BPD, severe IVH, NEC, PVL, and/or severe ROP.
The study's primary objective was to find the impact of the changes in neonatal care at birth, and RDS protocol in EP infants reflected by an improvement in the survival rate. The secondary objectives were (1) to evaluate the impact of the changes in neonatal care at birth and RDS protocol on the rate of morbidities associated with prematurity and (2) to define the factors and interventions with significant impact on mortality.
2.3. Statistical analysis
The continuous variables were verified for normal distribution, and all were found to be abnormally distributed. Therefore, the Mann-Whitney U test was used to compare the study groups. The chi-square test and Pearson correlation were used to compare the categorical variables. Kaplan-Meyer survival test was used to create survival curves. Multivariable Cox regression was performed to identify the best predictors for mortality during the study period. The variables with significant impact on mortality were used to design the regression models, which were then used to predict mortality using receiver operating characteristics (ROC). The precision of the regression models was estimated by calculating the area under the ROC curve (AUC). The statistical significance level was set at p-value < 0.05. Odds ratios (ORs) were calculated where appropriate. IBM SPSS Statistics 26.0 was used for all statistical analyses.
3. Results
3.1. Baseline demographic characteristics
Data was collected from 121 EP infants in the 2008–2012 period (n = 20 for 22–25 weeks; n = 101 for 26–28 weeks) and from 149 infants in the 2018–2022 period (n = 55 for 22–25 weeks; n = 94 for 26–28 weeks). The baseline demographic characteristics of the two study cohorts are shown in Table 3.
In period II of the study, EP infants had a mean GA of 26.1 ± 1.6 weeks (22–28 weeks) compared to the mean GA of infants from period I, which was 26.7 ± 1.1 weeks (24–28 weeks). Significant differences were found between the two groups in terms of male gender (57.7% in period I vs. 42.1% in period II; p = 0.011), outborn infants (23.1% in period I vs. 12.8% in period II; p = 0.025), prenatal care (14% in period I vs. 61.1% in period II; p < 0.001), maternal hypertension (26.4% in period I vs. 8.7% in period II; p < 0.001), and delivery mode (vaginal - 66.9% in period I vs. 50.3% in period II; p = 0.006) (Table 2). The incidence of maternal complications such as diabetes and chorioamnionitis was similar in both study periods. The rates of antenatal steroid administration (54.5% vs 61.1%) and tocolysis (14% vs 17.4%) were not significantly different between groups (Table 3).
3.2. Delivery room stabilization
There was no significant difference in the Apgar score at 5 minutes between the two time periods, as indicated in Table 4. However, the median umbilical cord pH was higher in period II (7.27 compared to 7.21 in period I; p = 0.002). Among the EP infants, only 23 (15.4%) received DCC in period II, and none received it in period I.
During period II, there was a significant reduction in the initial FiO2 used to stabilize EP infants. The FiO2 in period II ranged from 30–100%, with an average of 40.0%, compared to period I where it ranged from 50–100.0%, with an average of 100.0% (p < 0.001). Moreover, the SpO2 level at 5 minutes was lower in period II (80.0%) than in period I (83.0%; p < 0.001). In period II, nCPAP use for stabilization increased to 55.7%, while the use of VPP decreased to 49.7% compared to period I (19.0% and 74.4%, respectively). The percentage of infants intubated in the DR decreased significantly from 65.3% to 43.0% in the second period (p < 0.001). Significant improvements were found in the 26–28 weeks subgroup analysis during period II compared to period I. The improvements consisted of higher Agar score at 5 minutes (7.5 vs. 7; p = 0.020), increased umbilical cord pH (7.29 vs. 7.19; <0.001), and greater utilization of nCPAP (67.0% vs. 19.8%; p < 0.001). Additionally, lower administration of PPV (30.9% vs. 71.3; p < 0.001) and intubation rates (23.4% vs. 58.4%; p < 0.001) were noted in this subgroup during period II. Significant differences were observed in the 22–25 weeks GA subgroup between study periods for SpO2 at 5 minutes (75% vs. 80%; p = 0.017) and intubation rate (76.4% vs. 100.0%; p = 0.016).
3.3. RDS management (surfactant and mechanical ventilation)
3.3.1. Surfactant
In period II, a higher percentage of EP infants received surfactant (89.3% vs. 55.4%; p < 0.001) and early rescue surfactant treatment (65.8% vs 34.7%; p < 0.001) compared to period I. No significant difference was found between the two groups in surfactant prophylaxis and other modes of surfactant administration (conventional and INSURE). The surfactant dose was higher in period II and LISA was performed in 39.6% of infants in the same period. Caffeine treatment was administered only in period II.
In the analysis of infants born at 26–28 weeks, during period II a significant increase in overall surfactant administration (84% vs. 57.4%; p < 0.001), early rescue treatment (66.0% vs. 38.6%; p < 0.001), LISA method (52.1% vs. 0.0%; <0.001), and caffeine treatment (100.0% vs. 0.0%; <0.001) was noted as compared to period I. Conventional surfactant administration decreased in period II (12.8% vs. 42.6%; p < 0.001).
For infants born at 22–25 weeks, 98.2% received surfactant in period II, compared to 45% in period I. Early rescue treatment (65.5% vs. 15%; p < 0.001) and conventional surfactant administration (65.5% vs. 30.0%; p = 0.006) were also seen in more infants in period II. Table 5 shows early respiratory management in the study periods.
3.3.2. Mechanical ventilation
Infants born in period II required MV less often than those delivered in period I (58.4% vs. 98.3%; p < 0.001) at 72 hours. EP infants born in both periods had similar lengths of MV (measured in hours) and were supported with similar ventilation modes (SIMV/HFOV). Volume-targeted ventilation (VTV) was only used in period II of the study, in 76.1% of ventilated infants.
When analyzing the subgroup of infants born between 26 and 28 weeks, significant improvements were observed during period II compared to period I. Need for MV at 72 hours decreased (38.3% vs. 98.0%; p < 0.001), SIMV (32.2% vs. 59.6%; p = 0.042), and HFOV (21.6% vs. 40.4%; p = 0.042) were used in fewer cases. Infants born at 22–25 weeks had significantly longer MV duration in period II (312 days) compared to period I (48 days) (p = 0.001).
3.4. Outcomes (survival/deaths and morbidities)
The comparison of morbidities and deaths between the study periods is presented in Table 6.
The group of EP infants born between 2018 and 2022 had significantly lower rates of intraventricular hemorrhage (all IVH) (26.2%) and severe IVH (14.1%) when compared to the group of EP infants born between 2008 and 2012. This difference was statistically significant (p = 0.002 and p = 0.001, respectively). However, there was no significant difference between the two groups in the rates of other health conditions such as PTX, BPD, NEC, sepsis/probable sepsis, and severe ROP.
During the period I, 41.3% of infants admitted to our NICU died. However, the death rate decreased significantly to 27.5% (p = 0.017) during period II. Additionally, the early death rate was significantly lower during period II (15.4% vs. 25.6%; p = 0.038) than in period I.
We noted significant improvements in the outcomes in the 26–28 gestational weeks subgroup when comparing the two study periods. Thus, the rates of BPD (23.4% vs. 36.6%; p = 0.045), all IVH (17.0% vs. 26.7; p < 0.001)/severe IVH (4.3% vs. 26.7%; p < 0.001), deaths (17.0% vs. 36.2%; p = 0.002), and early deaths (9.6% vs. 21.8%; p = 0.020) were lower in period II compared to period I.
Although not statistically significant, improvements were also found in the 22–25 gestational weeks subgroup when comparing the two study periods: lower rates of all IVH (41.8% vs. 65.0%), severe IVH (30.9% vs. 50.0%), PVL (7.3% vs. 15.0%), PDA (29.1% vs. 40.0%), deaths (45.5% vs. 65.0%), early deaths (25.5% vs. 40.0%).
Kaplan-Meier survival curves were used to evaluate the survival rates during the two study periods. The log-rank test was used to compare the survival rates of the two study periods (Table 7). The results showed a significant improvement in the survival rate during the second period of the study compared to the first one (log-rank p = 0.016) (Table 7, Figure 2).
The same statistical analysis was performed for early death (0–6 days of life) and the results are presented in Table 8 and Figure 3.
Early survival rates were significantly improved in EP infants born between 2018 and 2022 compared to those delivered between 2008 and 2012 (log-rank p = 0.041).
Kaplan-Meier survival curves were also used to compare the survival rates without any significant risk for long-term neurodevelopmental impairment. The variable tested was the composite outcome (death or major IVH +/- PVL +/- NEC +/- severe ROP), and the log-rank test compared the survival rates without long-term risk for neurodevelopmental outcome between the two study periods. Again, a significant improvement was demonstrated for EP infants born between 2018 and 2022 as compared to those born between 2008 and 2012 (log rank p = 0.00003) (Table 9, Figure 4).
Multivariate Cox regression was used to build prediction models for mortality in the two birth study periods (Table 10). Each model – including statistically significant variables in Cox regression – was tested on the receiver operating curve to test the predictive power of the model (Figure 5A,B). As seen in Table 9 and in Figure 4, the predictive models using the variables with statistical significance had strong predictive power even though different variables influenced mortality during the study periods (AUC for 2008–2012 = 0.811, AUC for 2018–2022 = 0.907, p <0.001 for both).
The study has identified several factors that increase the risk of mortality in infants. During the first period, these factors included low birth weight, lack of antenatal steroids, postnatal transfer of EP infants, severe intraventricular hemorrhage (IVH), and bronchopulmonary dysplasia (BPD). In the second period, BPD and NEC had a negative impact on the survival rate, while alveolar recruitment and surfactant administration decreased the risk of death.
4. Discussion
Ensuring survival and the best possible outcomes for EP infants are crucial goals for healthcare professionals. This study is the first in Romania to analyze resuscitation trends in the delivery room, early management of RDS in EP infants based on guidelines, and their impact on neonatal outcomes. Our research has shown that overall survival rates of EP infants have increased from 41.3% (2008–2012) to 72.5% (2018–2022), despite a lower mean GA in the second study period. The most significant improvement was observed in the 26–28 weeks subgroup, where the survival rate increased from 63.8% to 83%. The survival rate for the subgroup of 22–25 weeks of gestation improved from 35% to 54.5% in period II. In Romania, the viability limit is 24 weeks of gestation, but our unit has been proactively resuscitating from 22 weeks since 2016. During period II, the overall early death rate was lower, with the most significant decrease seen in the 26–28-week subgroup, where only 9.4% of infants died, compared to 21.8% in period I. Previously published literature on survival and short-term outcomes among EP infants has shown variable results due to variable proactive resuscitation of periviable infants. Survival rates in our study are slightly lower than those reported by Bell et al. (5), who conducted a study of a large cohort of infants with the same GA (78.3%). According to a study conducted by Higgins in California (2011–2019) on infants ≤ 28 weeks, the survival rate of infants increases with each week of gestation, ranging from 33% at 22 weeks to 90% at 28 weeks [27].
Improved perinatal care and resuscitation algorithms, according to the new 2015 and 2020 International Consensus on neonatal resuscitation [15,16] in period II of the study, have led to better outcomes for EP infants. The improvements include in-utero transfer, delayed cord clamping, targeted SpO2 to avoid high FiO2 administration, avoiding intubation and PPV in the delivery room, and using non-invasive nCPAP for alveolar recruitment. In the last reporting period, 87.2% of EP infants treated in our NICU were inborn, 61.1% received prenatal care, and 49.7% were delivered via C-section. Delayed umbilical cord clamping was documented only for 15.4% of EP infants, less than reported in other studies [5], although this procedure brings many benefits [28]. At 5 minutes, the Apgar score and cord pH were higher, while FiO2 (median 40%) and SpO2 at 5 minutes (80%) were lower during the second study period. Additionally, during period II, changes in resuscitation practice led to a 40% decrease in the use of endotracheal intubation (43.0%) and a 47% decrease in PPV (49.7%). Instead, nCPAP was used 2.75 times more often than in period I. We found that alveolar recruitment was significantly associated with survival, as was in-utero transfer. Our results were consistent with those of a recent study reporting that over half of newborns required intubation at birth, while the percentage of positive pressure ventilation without intubation was 22.9% [29].
During period II, the management of RDS was improved in accordance with updated guidelines. One of the key changes was the administration of high-dose early rescue surfactant through less invasive methods. Additionally, where possible, a non-invasive mode of ventilation was used, and lung protective ventilation was provided when needed. Mechanical ventilation was avoided as much as possible, and caffeine treatment was also utilized. The length of stay in the NICU was 22 days, longer in period II, which can be attributed to the lower gestational age of the infants.
During the second period studied, there was a significant rise in the use of surfactant replacement for RDS. Among EP infants, 89.3% received surfactant and 65.8% as early rescue administration. LISA was the preferred mode of surfactant replacement in 39.6% of infants, particularly in the 26–28 weeks subgroup. Consequently, the requirement for MV at 72 hours of life decreased from 98.3% to 58.4% in all EP infants. In the 26–28 weeks subgroup, the requirement decreased even further, to 38.3%. The mean duration of invasive ventilation was 259.4 ± 234.2 hours in period II, higher than in period I. Volume-targeted ventilation was utilized in 76.1% of the ventilated EP infants, while caffeine was administered to all infants.
Although there have been improvements in stabilizing infants in the delivery room and early management of RDS, BPD still affected a significant number of infants at 30.9% between 2018–2022. It is likely that the higher survival rates of infants born before 25 weeks of GA have contributed to this. However, we have observed a significant decrease in the frequency of BPD among infants born between 26–28 weeks of GA.
In our study, the frequency of all IVH and severe IVH decreased in period II among survivors of EP infants from 43.8% to 26.2% and from 30.6% to 14.1%, respectively. We did not observe any significant improvements in PVL (8.1%), NEC at all stages (22.8%), PDA (31.5%), sepsis/probable sepsis (21.5%), and ROP ≥2 (18.1%) rates between study periods. A Turkish study reported rates of severe IVH of 14.5%, severe NEC of 4.6%, PDA of 50.7%, late-onset sepsis of 24.0%, and severe ROP of 13.3% among ELBW infants between 2017 and 2021 [30].
The prevalence of the composite outcome (major neonatal morbidity ± death) in our study remained high, at 66.4%, although it decreased significantly compared to the first period.
Kaplan-Meyer survival curves clearly confirmed the improvements in survival, early survival (0–6 days of life), and survival without significant morbidities associated with continuous updates of the protocols for resuscitation at birth and care of EP with RDS. Multivariable Cox regression has shown differences in factors influencing the mortality rate in the two periods of study as different factors influenced the risk of death of EP born between 2008–2012 compared to those delivered between 2018–2022.
Our study has provided insight into the impact of improved strategies on early outcomes of EP infants, by offering an image of practice according to guidelines during two periods. It is important to note that the study has certain limitations. Specifically, the limited number of cases and few missing data about stillbirths may limit our ability to interpret the results. Nevertheless, the findings of the study provide valuable insights into the topic, at least for Romanian neonatology, but further multicentric research is needed to have a better overview of the outcomes of EP infants and to identify strategies for further improvements.
The significant improvement in the survival and mortality rate clearly indicates the efficacy of our actions and the progress we have made in ensuring a better outcome. It is important to consider the benefits of evidence-based strategies and protocols for the stabilization and management of RDS. By implementing these strategies, we can provide the best possible care for these fragile and at-risk populations of newborns, increasing their chances of survival with fewer complications. The future concerns of clinicians should be focused on the development of new strategies to approach preterm infants born at the limit of viability.
5. Conclusions
New guidelines for resuscitation and early management of respiratory distress syndrome have improved survival rates and short-term outcomes for EP infants born between 2018–2022 compared to 2008–2012. Training healthcare professionals and updated guidelines and protocols are crucial for better outcomes.
Author Contributions
Conceptualization, M.C. and M.L.O.; methodology, M.C.; software, R.M.; validation, M.C., M.S., R.M., M A-C., M.R., and M.L.O; formal analysis, M.C, and M.L.O.; investigation, M.C., M.S., M-A-C., M.R.; data curation, R.M. and M.R.; writing—original draft preparation, M.C.; writing—review and editing, M.C. and M.L.O.; visualization, M.A-C.; supervision, M.C.; project administration, M.C.;. All authors have read and agreed to the published version of the manuscript.
Funding
Please add: This research was funded by the University of Medicine, Pharmacy, Sciences and Technology George Emil Palade of Targu Mures, grant number 10126/3 17.12.2020.
Institutional Review Board Statement
The study was conducted in accordance with the Declaration of Helsinki and approved by the Ethics Committee of Targu Mures Clinical and Emergency County Hospital (protocol code 6799/15.03.2022).
Informed Consent Statement
Not applicable.
Data Availability Statement
The data presented in this study are available on request from the corresponding authors.
Conflicts of Interest
The authors declare no conflicts of interest. The funders had no role in the design of the study; in the collection, analyses, or interpretation of data; in the writing of the manuscript; or in the decision to publish the results.
References
- Kong X, Xu F, Wu R, et al. Neonatal mortality and morbidity among infants between 24 to 31 complete weeks: a multicenter survey in China from 2013 to 2014. BMC Pediatr. 2016;16(1):174. [CrossRef]
- Anderson JG, Baer RJ, Partridge JC, et al. Survival and Major Morbidity of Extremely Preterm Infants: A Population-Based Study. Pediatrics. 2016;138(1):e20154434. [CrossRef]
- Lundgren p, Morsin, E, Hård A-L, et al. National cohort of infants born before 24 gestational weeks showed increased survival rates but no improvement in neonatal morbidity. Acta Paediatr. 2022; 111: 1515– 1525.
- Siffel C, Hirst AK, Sarda SP, Kuzniewicz MW, Li DK. The clinical burden of extremely preterm birth in a large medical records database in the United States: Mortality and survival associated with selected complications. Early Hum Dev. 2022;171:105613. [CrossRef]
- Bell EF, Hintz SR, Hansen NI, et al; Eunice Kennedy Shriver National Institute of Child Health and Human Development Neonatal Research Network. Mortality, In-Hospital Morbidity, Care Practices, and 2-Year Outcomes for Extremely Preterm Infants in the US, 2013-2018. JAMA. 2022;327(3):248-263.
- Edstedt Bonamy AK, Zeitlin J, Piedvache A, et al. Epice Research Group. Wide variation in severe neonatal morbidity among very preterm infants in European regions. Arch Dis Child Fetal Neonatal Ed. 2019;104(1):F36-F45. [CrossRef]
- Perkins GD, Neumar R, Monsieurs KG, et al; International Liaison Committee on Resuscitation. The International Liaison Committee on Resuscitation-Review of the last 25 years and vision for the future. Resuscitation. 2017;121:104-116. [CrossRef]
- Kattwinkel J, Niermeyer S, Nadkarni V, et al. Resuscitation of the newly born infant: an advisory statement from the Pediatric Working Group of the International Liaison Committee on Resuscitation. Resuscitation. 1999;40(2):71-88. [CrossRef]
- Phillips B, Zideman D, Wyllie J, Richmond S, van Reempts P; European Resuscitation Council. European Resuscitation Council Guidelines 2000 for Newly Born Life Support. A statement from the Paediatric Life Support Working Group and approved by the Executive Committee of the European Resuscitation Council. Resuscitation. 2001;48(3):235-9. [CrossRef]
- International Liaison Committee on Resuscitation. The International Liaison Committee on Resuscitation (ILCOR) consensus on science with treatment recommendations for pediatric and neonatal patients: pediatric basic and advanced life support. Pediatrics. 2006;117(5):e955-77. [CrossRef]
- American Heart Association. 2005 American Heart Association (AHA) guidelines for cardiopulmonary resuscitation (CPR) and emergency cardiovascular care (ECC) of pediatric and neonatal patients: pediatric basic life support. Pediatrics. 2006;117(5):e989-1004. [CrossRef]
- Tan A, Schulze A, O'Donnell CP, Davis PG. Air versus oxygen for resuscitation of infants at birth. Cochrane Database Syst Rev. 200;2005(2):CD002273.
- Saugstad, OD. Oxygen toxicity at birth: the pieces are put together. Pediatr Res 2003; 789–783. [CrossRef]
- Saugstad OD, Vento M, Ramji S, Howard D, Soll RF. Neurodevelopmental outcome of infants resuscitated with air or 100% oxygen: a systematic review and meta-analysis. Neonatology. 2012;102(2):98-103. [CrossRef]
- Wyllie J, Bruinenberg J, Roehr CC, Rüdiger M, Trevisanuto D, Urlesberger B. European Resuscitation Council Guidelines for Resuscitation 2015: Section 7. Resuscitation and support of transition of babies at birth. Resuscitation. 2015 Oct;95:249-63.
- Aziz K, Lee CHC, Escobedo MB, et al. Part 5: Neonatal Resuscitation 2020 American Heart Association guidelines for cardiopulmonary resuscitation and emergency cardiovascular care. Pediatrics 2021;147(Suppl 1). e2020038505E. [CrossRef]
- Yamada NK, Szyld E, Strand ML, et al. American Heart Association and American Academy of Pediatrics. 2023 American Heart Association and American Academy of Pediatrics Focused Update on Neonatal Resuscitation: An Update to the American Heart Association Guidelines for Cardiopulmonary Resuscitation and Emergency Cardiovascular Care. Circulation. 2024;149(1):e157-e166. [CrossRef]
- Sweet D, Bevilacqua G, Carnielli V, et al. Working Group on Prematurity of the World Association of Perinatal Medicine; European Association of Perinatal Medicine. European consensus guidelines on the management of neonatal respiratory distress syndrome. J Perinat Med. 2007;35(3):175-86.
- Sweet DG, Carnielli VP, Greisen G, et al. European Consensus Guidelines on the Management of Respiratory Distress Syndrome: 2022 Update. Neonatology. 2023;120(1):3-23. [CrossRef]
- Jensen EA, Dysart K, Gantz, M.G. The diagnosis of bronchopulmonary dysplasia in very preterm infants: An evidence-based approach. Am. J. Respir. Crit Care Med. 2019;200: 751–759. [CrossRef]
- Engle WA; American Academy of Pediatrics Committee on Fetus and Newborn. Age terminology during the perinatal period. Pediatrics. 2004;114(5):1362-1364.
- Papile, LA, Burstein J, Burstein R, Koffler H. Incidence and evolution of subependymal and intraventricular hemorrhage: A study of infants with birth weights less than 1500 gm. J. Pediatr. 1978;92:529–534. [CrossRef]
- Bell MJ, Ternberg JL, Feigin RD, et al. Neonatal necrotizing enterocolitis. Therapeutic decisions based upon clinical staging. Ann. Surg. 1978; 187:1.
- Gillam-Krakauer M, Reese J. Diagnosis and Management of Patent Ductus Arteriosus. Neoreviews. 2018;19:e394–e402. [CrossRef]
- Hong EH, Shin YU, Cho H. Retinopathy of prematurity: a review of epidemiology and current treatment strategies. Clin Exp Pediatr. 2022;65(3):115-126. [CrossRef]
- Hayes R, Hartnett J, Semova G, et al. Infection, Inflammation, Immunology and Immunisation (I4) section of the European Society for Paediatric Research (ESPR). Neonatal sepsis definitions from randomised clinical trials. Pediatr Res. 2023;93(5):1141-1148.
- Higgins BV, Baer RJ, Steurer MA, Karvonen KL, Oltman SP, Jelliffe-Pawlowski LL, Rogers EE. Resuscitation, survival and morbidity of extremely preterm infants in California 2011-2019. J Perinatol. 2023 Sep 9.
- Fogarty M, Osborn DA, Askie L, et al. Delayed vs early umbilical cord clamping for preterm infants: a systematic review and meta-analysis. Am J Obstet Gynecol. 2018;218(1):1-18. [CrossRef]
- Yoon SJ, Lim J, Han JH et al. Impact of neonatal resuscitation changes on outcomes of very-low-birth-weight infants. Sci Rep. 2021;11:9003. [CrossRef]
- Kavurt S, Baş AY, İşleyen F, Durukan Tosun M, Ulubaş Işık D, Demirel N. Short-term outcomes of extremely low birth weight infants in a tertiary neonatal intensive care unit in Türkiye. Turk J Pediatr. 2023;65(3):377-386. [CrossRef]
Figure 1.
Study enrolment flow chart.
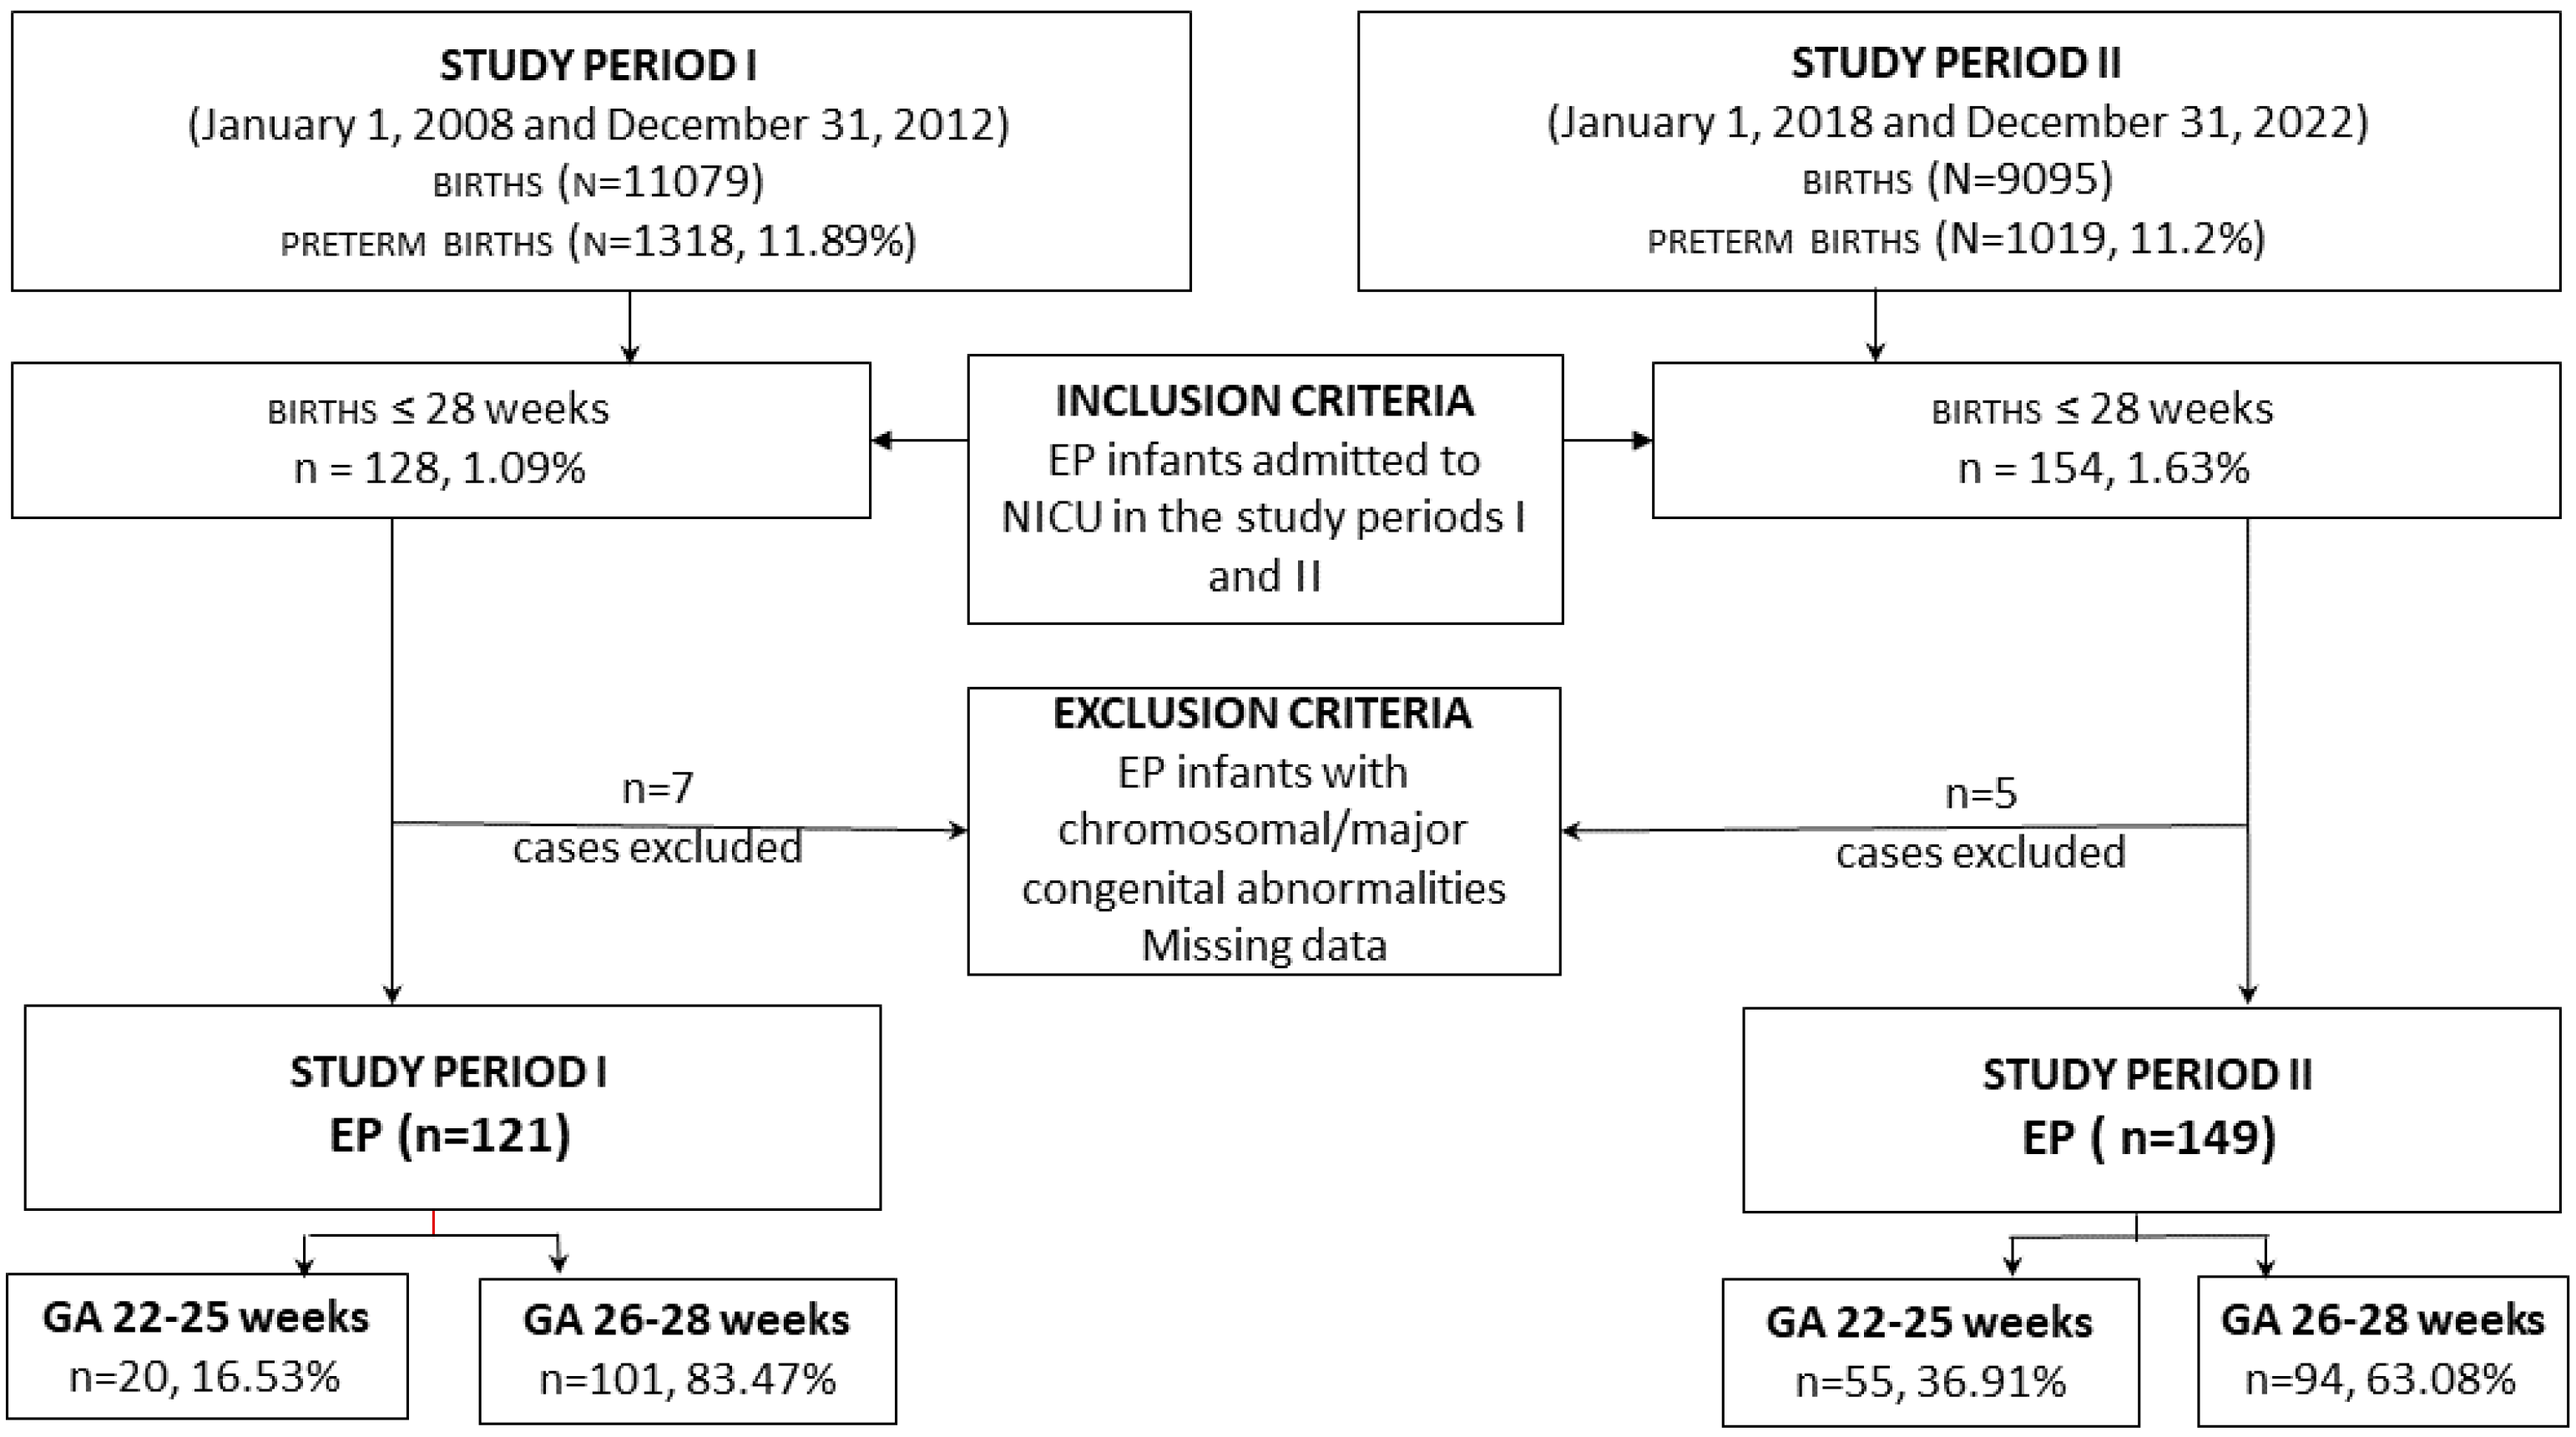
Figure 2.
Kaplan-Meier survival curves - survival rates compared between the study periods.
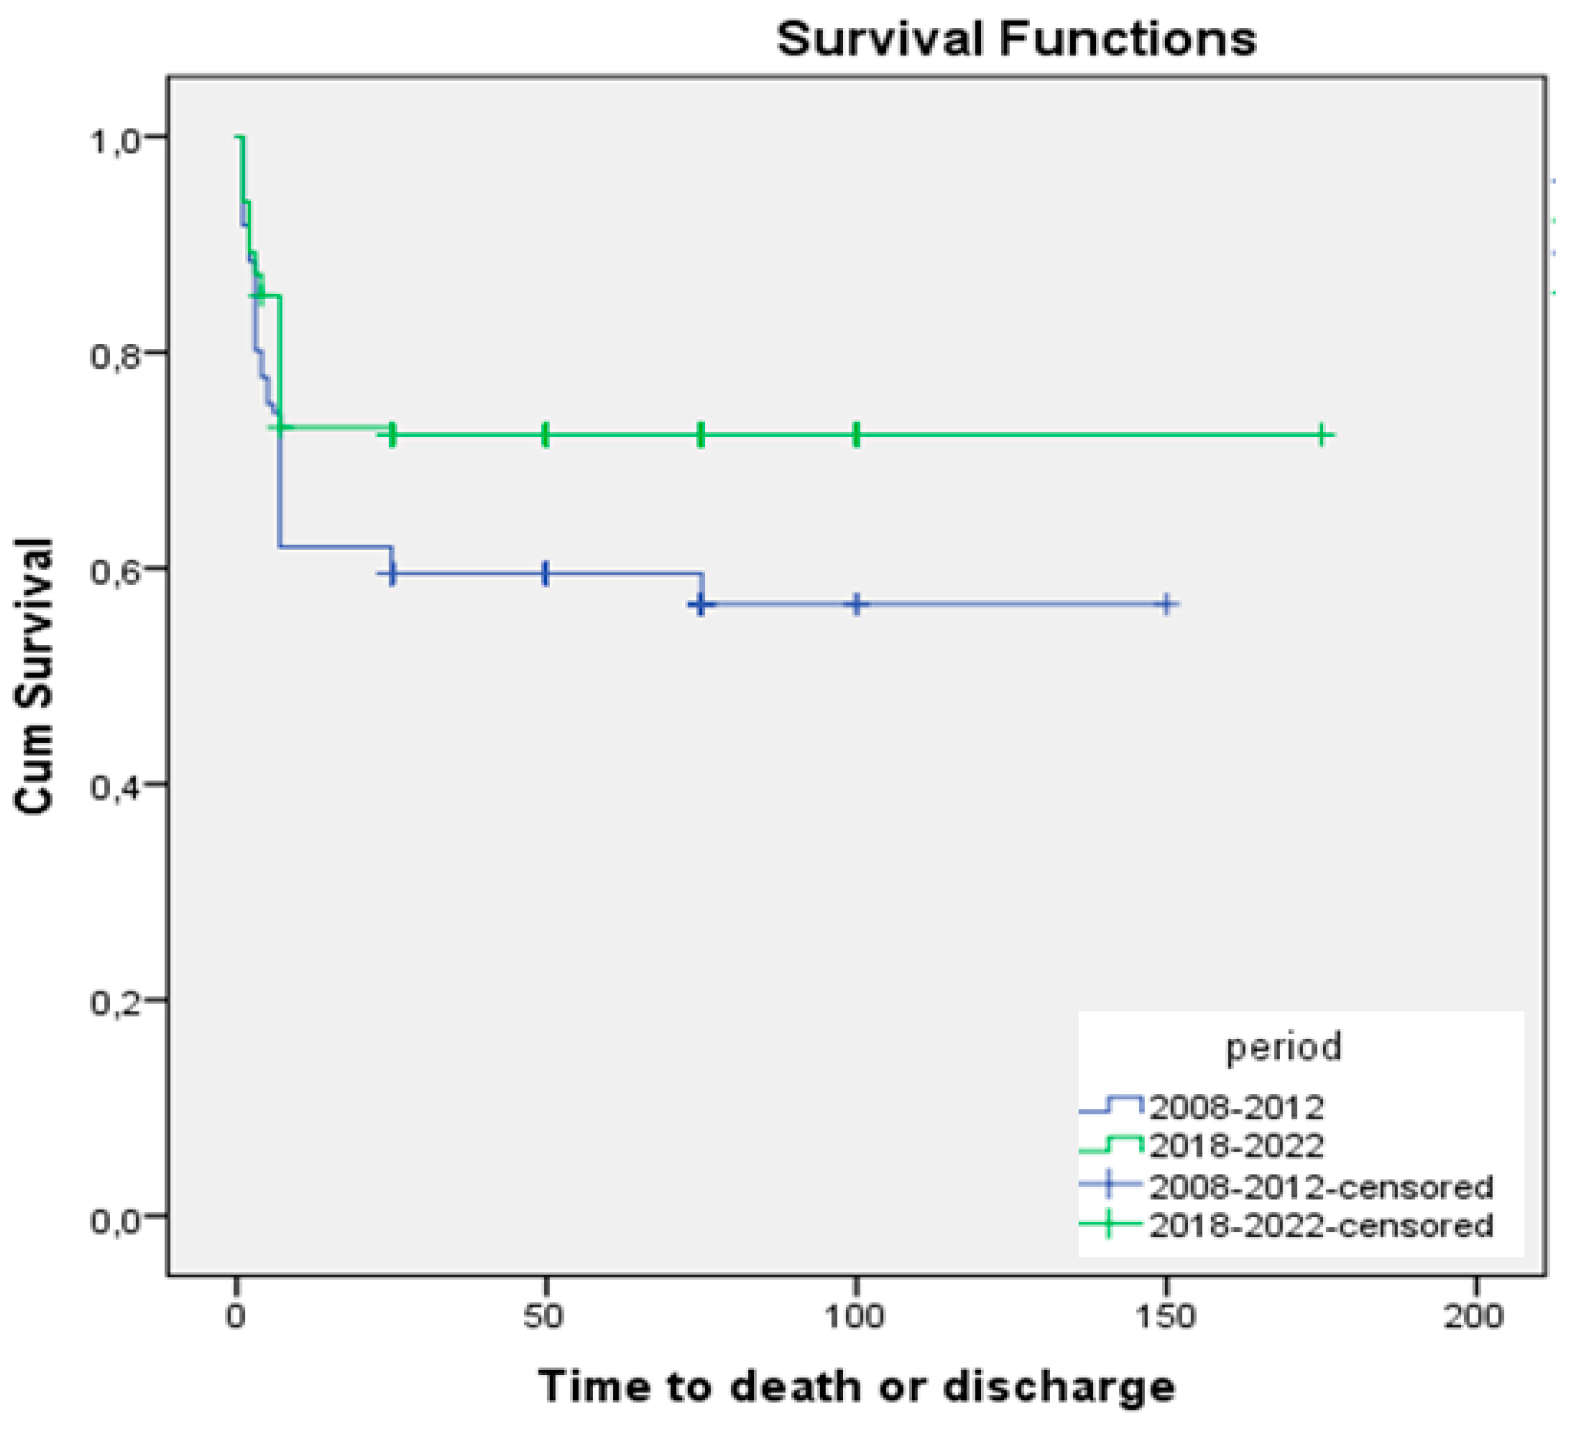
Figure 3.
Kaplan-Meier survival curves – early survival rates (0–6 days) compared between the study periods.
Figure 3.
Kaplan-Meier survival curves – early survival rates (0–6 days) compared between the study periods.
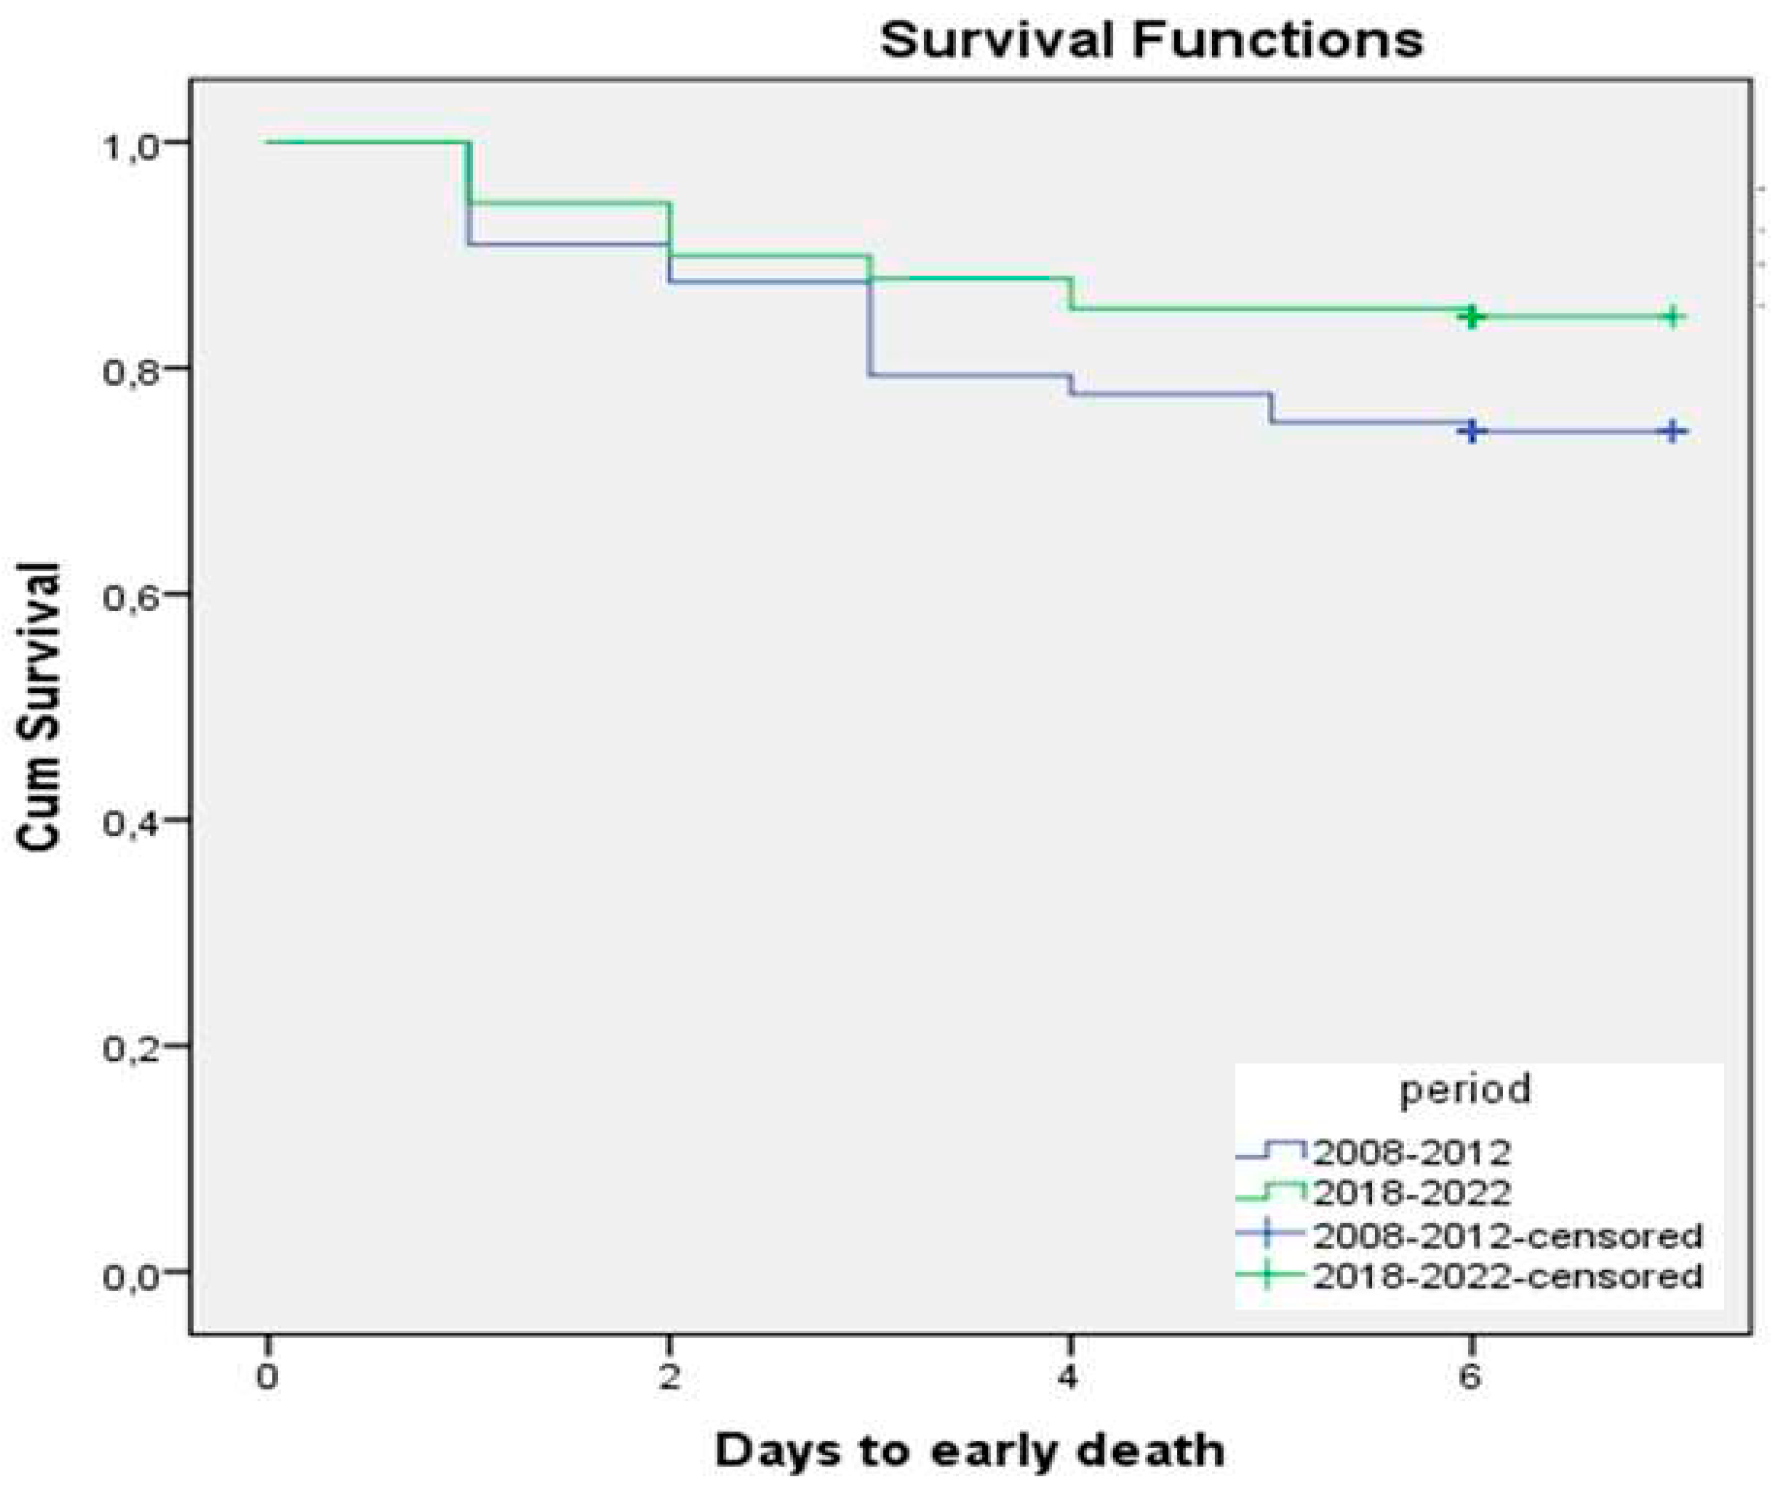
Figure 4.
Kaplan-Meier survival curves – survival free of significant morbidities compared between the study periods.
Figure 4.
Kaplan-Meier survival curves – survival free of significant morbidities compared between the study periods.
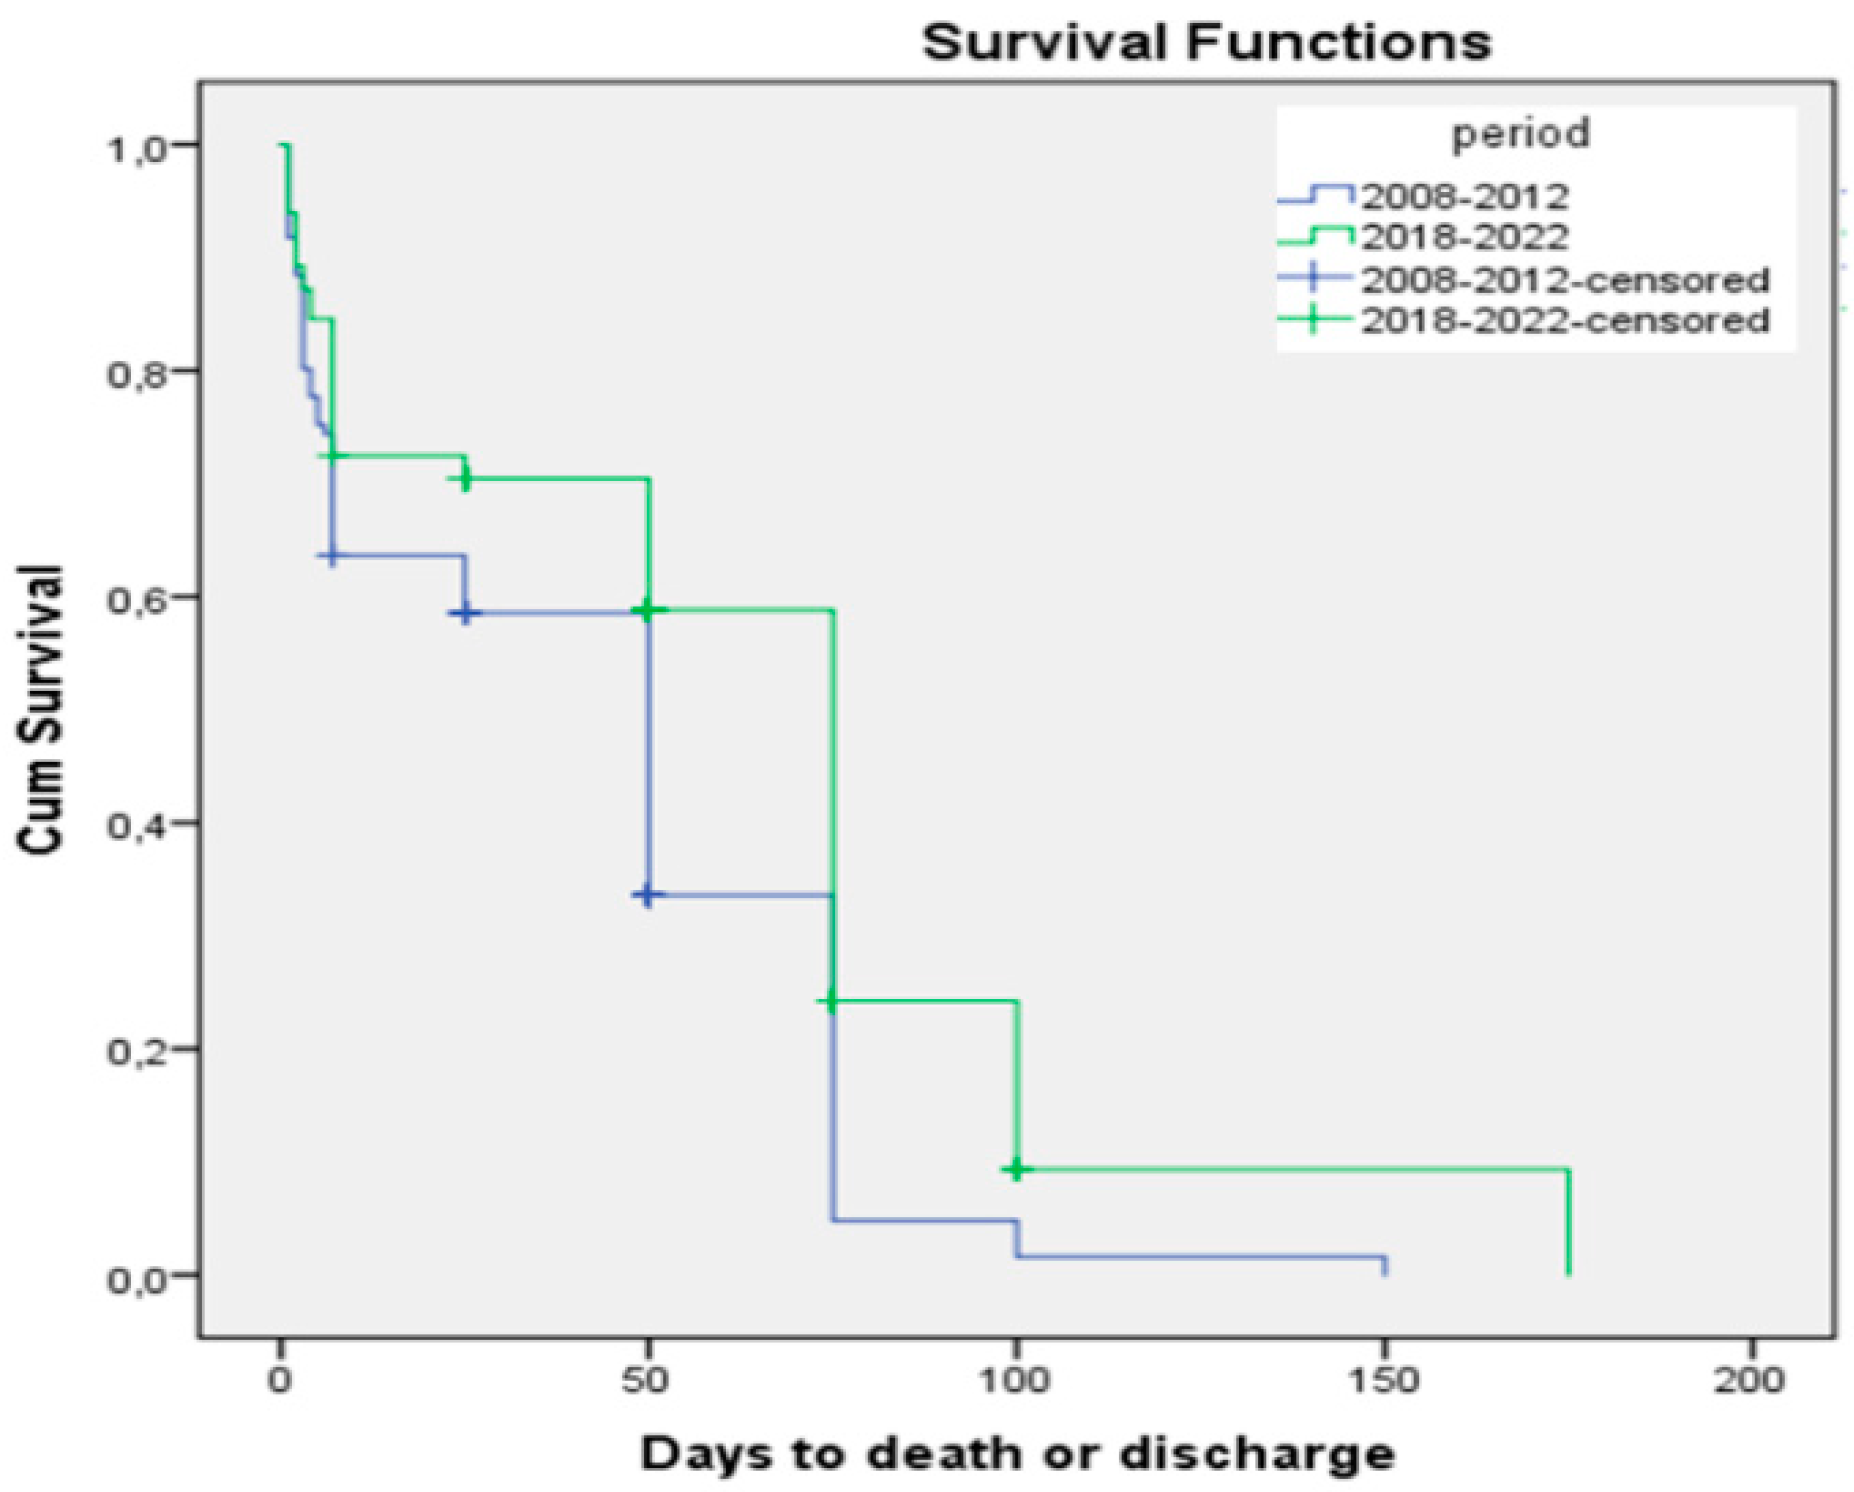
Figure 5.
ROC curves built using the mortality prediction models as evaluated by multivariable Cow regression: A for 2008–2012, B for 2012–2022.
Figure 5.
ROC curves built using the mortality prediction models as evaluated by multivariable Cow regression: A for 2008–2012, B for 2012–2022.
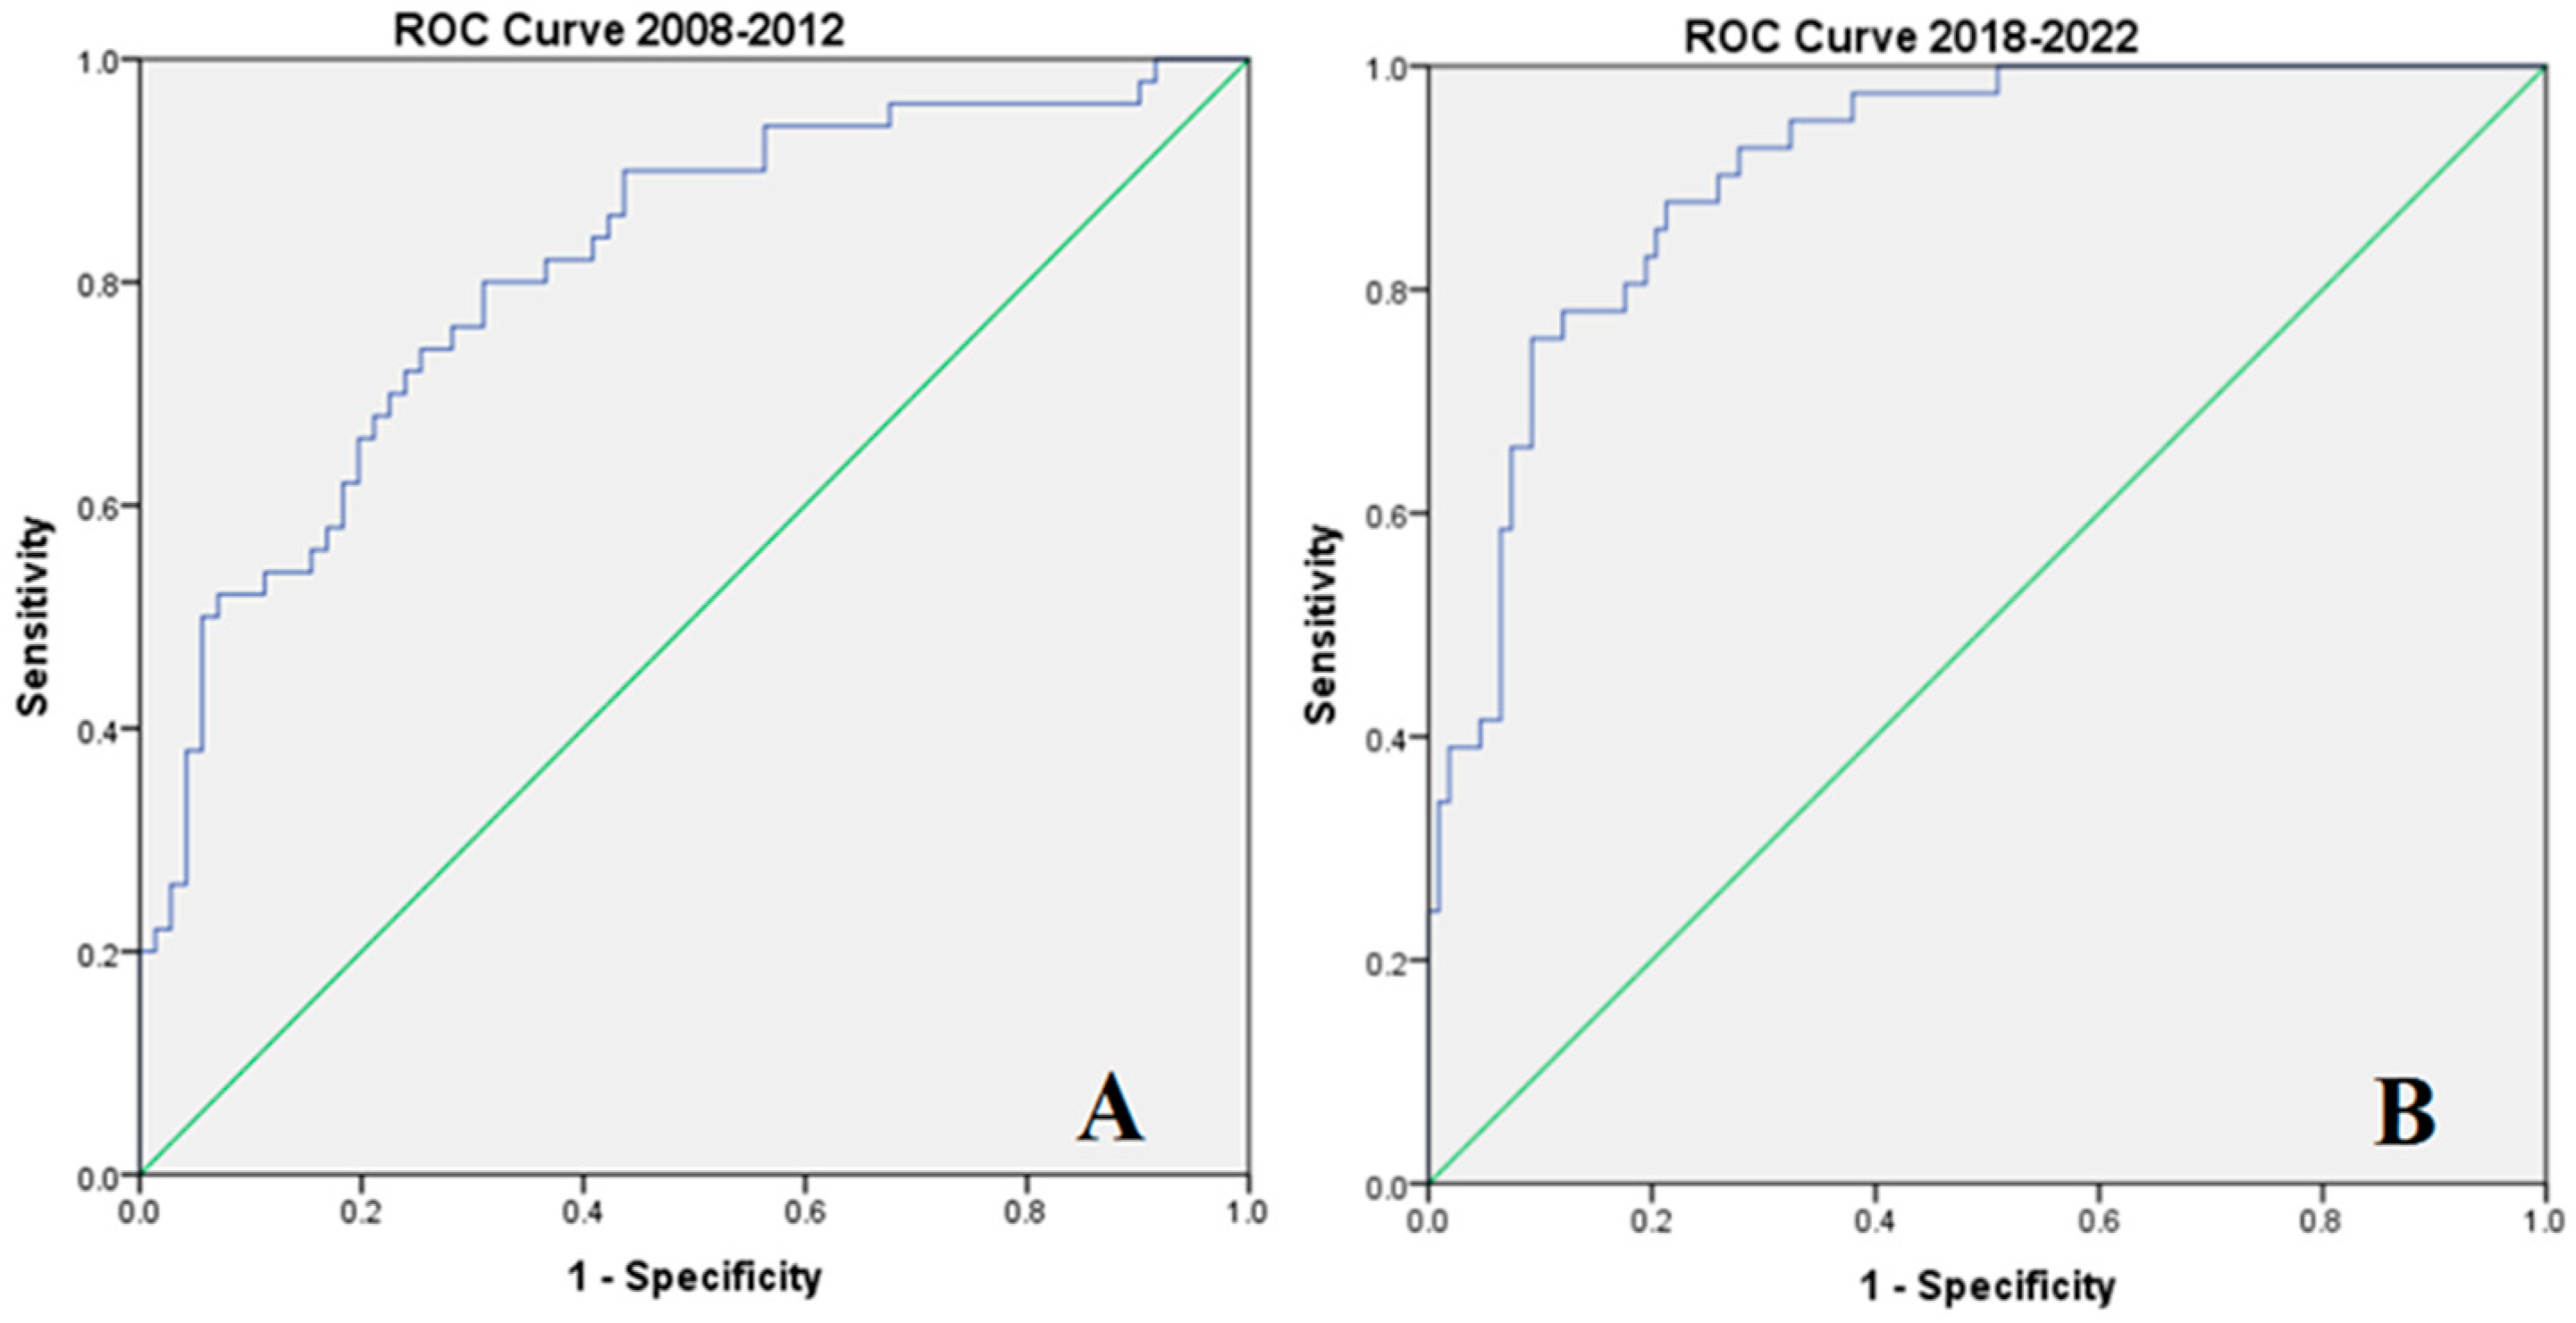

Table 2.
Essential differences between protocols in the studied periods.
| Period I (2008–2012) | Period II (2018–2022) | |
|---|---|---|
| Delivery room respiratory management | ||
| Neonatal resuscitation algorithm | 2005/2010 | 2015/2020 |
| Delayed cord clamping | No | In infants who do not require extensive resuscitation |
| FiO2 for initiating resuscitation | 100% (<100% since 2011) | 30–100% |
| SpO2 (%) at 5 min | No target SpO2 | Target SpO2 80–85% |
| PPV | Elective | Non-breathing preterm infants |
| nCPAP (alveolar recruitment) | No/yes, since 2012, PEEP 5 cmH2O | Yes, PEEP > 6 cm H2O |
| Intubation in the delivery room | Elective intubation | When needed |
| RDS management | ||
| Antenatal steroids | Yes | Yes |
| Surfactant prophylaxis | Yes | Only in the special situation |
| Rescue Surfactant | Yes | Early rescue - the first option |
| Dose of surfactant | 100–200 mg/kg | 200 mg/kg |
| Surfactant delivery | Conventional/INSURE | LISA/INSURE |
| nCPAP | after MV | First intention |
| MV modes | Conventional, HFOV | Lung protective ventilation TVT |
| Caffeine | No | Yes |
DCC: Delayed cord clamping; PPV: Positive Pressure Ventilation - bag and mask/T-piece resuscitator; HFOV: High-Frequency Oscillatory Ventilation; TTV: Targeted Tidal Volume; INSURE: INtubation-SURfactant administration-Extubation; LISA: Less Invasive Surfactant Administration.
Table 3.
Baseline demographic characteristics.
| Study Group (n = 270) | p‒value | OR | ||
|---|---|---|---|---|
| Period I 2008–2012 (n = 121) (n = 20; 22–25 w) (n = 101; 26–28 w) |
Period II 2018–2022 (n = 149) (n = 55; 22–25 w) (n = 94; 26–28 w) |
|||
|
Male (N/%)† 22–25 w 26–28 w |
51/42.1 6/30.0 45/44.6 |
86/57.7 32/58.2 54/57.4 |
0.011* 0.031* 0.773 |
1.41(1.08–1.85) 2.39 (1.03–2.56) 1.28 (0.98–1.89) |
|
GA, weeks median (IQR) ‡ 22–25 w 26–28 w |
27 (26–28) 25 (25–25) 27 (26–28) |
26 (25–27.5) 24 (24–25) 27 (26–28) |
<0.001* <0.001* 0.814 |
- |
|
BW, g, median (IQR) ‡ 22–25 w 26–28 w |
880 (750–960) 650 (512.5–797.5) 900 (800–980) |
800 (650–990) 620 (590–700) 950 (800–1000) |
0.114 0.488 0.190 |
- |
|
SGA, (N/%) † 22–25 w 26–28 w |
20/16.5 6/30.0 14/13.9 |
18/12.1 1/1.8 17/18.1 |
0.298 <0.001* 0.423 |
0.83 (0.59–1.16) 0.24 (0.14–0.42) 1.17 (0.78–1.78) |
|
Singleton (N/%)† 22–25 w 26–28 w |
113/93.4 18/90.0 95/94.1 |
126/84.6 43/78.2 83/88.3 |
0.024* 0.251 0.156 |
0.38 (0.17–0.90) 0.48 (0.13–185) 0.66 (0.34–1.28) |
|
Outborn (N/%)† 22–25 w 26–28 w |
28/23.1 1/5.0 27/26.7 |
19/12.8 3/5.5 16/17.0 |
0.025* 0.939 0.103 |
0.69 (0.48–0.99) 1.02 (0.57–1.83) 0.72 (0.48–1.10) |
|
Inborn (N/%)† 22–25 w 26–28 w |
93/76.9 19/95.0 74/73.3 |
130/87.2 52/94.5 78/83.0 |
0.025* 0.939 0.103 |
1.43 (1.08–1.89) 0.94 (0.16–5.32) 1.29 (0.97–1.71 |
|
Prenatal care (N/%)† 22–25 w 26–28 w |
17/14.0 4/20.0 13/12.9 |
91/61.1 27/49.4 64/68.1 |
<0.001* 0.024* <0.001* |
4.08(2.60–6.40) 2.82(1.04–7.62) 4.42(2.66–7.33) |
|
Maternal hypertension (N/%)† 22–25 w 26–28 w |
32/26.4 8/40.0 24/23.8 |
13/8.7 2/3.6 11/11.7 |
<0.001* <0.001* 0.028* |
0.56(0.43–0.71) 0.23(0.13–0.42) 0.70(0.53–0.92) |
|
Maternal diabetes (N/%)† 22–25 w 26–28 w |
6/5.0 1/5.0 5/5.0 |
4/2.7 0/0 4/4.3 |
0.327 0.098 0.818 |
0.72(0.44–1.24) - 0.93(0.51–1.69) |
|
Chorioamnionitis (N/%)† 22–25 w 26–28 w |
10/8.3 4/20.0 6/5.9 |
15/10.1 7/12.7 8/8.6 |
0.601 0.438 0.477 |
1.14(0.69–1.87) 0.67(0.28–1.67) 1.23 (0.66–2.29) |
|
Prenatal steroids (N/%)† 22–25 w 26–28 w |
66/54.5 11/55.0 55/54.5 |
91/61.1 32/58.2 59/62.8 |
0.281 0.809 0.242 |
1.16 (0.89–1.51) 1.10 (0.52–2.33) 1.18 (0.90–1.54) |
|
Tocolysis (N/%)† 22–25 w 26–28 w |
17/14.0 5/25.0 12/11.9 |
26/17.4 10/18.2 16/17.0 |
0.450 0.520 0.339 |
1.16 (0.78–1.72) 0.75 (0.32–1.73) 1.24 (0.79–1.95) |
|
PROM > 18 hours (N/%)† 22–25 w 26–28 w |
35/28.9 5/25.0 30/29.7 |
45/30.2 19/34.5 26/27.7 |
0.820 0.440 0.754 |
1.03 (0.77–1.39) 1.41 (0.58–3.43) 0.95 (0.71–1.28) |
|
Vaginal delivery (N/%)† 22–25 w 26–28 w |
81/66.9 13/65.0 68/67.3 |
75/50.3 26/47.3 49/52.1 |
0.006* 0.179 0.030* |
0.67 (0.50–0.90) 0.58 (0.26–1.30) 0.73 (0.54–0.98) |
Continuous variables were expressed as: median (IQR); categorical variables: number (%); n: number; w: weeks; GA: gestational age; BW: birth weight; SGA: small for gestational age; PROM: preterm rupture of membranes; † Chi-square test; IQR: interquartile range; ‡ Mann Whitney U Test; * Marked effects are significant at p < 0.05.
Table 4.
Delivery room stabilization.
| Study Group (n = 270) | p‒value | OR | ||
|---|---|---|---|---|
| Period I 2008–2012 (n = 121) (n = 20; 22–25 w) (n = 101; 26–28 w) |
Period II 2018–2022 (n = 149) (n = 55; 22–25 w) (n= 94; 26–28 w) |
|||
|
DCC (N/%)† 22–25 w 26–28 w |
0/0 0/0 0/0 |
23/15.4 4/7.3 19/20.2 |
<0.001* 0.331 <0.001* |
- |
|
Apgar score 5 min, median (IQR) ‡ 22–25 w 26–28 w |
7 (5–8) 6.5 (6.25–7) 7 (6–8) |
7 (5–8) 5 (4–7) 7.5 (6–8) |
0.883 0.513 0.020* |
- |
|
Cord pH median (IQR) ‡ 22–25 w 26–28 w |
7.21 (6.98–7.30) 7.23 (6.98–7.28) 7.19 (6.98–7.31) |
7.27 (7.12–7.32) 7.21 (7.10–7.28) 7.29 (7.21–7.33) |
0.002* 0.871 <0.001* |
- |
|
FiO2 (%), median (IQR) ‡ 22–25 w 26–28 w |
100 (50–100) 100 (40–100) 100 (50–100) |
40 (30–100) 77.5 (40–100) 40 (30–60) |
<0.001* 0.409 <0.001* |
- |
|
SpO2 (%) 5 min, median (IQR) ‡ 22–25 w 26–28 w |
83 (77.5–88) 80 (69–87.5) 83 (78–88) |
80 (70–86) 75 (67–80) 82 (77.5–88) |
0.004* 0.017* 0.541 |
- |
|
nCPAP ≥ 6cmH2O (N/%)† 22–25 w 26–28 w |
23/19.0 3/15.0 20/19.8 |
83/55.7 20/36.4 63/67.0 |
<0.001* 0.078 <0.001* |
2.75 (1.87–4.03) 2.51 (0.81–7.72) 3.00 (2.01–4.47) |
|
PPV (N%)† 22–25 w 26–28 w |
90/74.4 18/90.0 72/71.3 |
74/49.7 45/81.8 29/30.9 |
<0.001* 0.400 <0.001* |
0.53 (0.38–0.74) 0.58 (0.16–2.19) 0.43 (0.31–0.60) |
|
Intubation (delivery room) (N/%)† 22–25 w 26–28 w |
79/65.3 20/100.0 59/58.4 |
64/43.0 42/76.4 22/23.4 |
<0.001* 0.016* <0.001* |
0.60 (0.45–0.80) - 0.51(0.38–0.67) |
|
HGB (g/dl) at birth median (IQR) ‡ 22–25 w 26–28 w |
15.2 (14.2–16.45) 14.8 (13.65–17.07) 15.3 (14.3–16.45) |
15.5 (14.7–16.65) 15.8 (14.7–16.8) 15.4 (14.67–16.5) |
0.058 0.097 0.346 |
- |
Continuous variables were expressed as: median (IQR); categorical variables: number (%); n: number; w: weeks; PPV: positive pressure ventilation; DCC: delayed cord clamping; HGB: Hemoglobin; † Chi-square test; IQR: interquartile range; ‡ Mann Whitney U Test; * Marked effects are significant at p < 0.05.
Table 5.
RDS management.
| Study Group (n = 270) | p-value | OR | ||
|---|---|---|---|---|
| Period I 2008–2012 (n = 121) (n = 20; 22–25 weeks) (n = 101; 26–28weeks) |
Period II 2018–2022 (n = 149) (n = 55; 22–25 weeks) (n= 94; 26–28weeks) |
|||
| Surfactant | ||||
|
Surfactant dose (mg/kg), median (IQR)‡ 22–25 w 26–28 w |
100 (100–120) 120 (100–120) 100 (100–120) |
200 (200–200) 200 (200–200) 200 (200–200) |
<0.001* <0.001* <0.001* |
- |
|
Surfactant administration (N/%)† 22–25 w 26–28 w |
67/55.4 9/45.0 58/57.4 |
133/89.3 54/98.2 79/84.0 |
<0.001* <0.001* <0.001* |
2.30 (1.82–2.91) 6.42 (3.42–12.03) 1.75 (1.37–2.24) |
|
Surfactant prophylaxis (N/%)† 22–25 w 26–28 w |
25/20.7 6/30.0 19/18.8 |
35/23.5 18/32.7 17/18.1 |
0.580 0.826 0.897 |
1.10 (0.79–1.53) 1.10 (0.48–2.50) 0.98 (0.69–1.38) |
|
Rescue Surfactant (N/%)† 22–25 w 26–28 w |
42/34.7 3/15.0 39/38.6 |
98/65.8 36/65.5 62/66.0 |
<0.001* <0.001* <0.001* |
2.03 (1.52–2.70) 6.14 (1.96–19.21) 1.71 (1.28–2.27) |
|
Conventional surfactant (N/%)† 22–25 w 26–28 w |
49/40.5 6/30.0 43/42.6 |
48/32.2 36/65.5 12/12.8 |
0.160 0.006* <0.001* |
0.82 (0.63–1.07) 2.97 (1.28–6.88) 0.53 (0.42–0.67) |
|
INSURE (N/%)† 22–25 w 26–28 w |
18/14.9 3/15.0 15/14.9 |
26/17.4 8/14.5 18/19.1 |
0.571 0.961 0.426 |
1.11 (0.76–1.63) 0.97 (0.34–2.78) 1.17 (0.78–1.74) |
|
LISA (N/%)† 22–25 w 26–28 w |
0/0 0/0 0/0 |
59/39.6 10/18.2 49/52.1 |
<0.001* 0.041* <0.001* |
- - - |
|
Caffeine (N/%)† 22–25 w 26–28 w |
0/0 0/0 0/0 |
149/100.0 55/100.0 94/100.0 |
<0.001 <0.001 <0.001 |
- - - |
| Mechanical ventilation strategies | ||||
|
Need of MV at 72 h (N/%)† 22–25 w 26–28 w |
119/98.3 20/100.0 99/98.0 |
87/58.4 51/92.7 36/38.3 |
<0.001 0.221 <0.001 |
0.05 (0.01–0.21) - 0.04 (0.01–0.18) |
|
SIMV(N/%)† 22–25 w 26–28 w |
69/58.0 10/50.0 59/59.6 |
49/55.7 20/39.2 28/32.2 |
0.742 0.415 0.042 |
- |
|
HFOV (N/%)† 22–25 w 26–28 w |
50/42.0 10/50.0 40/40.4 |
39/44.3 31/60.8 8/21.6 |
0.742 0.415 0.042 |
1.04 (0.82–1.32) 1.37 (0.65–2.86) 0.80 (0.66–0.98) |
|
VTV (N/%)† 22–25 w 26–28 w |
0/0 0/0 0/0 |
67/76.1 44/86.3 23/62.2 |
<0.001* <0.001* <0.001* |
- |
|
Duration of MV, hours, median (IQR)‡ 22–25 w 26–28 w |
148 (49–345) 48 (17–172) 196 (73–372) |
220 (72–408) 312 (90–480) 124.5 (35.2–238.5) |
0.299 0.001* 0.072 |
- |
w: weeks; SIMV: Synchronized Intermittent Mandatory Ventilation; HFOV: High-Frequency Oscillatory Ventilation; VTV: Volume-targeted ventilation; INSURE: INtubation-SURfactant-Extubation; LISA: Less Invasive Surfactant Administration; Continuous variables were expressed as: median (IQR); categorical variables: number (%); n: number; IQR: interquartile range; † Chi-square test; IQR: interquartile range; ‡ Mann Whitney U Test; * Marked effects are significant at p < 0.05.
Table 6.
Short-term outcomes and mortality – comparison between the study groups.
| . | Study Group (n = 270) | p-value | OR | |
|---|---|---|---|---|
| 2008–2012 (n = 121) (n = 20; 22–25 w) (n = 101; 26–28w) |
2018–2022 (n = 149) (n = 55; 22–25 w) (n = 94; 26–28w) |
|||
| PTX, n (%) 22–25 w 26–28 w |
13/10.7 2/10.0 11/10.9 |
8/5.4 4/7.3 4/4.3 |
0.102 0.705 0.083 |
0.70 (0.49–1.01) 0.78 (0.27–2.60) 0.68 (0.49–0.96) |
| BPD, n (%) 22–25 w 26–28 w |
41/33.9 4/20.0 37/36.6 |
46/30.9 24/43.6 22/23.4 |
0.600 0.063 0.045* |
0.93 (0.70–1.22) 2.38 (0.88–6.42) 0.75 (0.57–0.98) |
| NEC, n (%) 22–25 w 26–28 w |
21/17.4 4/20.0 17/16.8 |
34/22.8 15/27.3 19/20.2 |
0.269 0.528 0.546 |
1.22 (0.84–1.76) 1.36 (0.52–3.56) 1.12 (0.77–1.63) |
| IVH all, n (%) 22–25 w 26–28 w |
53/43.8 13/65.0 40/39.6 |
39/26.2 23/41.8 16/17.0 |
0.002* 0.077 <0.001* |
0.66 (0.51–0.86) 0.50 (0.22–1.11) 0.61 (0.48–0.79) |
| IVH grade 1–2, n (%) 22–25 w 26–28 w |
16/13.2 3/15.0 13/12.9 |
18/12.1 6/10.9 12/12.8 |
0.779 0.635 0.983 |
0.94 (0.64–1.39) 0.77 (0.28–2.12) 0.99 (0.66–1.49) |
| IVH grade 3 – 4 (severe), n (%) 22–25 w 26–28 w |
37/30.6 10/50.0 27/26.7 |
21/14.1 17/30.9 4/4.3 |
0.001* 0.131 <0.001* |
0.62 (0.48–0.80) 0.56 (0.27–1.18) 0.52 (0.42–0.64) |
| PVL, n (%) 22–25 w 26–28 w |
17/14.0 3/15.0 14/13.9 |
12/8.1 4/7.3 8/8.5 |
0.114 0.316 0.240 |
0.74 (0.52–1.03) 0.58 (0.23–1.51) 0.79 (0.56–1.12) |
| PDA, n (%) 22–25 w 26–28 w |
52/43.0 8/40.0 44/43.6 |
47/31.5 16/29.1 31/33.0 |
0.053 0.377 0.130 |
0.77 (0.59–0.99) 0.71 (0.33–1.50) 0.81 (0.62–1.06) |
| Sepsis/probable sepsis, n (%) 22–25 w 26–28 w |
33/27.3 7/35.0 26/25.7 |
32/21.5 13/23.6 19/20.2 |
0.270 0.332 0.362 |
0.85 (0.63–1.13) 0.67 (0.31–1.45) 0.86 (0.64–1.16) |
| ROP≥2 n (%) 23–25 w 26–28 w |
22/18.2 5/25.0 17/16.8 |
27/18.1 16/29.1 11/11.7 |
0.990 0.731 0.310 |
0.99 (0.71–1.41) 1.17 (0.48–2.81) 0.83 (0.59–1.16) |
| NICU, days, median (IQR) † 22–25 w 26–28 w |
16 (5.5–26) 8.5 (2.25–30.25) 17 (7–26) |
22 (14–32) 24 (10–35) 22 (15–31) |
0.002* 0.082 0.005* |
- |
| Deaths, n (%) 22–25 w 26–28 w |
50/41.3 13/65.0 37/36.2 |
41/27.5 25/45.5 16/17.0 |
0.017* 0.138 0.002* |
0.72 (0.56–0.94) 0.55 (0.25–1.23) 0.65 (0.50–0.83) |
| Early death (0–6 days) (n/%) 22–25 w 26–28 w |
31/25.6 9/45.0 22/21.8 |
23/15.4 14/25.5 9/9.6 |
0.038* 0.107 0.020* |
0.73 (0.55–0.96) 0.54 (0.26–1.12) 0.68 (0.51–0.89) |
| Composite outcome (N/%) 22–25 w 26–28 w |
97/80.2 18/90.0 79/78.2 |
99/66.4 49/89.1 50/53.2 |
0.012* 0.912 <0.001* |
0.65(0.46–0.94) 0.93 (0.26–3.29) 0.68 (0.51–0.89) |
Continuous variables were expressed as median (IQR); categorical variables: number (%); n: number; w: weeks; PTX: pneumothorax; BPD: bronchopulmonary dysplasia; NEC: necrotizing enterocolitis; IVH: intraventricular hemorrhage; PVL: periventricular leukomalacia; PDA: patent ductus arteriosus; ROP: retinopathy of prematurity; NICU: Neonatal Intensive Care Unit; Composite outcome = death or IVH grade 3–4 ± LPV ± BPD ± NEC ± severe ROP (≥2); IQR: interquartile range; † Mann Whitney U Test ‡ Chi-square test; * Marked effects are significant at p < 0.05.
Table 7.
Kaplan-Meier curves – statistical results - survival rates compared between the study periods.
Table 7.
Kaplan-Meier curves – statistical results - survival rates compared between the study periods.
| Period | N of deaths/N of cases | Mean ± SD (95% CI) | Median ± SD (95% CI) | Chi-square | p |
|---|---|---|---|---|---|
| 2008–2012 | 50/121 | 89.3 ± 6.6 (76.3–102.3) | 59.0 ± 2.2 (54.8–63.2) | 5.782 | 0.016 |
| 2018–2022 | 41/149 | 127.9 ± 6.2 (115.7–140.2) | 64.0 ± 3.1 (57.8–70.2) |
Table 8.
Kaplan-Meier curves – statistical results - early survival rates (0–6 days) compared between the study periods.
Table 8.
Kaplan-Meier curves – statistical results - early survival rates (0–6 days) compared between the study periods.
| Period | No of deaths/No of cases | Mean ± SD (95% CI) | Chi-square | p |
|---|---|---|---|---|
| 2008–2012 | 31/121 | 5.8 ± 0.2 (5.5–6.2) | 4.176 | 0.041 |
| 2018–2022 | 23/149 | 6.3 ± 0.1 (6.0–6.6) |
Table 9.
Kaplan-Meier curves – statistical results - survival rates without significant risk for neurodevelopmental impairment in long-term.
Table 9.
Kaplan-Meier curves – statistical results - survival rates without significant risk for neurodevelopmental impairment in long-term.
| Period | N of EP with composite outcome/N of cases | Mean ± SD (95% CI) | Median ± SD (95% CI) | Chi-square | p |
|---|---|---|---|---|---|
| 2008–2012 | 97/121 | 42.4 ± 3.3 (36.0–48.8) | 50.0 ± 4.5 (41.1–58.89) | 17.403 | 0.00003 |
| 2018–2022 | 99/149 | 64.6 ± 4.7 (55.3–74.0) | 75.0 ± 3.2 (68.8–81.2) |
Table 10.
Results of the multivariable Cox regression.
| 2008–2012 period | 2012–2022 period | |||||
|---|---|---|---|---|---|---|
| p | 95.0% CI | p | 95 % CI | |||
| Lower | Upper | Lower | Upper | |||
| GA | 0.643 | 0.746 | 1.608 | 0.744 | 0.691 | 1.303 |
| BW | 0.037* | 0.995 | 1.000 | 0.955 | 0.998 | 1.002 |
| Prenatal steroids | 0.005* | 1.315 | 4.790 | 0.131 | 0.846 | 3.616 |
| Outborn | 0.042* | 0.161 | 0.969 | 0.142 | 0.060 | 1.499 |
| Vaginal delivery | 0.593 | 0.600 | 2.444 | 0.318 | 0.716 | 2.798 |
| Apgar at 5minute | 0.206 | 0.943 | 1.313 | 0.494 | 0.736 | 1.159 |
| Alveolar recruitment | 0.749 | 0.439 | 3.142 | 0.006* | 1.458 | 9.665 |
| Intubation at birth | 0.491 | 0.562 | 3.317 | 0.172 | 0.688 | 8.139 |
| Surfactant | 0.129 | 0.001 | 2.476 | 0.031* | 0.001 | 0.730 |
| Severe IVH | 0.001* | 0.130 | 0.609 | 0.133 | 0.223 | 1.219 |
| BPD | 0.000* | 3.356 | 26.648 | 0.000* | 6.017 | 79.616 |
| NEC | 0.061 | 0.964 | 4.980 | 0.015* | 1.197 | 5.401 |
| Surfactant dose | 0.145 | 0.942 | 1.009 | 0.031* | 0.971 | 0.999 |
| AUC | 0,811 + /-0,040 | 0,733 | 0,889 | 0.907+/-0.024 | 0.859 | 0.955 |
| Chi-square | 97,609 | 122.368 | ||||
| p | <0.001 | <0.001 | ||||
Legend: AUC – area under curve; *Marked effects are significant at p < 0.05.
Disclaimer/Publisher’s Note: The statements, opinions and data contained in all publications are solely those of the individual author(s) and contributor(s) and not of MDPI and/or the editor(s). MDPI and/or the editor(s) disclaim responsibility for any injury to people or property resulting from any ideas, methods, instructions or products referred to in the content. |
© 2024 by the authors. Licensee MDPI, Basel, Switzerland. This article is an open access article distributed under the terms and conditions of the Creative Commons Attribution (CC BY) license (http://creativecommons.org/licenses/by/4.0/).
Copyright: This open access article is published under a Creative Commons CC BY 4.0 license, which permit the free download, distribution, and reuse, provided that the author and preprint are cited in any reuse.


