1. Introduction
Allergic diseases driven by IgE-mediated type-I hypersensitivity have become a major global health challenge, with food allergy prevalence reaching 8–10% in children and 3–6% in adults in Westernized countries [
1,
2]. For egg allergy, it most commonly presents in infancy with a prevalence of about 2% in children and 0.1% in adults [
3].
Allergic sensitisation is the first stage in developing an allergy. The critical step in allergic sensitisation is the aberrant activation of naïve CD4⁺ T cells by professional antigen-presenting cells, particularly dendritic cells (DCs), resulting in Th2 polarisation characterised by IL-4, IL-5, and IL-13 secretion, IgE class-switching, and subsequent binding to mast cells and basophils [
4,
5]. Naïve T-cell priming classically requires three signals: T-cell receptor recognition of peptide–MHC-II complexes (signal 1), co-stimulation (primarily CD80/CD86–CD28) (signal 2), and polarising cytokines that dictate lineage commitment (signal 3) [
6].
However, intercellular communication in immunity extends well beyond direct cell–cell contact and cytokines. Extracellular vesicles (EVs), a heterogeneous family of lipid-enclosed particles ranging from 30 to 1000 nm, are now established as important carriers of bioactive cargo including proteins, lipids, mRNAs, miRNAs, and intact MHC–peptide complexes [
7,
8,
9]. Dendritic cells constitutively release EVs, and their biogenesis, cargo loading, and surface composition are profoundly modulated by maturation status and environmental stimuli such as pathogen-associated molecular patterns (e.g., lipopolysaccharide, LPS) or allergens [
10,
11,
12]. Numerous murine and human studies have demonstrated that DC-derived EVs can transfer allergen or MHC–allergen complexes to T cells and promote Th2-skewed responses. For instance, EVs from DCs can carry major cat allergen Fel d 1 and induce allergic immune response[
13]. These findings have led to the hypothesis that EVs may function as an autonomous “signal 3” or amplify classical priming pathways during allergic sensitisation [{Gutiérrez-Vázquez, 2013 #360] [
14]].
Despite substantial progress, several methodological limitations have prevented definitive conclusions regarding the specific contribution of human DC-derived EVs to allergy. Most functional studies have relied on differential ultracentrifugation, which co-isolates soluble proteins, immune complexes, and lipoproteins that independently affect T-cell responses [
15,
16]. Residual cytokines frequently co-purified with EVs can mask vesicle-specific effects. Many assays have employed total or memory CD4⁺ T cells rather than rigorously purified naïve populations, making it difficult to distinguish genuine sensitisation from recall responses. Furthermore, prolonged DC culture in serum-containing media introduces substantial bovine EV contamination, breaking current MISEV guidelines [
7,
17]. Finally, direct comparative studies between healthy individuals and patients with confirmed allergy using cytokine-depleted, highly purified EVs remain scarce.
To address these challenges, the present study established a fully human, MISEV-compliant in vitro platform that incorporates optimized monocyte-derived DC differentiation with short-term (24 h) maturation in serum-free medium, EV isolation by size-exclusion chromatography with validated depletion of soluble cytokines, comprehensive multimodal EV characterization, and repeated exposure of stringently isolated naïve CD4⁺ T cells from healthy donors and individuals with egg allergy, both with and without CD3/CD28 co-stimulation. This work aimed to determine whether highly purified human DC-derived EVs generated under resting, inflammatory (LPS), allergen (OVA), or combined conditions can activate and polarise naïve CD4⁺ T cells, and whether their immunomodulatory effects differ between healthy and allergic individuals, thereby clarifying the role of EVs in the early events of human allergic sensitisation.
3. Discussion
The present study establishes a rigorous, MISEV-compliant human
in vitro platform to evaluate the immunomodulatory effects of dendritic cell-derived extracellular vesicles (DC-EVs) on naïve CD4⁺ T cells polarisation in the context of egg allergy. Our findings indicate that DC-EVs isolated by size-exclusion chromatography (SEC) with cytokine depletion showed minimal impact on T-cell viability, CD69 expression, or cytokine secretion in the absence of TCR signalling (both signal 1 and 2). This observation underscores the limitations of earlier studies using ultracentrifugation, which often co-isolates soluble factors capable of independently driving T-cell responses [
18,
19].In addition, use of SEC-purified EVs aligns with recent reports emphasizing the need for contaminant-free preparations to accurately evaluate vesicle-specific functions [
20].
However, when the EVs are combined with signal 1 and 2 co-stimulation (i.e. CD3/CD28), EVs from LPS and OVA+LPS-stimulated DCs promote activation and a shift toward Th2 cytokine production, particularly IL-4, which is more pronounced in allergic donors. This allergen-specific Th2 bias was accompanied by reduced IFN-γ, suggesting a role for DC-EVs in amplifying Th2 polarization during sensitization.
These results significantly add to prior work on DC-EVs in allergy. For instance, Fang et al. showed that plasma EVs from allergic rhinitis patients exhibit antigen-presenting properties and drive Th2 differentiation [
21], while Molfetta et al. demonstrated that mast cell-derived EVs amplify allergic inflammation via immune complex transfer [
22]. In murine models, OVA-loaded mesenchymal stem cell-EVs in contrast have shown immunosuppression and prevention of allergic sensitization and inflammation [
23,
24].
High-dimensional FlowSOM analysis further highlighted baseline differences in naïve T-cell subsets between healthy and allergic donors, with T cells from allergic donors showing subtle enrichment in low-activation clusters. OVA-EV exposure eliminated these differences, while LPS-EVs preserved donor-specific patterns. The enhanced IL-4 response to OVA-EVs in allergic donors suggests that DC-EVs may sustain Th2 memory in established allergy, contributing to persistence beyond infancy. This aligns with evidence that allergen-bearing EVs can facilitate remote antigen presentation, offering opportunities for EV-based diagnostics or therapies, such as targeted depletion during desensitization [
25,
26].
In summary, our data demonstrate that purified DC-EVs serve as effective signal 3 modulators in naïve T-cell priming, with OVA+LPS-matured EVs preferentially inducing IL-4 in the context of egg allergy. These findings also highlight the need for standardized EV isolation and provide a foundation for exploring EVs as biomarkers or intervention targets in allergic sensitization. Future studies should incorporate longitudinal donor sampling and multi-omics of EV cargo to further delineate mechanisms.
4. Materials and Methods
4.1. PBMC Isolation
Whole blood (50 mL) was collected from healthy and egg-allergic human volunteers into EDTA-coated tubes (approved by the NHS Health Research Authority Research Ethics Committee (Ref 21/SC/0183)). Egg-allergic patients were identified using NHS records of GP notes stating adverse reactions to egg and/or positive allergy testing results. The blood was diluted 1:1 (v/v) with phosphate-buffered saline (PBS) supplemented with 2% fetal bovine serum (FBS) (Merck, UK). SepMateTM tubes (StemCell Technologies, UK) were pre-filled with 15 mL Histopaque-1077 (Merck, UK), and the diluted blood was carefully layered atop the density gradient. Tubes were centrifuged at 1200 × g for 10 min at room temperature with the brake engaged. The peripheral blood mononuclear cell (PBMC)-containing buffy coat layer was aspirated and transferred to a new 50 mL conical tube, then diluted to 50 mL with PBS + 2% FBS. Cells were pelleted by centrifugation at 400 × g for 8 min at room temperature, and the supernatant was discarded. This washing step was repeated once more to remove residual Histopaque and cellular debris. Isolated PBMCs were resuspended in complete RPMI 1640 medium (supplemented with 10% FBS, 1% penicillin-streptomycin, and 2 mM L-glutamine) (Merck, UK).
4.2. DC Generation and Culture
CD14+ monocytes were isolated from PBMCs using magnetic bead-based positive selection (Miltenyi Biotec, Bergisch Gladbach, Germany) according to the manufacturer's protocol. Isolated monocytes were resuspended at 1 × 10^6 cells/mL in RPMI 1640 medium supplemented with 10% FBS, 1% penicillin-streptomycin, and 2 mM L-glutamine, and plated in 48-well flat-bottom tissue culture-treated plates (Corning, Corning, NY, USA). For differentiation into immature DCs (iDCs), 50 ng/mL recombinant human GM-CSF and 20 ng/mL recombinant human IL-4 (both from R&D Systems, Minneapolis, MN, USA) were added. Cultures were maintained at 37°C in a humidified 5% CO_2 incubator for 5 days, with 50% media and cytokine replenishment on day 3. On day 5, non-adherent and loosely adherent cells were gently harvested, and the medium was replaced with serum-free X-VIVO 15 (Lonza, Walkersville, MD, USA). iDCs were then stimulated with 100 ng/mL LPS (from Escherichia coli O111:B4; Sigma-Aldrich, St. Louis, MO, USA) and/or 10 µg/mL ovalbumin (OVA; Grade V, Sigma-Aldrich) for 24 h to induce maturation into mature DCs (mDCs). Maturation status was confirmed by flow cytometric analysis of surface markers (e.g., CD80, CD83, CD86, HLA-DR). The cells were from cell culture and centrifuged with 1 mL of phosphate buffer albumin (PBA) at 300g for 5 minutes, the supernatant was kept for use in EV isolation, the pellet was re-suspending by gentle tapping. Antibodies were then added to the FACS tubes per manufacturer instructions and incubated at 4°C for 30 min. After the incubation, 2 mL of PBA was added and washed at 300g for 5 min. Supernatants were discarded and 300 µl of fixation buffer was added. The samples were analysed on SONY ID7000 flow cytometer.
4.3. Naïve T Cell Isolation
Naive CD4+ T cells were isolated from matched donor whole blood via negative magnetic selection using the Naive CD4+ T Cell Isolation Kit II (Miltenyi Biotec, Bergisch Gladbach, Germany), following the manufacturer's instructions. PBMCs were first isolated as described above. Isolated PBMCs were resuspended in MACS buffer (PBS containing 2 mM EDTA and 0.5% BSA) at 1 × 10^7 cells/mL. Naive CD4+ Biotin-Antibody Cocktail II (10 µL per 10^7 cells) was added, and the mixture was incubated at 4°C for 5 min. Subsequently, MACS buffer (30 µL per 10^7 cells) and Naive CD4+ MicroBeads II (20 µL per 10^7 cells) were added, followed by incubation at 4°C for 10 min. Labelled cells were loaded onto a pre-equilibrated LS MACS column in the magnetic field (Miltenyi Biotec). Unlabelled naive CD4+ T cells in the flow-through were collected, while the column was washed thrice with 3 mL MACS buffer. The eluted fraction was centrifuged at 300 × g for 5 min at 4°C, and the cell pellet was resuspended in serum-free AIM-V medium (Thermo Fisher Scientific, Waltham, MA, USA) at 1 × 10^6 cells/mL. Naive T cells (2 × 10^5 cells in 200 µL) were aliquoted into 96-well U-bottom tissue culture plates (Corning) for downstream assays. Purity was verified by flow cytometry (>95% CD3+CD4+CD45RA+CCR7+). Extracellular markers were stained by the previously described method.
4.4. EV Isolation with Size-Exclusion Chromatography
Following 24 h stimulation with LPS and OVA, DC culture supernatants were harvested and centrifuged at 300 × g for 8 min at 4°C to remove cellular debris. Clarified supernatants were subjected to size-exclusion chromatography (SEC) using qEVoriginal/35 nm columns (IZON Science, Oxford, UK) equilibrated with sterile-filtered PBS (0.22 µm pore size). Columns were pre-washed with 2 mL PBS, excess buffer was removed, and 1 mL supernatant was loaded per column. As the sample entered the resin bed, an additional 1 mL PBS was added to initiate elusion. Nine EV-enriched fractions (corresponding to elution volumes 1.5-4.5 mL) were collected based on manufacturer guidelines. Fractions were pooled and concentrated using Amicon Ultra-0.5 10 kDa centrifugal filter units (Merck Millipore, Burlington, MA, USA). Pooled eluates (up to 500 µL) were loaded into filters and centrifuged at 4000 × g for 10 min at 4°C. Retentates containing concentrated EVs were recovered from the upper chamber, resuspended in 100-200 µL PBS. The EVs were used immediately for the 1st dose of EVs, and for subsequent use was stored in -20°C for 24 h until next dose.
4.5. Nano-Tracking Analysis
Nano-tracking analysis (NTA) was performed on solutions containing EVs in order to confirm their sizes and presence. NTA was considered as the gold standard for sizing EVs. The ZetaView (Particle Matrix) was used for NTA. EVs isolated via SEC were diluted 1:1000 in 0.22 μM filtered PBS and loaded into an LM10/14 Nanosight instrument (Nanosight, Malvern Panalytical, UK) for particle size distribution and quantification. Before analysis, the instrument’s sensitivity was calibrated using a 1:10 dilution of 100 nm carboxylated polystyrene nanoparticles (IZON) and a 1:1000 dilution of 200 nm polystyrene nanoparticles (Malvern Panalytical). Automatic settings were used for minimum expected particle size, minimum track length, and blur. The instrument was configured with a sensitivity of 78, a gain of 26.88, and a temperature of 21 °C. National Institute of Standards and Technology (NIST) beads were analysed at a sensitivity of 65. Data processing and particle size distribution analysis were conducted using NTA Software 3.3 Dev build 3.3.301 (Malvern Panalytical).
4.6. Enzyme-Linked Immunosorbent Assay
After SEC had been performed, each of the fractions (1 to 7) were collected and used in ELISA to evaluate the effectiveness of SEC clearing capabilities of cytokines from EV solutions. 96-well plates were coated with IL-6 and IL-8 capture antibodies by adding 100µl of coating solution in each well, ensuring that the solution covers the bottom of each well evenly. The plate was then incubated overnight at 4 °C to allow the capture antibodies to adsorb on the bottom of the wells. After incubation the coating solution was discarded, and the wells were washed with PBS+0.05%Tween20. To prevent non-specific binding of proteins to the plate, the plates were blocked with blocking buffer for 1h. After the blocking of the plate, the blocking buffer was removed, and the wells were washed with PBS+0.05%Tween20. The sample was then added to the wells and incubated for 2h at room temperature, to allow the cytokines to bind to the capture antibodies. The wells were then washed with PBS+0.05%Tween20 to remove unbound substances and minimize the background noise. Horseradish peroxidase (HRP) Streptavidin was added to the wells and incubated for 1h at room temperature. The wells were washed again. 3,3',5,5' tetramethylbenzidine (TMB) was added to the wells to initiate a reaction with HRP and allowed to incubate for 20 min in the dark at room temperature. The stop solution (Sulfuric acid) was added to cease the reactions between HRP and TMB. The plate was then inserted into a microplate reader to measure the absorbance at 450nm and 570nm. The results from the standards were then plotted in a standard curve. Utilizing the standard curve, it was possible to calculate the concentrations of IL-6 and IL-8 in the solution.
4.7. DC-T Cell Assay
Isolated DC-derived EVs were added to naive CD4+ T cell cultures (2 × 10^5 cells/well in 200 µL AIM-V medium), with EV replenishment every 24 h for up to 3 days. For co-stimulation assays, 96-well U-bottom plates were pre-coated for 1h at 4°C with 2 µg/mL anti-human CD3 (clone OKT3; BioLegend, San Diego, CA, USA) in PBS, washed twice with PBS. Anti-human CD28 (2 µg/mL; clone CD28.2; BioLegend) was added directly to wells. Cultures were incubated at 37°C in a humidified 5% CO_2 incubator for 72 h total. After 30h of stimulation, protein transport inhibitor cocktail (GolgiPlug; BD Biosciences, Franklin Lakes, NJ, USA; 1 µL/mL) was added, and cells were incubated for an additional 12 h. Harvested cells were washed once with PBA (PBS containing 0.1% BSA and 0.09% sodium azide) by centrifugation at 300 × g for 10 min at 4°C. For extracellular staining, cells were resuspended in 100 µL PBA containing fluorochrome-conjugated antibodies against CD3, CD4, CD45RA, CD27, CD28, CCR7, and CD69 (all from BioLegend) and incubated at 4°C for 30 min in the dark. Cells were washed twice with PBA (300 × g, 5 min), fixed in 500 µL fixation buffer (BD Biosciences) for 30 min at 4°C. For intracellular staining, fixed cells were washed with 2 mL 1× Perm/Wash buffer (BD Biosciences; 500 × g, 5 min) and resuspended in 100 µL Perm/Wash buffer containing antibodies against IL-2, IL-4, IFN-γ, and TNF-α (all from BioLegend). Samples were incubated at room temperature for 30 min in the dark, washed twice with PBA (500 × g, 5 min), and resuspended in 300 µL fresh fixation buffer for storage at 4°C until acquisition. Stained samples were acquired on a Sony ID7000 spectral flow cytometer (Sony Biotechnology, Tokyo, Japan) using 405 nm, 488 nm, 561 nm, and 638 nm lasers, collecting data for 2 min per sample at a flow rate of ~1000 events/s. Spectral unmixing and compensation were performed with Sony software (v2.0.4), followed by manual gating in Kaluza and FlowJo software.
4.8. Supervised Flow Cytometry Analysis
Acquired spectral flow cytometry data were analysed using Kaluza Analysis software (v2.1; Beckman Coulter, Brea, CA, USA). A manual hierarchical gating strategy was applied: initial selection of viable singlets (forward/side scatter area vs. height, followed by live/dead amine-reactive dye exclusion), then CD3+CD4+ lymphocytes, and further subsetting to naive T cells (CD45RA+CCR7+). Expression of activation (CD69), costimulatory (CD27, CD28), and chemokine receptor (CCR7) markers, along with intracellular cytokines (IL-2, IL-4, IFN-γ, TNF-α), was quantified as percentage positive within the naive CD4+ gate. Gating was performed on fluorescence-minus-one controls for compensation and isotype controls for positivity thresholds. Aggregated data were imported into GraphPad Prism (v10.1.1; GraphPad Software, San Diego, CA, USA) for visualization. Statistical significance was assessed using two-way ANOVA with Sidak's post-hoc correction for donor group comparisons (healthy vs. allergic; α = 0.05), and one-way ANOVA with Brown-Forsythe correction for condition effects within groups (unstimulated vs. EV-stimulated; α = 0.05). Differences were deemed significant at p < 0.05.
4.9. Unsupervised Flow Cytometry Analysis
Flow cytometry data were additionally processed in FlowJo v10.8.1 (BD Biosciences, Franklin Lakes, NJ, USA) for unsupervised clustering. Following import, samples underwent manual hierarchical gating to select viable CD3+CD4+ naive T cells (CD45RA+CCR7+). The ‘Downsample’ plugin was applied to standardize each sample to 10,000 events, minimizing batch effects. Samples were concatenated by experimental condition (e.g., donor group or EV stimulation type) to generate combined files. Optimal cluster number was estimated using the ‘Phenograph’ plugin. This value was input into the FlowSOM plugin to delineate self-organizing map clusters. Resultant clusters were visualized via tSNE. ‘Cluster Explorer’ was employed to generate annotated t-SNE plots (color-coded by marker expression or population frequency) and quantify event distributions per cluster.
4.10. Statistical Analysis
Statistical analyses were performed using GraphPad Prism version 10.1.1 (GraphPad Software, San Diego, CA, USA). Data are presented as individual data points with median and interquartile range or as mean ± SEM where indicated. Normality was assessed using the Shapiro–Wilk test. For comparisons between healthy and allergic donor groups across multiple conditions, two-way repeated-measures ANOVA was used, followed by Šídák’s multiple comparisons test. Differences between stimulation conditions within the same donor group were evaluated by one-way repeated-measures ANOVA with Brown–Forsythe correction or Friedman test, followed by Dunn’s multiple comparisons test where appropriate. Differences were considered statistically significant at p < 0.05. For statistical comparisons of the unsupervised clustering analysis, the percentage of naive T cells per cluster was calculated for each donor. Data were exported to GraphPad Prism and analysed using multiple Mann-Whitney U tests (unpaired, two-tailed) with false discovery rate (FDR) correction at 5% via the two-stage step-up (Benjamini, Krieger, and Yekutieli) method for healthy vs. allergic donor differences. Condition-specific effects within allergic donors were evaluated by multiple Wilcoxon matched-pairs signed-rank tests with the same FDR correction (α = 0.05).
The overall assay workflow is illustrated in
Figure 7.
Figure 1.
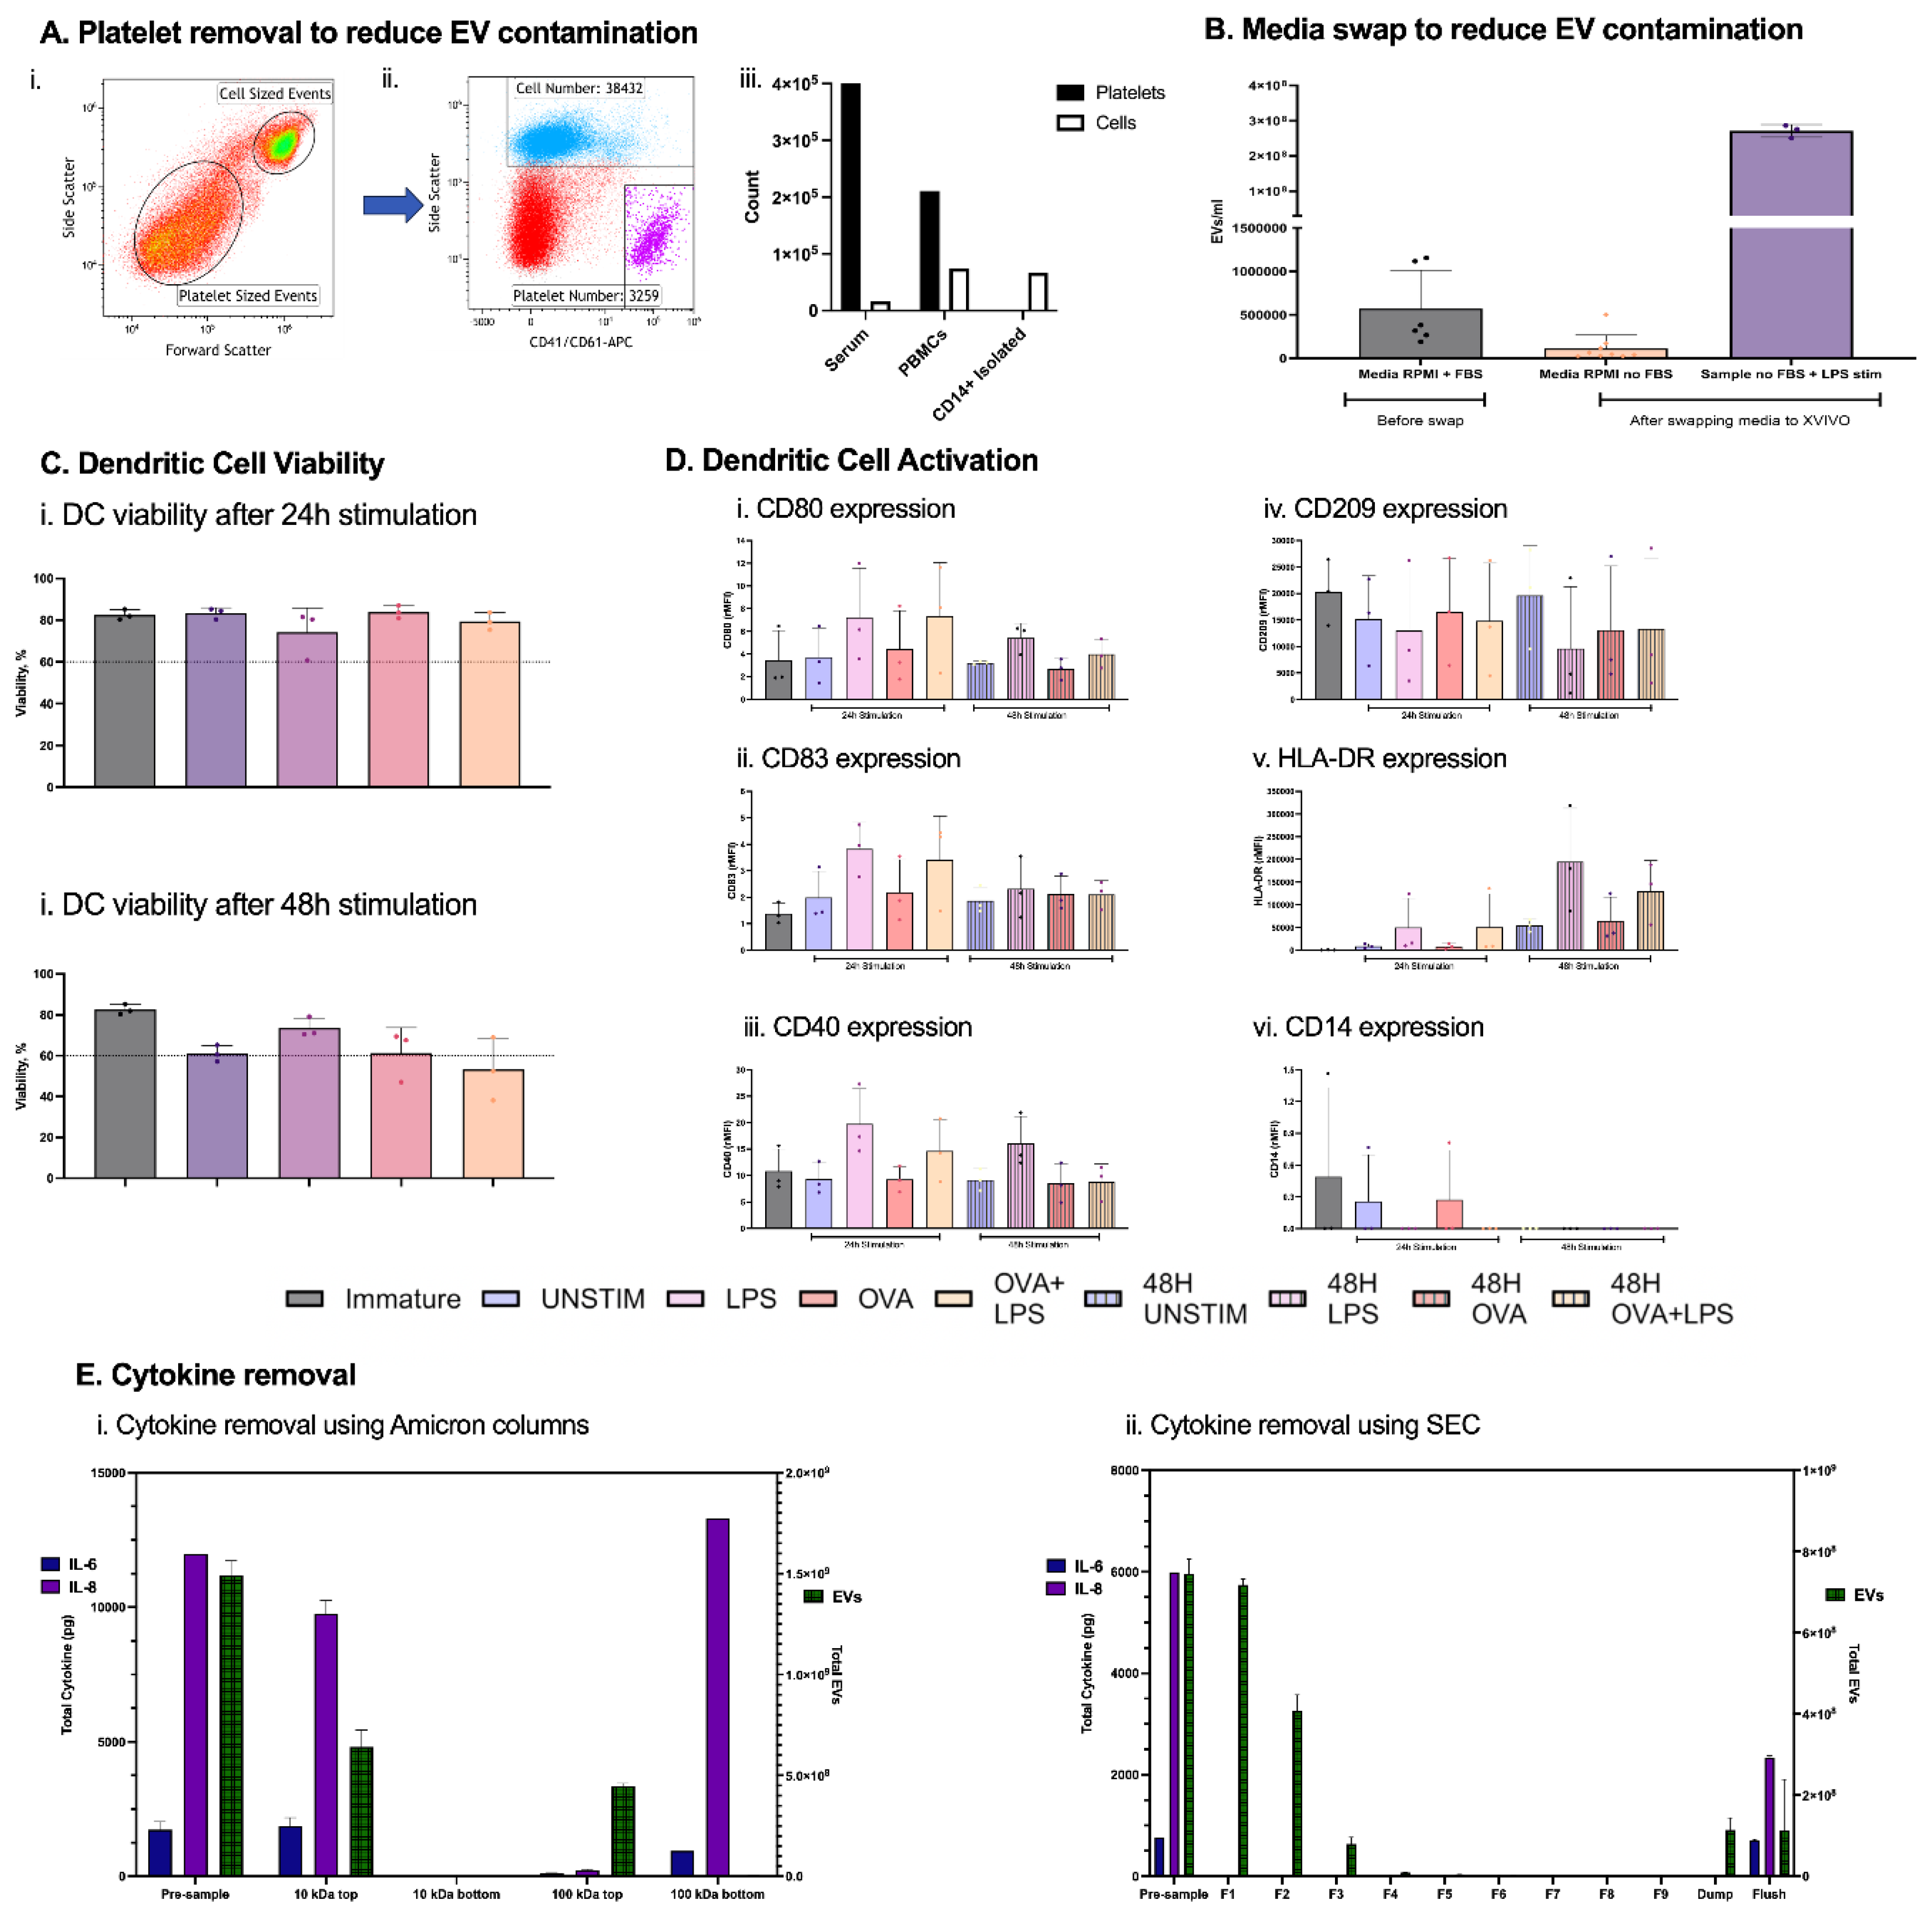
DC-EV Optimization. Reduction of contaminating EVs from platelets by CD14+ magnetic isolation (Ai, ii, iii) and media FBS after complete media swap from RPMI + 10% FBS to serum-free X-VIVO 15 on day 5, immediately before DC stimulation (B). Viability assessed by Zombie Aqua and Maturation marker expression (rMFI) on DCs after 24 h and 48 h stimulation (C-D). Comparison of cytokine versus EV separation efficiency using Amicon ultrafiltration (10 kDa and 100 kDa) (Ei) and automated size-exclusion chromatography (qEV/35 nm columns) (Eii). Primary human DC cell supernatants were spiked with recombinant IL-6 and IL-8, processed, and analysed by ELISA (cytokines) and calcein-AM/ImageStreamX (EVs). n = 3 independent donors.
Figure 1.
DC-EV Optimization. Reduction of contaminating EVs from platelets by CD14+ magnetic isolation (Ai, ii, iii) and media FBS after complete media swap from RPMI + 10% FBS to serum-free X-VIVO 15 on day 5, immediately before DC stimulation (B). Viability assessed by Zombie Aqua and Maturation marker expression (rMFI) on DCs after 24 h and 48 h stimulation (C-D). Comparison of cytokine versus EV separation efficiency using Amicon ultrafiltration (10 kDa and 100 kDa) (Ei) and automated size-exclusion chromatography (qEV/35 nm columns) (Eii). Primary human DC cell supernatants were spiked with recombinant IL-6 and IL-8, processed, and analysed by ELISA (cytokines) and calcein-AM/ImageStreamX (EVs). n = 3 independent donors.
Figure 2.
EV analysis. Extracellular vesicles under different microscopes. EVs were observed under TEM (Ai). Utilizing confocal microscopes features, calcein-AM stained and lipid dye DID stained EVs were overlayed together (Aii). Super-resolution microscope (ONI) allowed the staining of tetraspanins CD81, CD63 and CD9, to observe the number of copies on each EV in the sample (Aiii). Nanobeads of known refractive index and sized at 130nm were run on ISX to determine their positioning on the machine (Bi.). Based on the interest of only in small EVs, everything below 130nm beads was selected (Bii.). The sizing gate was then applied to EV samples (Biii). Knowing that ISX brightfields minimum pixel range is 0.9 µm, it was possible to create a gate ensuring objects larger than 0.9 µm would be excluded (Biv.). To ensure objects selected were intact EVs, a calcein+ gate was introduced (v.). To reduce artifacts and increase accuracy of tetraspanin expression on EVs, only in-focus EVs were selected (Bvi). (Ci) ImageStream X MkII imaging of a single EV showing the EV brightfield image (BF), and calcein, CD63 PE, CD81 PE-Vio 615, and CD9 APC fluorescence. (Cii) % of tetraspanin expression on DC-derived EVs from healthy and allergic individuals (Ciii).
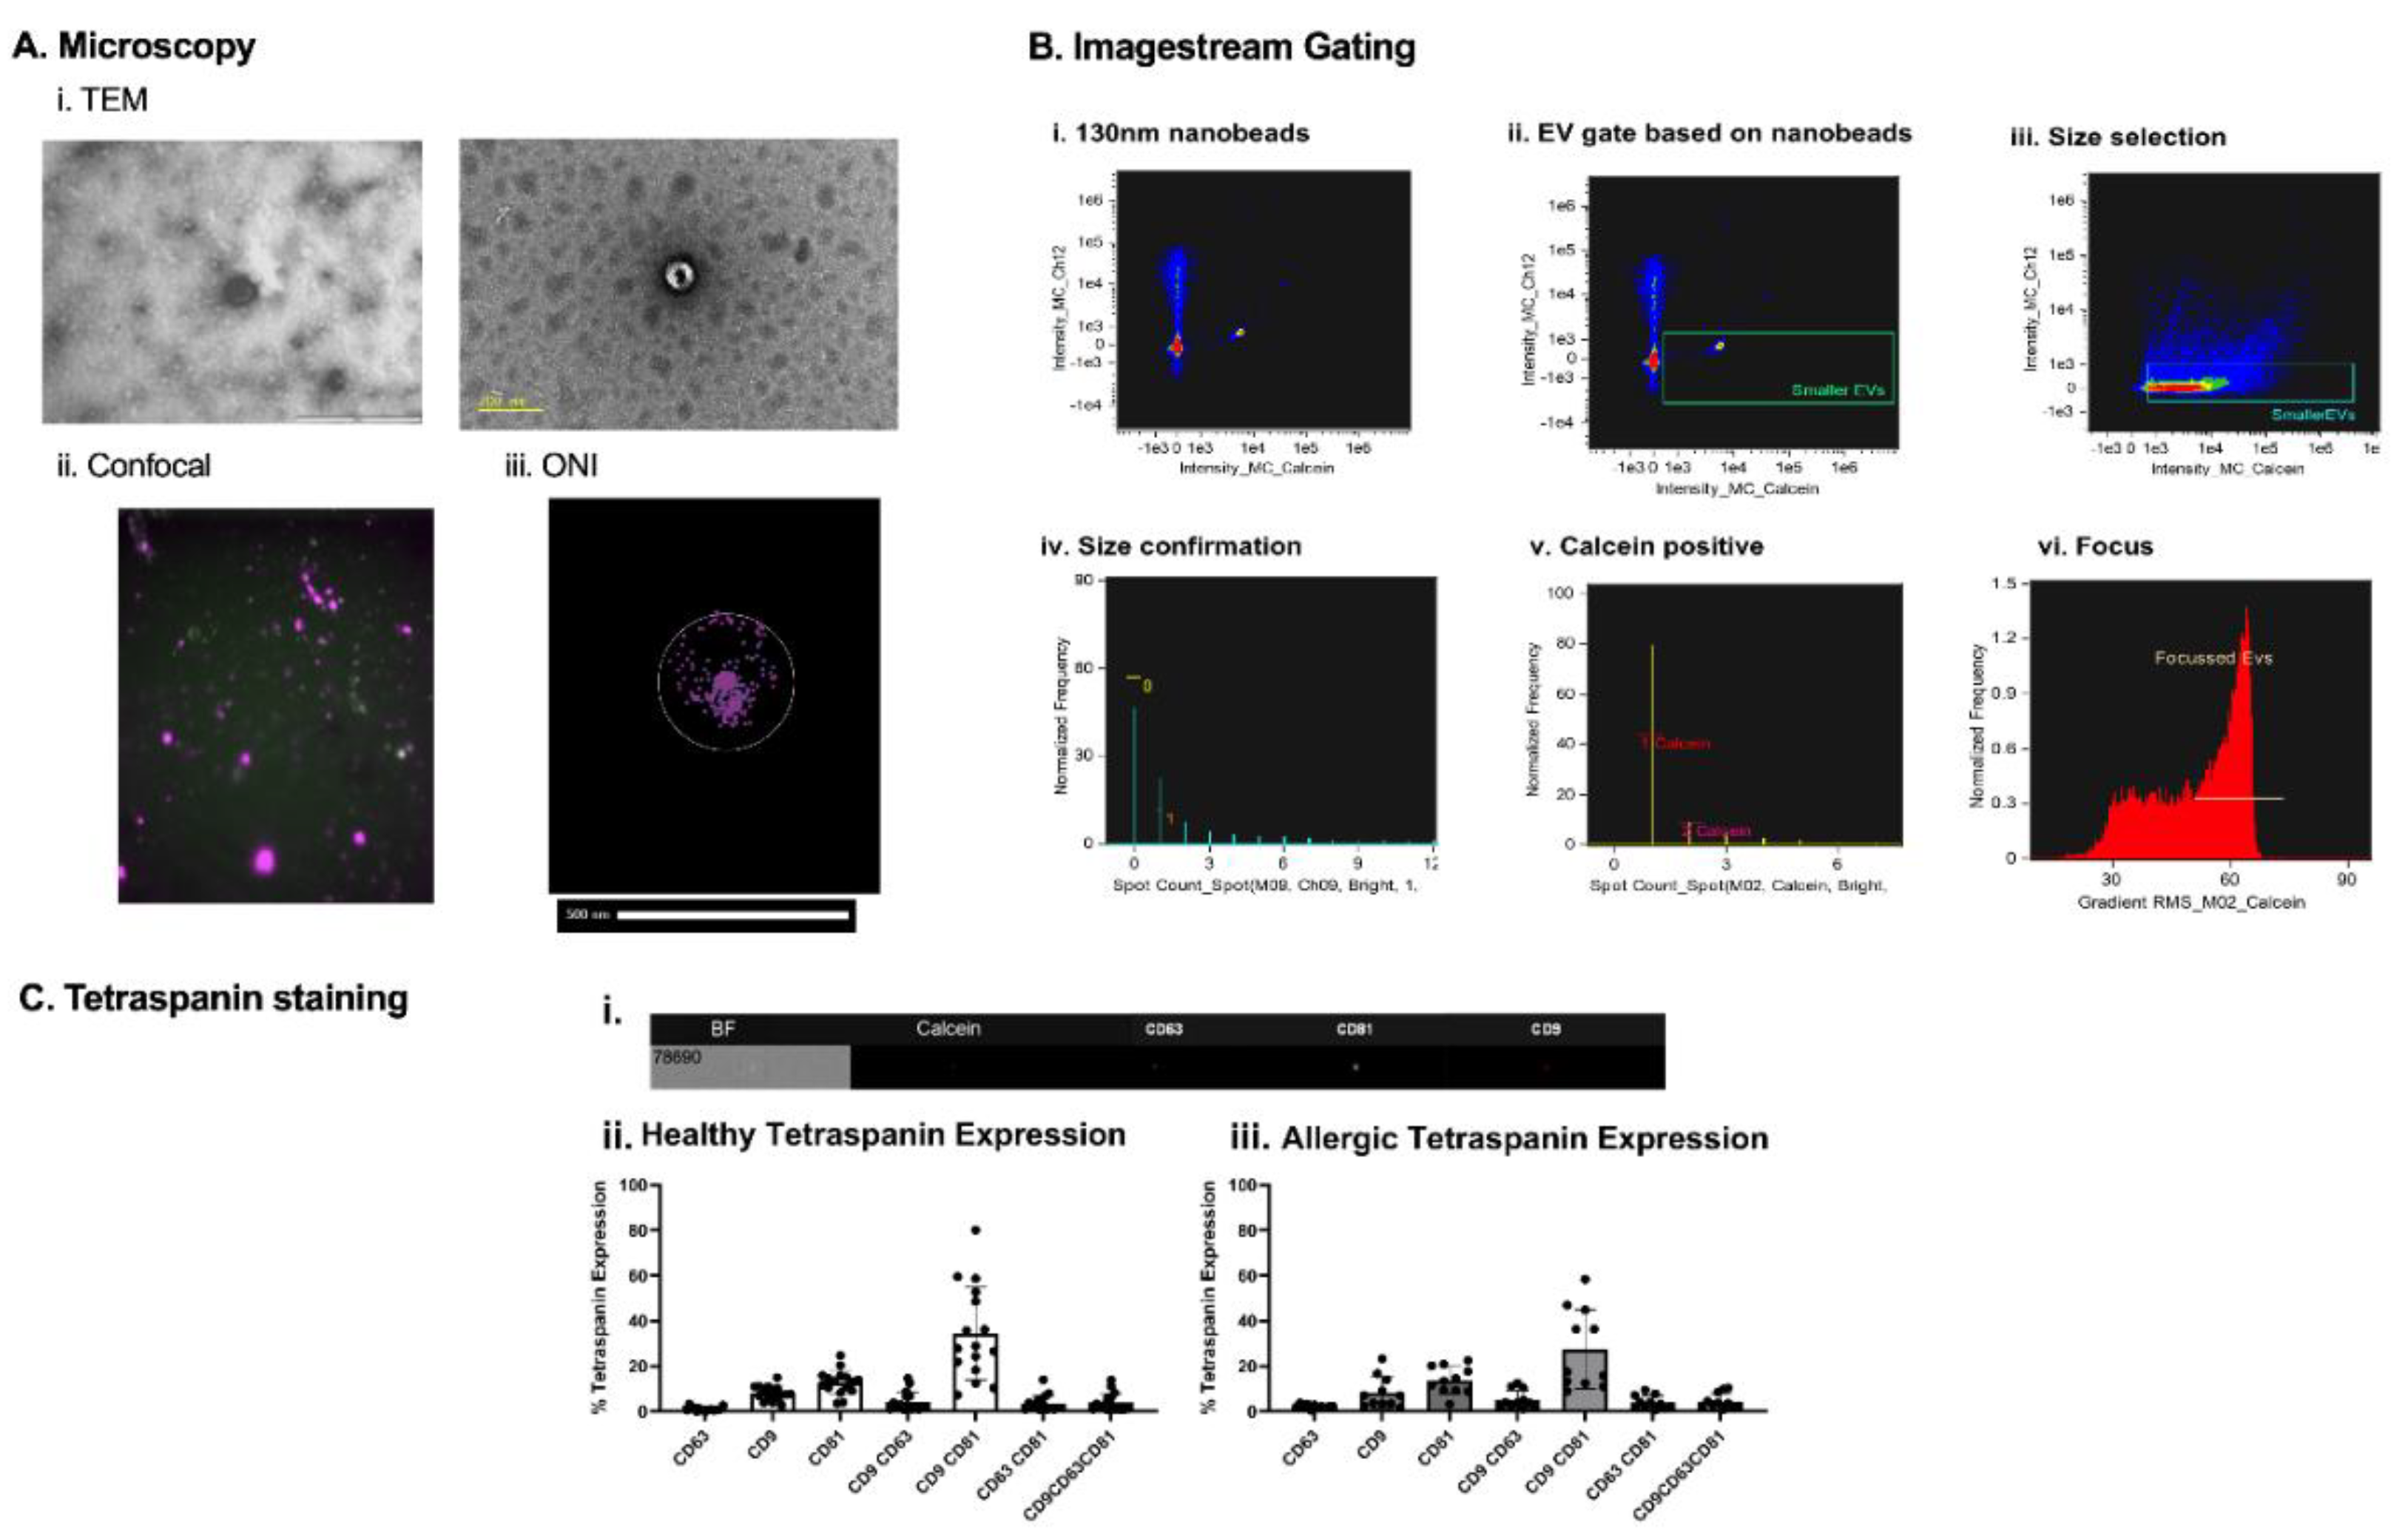
Figure 3.
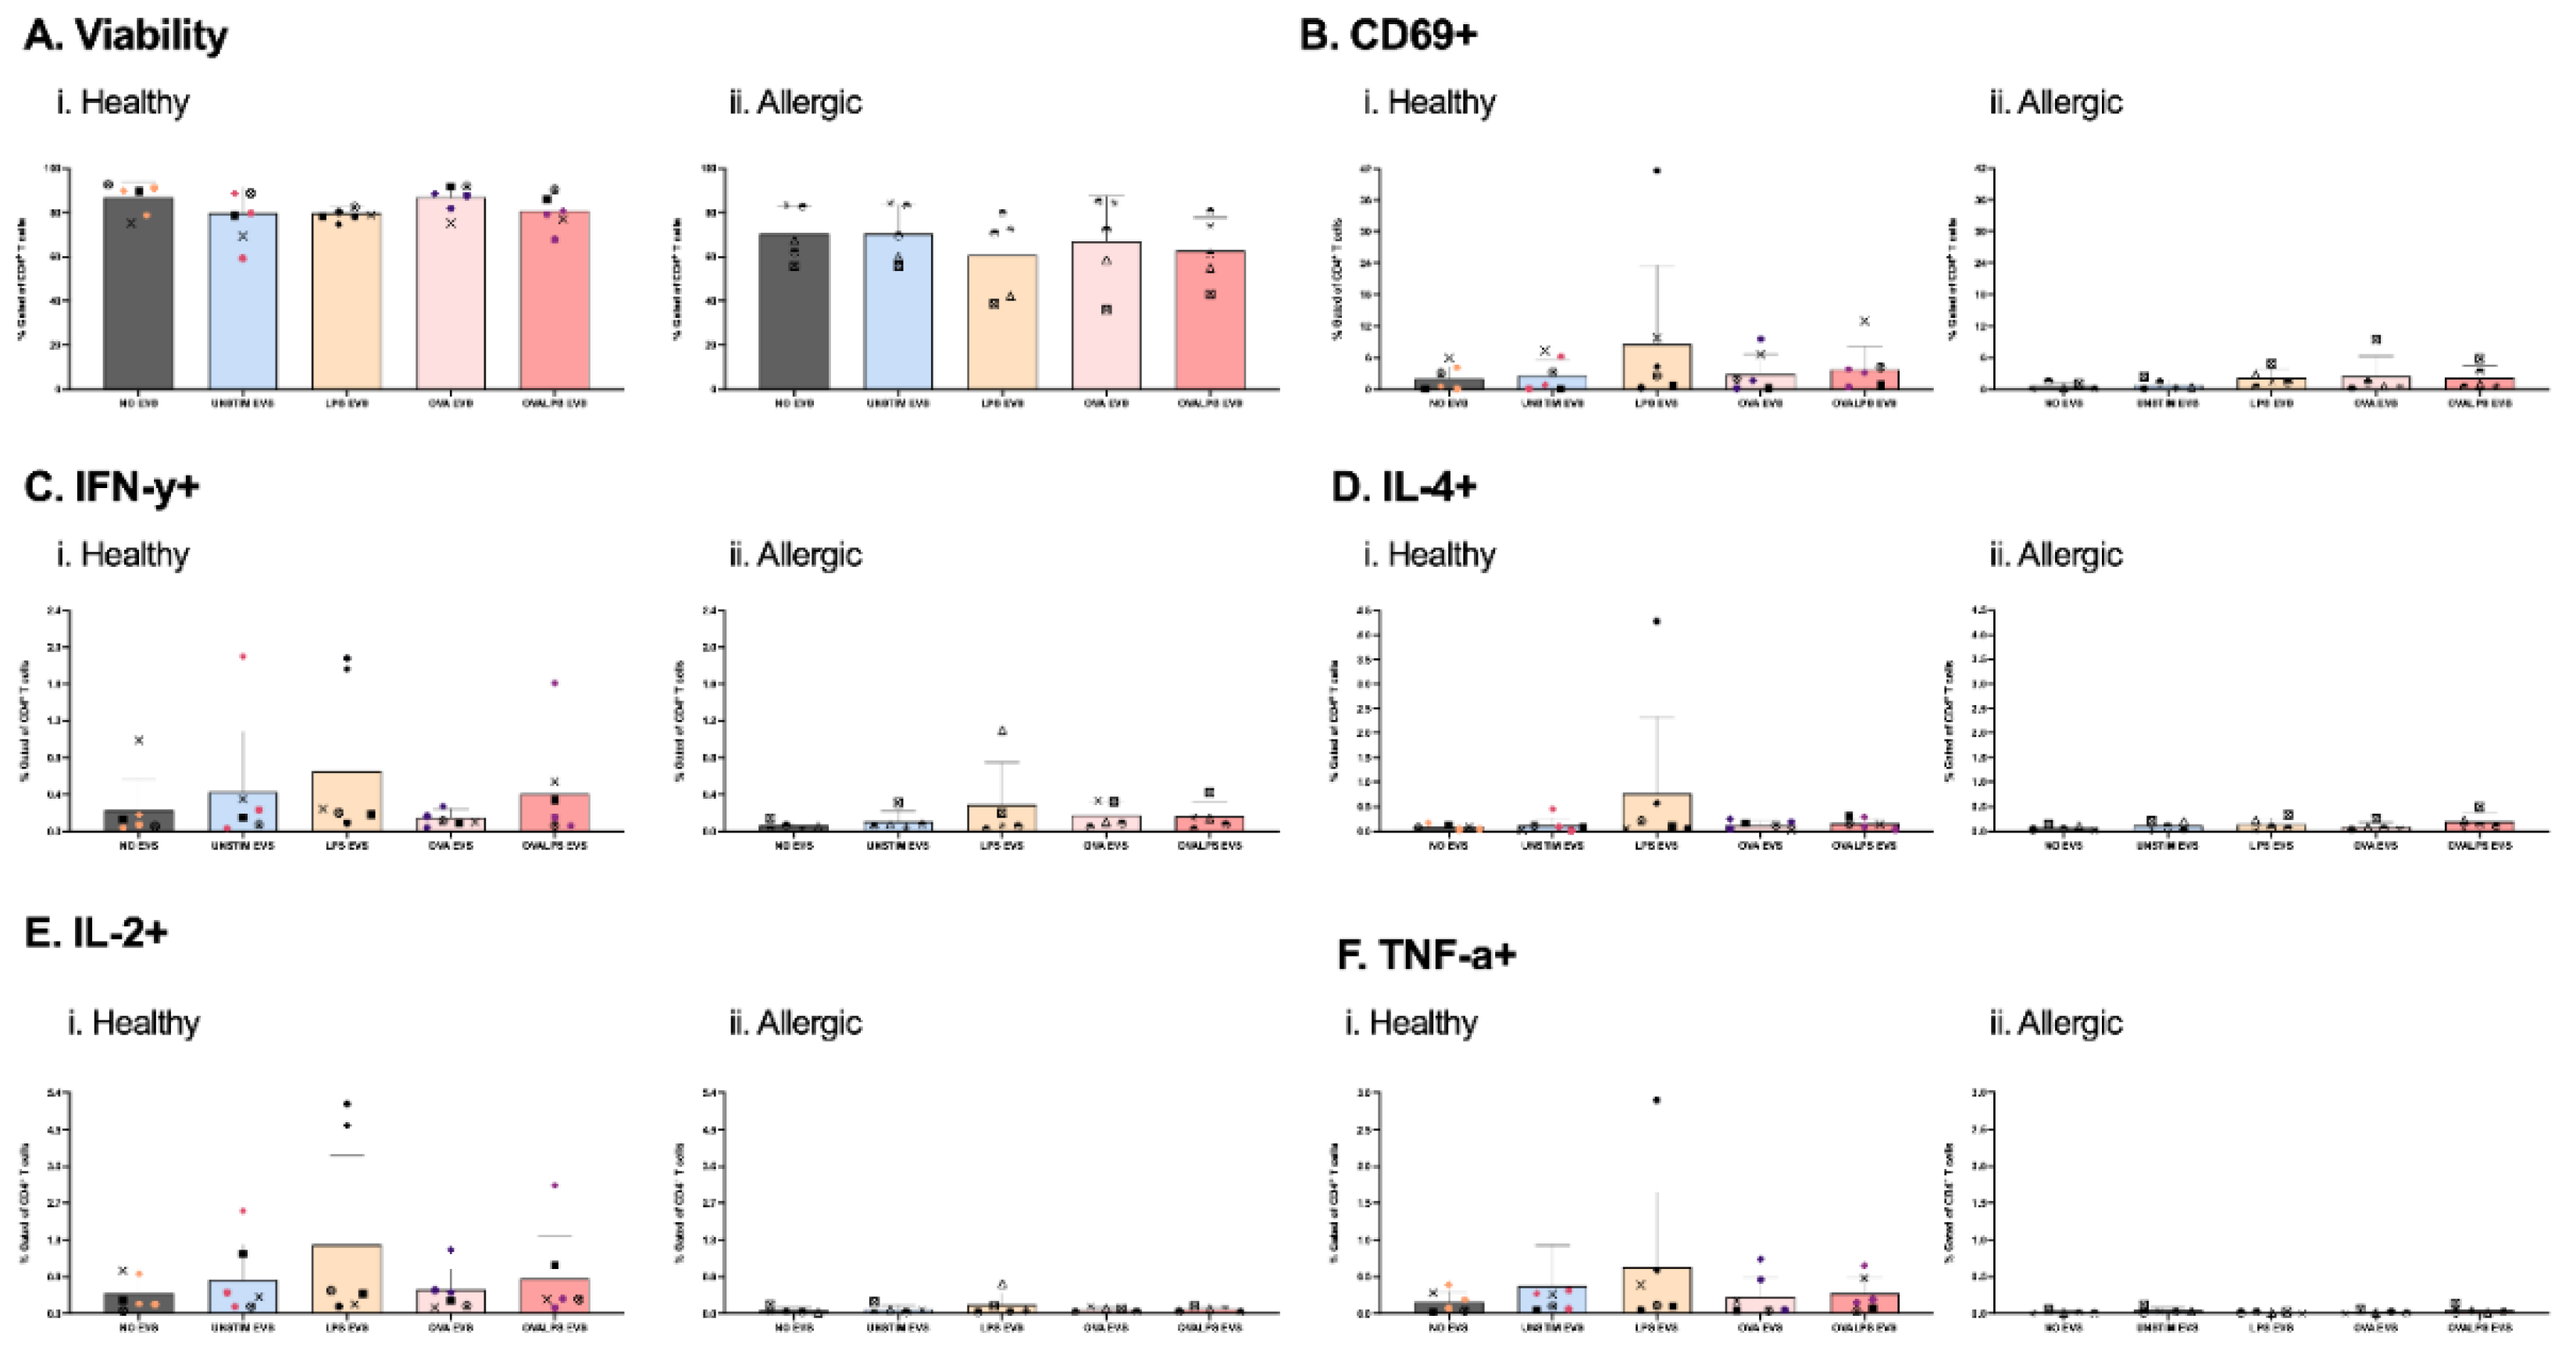
Effect of EVs alone on T cell viability and function. Naive T cells were plated in 96-well plate. Each well afterwards was stimulated with dendritic cell-derived EVs added in 3 doses. DCs were stimulated with 100ng/ml of LPS, 10µg/ml of OVA, 50ng/ml of LPS and 10µg/ml of OVA, and unstimulated, PBS was added as control. T cells were stimulated every 24h for 3 times, only 3rd dose results shown. Cytokine expression was measured after 42h, following 30h stimulation of EVs and 12h incubation with PTI, CD69 (B), IFN-y (C), IL-4 (D), TNF-a), IL-2 (F). Study included 7 healthy and 5 allergic participants. Statistical analysis was performed in GraphPad Prism using one-way ANOVA, p<0.05.
Figure 3.
Effect of EVs alone on T cell viability and function. Naive T cells were plated in 96-well plate. Each well afterwards was stimulated with dendritic cell-derived EVs added in 3 doses. DCs were stimulated with 100ng/ml of LPS, 10µg/ml of OVA, 50ng/ml of LPS and 10µg/ml of OVA, and unstimulated, PBS was added as control. T cells were stimulated every 24h for 3 times, only 3rd dose results shown. Cytokine expression was measured after 42h, following 30h stimulation of EVs and 12h incubation with PTI, CD69 (B), IFN-y (C), IL-4 (D), TNF-a), IL-2 (F). Study included 7 healthy and 5 allergic participants. Statistical analysis was performed in GraphPad Prism using one-way ANOVA, p<0.05.
Figure 4.
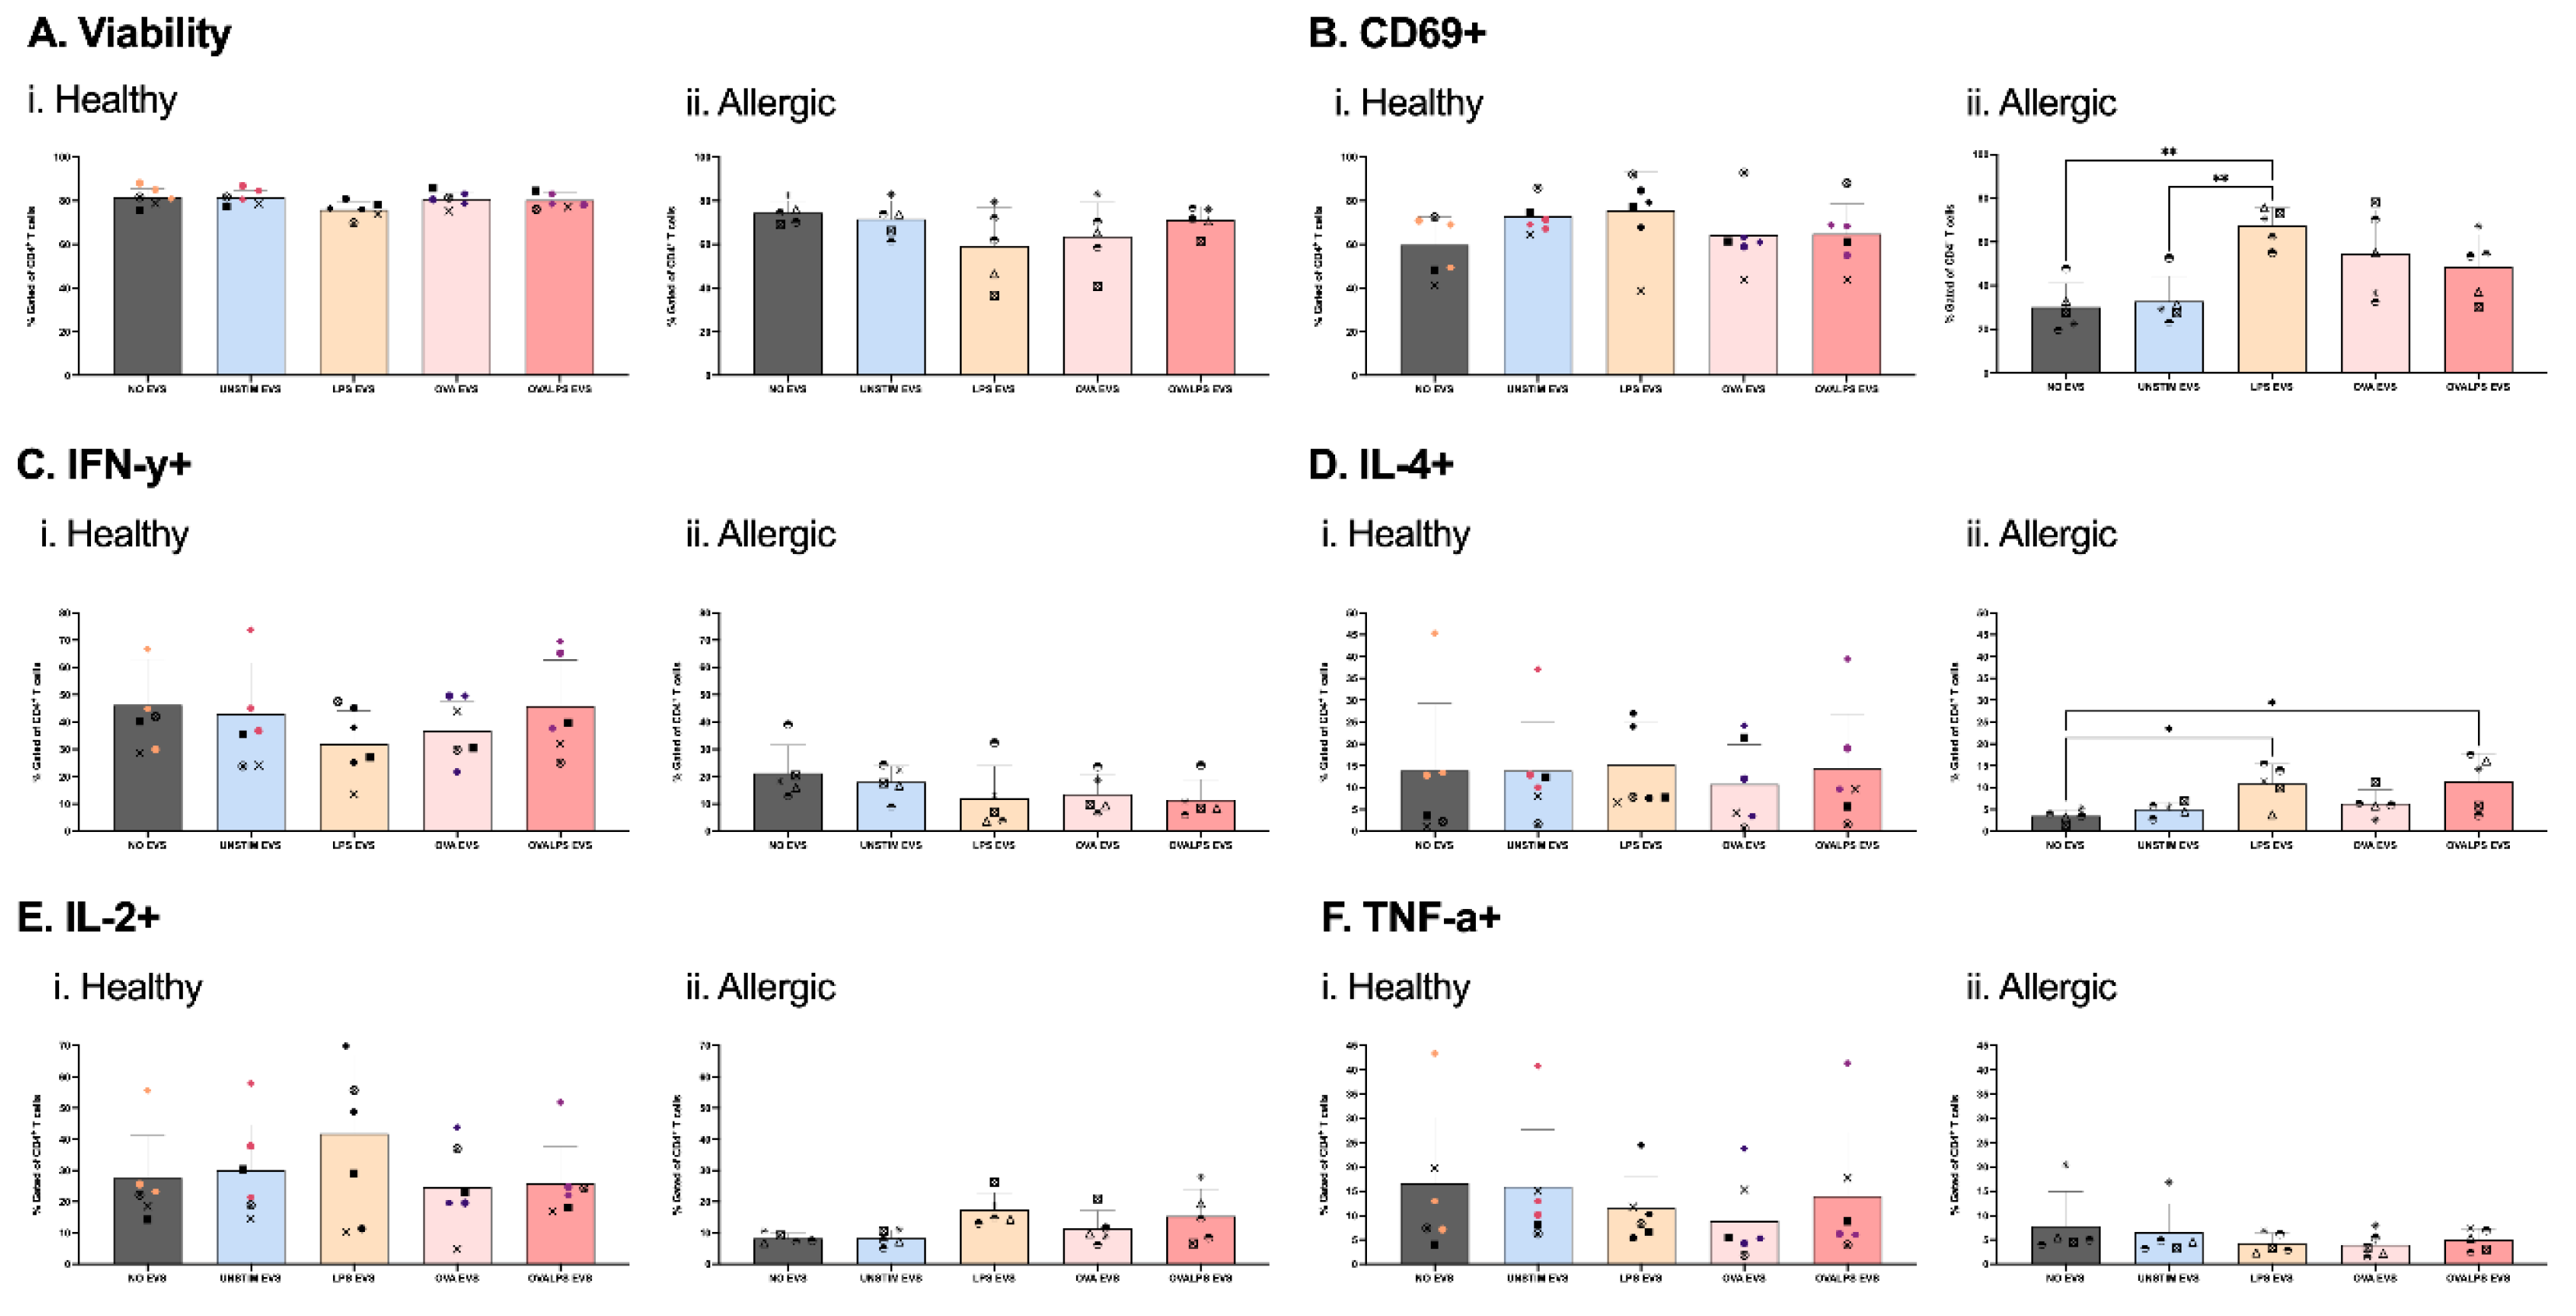
EVs as Signal 3 in T cell activation. Naive T cells were plated in 96-well plate with co-stimulation of coated 2µg/ml CD3 and direct 2µg/ml CD28. Each well afterwards was stimulated with dendritic cell-derived EVs added in 3 doses. DCs were stimulated with 100ng/ml of LPS, 10µg/ml of OVA, 50ng/ml of LPS and 10µg/ml of OVA, and unstimulated, PBS was added as control. T cells were stimulated every 24h for 3 times (i., ii., iii.,). Cytokine expression was measured after 42h, following 30h stimulation of EVs and 12h incubation with PTI, CD69 (B), IFN-y (C), IL-4 (D), TNF-a), IL-2 (F) Study included 7 healthy and 5 allergic participants. Statistical analysis was performed in GraphPad Prism using one-way ANOVA, p<0.05.
Figure 4.
EVs as Signal 3 in T cell activation. Naive T cells were plated in 96-well plate with co-stimulation of coated 2µg/ml CD3 and direct 2µg/ml CD28. Each well afterwards was stimulated with dendritic cell-derived EVs added in 3 doses. DCs were stimulated with 100ng/ml of LPS, 10µg/ml of OVA, 50ng/ml of LPS and 10µg/ml of OVA, and unstimulated, PBS was added as control. T cells were stimulated every 24h for 3 times (i., ii., iii.,). Cytokine expression was measured after 42h, following 30h stimulation of EVs and 12h incubation with PTI, CD69 (B), IFN-y (C), IL-4 (D), TNF-a), IL-2 (F) Study included 7 healthy and 5 allergic participants. Statistical analysis was performed in GraphPad Prism using one-way ANOVA, p<0.05.
Figure 5.
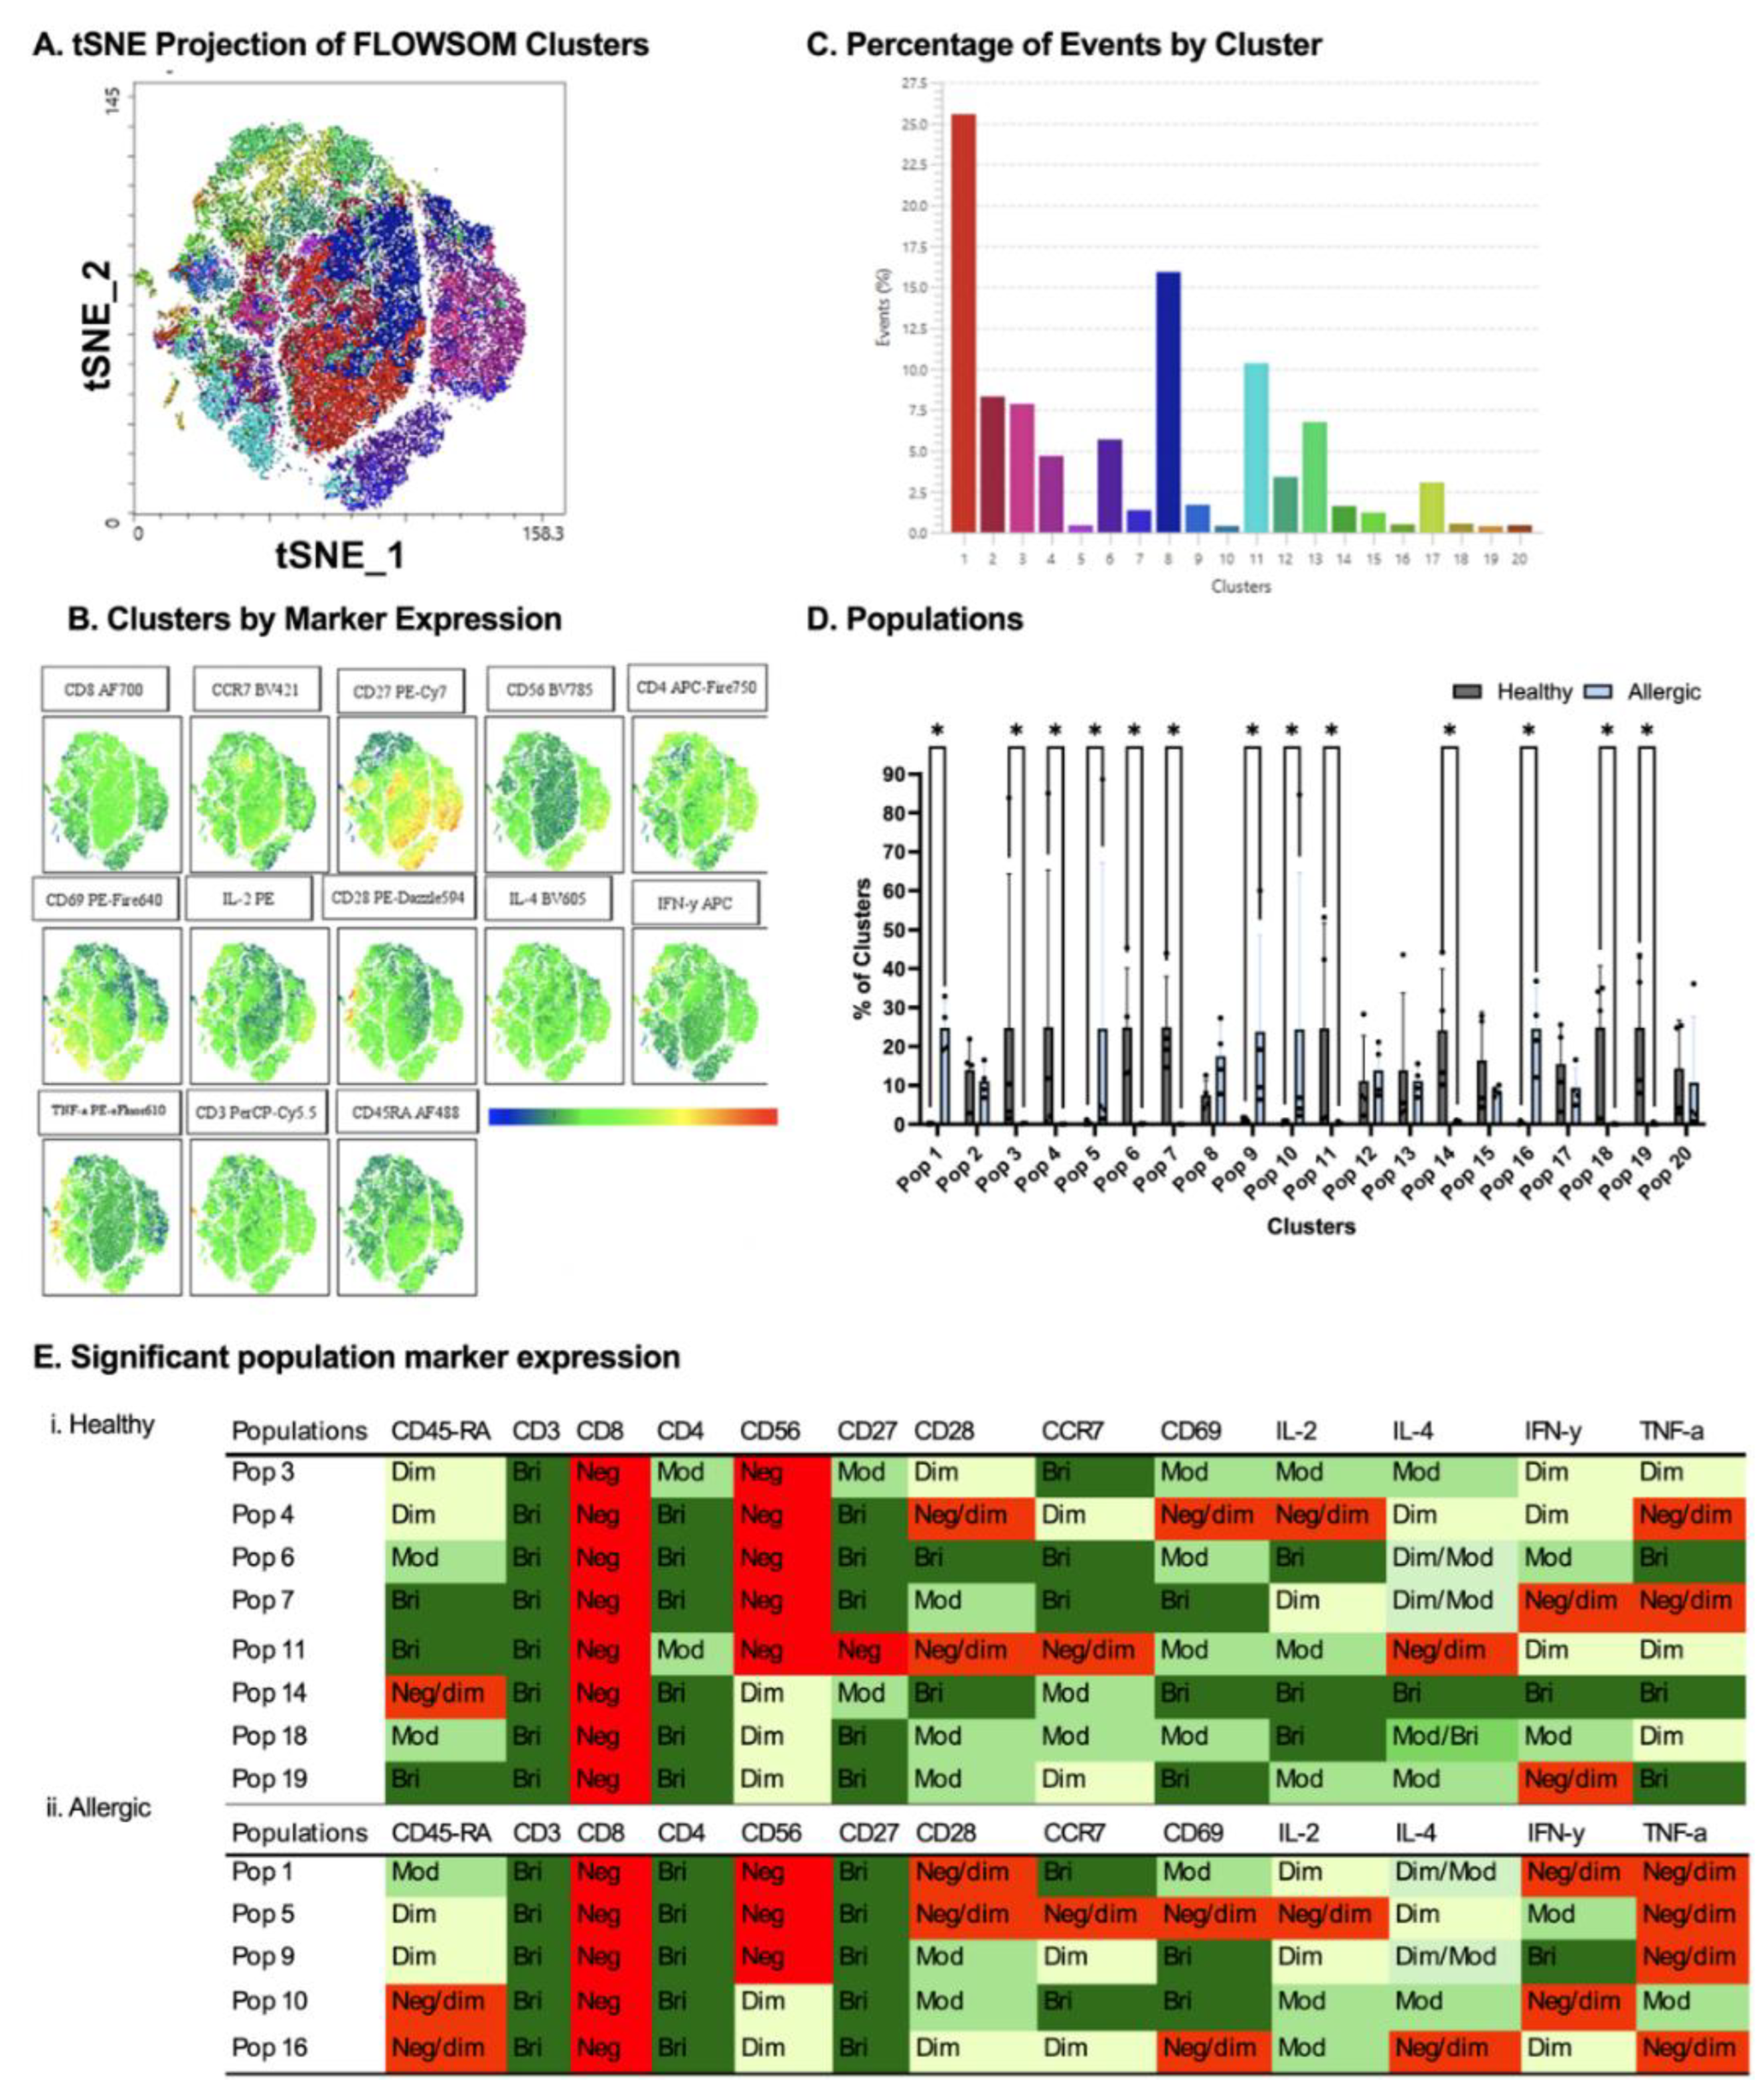
Comparison between healthy and allergic using unbiased clustering analysis following culture with PBS-stimulated DC-derived EVs. Following cluster explorer plugin, a multi-coloured tNSNE plot was made (A) and individual marker clusters were produced from tSNE plot (B). Clusters were separated based on their % (C). Populations between healthy and allergic groups were analysed for significant differences using Mann-Whitney Tests p<0.05 (D). Significant populations were split between healthy and allergic groups, and their marker expression was colour coded - Negative (red), Negative/dim (orange), DIM (pale yellow), Dim/moderate (pale green), Moderate (light green), Moderate/bright (green), Bright (dark green) (Ei.,ii). N= 4 healthy donors, 4 allergic donors.
Figure 5.
Comparison between healthy and allergic using unbiased clustering analysis following culture with PBS-stimulated DC-derived EVs. Following cluster explorer plugin, a multi-coloured tNSNE plot was made (A) and individual marker clusters were produced from tSNE plot (B). Clusters were separated based on their % (C). Populations between healthy and allergic groups were analysed for significant differences using Mann-Whitney Tests p<0.05 (D). Significant populations were split between healthy and allergic groups, and their marker expression was colour coded - Negative (red), Negative/dim (orange), DIM (pale yellow), Dim/moderate (pale green), Moderate (light green), Moderate/bright (green), Bright (dark green) (Ei.,ii). N= 4 healthy donors, 4 allergic donors.
Figure 6.
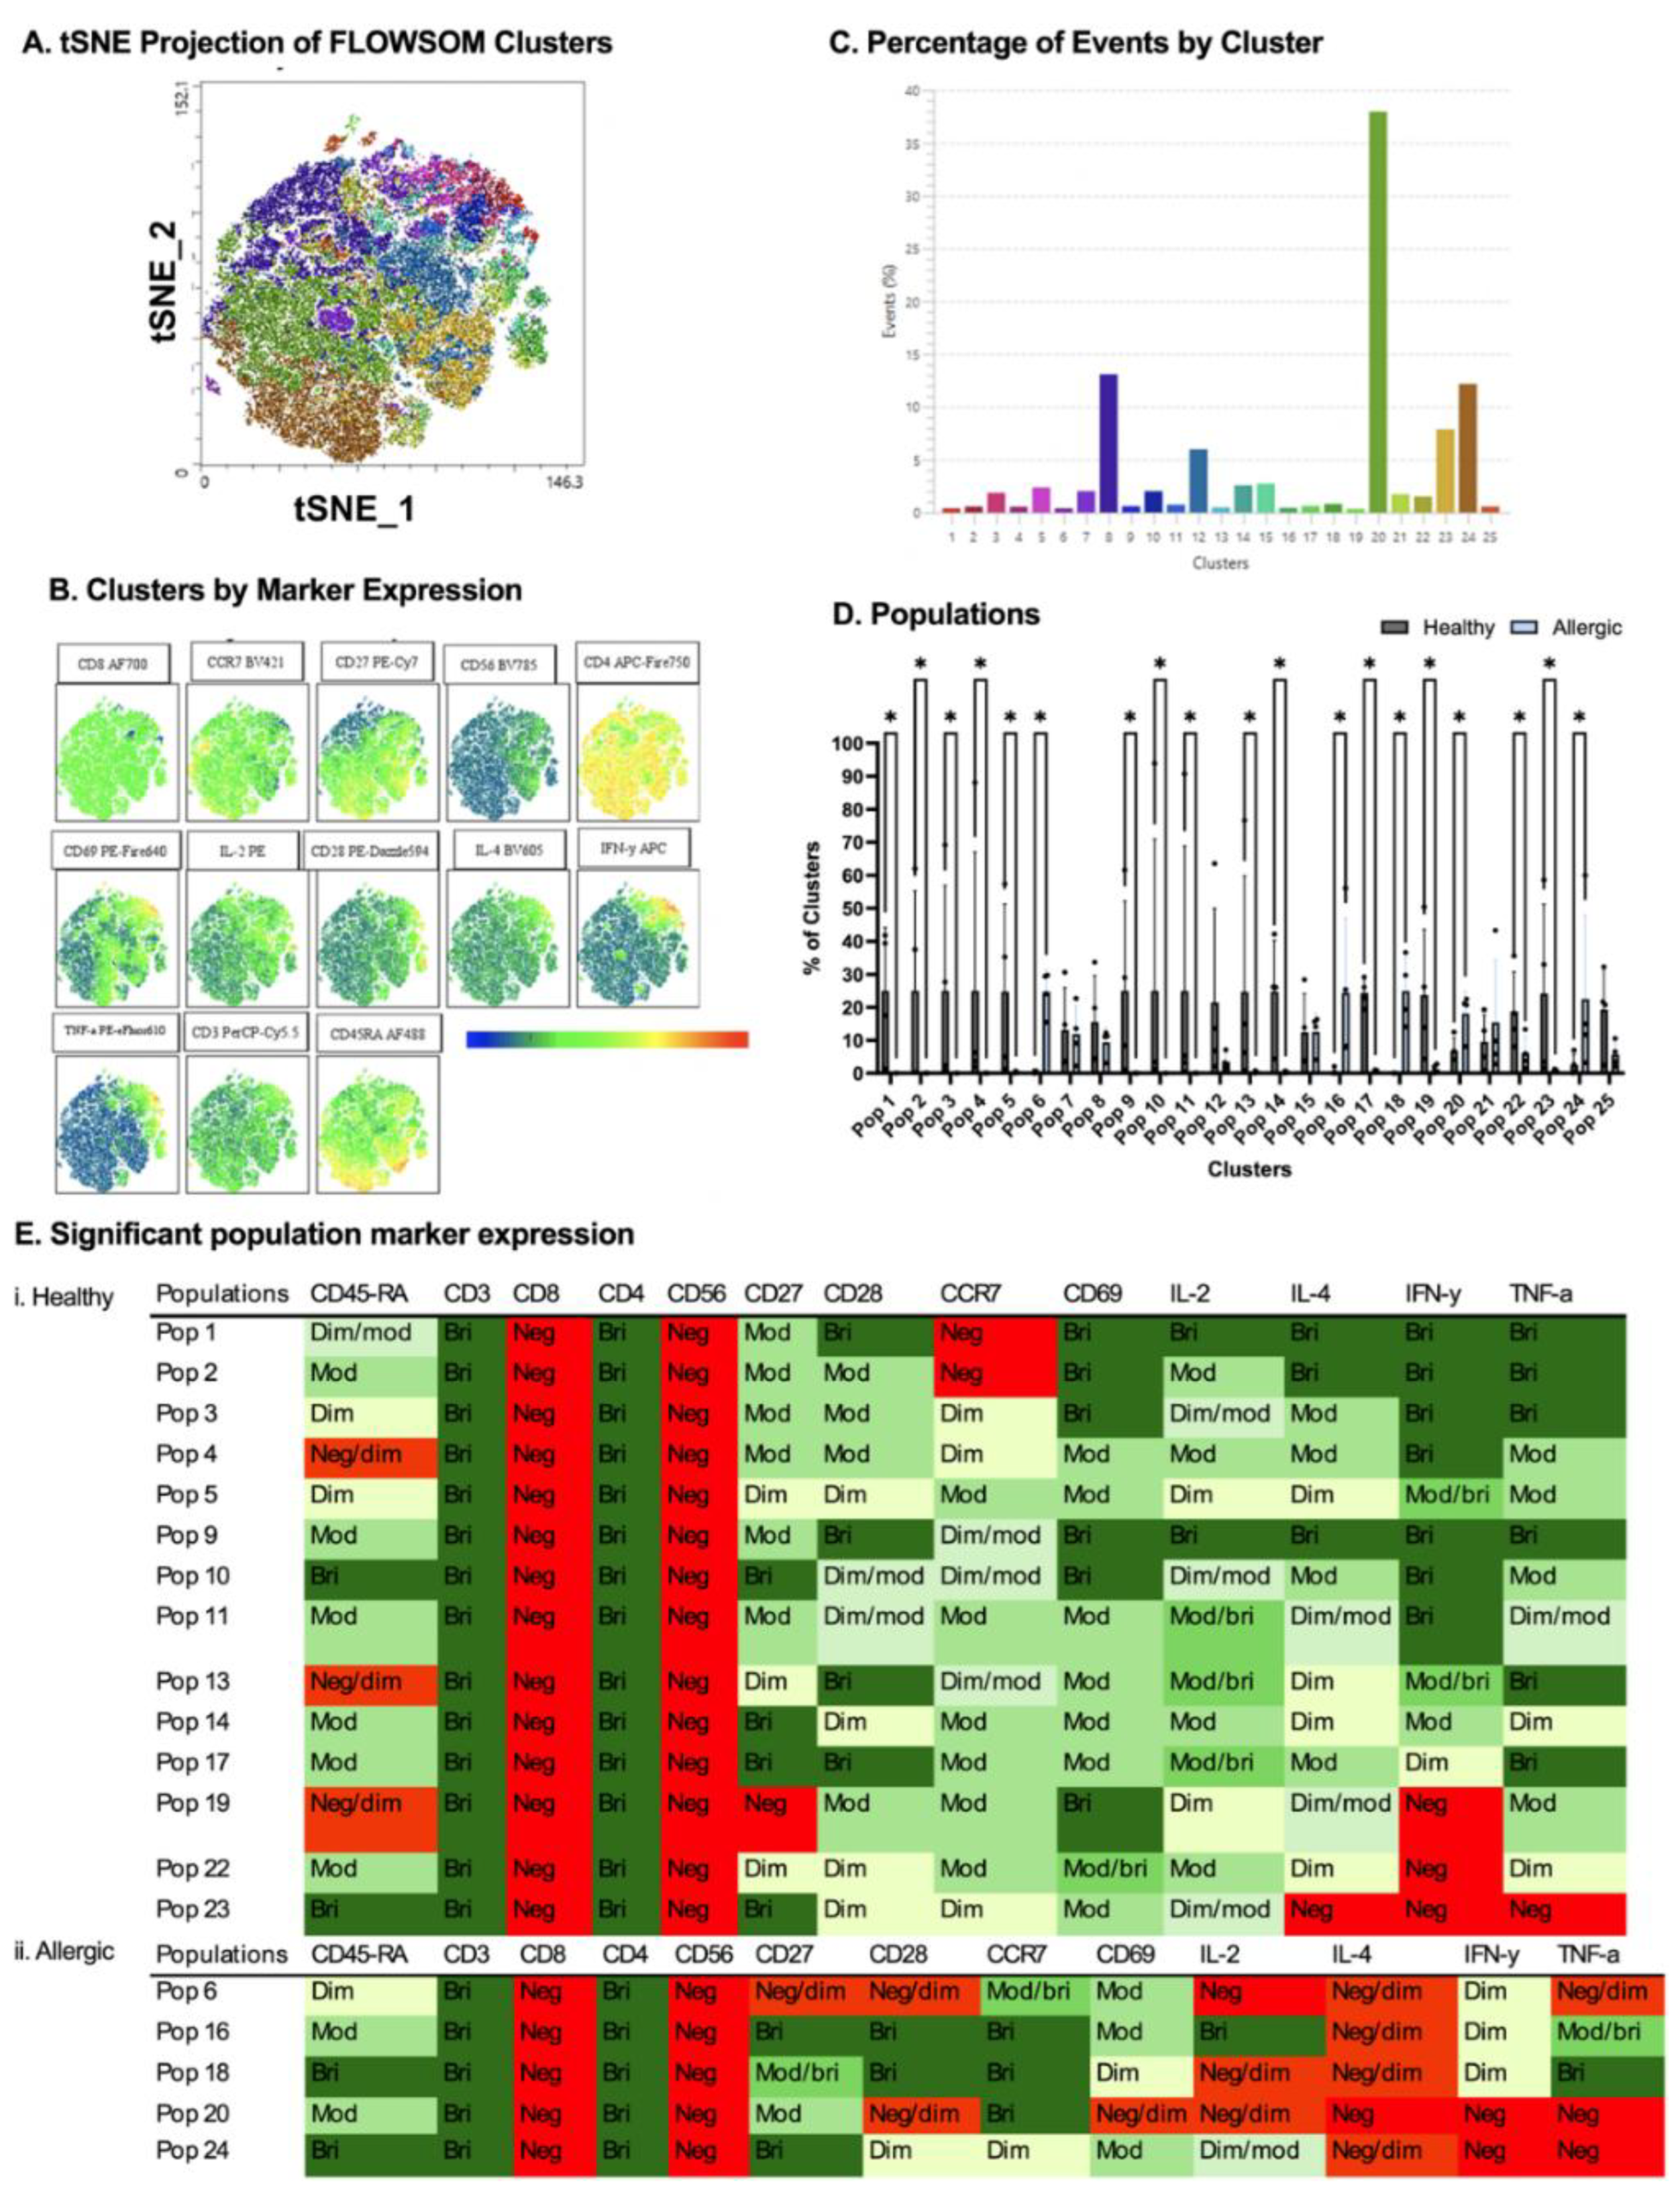
Comparison between healthy and allergic using unbiased clustering analysis following culture with LPS-stimulated DC-derived EVs. Following cluster explorer plugin, a multi-coloured tNSNE plot was made (A) and individual marker clusters were produced from tSNE plot (B). Clusters were separated based on their % (C). (C). Populations between healthy and allergic groups were analysed for significant differences using Mann-Whitney Tests p<0.05 (D). Significant populations were split between healthy and allergic groups, and their marker expression was colour coded - Negative (red), Negative/dim (orange), Dim (pale yellow), Dim/moderate (pale green), Moderate (light green), Moderate/bright (green), Bright (dark green) (Ei.,ii). N= 4 healthy donors, 4 allergic donors.
Figure 6.
Comparison between healthy and allergic using unbiased clustering analysis following culture with LPS-stimulated DC-derived EVs. Following cluster explorer plugin, a multi-coloured tNSNE plot was made (A) and individual marker clusters were produced from tSNE plot (B). Clusters were separated based on their % (C). (C). Populations between healthy and allergic groups were analysed for significant differences using Mann-Whitney Tests p<0.05 (D). Significant populations were split between healthy and allergic groups, and their marker expression was colour coded - Negative (red), Negative/dim (orange), Dim (pale yellow), Dim/moderate (pale green), Moderate (light green), Moderate/bright (green), Bright (dark green) (Ei.,ii). N= 4 healthy donors, 4 allergic donors.
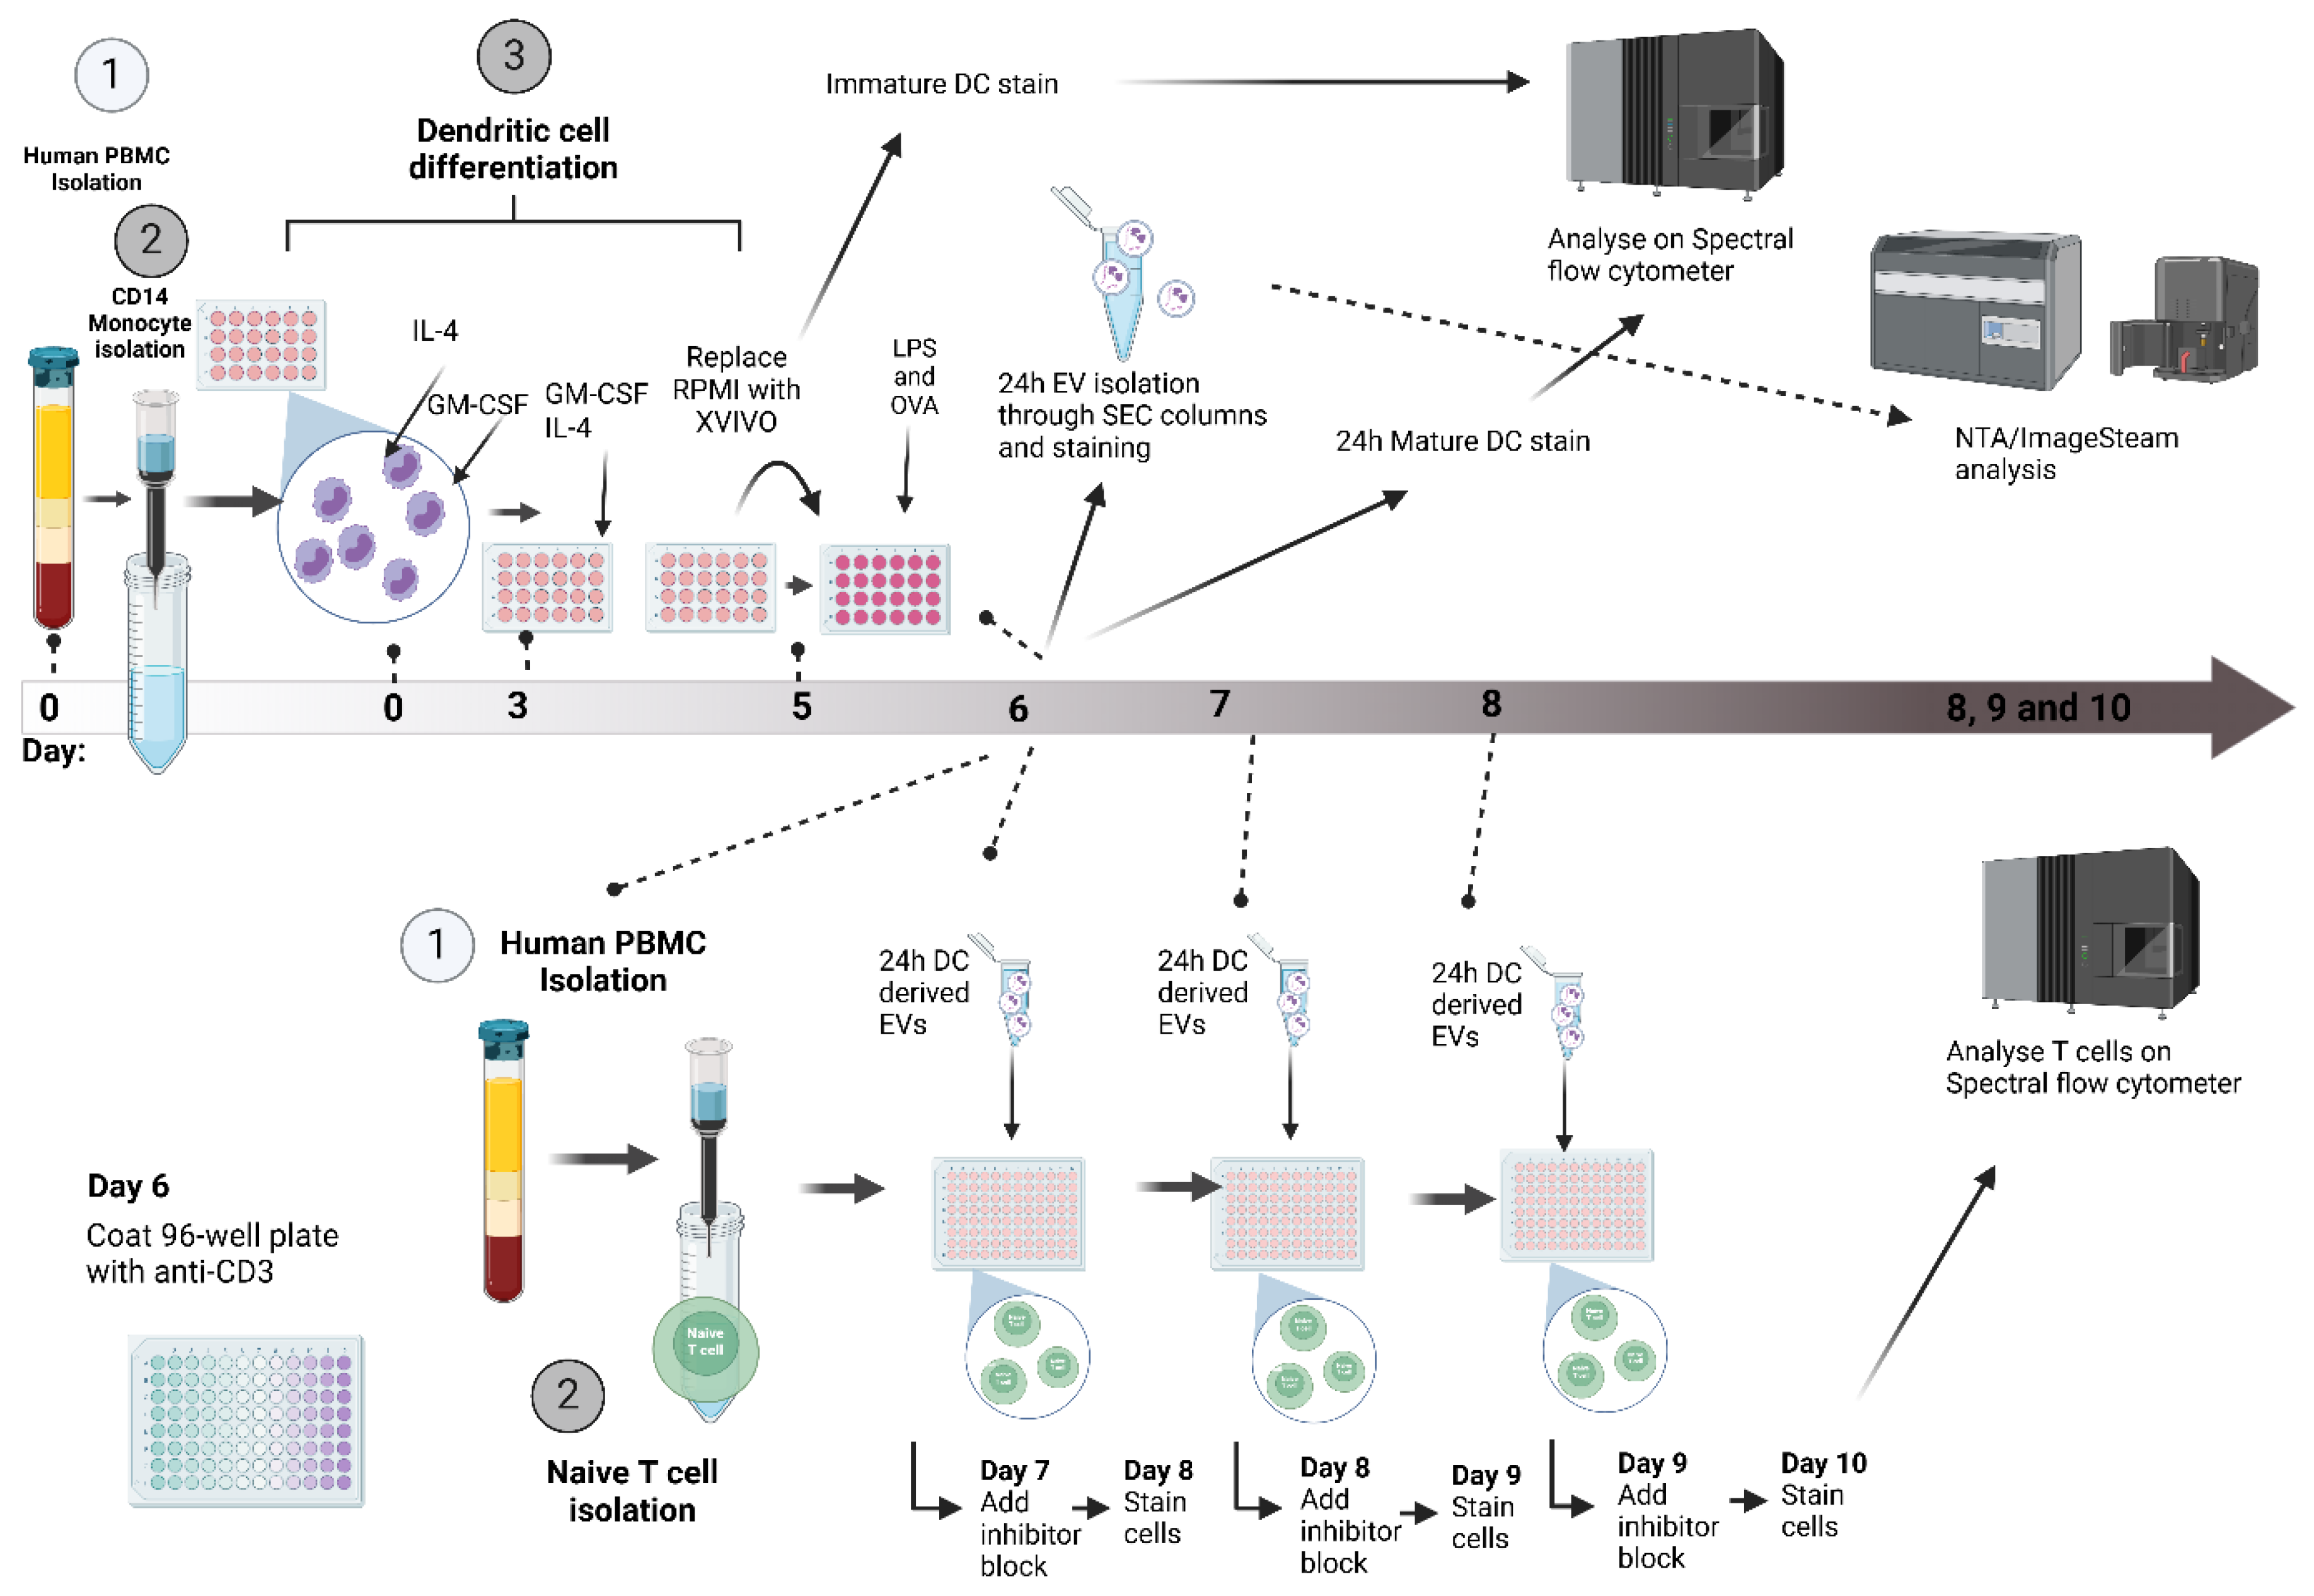
Figure 7.
DC-EV and T cell assay setup. On day 0, human whole blood was collected, and PBMCs were isolated by density gradient (1), followed by CD14+ monocyte isolation using magnetic separation (2). Monocytes were cultured in 48-well tissue culture plates with GM-CSF and IL-4 stimulation in RPMI + 10% FBS to initiate differentiation in dendritic cells, on day 3 the media and cytokines were replenished. On day 5 the media was swapped to serum-free media X-VIVO and stimulated with LPS, OVA and OVA+LPS (3). On day 6 EVs from DCs were collected and isolate through SEC, alongside PBMC 2nd isolation and negative selection of naïve T cells using magnetic separation (1,2). Naïve T cells were exposed to DC EVs for 3 separate doses, and the cells were collected and stained for extracellular and intracellular markers.