
Submitted:
13 December 2025
Posted:
16 December 2025
You are already at the latest version
Abstract
This work presents a unified mathematical framework for understanding how monotone nonlinear transformations reshape data and generate structural forms of distortion, even when order is preserved. We model perception and algorithmic processing as the action of a monotone mapping h(x) applied to an underlying truth variable, showing that curvature alone can alter scale, emphasis, and information content. Using synthetic data drawn from uniform, normal, and bimodal distributions, we evaluate power, root, logarithmic, and logistic transformations and quantify their effects through four complementary measures: Truth Drift for positional change, Differential Entropy Difference for information content, Confidence Distortion Index for confidence shifts, and Kullback–Leibler Divergence for structural variation. Across all experiments, power functions with large exponents and steep logistic curves produced the strongest distortions, particularly for bimodal inputs. Even moderate transformations resulted in measurable changes in entropy, confidence, and positional truth, with strong correlations among the four metrics. The findings provide a geometric interpretation of bias, demonstrating that distortion arises naturally whenever a system curves the input space—whether in human perception or algorithmic pipelines. This framework offers a principled foundation for evaluating the hidden effects of scaling, compression, and saturation, and highlights how the appearance of neutrality can conceal systematic informational shifts.
Keywords:
nonlinear transformations
; distortion metrics
; entropy
; Kullback–Leibler divergence
; information geometry
; algorithmic bias
; perception modeling
; data scaling
1. Introduction
In modern data-driven systems, truth and perception are not always aligned. Whether in psychometric testing, social media algorithms, or recommendation systems, the process of translating raw information into interpretable signals often introduces subtle but measurable distortions. These distortions do not alter the underlying truth itself, but instead reshape how it is seen, much like reflections in a house of mirrors. Psychologists, statisticians, and data scientists have long recognized that both human perception and algorithmic outputs are nonlinear. When individuals assess evidence, rate opinions, or interpret probabilities, their internal scales rarely behave linearly [1]. Likewise, digital systems trained to optimize engagement or classification accuracy often apply nonlinear mappings that magnify some signals while suppressing others. Although this phenomenon is widely recognized, it has rarely been quantified mathematically. Most existing research focuses on qualitative explanations of bias or framing effects, while there remains a need for a mathematical framework that captures how much perception diverges from reality and how this divergence can be measured systematically.
A central challenge is the lack of formal models for perception-distortion mechanisms by which information is transformed without losing order, but with changes in magnitude or emphasis. In psychometrics, scaling transformations such as or are commonly used to adjust survey data, yet the same transformations can profoundly reshape model outcomes. The “psychometric house-of-mirrors” study [2] demonstrated that even monotone, order-preserving nonlinear transformations can reverse or distort predictions in opinion-dynamics models. Their findings reveal a deeper problem: when perception is measured or processed through a nonlinear lens, even consistent and rational systems can create illusions of objectivity—outputs that appear balanced and factual, but are mathematically biased by scale distortions. This paper builds upon that foundation by proposing a quantitative model of perception distortion that unites psychometric scaling theory with information-theoretic analysis.
Formally, we model perception distortion as an order-preserving but nonlinear transformation h applied to an underlying truth variable X, yielding an observed signal that preserves rank while warping magnitude and emphasis. On this foundation, we introduce a family of quantitative indicators that connect mathematical structure to cognitive and informational interpretations: Truth Drift (TD) for systematic displacement from ground truth; Differential Entropy Difference (DED) for changes in uncertainty; a Confidence Distortion Index (CDI) that contrasts stated confidence with calibrated probabilities; and Kullback–Leibler divergence to quantify information loss between pre- and post-transformation distributions. Controlled simulations on synthetic datasets drawn from uniform, normal, and bimodal distributions visualize how increasing nonlinearity alters apparent truth and show how these metrics respond across regimes. Interpreting these outcomes in psychological and informational terms—bias, overconfidence, and information loss—allows the House of Mirrors to function not only as a metaphor, but as a testable mathematical framework for expressing, measuring, and, in principle, correcting distortion in both human and algorithmic systems.
The remainder of this paper is organized as follows. Section 3 introduces the mathematical framework for monotone nonlinear transformations and formally defines the proposed distortion metrics. Section 4 describes the simulation design, including the choice of distributions and transformation families. Section 5 presents the quantitative results, comparing how Truth Drift, Differential Entropy Difference, Confidence Distortion Index, and Kullback–Leibler divergence respond across nonlinear regimes. Section 6.1 interprets these findings in psychological, statistical, and information-theoretic contexts, highlighting links to perceptual bias and algorithmic distortion. Finally, Section 7 summarizes the contributions of the work and outlines future directions, including applications to psychometrics, risk communication, and algorithmic transparency.
2. Literature Foundation
Nonlinear distortions between underlying truth and observed measurements have been recognized in psychology, psychometrics, and information science for decades. Recent work has highlighted that even monotone, order-preserving transformations can meaningfully reshape the output of statistical and computational models. This section summarizes the key foundations relevant to the present study.
2.1. Nonlinear Distortion in Psychometric Models
A central inspiration for this work is the “psychometric house-of-mirrors” framework introduced by Carpentras and Quayle [2], who demonstrated that nonlinear but monotone transformations can substantially alter the outcomes of opinion-dynamics models. Their findings show that measurement scales in psychology are rarely linear: the distance between response categories is not constant, and the mapping from latent attitudes to numerical ratings often exhibits curvature. Using transformations of the form with and , they showed that model outputs based on the transformed variable can diverge dramatically from those based on the latent variable X. In simulations of Deffuant and Hegselmann–Krause models, transformations such as or were capable of flipping predictions from consensus to polarization or vice versa. Their work established that scale distortion is not merely a methodological inconvenience but a structural force with measurable effects. However, the magnitude of such distortion across transformation families remains largely unquantified.
2.2. Measurement Theory and Nonlinear Scaling
Classical measurement theory often assumes that numerically assigned values behave linearly and additively. Yet psychological, perceptual, and judgment-based data rarely satisfy these assumptions. Sensory perception, for instance, follows nonlinear laws such as Fechner’s logarithmic relation [3], while psychometric response functions frequently exhibit logistic or power-law structures [4]. Letting denote the perceived or measured value of a true stimulus X, the shape of the monotone function h determines how information is encoded and emphasized. Power functions compress or exaggerate high values, logarithmic mappings produce diminishing sensitivity, and sigmoidal functions suppress extremes while sharpening central differences. These transformations preserve ordinal structure but distort spacing, thereby generating systematic forms of perceptual bias. Understanding such mappings mathematically is essential to characterizing distortion in both human judgment and algorithmic systems.
2.3. Information-Theoretic Characterization of Distortion
Information theory provides quantitative tools for analyzing how distributions change under monotone transformations. When a variable X is transformed through , the resulting density follows
Although rank ordering is preserved, the two distributions generally differ in uncertainty, spread, and information content. Differential entropy captures changes in distributional variability, with compressive transformations reducing entropy and expansive ones increasing it. Divergence measures such as Kullback–Leibler divergence quantify the informational discrepancy between and , while symmetric variants such as Jensen–Shannon divergence offer bounded measures of representational shift. These metrics formalize distortion as a measurable change in informational structure rather than a subjective or qualitative concept.
2.4. Contribution of the Present Work
Existing literature has identified that monotone nonlinear transformations distort model outputs, but has not provided a unified framework for measuring the extent of this distortion across different transformation families. The present study extends prior work by introducing four complementary metrics—Truth Drift, Differential Entropy Difference, Confidence Distortion Index, and Kullback–Leibler divergence—that quantify how monotone curvature reshapes perception and information. By synthesizing insights from psychometric scaling, information theory, and applied mathematics, this paper establishes a generalizable framework for analyzing distortion in both human perceptual systems and data-driven algorithms. The proposed approach enables systematic comparison of transformations and clarifies how mild nonlinearities can lead to significant perceptual or computational biases.
3. Mathematical Framework
This section develops the mathematical foundation for modeling perception distortion as the result of monotone but nonlinear transformations. Prior work has shown that such transformations can qualitatively alter human judgments and model outcomes [2]; here, we formalize these effects within a quantitative analytical framework. Let X denote a true underlying variable and the perceived or transformed representation, where h is order-preserving but scale-distorting. The goal is to characterize how curvature in h reshapes distributions, modifies uncertainty, and shifts the informational structure of signals.
3.1. Monotone Nonlinear Transformation Model
Let represent a latent quantity such as belief strength, evidence value, or a probability of truth. Perception is modeled through
where ensures monotonicity (preservation of rank order), and introduces nonlinear scaling. Different choices of h correspond to different perceptual behaviors, with curvature controlling how sensitivity varies across the range. Representative examples include:
| Transformation | Behavior | Interpretation |
| Compresses the upper portion of the scale | Conservative or skeptical perception | |
| Expands upper values | Overconfidence or amplification bias | |
| Diminishing sensitivity across the range | Apathy or desensitization | |
| Compresses the center, exaggerates extremes | Polarization or binary thinking |
All such transformations preserve order but distort spacing, creating uneven perceptual sensitivity across the same numerical interval.
3.2. Transformation of Probability Distributions
If X has density , then the distribution of follows the standard change-of-variables formula:
While total probability is conserved, the transformation redistributes mass within the domain, potentially concentrating or diffusing density depending on the local curvature of h. This redistribution represents the mathematical core of perceptual distortion: the signal is not misordered, but its informational geometry is altered.
3.3. Distortion Metrics
To quantify the magnitude and nature of distortion induced by h, we consider four complementary metrics. Each captures a different dimension of divergence between X and Y.
(a) Truth Drift (TD)
Truth Drift measures the average deviation between true values and their transformed counterparts:
TD equals zero only for the identity transformation ; any curvature produces nonzero drift.
(b) Differential Entropy Difference (DED)
Entropy difference quantifies the change in uncertainty induced by the transformation:
Negative values indicate entropy loss (compression), while positive values indicate entropy gain (expansion). Examples include entropy reduction under and entropy increase under .
(c) Confidence Distortion Index (CDI)
CDI captures relative changes in variability:
If , the transformed variable displays reduced variation, signaling underconfidence or conservative perception. If , variability is amplified.
(d) Kullback–Leibler Divergence
KL divergence measures the informational cost of approximating the true distribution with the transformed distribution :
Higher values correspond to greater informational distortion and poorer fidelity.
3.4. Analytical Behavior Across Transformation Families
These metrics reveal systematic patterns across different nonlinear mappings. Table 1 summarizes the directional effects on entropy, variability, and drift.
These analytical properties illustrate how even mild curvature can meaningfully reshape perceived information, producing effects ranging from subtle underconfidence to strong polarization.
4. Methods and Experimental Design
This section describes the methodological framework used to evaluate how monotone nonlinear transformations generate measurable distortion in data distributions. The analysis proceeds in two complementary stages. The first experiment characterizes how transformation families reshape synthetic data and influence four quantitative distortion metrics: Truth Drift (TD), Differential Entropy Difference (DED), Confidence Distortion Index (CDI), and Kullback–Leibler divergence (KL). The second experiment aggregates these results to examine system-level distortion behavior, drawing parallels to amplification, suppression, and compression effects commonly observed in algorithmic information systems. All simulations are conducted on synthetic data to ensure interpretability, replicability, and isolation of the mathematical effects of nonlinearity [2].
4.1. Experimental Objectives and Data Generation
The experimental design addresses two objectives:
- Transformation Behavior and Metric Response: quantify how monotone transformations (power, root, logarithmic, logistic) affect distributions and distortion metrics across parameter sweeps.
- System-Level Distortion Patterns: evaluate aggregated distortion across transformation families to identify broader tendencies such as amplification, omission, or polarization.
Synthetic datasets are drawn from three representative distributions:
- Uniform : models equal-information environments.
- Normal : models centralized or balanced systems.
- Bimodal : models polarized or segmented populations.
Each dataset contains 10,000 samples generated with NumPy (np.random.seed(42)), ensuring reproducible results across runs.
4.2. Simulation Pipeline
For each base distribution, samples X are transformed according to
where is the parameter controlling the curvature or slope of the transformation. For every transformed dataset, TD, DED, CDI, and KL are computed, and the resulting metric values are recorded across parameter sweeps. The two experiments differ in scope and summarization method, as described below.
Experiment 1: Transformation Behavior and Metric Analysis
Experiment 1 evaluates how individual transformations reshape distributions and influence distortion metrics. The following transformation families are applied:
- Power functions: , with
- Root transformation:
- Logarithmic: , with
- Sigmoid: , with
For each transformation, metrics are computed as follows:
Numerical integration and estimation procedures follow the methods described by Ascher and Greif [7]. Output figures include transformation curves, derivatives, and metric trajectories across parameter sweeps. Supplementary details and extended parameter ranges are provided in the Appendix.
Experiment 2: Aggregated Distortion Patterns
Experiment 2 applies the same transformations and parameters as Experiment 1 in order to enable direct comparison. For each distribution and transformation family, the mean, maximum, and variance of each distortion metric are computed. These aggregated values characterize how each family behaves at a system level, analogous to how algorithmic filters amplify, suppress, or redistribute information.
System-level summaries are reported in tabular form, and composite figures (e.g., TD Across Transformations, DED Across Transformations) illustrate hierarchical patterns. Correlation matrices and scatterplots provide insight into joint relationships among metrics. All supplementary plots are included in the Appendix.
4.3. Validation and Reproducibility
All simulations are fully deterministic. Random sampling is controlled using a fixed seed (np.random.seed(42)), and identical parameter grids are applied across both experiments. Numerical outputs are exported as CSV files, and visualizations are saved at 300 dpi with embedded axis labels to ensure consistent rendering. Re-running the full simulation pipeline reproduces all metric values within a numerical tolerance of .
4.4. Limitations
The experiments in this study use idealized monotone transformations applied to synthetic data. Real-world systems may involve nonmonotonic dynamics, feedback loops, adaptive filtering, or context-dependent updates. While the selected metrics (TD, DED, CDI, KL) capture key aspects of distortion, future work may incorporate additional measures such as Jensen–Shannon divergence or Wasserstein distance to broaden the analytical scope.
5. Results and Analysis
5.1. Overview of Experimental Results
This section presents the quantitative results and interpretive analysis of two connected experiments designed to model and measure how mathematical transformations produce both structural and perceptual distortions. In Experiment 1, the focus is on how specific transformation families—power, logarithmic, logistic, and a root variant—reshape data distributions and alter four key distortion metrics: TD, DED, CDI, and KL. Together, these metrics provide a multidimensional view of how transformations change both the geometry of data and the information it conveys.
In Experiment 2, the same mathematical framework is extended in a “House of Mirrors” simulation, where transformations emulate algorithmic filtering and amplification effects that appear in real-world data ecosystems. The goal of this second stage is to connect quantitative evidence of distortion with the broader conceptual framework of this work: that selective transformations—whether intentional or emergent—can create an illusion of objectivity by changing what remains visible within an information system.
Across both experiments, a unifying principle emerges: distortion does not require malice or error. It can arise naturally through the ordinary mechanics of scaling, normalization, and selective emphasis. The sections that follow describe the measured patterns and their interpretive significance, showing how mathematical transformation acts as both a metaphor and a mechanism for cognitive and algorithmic bias [2,7].
5.2. Transformation Behavior
Experiment 1 begins by examining how each transformation family behaves across the three base distributions (Uniform, Normal, Bimodal). Each transformation is monotone, preserving order while reshaping scale, density, and curvature in distinctive ways.
Figure 1a–d show representative transformation functions for the power, root, logarithmic, and logistic families. Power transformations follow a predictable pattern: when , they compress high values toward the mean (concave shape); when , they exaggerate high values (convex shape). The root transformation () illustrates gentle curvature and smoothing. Logarithmic transformations expand the lower end of the distribution—making small variations appear larger—while compressing the upper end. As the scaling constant a increases, curvature intensifies and early variation is emphasized more strongly. Logistic transformations model bounded amplification: an S-shaped curve with saturation at both extremes. As the slope parameter k increases, the curve steepens near the midpoint, compressing peripheral data and accentuating central content. This dynamic mimics algorithmic curation, where information near an attention threshold receives disproportionate weight, while fringe content fades.
Figure 2a,c plot the derivatives of these functions, providing a direct visualization of information sensitivity—how rapidly perceived change (output) responds to actual change (input). Power and logarithmic derivatives shift smoothly, while the logistic derivative forms a sharp localized peak: a quantifiable analogue of attention bias. Around that inflection point, small input differences produce outsized perceptual changes, while regions outside remain comparatively inert.
5.3. Metric-Based Analysis
To quantify how transformations reshape informational and perceptual structure, the four distortion metrics were computed across the shared parameter grid and all three base distributions.
Truth Drift (TD) measures the average displacement between original and transformed values—how far the “truth” moves under curvature. TD rises nonlinearly with intensity: high-order power functions show large drift; logarithmic transformations moderate it; logistic transformations often exhibit smaller but sometimes nonmonotonic patterns around specific k values.
Figure 3.
Truth Drift (TD) across transformation parameters for selected transformation families and base distributions.
Figure 3.
Truth Drift (TD) across transformation parameters for selected transformation families and base distributions.
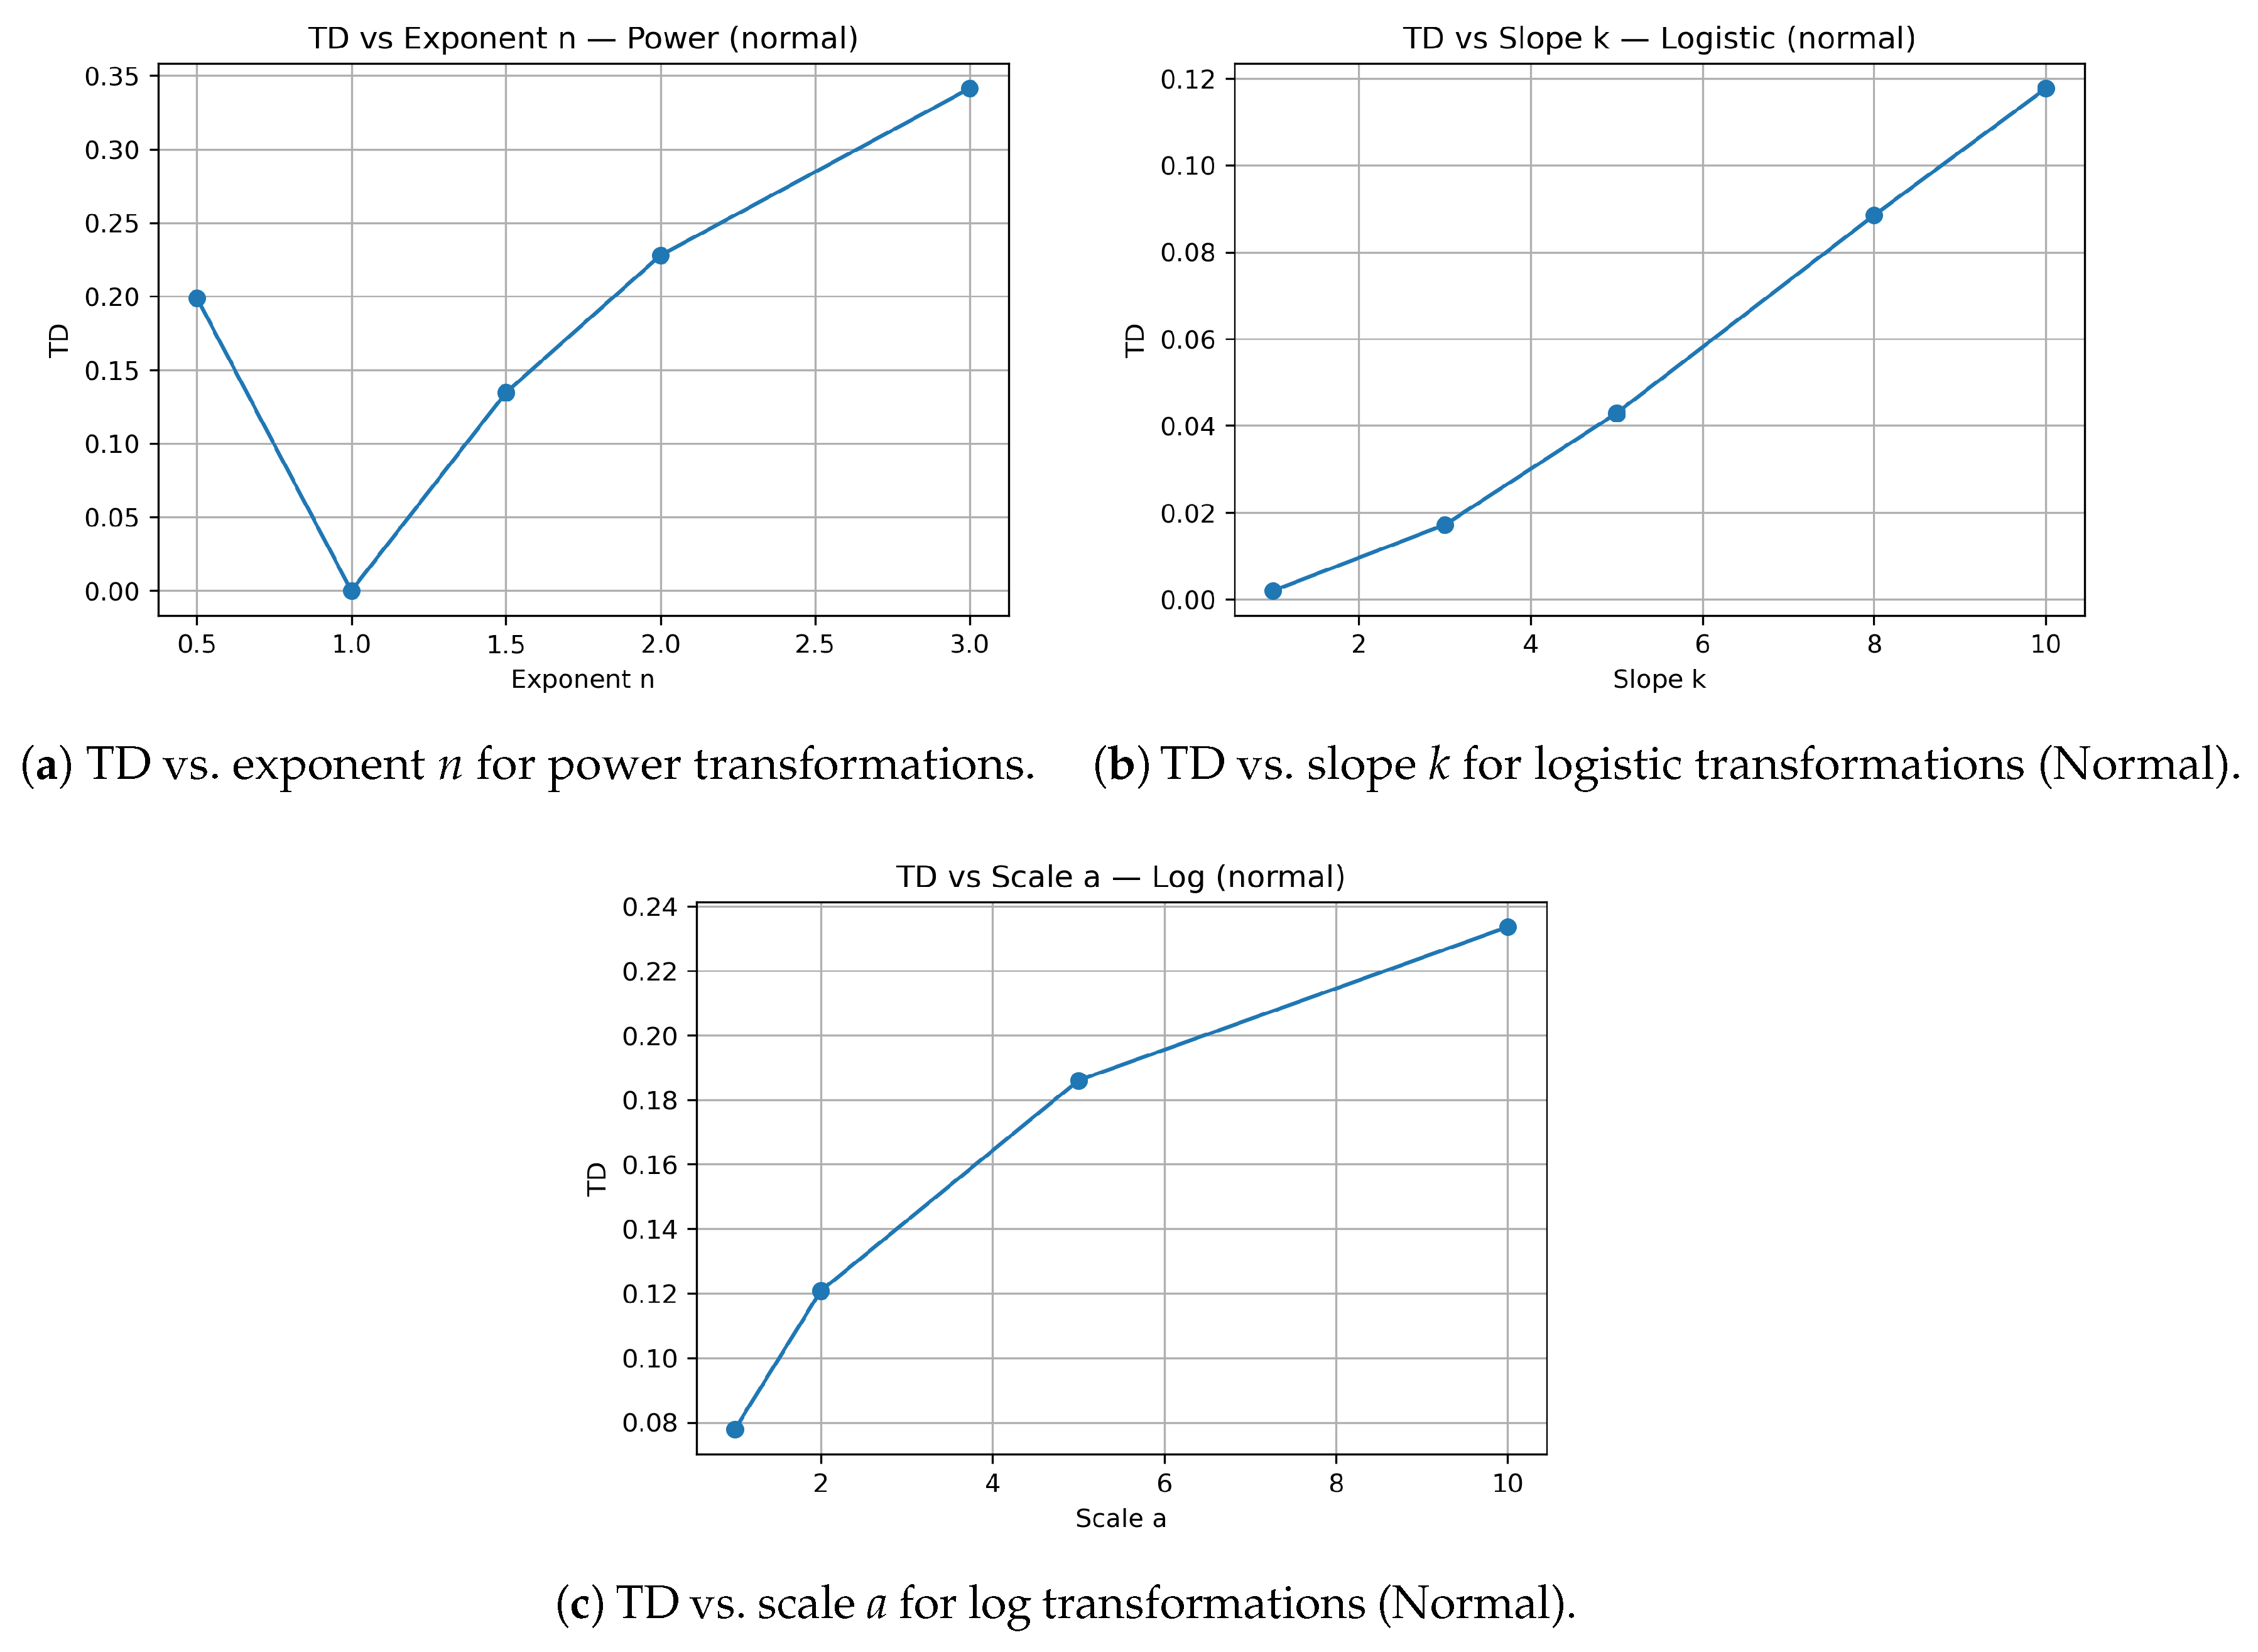
Figure 4.
Differential Entropy Difference (DED) across transformation parameters for power, logarithmic, and logistic families (Normal base distribution).
Figure 4.
Differential Entropy Difference (DED) across transformation parameters for power, logarithmic, and logistic families (Normal base distribution).
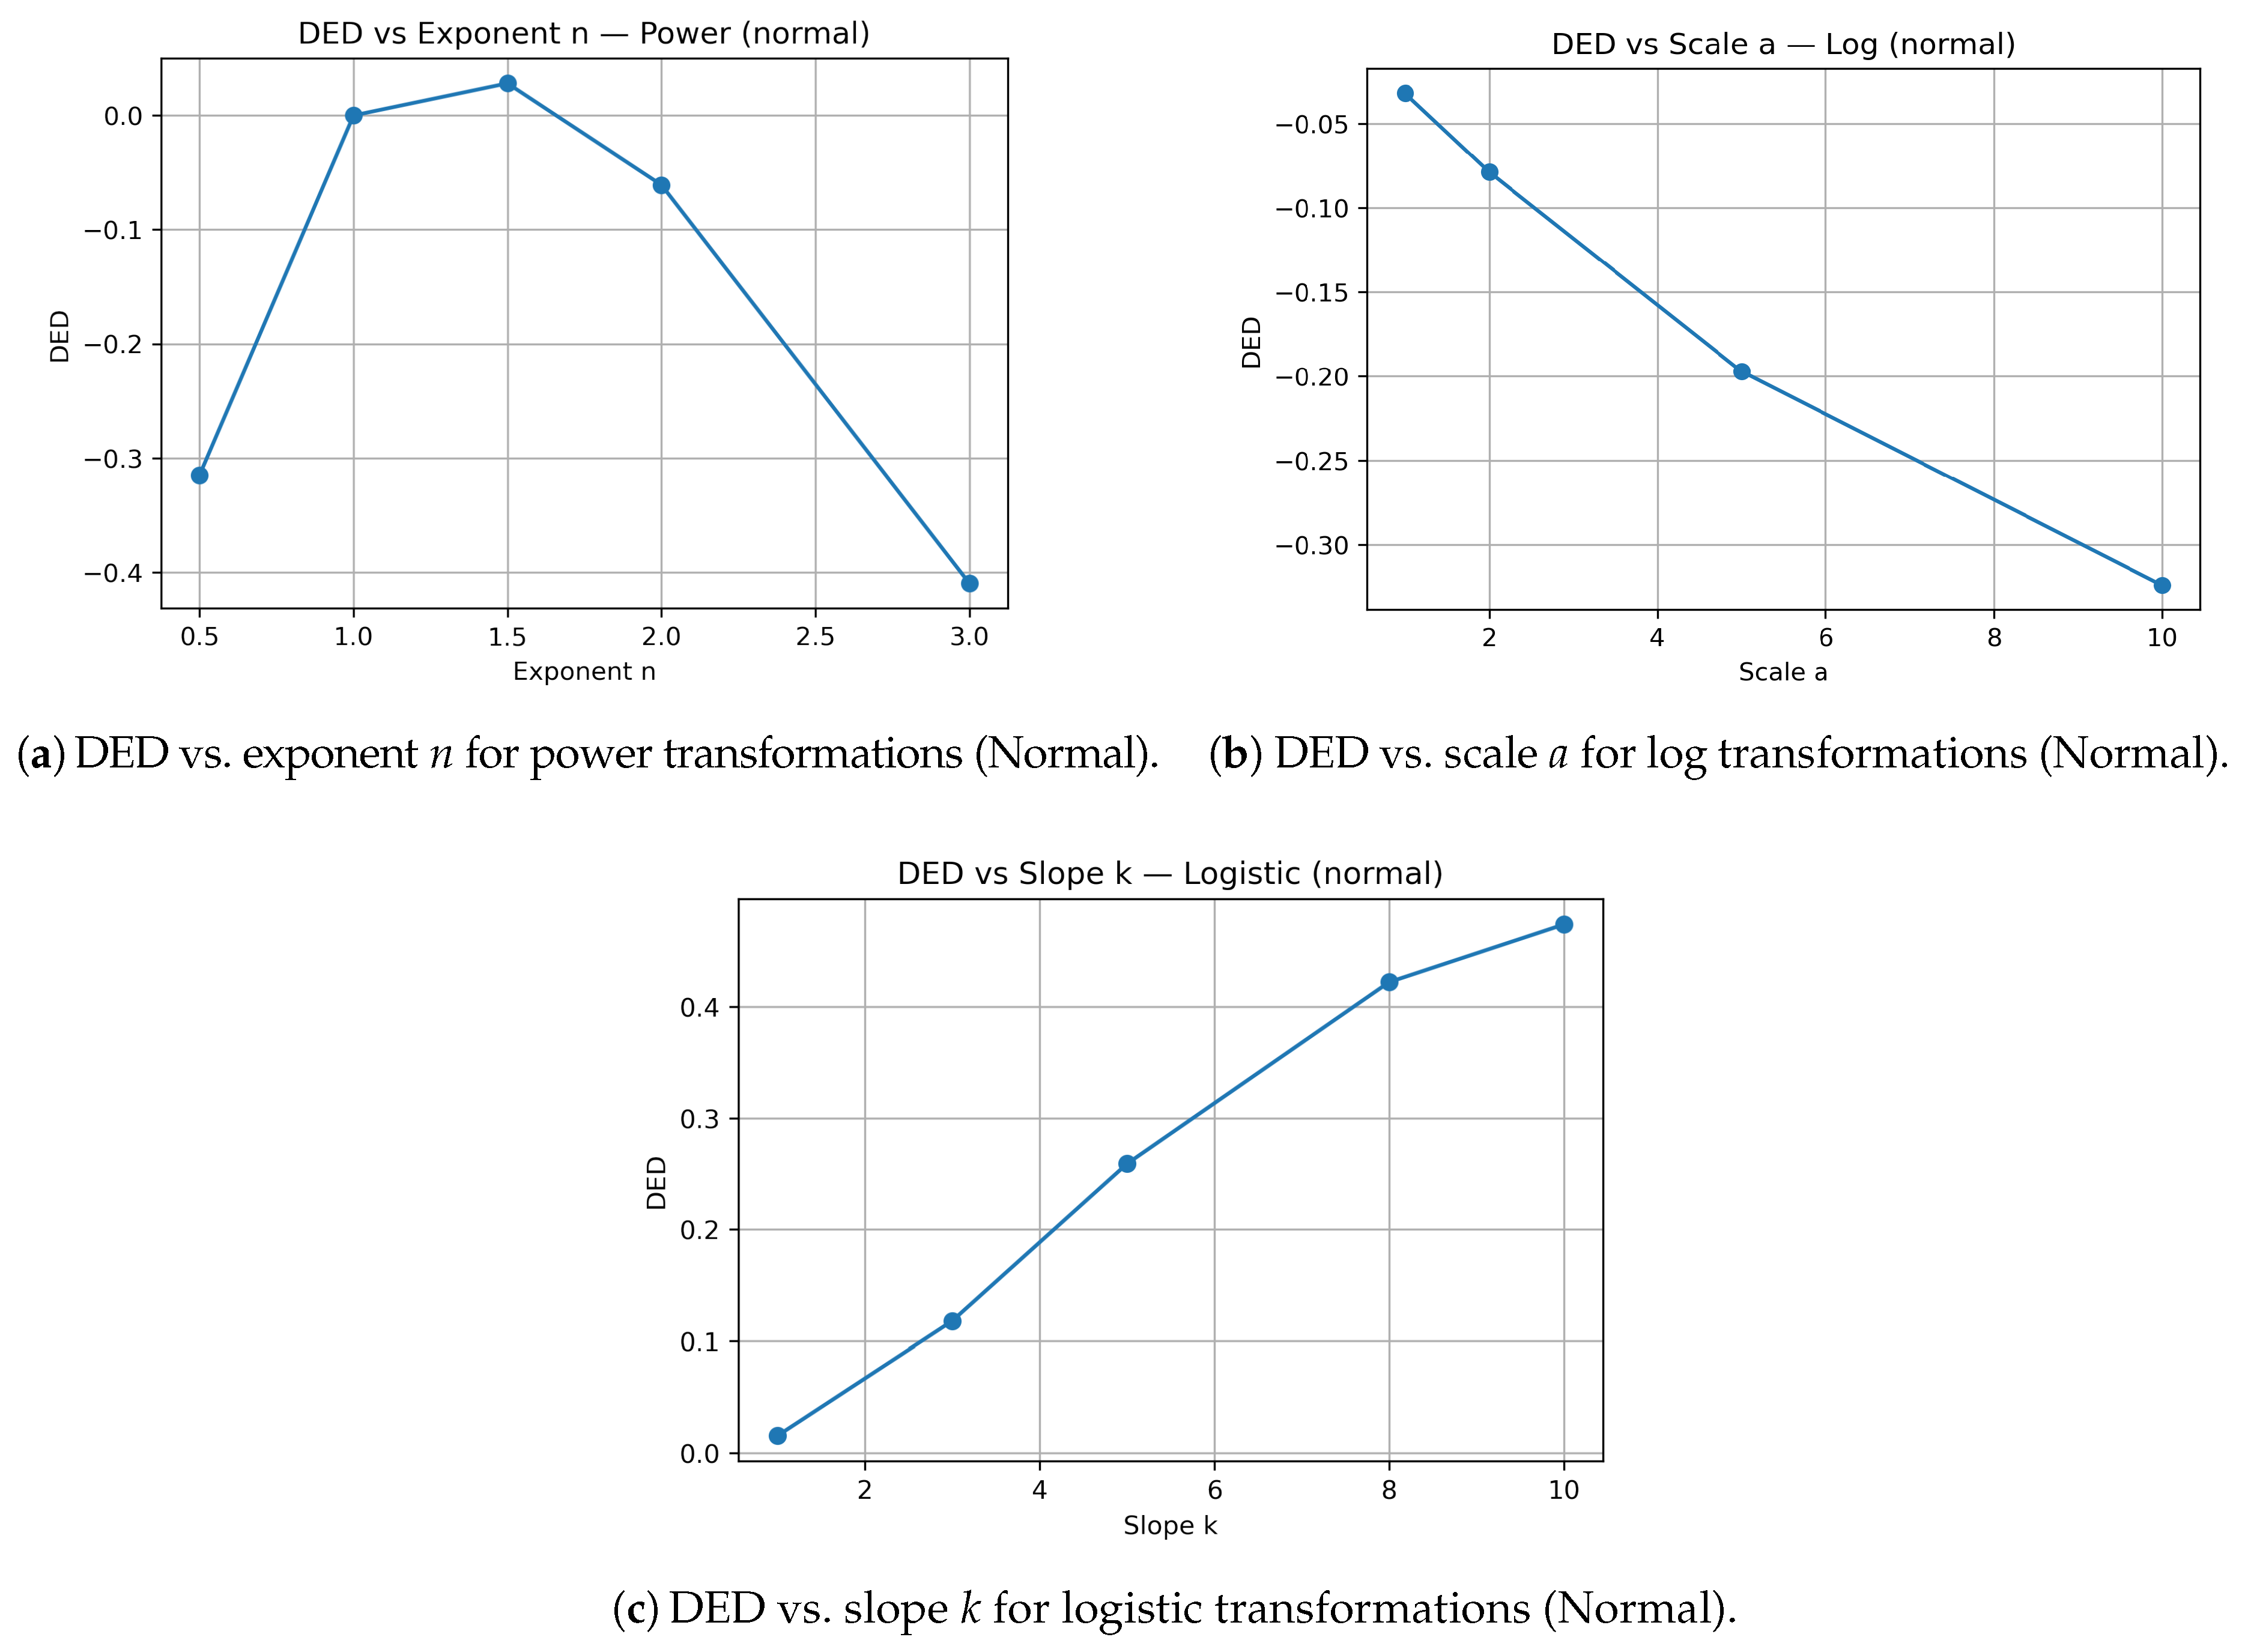
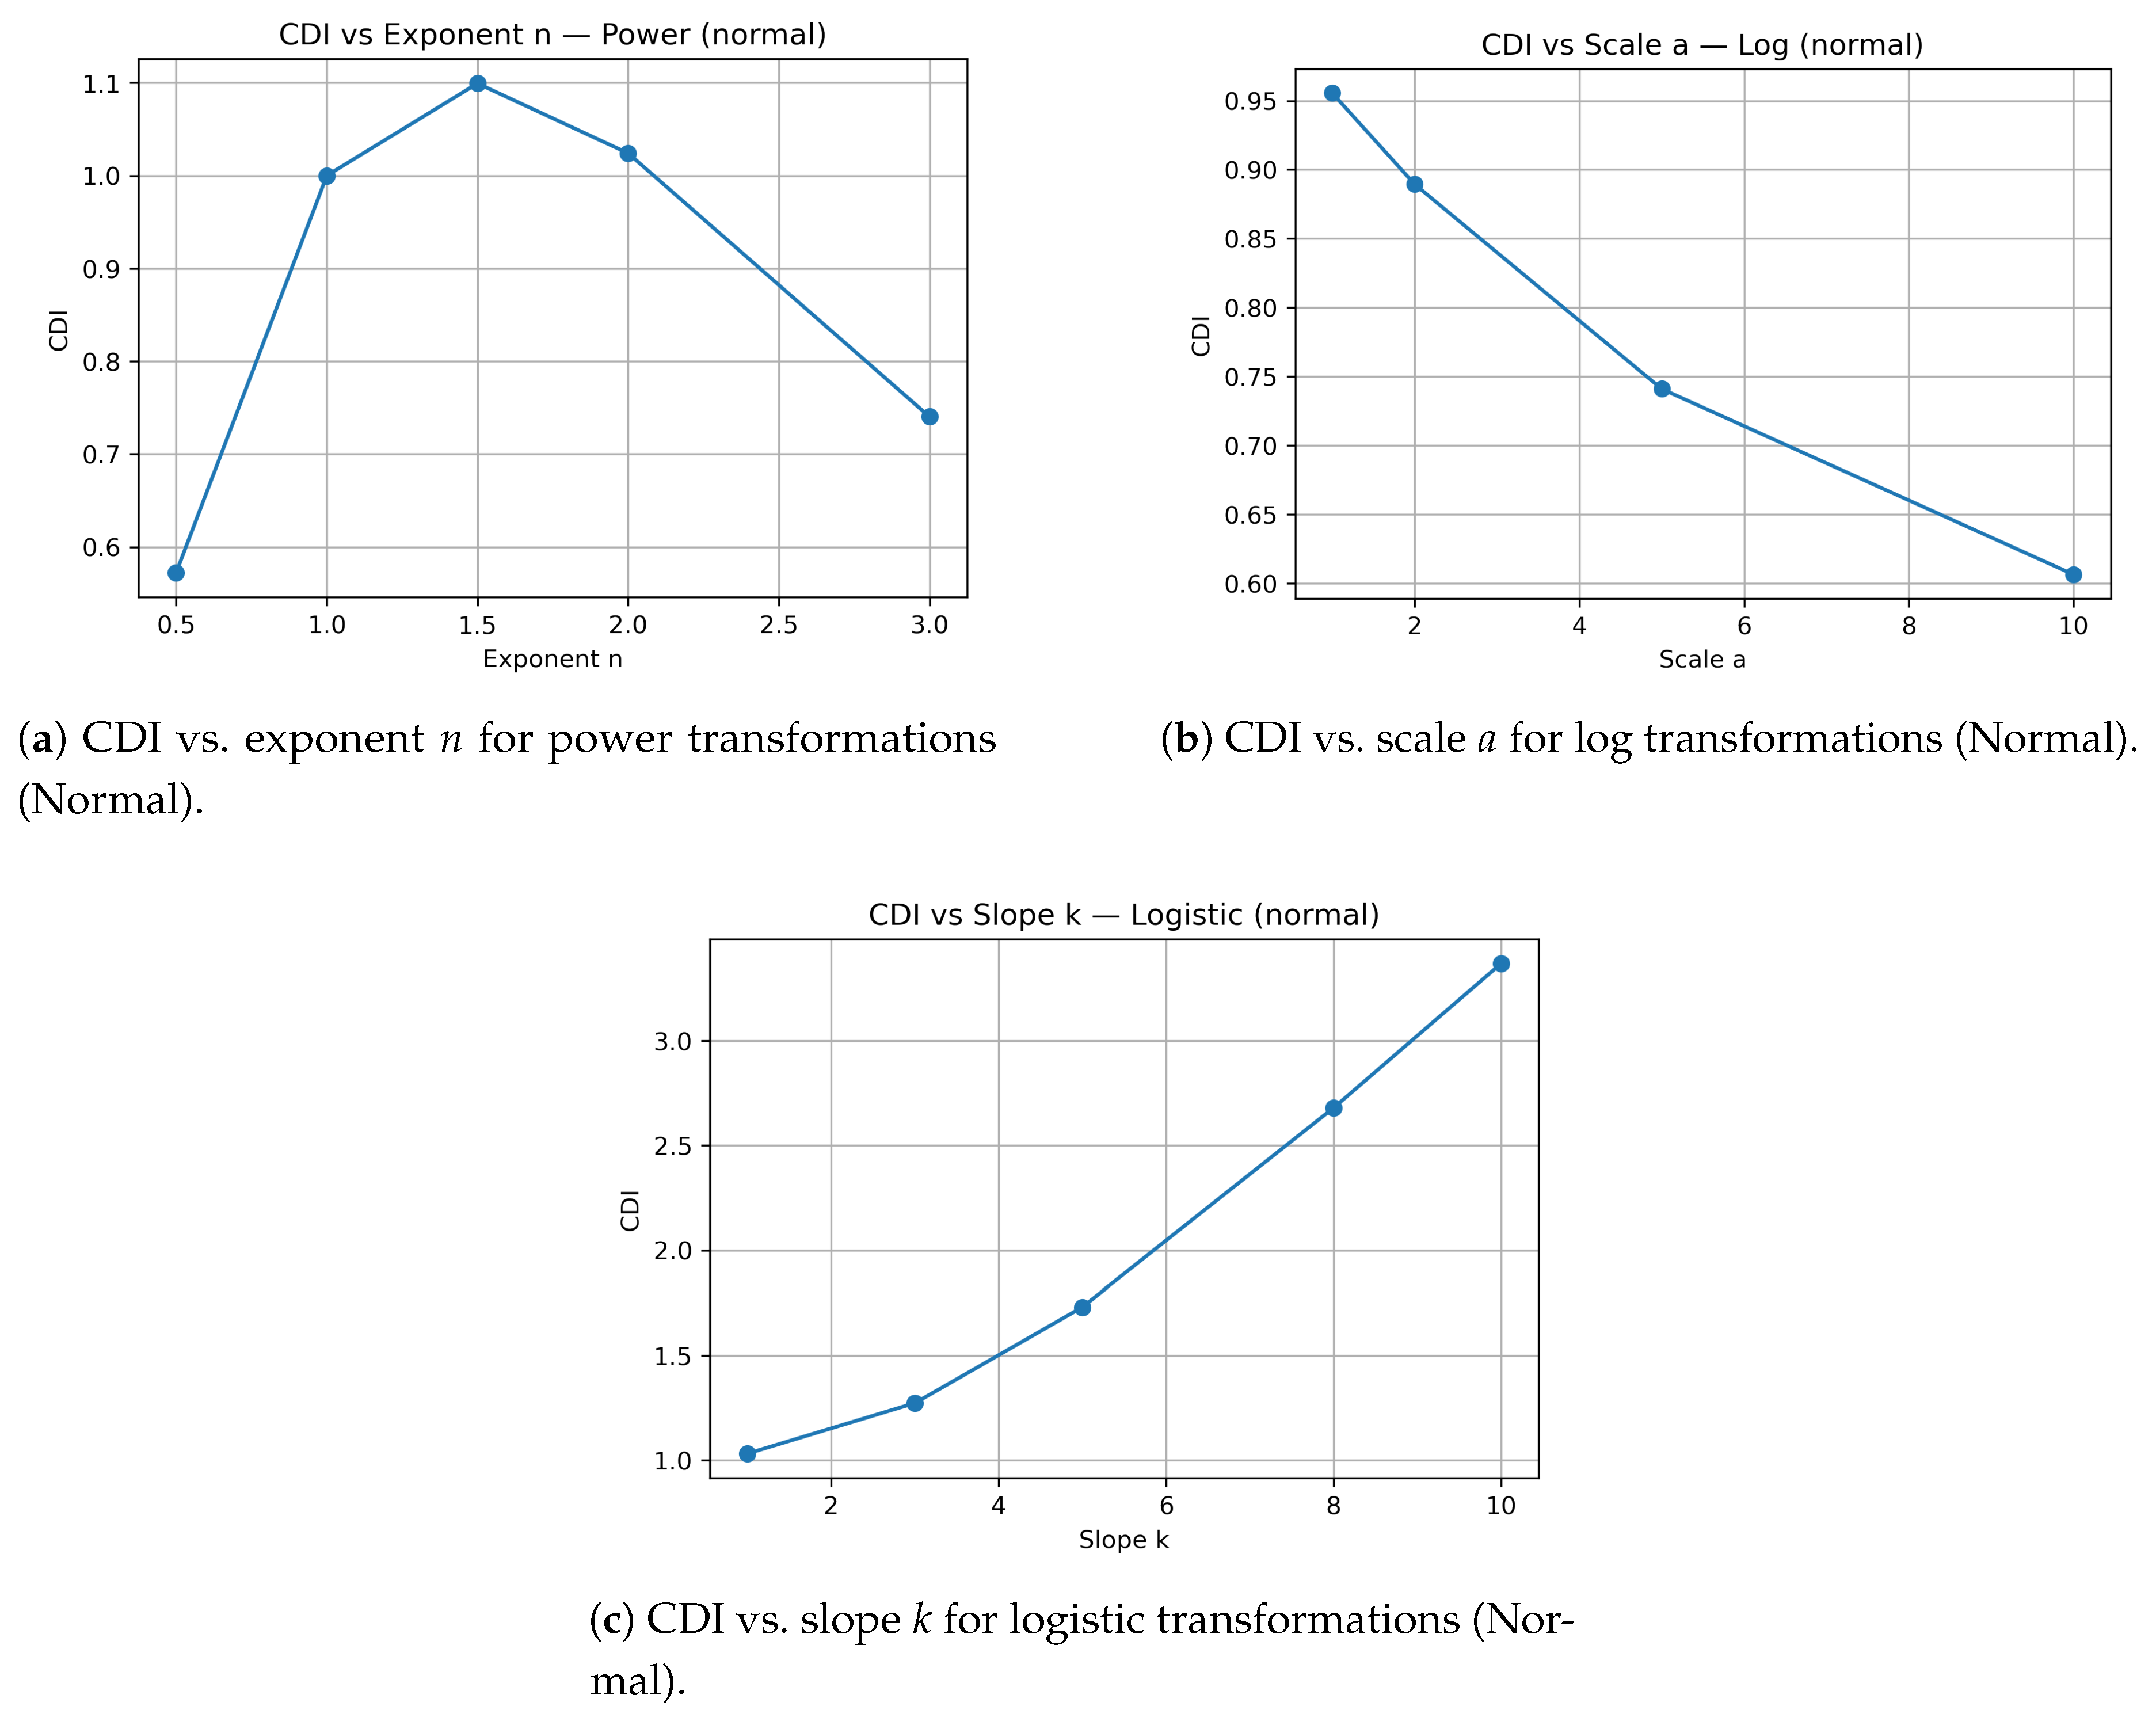
Figure 5.
Confidence Distortion Index (CDI) across transformation parameters for power, logarithmic, and logistic families (Normal base distribution).
Figure 5.
Confidence Distortion Index (CDI) across transformation parameters for power, logarithmic, and logistic families (Normal base distribution).
DED captures net compression or expansion of information [5,6]. Positive DED indicates added complexity; negative DED indicates homogenization. Power transformations with large exponents and steep logistic curves tend to reduce entropy, suggesting convergence toward simpler, less varied states reminiscent of echo-chamber effects.
The Confidence Distortion Index (CDI) measures how variance changes under transformation. Values above 1 signify amplified variance (overconfidence), while values below 1 indicate compression (underconfidence). Power transformations on Normal data yield –; on bimodal data, CDI can exceed . Logarithmic curves consistently suppress CDI (), producing the effect of cautious or conservative bias.
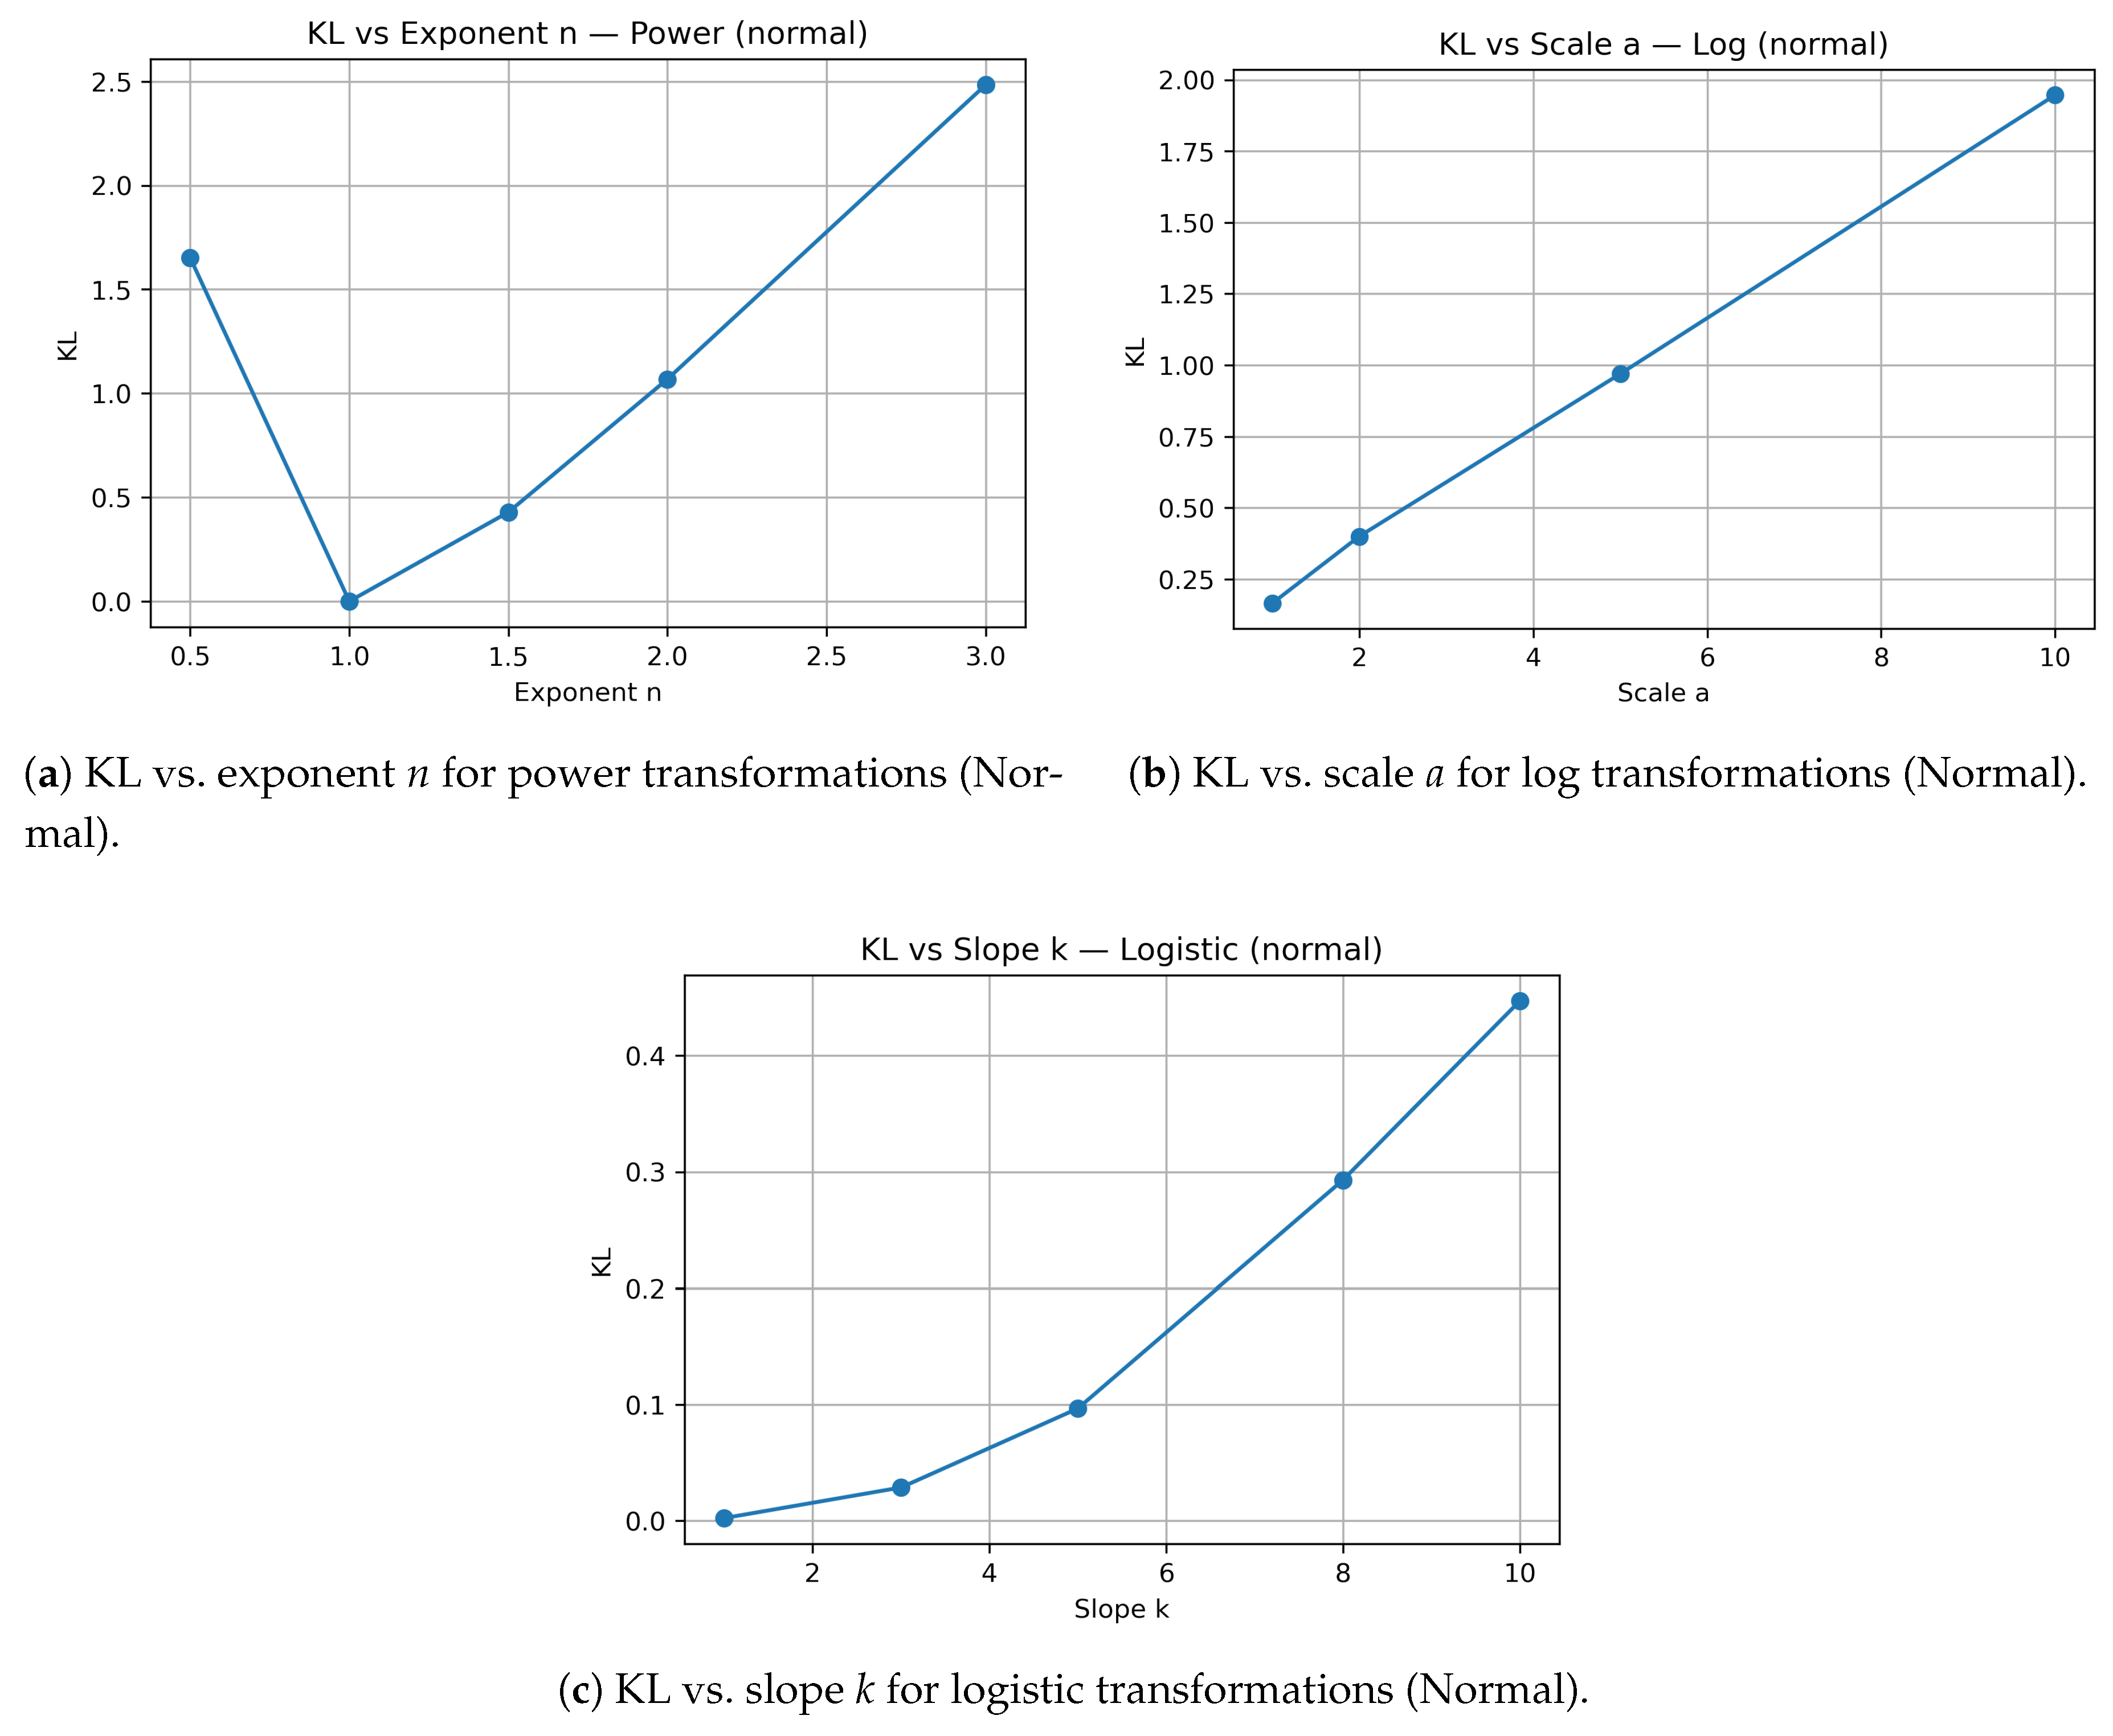
Kullback–Leibler divergence (KL) quantifies total structural change. It increases sharply for power and logistic transformations applied to bimodal data ( in Experiment 1 and exceeding 9 in aggregate analyses), confirming that multimodal systems—those with built-in polarity—are most distortion-prone. Together, these metrics demonstrate that transformations can preserve data order while profoundly altering meaning. The geometry of truth remains, but its proportions shift.
Figure 6.
Kullback–Leibler divergence (KL) across transformation parameters for power, logarithmic, and logistic families (Normal base distribution).
Figure 6.
Kullback–Leibler divergence (KL) across transformation parameters for power, logarithmic, and logistic families (Normal base distribution).
5.4. Cross-Transformation Comparison
Figure 7 shows that TD grows most rapidly for bimodal data, more moderately for Normal data, and least for Uniform data. Uniform distributions appear most stable under transformation, while bimodal distributions accumulate positional distortion quickly.
Figure 8 indicates that entropy generally declines as curvature strengthens. High-order power and steep logistic functions simplify data structure, echoing narrative compression in real systems where complex variability is reduced to a narrower range of outcomes.
Figure 9 shows that when , systems appear overconfident; logistic curves exhibit the sharpest variance inflation in certain regimes, particularly on bimodal inputs.
Figure 10 demonstrates that KL divergence spikes under power and logistic forms, especially for bimodal distributions, revealing how local curvature magnifies bias and structural deviation from the original distribution.
5.5. Numerical Summary of Experiment 1
Table 2 summarizes average distortion metrics by distribution type.
Normal distributions, though seemingly balanced, exhibit the largest overconfidence (); bimodal distributions experience stronger structural divergence (higher KL); Uniform data remain relatively stable but show greater entropy loss. Distortion thus arises not from random error, but from curvature itself—the geometry of emphasis.
5.6. Numerical Summary of Experiment 2
Experiment 2 aggregates metrics across transformations to provide a system-level view of distortion. Table 3 presents average metrics by distribution type.
Bimodal data display extreme divergence (), analogous to polarized information loops. Normal data appear balanced yet subtly distort confidence and entropy, mirroring algorithmic “neutrality” that conceals bias. Uniform data exhibit flattening of diversity, with entropy changes reflecting homogenization. These results confirm that even ostensibly neutral transformations yield structured distortion: the mirror is not broken, but curved.
5.7. Cross-Metric and Correlation Analysis
Correlation analysis (Figure 11) reveals strong internal relationships among the metrics. TD correlates positively with DED (), indicating that positional drift is often accompanied by changes in entropy. CDI and DED correlate negatively (): increasing confidence is associated with informational loss. CDI and KL correlate positively (), suggesting that systems which appear more confident also tend to deviate more strongly from the original distribution.
5.8. Synthesis with the Conceptual Framework
Viewed within the broader conceptual framework of this work, both experiments support the illusion-of-objectivity model. Each mathematical transformation functions as a reflective surface, accurate in detail but altered in proportion. Power transformations amplify, logarithmic transformations compress, and logistic transformations concentrate attention. CDI and KL act as dual anchors: CDI represents perceived confidence, while KL captures actual divergence. High-CDI/high-KL regimes embody the paradox of certainty amidst distortion. The extreme KL observed for bimodal data mirrors social polarization, where algorithmic weighting magnifies division. Near-unity CDI in Normal data reflects deceptive neutrality, in which systems that appear balanced subtly reweight truth. In sum, bias emerges not as a failure of information, but as geometry manifesting perception [6,7]. Each transformation describes a distinct way in which data, like light, can bend.
6. Interpretation and Implications
6.1. Re-Framing Objectivity
The results above motivate a reconsideration of what it means to describe a system as “objective.” In both human cognition and algorithmic design, objectivity is often equated with neutrality, the absence of distortion or preference. Yet the experiments show that even neutral-seeming mathematical transformations can reshape truth through their own geometry. In this sense, bias does not arise because something malfunctioned; it arises because a particular form was imposed. Every transformation, from simple scaling to complex nonlinear mappings, carries an implicit curvature that changes how relationships are perceived. Systems that claim to be impartial therefore often inherit the same distortions embedded in their design.
To say that objectivity is geometric is to recognize that even order can bend. The illusion of neutrality persists precisely because the transformation is consistent: its curvature is invisible to those operating within it. Like a lens that magnifies without revealing its shape, a transformation can both clarify and distort at once. Rather than defining objectivity as the absence of bias, it may be more accurate to view it as awareness of bias: recognition that every form of measurement and representation imposes a particular geometry of meaning [7,8].
6.2. The Geometry of Bias
The experiments indicate that each transformation family corresponds to a distinct mode of perception. Power functions amplify differences, mirroring confirmation-like biases. Logarithmic functions compress range, echoing omission or underrepresentation. Logistic functions saturate sensitivity around thresholds, paralleling attention biases. Together, they describe a geometry of distortion that is simultaneously mathematical and psychological.
This geometric framing helps explain why bias is difficult to see from within a system. Just as curvature may be imperceptible to those moving along it, the distortions of perception feel natural to those experiencing them. Every system, biological or computational, “sees” through its own function. Curvature thus becomes a bridge between mathematics and cognition: what power functions do to numbers, minds do to narratives—stretching, emphasizing, and filtering until patterns feel coherent. In this view, bias is not the enemy of truth but the shape truth takes when filtered through form.
6.3. Algorithmic Design Implications
Understanding bias as curvature has direct implications for the design of algorithmic systems. Modern recommendation engines, ranking algorithms, and social media platforms operate through compounded transformations: normalization, weighting, thresholding, and feedback. Each of these steps bends data along predictable curves akin to those studied here.
Power-like amplification occurs when popularity metrics reinforce themselves, making what is seen more visible. Logarithmic compression appears in normalization layers that suppress outliers or low-frequency signals. Logistic saturation defines engagement thresholds, where attention becomes bounded around specific triggers. The result is a complex, self-consistent system that may feel balanced from within yet appear increasingly distorted from outside.
Recognizing this does not condemn such systems, but clarifies their function. By mapping how different curvatures emphasize or suppress information, designers can anticipate bias before it manifests. Ethical algorithm design, in this context, involves making curvature visible: labeling, testing, and quantifying the transformations through which data is filtered [4,5].
6.4. Ethical and Philosophical Considerations
If bias is structural rather than incidental, ethical responsibility cannot rest solely on attempts at complete correction. It must also involve awareness and transparency. The central question shifts from “How do we remove bias?” to “How do we acknowledge and manage the curvature through which we see?”
When distortion is understood as an inevitable property of form, neutrality becomes less a destination and more a stance, characterized by explicit recognition of limitations rather than denial of them [8]. Systems, like observers, cannot eliminate curvature, but they can document and expose it. Fairness, in this setting, does not imply flattening all differences; rather, it entails balancing multiple curvatures so that no single geometric perspective dominates all others.
This reorientation also invites a more nuanced view of distortion. Instead of treating bias purely as contamination, it can be understood as a property of perception that makes representation possible. To perceive is, in a sense, always to curve reality slightly toward oneself. The ethical task is not to abolish this curvature, but to recognize its outline and account for it in the design and interpretation of data-driven systems.
7. Conclusions
This work examined a central question: in contemporary data-driven environments, can an information-processing system be considered truly neutral? To investigate this, we modeled perception distortion as a monotonic but nonlinear transformation h applied to an underlying truth variable X, producing an observed signal . Such transformations preserve order while altering scale, thereby reshaping relationships without changing rank. Within this mathematical framework, we introduced four complementary quantitative measures—Truth Drift (TD), Differential Entropy Difference (DED), Confidence Distortion Index (CDI), and Kullback–Leibler Divergence (KL)—to capture distinct aspects of informational distortion.
Synthetic datasets drawn from uniform, normal, and bimodal distributions were subjected to power, root, logarithmic, and logistic transformations. The resulting effects were evaluated using the four metrics. Several consistent empirical patterns emerged. Power transformations with high exponents, as well as steep logistic transformations, produced the strongest distortions across all metrics, particularly for bimodal distributions, where structural divergence was most pronounced. Normal distributions exhibited moderate but systematic distortion, with CDI frequently indicating overconfidence even when the transformed data appeared visually stable. Uniform distributions appeared least affected visually, but entropy and KL measures revealed that substantial informational structure was lost as probability mass was redistributed.
Across all experiments, TD, DED, CDI, and KL showed strong correlations, indicating that positional drift, entropy change, confidence distortion, and structural divergence are interconnected manifestations of a common underlying geometric effect. This reinforces the central thesis of the House of Mirrors model: distortion does not arise only from malfunction, bias, or noise, but can emerge naturally from the inherent curvature of nonlinear transformations used in scaling, filtering, or normalization.
These findings suggest that objectivity should not be conceptualized as the absence of distortion. Instead, objectivity requires recognizing and measuring the curvature introduced by transformation functions, whether in human perception, statistical modeling, or algorithmic systems. Without such awareness, systems risk presenting an appearance of neutrality while subtly reshaping informational structure—preserving detail while altering proportion.
By integrating psychometric transformation theory, information-theoretic metrics, and computational simulation, this study provides a quantitative methodology for diagnosing distortions in data-driven environments. The proposed metrics and experimental framework offer a foundation for analyzing how transformations amplify, suppress, or saturate signals. Ultimately, this work supports a reframing of objectivity as a practice grounded in transparency: making curvature visible, measurable, and, where necessary, correctable rather than assuming neutrality by default.
8. Future Work
The experiments presented in this study relied on controlled synthetic data in order to isolate the mathematical effects of monotonic nonlinear transformations. A natural direction for future research is to apply the same distortion metrics— Truth Drift (TD), Differential Entropy Difference (DED), Confidence Distortion Index (CDI), and Kullback–Leibler Divergence (KL)—to real-world information systems. Platforms such as news aggregators, search engines, and recommendation systems could be quantitatively evaluated to assess how their internal transformations warp informational space and shape user perception.
Beyond empirical validation, future work may translate these mathematical insights into interactive visualization tools. Dynamic dashboards or user-facing interfaces could illustrate how data streams, ranking outputs, or algorithmic decisions are affected by curvature introduced through scaling, normalization, or feedback. Such tools would support transparency by enabling users to see distortion rather than merely being informed of its presence.
A further research avenue involves extending the geometric model to cognitive psychology. Human perceptual systems naturally amplify, compress, or saturate signals in ways that parallel the transformations studied here. Integrating quantitative distortion metrics with established theories of perception, memory, and decision-making could provide a unified framework for understanding how truth is systematically deformed across both computational and cognitive processes.
Collectively, these directions aim to broaden the applicability of the proposed framework, linking mathematical structure, algorithmic behavior, and human interpretation within a cohesive theory of informational distortion.
Author Contributions
Conceptualization, I.D.; methodology, I.D. and A.W.; software, I.D.; formal analysis, I.D. and A.W.; investigation, I.D. and A.W.; visualization, I.D.; writing—original draft preparation, I.D.; writing—review and editing, I.D. and A.W.; supervision, I.D. All authors have read and agreed to the published version of the manuscript.
Funding
This research received no external funding.
Institutional Review Board Statement
Not applicable.
Informed Consent Statement
Not applicable.
Data Availability Statement
No real-world dataset was used. All data were generated synthetically. The Python code and full reproducible simulation notebook (including parameter settings and random seed) are available at: https://github.com/indika1988/Indika_eastern/blob/main/Chapter5_Results_Notebook.ipynb.
Acknowledgments
The authors thank colleagues and students in the Department of Mathematics and Statistics at Eastern Washington University for helpful feedback and discussions.
Conflicts of Interest
The authors declare no conflicts of interest.
References
- Vinay, R.; Spitale, G.; Biller-Andorno, N.; Germani, F. Emotional prompting amplifies disinformation generation in AI large language models. Frontiers in Artificial Intelligence 2025, 8, 1543603. [CrossRef]
- Carpentras, D.; Quayle, M. The psychometric house-of-mirrors: the effect of measurement distortions on agent-based models’ predictions. International Journal of Social Research Methodology 2023, 26, 215–231. [CrossRef]
- Algom, D. The Weber–Fechner law: A misnomer that persists but that should go away. Psychological review 2021, 128, 757.
- Noble, S.U. Algorithms of oppression: How search engines reinforce racism. In Algorithms of oppression; New York university press, 2018.
- Shannon, C.E. A mathematical theory of communication. The Bell system technical journal 1948, 27, 379–423. [CrossRef]
- Kullback, S.; Leibler, R.A. On information and sufficiency. The annals of mathematical statistics 1951, 22, 79–86.
- Ascher, U.M.; Greif, C. A first course on numerical methods; SIAM, 2011.
- Blackman, R. Ethical Machines: The Truth About AI and How to Humanize Our Future; Harvard Business Review Press: Boston, MA, USA, 2022.
Figure 1.
Representative monotone nonlinear transformations used in the analysis.
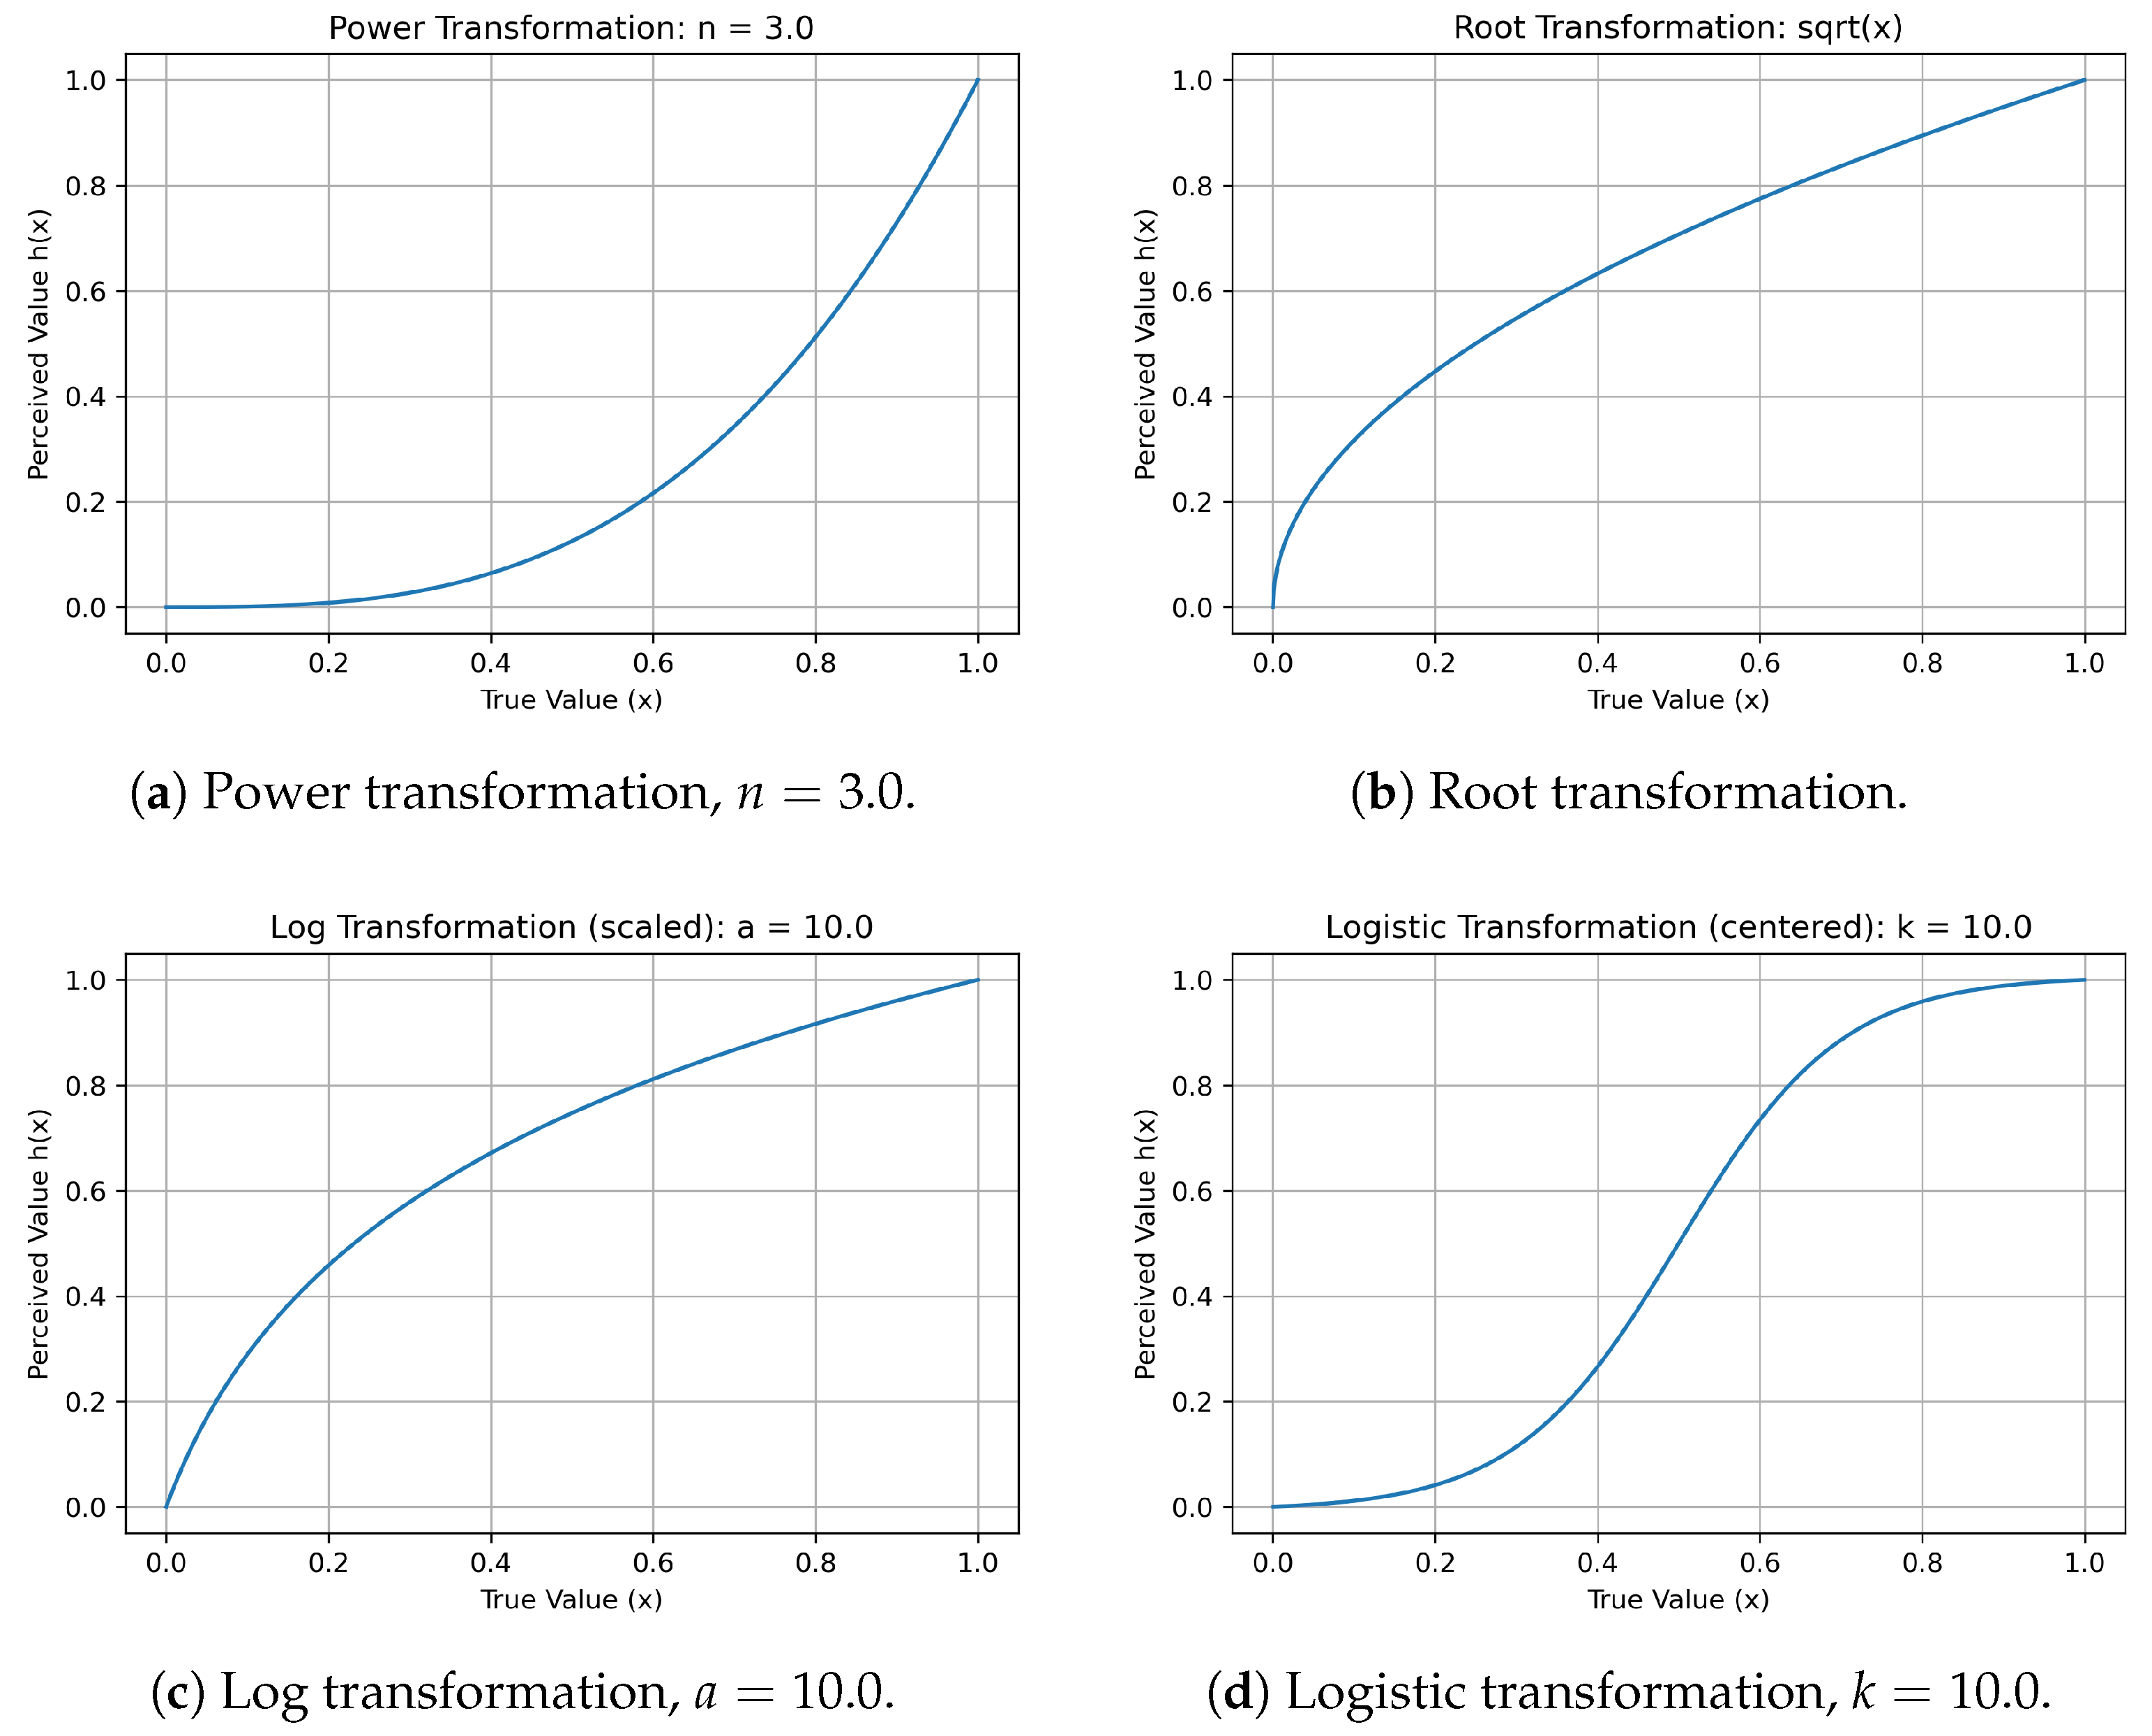
Figure 2.
Derivatives of selected transformations, illustrating local sensitivity to changes in x.
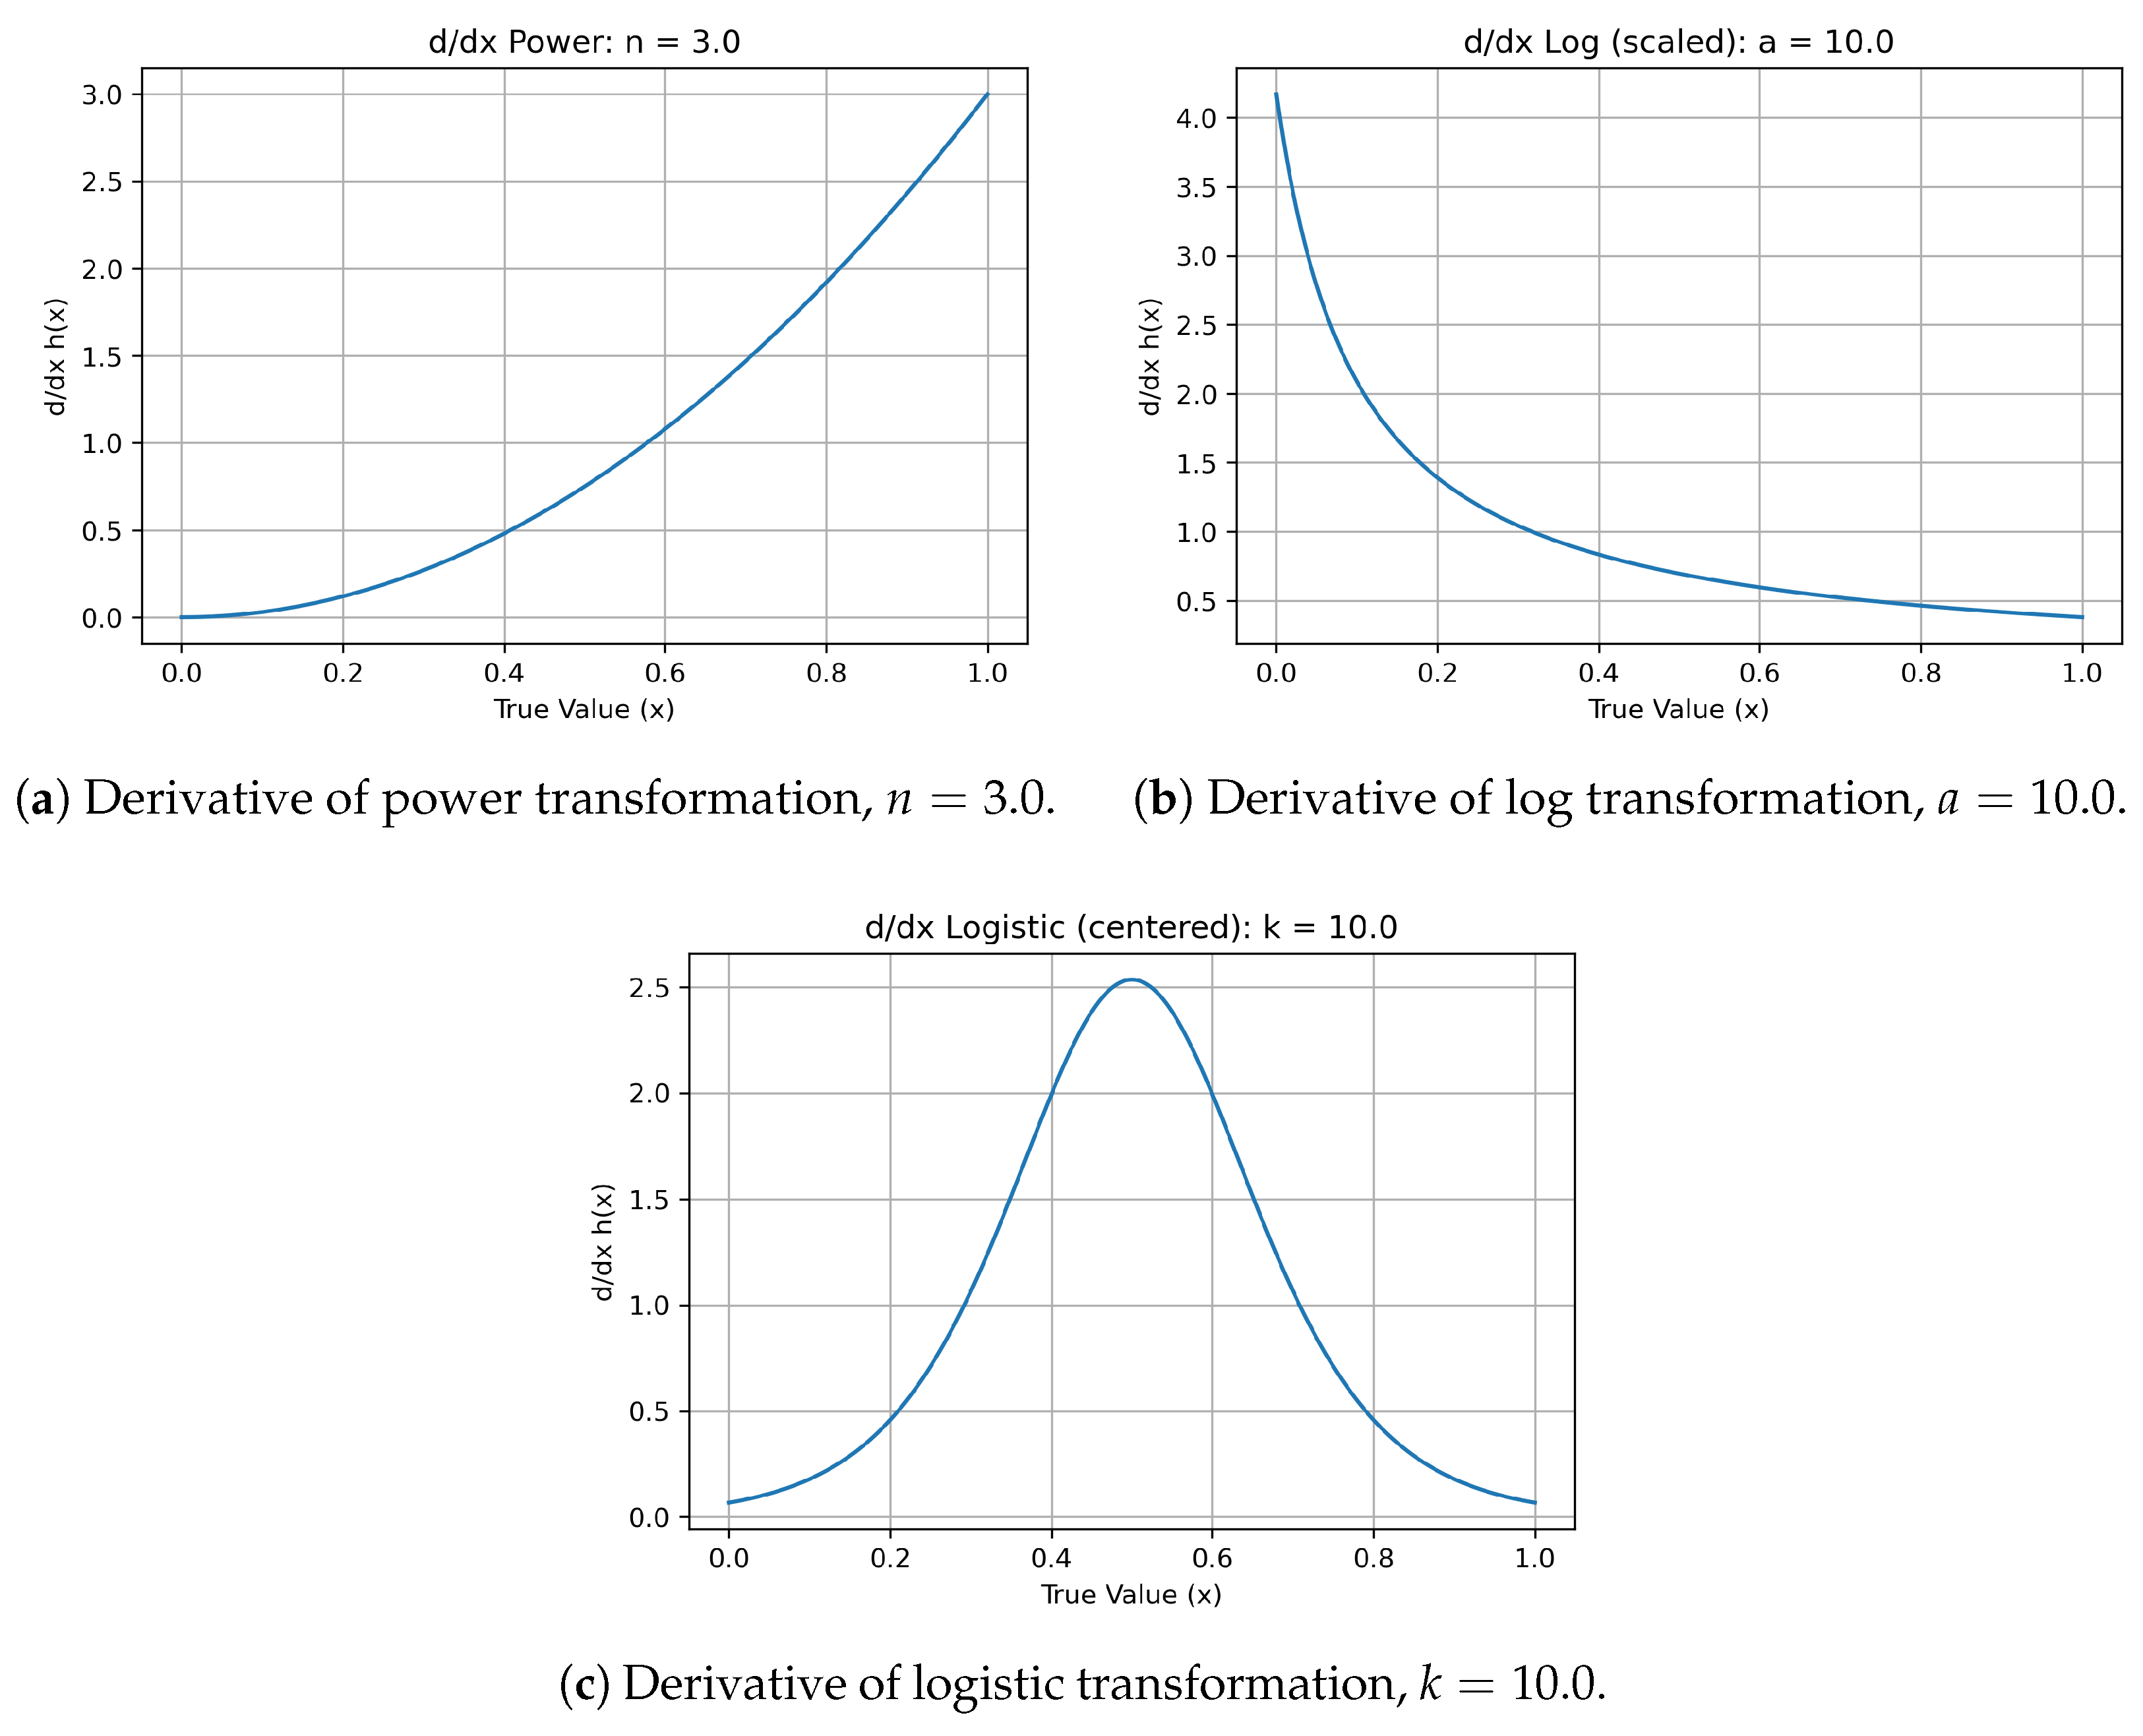
Figure 7.
TD across transformation families for different base distributions.
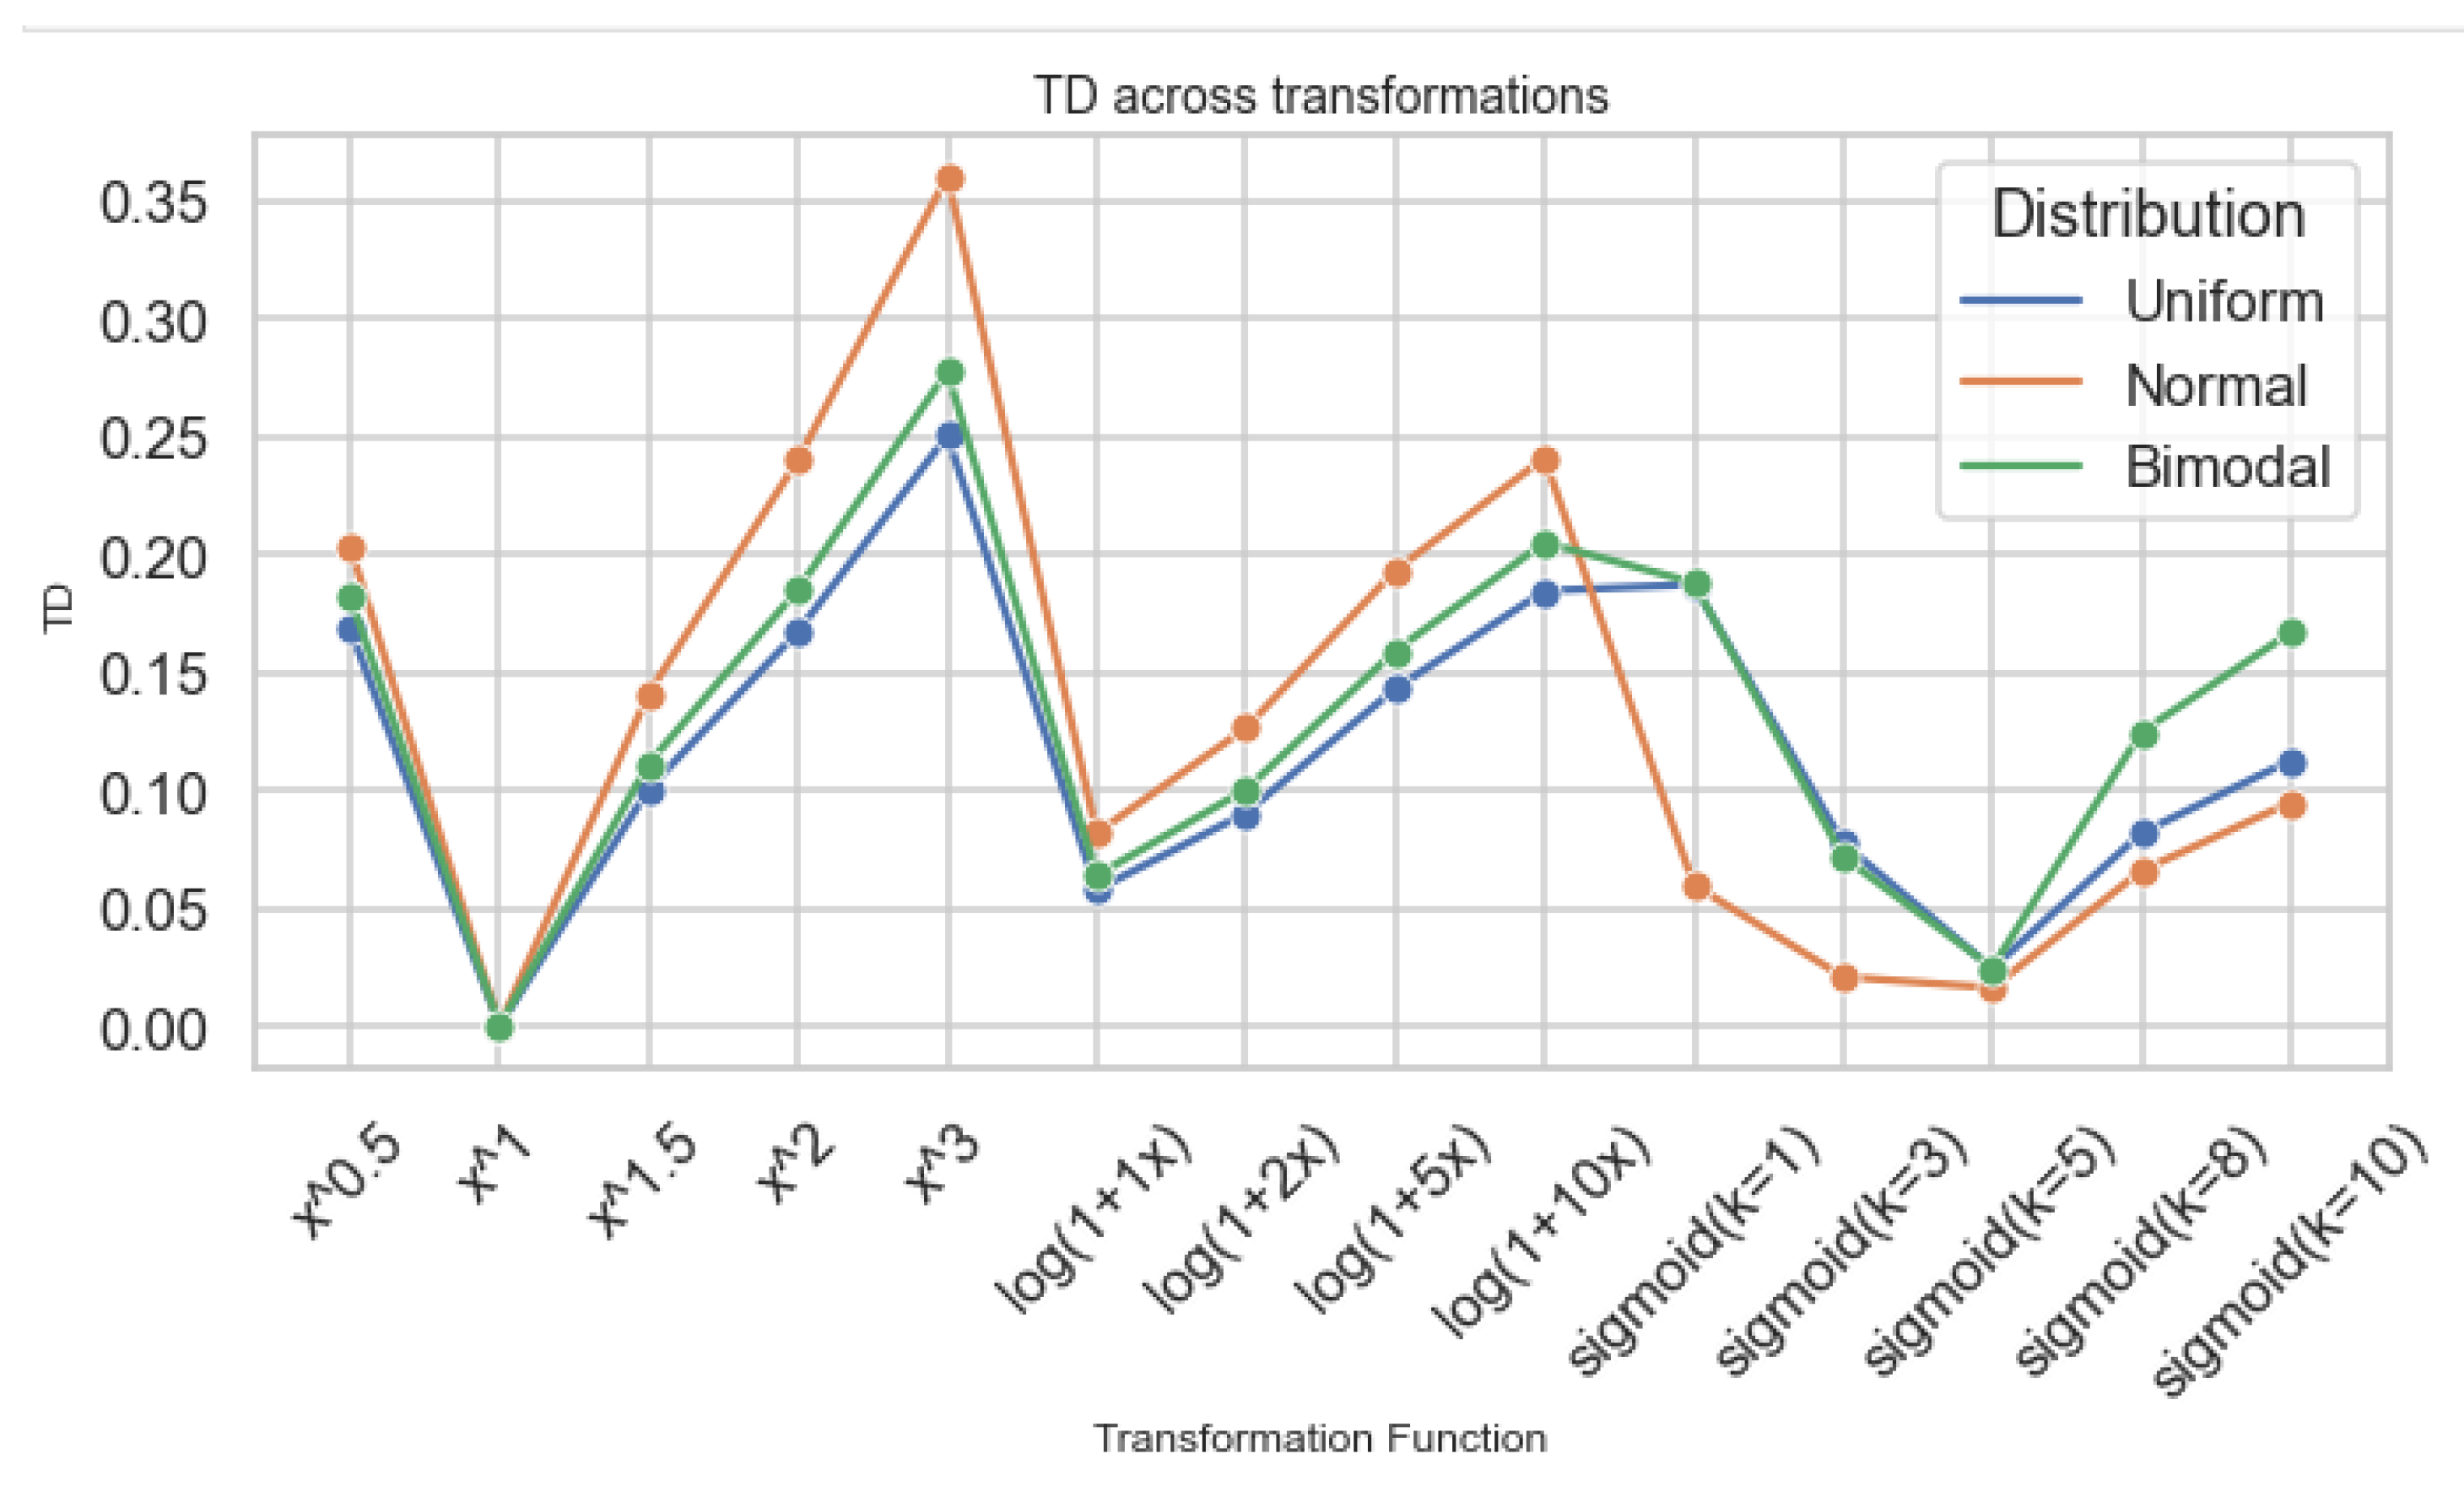
Figure 8.
DED across transformation families.
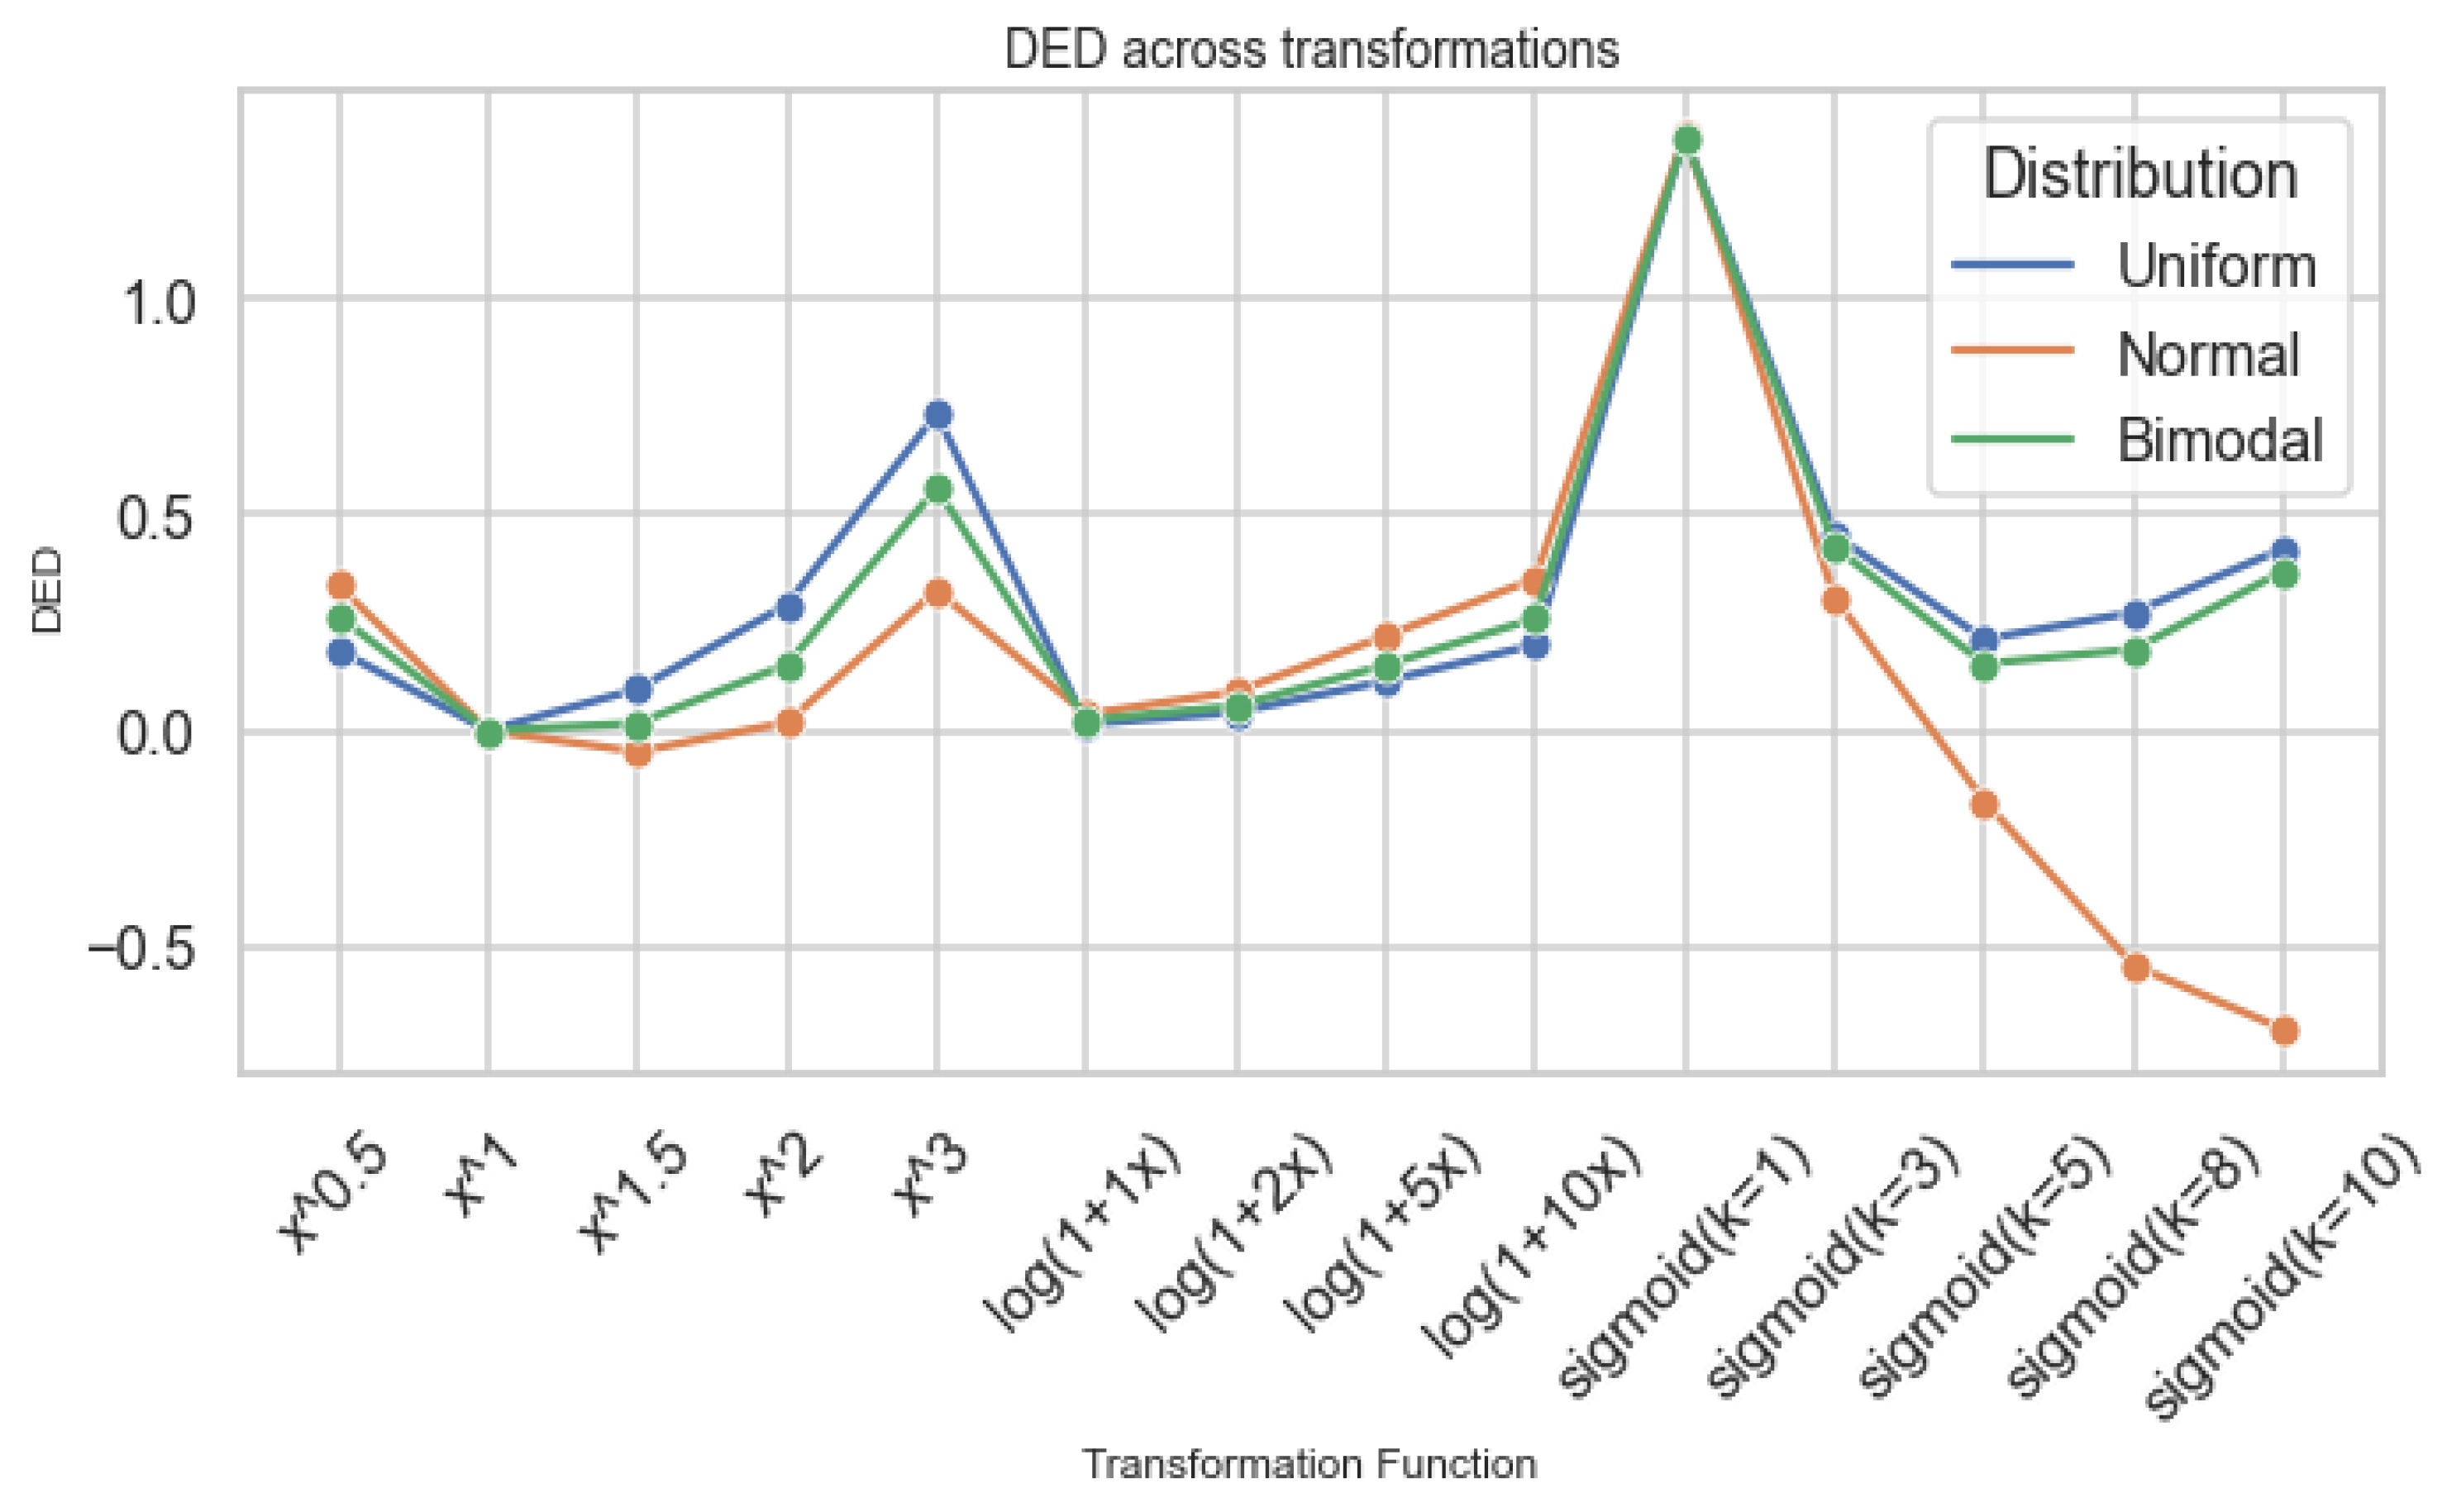
Figure 9.
CDI across transformation families.
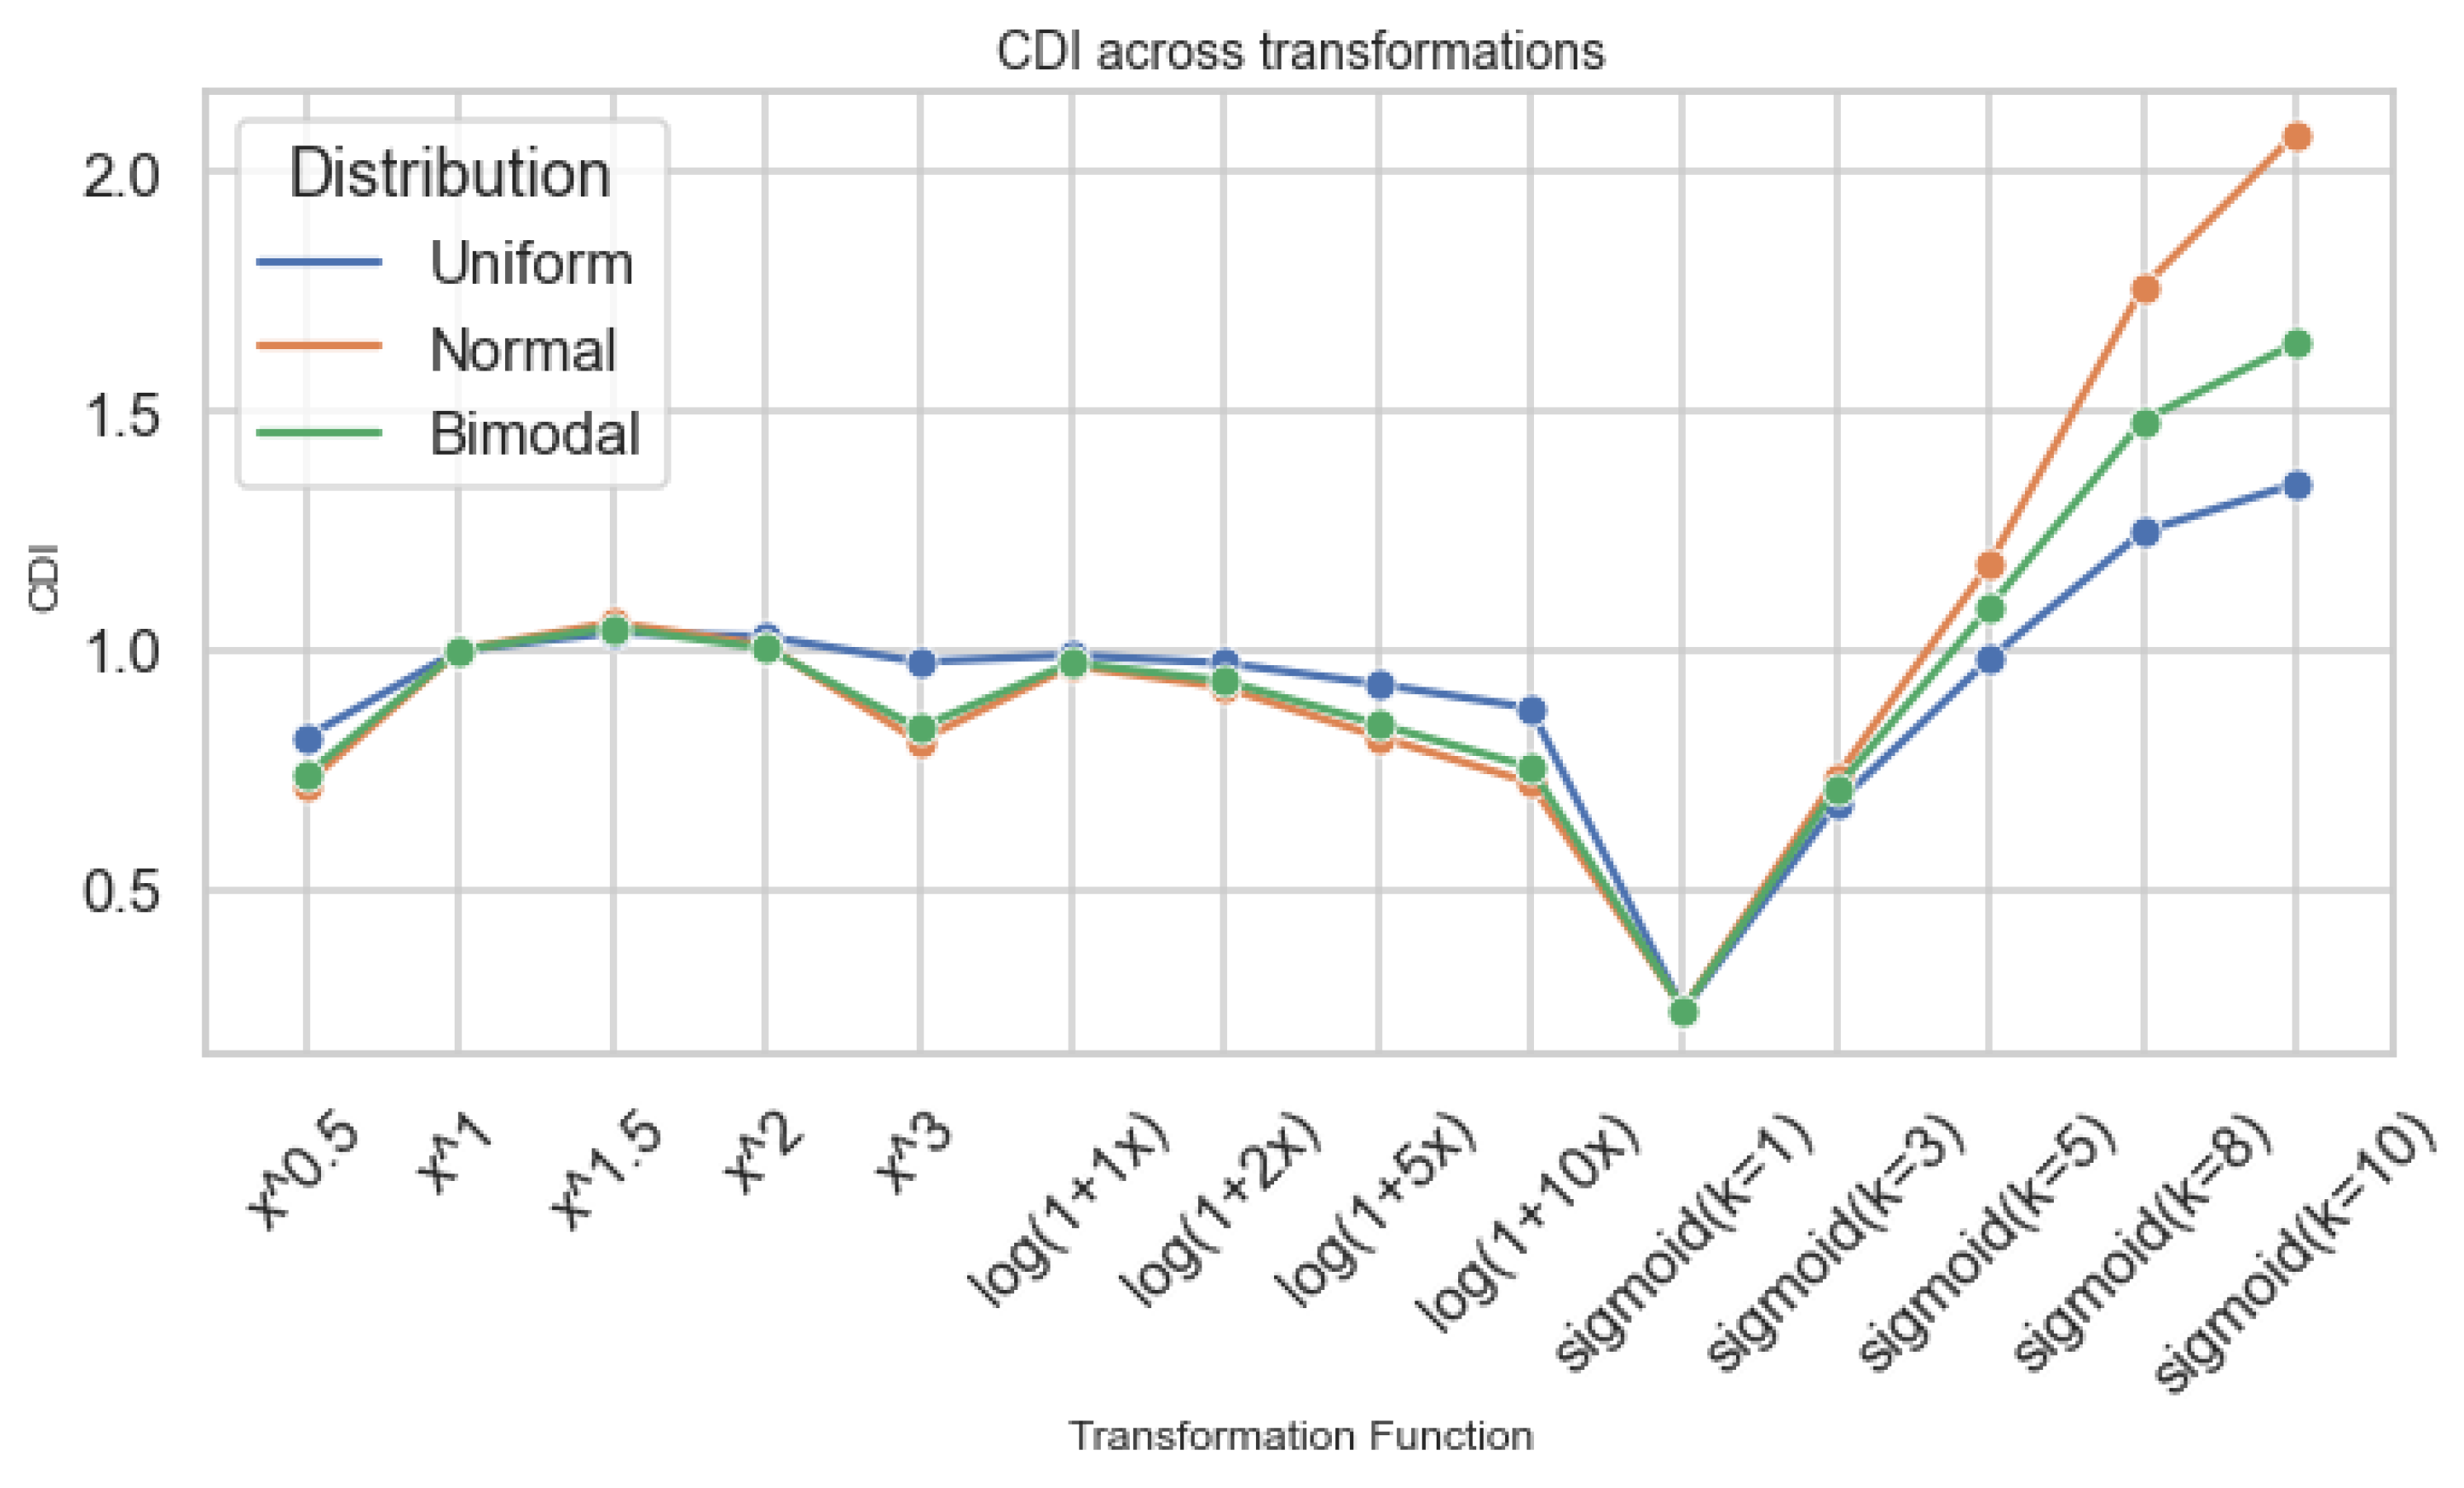
Figure 10.
KL across transformation families.
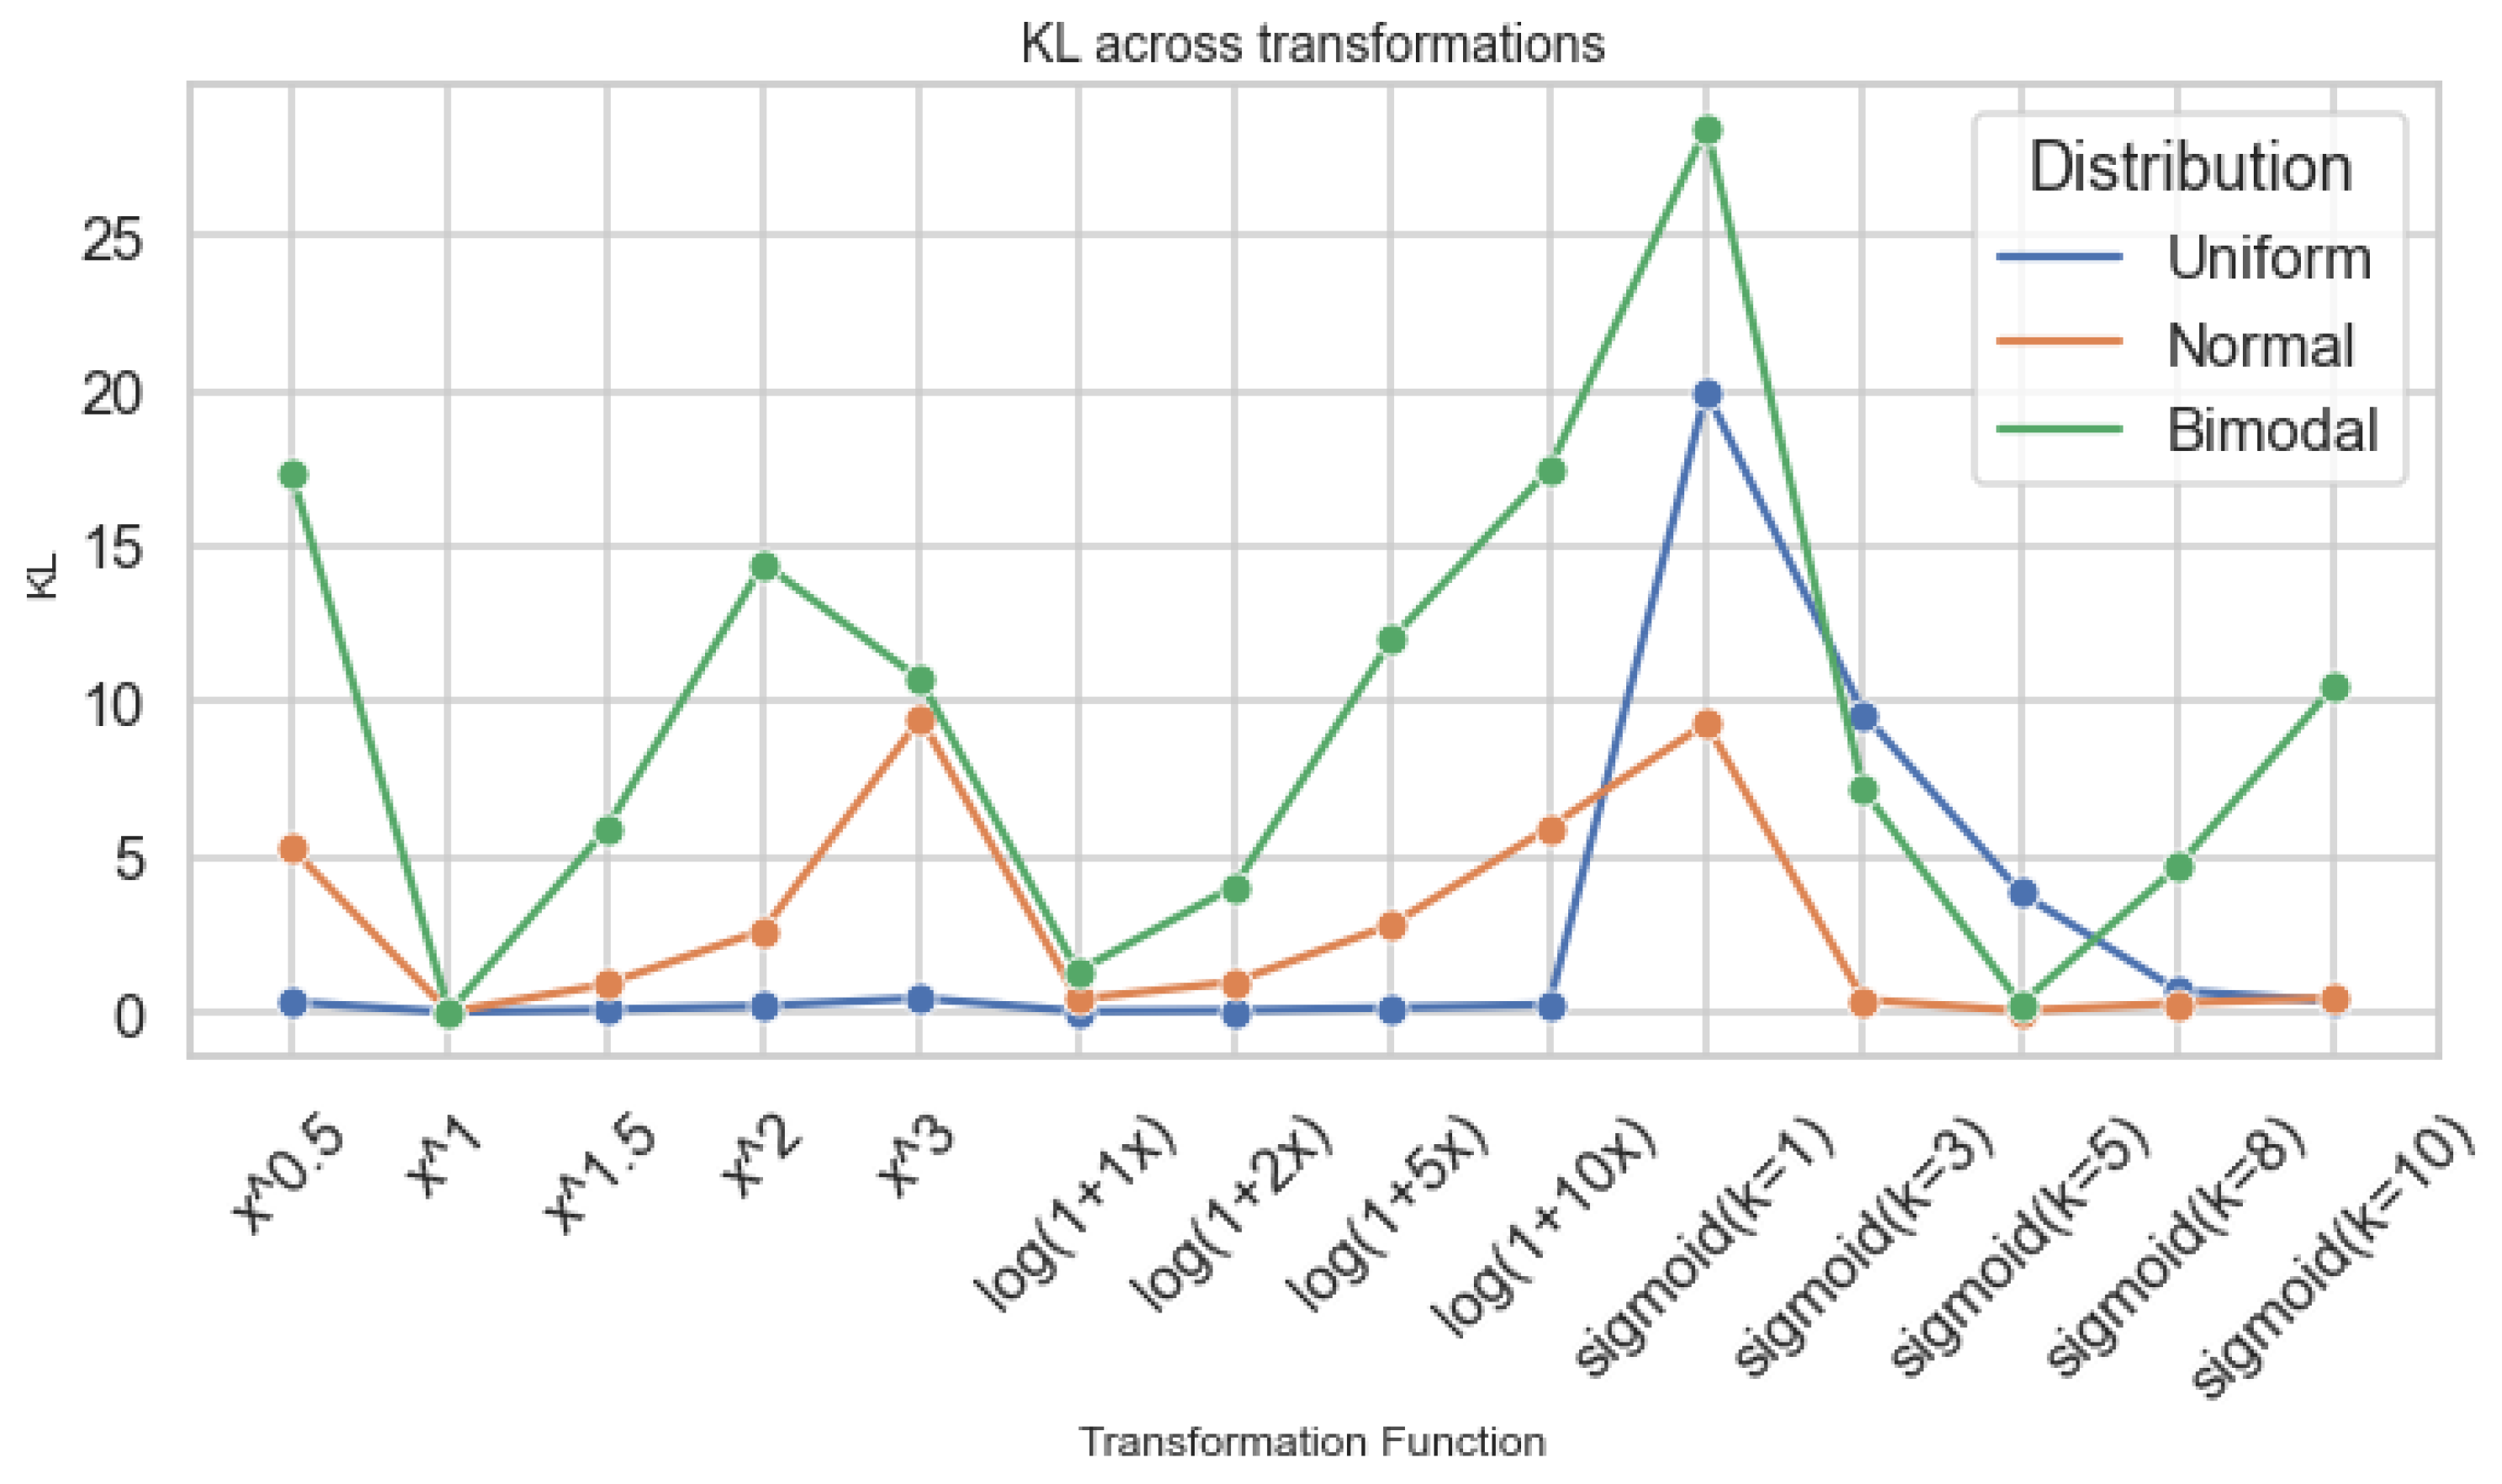
Figure 11.
Correlation heatmap among distortion metrics across experiments.
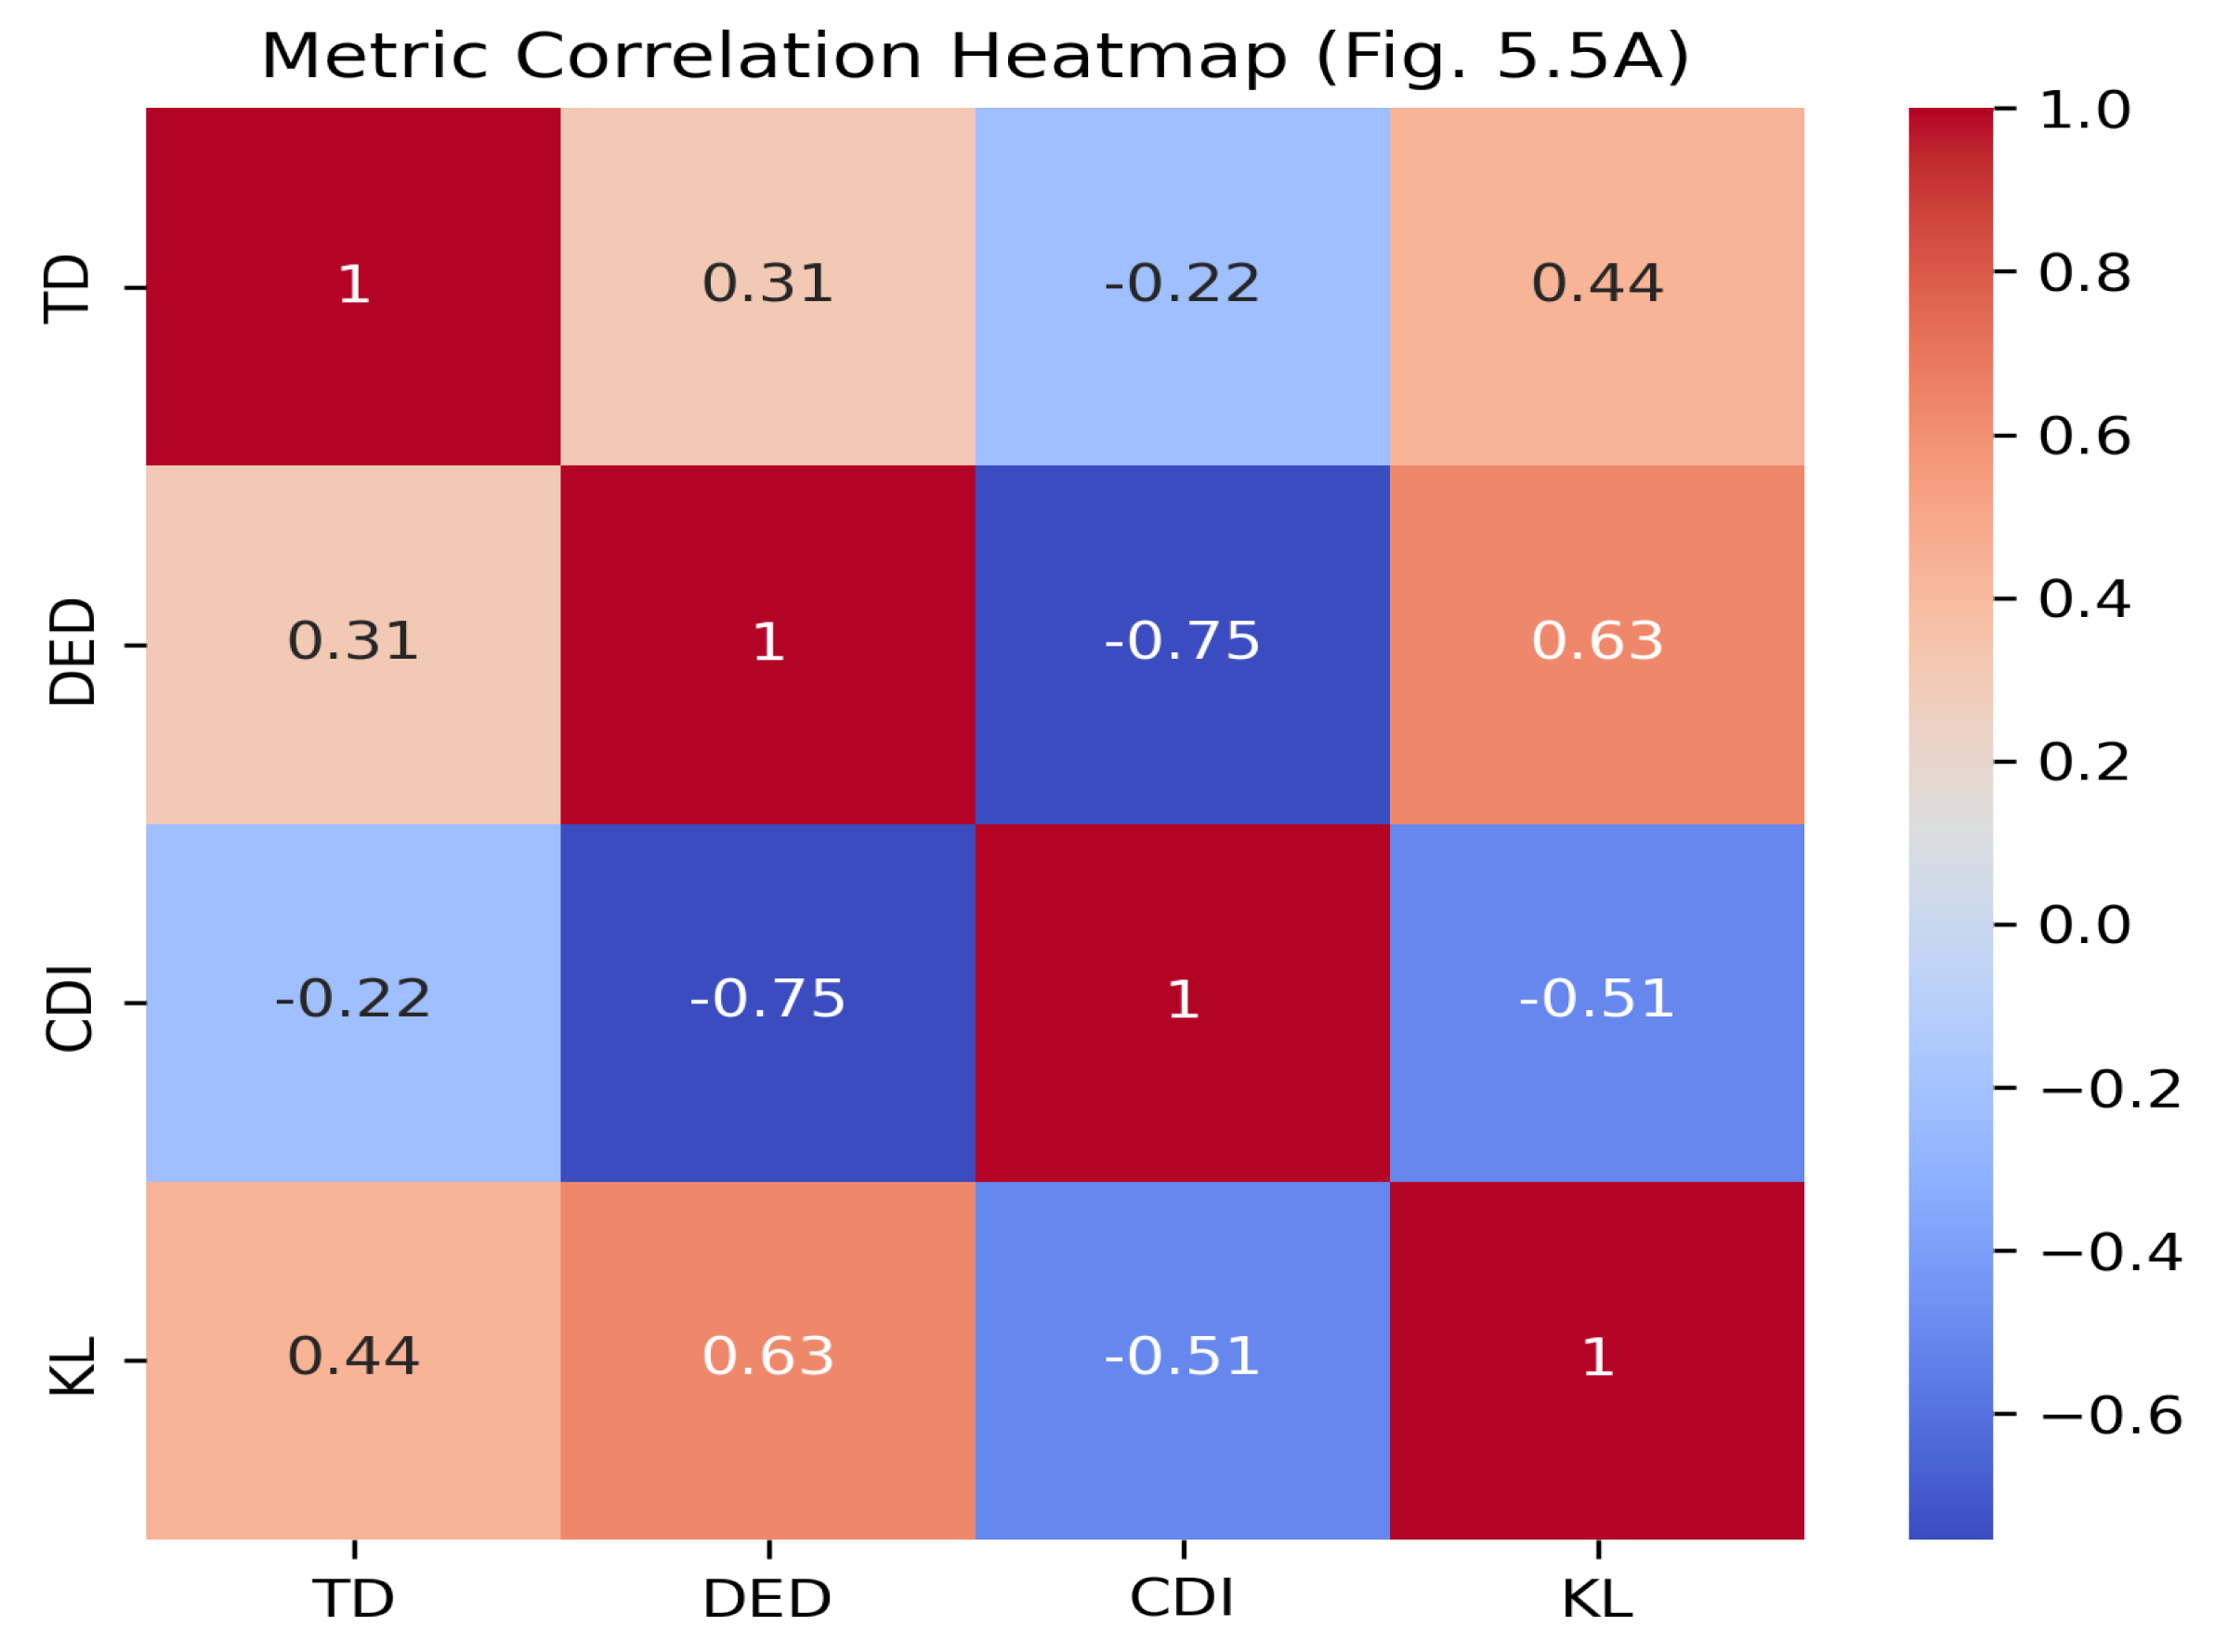

Table 1.
Analytical behavior of selected transformations.
| Transformation | Entropy Effect | CDI Effect | Drift Pattern |
|---|---|---|---|
| Entropy decreases | Positive drift from upper-range compression | ||
| Entropy increases | Negative drift from upper-range expansion | ||
| Moderate entropy loss, strongest midrange | Flattened middle region | ||
| Mixed effects; mass shifts to tails | in extremes | Polarized tail behavior |
Table 2.
Average distortion metrics by distribution type (Experiment 1).
| Distribution | TD | DED | CDI | KL |
| Bimodal | 0.1427 | -0.1394 | 1.0401 | 1.6036 |
| Normal | 0.1465 | -0.0881 | 1.0827 | 0.9598 |
| Uniform | 0.1194 | -0.1859 | 0.9828 | 0.2037 |
Table 3.
House of Mirrors aggregate distortion metrics by distribution type (Experiment 2).
| Distribution | TD | DED | CDI | KL |
| Bimodal | 0.1328 | 0.2855 | 0.9507 | 9.5943 |
| Normal | 0.1317 | 0.1157 | 1.0024 | 2.7812 |
| Uniform | 0.1175 | 0.3152 | 0.9381 | 2.5734 |
Disclaimer/Publisher’s Note: The statements, opinions and data contained in all publications are solely those of the individual author(s) and contributor(s) and not of MDPI and/or the editor(s). MDPI and/or the editor(s) disclaim responsibility for any injury to people or property resulting from any ideas, methods, instructions or products referred to in the content. |
© 2025 by the authors. Licensee MDPI, Basel, Switzerland. This article is an open access article distributed under the terms and conditions of the Creative Commons Attribution (CC BY) license (http://creativecommons.org/licenses/by/4.0/).
Copyright: This open access article is published under a Creative Commons CC BY 4.0 license, which permit the free download, distribution, and reuse, provided that the author and preprint are cited in any reuse.


