Submitted:
14 December 2025
Posted:
15 December 2025
You are already at the latest version
Abstract
Climate change and increasingly restrictive pesticide regulations have created a growing need for new tools to support the integrated pest management (IPM) of the olive fruit fly, Bactrocera oleae, in cultivated areas of the Mediterranean. In this study, the environmental suitability of this phytophagous in eastern Sicily was mapped by using geographic information system (GIS) tools and species distribution models (i.e., Random Forest and MaxEnt). The models were trained on presence data of the fly, ob-tained from a network of pheromone traps and locations where olive trees were pre-sent, combined with climatic, topographic and soil predictors for both current condi-tions and the future climate scenario (2021–2040). Correlation analysis was utilised to select ten predictors from an initial set of 33 soil and climate variables. Model performance was evaluated by using 10-fold cross-validation based on accuracy measures Area Under the Curve (AUC), True Skill Statistic (TSS), and the dif-ference between the training and testing to minimise overfitting. Both algorithms demonstrated excellent predictive performance, producing convergent suitability maps with high values concentrated in the foothills and hills of the Iblean-Calatino area, and low values along the coastal plains and at higher altitudes, where extreme temperatures and unfavourable soil textures reduce habitat suitability. Response curves highlighted the combined influence of moderate temperature and precipitation seasonality, balanced topsoil texture, and moderate slopes in defining the species' ecological niche. The proposed framework provides an operational basis for optimising monitoring networks and targeting IPM measures under current and near future climate conditions.
Keywords:
Species distribution modelling
; GIS
; Bactrocera oleae
; territorial analysis
; IPM
; climate projections
1. Introduction
Global agricultural productivity is being compromised by many factors, primarily among them the rising atmospheric CO₂ levels driven by climate change [1].
The agricultural sector is expected to remain one of the major contributors to this increase in CO₂ levels in the coming decades. In response, the sector is working to reduce its ecological footprint through technological innovations on farms and the adoption of increasingly stringent environmental regulations. For instance, pest management has become more complicated due to recent regulatory changes. Among them, European Commission Regulation (EU) 2019/1090 banned the use of dimethoate in Integrated Pest Management (IPM) systems because of its risks to consumers and the environment. Since dimethoate was a widely used broad-spectrum insecticide, its ban has required a shift toward alternative control strategies, making preventive measures such as monitoring and predictive modelling essential.
Based on the principles of Integrated Pest Management (IPM) described in Annex III of Directive 2009/128/EC, this strategy limits the damage caused by plant pests by using all available methods and techniques, while safeguarding the environment and human health. The IPM strategy uses models to describe species population dynamics, enabling more effective disease interventions as climate conditions change.
Indeed, the number of insects has increased across a wider range of habitats due to higher average daily temperatures and more frequent extreme weather events, which have resulted in substantial crop losses [2].
The IPM strategy is also applied in the olive production sector to protect crops from attacks by the olive fruit fly (Bactrocera oleae (Rossi)) and the olive moth (Prays oleae). These pests have significantly impacted the olive sector (Olea europaea L.). In the 2024/25 crop year, Italian olive oil production reduced to 250,000 tons, the lowest point in a decade (-24%) [3]. This decline was due to water scarcity, abnormal temperatures during critical growth stages, and increased pest pressure. The Bactrocera oleae (B. Olea) is one of the most prevalent and destructive pests in this global ecosystem. Its larvae feed on the fruit pulp, causing premature fruit drop and significantly reducing yield and oil quality [3]. Therefore, both demographic and phenological models have been developed to describe species population dynamics.
In the literature, studies have mainly focused on two approaches. The first involves implementing models for large-scale analysis by correlating soil and climate predictors with insect demography or by conducting a phenological analysis to identify optimal environmental ranges for insect development. The second approach, conversely, analyses insect distribution at a smaller spatial scale and aims at studying population trends. However, these methods do not account for temporal interactions among pest populations, and, therefore, loses spatial information, which can result in inaccurate results.
In a regional study conducted by [4], a modelling approach was central to understanding B. Oleae infestation and predicting population dynamics. The study aimed at developing a monthly data-driven method to predict the presence of B. Oleae infestations in olive groves at a regional level in Tuscany (Italy), by applying machine learning (ML) algorithms. To this end, a demographic model was constructed, counting the numbers of: (i) eggs, (ii) live and dead first-, second- and third-instar larvae, (iii) live and dead pupae and (iv) exit holes. The combination of uncorrelated bioclimatic predictors was then used for the prediction of the infestation levels.
Furthermore, along the same lines, [2] improved model calibration at a fine spatial scale in the Umbria region by using demographic data from 79 olive groves and climatic variables interpolated with the Inverse Distance Weighting (IDW) method from the Regional Hydrographic Service. The relationships between predictors and B. Oleae presence suitability were analysed along the “Julian day”, highlighting the seasonal patterns of the pest to support targeted protection measures.
Finally, [6] investigated the geographical relationships between the olive tree host and the olive fly parasite in Africa and the Mediterranean region in relation to the impacts of climate change by using ecological niche modelling approaches.
Many studies in the scientific literature have used species distribution models (SDMs) to predict the potential distribution of species by integrating abiotic and biotic factors, as reported by [7].This study aims at assessing the environmental suitability of the phytophagous olive fruit fly, B. Olea, in cultivated areas of eastern Sicily through the combination of GIS and SDMs.
Unlike previous research, this study is novel in that it:
- i.
- uses a high-resolution (1 ha) pedoclimatic model that integrates topsoil texture to characterise microenvironmental conditions relevant to pest development;
- i.
- ii. assesses the future suitability of B. Oleae in global climate model simulations for near-term projections (2021–2040) compared with the current distribution of olive groves, identifying areas of current and potential risk;
- i.
- iii. uses response curves to define agronomically significant thresholds and predictor ranges, translating the ecological model’s outputs into an operational tool that supports IPM planning and management in Mediterranean olive systems.
On this basis, the main research questions are the following:
- Which SDM provides the most accurate prediction of the presence of Bactrocera oleae in eastern Sicily?
- Which pedoclimatic factors mostly influence the probability of Bactrocera oleae presence under heterogeneous pedoclimatic conditions?
- How do the response curves derived from SDMs clarify the relationship between environmental predictors and the ecological niche of Bactrocera oleae?
- How would the spatial suitability of Bactrocera oleae change under future climate projections (2021–2040) according to global climate models?
2. Materials and Methods
In this study, a methodology based on SDM algorithms was defined to identify areas with the highest probability of B. Oleae presence in Eastern Sicily. This is based on the known distribution of its host plant, Olea europaea L., and key environmental covariates for both current and future scenarios (subsections 2.1 and 2.2). Unlike previous research, this study integrates bioclimatic predictors generated through the ‘dismo’ package in Rstudio software 2022.07.0 (https://www.R-project.org/Accessed on 14/10/2024) besides soil predictors within a regional geographical area (R Core Team, 2023). To this end, a collaboration was established with a local cooperative that supplied presence data for Bactrocera oleae gathered by using field monitoring traps.
Accuracy measures of the models have been considered for the assessment and the contribution of each environmental variable to the probability of B. Oleae presence was analysed by using response curves generated by Random Forest (RF) and MaxEnt models (subsection 2.3 and 2.4).
2.1. Study Area and B. Oleae Occurrence Data
The study area included the provinces of Catania, Syracuse and Ragusa (Figure 1), located in the south-eastern part of Sicily. This territory is characterised by different agrarian landscapes and a notable historical and cultural heritage, with a Mediterranean climate characterised by hot, dry summers and mild, wet winters. Crop selection and agronomic management are influenced by this climate and are calibrated to seasonal variations in temperature and water availability. Sicily produces high quality olive oils, i.e., Monte ETNA D.O.P. (Protected Designation of Origin) (Council Regulation (EEC) No. 2081/92 - Official Journal of the European Union. Series L. June 21, 2022.) or Monte Iblei D.O.P. (Ministerial Decree of December 4, 2003), known for their unique flavour profiles due to the specific soil and climatic conditions. Olive groves are often located in arid or semi-arid environments, which requires deficit irrigation, and efficient irrigation strategies, especially during the summer period when water resources are most limited. In Sicily, olive groves are often intercropped with other crops, such as citrus fruits, forming polyculture ecosystems. These ecosystems play a critical role in maintaining ecological balance and supporting the region’s agricultural productivity.
The study areas were identified based on agronomic and operational criteria, favouring olive-growing districts where the pressure from B. Oleae and the associated monitoring costs represent a critical element of crop management. In this context, suitability maps are intended as a decision-support tool to help rationalise trap placement and survey frequency, reduce monitoring costs and improve the spatial resolution of information on the pest’s distribution. Specifically, the sampling area was defined by using basic data on B. Oleae presence acquired from the Olive Producers Association (APO) pheromone-trap monitoring system.
These data were collected by using pheromone traps of a monitoring network distributed throughout the cooperative’s territory (Figure 1). Points were selected based on farm location and size, semi-intensive farming systems and a minimum area of 3 hectares.
Data from APO were processed to produce an input map showing the presence of phytophagous organisms. Despite the fact that a limited number of presence points can reduce the predictive power of SDM [9,10,11] presence points were consolidated in a GIS (QGIS Desktop 3.22.1) by overlaying pheromone trap presence points, Olea europaea occurrence points and a 250 m buffer around the traps. This buffer was chosen as a conservative compromise between the average trap spacing (approximately 150 metres) and the reported dispersal distances for B. Oleae in the literature, reaching up to 5000 m [12].
2.2. Pedoclimatic Predictors
Climatic predictors for the study area were specifically generated by using data from the WorldClim global climate database (https://www.worldclim.org). The time span from 2003 to 2021 was chosen as the reference window for the current scenario because it is broad enough to account for recent interannual variability in climate conditions, while also being representative of the operational climate in which field observations are located. According to [13], this timeframe meets the requirement of working with multidecadal periods in order to construct a stable ‘recent’ climate framework from which to derive the bioclimatic predictors considered in the models. The data were processed and analysed by using RStudio 2022.07.0 and QGIS 3.22.1, following well established methodologies [13,14]. Bioclimatic predictors were produced by using the “dismo” package in RStudio software [15], together with the function biovar utilised to transform monthly climatic data into the desired bioclimatic indices, i.e., 19 biovariables [16], included in the predictors list.
In the case of the future scenario, the future climate conditions were obtained from the WorldClim database (SSP5-8.5 by CMCC-ESM2 global climate models, for near-term projections 2021–2040) (https://www.worldclim.org/data/cmip6/cmip6_clim30s.html; accessed 20/10/2024).
Since pedological factors are recognised to influence the vitality of the B. Oleae pupas [17], the soil conditions in the study area were acquired from Soilgrid (https://soilgrids.org/) and SITR database (https://www.sitr.regione.sicilia.it/) and were considered in the simulations as input data. The following soil predictors and geomorphological information were included in the predictor list:
- • Digital Terrain Model (DTM): The DTM, with a 20-m resolution, was acquired from the SITR geo-database through the GIS WFS (https://www.sitr.regione.sicilia.it/accessed on 13/02/2022 and unavailable at present).
- • Slope [%]: The slope of the terrain was computed, at a 20-m resolution, from DTM by using specific tools available in QGIS 3.22.1 (Sphinx, https://docs.qgis.org/3.40/it/docs/training_manual/index.html) .
- • Aspect [°]: The raster was produced from DTM by using specific tools available in QGIS 3.22.1 (Sphinx vectorization toolkit for QGIS, https://docs.qgis.org/3.40/it/docs/training_manual/index.html). This parameter contains values ranging from 0 to 360, which represent the direction of the slope, beginning with the north (0°) and continuing in a clockwise direction.
- • Volume of water in soil at a -5 cm depth, at saturated soil of -10 kPa (named Vw-10 hereafter), at field capacity of -33 kPa (named Vw-33 hereafter), and at permanent wilting point of -1500 kPa (named Vw-1500 hereafter), obtained from Soilgrid250 [18] (https://soilgrids.org/accessed on 02/10/2023).
- • Sand Content, Silt Content, Clay Content [g/kg]: Raster images were used to indicate the fine earth content present in the soil. According to the established definitions, particles classified as sand have a diameter between 2 and 0.05 mm; particles designated as silt have a diameter between 0.05 and 0.002 mm; and particles identified as clay are the finest fraction, with particles diameter less than 0.002 mm [18].
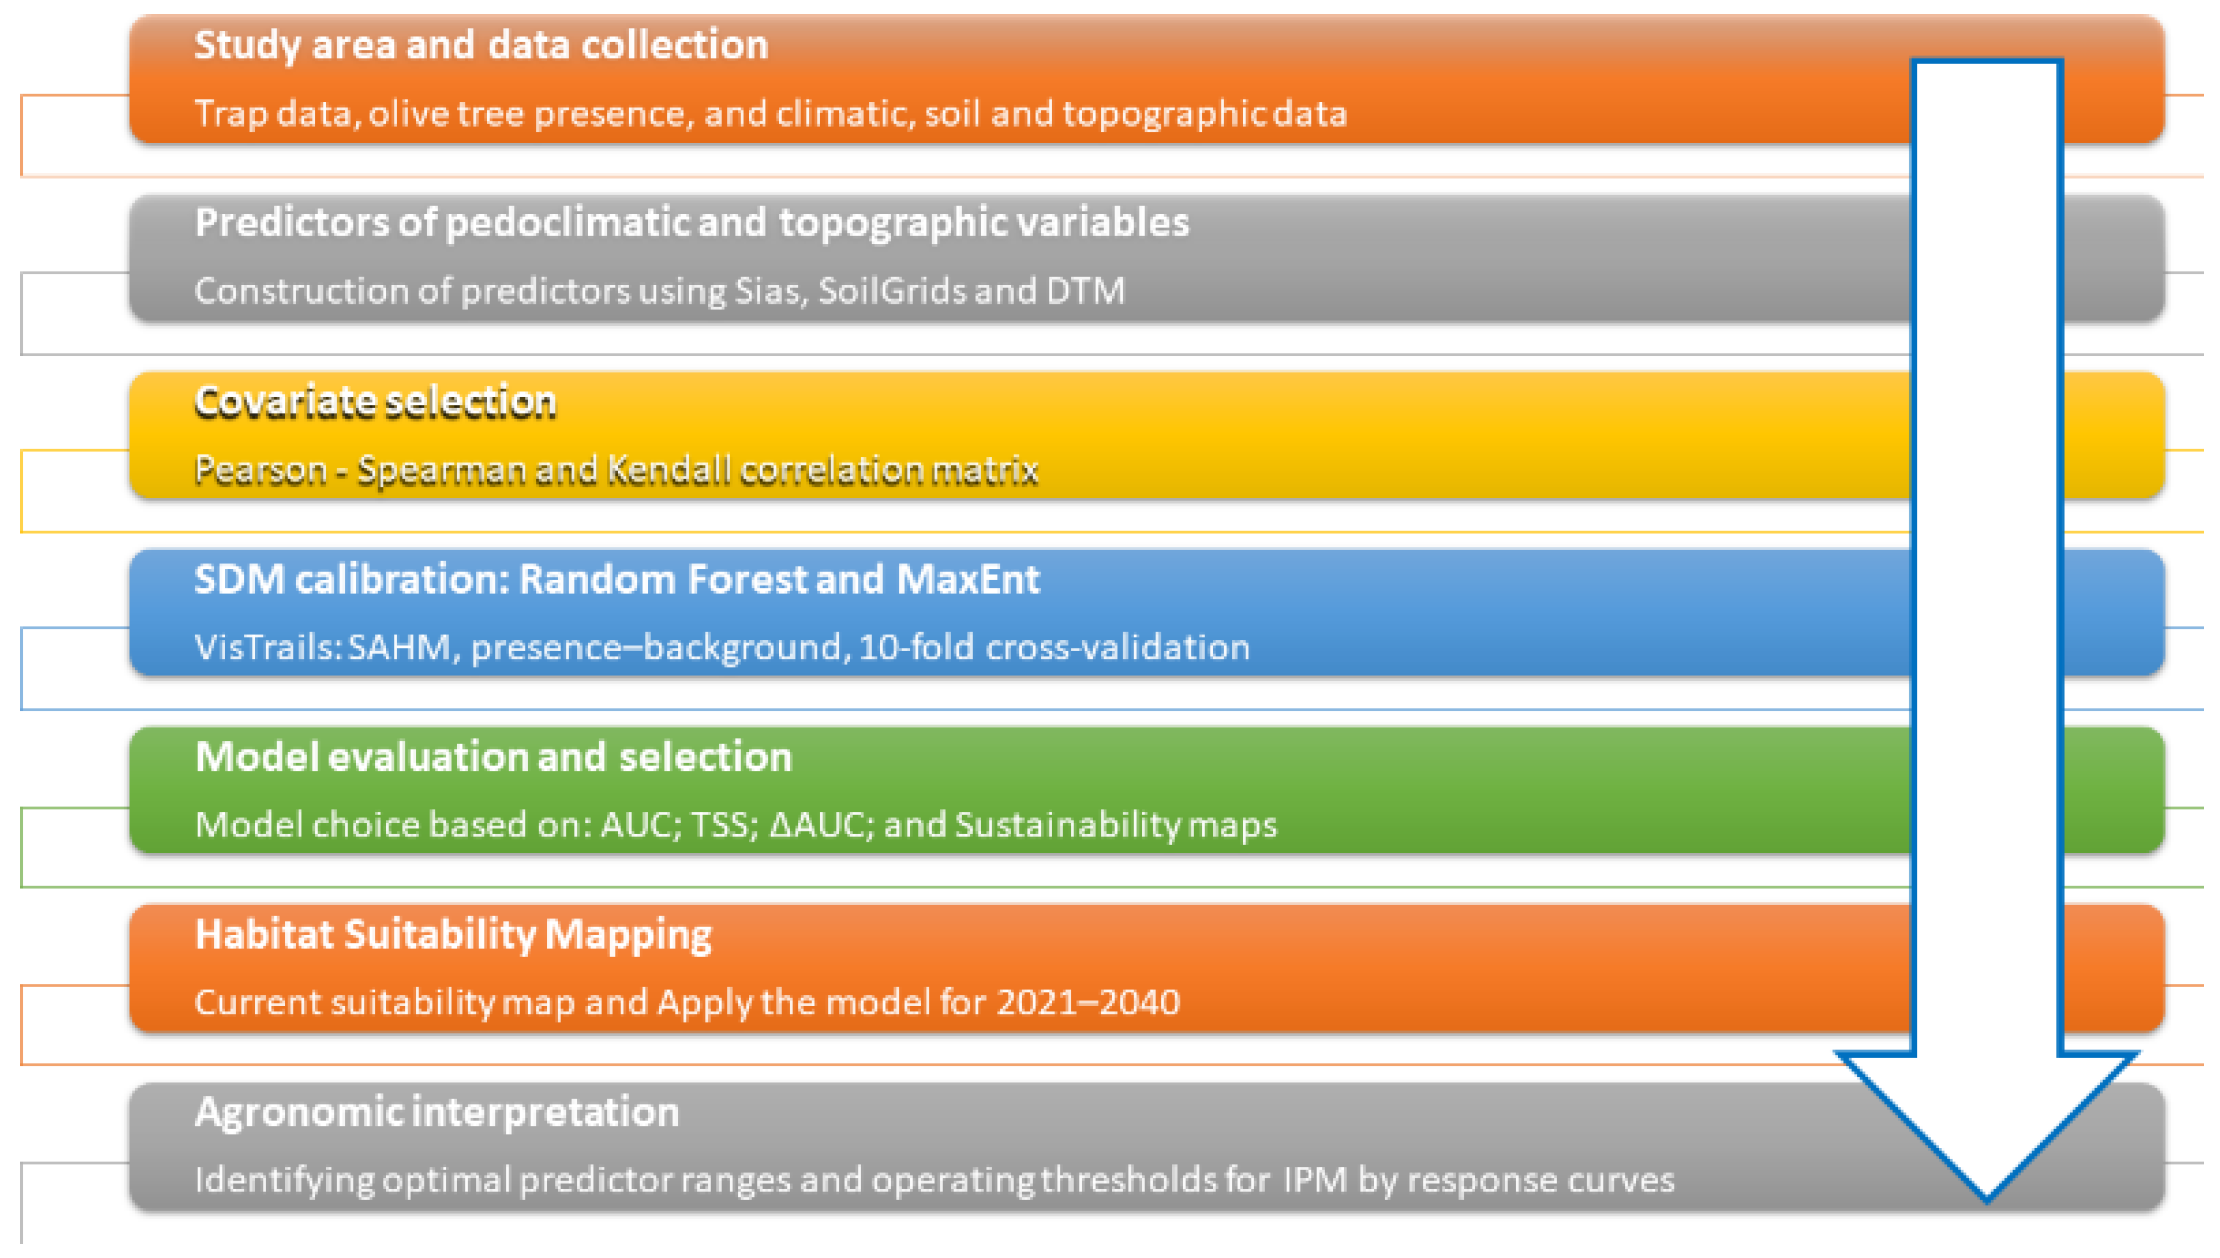
Figure 2.
Methodology framework.
2.3. Implementation of Species Distribution Models (SDMs)
Vistrails:Sahm was the framework used for the entire process [19,20].
Two SDMs, namely Random Forest (RF) and Maximum Entropy (MaxEnt), were used to generate probability maps of B. Oleae presence. RF is an ensemble learning method composed of multiple decision trees built on random subsets of data. MaxEnt is a machine-learning method optimised for presence-background data that estimates the most uniform distribution consistent with the observed data. These models have been widely applied for various objectives such as estimation of potential biomass [16], optimisation of resource input [20], and relationship between fish and habitat [21]. The models were trained and tested by using 10-fold cross-validation [22]. To reduce collinearity among highly correlated variables (r ≥ 0.75) [23], the predictors with the greatest ecological relevance to the biology of B. Oleae were retained in order to reduce redundancy and improve transferability [23,24]. Finally, the Apply model module was also used to enable predictions of the future climate suitability for B. Olea.
2.4. Output Assessment
The results of the predicted presence maps and the performance of the models were evaluated by using accuracy measures derived from the confusion matrix, including the True Skill Statistic (TSS) and the Area Under the Curve (AUC), which are widely used metrics for evaluating the reliability of SDMs.
The AUC represents the area under the Receiver Operating Characteristic (ROC) curve. According to [25], the test is moderately accurate in the range 0.7–0.9 and highly accurate for values above 0.9. In these types of assessments, overfitting is generally considered and analysed because in such conditions the utility of the model is limited, indicating that the uncertainty regarding the true complexity of the environmental niche is high [26].
In the literature, the selection of the most suitable model is generally based on a comparative analysis of its performance. The most commonly used criteria are:
i) maximising the AUC during the training phase by choosing the model with the highest AUC value calculated on the data used to build the model; and
ii) maximising the testing AUC by choosing the model with the highest AUC value calculated on a randomly selected test dataset not used in the training phase.
In addition to these criteria, jointly analysing training and testing performance allows us to assess the risk of overfitting by calculating the difference between the corresponding AUC values (ΔAUC). According to [27], a ΔAUC difference greater than 0.05 between the training and testing phases suggests potential overfitting. This third approach was adopted in this study, with a threshold of ΔAUC ≤ 0.05 used to identify models that strike a better balance between predictive capacity and generalisation.
Regarding the True Skill Statistic (TSS), values range from -1, indicating a performance no better than random, to +1, indicating perfect agreement [28].
Model response curves were also analysed to evaluate the relationship between environmental predictors and habitat suitability, with the aim to understand the potential interactive adaptation of the pest. These curves describe the relationship between predictor values and the probability of presence, supporting the identification of high-probability ranges and thresholds, and each predictor’s contribution. Therefore, response curves were used to select the most suitable model for B. Oleae distribution and to compare it with previous studies, supporting the verification of future predictions based on observed data [28].
In the simulation of future scenarios, the “Apply model” module was used to create future distribution forecasts of B. Olea and compare them with the current probability of olive presence.
3. Results and Discussion
The Results and Discussion section is organised into four main parts. Section 3.1 describes how non-collinear covariates were selected by using the PSK correlation matrix. Section 3.2 analyses the suitability patterns simulated by RF and MaxEnt algorithms. Sub-section 3.2.1 then extends this assessment to the period from 2021 to 2040 under the SSP5-8.5 scenario by overlaying the predicted suitability with the presence of olive orchards in 2012. Finally, Section 3.3 interprets the response curves of the selected predictors, which are grouped into climatic, soil, and topographic variables.
Based on the results, the methodology developed in this study enabled the optimisation of the monitoring by creating a climate suitability map for the pest. In addition, the comparison of response curves across the territory was suitable to improve pest management, providing farmers and local authorities with useful information for management and planning purposes while containing pest monitoring costs.
3.1. Analysis of Covariates and Models’ Metrics
Figure 3 summarises: (i) the set of predictors retained after correlation analysis and (ii) the Pearson–Spearman–Kendall correlation matrix (PSK matrix) used for selection. The left column indicates the “Response/Importance” that reports the univariate contribution of each predictor to modelled suitability.
Based on the reduction of collinearity between highly correlated predictors, ten co-variates were selected for modelling: Bio 2 (Mean Diurnal Range), Bio 4 (Temperature Seasonality; SD × 100), Bio 15 (Precipitation Seasonality; coefficient of variation, %), Bio 16 (Precipitation of Wettest Quarter, mm), clay (0–5 cm), sand (0–5 cm), silt (0–5 cm), DTM, slope (%), and aspect (°).
Then, the predictors identified by the PSK matrix were used to train the MaxEnt and RF models. Table 1 shows the accuracy measures related to the models, in accordance with the description reported in Section 2.4.
According to [25], the models can be classified as “highly accurate” when the AUC values are greater than 0.90.
Furthermore, in this study the TSS value was greater than 0.60, confirming that the models have a high accuracy [28].
Therefore, the accuracy measures calculated from 10 cross-validation replicates indicate high performance for both algorithms with values falling within the ranges obtained in regionally-applied SDM of B. Oleae [4,30]. However, the training AUC values can be an inaccurate metric in presence/background contexts [31]. Therefore, an inspection of the difference in AUC between the training and testing phases was also performed to identify overfitting. Specifically, the difference between the training and test AUC (ΔAUC) was lower than the 0.05 threshold (Table 1).
3.2. Species Suitability Maps
The suitability maps (Figure 4) should be interpreted as indices of the species’ relative environmental suitability, rather than as absolute probabilities of occurrence. While the resulting map shows the abiotic conditions suitable for the species, it does not depict its actual niche, which is further limited by factors such as predators or competitors, host plant distribution and dispersal barriers [32]. Consequently, an area of high suitability may not be occupied, as the results do not represent probabilities of occurrence in the strict sense, but rather an index that ranks the suitability of different areas [33].
Figure 4a and Figure 4b show the suitability maps produced for the current scenario by the two algorithms, i.e., RF and MaxEnt. These maps outline a rather specific distribution pattern for B. Oleae in the provinces of Catania, Syracuse, and Ragusa. According to [35], biodiversity research must be able to integrate the effects of climate change and land use change. Therefore, the approach adopted in this study responds to the need to simulate the interactions between different pedoclimatic predictors at the local scale. The RF produces a more selective surface. MaxEnt, on the other hand, is more inclusive in identifying areas of suitability, assigning moderate suitability values to regions with only a subset of ideal conditions. The differences at the boundaries of the identified areas indicate “Low probability” ecological areas. However, their strong overlap in areas of high suitability improves the accuracy of predictions (Warren & Seifert, 2011). The results of the two models show high spatial convergence (about 52,848 ha), delineating a specific distribution pattern. In both suitability maps, areas with higher levels of suitability are not evenly distributed across the territory due to heterogeneous soil and climate conditions. Environmental suitability for the olive fly tends to be very low along the coastal strips, as well as in the areas of the Catania Plain and at higher altitudes on Mount Etna. The most significant presence seems to be concentrated mainly in two inland areas: the first covers the Iblean Plateau, affecting the inland areas of the provinces of Ragusa and Syracuse; the second nucleus is located in the Calatino area, in the south-western part of the province of Catania.
The probability maps related to the presence of B. Oleae show that high suitability for its presence is restricted to lowland and foothill areas, where olive cultivation has historically been practiced. Areas that are climatically suitable but where olive trees are not cultivated may not be occupied. As highlighted by [40], this is due to the fact that B. Oleae is monophagous on Olea europea; therefore, the presence of the host limits its distribution even where suitability for presence is high.
The area of overlap between the RF and MaxEnt models amounts to just 9.64% of the territory, equivalent to 52,848 hectares.
The RF model identifies 103,197 hectares as suitable, with the most suitable areas concentrated in the municipalities of Mineo, Caltagirone, Palagonia, Adrano and Paternò.
In contrast, the MaxEnt model defines 78,245 hectares as suitable, with a higher level of suitability in the municipalities of Misterbianco, Caltagirone, Francofonte, Ragusa and Mineo.
These differences in suitability depend mainly on the weight given to environmental variables in different territorial contexts. The RF model is more effective than MaxEnt at identifying areas with higher climatic suitability, since areas with the highest probability of presence agree with field observations (i.e., pheromone traps). Therefore, RF was chosen as the most accurate model for the case study, although accuracy measurement analyses were also verified using MaxEnt results.
The results of this study are also supported by the findings of [36], who verified that environmental suitability is not maximised in uniform landscapes, but at the interfaces between different environmental systems, such as foothills and hill margins, where local combinations of humidity, soil aeration and thermal stability create favourable microhabitats.
In conclusion, the RF model is more effective than MaxEnt at identifying the most climatically favourable areas, in terms of both overall accuracy and correspondence between predictions and observed data.
3.2.1. Spatial Distribution of the B. Oleae in the Future Scenario 2021–2040
Forecasting future pest trends also enables evaluation of their potential impact on olive production. Therefore, changes in pest suitability have been compared, within the landscape, with the presence of the plant. This comparison makes it possible to verify the spatial consistency between areas that are potentially suitable for B. Oleae and areas that are actually cultivated, thus providing initial validation of the model. To evaluate the maximum risk scenario, the SSP5-8.5 scenario, an approach also adopted in the study by [7] which was used to identify the maximum potential expansion of climatically suitable areas for the pest.
As the models were trained by using climate data from 2003 to 2021, and the forecast covers the period from 2021 to 2040, the time needed for the crop to develop and enter production was taken into account. For this reason, points indicating the presence of olive trees in 2012 were used.
In Figure 5, the areas classified as having high and medium pest suitability overlap in most cases with dense stands of olive trees arranged in multiple blocks within the Iblean–Calatino sector and along several inland valley systems. This pattern is particularly evident in the municipalities of Chiaramonte Gulfi and Militello in Val di Catania, where 68.57% and 82.42% of the municipal territories, respectively, are classified as having high or medium suitability, indicating high potential pest pressure at the landscape scale. This spatial concordance confirms that the model correctly identifies environmentally suitable areas and the resulting distribution pattern of B. oleae. Moreover, the comparison of Figure 5 with Figure 4b shows that the upper classes coincide with the current suitable areas. Figure 9 shows how areas where olive trees are already growing tend to become larger and more connected and are more likely to be suitable for growing olives in the future. Finally, some areas where the pest is likely to be found but no host plant is present have been identified. In these cases, the soil and climate conditions are ideal, but the area is too far from crops. Therefore, if olive orchards were to be established in these areas in future, they could be subject to significant pest pressure. This is due to mild winters favouring the survival of B. Oleae in the pupal stage, which increases the risk of infestation [37]. A comparison between the RF actual and future probability maps revealed significant changes in the spatial distribution of risk for B. oleae. In the actual scenario, approximately 445,000 hectares (81%) of the territory are classified as risk-free, while only 19% present a certain level of suitability: ~74,000 ha (13.5%) in Low, ~23,000 ha (4.2%) in Medium and only 6,000 ha (1.1%) in the Highest class. In the SSP5-8.5 future scenario, the unsuitable area is reduced by almost half, falling to around 246,000 hectares (44.9%). At the same time, areas with a high probability of infestation increase significantly: low probabilities triple to around 236,000 hectares, or 43% of the study area, while medium probabilities expand to almost three times the area in the present scenario, reaching around 62,000 hectares, or 11.3% of the study area. High probability areas, on the other hand, decrease slightly to about 4,300 hectares (0.8%). From an ecological point of view, the future climate scenario does not generate new intense hotspots; on the contrary, it favours large-scale spread, promoting many areas currently classified as unsuitable to areas with low and medium probability of occurrence. No significant increases have been observed in areas with a high probability of occurrence; these areas remain limited and selective. The projections of the SSP5-8.5 climate scenario are set to expand and connect areas potentially suitable for the spread of B. oleae, particularly in the hilly areas of Iblean-Calatino and along the inland valleys. This analysis has direct implications for management. According to [38], timely and targeted integrated pest management (IPM) strategies are needed for areas that are already cultivated with olive trees and overlap with areas of high value, as well as for areas where crops will be cultivated in the future. According to [39], the agricultural phase constitutes a significant contributor to the environmental impact of the olive oil life cycle. The information generated by species distribution models has the potential to inform agronomic decisions and to form the basis for new circular economy strategies. Consequently, suitability maps for B. Oleae have been generated. In future studies, the potential exists for the integration of these maps with olive tree climate suitability maps. Additionally, integration with maps detailing the utilisation of inputs such as chemical or organic fertilisers, including digestate, could be a valuable improvement. The strategic utilisation of biomass as organic fertilisers depends on the geographical proximity between olive mill sites and agricultural areas. Therefore, GIS platforms emerge as valuable tools for supporting territorial planning. Furthermore, integrating suitability maps with LCA analyses facilitates the identification of optimal locations and appropriate scale for new industrial facilities. This supports the promotion of plant establishment in areas with stable biomass flows, where effective pest management ensures the long-term sustainability of the incoming raw material.
3.3. Assessment Through Analysis of Response Curves and Predictors
Figure 6 shows the contribution of each predictor to the suitability assigned by the model. The curves identify the ranges of predictors in which suitability increases, stabilises, or decreases, providing an interpretable link between the predictors and the probability maps generated by the models. In the following subsections, the analysis of the response curves and predictors is carried out by grouping the analyses by bioclimatic predictors, edaphic predictors and topographic predictors.
3.3.1. Climatic Predictors: A Focus on BIO2, BIO4, BIO15, BIO16
One of the biologically significant results of the study is that winter temperatures influence prediction mechanisms. Winter can alter the biotic potential and size of the population that will emerge in spring, defining the intensity of pest pressure for the following season. According to [2], milder winter temperatures are correlated with a more intense and earlier season of attacks. The Bio 2 curve showed that intermediate values of diurnal temperature range are associated with a higher probability of occurrence. The probability of occurrence predicted by both models was mainly distributed between the third class (7.95–8.64) and the fourth class (8.64–9.1). These classes corresponded to areas located mainly in the foothills and hills of eastern Sicily (see Figure 7a), where the daily temperature fluctuations observed are more moderate than the values in inland areas. In these areas, both the MaxEnt and RF models assign high levels of suitability, highlighting how this variable plays an essential role in determining potential distribution. According to [30], Bio 2 predictor is among the most influential in delineating the ecology of B. oleae. Diurnal temperature ranges exceeding 10 °C cause a sharp reduction in suitability of presence, highlighting a clear preference of B. Oleae for climates with moderate diurnal temperature ranges.
The Bio 4 predictor identifies the areas with the highest suitability as falling between 522 and 724.28. These values are found in both coastal and inland areas, where temperature variations during the year are harmful to B. oleae. As [2] observed, although high spring temperatures cause an acceleration of the first attacks, bringing forward their occurrence, this increase in temperature is negatively correlated with the overall probability of seasonal infestation. These results demonstrate that spring acts as a second demographic filter after winter. The timing of emergence does not coincide with the plant’s phenological phase, which causes pupal mortality through desiccation or the premature decline of adults; and it results in reduced seasonal infestation pressure. This phenomenon is more evident in the results of the RF model, which shows a more fragmented and selective potential area than the MaxEnt model. Internal areas with very hot summers are less suitable for B. Oleae due to increased temperatures. High seasonality is penalised by the model as it leads to summer temperatures that are lethal for the insect. Experimental data from [12] showed that larval mortality reaches 100% above 32.5 °C.
The Bio 15 predictor (Figure 7c), shows optimal suitability at intermediate levels of rainfall variability. The Medium (80.20% – 82.30%) and Medium-High (82.30% – 84.30%) classes are widespread in the central-southern area, where precipitation is mainly concentrated in the autumn and winter months, with small contributions also in summer.
As for Bio 16 predictor (Figure 7d), the areas with the highest suitability are concentrated in zones with average (243.55 – 256.59 mm) and medium-high (243.55 – 256.59 mm) precipitation levels. These areas are arranged in two formations: an internal band running from west to east through the study area, and a ring on the lower slopes of Etna. The Bio16 intervals (250–317 mm) maximise suitability by providing adequate autumn and winter rainfall.
Finally, the RF model depicts a fragmented and selective pattern of suitability, mostly confined to areas characterised by moderate diurnal temperature ranges, low temperature seasonality and intermediate rainfall regimes, concentrated around the central values of the response curves.
By contrast, the MaxEnt model outlines a more continuous potential distribution, extending into transitional zones that approach the species’ thermal and rainfall limits and including areas that are marginal relative to the optimal suitability range.
3.3.2. Soil Predictors (0–5 cm Texture: Sand, Silt, Clay)
The presence of B. Oleae is influenced by soil characteristics, particularly texture, as the pest completes part of its life cycle in the soil during the winter season (Lal, 2004).
In addition, the presence of B. oleae, as demonstrated in the work of [17], is mainly found in the first few centimetres of the topsoil, with maximum frequency between 0 and 3 cm. The insect is sensitive to its physical properties, such as water retention capacity and aeration. The depth of pupation is significantly influenced by soil type, with calcareous soils inducing deeper pupation, whereas alluvial soils with higher percentages of sand and silt result in an average depth of 1.16 cm.
Spatial results show that the highest probability is concentrated in areas where the clay content varies from 225 to 375 g/kg, clay in the Medium–Medium-High classes (206–357 g kg⁻1; Figure 8a). The sand content in the soil (Figure 8b) has a negative correlation with suitability for presence. Suitability increases from low to intermediate values and decreases when sand falls into the High class ( > 364 g kg⁻1; Figure 8b); these conditions are typical of the slopes of Mount Etna and some coastal areas, where greater porosity can promote surface drying in the absence of prolonged moisture [42]. As regards the silt content in the “Silt” soil, the Medium and Medium-High classes (458–571 g kg⁻1; Figure 8c) coincide with maximum suitability. These percentages are recurrent in floodplains and inland basins, where water retention capacity combined with soil porosity provides a microenvironment favourable to pupal overwintering.
It can therefore be concluded that clay, silt and sand are compositional fractions of soil texture that must be interpreted jointly. The RF and MaxEnt models assigned a high probability of occurrence mainly in soils with a balanced texture between its components, according to Miller’s triangle, with moderate clay and silt, and low sand values; this result is in line with the findings of [17].
3.3.3. Topographic Predictors (DTM, Elevation, Slope, Aspect)
The Sicilian landscape is characterised by high levels of heterogeneity, which can affect macroclimatic conditions. The DTM variable (Figure 4) shows that the potential distribution of the suitability of B. Oleae is strongly limited by altitude. Analysis of the response curve (Figure 6) shows a positive contribution between 32 m and 562 m above sea level, where the highest suitability values are concentrated, with a maximum weight of 0.48; at higher altitudes, suitability decreases significantly. In the DTM variable map (Figure 9a), altitudes between 32 m and 562 m above sea level are those where olive cultivation is most concentrated and correspond mainly to coastal plains, valleys and foothill areas. However, by overlaying the DTM variable on the probability maps of the RF and MaxEnt models (Figure 4), it can be seen that B. oleae is also present in suitable environments at relatively high altitudes, reaching about 1000 m above sea level. These habitats are found on some slopes of Mount Etna and in some parts of the Calatino area, where the local topography and climate create favourable microclimatic conditions. Data from [17] confirm this result: altitude is a mitigating predictor of pest suitability, but not as constraining as other climate predictors such as mean temperature or temperature range. High-altitude olive groves can be considered climatic refuges where the development of B. oleae is intrinsically slower and the overall infestation pressure is significantly lower.
The models indicate a clear preference for predominantly flat or sloping areas with values below 12%. This is reflected in the map in Figure 9b, where areas belonging to the Low-Medium and Medium classes (3.00 - 9) more often correspond to greater suitability than the Medium-High/High classes ( > 9.00).
This relationship is likely to be an indirect effect linked to agricultural practices, as most olive groves are located on gently sloping land to facilitate cultivation and mechanisation. In contrast, the Aspect variable showed no clear preference, as the response curve indicated no appreciable increase in suitability across orientations. There is a weak correlation with the low suitability of north-facing slopes, which have microclimates that receive less radiation and are cooler and more humid (Figure 9c).
4. Conclusion
This research study demonstrated how a high-resolution modelling approach can be effective in delineating the ecological niche of B. Oleae at a local scale, particularly in the study area of eastern Sicily.
The high predictive power and strong spatial concordance between the two algorithms used in the study (RF and MaxEnt) confirmed the effectiveness of this method. The complex interactions between the selected predictors have made it possible to produce sustainability maps showing the potential distribution of B. Oleae. The climatic predictors associate the suitability of the species with a moderate temperature regime, defined by Bio 2 and Bio 4, and a seasonal balance of precipitation, defined by Bio15 and Bio16. Soil texture was a critical factor in regulating soil water availability, determining survival in the pupal stage and future infestation intensity. Topography acted as a filter, limiting suitability to areas with altitudes and slopes compatible with olive cultivation practices and, consequently, with the microclimatic requirements of B. Oleae.
The probability maps showed a non-homogeneous distribution of the pest in the territory, with environmental suitability increasing in areas where combinations of humidity, soil aeration and thermal stability create microhabitats favourable to the development and proliferation of the species.
Overlaying the future suitability projections for the SSP5–8.5 scenario for the period 2021–2040 with the 2012 olive presence map indicated that most existing olive-growing areas will remain at high risk, while additional zones, with high suitability but currently without olive groves, are identified as potential future hotspots for infestation.
The approach developed in this study provides a valid and practical foundation for analysing the risks and planning the use of land in agricultural ecosystems. Limitation of this study is connected to the focus on pedo-climatic and topographic data, excluding anthropogenic factors. Further research could include anthropogenic variables, such as management practices, irrigation regimes, and land-use changes, to refine model accuracy and better capture the complexity of agricultural systems.
Author Contributions
Conceptualization, G.A.C., and C.A.; methodology, G.A.C., P.R.D., and C.A.; software, G.A.C., and G.P.; validation, P.R.D.; formal analysis, G.A.C., P.R.D., and C.A.; investigation, G.A.C. and G.P.; resources, C.A.; data curation, G.A.C. and G.P.; writing—original draft preparation, G.A.C., G.P., and P.R.D.; writing—review and editing, G.A.C., P.R.D. and C.A.; visualisation, G.A.C. and P.R.D.; supervision, C.A.; project administration, C.A.; funding acquisition, C.A. All authors have read and agreed to the published version of the manuscript.
Funding
The APC was funded by the Agritech National Research Center and received funding from the European Union Next-GenerationEU (PIANO NAZIONALE DI RIPRESA E RESILIENZA (PNRR)—MISSIONE 4 COMPONENTE 2, INVESTIMENTO 1.4—D.D. 1032 17/06/2022, CN00000022—CUP: E63C22000960006). The work of prof. Claudia Arcidiacono was carried out within the same project. This manuscript reflects only the authors’ views and opinions; neither the European Union nor the European Commission can be considered responsible for them. This research is also in line with the ‘Piano incentivi per la ricerca di Ateneo 2024–2026 (DR 2306 del 03/06/2024)—Pia.ce.ri, Linea 2′ project on ‘Innovative solutions and strategies for sustainability of Cities, Land and Society’ (SIA3) by the University of Catania, coordinated by Claudia Arcidiacono.
Data Availability Statement
The data presented in this study are available at the Sicilian Region for Land Information System (SITR) (https://www.sitr.regione.sicilia.it/accessed on 19 September 2025), the global database WorldClim (https://www.worldclim.org/accessed on 16 July 2020), and Soilgrid250 (https://soilgrids.org/accessed on 2 October 2023).
Acknowledgments
The authors wish to thank the Sicilian Region for Land Information System (SITR) for data (https://www.sitr.regione.sicilia.it/).
Conflicts of Interest
The authors declare no conflicts of interest.
Abbreviations
The following abbreviations are used in this manuscript:
| Bio 2 | Mean Diurnal Range |
| Bio 4 | Temperature Seasonality |
| Bio 15 | Precipitation Seasonality |
| Bio 16 | Precipitation of Wettest Quarter |
| CMCC-ESM2 | Centro Euro-Mediterraneo sui Cambiamenti Climatici - Earth System Model 2 |
| CV | Cross-Validation |
| DOP | Protected Designation of Origin |
| DTM | Digital Terrain Model |
| GIS | Geographic Information System |
| IDW | Inverse Distance Weighting |
| IPCC | Intergovernmental Panel on Climate Change |
| IPM | Integrated Pest Management |
| ISMEA | Istituto di Servizi per il Mercato Agricolo Alimentare |
| MaxEnt | Maximum Entropy |
| RF | Random Forest |
| ROC | Receiver Operating Characteristic |
| SDM | Species Distribution Model |
| TSS | True Skill Statistic |
| AUC | Area Under the Curve |
References
- IPCC. Climate Change 2021: The Physical Science Basis. Contribution of Working Group I to the Sixth Assessment Report of the Intergovernmental Panel on Climate Change; Cambridge University Press, 2021. [Google Scholar]
- Rondoni, G.; Mattioli, E.; Giannuzzi, V. A.; Chierici, E.; Betti, A.; Natale, G.; Conti, E. Evaluation of the effect of agroclimatic variables on the probability and timing of olive fruit fly attack. Frontiers in Plant Science 2024, 15, 1401669. [Google Scholar] [CrossRef]
- Istituto di Servizi per il Mercato Agricolo Alimentare (ISMEA). Tendenze E Dinamiche recenti Olio D’oliva – Luglio 2025. Available online: https://www.ismeamercati.it/flex/cm/pages/ServeBLOB.php/L/IT/IDPagina/13559.
- Benelli, G.; Daane, K. M.; Canale, A.; Nadel, H.; Yokoyama, V. Y.; Messing, R. H. Integrated pest management of olive fruit fly (Bactrocera oleae): a review. Pest Management Science 2014, 70(11), 1641–1662. [Google Scholar]
- Volpi, I.; Guidotti, D.; Mammini, M.; Petacchi, R.; Marchi, S. Managing complex datasets to predict Bactrocera oleae infestation at the regional scale. Computers and Electronics in Agriculture 2020, 179, 105867. [Google Scholar] [CrossRef]
- Ashraf, U.; Chaudhry, M. N.; Peterson, A. T. Ecological niche models of biotic interactions predict increasing pest risk to olive cultivars with changing climate. Ecosphere 2021, 12(8), e03714. [Google Scholar] [CrossRef]
- Jin, Z.; Yu, W.; Zhao, H.; Xian, X.; Jing, K.; Yang, N.; Liu, W. Potential Global Distribution of Invasive Alien Species, Anthonomus grandis Boheman, under Current and Future Climate Using Optimal MaxEnt Model. Agriculture 2022, 12(11), 1759. [Google Scholar] [CrossRef]
- R Core Team. R: A language and environment for statistical computing.; R Foundation for Statistical Computing: Vienna, Austria, 2023. [Google Scholar]
- Barbet-Massin, M.; Jiguet, F.; Albert, C. H.; Thuiller, W. Selecting pseudo-absences for species distribution models: how, where and how many? Methods in Ecology and Evolution 2012, 3(2), 327–338. [Google Scholar] [CrossRef]
- Catalano, G. A.; D’Urso, P. R.; Maci, F.; Arcidiacono, C. Influence of Parameters in SDM Application on Citrus Presence in Mediterranean Area. Sustainability 2023, 15(9), 7656. [Google Scholar] [CrossRef]
- Guisan, A.; Graham, C. H.; Elith, J.; Huettmann, F.; NCEAS Species Distribution Modelling Group. Sensitivity of predictive species distribution models to change in grain size. Diversity and Distributions 2007, 13(3), 332–340. [Google Scholar] [CrossRef]
- Preu, M.; Frieß, J. L.; Breckling, B.; Schröder, W. Case Study 1: Olive Fruit Fly (Bactrocera oleae). In Gene Drives at Tipping Points; Springer: Cham, 2020; pp. 79–101. [Google Scholar] [CrossRef]
- Perez-Navarro, M. A.; Broennimann, O.; Esteve, M. A.; Bagaria, G.; Guisan, A.; Lloret, F. Comparing climatic suitability and niche distances to explain populations responses to extreme climatic events. Ecography 2022, 2022(11), e06263. [Google Scholar] [CrossRef]
- Nietupski, T. C.; Kim, J. B.; Tortorelli, C. M.; Lemons, R.; Kerns, B. K. Ventenata dubia projected to expand in the western United States despite future novel conditions. Ecosphere 2024, 15(9), e4979. [Google Scholar] [CrossRef]
- Hijmans, R. J.; Phillips, S.; Leathwick, J.; Elith, J. dismo: Species Distribution Modeling. R package version 1.1-4. 2017. [Google Scholar]
- Catalano, G. A.; D’Urso, P. R.; Arcidiacono, C. Predicting Potential Biomass Production by Geospatial Modelling: The Case Study of Citrus in a Mediterranean Area. Ecological Informatics 2024, 83, 102848. [Google Scholar] [CrossRef]
- Dimou, I.; Lambropoulos, P. A.; Kapatos, E. T. Soil factors affecting pupal distribution and mortality of the olive fruit fly Bactrocera oleae (Gmelin) (Diptera: Tephritidae). Journal of Applied Entomology 2003, 127(8), 469–473. [Google Scholar] [CrossRef]
- Poggio, L.; De Sousa, L. M.; Batjes, N. H.; Heuvelink, G. B.; Kempen, B.; Ribeiro, E.; Rossiter, D. SoilGrids 2.0: producing soil information for the globe with quantified spatial uncertainty. Soil 2021, 7(1), 217–240. [Google Scholar] [CrossRef]
- Da Silva, R. S.; Kumar, L.; Shabani, F.; Picanço, M. C. Potential risk levels of invasive Neoleucinodes elegantalis (small tomato borer) in areas optimal for open-field Solanum lycopersicum (tomato) cultivation in the present and under predicted climate change. Pest Management Science 2017, 73(3), 616–627. [Google Scholar] [CrossRef]
- Catalano, G. A.; Maci, F.; D’Urso, P. R.; Arcidiacono, C. GIS and SDM-Based Methodology for Resource Optimisation: Feasibility Study for Citrus in Mediterranean Area. Agronomy 2023, 13(2), 549. [Google Scholar] [CrossRef]
- See, K. E.; Ackerman, M. W.; Carmichael, R. A.; Hoffmann, S. L.; Beasley, C. Estimating carrying capacity for juvenile salmon using quantile random forest models. Ecosphere 2021, 12(3), e03404. [Google Scholar] [CrossRef]
- Hao, T.; Elith, J.; Lahoz-Monfort, J. J.; Guillera-Arroita, G. Testing whether ensemble modelling is advantageous for maximising predictive performance of species distribution models. Ecography 2020, 43(4), 549–558. [Google Scholar] [CrossRef]
- Kumar, S.; Neven, L. G.; Yee, W. L. Evaluating correlative and mechanistic niche models for assessing the risk of pest establishment. Ecosphere 2014, 5(7), art85. [Google Scholar] [CrossRef]
- Dormann, C. F.; Elith, J.; Bacher, S.; Buchmann, C.; Carl, G.; Carré, G.; Lautenbach, S. Collinearity: a review of methods to deal with it and a simulation study evaluating their performance. Ecography 2013, 36(1), 27–46. [Google Scholar] [CrossRef]
- D’Arrigo, G.; Provenzano, F.; Torino, C.; Zoccali, C.; Tripepi, G. I test diagnostici e l’analisi della curva ROC. Giornale Italiano di Nefrologia 2011, 28(5), 642–647. [Google Scholar]
- Warren, D. L.; Seifert, S. N. Ecological niche modeling in Maxent: the importance of model complexity and the performance of model selection criteria. Ecological Applications 2011, 21(2), 335–342. [Google Scholar] [CrossRef]
- Mukherjee, T.; Sharma, V.; Sharma, L. K.; Thakur, M.; Joshi, B. D.; Sharief, A.; Sathyakumar, S. Landscape-level habitat management plan through geometric reserve design for critically endangered hangul (Cervus hanglu hanglu). Science of The Total Environment 2021, 777, 146031. [Google Scholar] [CrossRef]
- Allouche, O.; Tsoar, A.; Kadmon, R. Assessing the accuracy of species distribution models: prevalence, kappa and the true skill statistic (TSS). Journal of Applied Ecology 2006, 43(6), 1223–1232. [Google Scholar] [CrossRef]
- Van Beest, F. M.; McLoughlin, P. D.; Mysterud, A.; Brook, R. K. Functional responses in habitat selection are density dependent in a large herbivore. Ecography 2016, 39(6), 515–523. [Google Scholar] [CrossRef]
- Benhadi-Marín, J.; Santos, S. A. P.; Baptista, P.; Pereira, J. A. Distribution of Bactrocera oleae (Rossi, 1790) throughout the Iberian Peninsula based on a maximum entropy modelling approach. Annals of Applied Biology 2020, 177(1), 112–120. [Google Scholar] [CrossRef]
- Lobo, J. M.; Jiménez-Valverde, A.; Real, R. AUC: a misleading measure of the performance of predictive distribution models. Global Ecology and Biogeography 2008, 17(2), 145–151. [Google Scholar] [CrossRef]
- Peterson, A. T.; Soberón, J.; Pearson, R. G.; Anderson, R. P.; Martínez-Meyer, E.; Nakamura, M.; Araújo, M. B. Ecological niches and geographic distributions; Princeton University Press, 2011. [Google Scholar]
- Merow, C.; Smith, M. J.; Silander, J. A., Jr. A practical guide to MaxEnt for modeling species’ distributions: what it does, and why inputs and settings matter. Ecography 2013, 36(10), 1058–1069. [Google Scholar] [CrossRef]
- Titeux, Nicolas; Henle, Klaus; Mihoub, Jean-Baptiste; Regos, Adrián; Geijzendorffer, Ilse R.; Lluís.
- Titeux, N.; Henle, K.; Mihoub, J.-B.; Regos, A.; Geijzendorffer, I. R.; Cramer, W.; Verburg, P. H.; Brotons, L. Global scenarios for biodiversity need to better integrate climate and land use change. Diversity and Distributions 2017, 23(11), 1231–1234. [Google Scholar] [CrossRef]
- Turner, M. G.; Gardner, R. H.; O’Neill, R. V. Landscape ecology in theory and practice; Springer, 2001. [Google Scholar] [CrossRef]
- Wang, X. G.; Levy, K.; Nadel, H.; Johnson, M. W.; Blanchet, A.; Argov, Y.; Daane, K. M. Overwintering survival of olive fruit fly (Diptera: Tephritidae) and two introduced parasitoids in California. Environmental Entomology 2013, 42(3), 467–476. [Google Scholar] [CrossRef]
- Lantero, E.; Matallanas, B.; Callejas, C. Current Status of the Main Olive Pests: Useful Integrated Pest Management Strategies and Genetic Tools. Applied Sciences 2023, 13(21), 12078. [Google Scholar] [CrossRef]
- Cinardi, G.; D’Urso, P. R.; Arcidiacono, C.; Ingrao, C. Accounting for circular economy principles in Life Cycle Assessments of extra-virgin olive oil supply chains – Findings from a systematic literature review. Science of The Total Environment 2024, 945, 173977. [Google Scholar] [CrossRef] [PubMed]
- Caselli, A.; Favaro, R.; Petacchi, R.; Angeli, S. Infestation of the gall midge Dasineura oleae provides first evidence of induced plant volatiles in olive leaves. Bulletin of Entomological Research 2022, 112(4), 481–493. [Google Scholar] [CrossRef] [PubMed]
- Lal, R. Soil texture, soil structure, and soil organic matter effects on carbon sequestration. Soil and Tillage Research 2004, 78(2), 183–193. [Google Scholar]
- Papadopoulos, N. T.; Katsoyannos, B. I. Field studies on the olive fruit fly (Bactrocera oleae) pupal mortality. Phytoparasitica 2003, 31, 347–355. [Google Scholar]
Figure 1.
- Location of the area under study in Sicily (Italy) and study area encompassing the municipalities of Catania, Syracuse, and Ragusa.
Figure 1.
- Location of the area under study in Sicily (Italy) and study area encompassing the municipalities of Catania, Syracuse, and Ragusa.
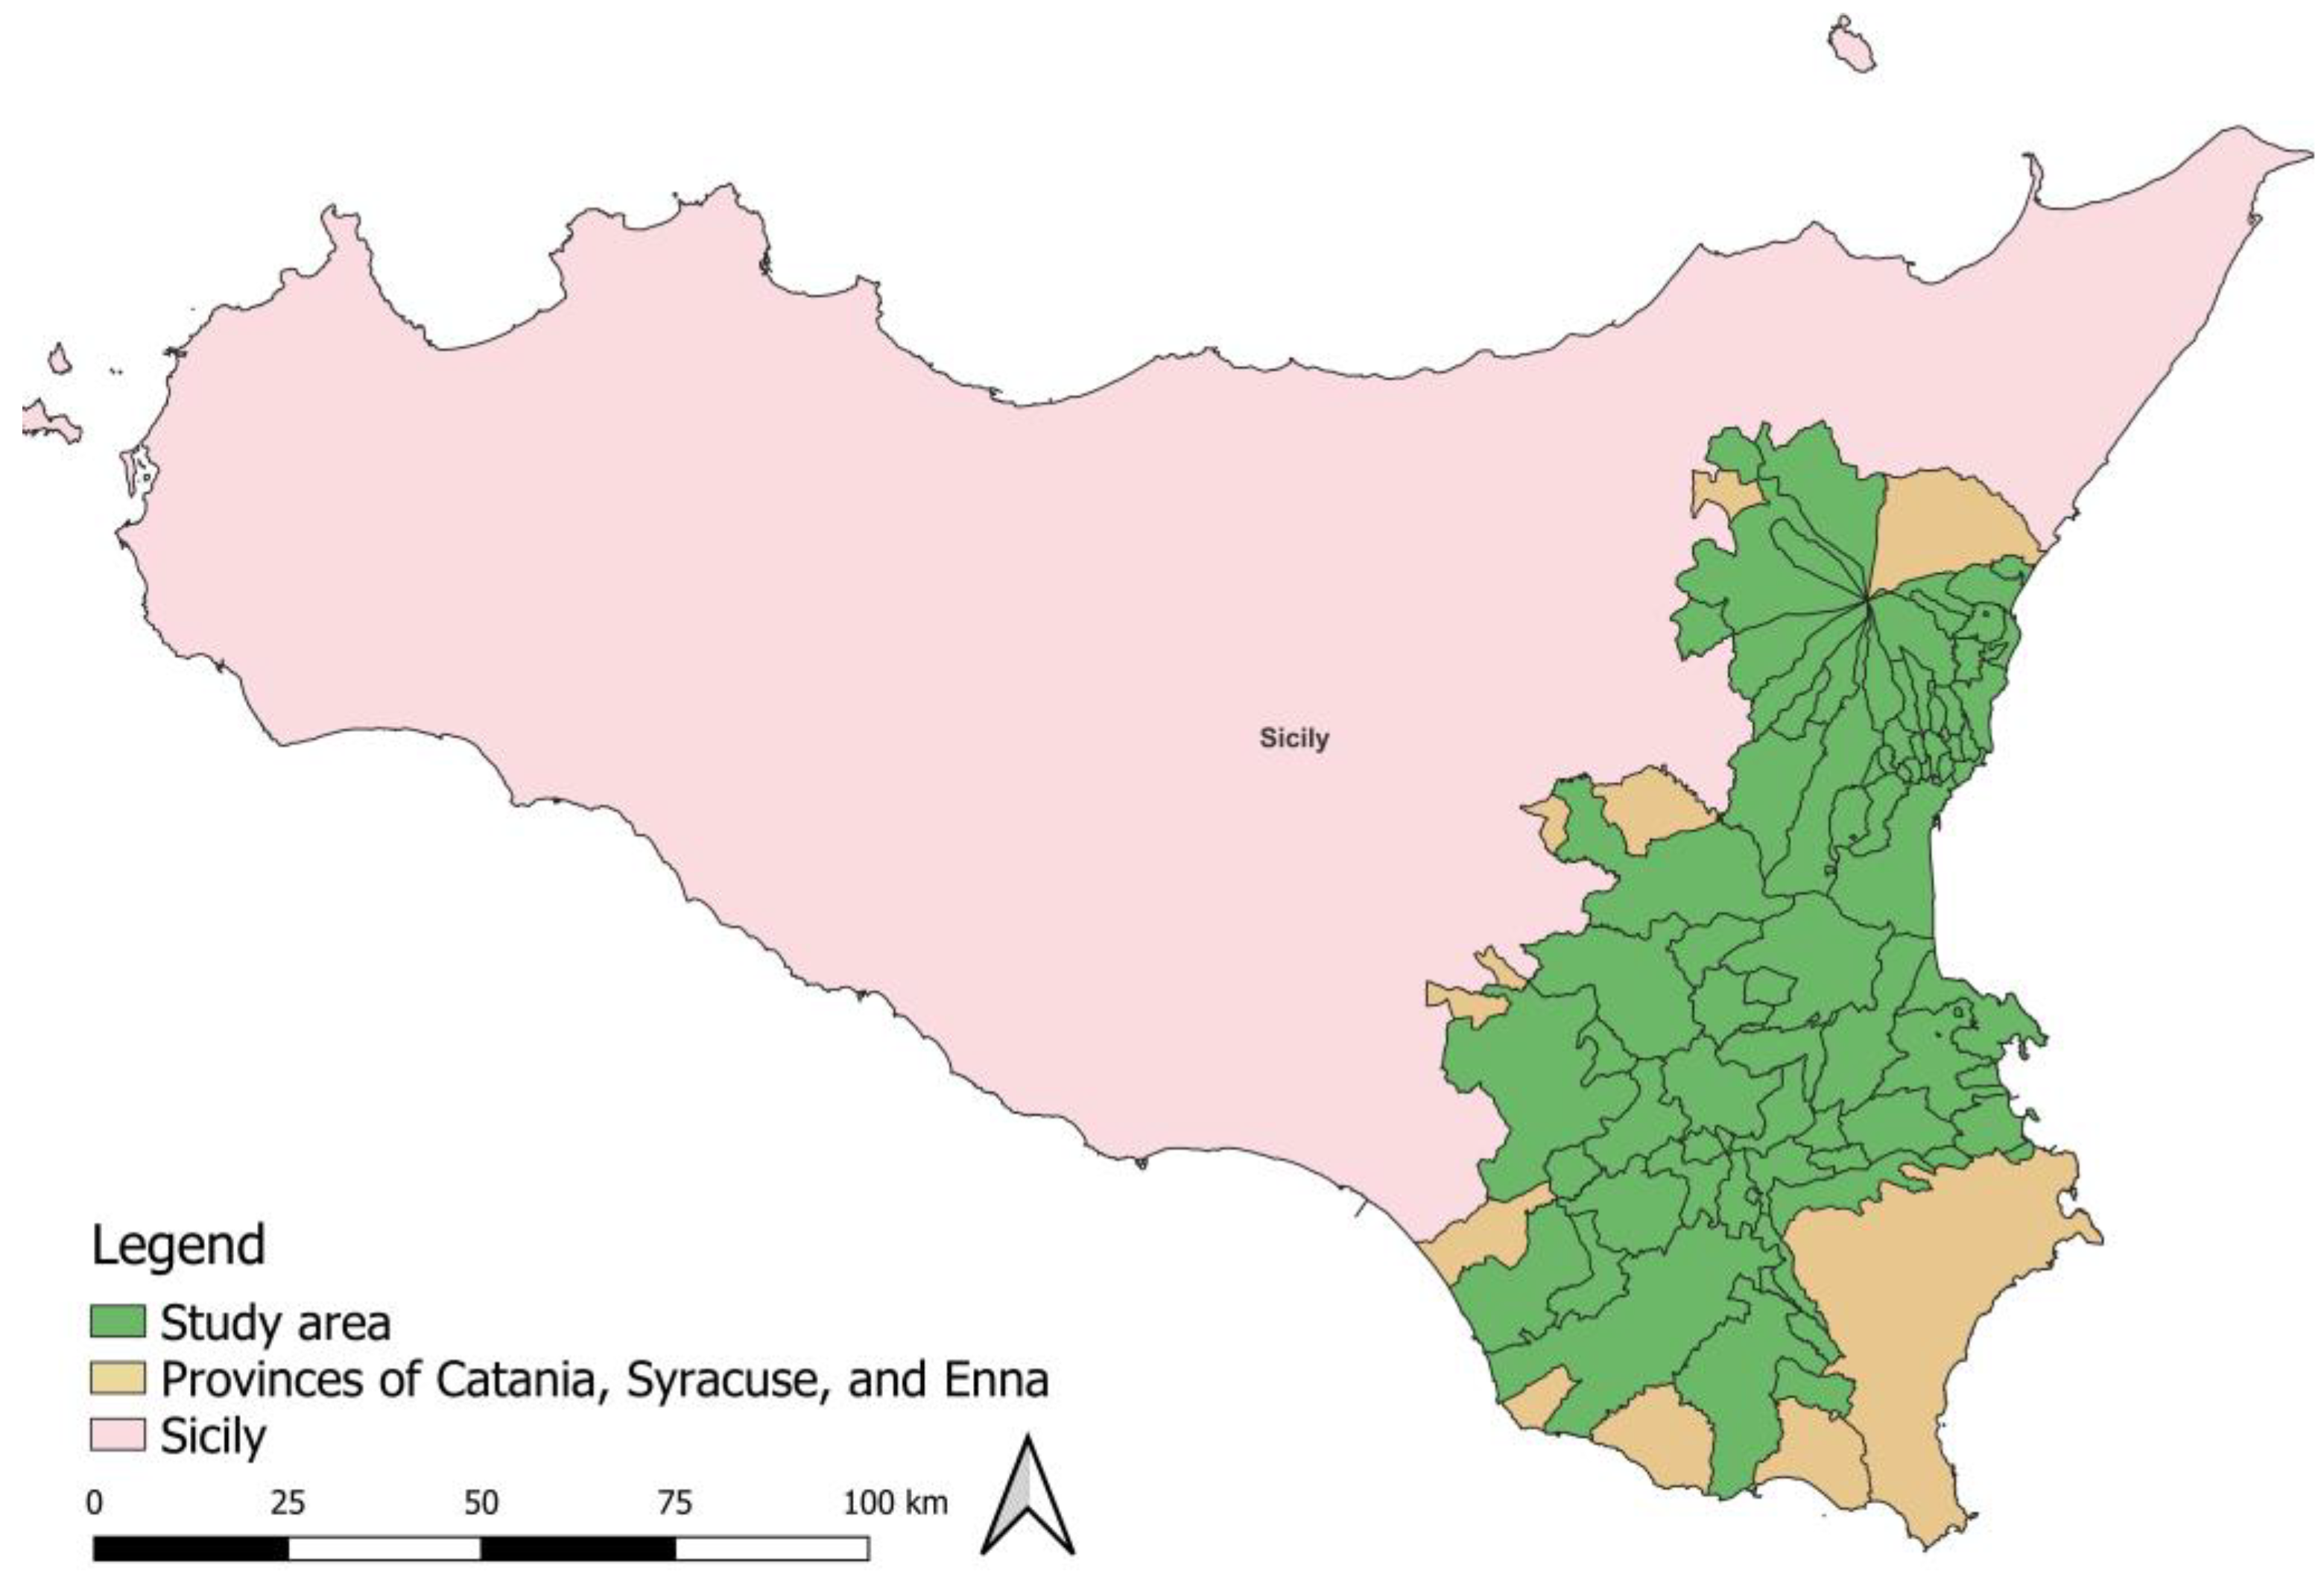
Figure 3.
PSK matrix, where histograms for each variable are displayed along the diagonal.
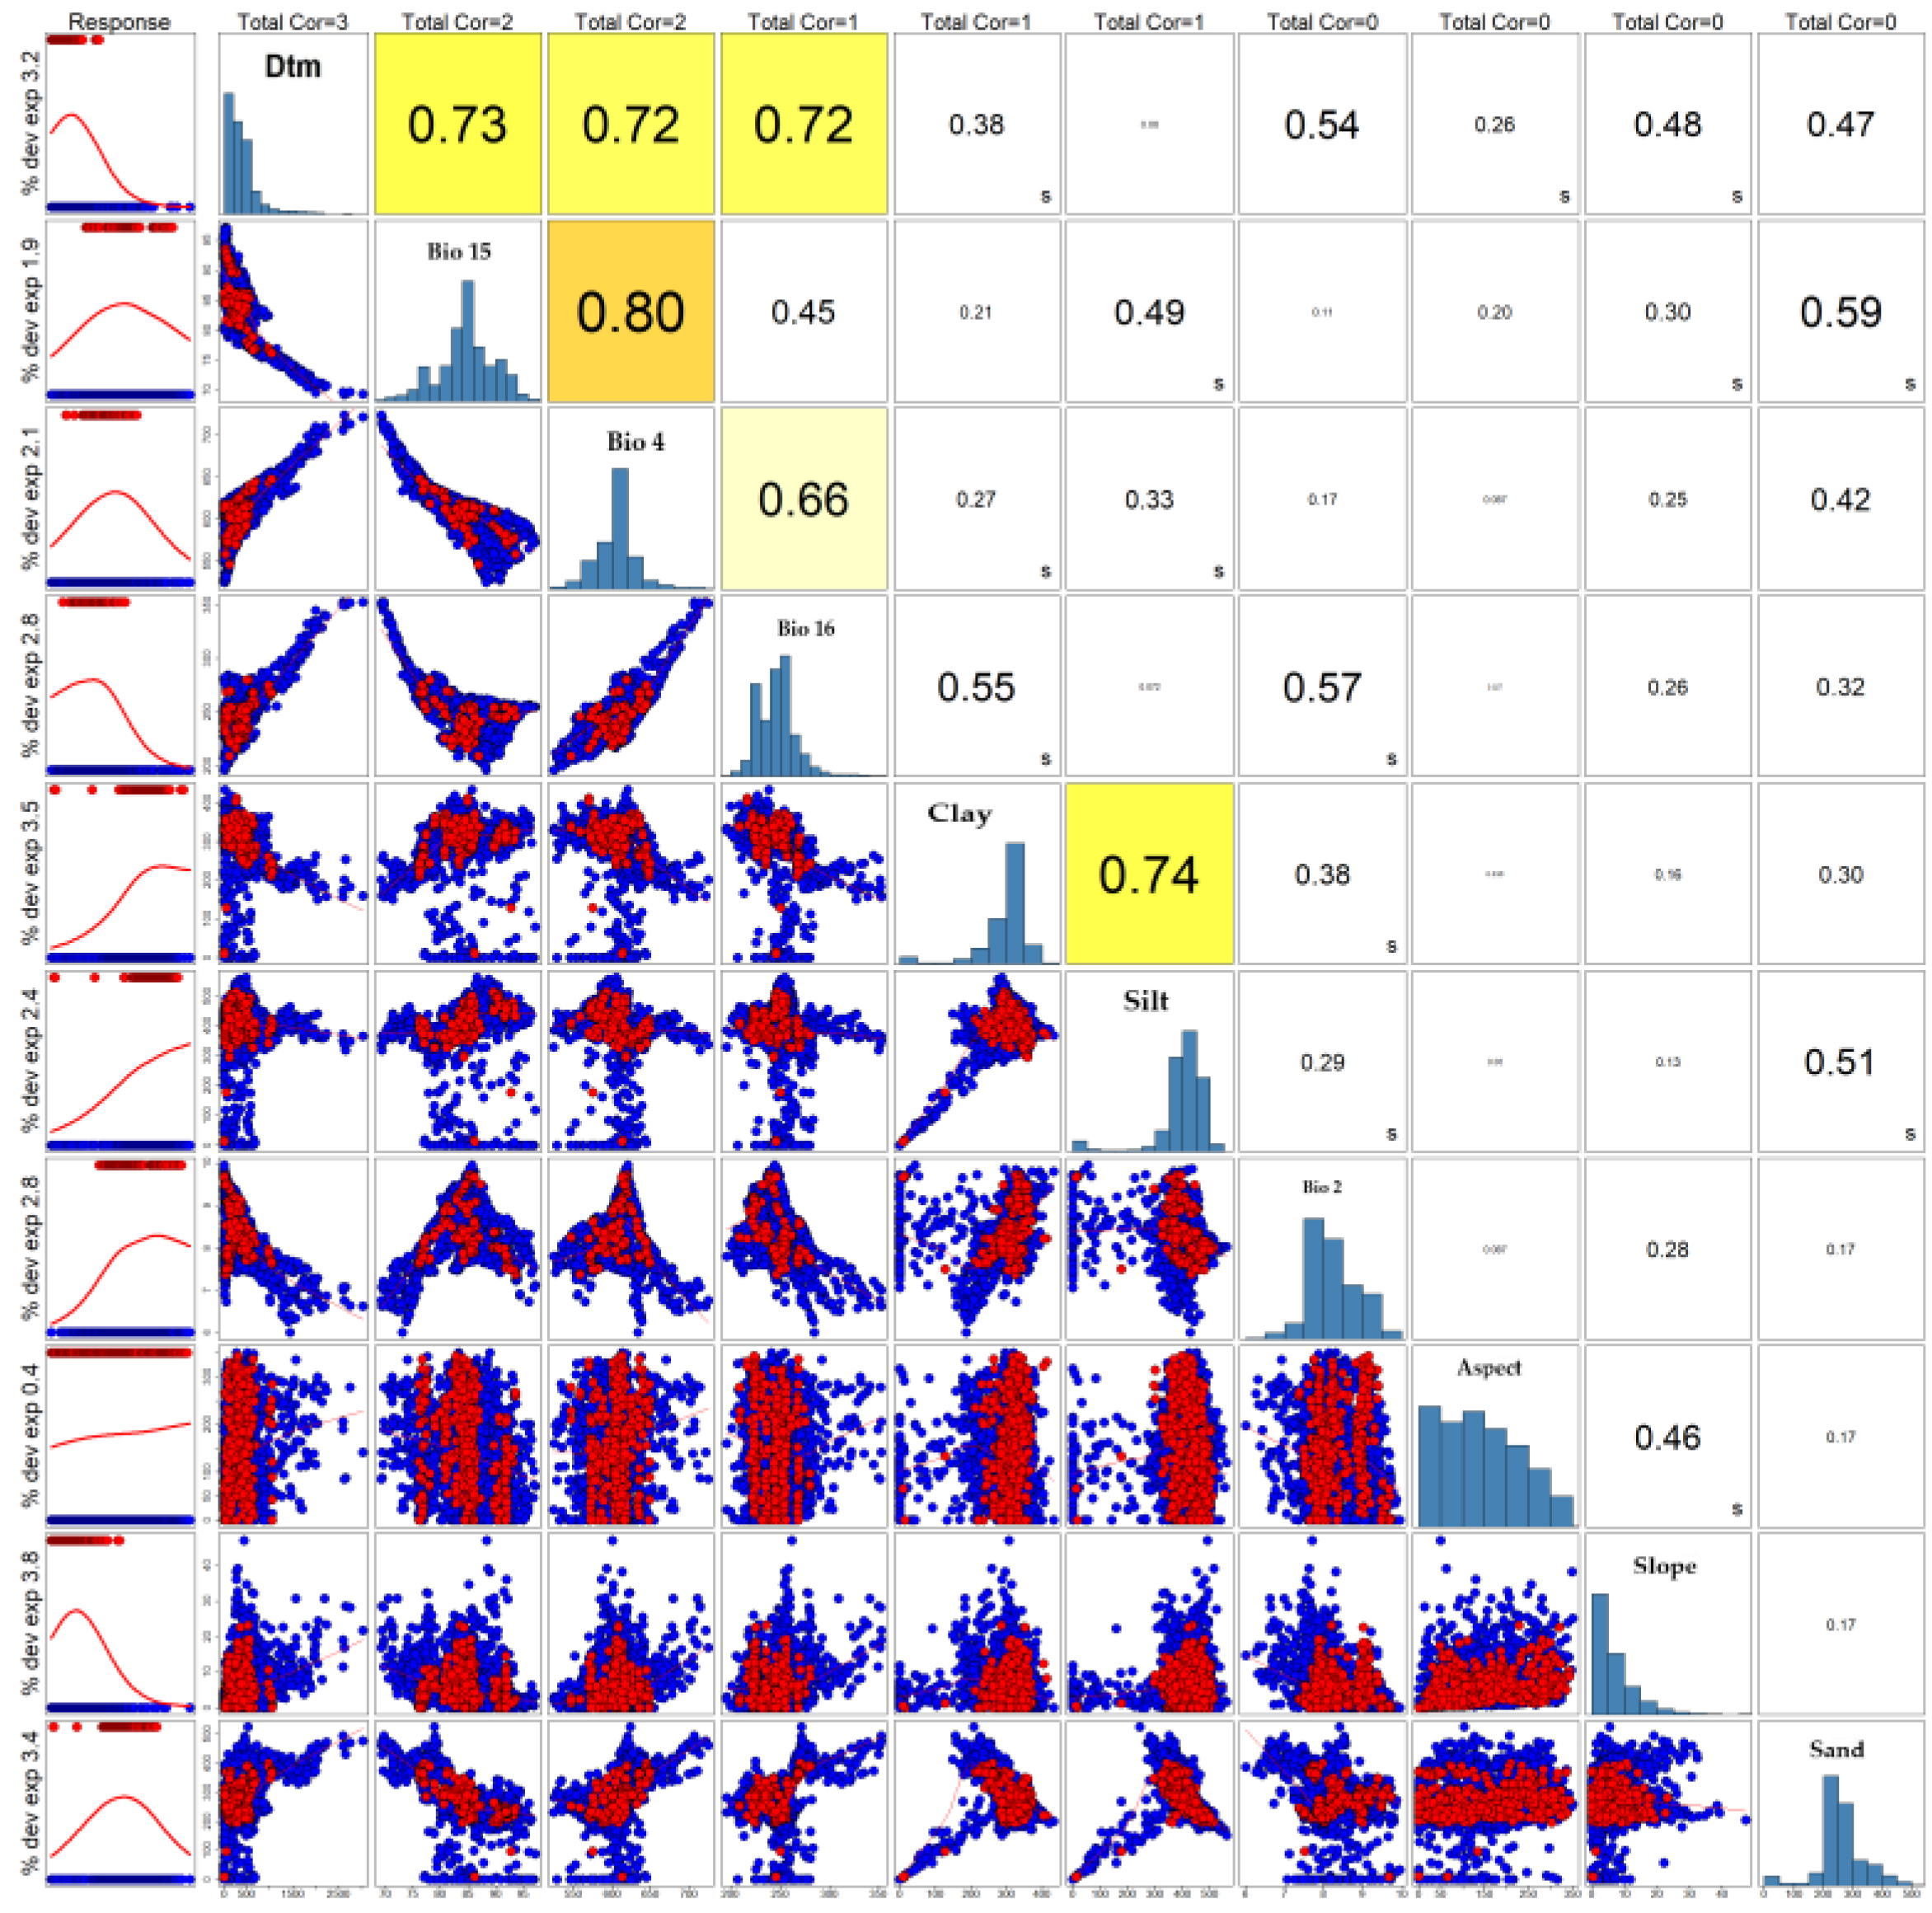
Figure 4.
Probability maps of B.Oleae: a) Actual suitability by MaxEnt model; b) Actual suitability by RF model.
Figure 4.
Probability maps of B.Oleae: a) Actual suitability by MaxEnt model; b) Actual suitability by RF model.
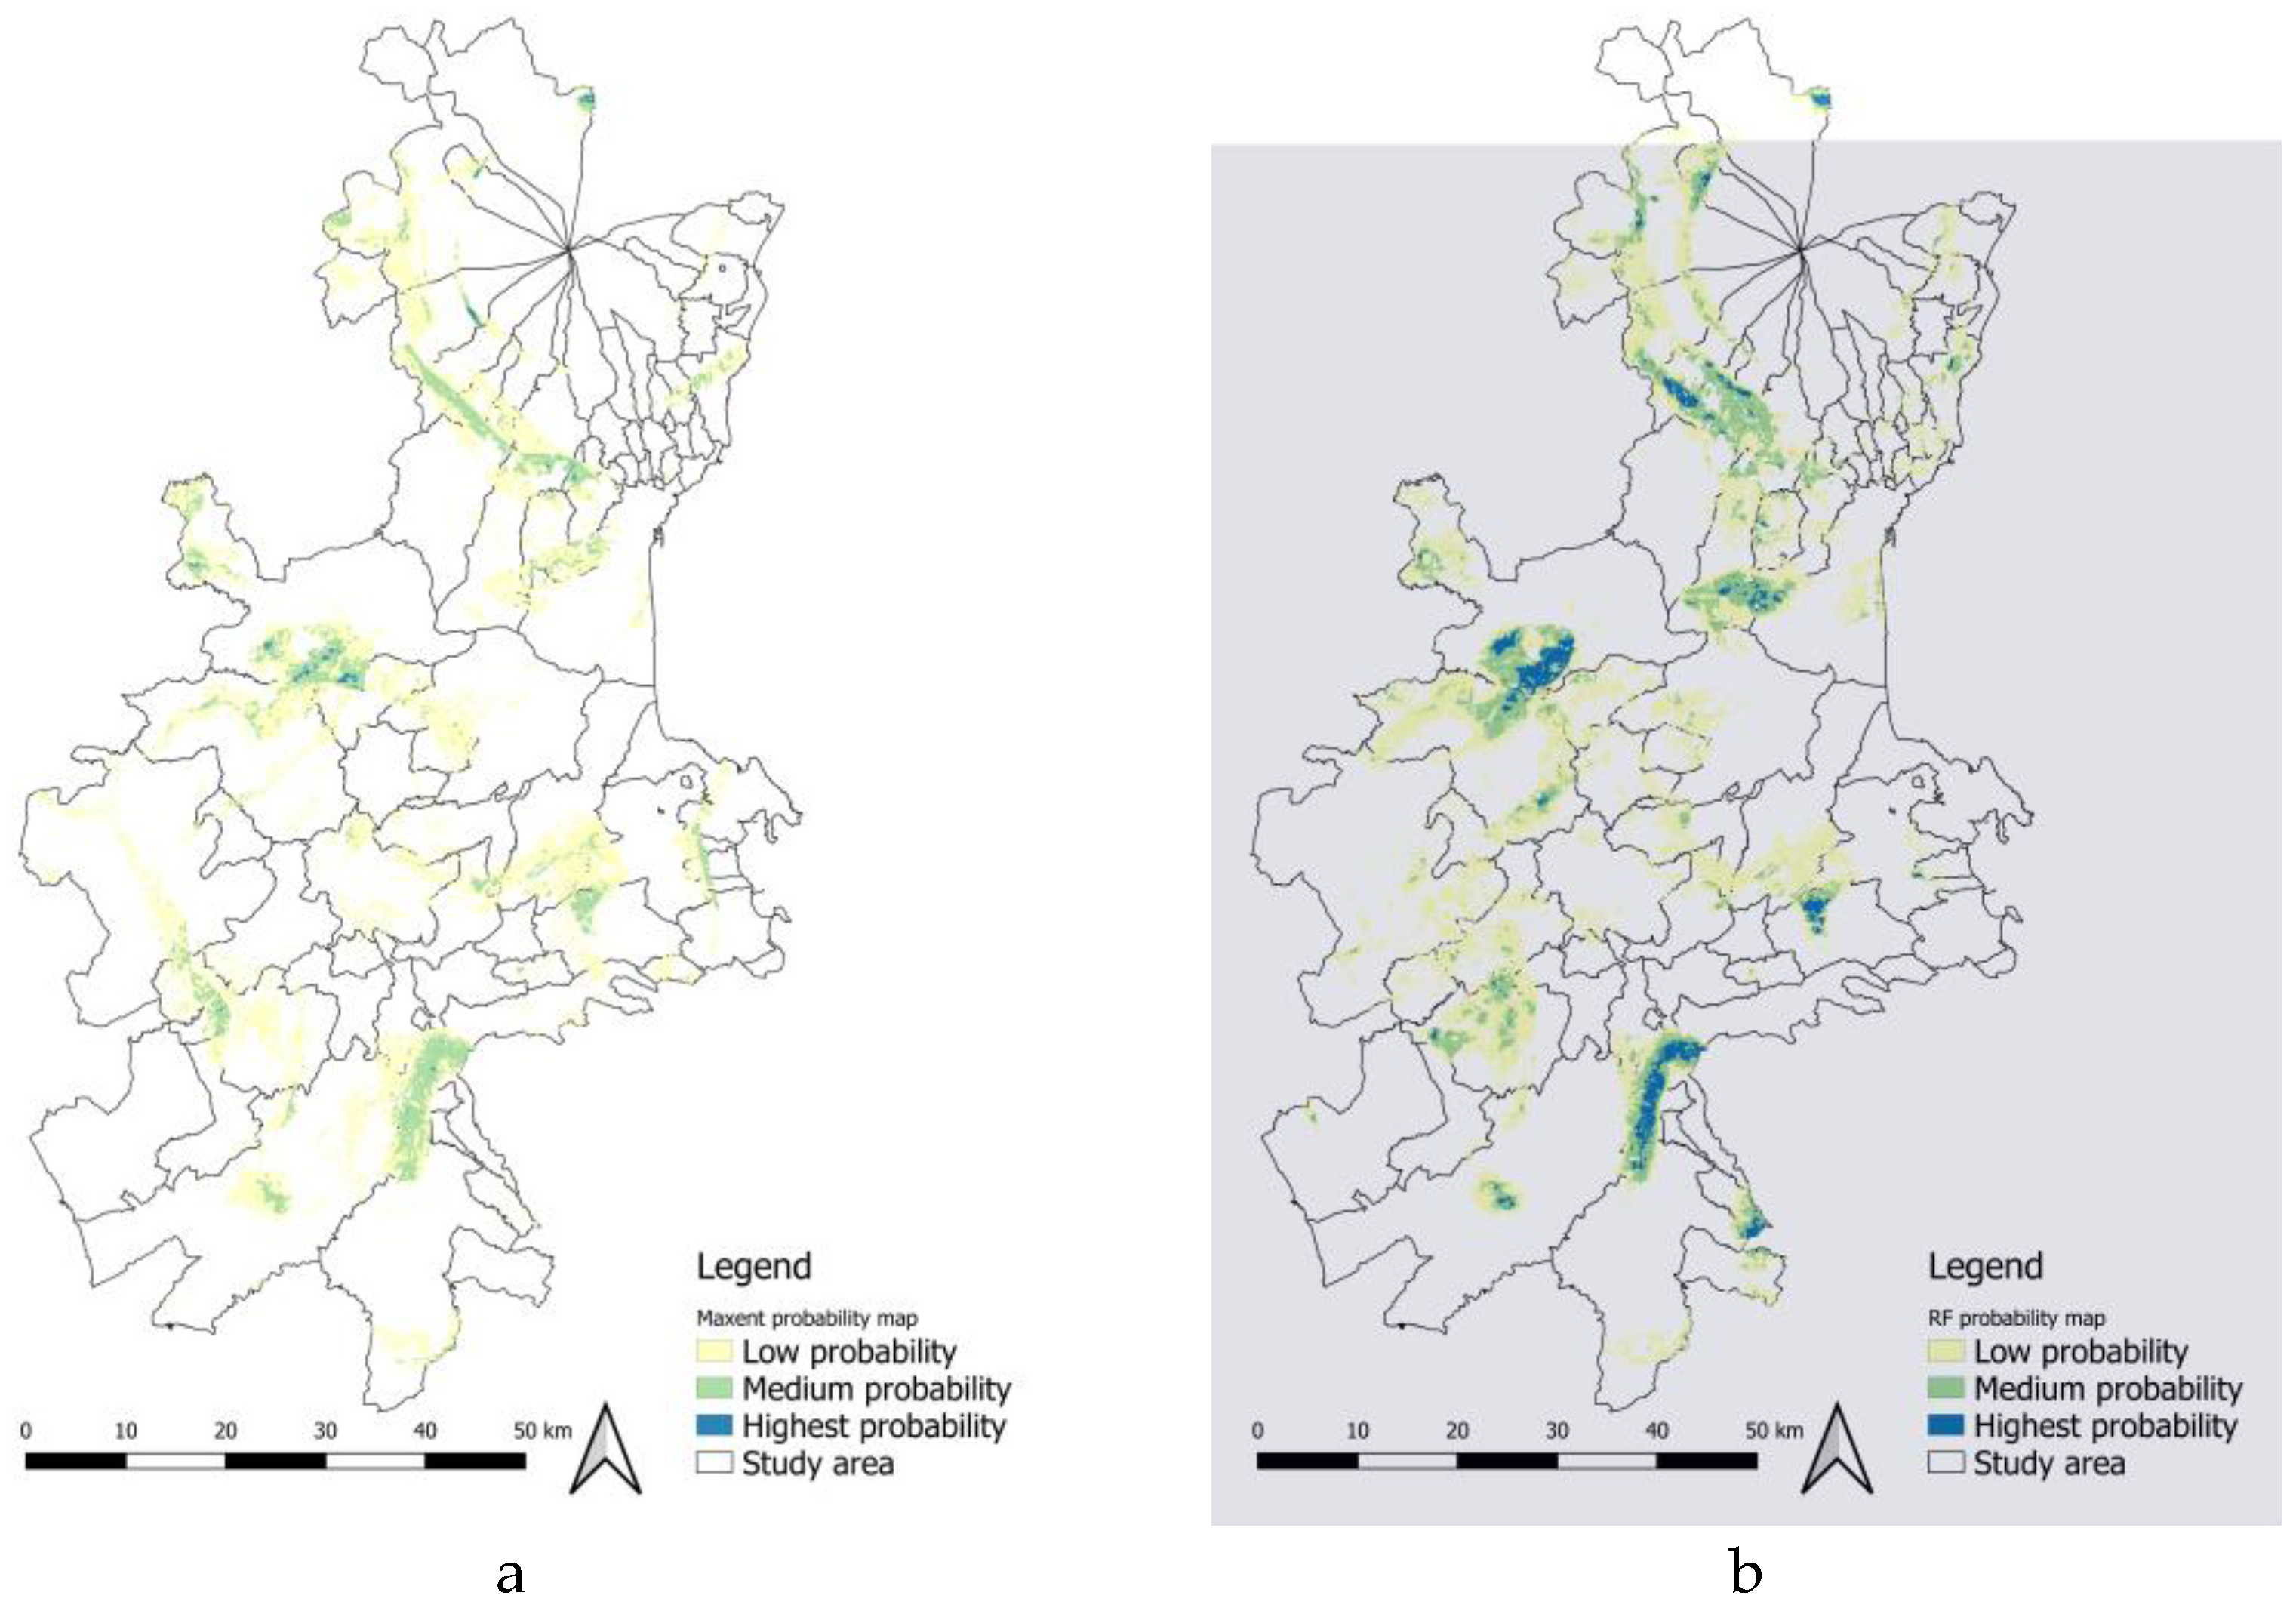
Figure 5.
Overlay between Olive trees Presence Points and the future scenario of B.Oleae presence for RF model.
Figure 5.
Overlay between Olive trees Presence Points and the future scenario of B.Oleae presence for RF model.
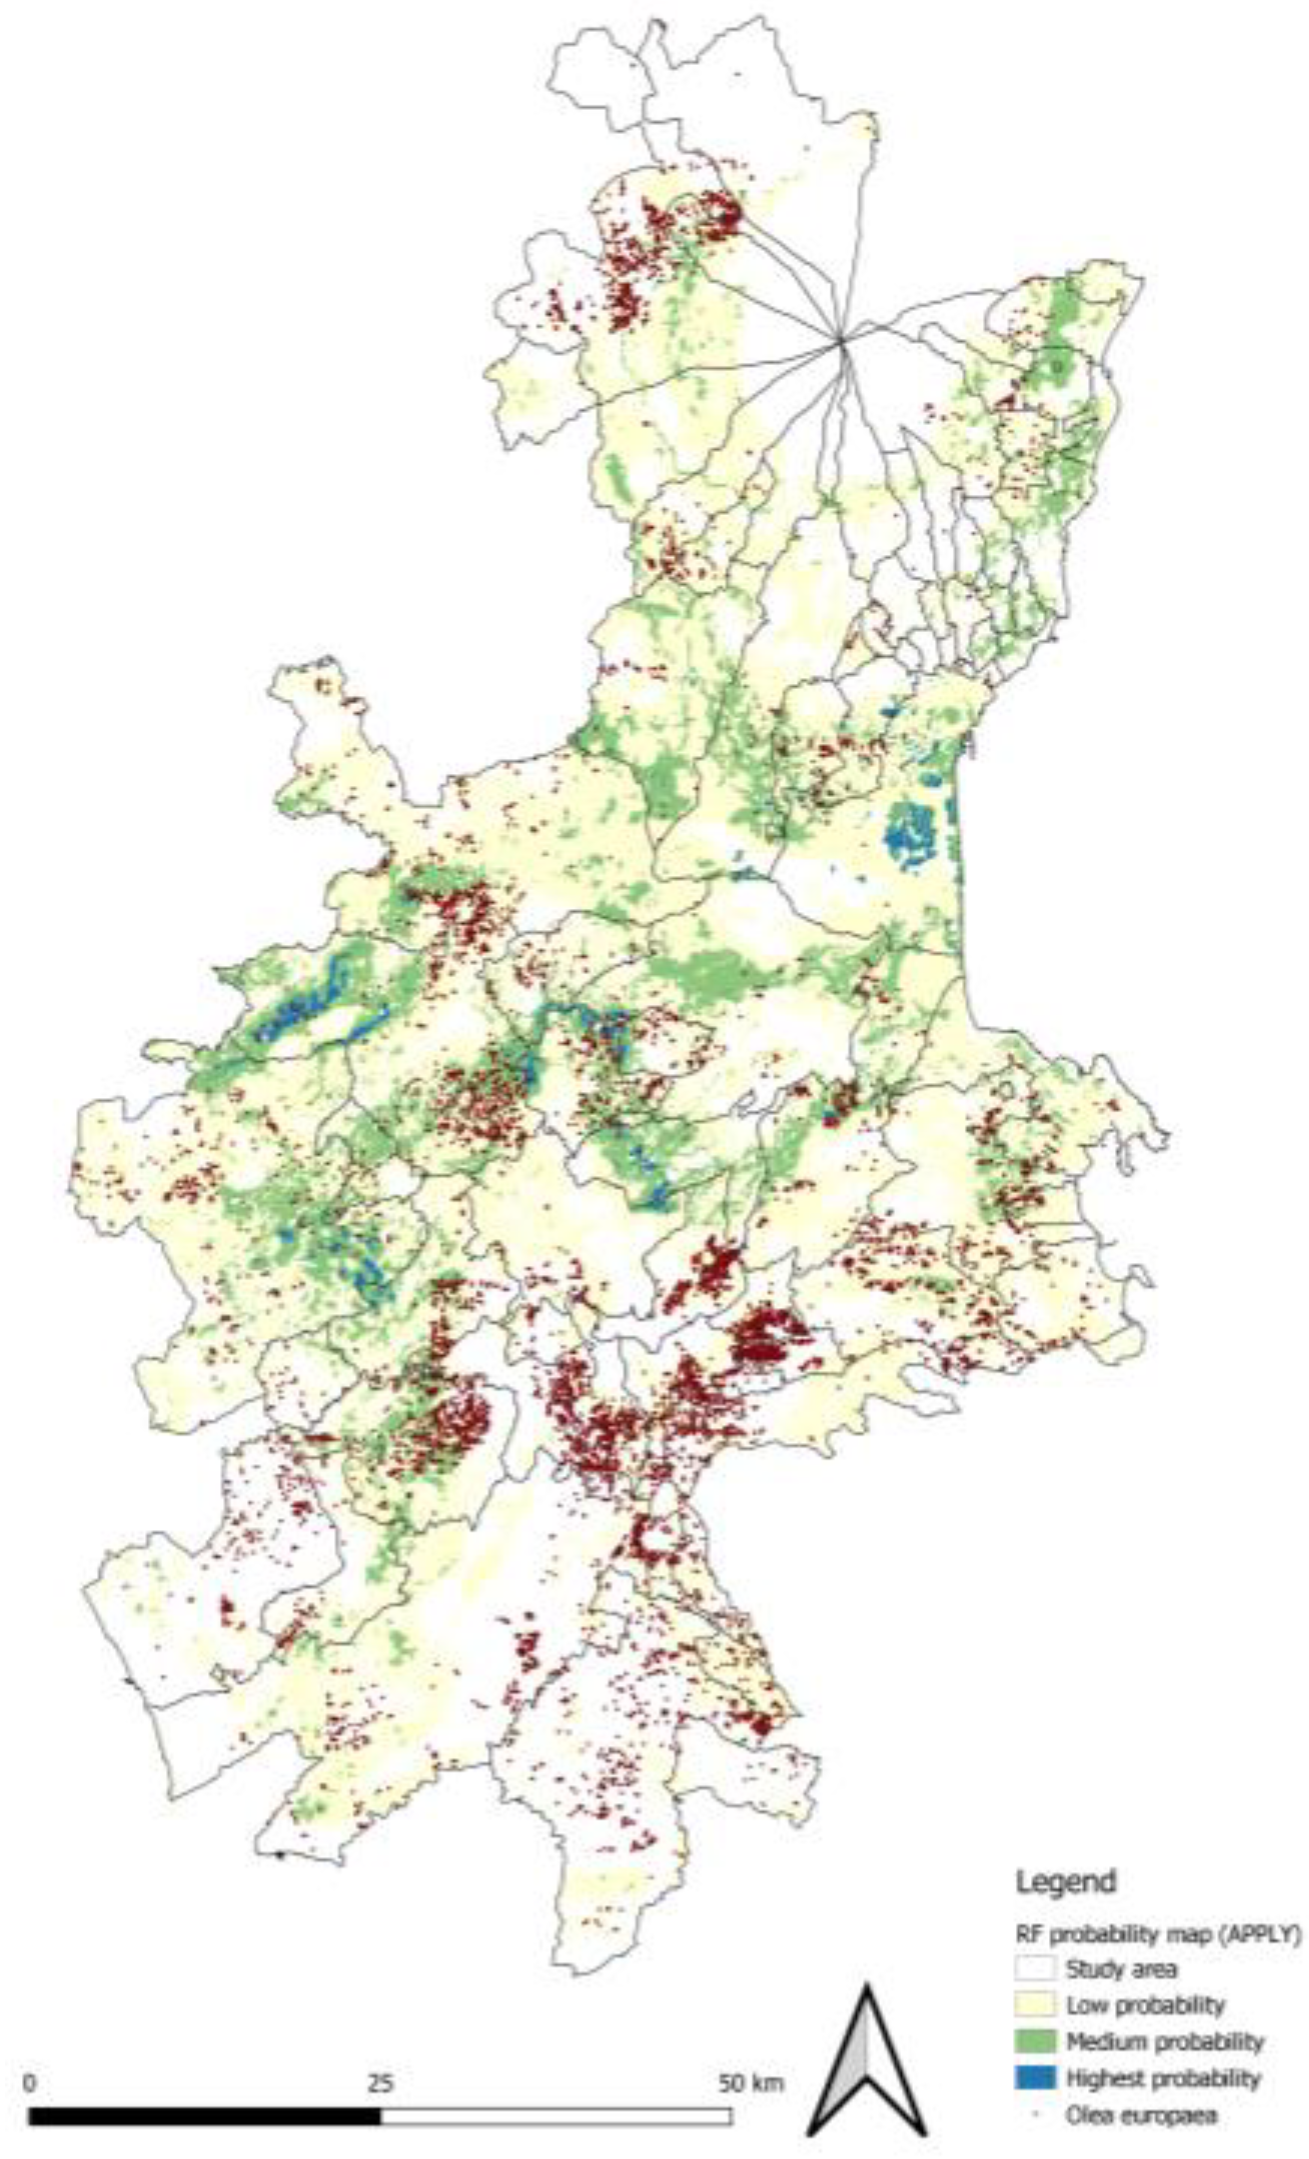
Figure 6.
– Response Curves of the predictors for the RF model.
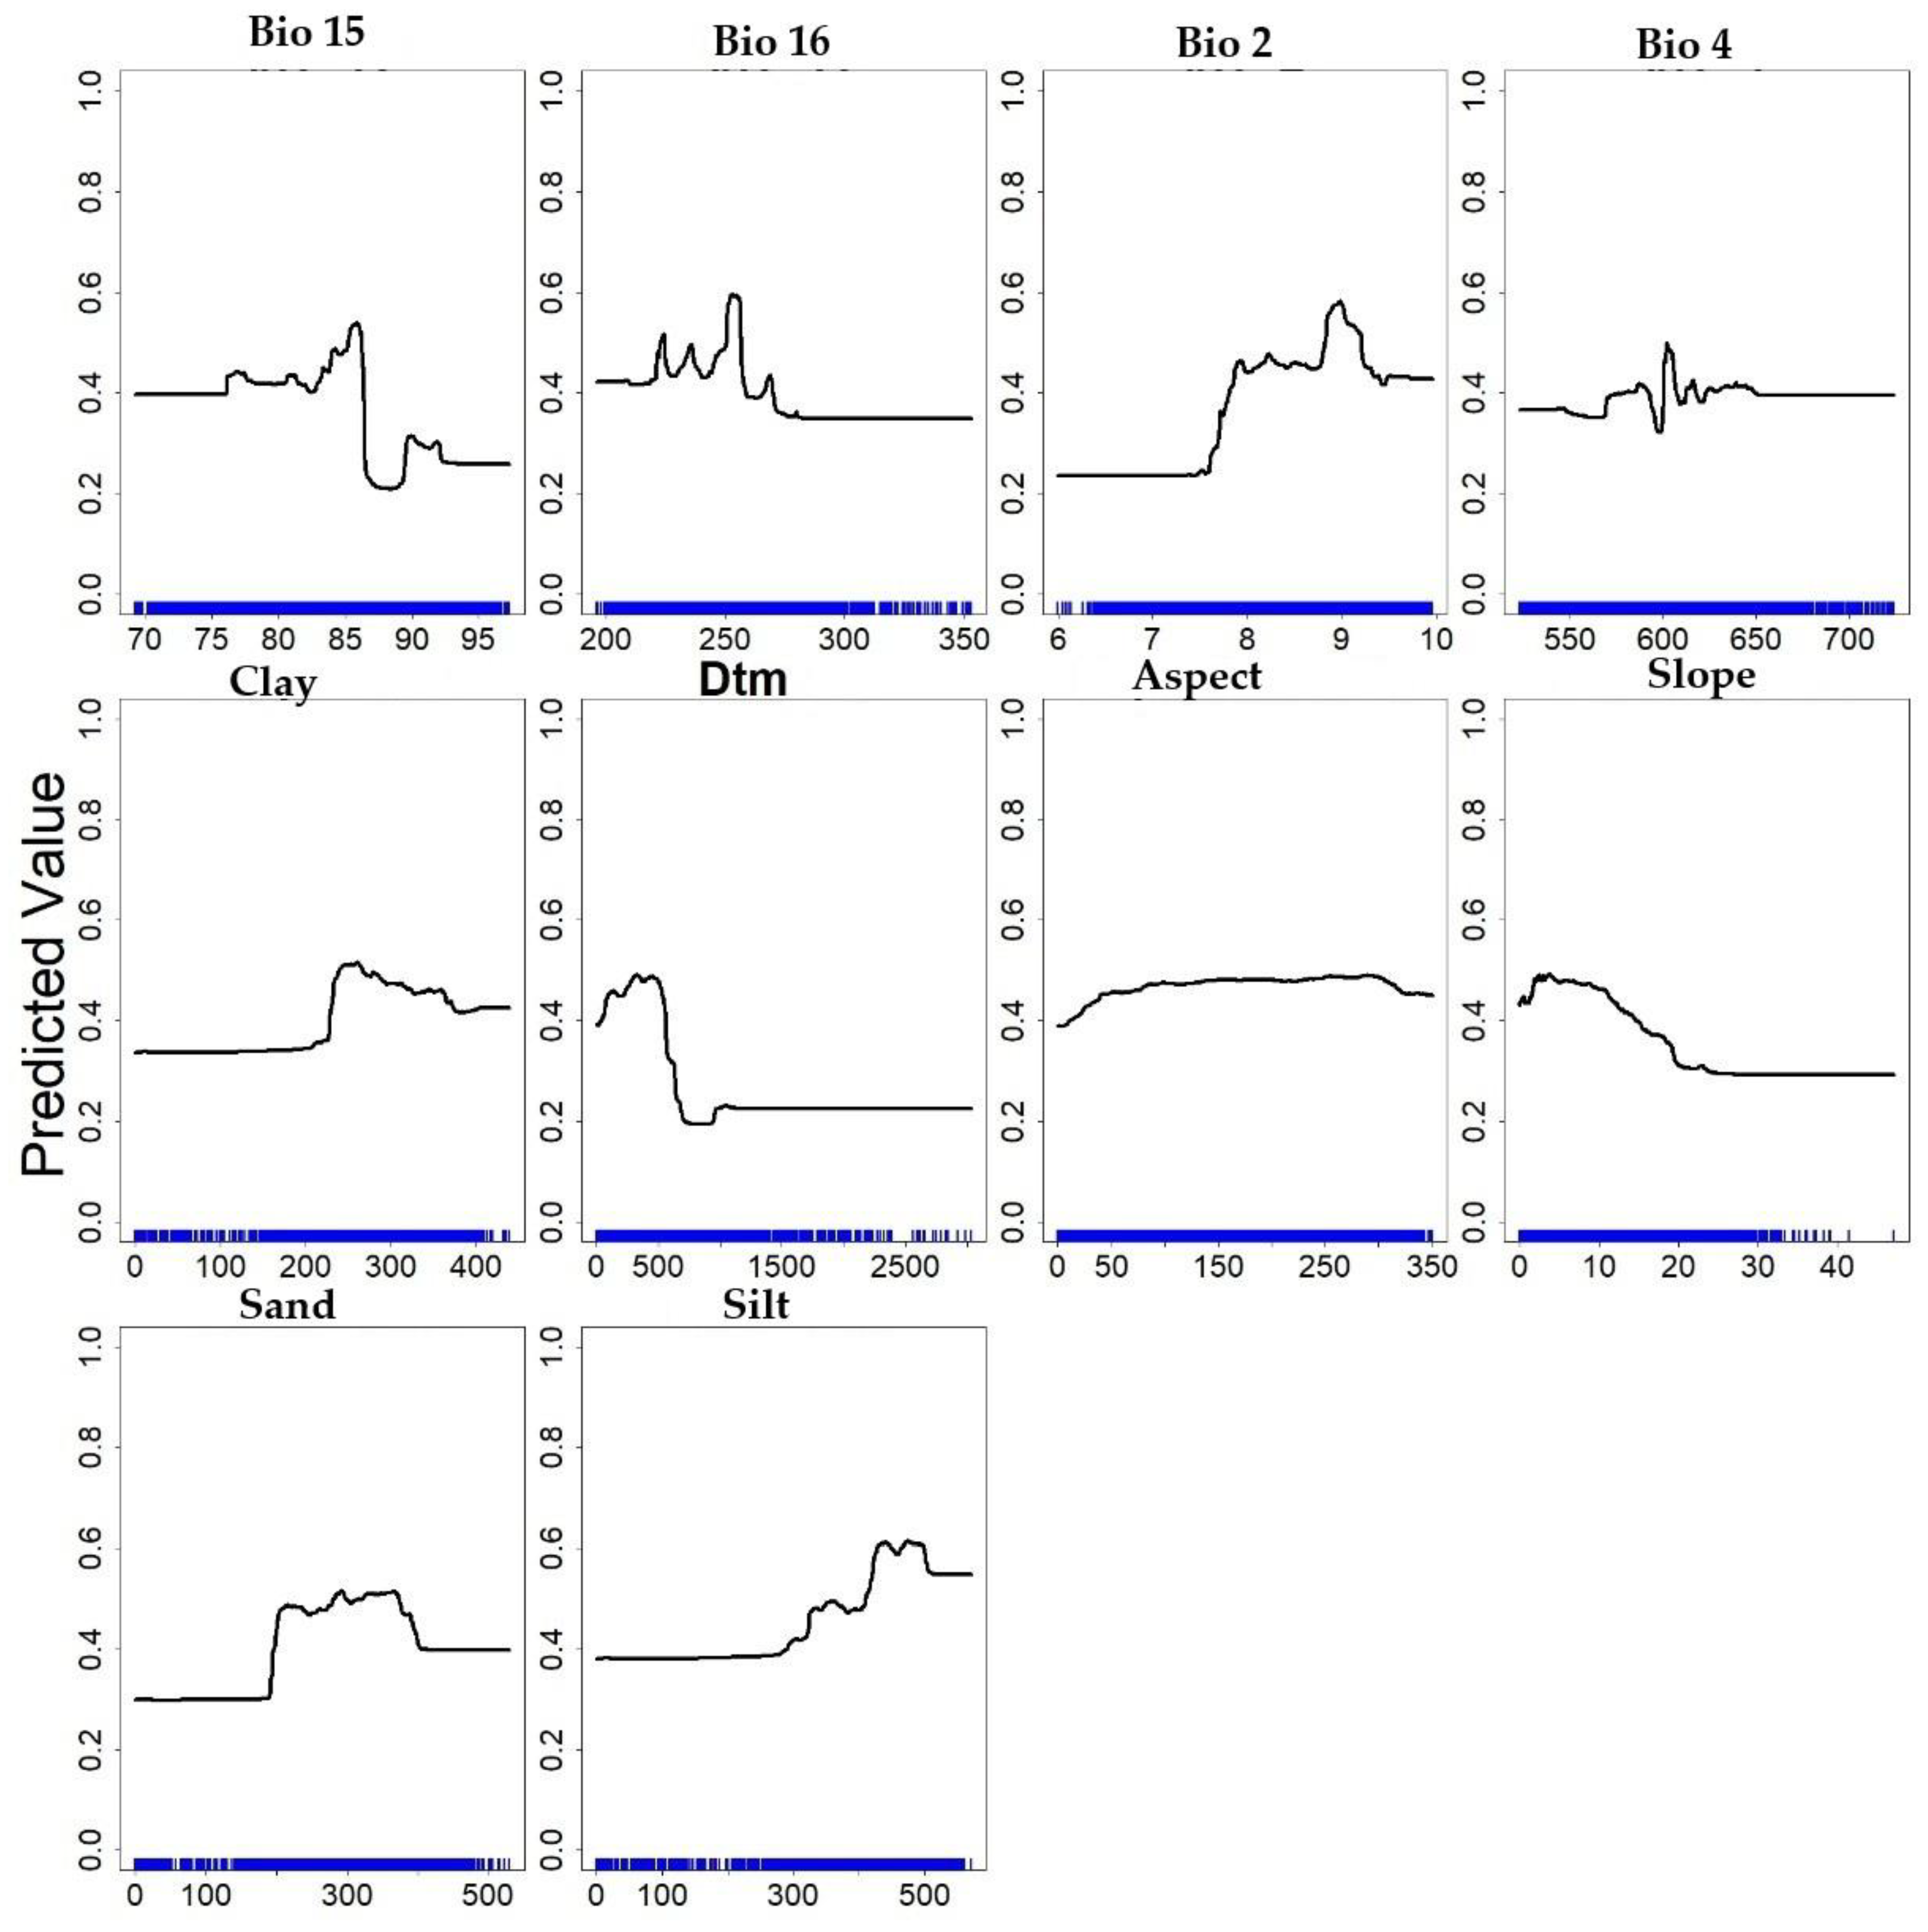
Figure 7.
Climatic predictors ranges in the study area: a) Biovariable 2; b) Biovariable 4; c) Biovariable 15; and d) Biovariable 16.
Figure 7.
Climatic predictors ranges in the study area: a) Biovariable 2; b) Biovariable 4; c) Biovariable 15; and d) Biovariable 16.
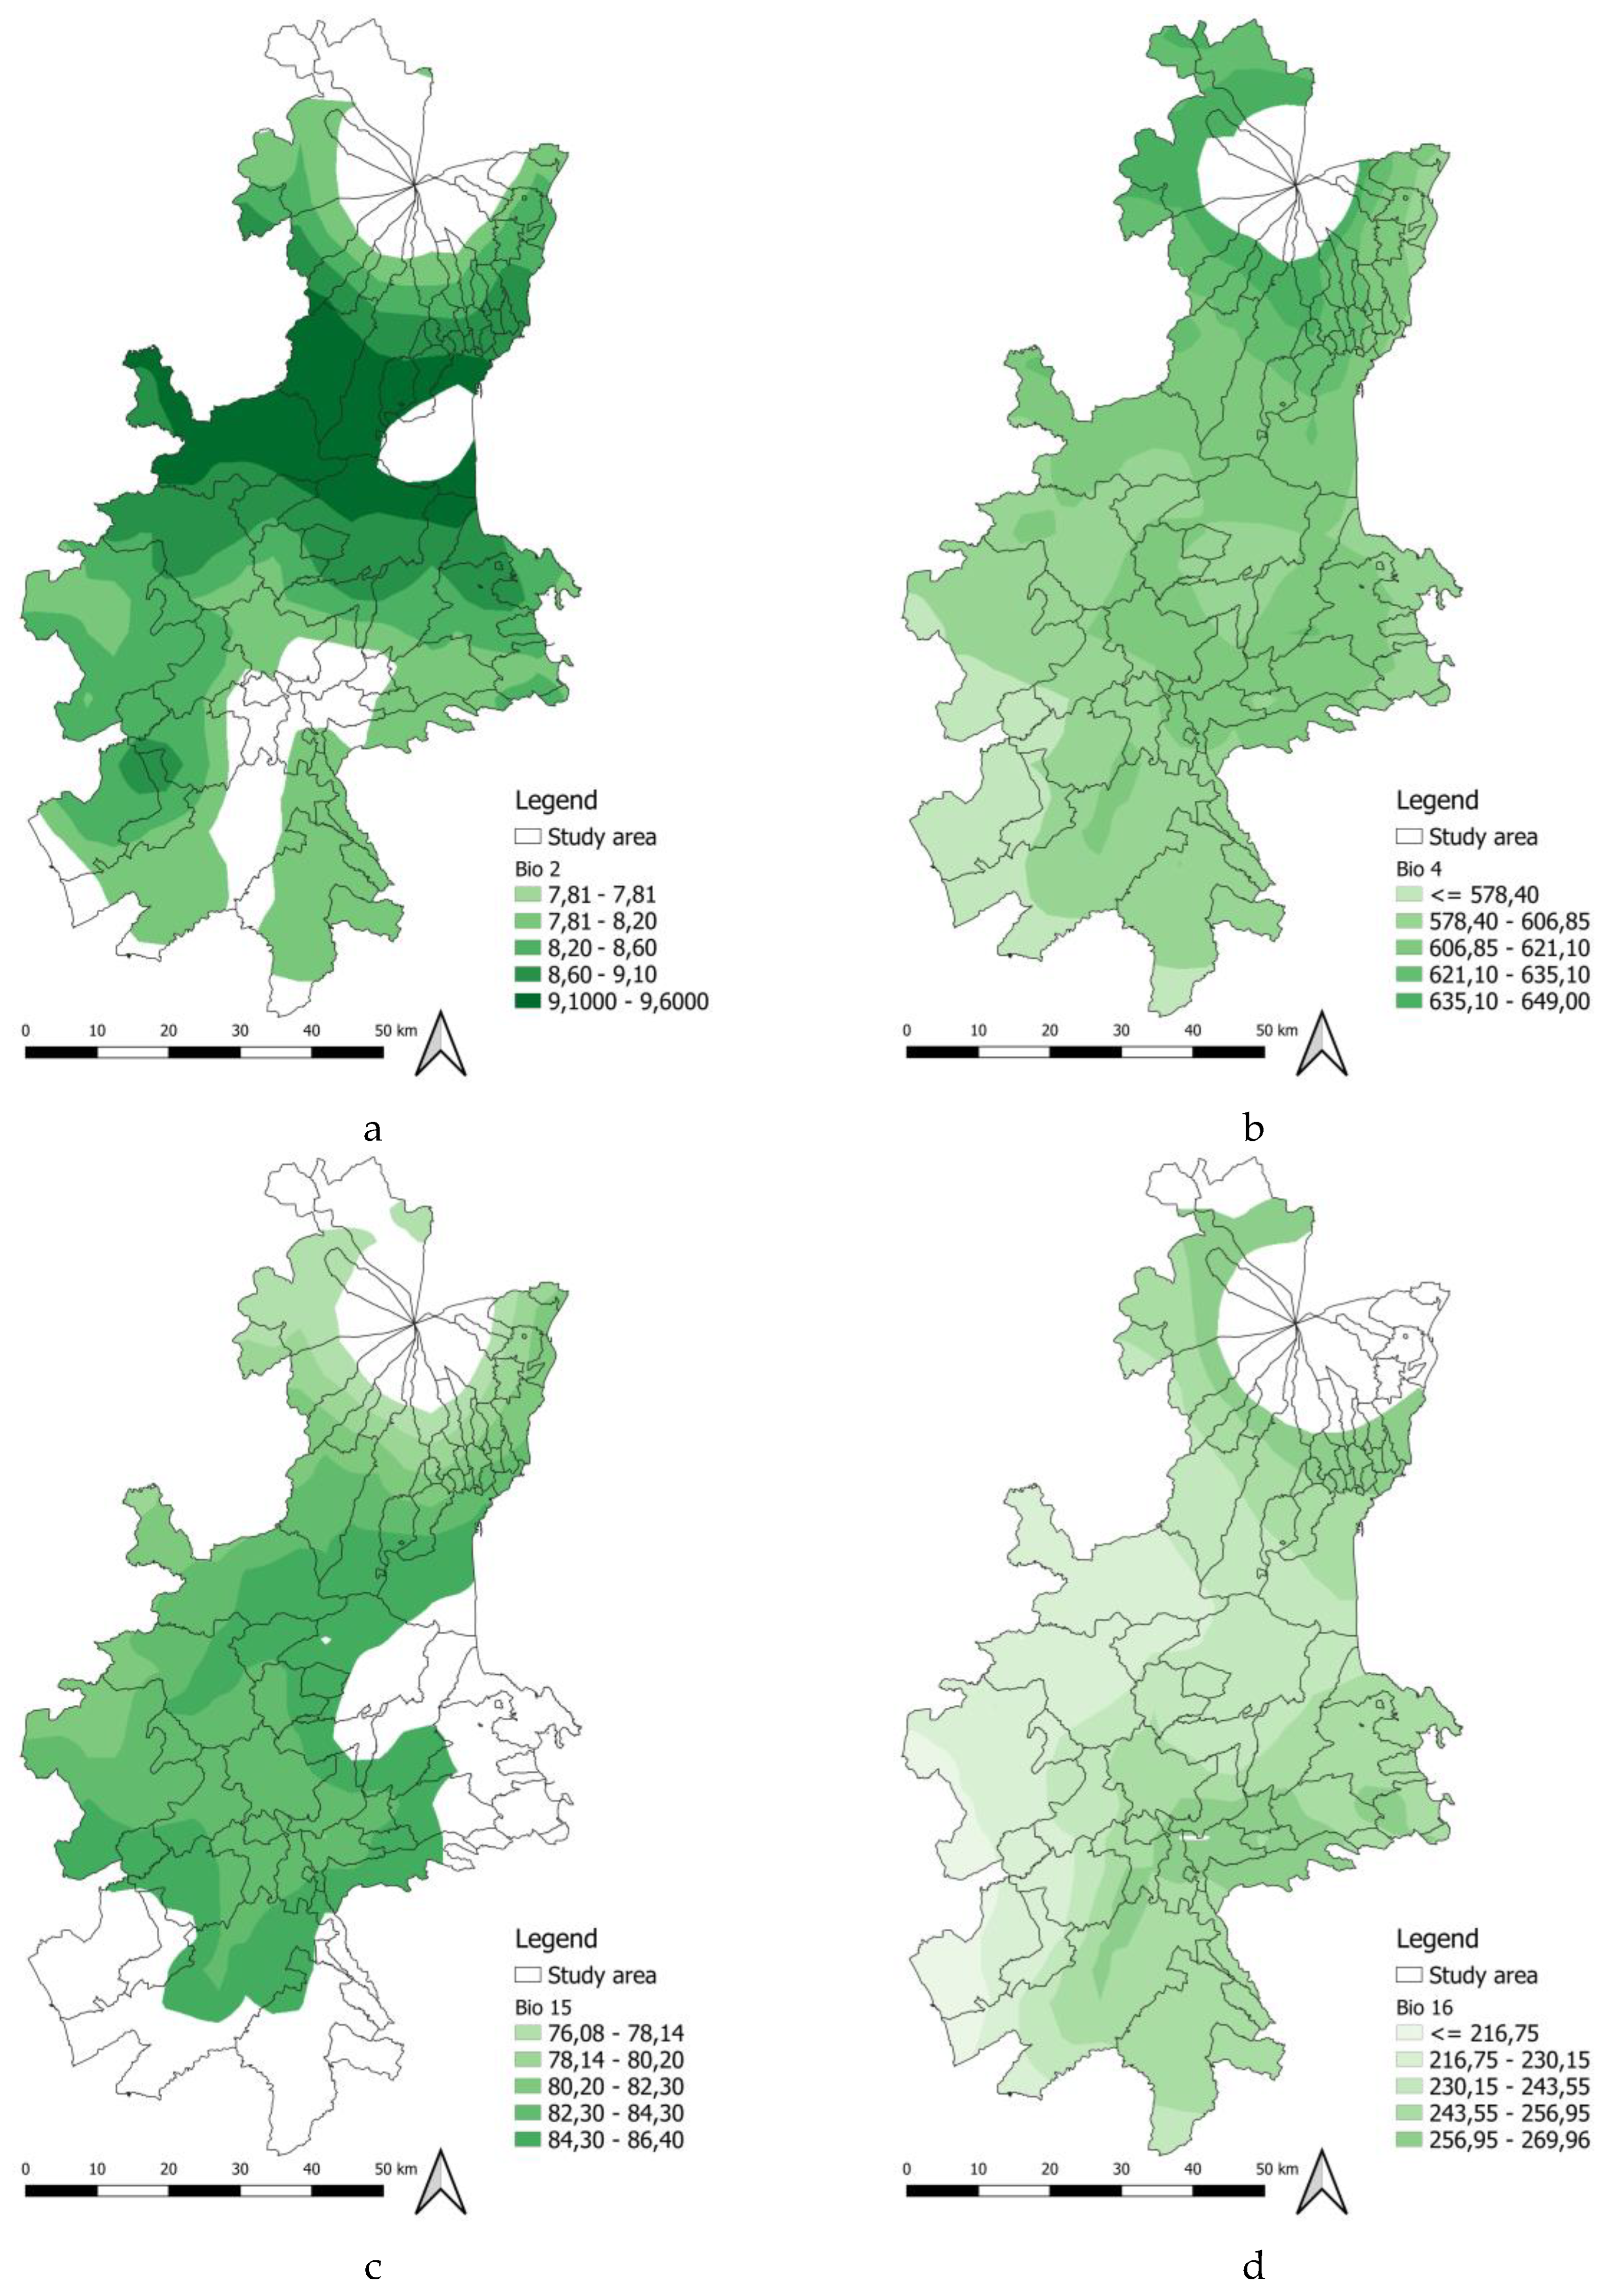
Figure 8.
Components of soil texture ranges in the study area: a) Clay; b) Sand; c) Silt;.
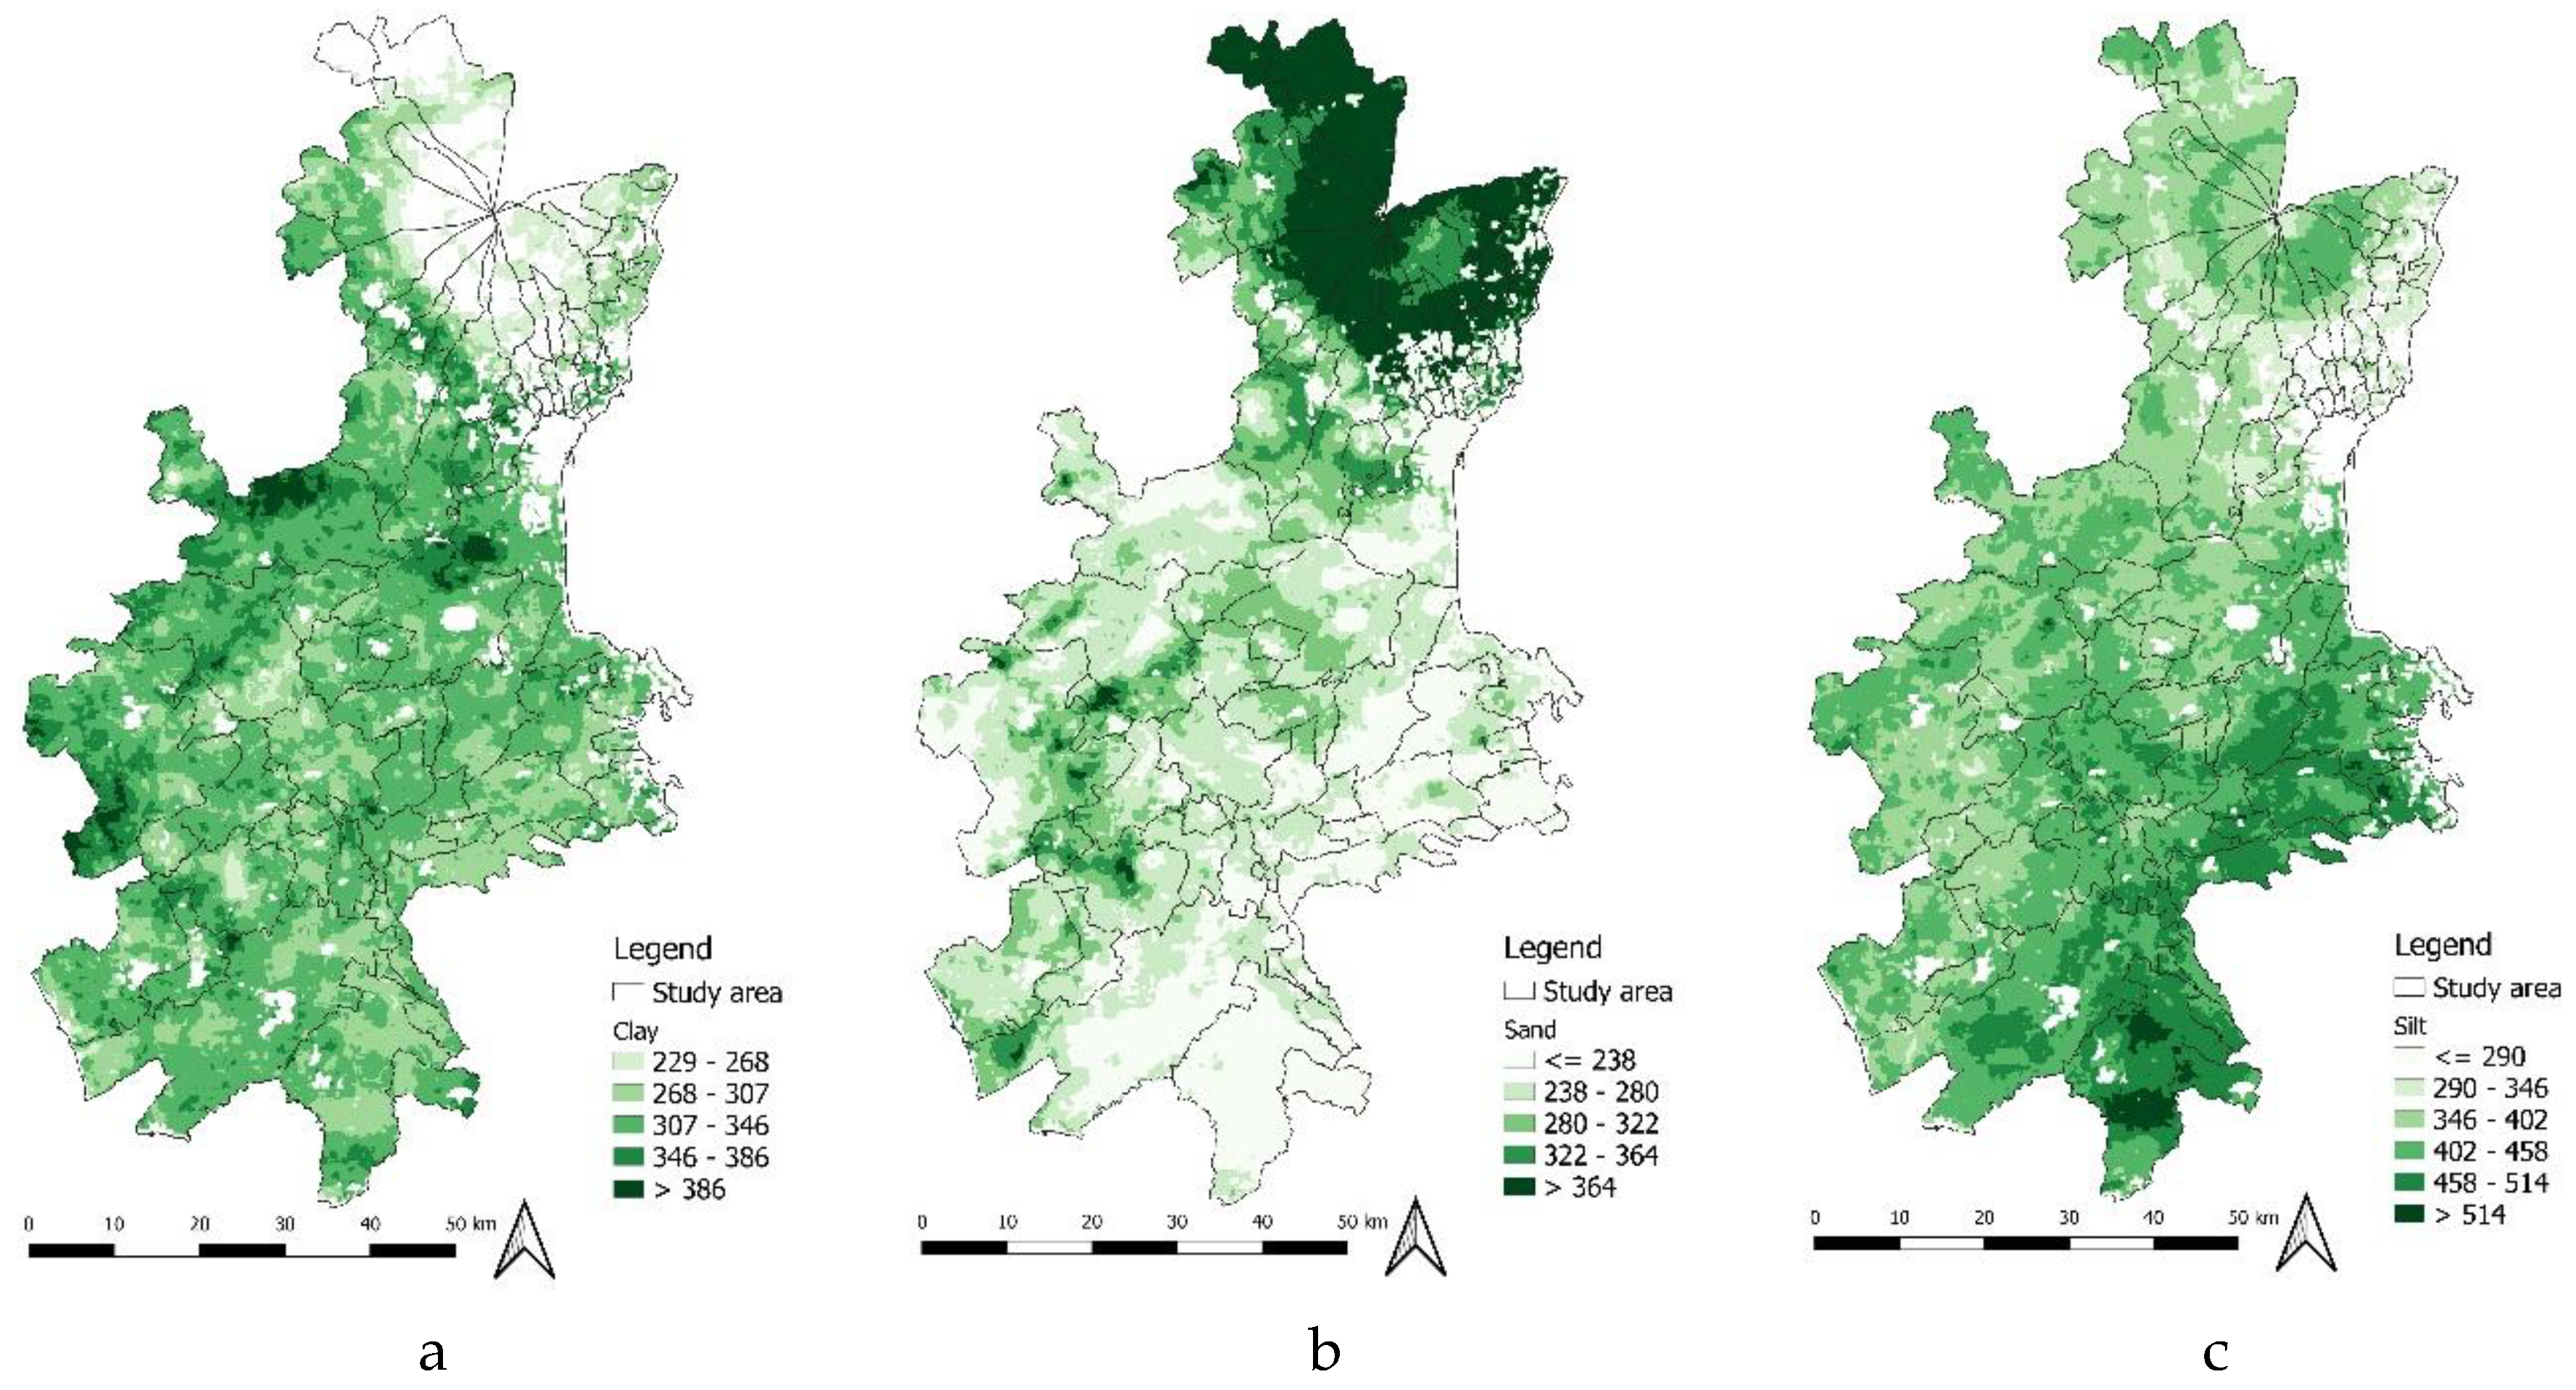
Figure 9.
Topographic predictors ranges in the study area: a) DTM; b) Slope; c) Aspect.


Table 1.
- Values of the training and CrossValidation metrics for RF and MaxEnt.
| MaxEnt | Random Forest | |||||
|---|---|---|---|---|---|---|
| AUC | TSS | AUC | TSS | |||
| Training | 0.939 | 0.721 | 0.970 | 0.822 | ||
| CrossValidation | 0.892 | 0.612 | 0.967 | 0.681 | ||
| ΔAUC | 0.047 | 0.004 | ||||
Disclaimer/Publisher’s Note: The statements, opinions and data contained in all publications are solely those of the individual author(s) and contributor(s) and not of MDPI and/or the editor(s). MDPI and/or the editor(s) disclaim responsibility for any injury to people or property resulting from any ideas, methods, instructions or products referred to in the content. |
© 2025 by the authors. Licensee MDPI, Basel, Switzerland. This article is an open access article distributed under the terms and conditions of the Creative Commons Attribution (CC BY) license (http://creativecommons.org/licenses/by/4.0/).
Copyright: This open access article is published under a Creative Commons CC BY 4.0 license, which permit the free download, distribution, and reuse, provided that the author and preprint are cited in any reuse.


