Submitted:
12 December 2025
Posted:
15 December 2025
You are already at the latest version
Abstract
Boiling crises are a complex stochastic process that is influenced by the physical phenomena of heat transfer and evaporation, as well as the shape and roughness of the boiling surface. When calculating the critical heat fluxes corresponding to the point of the first boiling crisis, it is important to know the numerical density of the formed bubbles per unit surface and volume. Most models consider only non-interacting bubbles. This greatly reduces their predictive accuracy. An analysis of the video footage of bubble boiling near the point of the first boiling crisis allows us to conclude that this is a typical picture for a continuum off-lattice problem of percolation theory. The main idea of the work is to consider the point of the first boiling crisis as the percolation threshold for a three-dimensional problem. This threshold describes the transition from finite size inclusions (single bubbles and small groups of weakly interacting bubbles) to a percolation structure in which there is a macroscopic irregular bubble, the size of which is comparable to the size of the entire system. This hypothesis allows us to make estimates for the concentration of bubbles at the boiling point and to obtain estimates for critical heat fluxes at this point. The fundamental difference between the proposed approach and previous attempts to apply percolation theory to the description of boiling crisis is the consideration of a three-dimensional problem in liquid volume, rather than a two-dimensional problem onto a hot boiling surface. It is shown for the first time that the proportionality constant in Kutateladze-Zuber equation coincides with the percolation threshold for a three-dimensional continuum percolation problem on overlapping ellipsoids.
Keywords:
percolation theory
; boiling crisis
; percolation threshold
; stochastic process
1. Introduction
Boiling crises are among the most well-known hydrodynamic stochastic instabilities. In addition to the phenomenon's rich physical effects, it is critically important for a wide range of technologies. The most significant are power engineering, metallurgy, and the cooling of high-power electronics. For example, in power engineering, it is necessary to solve the problem of removing large amounts of heat from hot surfaces. In metallurgy, boiling critically affects the cooling rate during quenching of steel products in liquid media. Boiling is likely of primary importance for cooling high-power electronics, where the heat flux density of the removed fluids has already exceeded 100 W/cm2. It is worth noting that a comparable heat flux density is realized in a gas burner flame. The main advantage of boiling from the perspective of thermal physics and power engineering is the high density of the removed heat fluxes, achieved due to the high heat of phase transition. Despite the rich history of boiling research, a number of questions regarding the description of this phenomenon, particularly its crises, remain open. To date, this problem has not been solved analytically, and the relationships for critical heat fluxes are still empirical or semi-empirical. The most important parameter in the problem of crisis boiling is the prediction of its point and the magnitude of the critical heat flux. The pioneering formulation for the critical heat flux was proposed in the late 1940s independently in the works of Kutateladze [1] and Zuber [2]. Currently, five different mechanisms for the onset of crisis boiling are discussed in the scientific literature: bubble interference, hydrodynamic instability, macrolayer drying, hot/dry spot, and interface separation. In addition, many modifications of these mechanisms have been proposed to improve the accuracy of prediction by taking into account the influence of surface size and roughness, pressure, wetting angle, etc. Among the five mechanisms, Zuber's theory of hydrodynamic instability has attracted the most attention due to its mechanistic formulation and theoretical appeal. Recently, the interphase separation mechanism, which is also theoretically substantiated, has received significant experimental support and offers the advantage of being able to account for various surface orientations [3]. Overall, despite the large volume of published literature on bulk boiling, there are serious gaps in the data covering the relevant parameters.
The subject of this study is the first boiling crisis and its stochastic nature [4]. It is known that the boiling process can be influenced by a large number of factors, ranging from the properties of the liquid itself to the morphology of the hot surface. An important factor is the orientation of the hot surface immersed in the liquid relative to the gravity field. For the sake of clarity, we will assume here and below that liquid boiling on a flat horizontal surface under free convection, i.e., in a large volume, is being considered. Recently, a number of studies have appeared that consider the first boiling crisis as a critical phenomenon from the standpoint of phase transition theory. We are dealing with the formation and growth of vapor bubbles on a superheated surface. A number of researchers have come to the understanding that in this case, we are dealing with a percolation problem in a binary system. A binary feature is the presence of liquid or vapor (a vapor bubble) in a certain region of space. This attribute is stochastically distributed over space. For a system of this type, with a continuous change in the concentration of one of the components, there is a point at which macroscopic connectivity is formed for this component. This is a percolation transition or geometric phase transition. In this case, we are talking about continuum percolation or off-lattice percolation problems. It is important to note that at the critical transition point in these problems there is no spatial scale due to the divergence of fluctuations. This behavior for boiling has been noted by a number of researchers [5]. It is assumed that the first boiling crisis point corresponds to the 2D percolation threshold. We believe the picture is somewhat more complex, and that as the boiling crisis develops, we sequentially or simultaneously observe two percolation transitions—a 2D transition on the hot surface and a stochastic 3D transition within the bulk of the boiling liquid. This paper aims to clarify this picture.
2. Materials and Methods
2.1. Preliminary Estimates
The key object of our study is a vapor bubble, both immediately before its separation from the hot surface and during its ascent. The bubble's ascent velocity depends, among other things, on its size and can be variable. Some researchers believe that the growth of bubbles during their merging slows their ascent and is a mechanism that reduces heat flux [6]. Since this explanation is simpler than the occurrence of a percolation transition, we will qualitatively evaluate its contribution to the change in heat flux. Note that the heat flux from the surface is proportional to the volume of the rising bubbles and their ascent velocity. To initiate boiling on the substrate from which heat is removed, a liquid superheat of several degrees must be created. Superheat is defined as the difference between the liquid temperature and the saturation temperature Ts. The superheat field must form in a thin liquid layer, approximately several hundred microns thick, above the substrate surface. Within the cavities and irregularities of the substrate, unstable vapor nanobubbles with a characteristic size of approximately one nanometer spontaneously emerge. Due to stochastic Brownian coagulation, the bubbles coalesce, eventually forming a bubble of critical size [6]. This bubble is held to the substrate by surface tension forces around the perimeter of the bubble's "neck." Within the superheated liquid layer, the bubbles grow to hundreds of microns in size and break away under the action of Archimedes' force.
For boiling on a substrate, studies have found two ranges of bubble sizes, differing by two orders of magnitude [6]. The first range is called critical. With superheating of a few degrees, the characteristic size of a critical liquid vapor bubble in a conical cavity on a substrate is approximately 1 μm. Critical bubbles can grow indefinitely. The second range of bubble radii is called separation. The radius of separation bubbles is several hundred microns. These bubbles detach from the substrate due to the Archimedes force and carry the bulk of the energy during boiling.
At the point of the first boiling crisis, the heat flux removed reaches a maximum and begins to decrease. Most of the heat is removed from the hot surface in steam bubbles. As noted above, one of the simplest explanations for the boiling crisis and the resulting slowdown in heat removal is a decrease in the bubble ascent velocity. This change in velocity can be caused by bubble coagulation or a change in external pressure as the bubbles rise. Let's consider the effect of coagulation. For the laminar ascent of a spherical bubble of radius Rb, the steady-state velocity of a single bubble in a liquid, v, can be calculated using the expression
where µ is the viscosity of the liquid, , are the liquid and vapor densities, respectively, and g is the acceleration due to gravity. In fact, equation (1) is a lower bound estimation for the velocity of bubbles in a flow moving in one direction. It follows from this formula that in the laminar Stokes regime of bubble rising, the rate of energy transfer should only increase as the vapor bubbles coagulate. As the critical point is approached, the bubbles begin to interact with each other and significantly turbulize the flow. The dependence of the bubble ascent velocity on the bubble radius in the turbulent regime has a different character [7]. The nature and features of the motion of gas bubbles in this regime were analyzed in detail in the works of Malenkov [8] and Kutateladze [9]. This regime is characterized by two size ranges of rising bubbles, corresponding to Reynolds numbers Re ~ 10-100 and Re ~ 1000. The first regime can be considered a transitional form associated with changes in the bubble's shape and dependent on the surface tension σ of the liquid. The bubble's ascent velocity in this regime can be determined from dimensional theory considerations:
This regime is intermediate for the entire size range of air bubbles in water. It operates at Rb ≈ 3...5 mm and exhibits a decrease in velocity with increasing bubble size. Equation (2) is a special case of the expression for the bubble ascent velocity obtained by Malenkov for the entire range of Reynolds numbers (Re ~ 10...1000):
Here, the numerical coefficients α and β, according to Malenkov, are close to 1. The characteristic times for establishing a steady-state ascent velocity do not exceed 0.1 s for any regime. Generally, the dependence of the ascent velocity of gas bubbles in a liquid on their radius is nonmonotonic: it increases rapidly in the diameter range from hundreds of microns to approximately 2 mm, then decreases just as rapidly to a size of ~5 mm. It then remains approximately constant in the diameter range of 5-10 mm and increases slowly at larger sizes. Coagulation "drives" the bubble along this size range; in the intermediate size range, it slows the bubbles, possibly thereby further turbulizing the flow. This pattern partially confirms the hypothesis that, during the coagulation of intermediate-sized bubbles at a certain height from the substrate, the bubbles can slow their velocity and partially slow heat removal. However, in our opinion, such behavior cannot fully explain the occurrence of a boiling crisis. Even if we narrow the bubble size spectrum through a specific hot surface morphology, the bubble slowing mechanism by coagulation is still monotonic and cannot, from a mathematical point of view, yield a singular point. This mechanism may adjust the absolute value of the critical heat flux, but it does not determine the underlying mechanism. We believe that the primary mechanism for the occurrence of a boiling crisis is percolation-based.
2.2. Continuum Percolation Problem
For further consideration, we need a brief overview of the key aspects of continuum or off-lattice problems of percolation theory. Percolation theory is currently the dominant scientific concept in describing heterogeneous disordered media and systems with fully stochastic structure [10,11]. The classic and best-developed example of a percolation problem is the conductivity problem, or the dielectric-metal transition. In this problem a mixture of dielectric and metallic balls or particles is considered. When metallic balls are added to the dielectric ones, at a certain concentration, macroscopic electrical conductivity arises in the system. Percolation theory describes the emergence of macroscopic conductivity in such a system. More generally, percolation theory describes the emergence of macroscopic connectivity in a disordered system for one of the components. The condition of local connectivity in each problem has its own meaning – from direct contact of particles to the overlap of virtual regions of physical interaction. For example, when a combustion wave propagates through a heterogeneous mixture of fuel and inert particles, the connectivity condition is the condition of the fresh particle entering the heating region around the burnt particle, where the temperature is higher than the ignition temperature [12]. Direct contact is a special case of the connectivity condition.
A percolation cluster (PC) is the most interesting and important object in such a heterogeneous system. It is a cluster that joints only sites (objects) of a similar type, for example, only metal balls in its mixture with dielectric ones. So, one can travel to infinity from any PC site by moving only along the sites of a given cluster, i.e., along metallic balls. A PC possesses a whole set of fractal properties. It can be distinguished by several subsystems, the main ones being the skeleton and the surface. Removing skeleton sites leads to a rupture of macroscopic connectivity. The surface of a percolation cluster is a collection of cluster sites adjacent to sites of another type. Macroscopic connectivity arises in such a system when a percolation cluster forms from connected sites.
Historically, the first problems were those of percolation on lattices. In these problems, the sites of regular spatial lattices were considered, some of which were occupied, some free. Next, the minimum fraction of occupied sites was found at which a percolation cluster occurred in the system. Thus, for the site problem on a 2D square lattice, this threshold is pc ≈ 0.5927, and on a 3D cubic lattice, pc = 0.3116077 ± 0.0000004 [13].
Continuum percolation theory arose as an extension of discrete lattice percolation theory to continuous Euclidean space. It was first formulated based on ideas from early lattice problems and was associated with the need to describe the first wireless communication networks [14]. The base points of discrete percolation form various types of lattices. In the general case, the base points of continuum percolation are stochastically located in some continuous space. In the context of the problem under consideration, these may be the growth centers of vapor bubbles or the centers of mass of such bubbles as they rise (Figure 1). Each point may be associated with a specific geometric object (a shape—a sphere, ellipsoid, cube, cylinder, etc.). In the simplest case, this is a circumscribed circle for two-dimensional problems or a sphere for three-dimensional ones. For example, for the problem of signal transmission over a network of cellular towers, the sites are the locations of the towers, and the geometric shapes are the coverage areas of these towers, which, due to local topographic features, may differ from a circle. It should be noted that sometimes this form can represent the real forms of physical objects – for example, particles of one material randomly distributed in a matrix of another material [15]. Sometimes, for a number of problems, these forms are virtual and represent, for example, the region of some physical interaction of particles [16]. In general, two large classes of continuum problems are considered – problems on non-overlapping volumes (forms cannot penetrate or superimpose each other) [17] and problems on overlapping volumes [18]. Which class of problems describes the boiling problem is still an open question. During boiling, most bubbles do not overlap, and the total volume of merging bubble is, to a first approximation, equal to the sum of the volumes of the merged bubbles. Therefore, for the boiling problem, a description based on a percolation problem for non-overlapping volumes appears preferable. As for discrete percolation problems, the key question of study in continuum percolation is the conditions for the formation of a percolation cluster, i.e. macroscopic connectivity.
An important issue for this work is the percolation threshold in continuum problems. The development of continuum percolation is closely related to the work of Sher and Zallen [19]. Percolation thresholds for lattice problems vary widely, and it is difficult to discern any pattern in their values. However, there is an approximate invariant for them, which was described by Sher and Zallen. They constructed a circle (or sphere) around each lattice site with a radius equal to half the distance to the nearest neighbor (Fig. 1c). Note that such a construction corresponds to the continuum problem for non-overlapping volumes. Sher and Zallen calculated the fraction of the area (volume) that is located within such circles (spheres) constructed around occupied sites at the percolation threshold. It turned out that the relative volume φc occupied by such spheres at the percolation threshold is an approximately constant value, depending only on the dimensionality of the space:
φc,2D ≈ 0.44 ± 0.02
φc,3D ≈ 0.154 ± 0.005
This construction was the first step in understanding the properties of continuum percolation. The problem of continuum percolation on random sites is formulated as follows. Consider a stochastic system of points randomly distributed in space with an average concentration n per unit volume. Let ξij be a function of the vector rij connecting points i and j. We define a number ξ and assume that sites i and j are connected if the inequality ξij ≤ ξ, which is called the connectivity condition, is satisfied. If two sites are connected directly or via pairwise connected sites, they are said to belong to the same cluster. The percolation threshold ξc is defined as the lower value of the parameter ξ for which a percolation system exists. The simplest of these problems is the problem with the connectivity condition rij ≤ R. This condition is satisfied if site j is located within a sphere of radius R circumscribed around site i. This problem has a simple geometric interpretation. Let spheres of equal radius R be constructed around stochastically distributed sites. The problem is to find, for a given concentration of sites n, the smallest value of R = Rc such that infinite chains of sites exist such that each subsequent sites lies inside the sphere constructed on the previous one. In some problems, it is more convenient to construct spheres with radius R/2 (analogy with the Scher-Zallen construction). In this case, sites are considered connected if their spheres intersect. Pike and Seeger [20] proposed calling the first construction enclosing spheres (circles), and the second, overlapping spheres (circles).
Consider a three-dimensional region with linear dimension L and volume V = L3. N particles (bubbles of radius r) are randomly distributed within this region. The numerical concentration of particles is n = N/V. Then the volume fraction of the space occupied by the spheres circumscribed around the particles is:
Let's consider the problem of overlapping spheres. Consider an arbitrary point in space. We'll find the probability that none of the N particles and the spheres circumscribed around them fall into that arbitrary point in space. Given their uniform distribution throughout the volume
Then we obtain the following relationship between the volume fraction and the volume fraction of space occupied by intersecting spheres, taking into account their random overlaps:
The parameter φс represents the percolation threshold for continuum problems. It depends on the spatial dimension d and on the shape of the interacting geometric objects embedded within the space. For the problem on overlapping circles and spheres, the most accurate calculation result to date is as follows [21]:
These values of the quantities characterizing thresholds in 2D and 3D systems with a uniform space distribution of particles (bubbles) are valid for both the non-overlapping and overlapping spheres (circles) problem.
3. Results
3.1. Percolation and Boiling
The most detailed and thorough work examining crisis boiling from the standpoint of the percolation transition is [23]. The authors of this work experimentally found a correlation between the signs of boiling crisis and the probability density of bubble formation on a heated surface [24,25]. For this purpose, advanced experimental techniques were used, such as high-resolution infrared thermometry with phase detection, which allows for the determination of bubble traces and other boiling parameters, such as the distribution of the area of bubble traces and the bubble growth time, the departure frequency and the density of nucleation centers. An important fact of the experimental observation is that at low heat fluxes, when single bubbles grow on the boiling surface, and the heat flux density is about 80 W/cm2, the bubbles do not interact with each other. Moreover, the surface area distribution for bubbles is a damped function with a corresponding mean value and standard deviation. In other words, the problem can be characterized by the average bubble size. As the heat flux and the number of bubbles on the surface increase, they begin to interact, often forming larger vapor bubbles or dynamic, rapidly changing bubble clusters. At the onset of crisis boiling, which was observed for a heat flux of about 350 W/cm2, this distribution follows to a scale-free distribution, i.e., a power-law distribution with a negative exponent less than 3. The presence of a scale-free distribution indicates a divergence of bubble size dispersion in this region. There is no dominant bubble size, and all sizes are equally probable. This is a clear sign of a geometric phase transition or, in other words, a percolation threshold [11]. This means that to understand and describe boiling crisis, it is not enough to consider models based on single bubbles; their interaction and collective behavior are important. We only note that this is the main experimental fact that allowed the authors [23] to link boiling crisis with the percolation problem. But this fact does not allow us to make an unambiguous conclusion about the spatial dimension (2D or 3D) of the observed phenomenon without additional information or mathematical models.
The authors conducted further research based on their mathematical model. The model is based on bubble interactions as a process of stochastic percolation in a continuum. They simulated the behavior of the total surface area of bubbles that have not yet detached from the hot surface, depending on the main parameters of the boiling problem. These parameters included the nucleation site density N, the average footprint radius R of non-interacting bubbles, and the product of the average bubble growth time tg and departure frequency f. Computer modeling made it possible to establish a correlation between the main boiling parameters in the following form:
where C is a constant. In their modeling, the authors considered largest cluster of the bubbles and the second-largest cluster of bubbles on a hot surface. During nucleate boiling, the sizes of these clusters were comparable and increased monotonically with increasing heat flux density. Upon reaching a certain flux value, interpreted as critical, a bifurcation was observed: the size of the largest cluster increased sharply, while the size of the second-largest bubble cluster began to decrease significantly. This is a classic picture of a percolation transition. In other words, the model predicts a sudden transition from a nucleate boiling regime to a stable vapor film, called a film boiling regime. The picture of the onset of the crisis is essentially two-dimensional.
According to the simulation results, the constant C depends on the dimensionless boiling area Ah/πR2, normalized to the average area of the footprint of one bubble, where Ah is the area of the entire boiling surface. According to the simulation data, this parameter is equal to 0.95 for a dimensionless area of ~10 and asymptotically tends to a value of 1.15 for a dimensionless region of 10 000 or more. It can be seen that this parameter is very close to the percolation threshold for a two-dimensional system from equation (9) ≈ 1.128. Thus, the product N πR2 is the fraction of the area that would be covered by bubbles on the hot surface if they did not interact, and f tg is the probability that a bubble exists (the concentration of bubble growth centers). The coincidence of these constants is the main argument of the authors [23] in favor of describing the boiling crisis by a two-dimensional percolation problem. This point is also debatable.
3.2. Percolation Model of Boiling and Critical Flux Estimations.
We believe that the above-mentioned work and the proposed approach to the problem raise an important controversial issue. This issue concerns the two-dimensionality of the percolation model describing the boiling crisis. Qualitatively, this approach is based on analogies and, in large part, on the coincidence of the constant C found by the authors through computer simulation with the critical concentration of centers for a two-dimensional percolation problem (the percolation threshold). However, the physical mechanism leading to this essentially three-dimensional phenomenon — the boiling crisis in a large liquid volume — remains unclear. How can the formation of a percolation cluster from the vapor phase on a hot flat surface significantly alter the boiling pattern in the bulk? According to the model presented in this work, as the fraction of the surface occupied by the vapor film increases, heat transfer from the surface to the bulk decreases monotonically. But why should we observe an extremum for the heat flux density at some given fraction of the surface occupied by the vapor film? Importantly, in a two-dimensional system, for simple topological reasons, only one percolation cluster can exist at a time—either from the vapor phase or from the liquid. However, the loss of liquid connectivity on a hot surface in a thin near-surface layer provides no obvious basis for a reduction in heat flux. There is no physical mechanism responsible for this process.
It should be noted that one of the main conceptualizations of the formation of a boiling crisis is the loss of hydrodynamic stability. However, for example, in [26], it is noted that it is physically incorrect to discuss at boiling the "stability of the bubble structure of a two-phase boundary layer," since the motion of a two-phase steam-water flow is stochastic and chaotic by nature. This may require the use of stochastic equations for each phase of the system [27,28,29,30]. For the same reason, there is no basis for even speaking about a "boundary layer." Furthermore, it is noted that the previously held notion of the onset of a boiling crisis due to the merging of steam bubbles on the heating surface is not supported by experimental data on the boiling of water and organic liquids [26]. This fact contradicts the 2D percolation model of boiling crisis.
We believe that the 3D percolation model is consistent with the experimental data on the development of a boiling crisis. It is important for us to understand which physical processes during boiling are affected by the forming percolation cluster. During boiling in a three-dimensional system, vapor bubbles continuously form on a hot surface, break away at a certain frequency, and are carried toward the surface. The continuity equation requires compensation for the liquid flow carried away by the vapor. The reverse flow of liquid from cooler upper layers to the hot surface must be realized. Far from the point of the first crisis, nothing prevents such a reverse flow. When a percolation cluster forms from vapor bubbles in the continuum formulation of the problem, the global connectivity of liquid phase is lost. This, in our opinion, stops the flow of liquid from the bulk to the hot surface, making this process only local. This is the essence of the physical mechanism for the onset of the first boiling crisis, driven by percolation connectivity.
Let's make some estimates to confirm these qualitative arguments. The classic expression for the critical heat flux at the first boiling crisis is the Kutateladze-Zuber equation:
Here hlv is the enthalpy of the liquid to vapor phase transition, K is a constant. This form of the equation for the heat flow has been repeatedly derived by various authors using various approaches and approximations. Its derivation is considered in most detail in the methodological work [26]. In the same work [26], it is repeatedly noted that for the boiling of non-metallic liquids, the value of the constant K has been experimentally established
Let's estimate the critical heat flux for boiling crisis based on the concept that the boiling crisis is the point of a three-dimensional continuum percolation threshold. The high thermal fluxes for nucleate boiling are provided by the formation and growth of vapor bubbles, which then transfer heat to the cold surface. The heat transfer rate can be calculated using Equation (15), if all its components are known:
Here, q is the specific heat flux (per unit area), fb is the bubble departure frequency, ns is the departing bubble number density per unit area, and Vb is the bubble volume at the moment of departure. We assume that the bubble volume Vb changes only slightly as it rises due to changes in external pressure.
If we consider an elementary area on a hot surface and a column of liquid above this area, then we can estimate the volume concentration of centers nv of emerging bubbles as
If the boiling crisis corresponds to the percolation threshold for a three-dimensional continuum problem, then we can write the following relation, which already takes into account the interaction and merging of vapor bubbles:
Finally, for the speed of rising bubbles we use Zuber's equation:
In this case, we assumed that the density of the liquid is much greater than the density of its saturated vapor: . Putting everything together, we finally obtain the expression
Thus, we obtained the Kutateladze-Zuber equation for the critical heat flux. Moreover, our approach provides an explicit correspondence between the constant K in the Kutateladze-Zuber equation (15) and the value of percolation threshold:
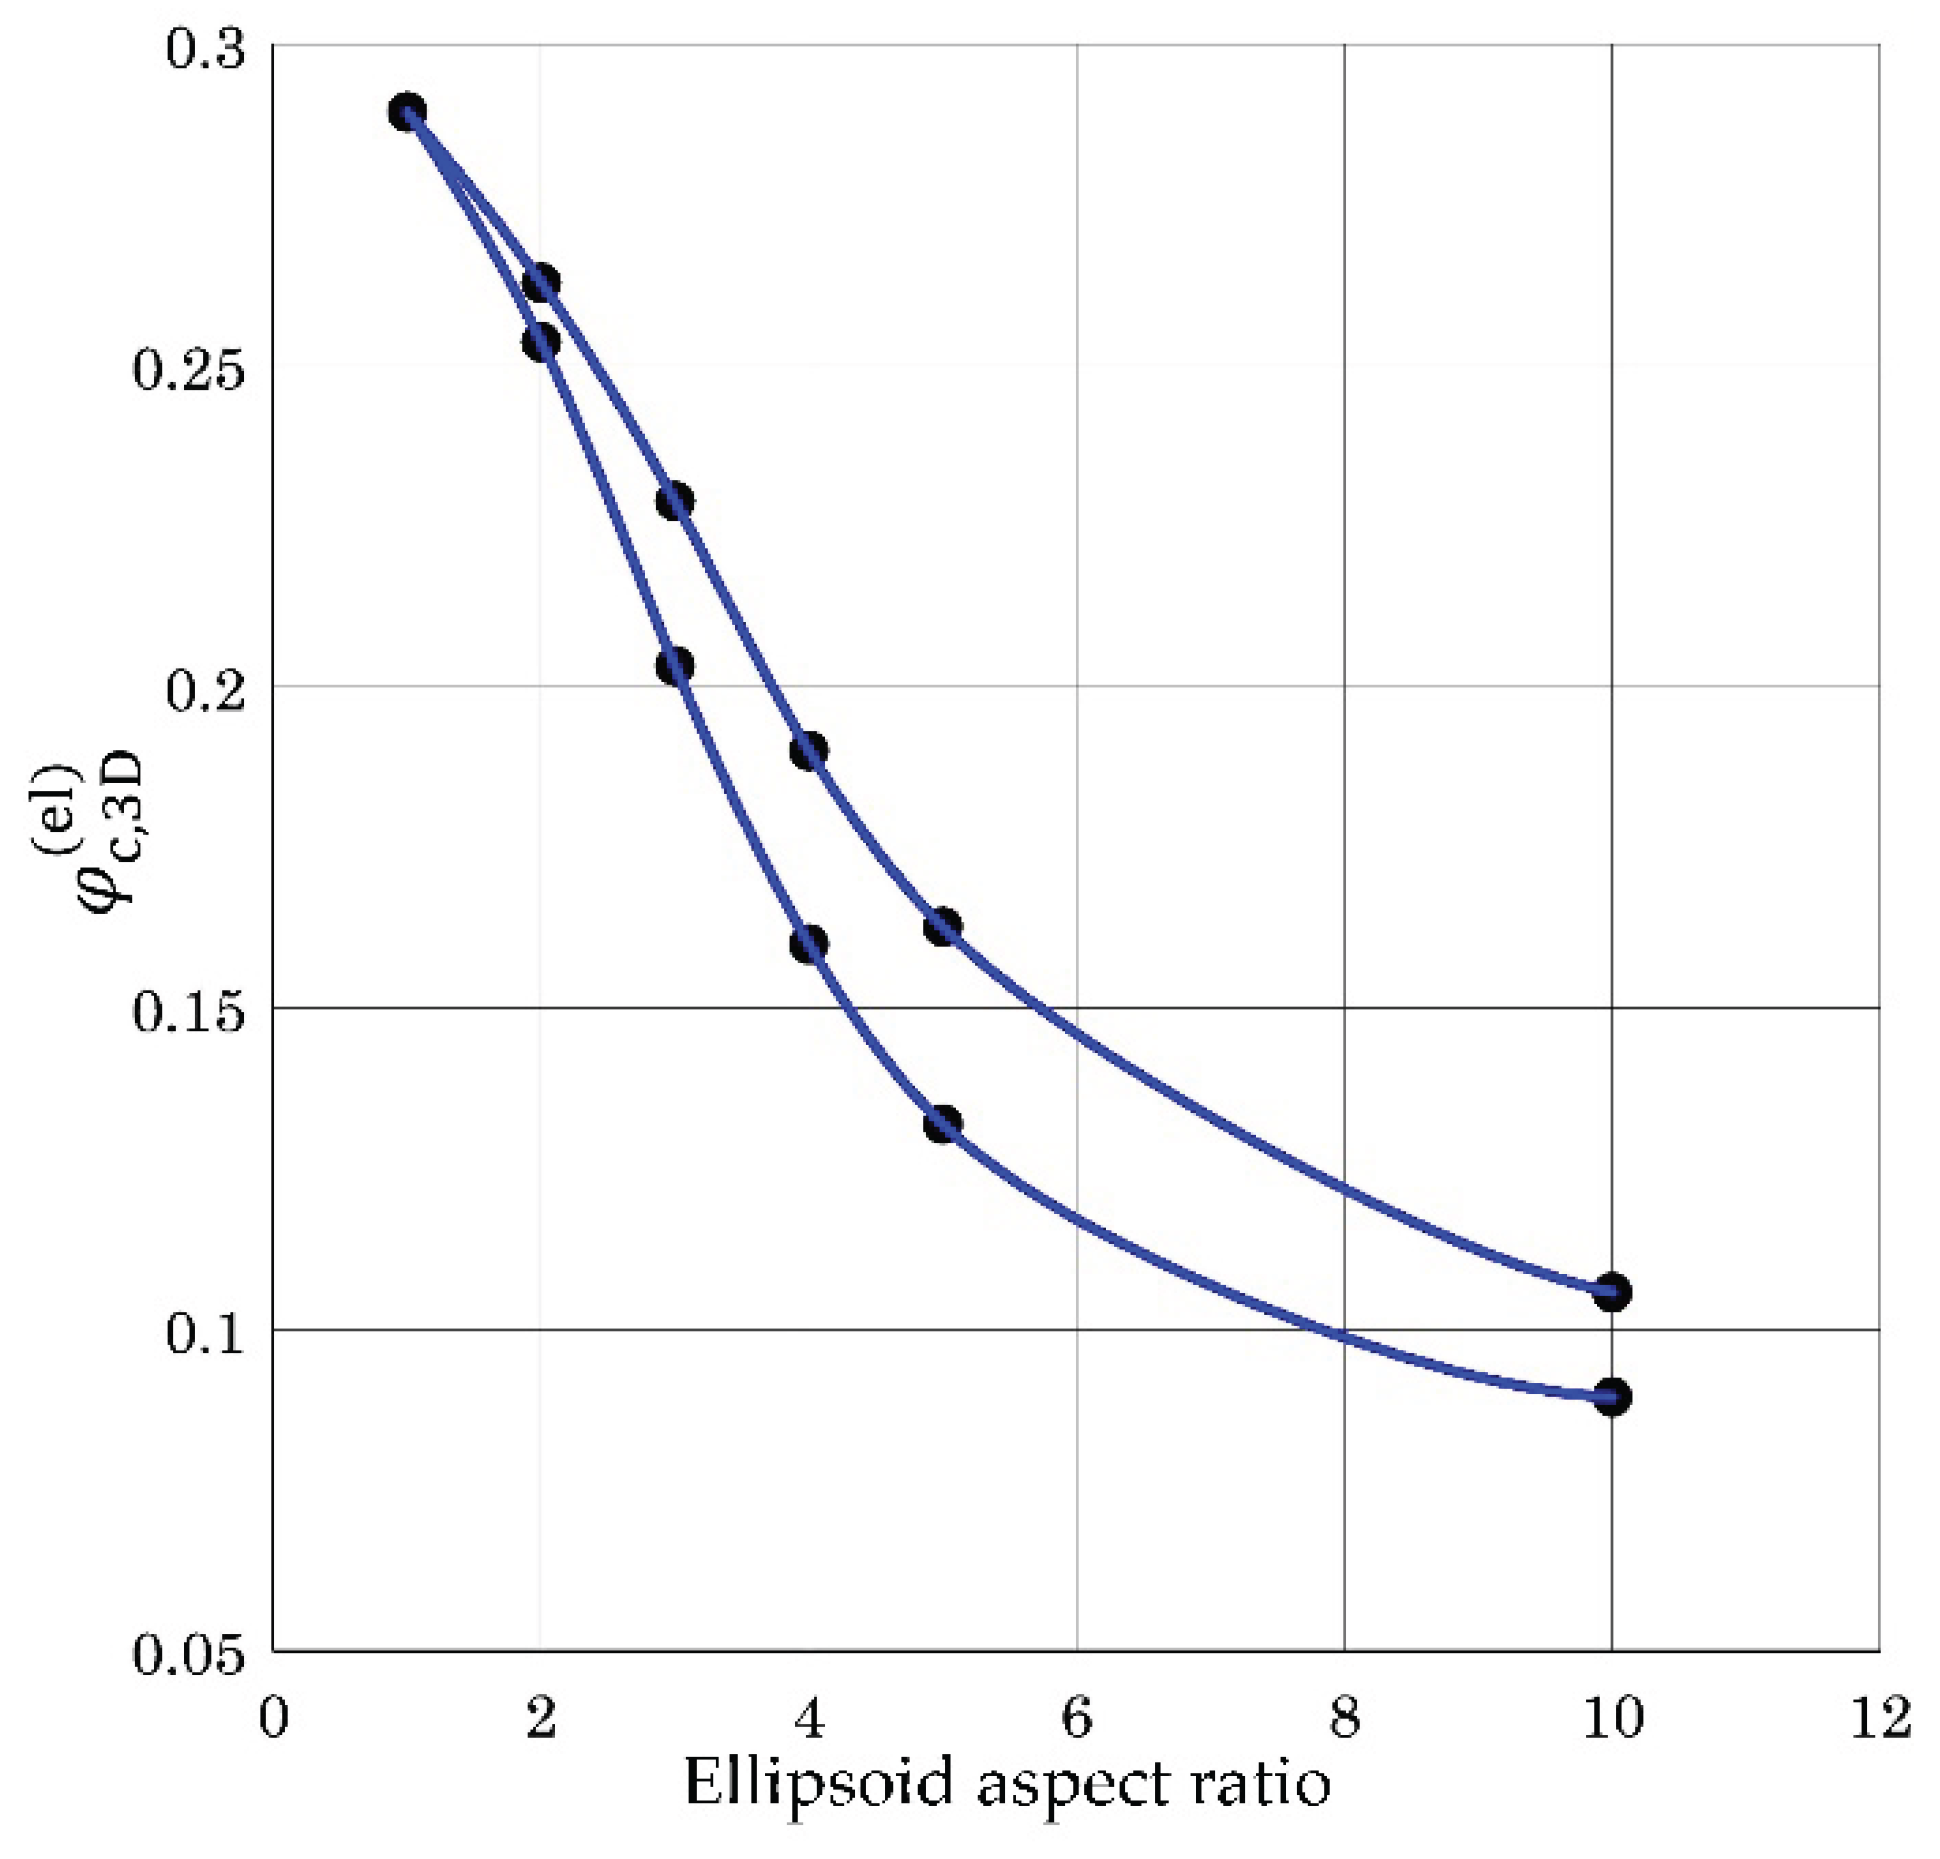
If we now turn to equations (10) and (11), we can see that the spherical vapor bubble model rather roughly describes the crisis as a percolation transition. This model overestimates the constant K by a factor of two. At the same time, the model of vapor bubbles in the form of ellipsoids, when axes aspect ratio is about 4 - 6 (Figure 2), brings all models into line from a quantitative point of view (compare Equations (14) and (11)). So, we can finally write . And this also correlates well with experimental observations that the gas bubbles in a liquid are better described with an ellipsoidal shape than a spherical one [33,34]. Note that the constant K is close in value to the Sher-Zallen criterion for three-dimensional systems (equation (5)), when a system of mutually touching but non-overlapping spheres is constructed for occupied lattice sites at percolation threshold. This is another indirect confirmation of the constructed theoretical model.
The obtained estimates confirm the applicability of the proposed 3D stochastic percolation model for describing the first boiling crisis.
4. Conclusions
For the first boiling crisis, this paper proposes and discusses in detail a stochastic model that describes this crisis as a percolation transition in three-dimensional space. It is shown that this crisis is more accurately described by a continuous percolation problem on prolate ellipsoids. Based on the proposed model, an equation for the critical heat flux is derived that coincides with the Kutateladze-Zuber equation. It is shown for the first time that the proportionality constant in this equation coincides with the percolation threshold for a three-dimensional continuum percolation problem on overlapping ellipsoids.
Author Contributions
Conceptualization, P.G.; methodology, P.G.; validation, P.G., O.P.; writing—original draft preparation, P.G.; writing—review and editing, P.G., O.P. All authors have read and agreed to the published version of the manuscript.
Funding
This research received no external funding.
Conflicts of Interest
The authors declare no conflicts of interest.
References
- Kutateladze, S.S. Hydrodynamic theory of changes in the boiling regime of liquid during free convection. Izvestiya AN USSR. 1951, 529–536.
- Zuber, N. Hydrodynamic Aspects of Boiling Heat Transfer. Univ. of California: Los Andgeles:, 1959.
- Liang G.; Mudawar I. Pool boiling critical heat flux (CHF)–Part 1: Review of mechanisms, models, and correlations. Int. J. Heat Mass Transf. 2018, 117, 1352-1367. [CrossRef]
- Tong, L.S. Boiling Crisis and Critical Heat Flux. U.S. Atomic Energy Commission, 1972.
- Zhang, L.; Seong, J.H.; Bucci M. Percolative scale-free behavior in the boiling crisis. Phys. Rev. Lett. 2019, 122, 134501. [CrossRef]
- Koznacheev, I.A.; Malinovskii A.I.; Rabinovich O.S.; Fisenko S.P. Saturation Temperature and Heat Transfer During Nucleate Boiling on a Substrate. J. Eng. Phy. Thermophys. 2023, 96, 1862-1866. [CrossRef]
- Chantsev, V.Y. The vertical motion of air-bubble curtain analysis. Sci. Not. Russ. State Hydrometeorolog. Univ. 2017, 46, 64-70.
- Malenkov, I.G. On the motion of large gas bubbles floating in a liquid. J. Appl. Mech. Tech. Phys, 1968, 6, 130–134.
- Kutateladze, S.S.; Styrikovich M.A. Hydrodynamics of gas-liquid systems. Moscow: Energy, 1976. 296 p.
- Stauffer, D.; Aharony, A. Introduction to percolation theory. Taylor & Francis, 2018.
- Grinchuk, P.S. Cluster size distribution in percolation theory and fractal Cantor dust. Phys. Rev. E. 2007, 75, 041118. [CrossRef]
- Grinchuk, P.S.; Rabinovich, O.S. Percolation Phase Transition in Combustion of Heterogeneous Mixtures. Comb. Expl. Shock Wav. 2004, 40, 408–418. [CrossRef]
- Deng, Y; Blöte, HWJ. Monte Carlo study of the site-percolation model in two and three dimensions. Phys. Rev. B, 2005, 72, 016126.
- Gilbert, E. N. Random plane networks. J. Soc. Indust. Appl. Mat., 1961, 9, 533–543. [CrossRef]
- Danilova-Tretiak, S.M.; Nikolaeva, K.V.; Evseeva, L.E.; Grinchuk, P.S. Thermal conductivity of a polymer composite on the base of correlated site-bond percolation problem. Polymer. 2025, 337, 128949. [CrossRef]
- Grinchuk, P.S. Scattering of radiation in a heterogeneous medium near the percolation threshold. Phys. B: Cond. Matt. 2003, 338, 252-255. [CrossRef]
- Ambrosetti, G.; Grimaldi, C.; Balberg, I.; Maeder, T .; Danani, A.; Ryser, P. Solution of the tunneling-percolation problem in the nanocomposite regime. Phys. Rev. B. 2010, 81, 155434. [CrossRef]
- Garboczi, E. J. Percolation phase diagrams for multi-phase models built on the overlapping sphere model. Phys. A: Stat. Mech. Appl. 2016, 442, 156-168. [CrossRef]
- Scher, H.; Zallen, R. Critical density in percolation processes. J. Chem. Phys., 1970, 53, 3759. [CrossRef]
- Pike, G.E.; Seager, C.H. Percolation and conductivity: A computer study. Phys. Rev. B, 1974, 10, 1421–1434. [CrossRef]
- Quintanilla, J.; Torquato, S.; Ziff, R.M. Efficient measurement of the percolation threshold for fully penetrable discs. J. Phys. A: Math. Gen. 2000, 33, L399–L407. [CrossRef]
- Yi, Y. B.; Sastry, A.M. Analytical approximation of the percolation threshold for overlapping ellipsoids of revolution. Proc. Roy.Soc. Lond. Ser. A: Math., Phys.Eng.Sci. 2004, 460, 2353-2380. [CrossRef]
- Zhang, L.; Wang, C.; Su1, G.; Kossolapov, A.; Aguiar, G.M.; Seong, J.H.; Chavagnat, F.; Phillips, B.; Rahman, Md M.; Bucci, M. A unifying criterion of the boiling crisis. Nat. Comm. 2023, 14, 2321. [CrossRef]
- Zhang, L.; Seong, J. H.; Bucci, M. Percolative scale-free behavior in the boiling crisis. Phys. Rev. Lett. 0, 122, 134501. [CrossRef]
- Su, G.-Y.; Wang, C.; Zhang, L.; Seong, J.H.; Kommajosyula, R.; Phillips, B.; Bucci, M. Investigation of flow boiling heat transfer and boiling crisis on a rough surface using infrared thermometry. Int. J. Heat Mass Transf. 2020, 160, 120134. [CrossRef]
- Kruzhilin, G. N.; Lykov, E.V. Critical heat load upon pool liquid boiling. Tech. Phys. 2000, 45, 157-160. [CrossRef]
- Dmitrenko AV. Prediction of laminar–turbulent transition on flat plate on the basis of stochastic theory of tur-bulence and equivalence of measures. Continuum Mech Thermodyn. 2022; 34:601-615. [CrossRef]
- Dmitrenko AV. The Theory of Equivalence Measures and Stochastic Theory of Turbulence for Non-Isothermal Flow on the Flat Plate. Int J Fluid Mech Res. 2017;43(2):182-187. [CrossRef]
- Dmitrenko AV. Analytical Determination of the Heat Transfer Coefficient for Gas, Liquid and Liquid Metal Flows in the Tube Based on Stochastic Equations and Equivalence of Measures for Continuum. Contin Mech Thermodyn. 2017; 29(6):1197-1205. [CrossRef]
- Dmitrenko, A.V. Analytical estimates of critical Taylor number for motion between rotating coaxial cylinders based on theory of stochastic equations and equivalence of measures. 2021,Fluids 6(9):306. [CrossRef]
- Lin, J.; Chen, H.; Xu, W. Geometrical percolation threshold of congruent cuboidlike particles in overlapping particle systems. Phys. Rev. E. 2018, 98, 012134. [CrossRef]
- Garboczi, E. J.; Snyder, K.A.; Douglas, J. F. Geometrical percolation threshold of overlapping ellipsoids. Phys. Rev. E, 1995, 52, 819. [CrossRef]
- Mikaelian, D.; Larcy, A.; Dehaeck, S.; Haut, B. A new experimental method to analyze the dynamics and the morphology of bubbles in liquids: Application to single ellipsoidal bubbles. Chem. Eng. Sci. 2013, 100, 529-538. [CrossRef]
- Aoyama, S.; Hayashi, K.; Hosokawa, S.; Tomiyama, A. Shapes of ellipsoidal bubbles in infinite stagnant liquids. Int. J. Multiphase Flow. 2016, 79, 23-30. [CrossRef]
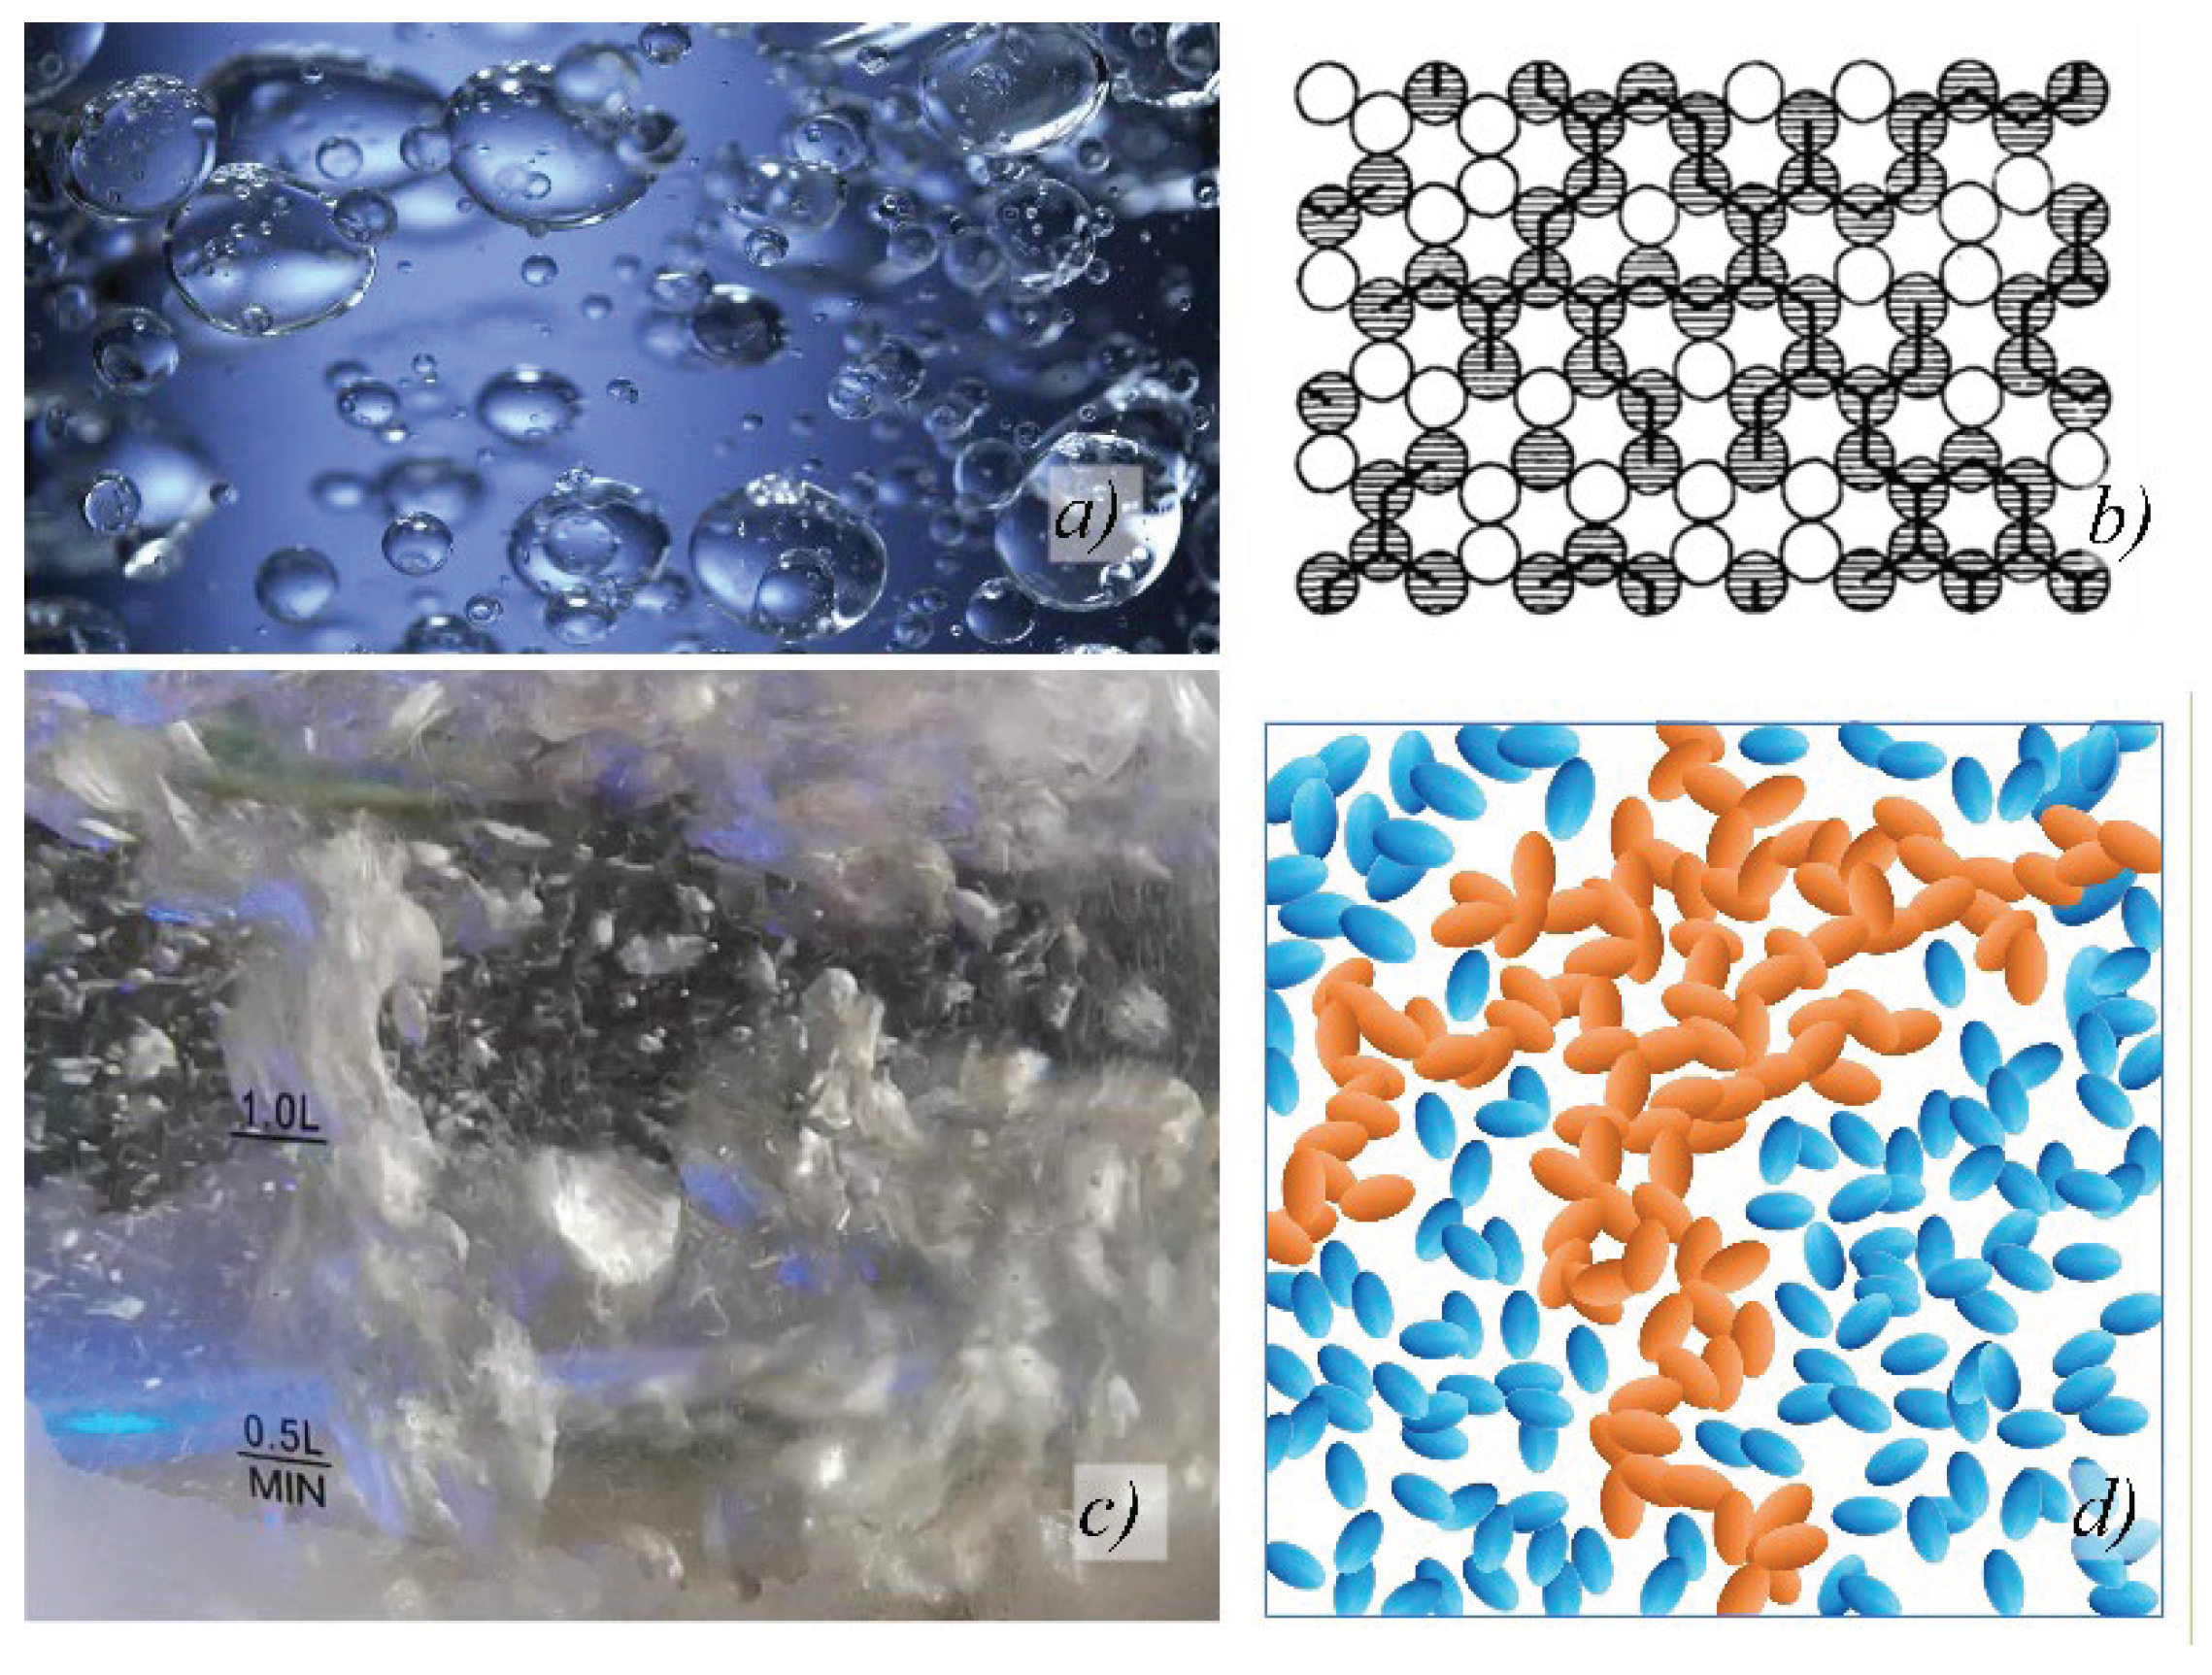
Figure 1.
Illustration of the model. Different stages of water boiling: a) initial, c) developed; b,d - and model geometric constructions for describing the boiling crisis: b) – const- ruction of Sher and Zallen for a honeycomb lattice [19], d) - continuum problem of percolation theory for overlapping ellipses, the percolation cluster is highlighted in orange.
Disclaimer/Publisher’s Note: The statements, opinions and data contained in all publications are solely those of the individual author(s) and contributor(s) and not of MDPI and/or the editor(s). MDPI and/or the editor(s) disclaim responsibility for any injury to people or property resulting from any ideas, methods, instructions or products referred to in the content. |
© 2025 by the authors. Licensee MDPI, Basel, Switzerland. This article is an open access article distributed under the terms and conditions of the Creative Commons Attribution (CC BY) license (http://creativecommons.org/licenses/by/4.0/).
Copyright: This open access article is published under a Creative Commons CC BY 4.0 license, which permit the free download, distribution, and reuse, provided that the author and preprint are cited in any reuse.


