
Submitted:
11 December 2025
Posted:
12 December 2025
You are already at the latest version
Abstract
: Due to the lack of in-situ observations in mountainous locations, the use of remote sensing data is an alternative to analyze rainfall distribution patterns during the passage of major hurricanes. In this work, gridded precipitation data from the CHIRPS database are evaluated by comparing with observations from weather stations during the passage of category 3–5 hurricanes for the period 1980–2024. The comparison between estimated and observed values is performed by regression analysis and the use of the K and K0 coefficients. An advantage of using K-ratio and K0-ratio is the identification of overestimated or underestimated precipitation in the pixel records. The distribution of daily precipitation helped in a more concise way to better understand how well CHIRPS reproduced the observed rainfall patterns. Results show that correlations between observations and database estimates are in the range of 0.42–0.67, for eastern Pacific hurricanes, and 0.29–0.74 for Atlantic hurricanes all of which are statistically significant; however, these results do not imply congruence between observations and estimates since CHIRPS fails to adequately reproduce the position of the highest precipitation core. In the initial stages of a tropical cyclone, near- zero correlations between observations and estimates indicate that CHIRPS is not able to reproduce the observed rainfall. It is recommended to use CHIRPS with caution when the focus is on analyzing rainfall patterns during the development of intense tropical cyclones.
Keywords:
precipitation
; tropical cyclones
; satellite precipitation products
; CHIRPS
; Rainfall impact
1. Introduction
The rainfall regime in Mexico is crucial for economic and human activities such as agriculture, livestock, tourism, water supply in reservoirs, and consequently the availability of water for domestic use [1,2,3]. Moreover, precipitation displays high spatial and temporal variability worldwide (i.e., [4,5,6,7,8]). Understanding the impacts associated with the variability of precipitation, such as floods, landslides, and droughts, is of great interest to reduce social vulnerability in the country’s development.
Tropical Cyclones (TCs) are a main source of warm-season humidity in the tropics, encompassing various intensities such as tropical depressions (TD), tropical storms (TS), and hurricanes (H), which are classified into five categories (hereafter HN; N = 1, 2, 3, 4, or 5). These weather systems can deliver large quantities of water during just a few days. Due to its geographic location, Mexico is one of the few countries in the world that is affected by TCs from two ocean basins [9,10,11,12,13,14] with a season starting in May in the eastern Pacific and June in the Atlantic Ocean. Daily precipitation records give support to study and understand the precipitation variability details, comprehend the benefits and damages from the occurrence of TCs, and consequently reduce their associated risks. However, homogeneous and high-quality daily precipitation records over a large area are scarce, mainly when the interest is focused on major hurricanes (i.e., H3–H5) because of the impacts on the country. Major hurricanes involve not only high rainfall accumulation in few days but also strong wind speeds. Such hurricanes are the most devastating and have caused large economic and human losses in Mexico. As an example of a relatively large devastation [15], on October 25, 2023, hurricane Otis made landfall in Guerrero State as an H5.
The variability of precipitation is not only linked to global-scale atmospheric disturbances, but often to local or regional-scale systems [16,17,18,19,20]. The complex orography of Mexico prevents the availability of a spatially and uniformly distributed network throughout the country, which results in difficulties to conduct hydrometeorological studies. Therefore, it is imperative to have an alternative high-quality and high-resolution database to characterize precipitation and associated risks.
The Climate Hazards Group InfraRed Precipitation with Stations (CHIRPS; Funk, et al. [21]) database can be a good choice for studies because it provides information on a quasi-global grid at high resolution (0.05°). CHIRPS is constructed from satellite observations, providing information for broad regions where observations from meteorological stations are scarce, incomplete, or even absent. This relatively new database has been used in various parts of the world [22,23,24,25]. In Mexico Morales-Velázquez, et al. [26] used reanalysis and satellite data, including CHIRPS, to assess precipitation at the regional and daily scales in La Sierra River basin. Hernández-Romero, et al. [27] compared a time series of in situ observations and CHIRPS in the Conchos River basin between to find a good response of the CHIRPS data. Other studies using CHIRPS are available elsewhere [19,28,29,30].
This research aims to evaluate and discuss the effectiveness of CHIRPS in reproducing precipitation patterns associated with major hurricanes (H3, H4, and H5) that have affected Mexico, compared to an observational dataset. The study is organized as follows: Section 2 describes data and methods; Section 3 presents the main results, emphasizing discrepancies between CHIRPS and observations; and Section 4 discusses these results to provide some insights for future research. Finally, the last section summarizes the study, highlighting our conclusions.
2. Data and Methods
2.1. Study Area
Mexico is a country located between 14° and 32° N latitude and 86° and 118° W longitude (Figure 1). It covers an area of 1,960,646.7 km² [31]. The main orographic features include the Sierra Madre Occidental (SMO), the Sierra Madre Oriental (SMOR), the Sierra Madre del Sur, and the Trans-Volcanic Axis (TVA), which extends from east to west [32,33]. Most of Mexico’s annual precipitation occurs during the summer, with a secondary peak in the winter.
2.2. Tropical Cyclones
The TC dataset from the eastern Pacific and Atlantic basins was obtained from the National Hurricane Center for the period 1949–2024 that is available at https://www.nhc.noaa.gov/data/#hurdat [34,35].
For this investigation, from both ocean basins, we focused on H3–H5 (Table 1) that made landfall or had a trajectory located within 30 km from the coast. Once identified, we considered the complete track of the TC, including the area within a 500-km radius from the position at 1200 UTC (Figure 2). The precipitation was evaluated on a daily basis (24-hour intervals) for all observations within the radius of influence. This value was considered as the TC contribution to the total precipitation.
2.3. Observational Data
Daily precipitation for the 1981–2024 period were provided by Mexico’s National Meteorological Service (SMN) available at: https://smn.conagua.gob.mx/es/climatologia/informacion-climatologica/informacion-estadistica-climatologica [36]. We will refer to these data as “observations” for evaluating precipitation recorded on each day along the TC tracks. Data quality was verified before calculations through direct inspection of each series. Extremely high values with no replication in surrounding stations were considered a gap. No attempts were made to replace the gaps in the observations. The use of daily precipitation data means that the same weather station overlaps depending whether (or not) it is in the path of the TC but is not considered if there is not reported data.
2.4. CHIRPS Dataset
The CHIRPS dataset for the 1981–2024 period was obtained from: https://data.chc.ucsb.edu/products/CHIRPS-2.0/global_daily/netcdf/p05/by_month/. CHIRPS is a gridded product developed by the US Geological Survey Earth Resources Observation and Science Center, in collaboration with the Santa Barbara Climate Hazards Group at the University of California. The dataset provides precipitation data for a quasi-global domain spanning 50° S to 50° N and 180° E to 180° W, with a very high spatial resolution of 0.05° × 0.05°. CHIRPS comprises over 40 years, from 1981 to the present, and integrates various rain-gauge networks with satellite-based estimates [21]. Daily values were used for regions within a 500-km radius of influence of the TC position.
2.5. CHIRPS Gridded Dataset Versus Observations
To assess the correspondence between precipitation records from weather stations (i.e., observations) and the CHIRPS gridded dataset associated with the passage of major hurricanes, we identified grid cells whose centroids were closest to each weather station within a 500-km radius from the TC position during its entire track (Figure 2). We applied a least-square regression analysis to the precipitation dataset from both sources, i.e., observations and the CHIRPS gridded dataset. In this analysis, the observations were considered as the predictor or independent variable, while the precipitation data from the closest centroids of the grid cells to each station (hereafter referred to as “pixel records”) were treated as the criterion or dependent variable (Figure 2b, c).
Additionally, a comparative approach between observations and pixel records was applied during each day of the passage of major TCs, consisting of the K ratio and K0 ratio. These ratios compare average precipitation and the number of records with zero precipitation, respectively, from CHIRPS and observational data, which are expressed as:
where , , and , represent the average precipitation and number of records with no precipitation (i.e., precipitation equals zero) during each day of the passage of major TC from the CHIRPS dataset and the observational data, respectively.
The discrepancy in the K-ratio and K0-ratio for each data source is analyzed to evaluate the effectiveness of CHIRPS reproducing precipitation patterns associated with major hurricanes. An advantage of using the K-ratio and K0-ratio is that they help to identify overestimated or underestimated precipitation observations in the pixel records. For example, indicates that the average precipitation estimated from the CHIRPS dataset in a particular case is higher than that from the observations, and consequently, the pixel records generally overestimate the observations. On the other hand, suggests that, in general, pixel records underestimate the observations. Similarly, if the K0 ratio shows that there are few (or more) instances of zero precipitation in the numerator (i.e., pixel records) compared to the denominator (observations) in a particular case, it is expected that pixel records overestimate (underestimate) precipitation in locations closest to the stations.
2.6. Cumulative Precipitation
The accumulated precipitation was calculated for the TC track. In this case, all weather stations within a 500-km radius from the hurricane center were considered (i.e., see Figure 2), as well as their corresponding nearest centroids from CHIRPS dataset. The criterion for considering cumulative precipitation valid was that the station reported precipitation observation throughout the entire path of the TC (i.e., no missing data). If this was not the case, the pair values, i.e., from the station and the corresponding nearest centroid in the CHIRPS dataset were removed from the computation process.
3. Results
3.1. Cumulative Precipitation in the Eastern Pacific and Atlantic Basins
Table 2 and Figure 3, and Table 3 and Figure 4 show the results of the correlation analysis, and K0- and K-ratios for the accumulated precipitation of the TC track in the Pacific and Atlantic basins, respectively. Maximum correlation (see Table 2) between observations and pixel records was obtained for Lane (2006, R=0.76, n=956) while minimum correlation was for Jimena (2009, R=0.40, n=472). According to the K0- and K-ratios, in 5 out of 15 cases pixel records overestimate the mean accumulated precipitation relative to observations (K>1). For the remaining 10 cases in which the pixels records underestimate the mean accumulated precipitation, in five cases there is a discrepancy between the K0- and K-ratios, i..e. while K0-ratio indicates less intances of zero precipitation, K coefficient indicates underestimation of precipitation.
The most obvious feature of the relationship between the accumulated precipitation from observations and from pixel records is that, both in the Pacific (Figure 3) and Atlantic (Figure 4) basins there are deviations from the 1:1 ratio line. Relevant cases occur when the estimates show a larger bias compared to the corresponding observations. Specifically, it is evident that CHIRPS estimates are more (less) than one standard deviation away from the observed precipitation values when the observed precipitation is small (large).
In the Atlantic basin (Table 3), maximum corelation between observations and pixel records was obtained for Wilma (2005, R=0.78, n=149) while minimum correlation was for Emily (2005, R=0.49, n=1046). In four out of eight cases there is consistency between the K0- and K-ratios, from this in one case case (Gilbert, 1988) pixel records overestimate the accumulated precipitation relative to observations. For the remaining four cases in which there is discrepancy between the K0- and K-ratios, in three cases (Dean, 2007; Isidore, 2002; Grace, 2021) the pixel records underestimate accumulated precipitation in relation to observations but reported less (even none in two cases) instances of zero precipitation.
3.2. Specific Dates Analysis in the Eastern Pacific
A more detailed analysis considering precipitation records on specific dates of TCs in the Pacific (Table 4) and the Atlantic (Table 5) basins shows, in general, a weaker relationship between observations and pixel records compared to accumulated precipitation. For instance, in the eastern Pacific (Table 4), observations and pixel records had the highest correlations (r ≥ 0.60) in 6 out of 15 events when pixel records underestimate observations, (i.e., K<1). This occurred during John (2024, R=0.70, n=199); Roslyn (2022, R=0.70, n=107; Virgil (1992, R=0.69, n=200); Odile (2014, R=0.65, n=179); Patricia (2015, R=0.62, n=179); and Lane (2006, R=0.60, n=312). Otherwise, correlations (r<0.60) were obtained either when pixel records overestimate observations (K>1, in 5 out of 15 events) or when pixel records underestimate observations (K<1, in 4 out of 15 events)
3.3. Specific Dates Analysis in the Atlantic Basin
In the Atlantic (Table 5), the highest correlations (r ≥ 0.60) between precipitation observations and pixel records from the CHIRPS dataset were obtained either when pixel records overestimate observations, (K>1, i.e., Keith 2000, R=0.67 and Dean 2007, R=0.63), or when pixel records underestimate observations (K<1, i.e., Roxanne 1995, R=0.61). In the remaining events (5 out of 8 occurrences), correlations (r<0.60) showed no tendency toward either overestimation (2 cases) or underestimation (3 cases) between CHIRPS and observations and, in two cases, a discrepancy between the K0- and K-ratios is observed.
The results of the correlations between observations and pixel records for each day of the TC track are provided in Table S1 (Supplementary Material) for both the eastern Pacific and Atlantic basins.
For 116 dates related to TC tracks in the Pacific and Atlantic basins (see Table S1), in 85 cases (73%) there is consistency between the K and K0 coefficients. This means that, in general, in 52 cases the overestimation (33 underestimation) of mean precipitation is related both to higher (lower) mean precipitation in CHIRPS compared to observations (i.e., ) and to the lower (higher) number of CHIRPS centroids with precipitation equal to zero, compared to the corresponding sites in the observations (i.e., K0). In the remaining 31 cases (27%) there is discrepancy between the K and K0 coefficients.
Considering only cases when there is consistency between the K and K0 coefficients (see Table 4 and Table 5), the largest overestimation of mean precipitation is observed for Kiko (K = 1.28, K0 = 69/125) in the Pacific (Table 4) and Keith (K = 1.34, K0 = 37/46) in the Atlantic (Table 5). Conversely, the largest underestimation occurs for Pauline (K = 0.37, K0 = 131/62) in the Pacific (Table 2) and Wilma (K = 0.39, K0 = 53/10) in the Atlantic (Table 3).
Unfortunately, for Roslyn (K = 0.47, K0 = 31/41), Patricia (K = 0.59, K0 = 0/8), Lane (K = 0.65, K0 = 49/71), John (K = 0.62, K0 = 30/47), and Lidia (K = 0.31, K0 = 4/4) in the Pacific (Table 4), along with Isidore (K = 0.65, K0 = 0/14), and Grace (K = 0.31, K0 = 64/122) in the Atlantic (Table 5), CHIRPS underestimates mean precipitation (K<1) even when the grid cells report fewer cases of zero precipitation compared to observations (K0 coefficients). To assess more objectively the usefulness of CHIRPS in reproducing the precipitation pattern under the impact of major hurricanes, we complement the analysis by comparing distribution maps derived from pixel records and observation. The accumulated precipitation distribution for each TC can be found in the supplementary material (Figure S1).
To accomplish this goal, we selected one Pacific TC (Roslyn, 2022) and one from the Atlantic (Gilbert, 1988). Their precipitation distributions from CHIRPS and observations are shown in Figure 5 and Figure 6, respectively.
In general, the discrepancy between observations and the CHIRPS data is most evident in the accumulated precipitation distribution maps (Figure 5 and Figure 6, and supplementary material A and B). In all cases, a bias in the distribution pattern is observed with CHIRPS overestimating small precipitation and underestimating large precipitation compare to observations. The overestimation of small amounts causes a much larger area in CHIRPS than observed. However, when the correlation between observed and estimated precipitation is highest, CHIRPS reproduces the precipitation pattern quite well, although it tends to overestimate the area of high precipitation. These features are displayed in Figure 5 and Figure 6. For instance, the core of maximum precipitation is clearly identified, with an acceptable and consistent pattern between observations and CHIRPS for the Pacific (Figure 5) and Atlantic (Figure 6) cases. However, CHIRPS underestimates maximum precipitation in the core, while low precipitation covers a larger area compared to observations.
If, in addition to the data from the cells closest to weather stations, all CHIRPS grid cells are considered during the entire TC track, the precipitation distribution pattern is better detailed, but the features mentioned above are still maintained, with CHIRPS, overestimating small precipitation and underestimating large precipitation. This result is clearly identified for TC Keith (2000) (Figure 7). The precipitation contour maps for each day of TCs can be found in the supplementary material (Figure S2).
Tropical Cyclone OTIS
Recently one of the most intense hurricanes in Mexico was Otis, which intensified rapidly, made landfall as an H5 at 12:30 local time (06:30 UTC) on October 25, 2023. Table 6 show the highest correlations between observations from October 24–25, 2023 and pixel records from the CHIRPS dataset on specific dates of the TC, the highest correlation was obtained when Otis was over land (R=0.31). For this case, K and K0 coefficients showed an overestimation for October 24 (K>1).
The relationship between the observations and CHIRPS for Otis’s track are shown in Figure 8, while the corresponding CHIRPS distribution and observation are in Figure 9. Note that in Figure 8 the TC position is displayed each day at 1200 UTC. Between 0300 and 0600 UTC October 25, 2023, when Otis reached its category 5 as hurricane.
Figure 8 highlights the pairs of points that line up well along the regression line, especially when the correlations between observations and the estimated data are statistically significant (i.e., day 25, R=0.31). However, there are deviations from the 1:1 ratio line. In addition, Figure 9 reproduces the precipitation pattern for Otis, between CHIRPS and observations, with an underestimation on October 24 and an overestimation on the 25th.
The differences between observed and estimated rainfall during the path of hurricane Otis are, perhaps, caused by the development and internal structure of the TC itself. Because Otis intensified from a tropical storm to a category 5 hurricane in less than 24 hours, we attempt to elucidate the causes of precipitation deviations between CHIRPS and observations. To achieve this goal, we analyzed vertical profiles of the horizontal winds and mixing ratios for October 23–25 along 15.0°N, 99.0°W through 19.5°N, 100.0°W (Figure 10). The profile is oriented parallel to the path of Otis. On October 23, Otis was a tropical storm and became an H1-H3 on the 24th; while approaching the coast, the incident flow (Figure 10a) abruptly changed being dominated by inland flow above 800 hPa, increasing moisture convergence (black dotted lines) on the coast by October 24 (Figure 10b). The increase of mixing ratio and the configuration of moisture convergence at low levels and divergence at 700 hPa on the coast agrees with the observed rainfall estimate that is not well simulated by CHIRPS (see Figure 9), causing a very low correlation between observed and estimated rainfall on October 24. Later (Figure 10c), at and after landfall, the contribution of the TC is evident by generating moisture convergence below 700 hPa –and divergence above– accompanied by an increase in the mixing ratio from the ocean to the interior of the continent. These conditions coincide with an increase in observed and estimated precipitation inland, increasing the correlation between both values (see Figure 8) indicating that, once the flow and moisture are dominated by the TC, greater consistency is observed between simulated (i.e., CHIRPS) and observed precipitation.
4. Discussion
One of the major challenges in examining rainfall patterns during the development of a major hurricane is the uncertainty in accurately measuring the cumulative rainfall. This uncertainty arises from the deflection of raindrops by strong winds, which prevents them from reaching the rain gauge and leading to underestimate precipitation. Moreover, the scarcity of observational sites in remote, isolated areas further complicates efforts to pinpoint potentially flood-prone regions during rainfall from major hurricanes. Despite these shortcomings, it is still possible to identify the regions of highest rainfall. In this context, high-resolution, open-access gridded datasets such as CHIRPS are valuable for providing a detailed description of rainfall patterns. It is therefore crucial to understand the strengths and limitations of such database to study rainfall patterns associated with major hurricanes.
To provide insights into the reliability of CHIRPS, an analysis of rainfall from 15 major hurricanes in the eastern Pacific and 8 in the Atlantic basins, between 1980 and 2024, was performed to compare observed (SMN) and estimated (CHIRPS) precipitation. The results consistently indicate that CHIRPS overestimates provided low precipitation while underestimates extreme precipitation. These limitations are observed in both the Pacific and Atlantic basins, although the correlations between observed and estimated precipitation accumulations are greater in the Atlantic basin (see Table 2 and Table 3) with an average correlation of 0.56 and 0.68 for the Pacific and Atlantic, respectively. In both basins, the correlations are statistically significant, which means that they are not random, implying that CHIRPS is able to reproduce the observed precipitation pattern. Moreover, significant correlations (r>0.6) between observed and estimated precipitation are evident on several days of the TC track, suggesting that the CHIRPS dataset can, to some extent, reproduce the observed rainfall patterns from major hurricanes, although there is a tendency to overestimate the area of small precipitation and underestimate the core of large precipitation.
Statistically significant correlations between observed and estimated (CHIRPS) precipitation are found when the TC is well-organized and reaches category 1 or higher as hurricane. Conversely, in the initial stages of the TC, CHIRPS struggles to adequately replicate the observed rainfall patterns. The case of hurricane Otis (2023) serves as an example for this analysis.
This is likely due to, during the early stages of TC organization near the coast, convection generated over land that interacts with the moisture supplied by the TC, making an accurate estimation in CHIRPS difficult (see Figure 10). Once the TC develops into a major hurricane, the atmospheric flow pattern takes over, driving local convection and producing more precipitation because of this development. This behavior will be reviewed in greater detail in a subsequent manuscript.
Worldwide studies that use the CHIRPS database for different regions, found some difficulties in showing the benefits of the database. For example [37], use CHIRPS for East Africa finding that the satellite precipitation products present irregularities in the mountainous and coastal region, being only promising in some regions. In this work, CHIRPS consistently reproduces the precipitation pattern (see Figure 5, Figure 6 and Figure 7) although a bias is observed with CHIRPS overestimating small precipitation area and underestimating large precipitation compare to observations. Base on the average correlation between observations and estimations among the entire track of the TC,
Paredes-Trejo et al. [38] assessed CHIRPS estimates in comparison with pixel-to-pixel observations for Northeastern Brazil, to conclude that CHIRPS is more accurate in the summer, as in general the database underestimates (overestimates) high (low) precipitation. These results are congruent with our findings, where the summer precipitation distribution pattern associated with major hurricanes underestimates (overestimates) high (low) precipitation.
5. Conclusions
The use of precipitation from indirect estimates, in particular from satellite products, is of paramount importance to understand the mechanisms that govern the water-cycle management across the world. CHIRPS is a state-of-the-art dataset characterized by a blending procedure using infrared satellite observations and in-situ estimates of precipitation. The objective of the present study was to evaluate the database performance associated with precipitation from major hurricanes that approached Mexico from either the eastern Pacific or the Atlantic basins. Our main findings were:
- The correlations between observations and estimates, in some cases, were statistically significant. However, this result does not guarantee congruence between observations and estimates since, as discussed, CHIRPS fails to adequately reproduce the position of the highest precipitation core, to overestimate small precipitation, and to underestimate large precipitation.
- When the correlation between observed and estimated precipitation is higher, CHIRPS is able to reproduce the precipitation pattern quite well, although it tends to overestimate the area of very large precipitation.
- Based on the average correlation between observed and estimated precipitation, the Atlantic basin shows a higher correlation than the Pacific basin, indicating that, in general, CHIRPS better replicates the precipitation distribution pattern in the Atlantic.
- In the initial stages of TC, CHIRPS is unable to reproduce the accumulations of precipitation resulting in low correlations between the observations and database estimates.
- It is recommended to use CHIRPS with caution when the focus is on analyzing rainfall patterns during the development of intense tropical cyclones.
Supplementary Materials
The following supporting information can be downloaded at the website of this paper posted on Preprints.org, Table S1: Major hurricanes in the eastern Pacific and Atlantic basins that affected Mexico during the period 1981–2024. Dates and categories (Cat) of the hurricanes are shown, along with the highest correlation (R) achieved in each case from the regression analysis between the number of observations and pixel records from CHIRPS, statistical significance (p), and K0- and k-ratios. Figure S1: Contor maps of accumulated precipitation along the TC track in the Pacific and Atlantic basins. Figure S2. Precipitation contour maps for each day of TCs in the Pacific and Atlantic basins.
Funding
This research received no external funding.
Author Contributions
Conceptualization, J.P.V.C and L.B.C.; methodology, J.P.V.C., L.B.C and L.M.F.; software, L.B.C., L.M.F and J.P.V.C.; validation, J.P.V.C., L.B.C., L.M.F., D.A.C and E.P.H.; formal analysis, J.P.V.C., L.B.C.; investigation, J.P.V.C., L.B.C.; resources, J.P.V.C., L.B.C., L.M.F., D.A.C and E.P.H.; data curation, J.P.V.C., L.B.C.; writing—original draft preparation, J.P.V.C., L.B.C.; writing—review and editing, J.P.V.C., L.B.C., L.M.F., D.A.C., E.P.H., and C.O.M; visualization, J.P.V.C., L.B.C., L.M.F., D.A.C., E.P.H and C.O.M. All authors have read and agreed to the published version of the manuscript.
Data Availability Statement
The CHIRPS gridded precipitation dataset was obtained from: https://data.chc.ucsb.edu/products/CHIRPS-2.0/global_daily/netcdf/p05/by_month/ (accessed on 01 March 2025). The North American Regional Reanalysis (NARR) https://rda.ucar.edu/datasets/d608000/ (accessed on 12 January 2025). Tropical cyclone records were obtained from the National Hurricane Center database (HURDAT2) (accessed on 09 May 2025).
Acknowledgments
The authors are grateful to Julio Egren Felix Dominguez from CIBNOR’s Spatial Modeling and Remote Sensing Laboratory for technical support in obtaining the SMN data. J.P.V.C is the recipient of a postdoctoral fellowship from CONAHCYT (Grant 376783).
Conflicts of Interest
The authors declare no conflict of interest.
References
- Englehart, P.J.; Douglas, A.V. Dissecting the Macro-scale Variations in Mexican Maize Yields (1961-1997). Geographical and Environmental Modelling 2000, 4, 65–81. [Google Scholar] [CrossRef]
- Fuchs, A.; Wolff, H. Concept and Unintended Consequences of Weather Index Insurance: The Case of Mexico. American Journal of Agricultural Economics 2011, 93, 505–511. [Google Scholar] [CrossRef]
- Rogé, P.; Friedman, A.R.; Astier, M.; Altieri, M.A. Farmer Strategies for Dealing with Climatic Variability: A Case Study from the Mixteca Alta Region of Oaxaca, Mexico. Agroecology and Sustainable Food Systems 2014, 38, 786–811. [Google Scholar] [CrossRef]
- Englehart, P.J.; Douglas, A.V. Mexico’s summer rainfall patterns: an analysis of regional modes and changes in their teleconnectivity. Atmósfera 2002, 15, 147–164. [Google Scholar]
- Giddings, L.; Soto, M.; Rutherford, B.; Maarouf, A. Standardized Precipitation Index Zones for México. Atmósfera 2005, 18, 33–56. [Google Scholar]
- Seager, R.; Ting, M.; Davis, M.; Cane, M.; Naik, N.; Nakamura, J.; Li, C.; Cook, E.; Stahle, D. Mexican drought: an observational modeling and tree ring study of variability and climate change. Atmósfera 2009, 22, 1–31. [Google Scholar]
- Colorado-Ruiz, G.; Cavazos, T. Trends of daily extreme and non-extreme rainfall indices and intercomparison with different gridded data sets over Mexico and the southern United States. International Journal of Climatology 2021, 41, 5406–5430. [Google Scholar] [CrossRef]
- Bhattacharya, T.; Chiang, J.C.H. Spatial variability and mechanisms underlying El Niño-induced droughts in Mexico. Climate Dynamics 2014, 43, 3309–3326. [Google Scholar] [CrossRef]
- Cheung, K.; Yu, Z.; Elsberry, R.L.; Bell, M.; Jiang, H.; Lee, T.C.; Lu, K.-C.; Oikawa, Y.; Qi, L.; Rogers, R.F.; et al. Recent Advances in Research and Forecasting of Tropical Cyclone Rainfall. Tropical Cyclone Research and Review 2018, 7, 106–127. [Google Scholar]
- Rivera-Monroy, V.H.; Farfán, L.M.; Brito-Castillo, L.; Cortés-Ramos, J.; González-Rodríguez, E.; D’Sa, E.J.; Euan-Avila, J.I. Tropical Cyclone Landfall Frequency and Large-Scale Environmental Impacts along Karstic Coastal Regions (Yucatan Peninsula, Mexico). Applied Sciences 2020, 10, 5815. [Google Scholar] [CrossRef]
- Breña-Naranjo, A.J.; Pedrozo-Acuña, A.; Pozos-Estrada, O.; Jiménez-López, S.A.; López-López, M.R. The contribution of tropical cyclones to rainfall in Mexico. Physics and Chemistry of the Earth, Parts A/B/C 2015, 83-84, 111–122. [Google Scholar] [CrossRef]
- Khouakhi, A.; Villarini, G.; Vecchi, G.A. Contribution of Tropical Cyclones to Rainfall at the Global Scale. Journal of Climate 2017, 30, 359–372. [Google Scholar] [CrossRef]
- Dominguez, C.; Magaña, V. The Role of Tropical Cyclones in Precipitation Over the Tropical and Subtropical North America. Frontiers in Earth Science 2018, 6. [Google Scholar] [CrossRef]
- Englehart, P.J.; Douglas, A.V. The role of eastern North Pacific tropical storms in the rainfall climatology of western Mexico. International Journal of Climatology 2001, 21, 1357–1370. [Google Scholar] [CrossRef]
- Klotzbach, P. C.; Fogarty; Truchelut, R. Hurricane Otis: The strongest landfalling hurricane on record for the west coast of Mexico [in “State of the Climate in 2023”]. Bulletin of the American Meteorological Society 2024, 105(8), S264–S265. [Google Scholar] [CrossRef]
- Colorado-Ruiz, G.; Cavazos, T.; Salinas, J.A.; De Grau, P.; Ayala, R. Climate change projections from Coupled Model Intercomparison Project phase 5 multi-model weighted ensembles for Mexico, the North American monsoon, and the mid-summer drought region. International Journal of Climatology 2018, 38, 5699–5716. [Google Scholar] [CrossRef]
- León-Cruz, J.F.; Carbajal Henken, C.; Carbajal, N.; Fischer, J. Spatio-Temporal Distribution of Deep Convection Observed along the Trans-Mexican Volcanic Belt. Remote Sensing 2021, 13, 1215. [Google Scholar] [CrossRef]
- Mohammed, S.; Alsafadi, K.; Al-Awadhi, T.; Sherief, Y.; Harsanyie, E.; El Kenawy, A.M. Space and time variability of meteorological drought in Syria. Acta Geophysica 2020, 68, 1877–1898. [Google Scholar] [CrossRef]
- Perdigón-Morales, J.; Romero-Centeno, R.; Pérez, P.O.; Barrett, B.S. The midsummer drought in Mexico: perspectives on duration and intensity from the CHIRPS precipitation database. International Journal of Climatology 2018, 38, 2174–2186. [Google Scholar] [CrossRef]
- Zhao, Z.; Oliver, E.C.J.; Ballestero, D.; Mauro Vargas-Hernandez, J.; Holbrook, N.J. Influence of the Madden–Julian oscillation on Costa Rican mid-summer drought timing. International Journal of Climatology 2019, 39, 292–301. [Google Scholar] [CrossRef]
- Funk, C.; Peterson, P.; Landsfeld, M.; Pedreros, D.; Verdin, J.; Shukla, S.; Husak, G.; Rowland, J.; Harrison, L.; Hoell, A.; et al. The climate hazards infrared precipitation with stations—a new environmental record for monitoring extremes. Scientific Data 2015, 2, 150066. [Google Scholar] [CrossRef]
- Cavalcante, R.B.L.; Ferreira, D.B.d.S.; Pontes, P.R.M.; Tedeschi, R.G.; da Costa, C.P.W.; de Souza, E.B. Evaluation of extreme rainfall indices from CHIRPS precipitation estimates over the Brazilian Amazonia. Atmospheric Research 2020, 238, 104879. [Google Scholar] [CrossRef]
- Duan, Z.; Liu, J.; Tuo, Y.; Chiogna, G.; Disse, M. Evaluation of eight high spatial resolution gridded precipitation products in Adige Basin (Italy) at multiple temporal and spatial scales. Science of The Total Environment 2016, 573, 1536–1553. [Google Scholar] [CrossRef]
- López-Carr, D.; Mwenda, K.M.; Pricope, N.G.; Kyriakidis, P.C.; Jankowska, M.M.; Weeks, J.; Funk, C.; Husak, G.; Michaelsen, J. A spatial analysis of climate-related child malnutrition in the Lake Victoria Basin. In Proceedings of the 2015 IEEE International Geoscience and Remote Sensing Symposium (IGARSS), 26-31 July 2015, 2015; pp. 2564–2567. [Google Scholar]
- Rivera, J.A.; Marianetti, G.; Hinrichs, S. Validation of CHIRPS precipitation dataset along the Central Andes of Argentina. Atmospheric Research 2018, 213, 437–449. [Google Scholar] [CrossRef]
- Morales-Velázquez, M.I.; Herrera, G.d.S.; Aparicio, J.; Rafieeinasab, A.; Lobato-Sánchez, R. Evaluating reanalysis and satellite-based precipitation at regional scale: A case study in southern Mexico. Atmósfera 2021, 34, 189–206. [Google Scholar] [CrossRef]
- Hernández-Romero, P.; Patiño-Gómez, C.; Martínez-Austria, P.F.; Corona-Vásquez, B. Rainfall/runoff hydrological modeling using satellite precipitation information. Water Practice and Technology 2022, 17, 1082–1098. [Google Scholar] [CrossRef]
- Cavazos, T.; Luna-Niño, R.; Cerezo-Mota, R.; Fuentes-Franco, R.; Méndez, M.; Pineda Martínez, L.F.; Valenzuela, E. Climatic trends and regional climate models intercomparison over the CORDEX-CAM (Central America, Caribbean, and Mexico) domain. International Journal of Climatology 2020, 40, 1396–1420. [Google Scholar] [CrossRef]
- González-Ortigoza, S.; Hernández-Espriú, A.; Arciniega-Esparza, S. Regional modeling of groundwater recharge in the Basin of Mexico: new insights from satellite observations and global data sources. Hydrogeology Journal 2023, 31, 1971–1990. [Google Scholar] [CrossRef]
- Rincón-Avalos, P.; Khouakhi, A.; Mendoza-Cano, O.; Cruz, J.L.-D.l.; Paredes-Bonilla, K.M. Evaluation of satellite precipitation products over Mexico using Google Earth Engine. Journal of Hydroinformatics 2022, 24, 711–729. [Google Scholar] [CrossRef]
- (INEGI), I.N.d.E.y.G. Panorama sociodemográfico de México: Censo de Población y Vivienda 2020; Instituto Nacional de Estadística y Geografía: Mexico, 2020.
- De la Torre, E.Y. Los volcanes del Sistema Volcánico Transversal. Investigaciones Geográficas 2012. [Google Scholar] [CrossRef]
- Neyra Jáuregui, J.A. Guía de las altas montañas de México y una de Guatemala; Comisión Nacional para el Conocimiento y Uso de la Biodiversidad (CONABIO), 2012; p. 415. [Google Scholar]
- Knapp, K.R.; Diamond, H.J.; Kossin, J.P.; Kruk, M.C.; Schreck, C.J. International best track archive for climate stewardship (IBTrACS) project, version 4. NOAA National Centers for Environmental Information 2018, 10. [Google Scholar]
- Knapp, K.R.; Kruk, M.C.; Levinson, D.H.; Diamond, H.J.; Neumann, C.J. The International Best Track Archive for Climate Stewardship (IBTrACS): Unifying Tropical Cyclone Data. Bulletin of the American Meteorological Society 2010, 91, 363–376. [Google Scholar] [CrossRef]
- Branski, F. Pioneering the collection and exchange of meteorological data. Bulletin of the World Meteorological Organization 2010, 59, 1. [Google Scholar]
- Dinku, T.; Funk, C.; Peterson, P.; Maidment, R.; Tadesse, T.; Gadain, H.; Ceccato, P. Validation of the CHIRPS satellite rainfall estimates over eastern Africa. Quarterly Journal of the Royal Meteorological Society 2018, 144, 292–312. [Google Scholar] [CrossRef]
- Paredes-Trejo, F.; Barbosa, H. A.; Kumar, T. V. L.; Thakur, M. K.; de Oliveira Buriti, C. Assessment of the CHIRPS-based satellite precipitation estimates. In Inland Waters-Dynamics and Ecology; IntechOpen., 2020. [Google Scholar]
Figure 1.
Tracks of major hurricanes that have affected Mexico from the Eastern Pacific (blue lines) and Atlantic (red lines) basins in the period 1980–2024. SMO: Sierra Madre Occidental; SMOR: Sierra Madre Oriental; TVA: Trans-Volcanic Axis.
Figure 1.
Tracks of major hurricanes that have affected Mexico from the Eastern Pacific (blue lines) and Atlantic (red lines) basins in the period 1980–2024. SMO: Sierra Madre Occidental; SMOR: Sierra Madre Oriental; TVA: Trans-Volcanic Axis.
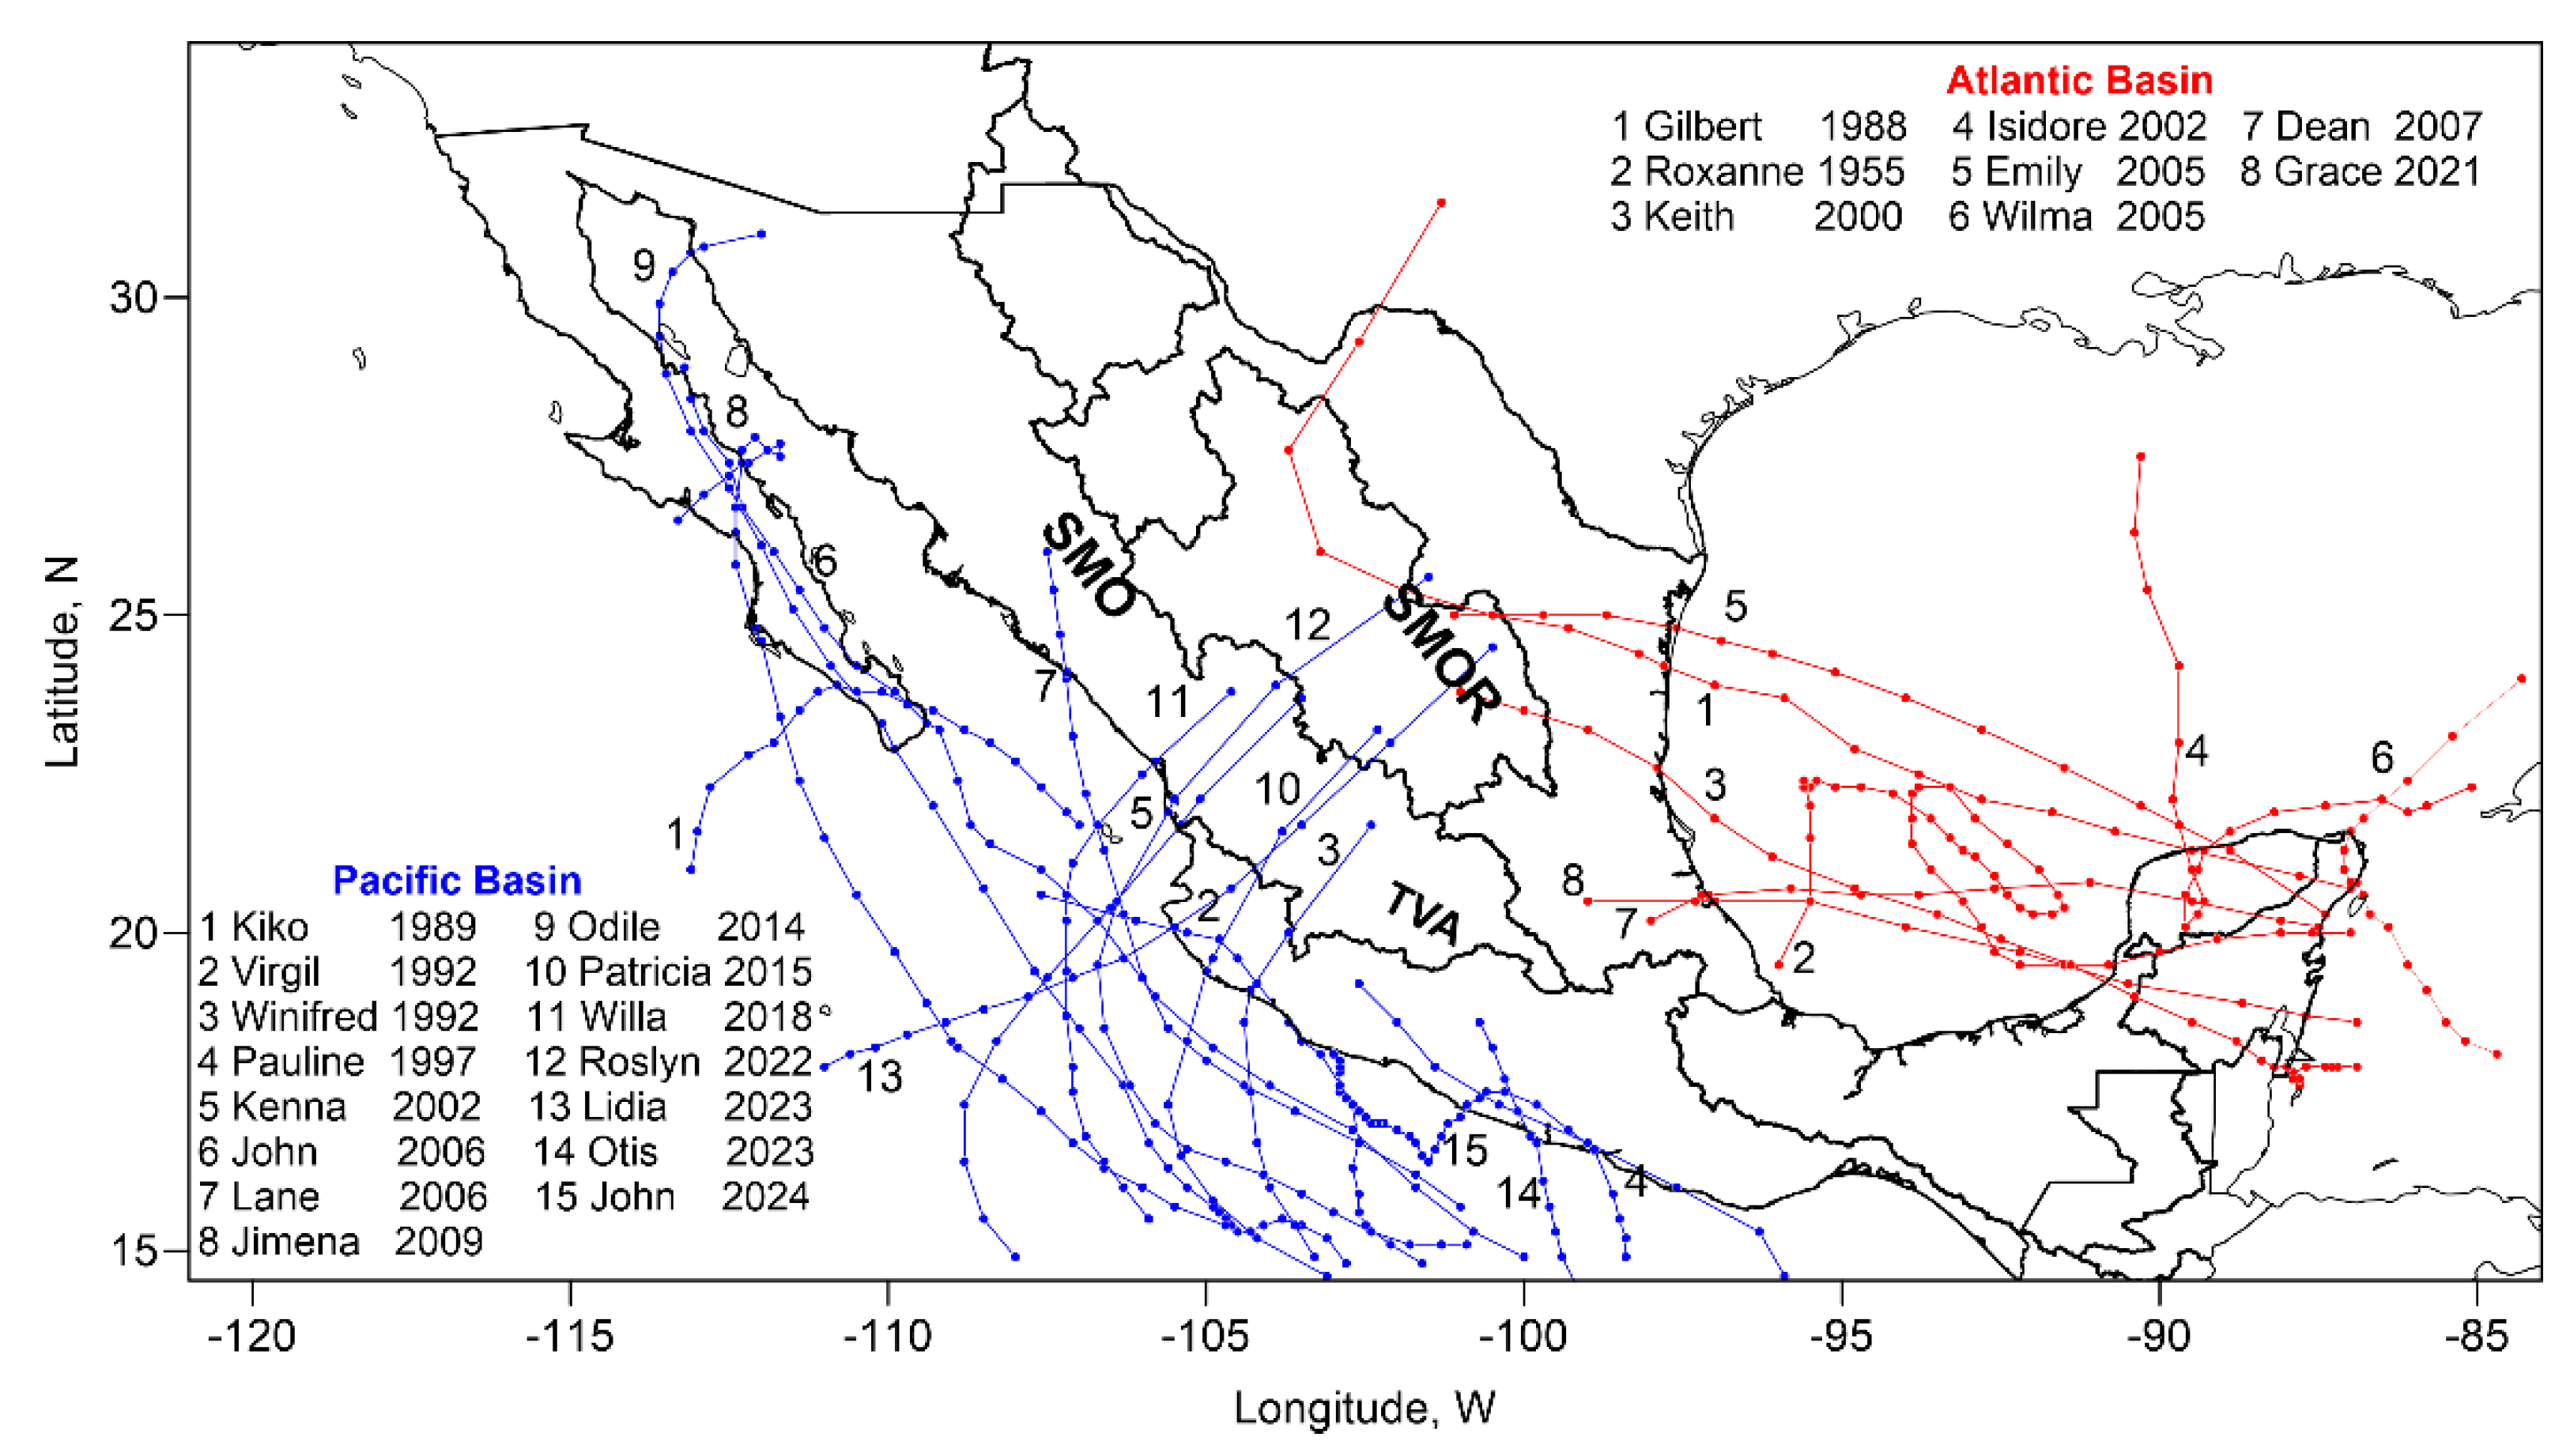
Figure 2.
Example of the CHIRPS gridded dataset and station observations. Blue line represents the track of tropical cyclone Odile (September 09–18, 2014). (a) Red dots indicate the position of weather stations, while gray dots represent the CHIRPS centroids of the grid cells within a 500-km radius from the TC position. Panels (b) and (c) zoom in on specific regions of interest, highlighting the centroids closest to each station. SMO: Sierra Madre Occidental; SMOR: Sierra Madre Oriental.
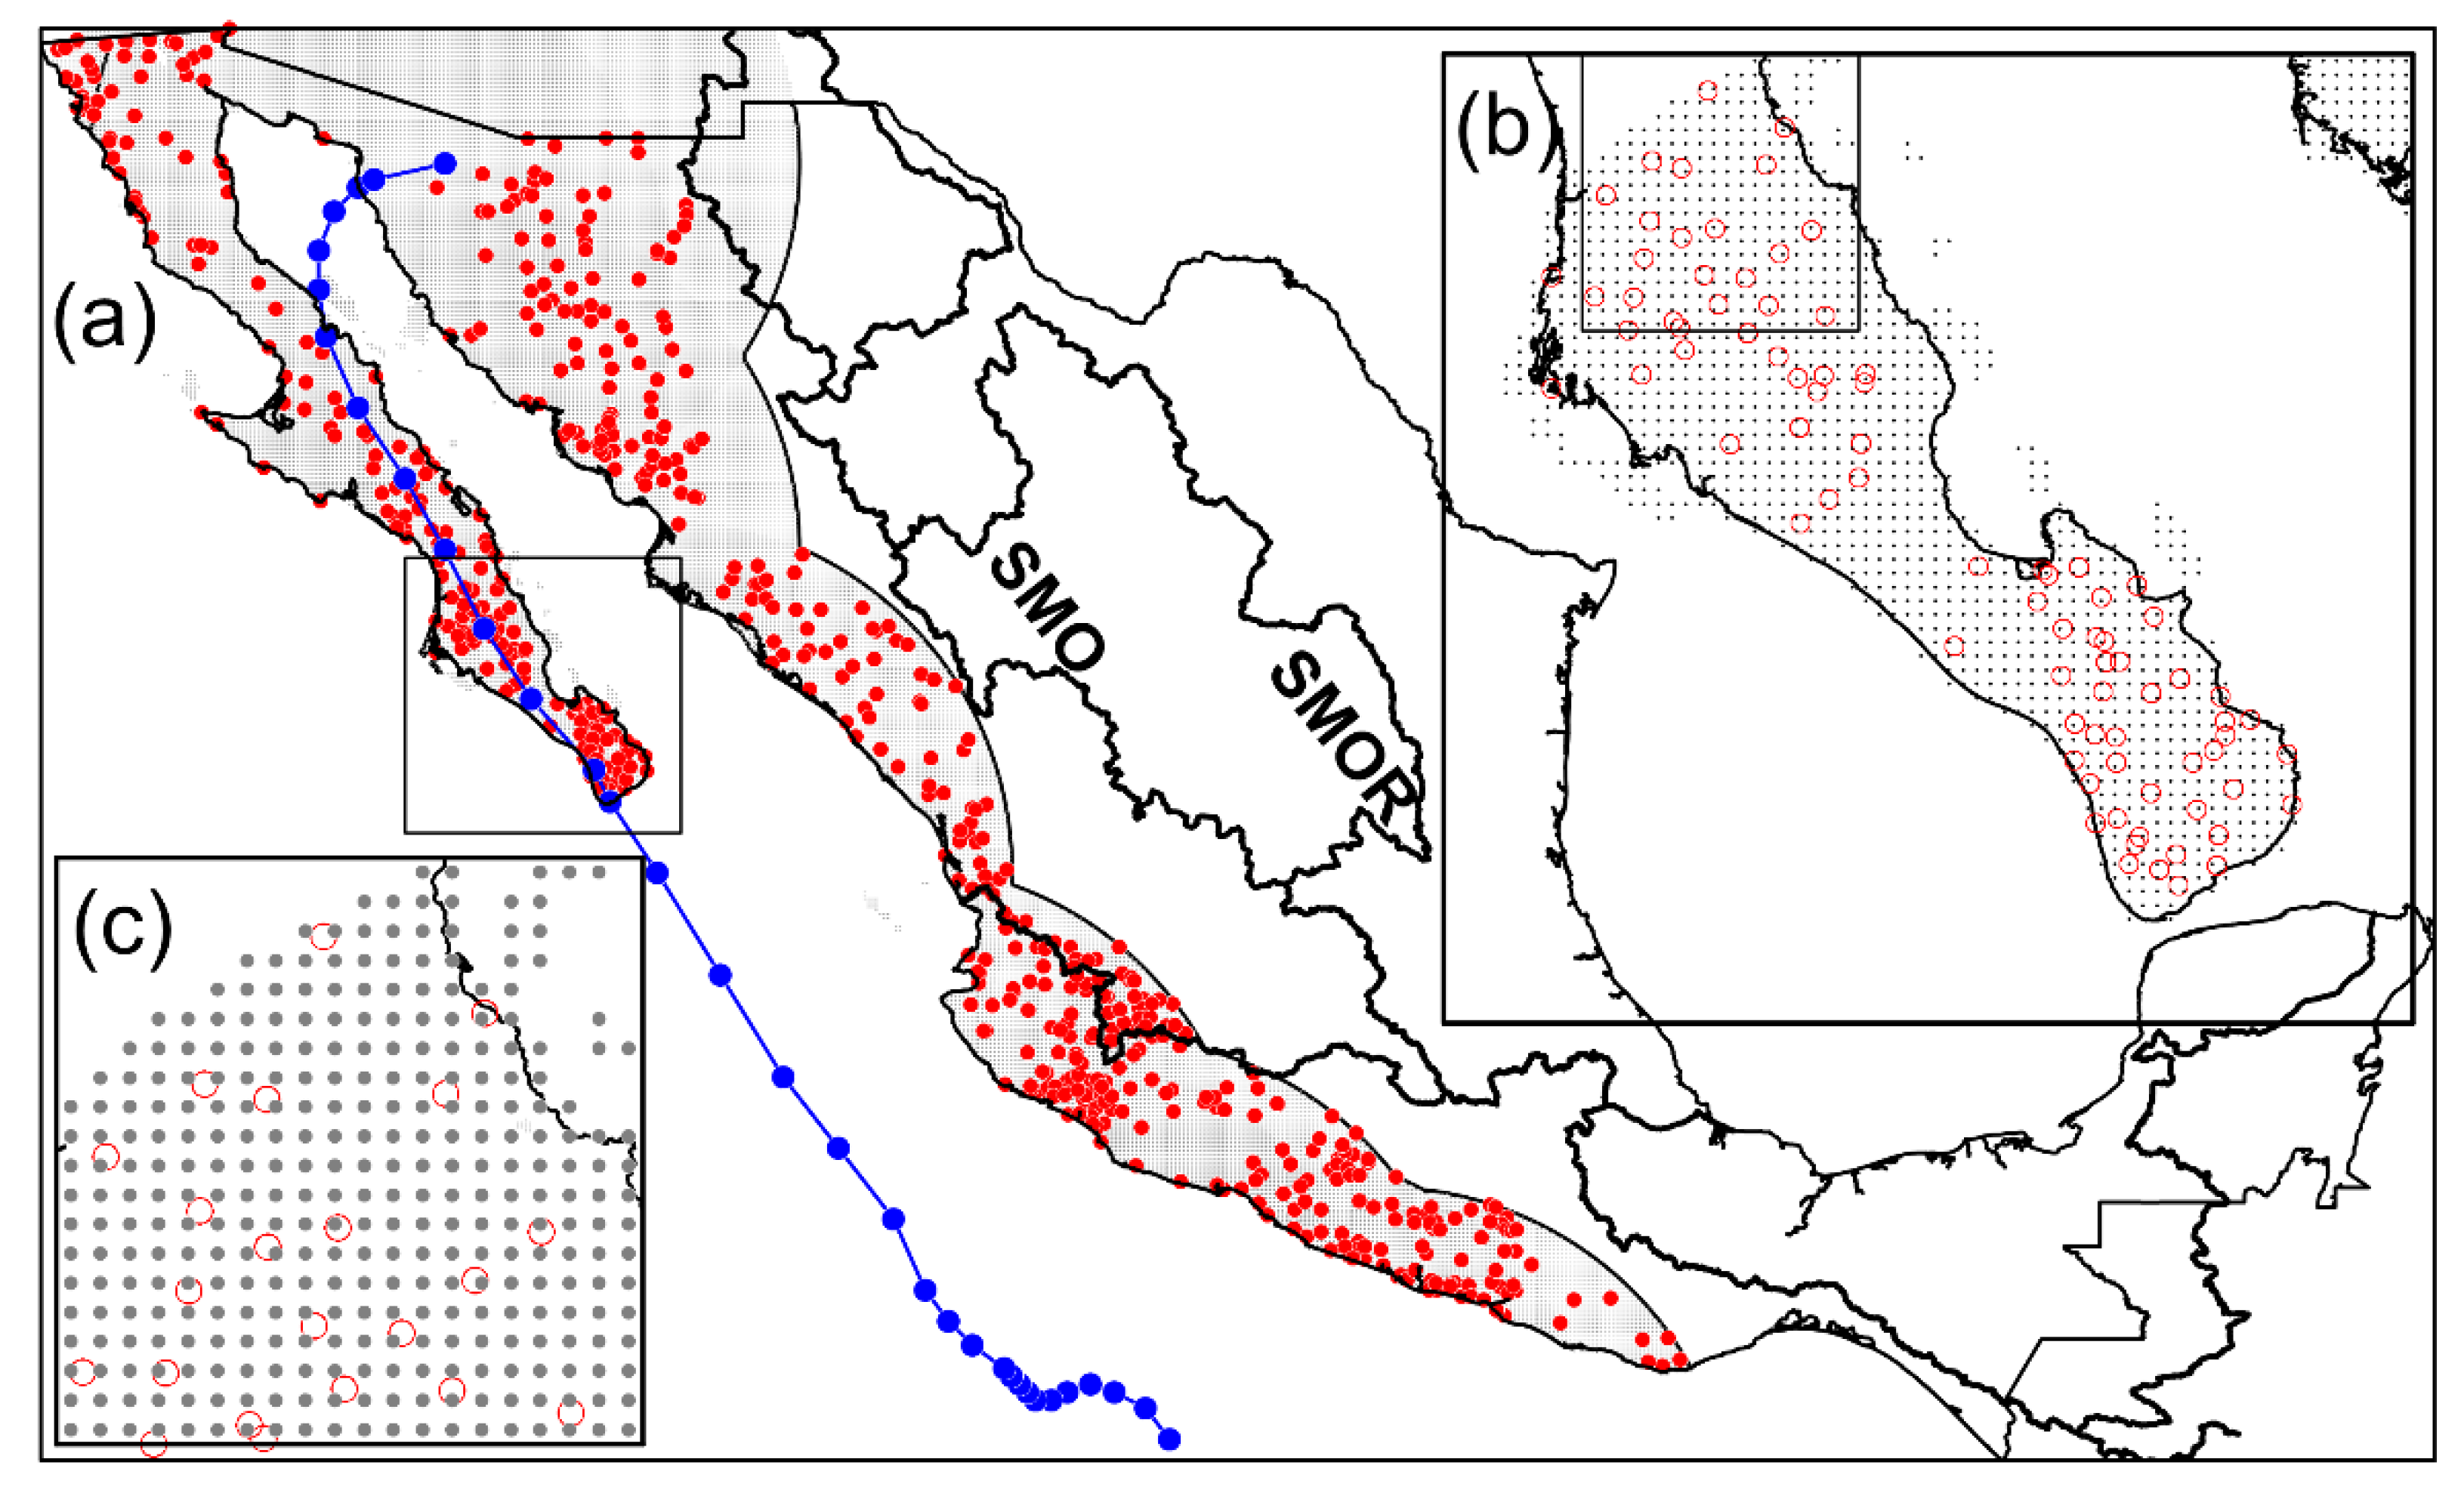
Figure 3.
Relationship between accumulated precipitation from observations and CHIRPS, for hurricane tracks in the eastern Pacific basin. Dashed line on each plot represents the 1:1 relationship. R=correlation coefficient, SD=standard deviation. Blue (red) dots indicate data pairs where CHIRPS estimates are one SD higher (lower) than the corresponding observations.
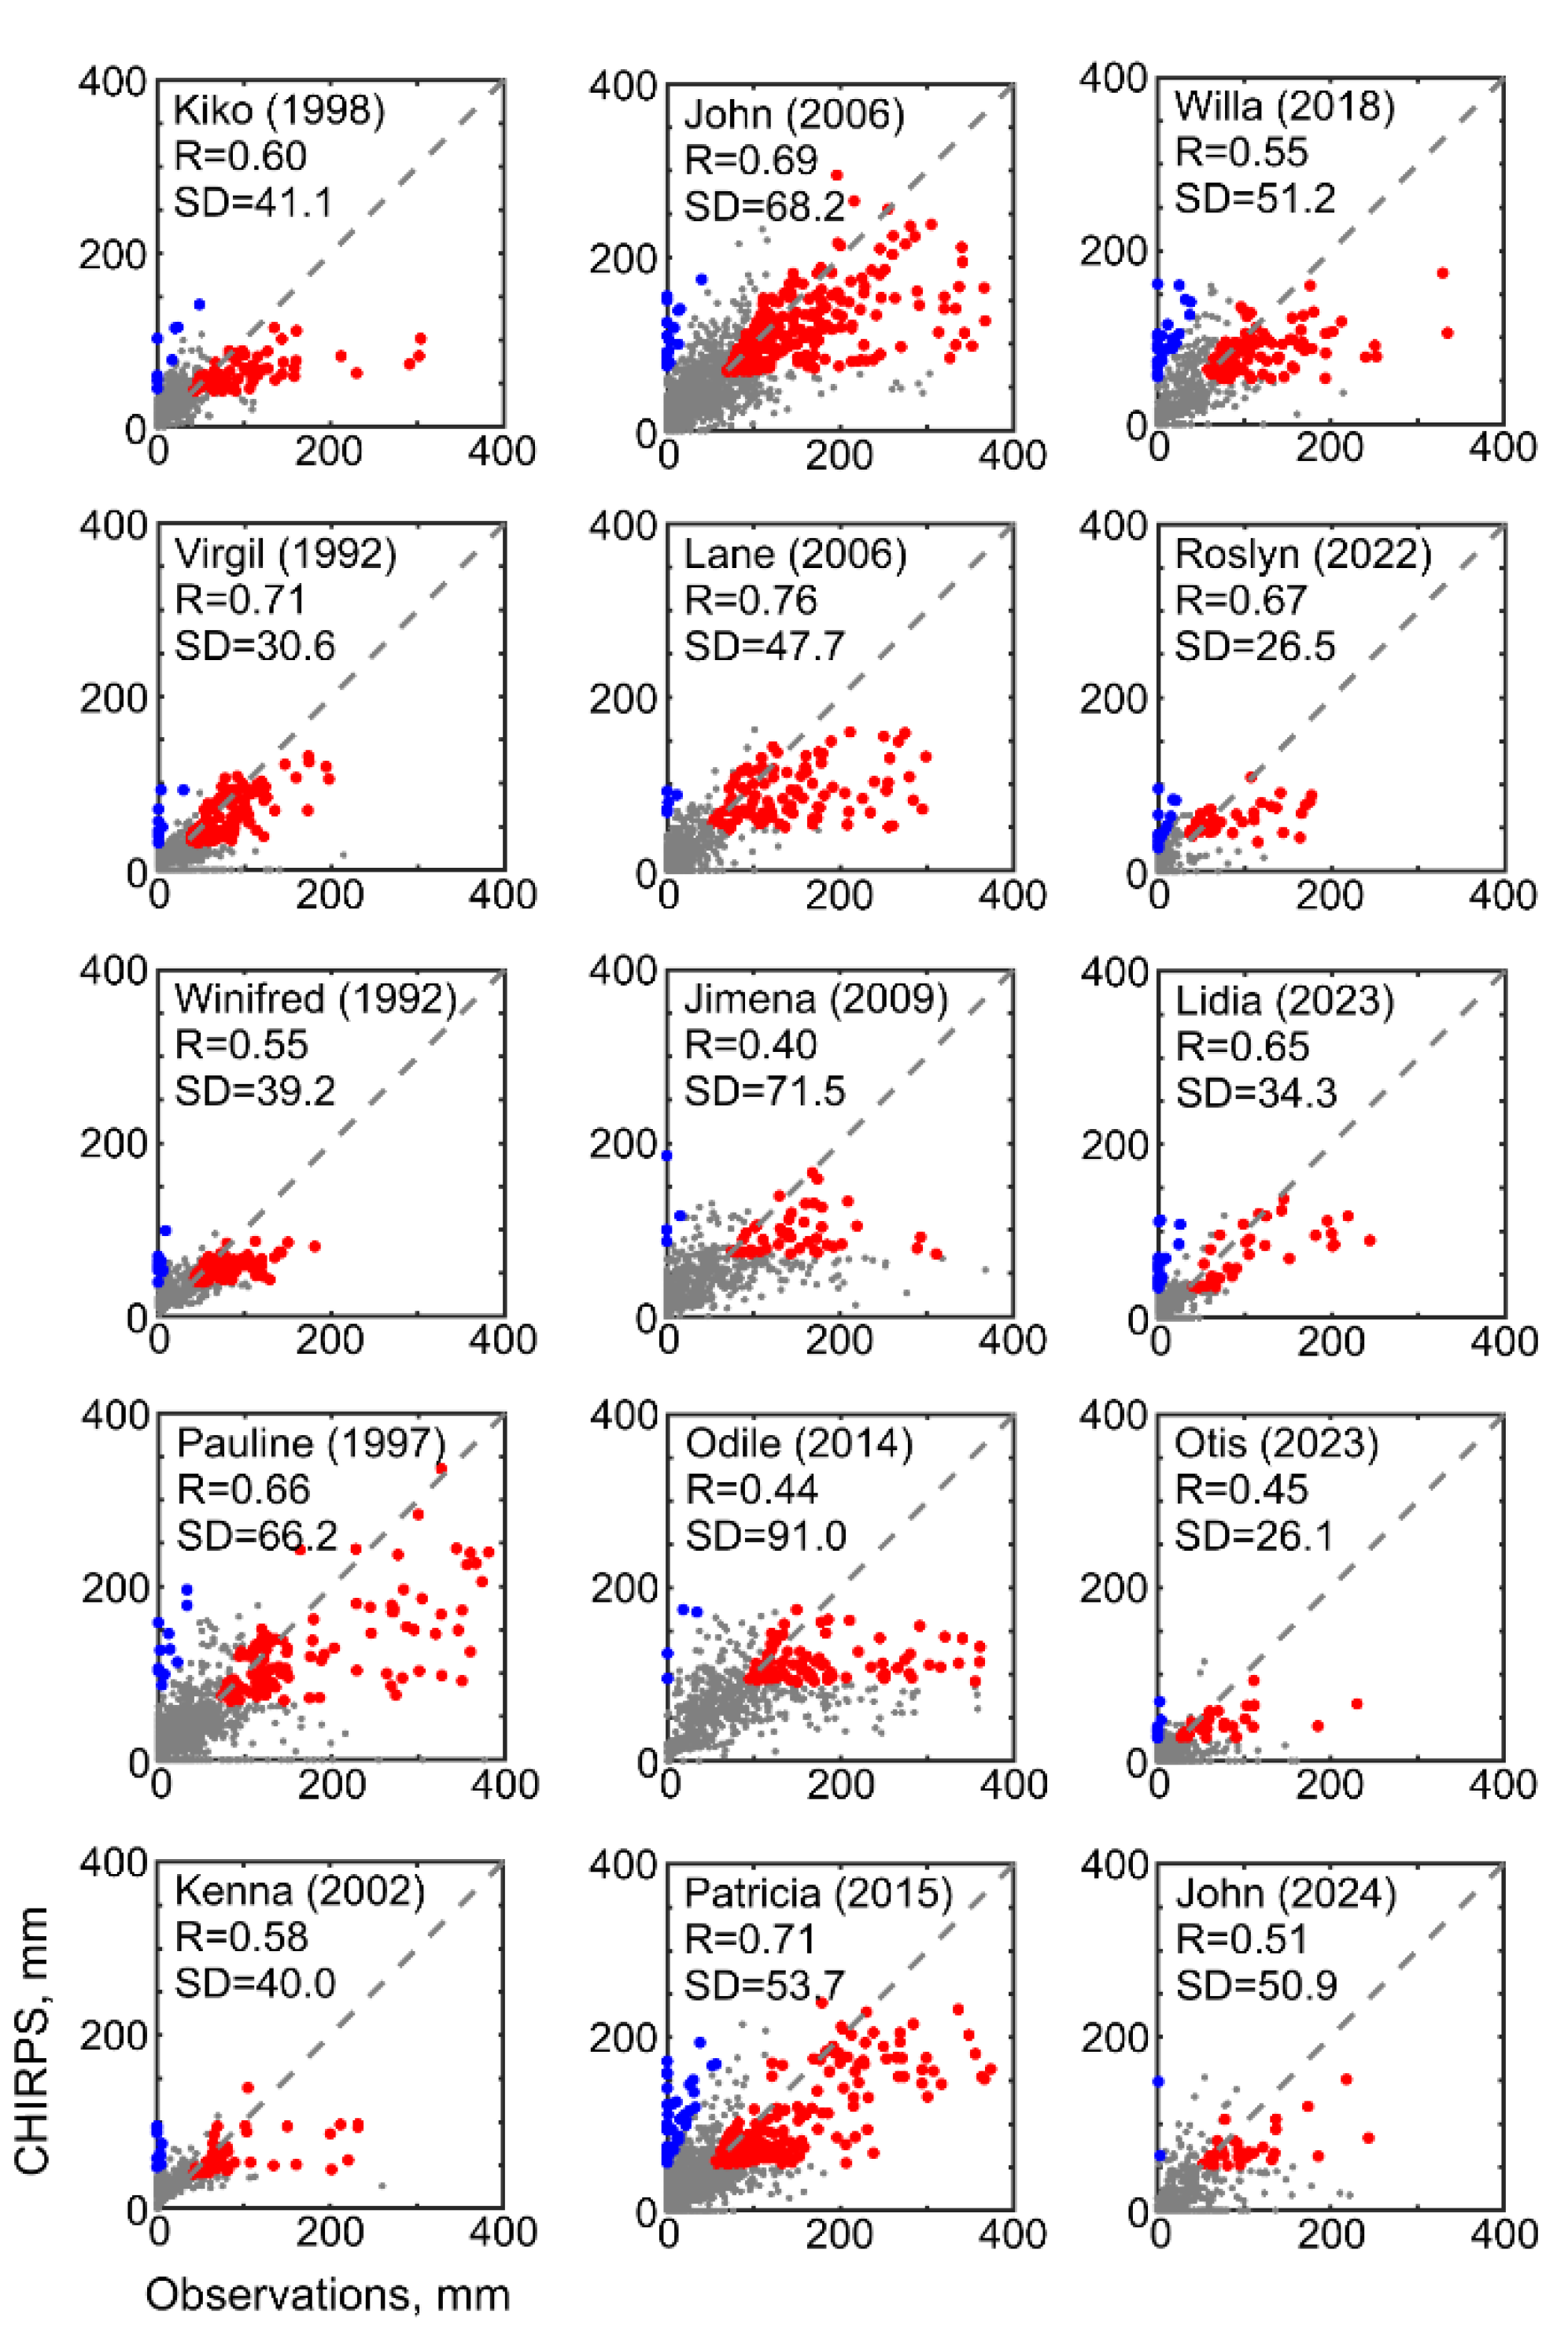
Figure 4.
Relationship between accumulated precipitation from observations and CHIRPS, for TCs in the Atlantic basin. Dashed line in each plot represents the 1:1 relationship. R=correlation coefficient, SD=standard deviation. Blue (red) dots indicate data pairs where CHIRPS estimates are one SD higher (lower) than the corresponding observations.
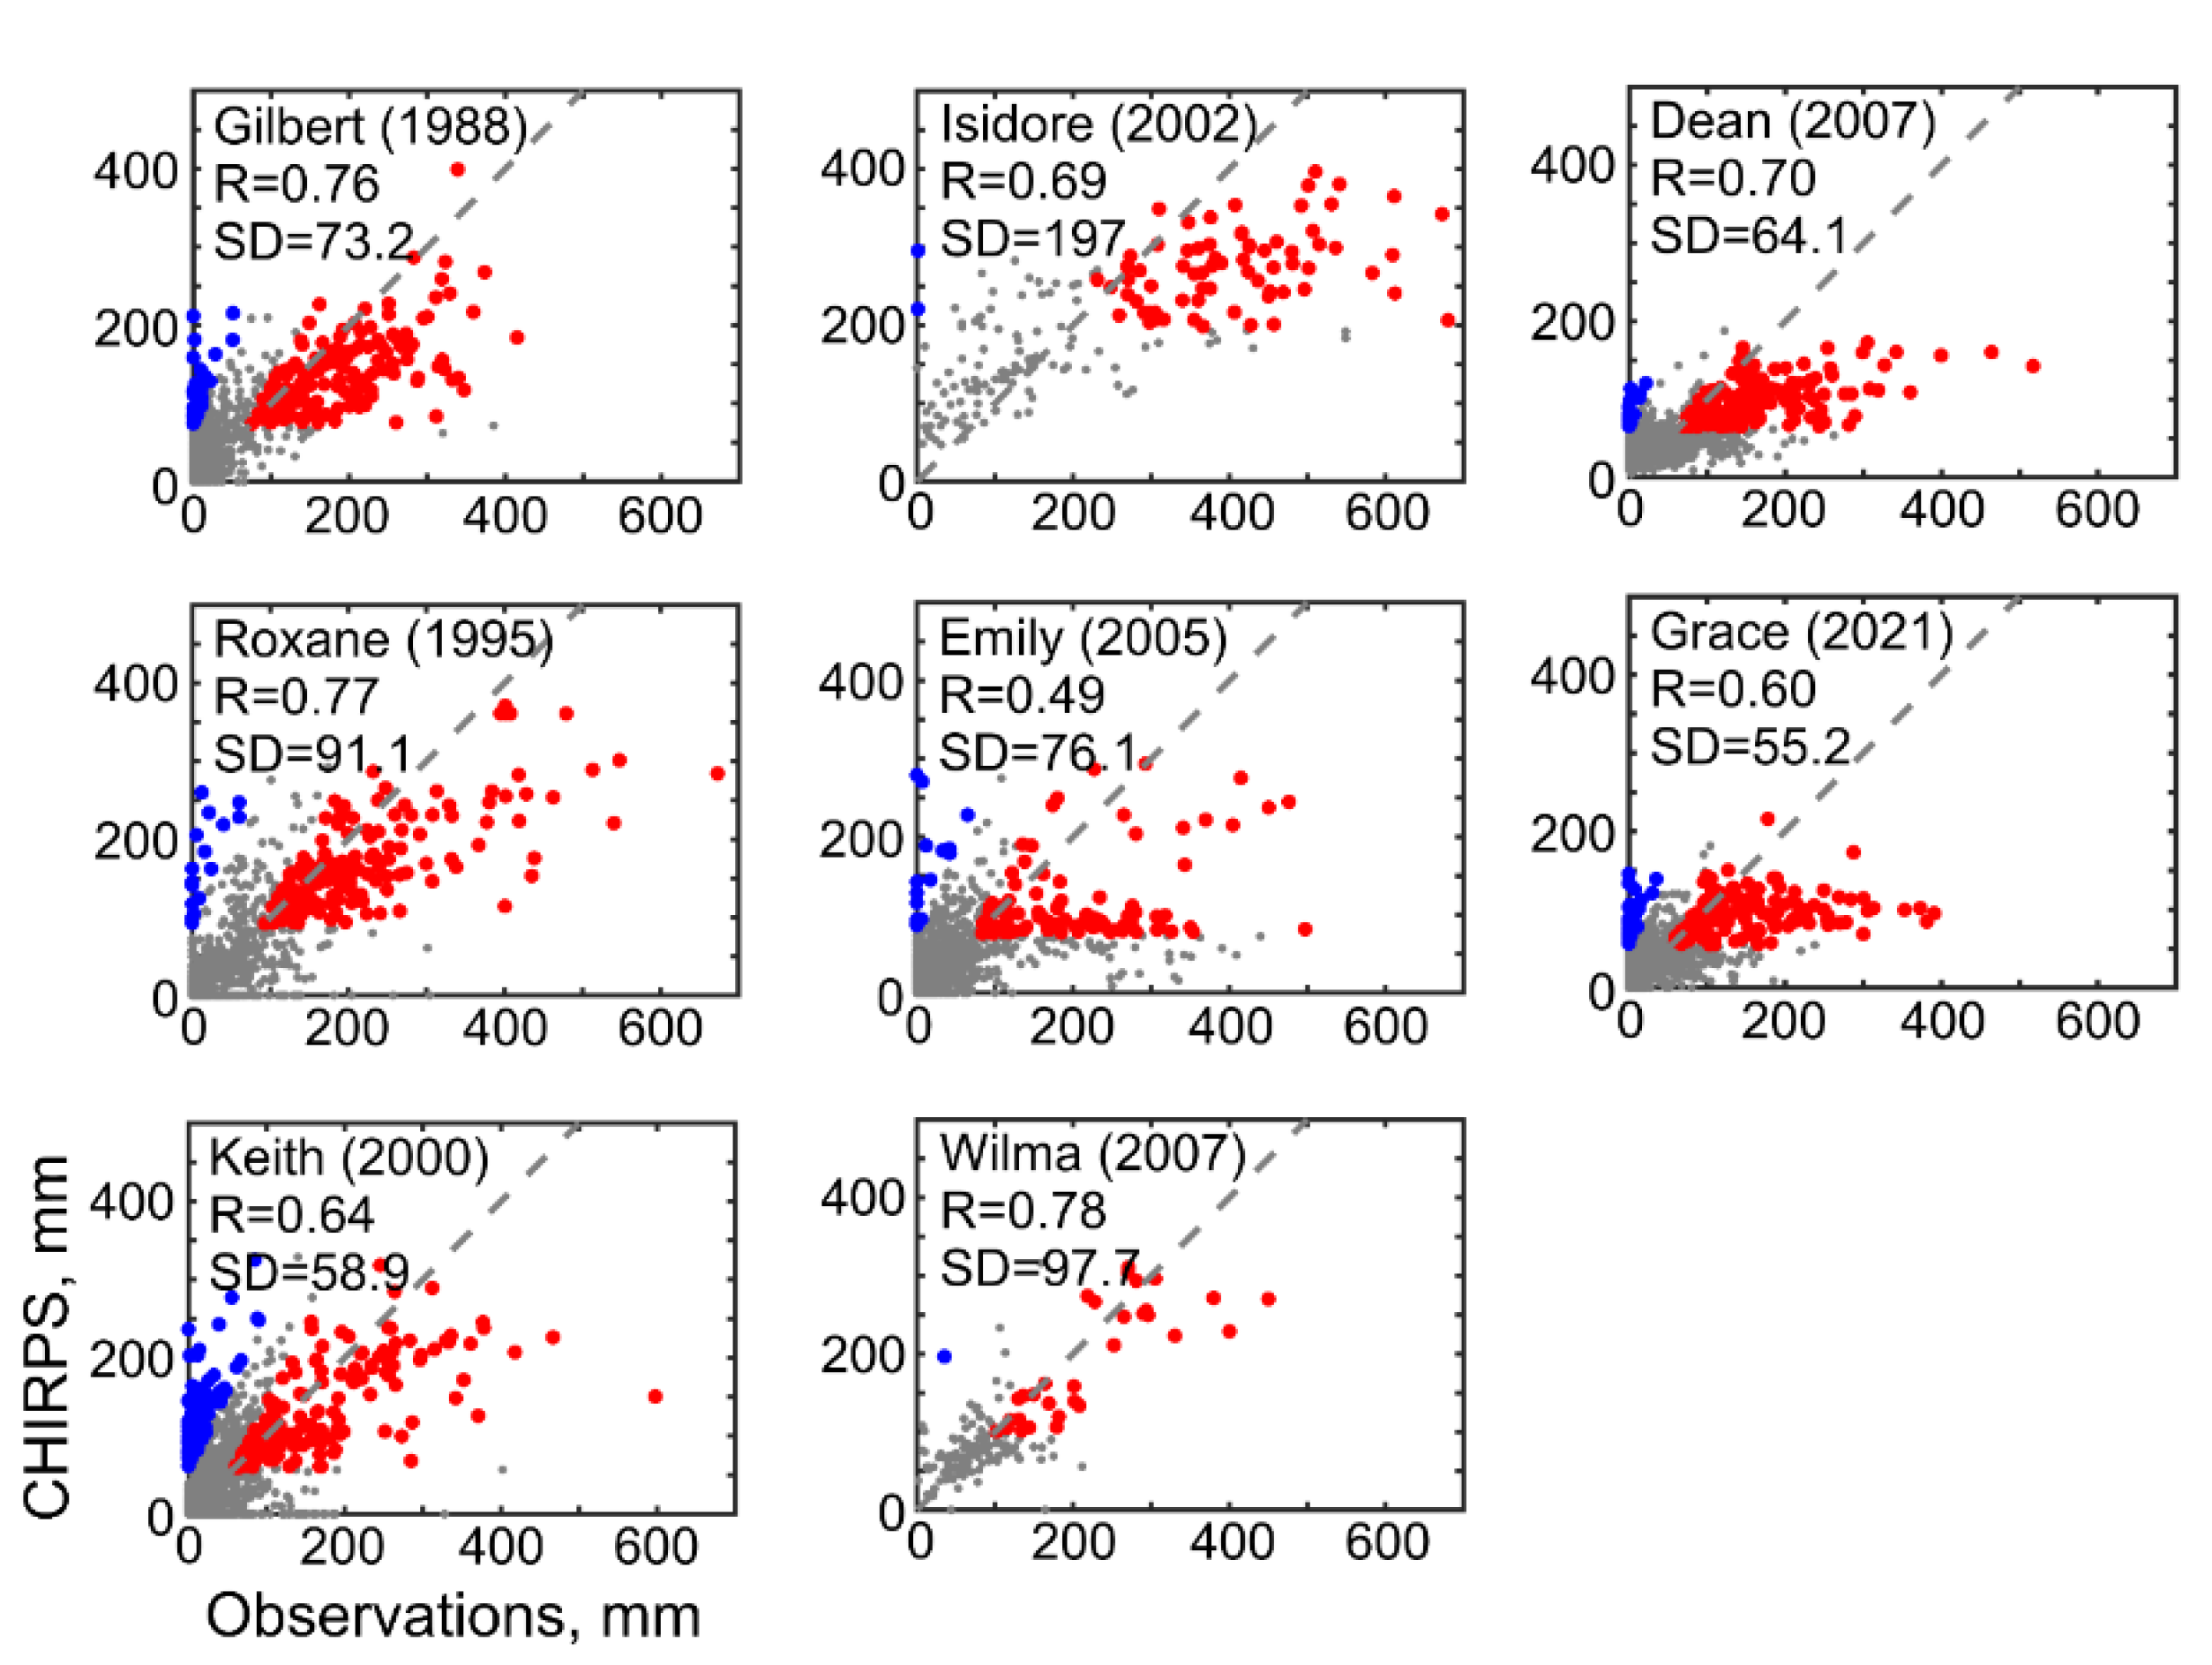
Figure 5.
Contour maps of accumulated precipitation throughout the entire path of Tropical Cyclone Roslyn (October 20–24, 2022) according to the CHIRPS dataset and observations from Mexico’s meteorological service.
Figure 5.
Contour maps of accumulated precipitation throughout the entire path of Tropical Cyclone Roslyn (October 20–24, 2022) according to the CHIRPS dataset and observations from Mexico’s meteorological service.
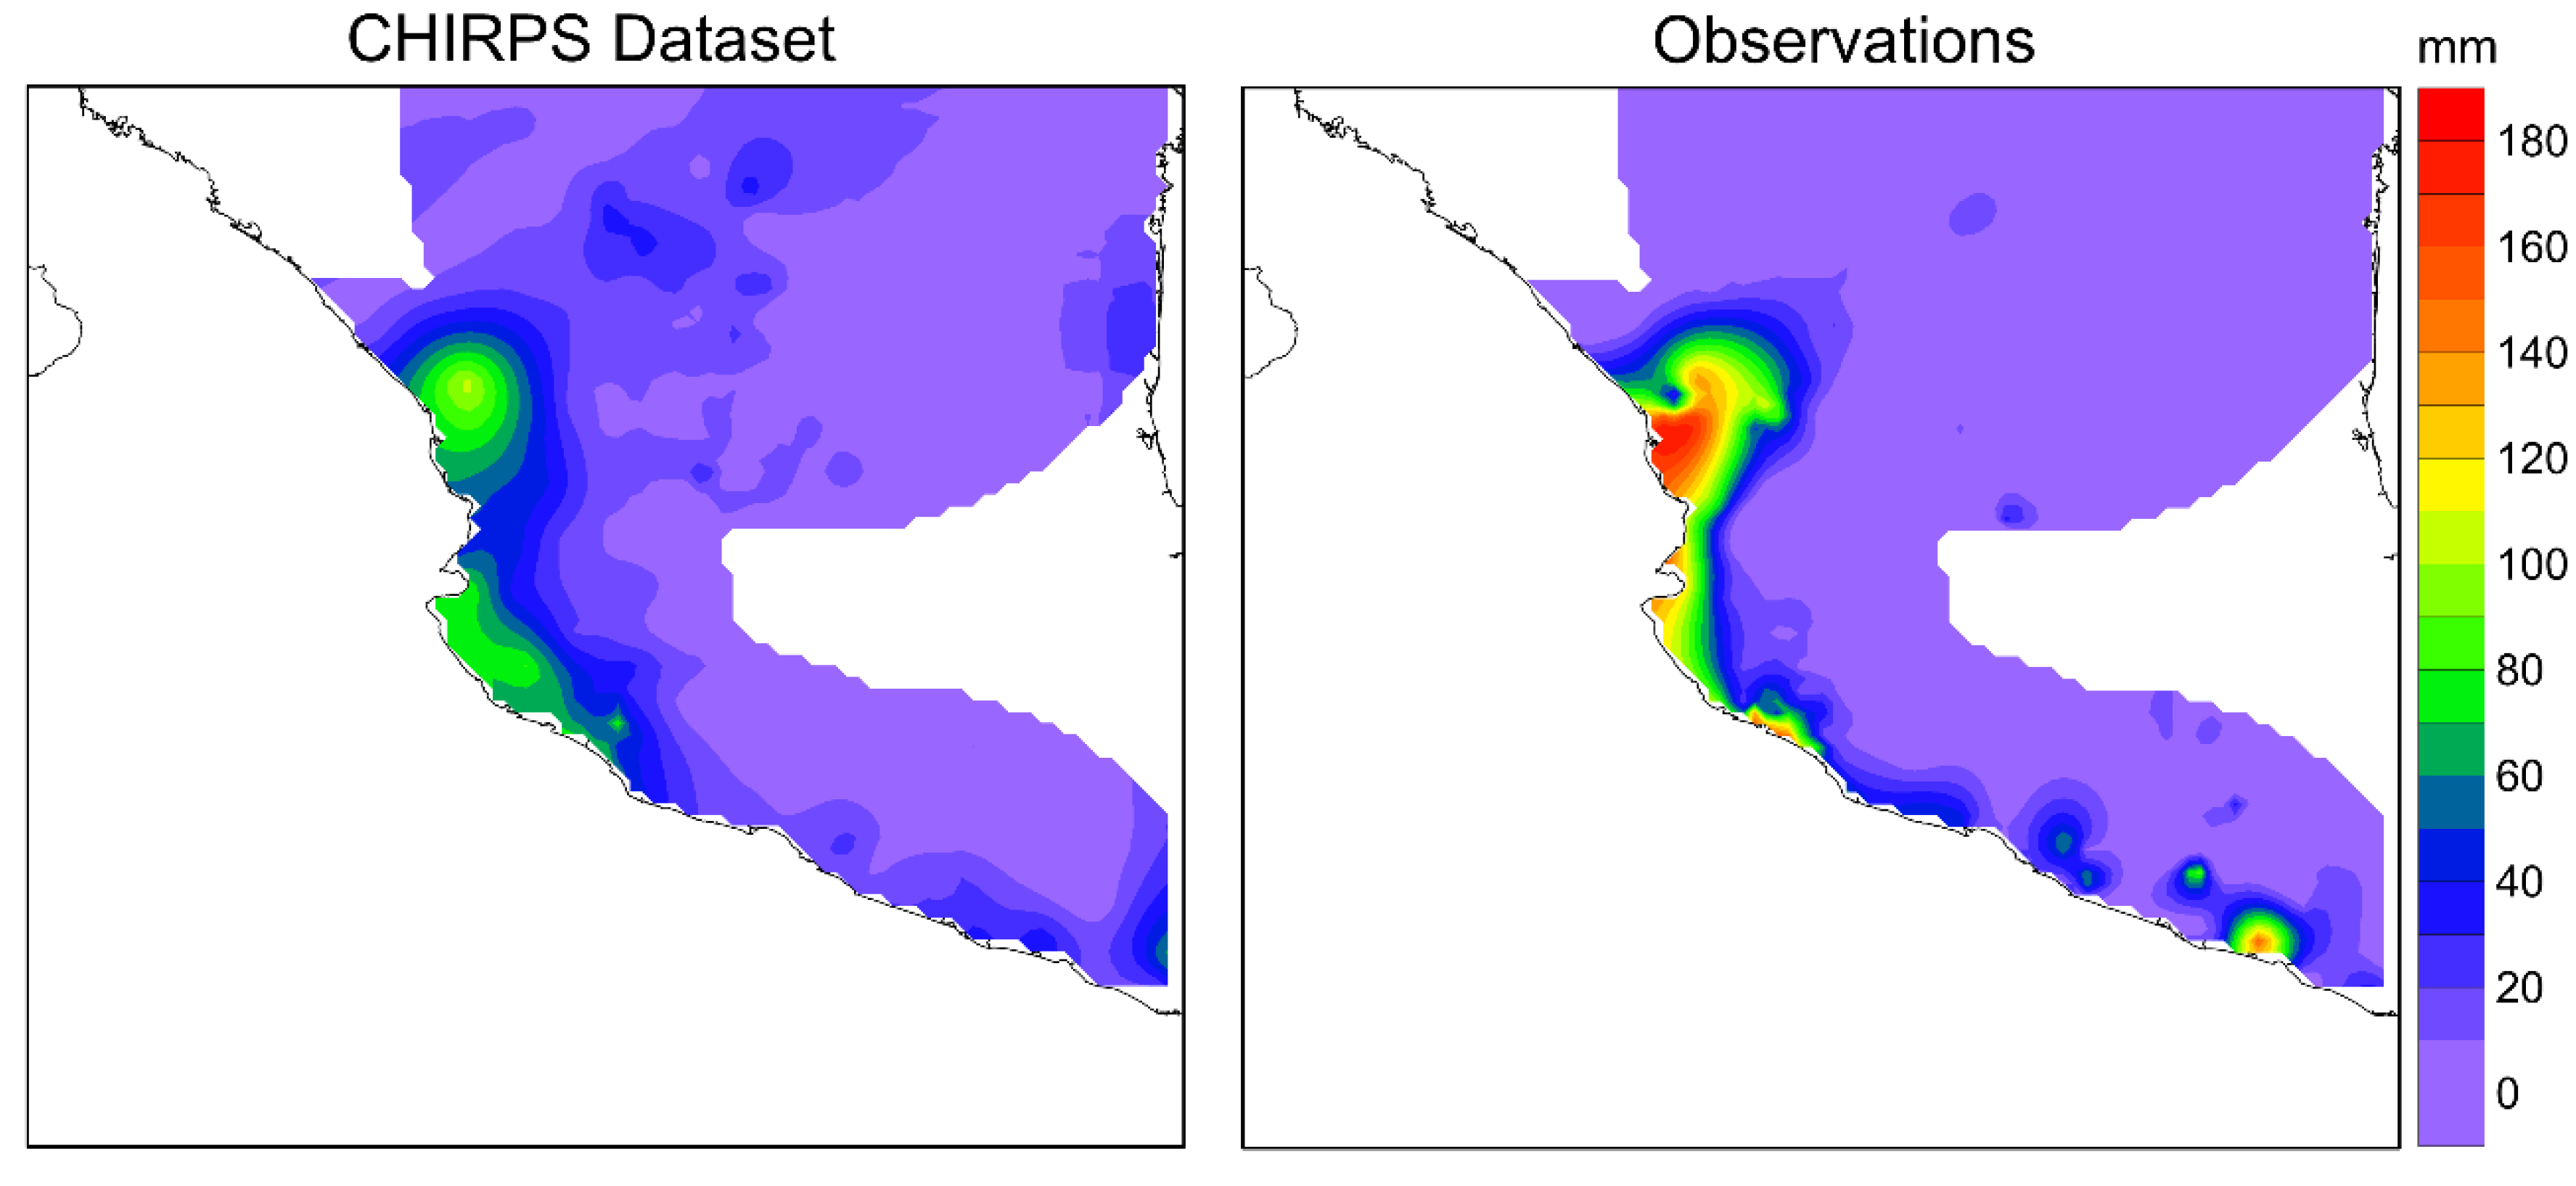
Figure 6.
Contour maps of accumulated precipitation throughout the entire path of Tropical Cyclone Gilbert (September 14–18, 1988) according to CHIRPS and observations from Mexico’s meteorological service.
Figure 6.
Contour maps of accumulated precipitation throughout the entire path of Tropical Cyclone Gilbert (September 14–18, 1988) according to CHIRPS and observations from Mexico’s meteorological service.
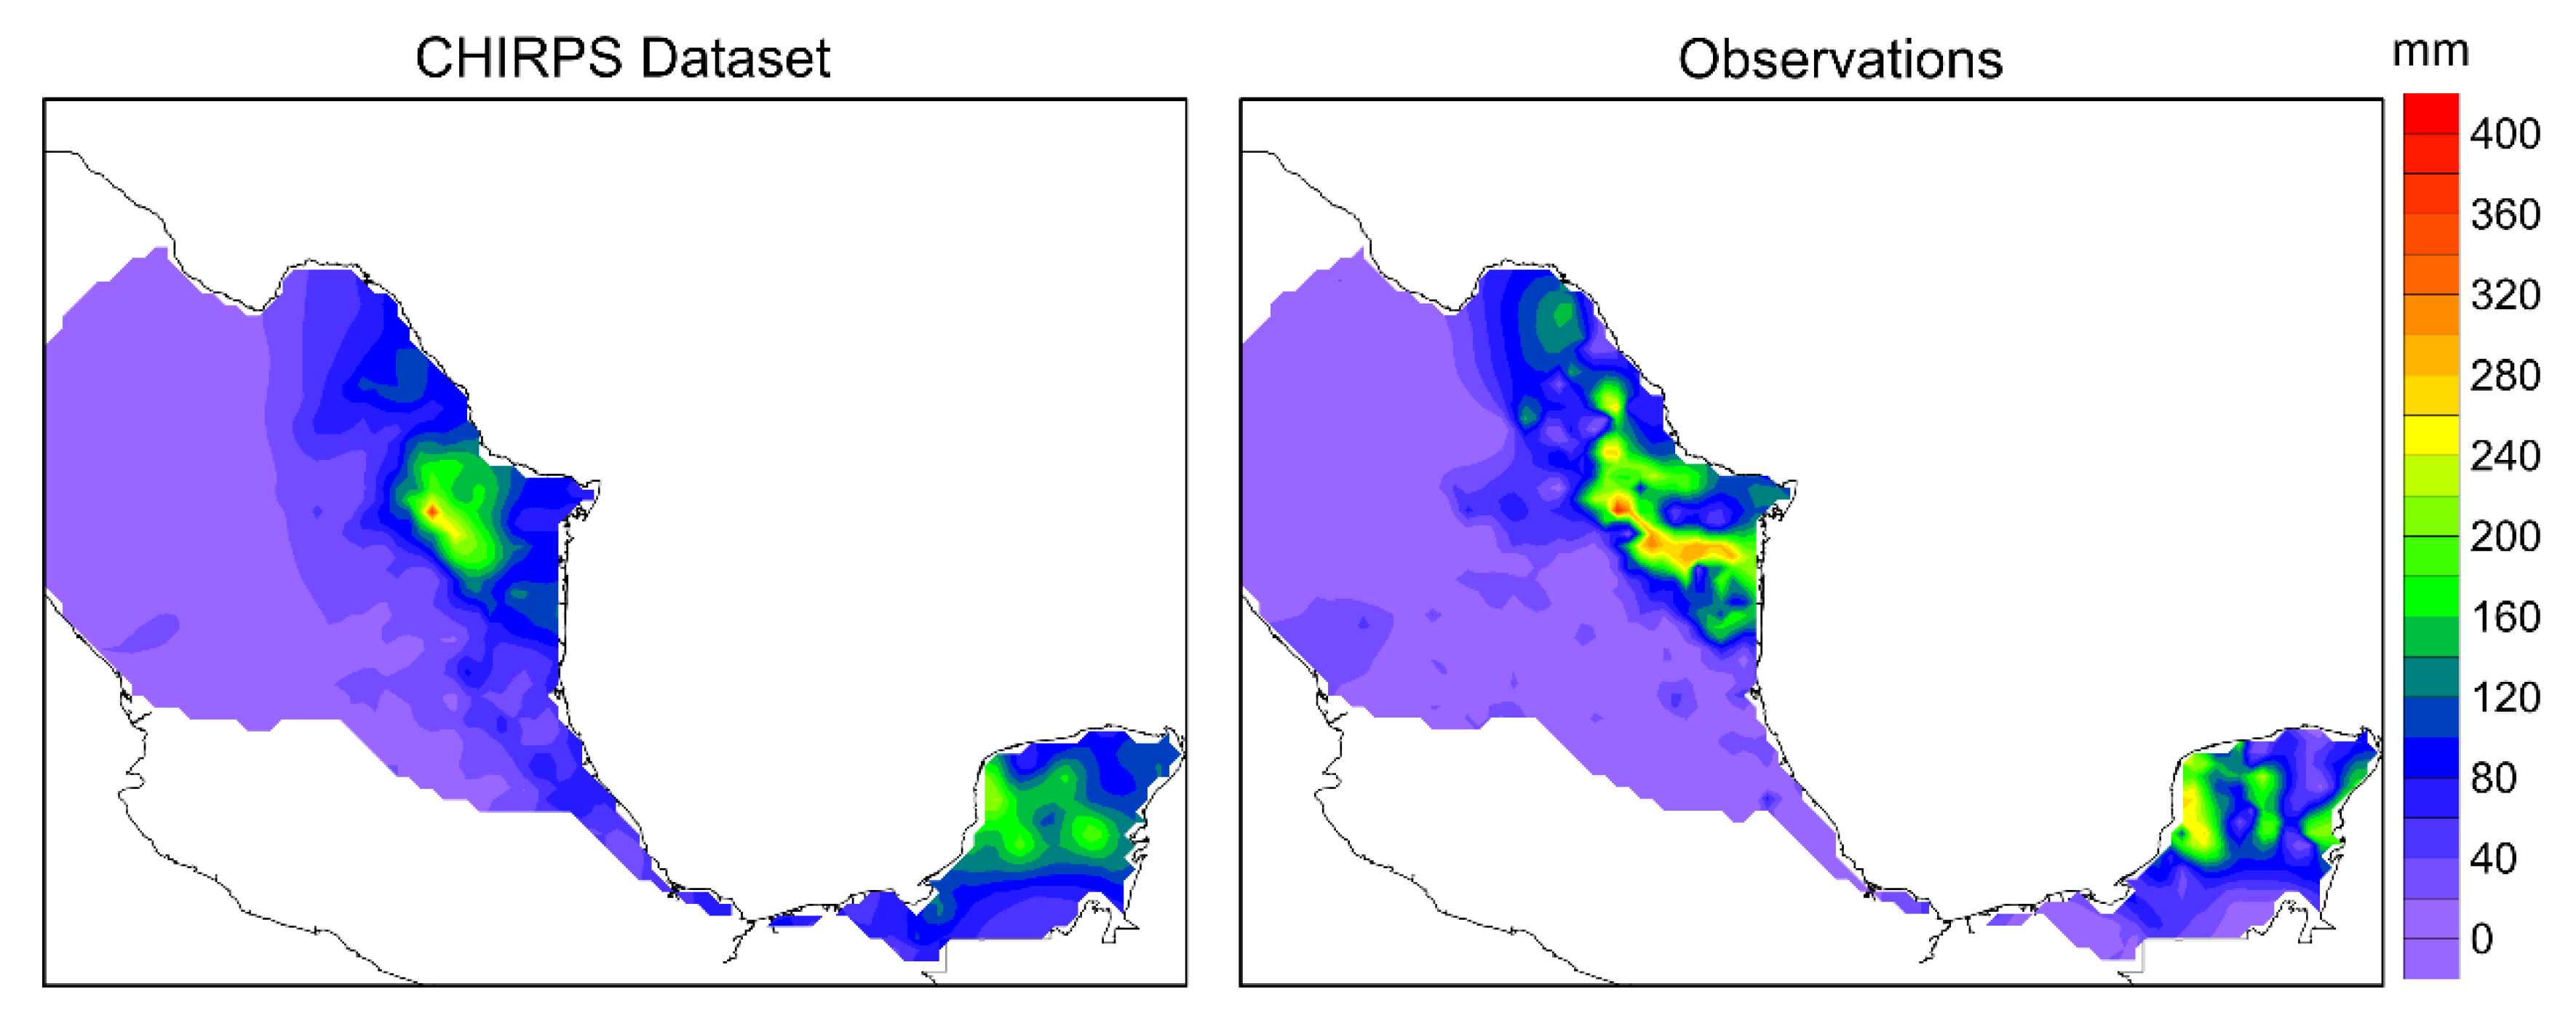
Figure 7.
Precipitation contour maps for each day of Tropical Cyclone Keith (September 30–October, 5, 2000), based on data from three sources: (left) the CHIRPS gridded dataset, (middle) CHIRPS grid cell values nearest to each weather station (“pixel records”), and (right) observations.
Figure 7.
Precipitation contour maps for each day of Tropical Cyclone Keith (September 30–October, 5, 2000), based on data from three sources: (left) the CHIRPS gridded dataset, (middle) CHIRPS grid cell values nearest to each weather station (“pixel records”), and (right) observations.
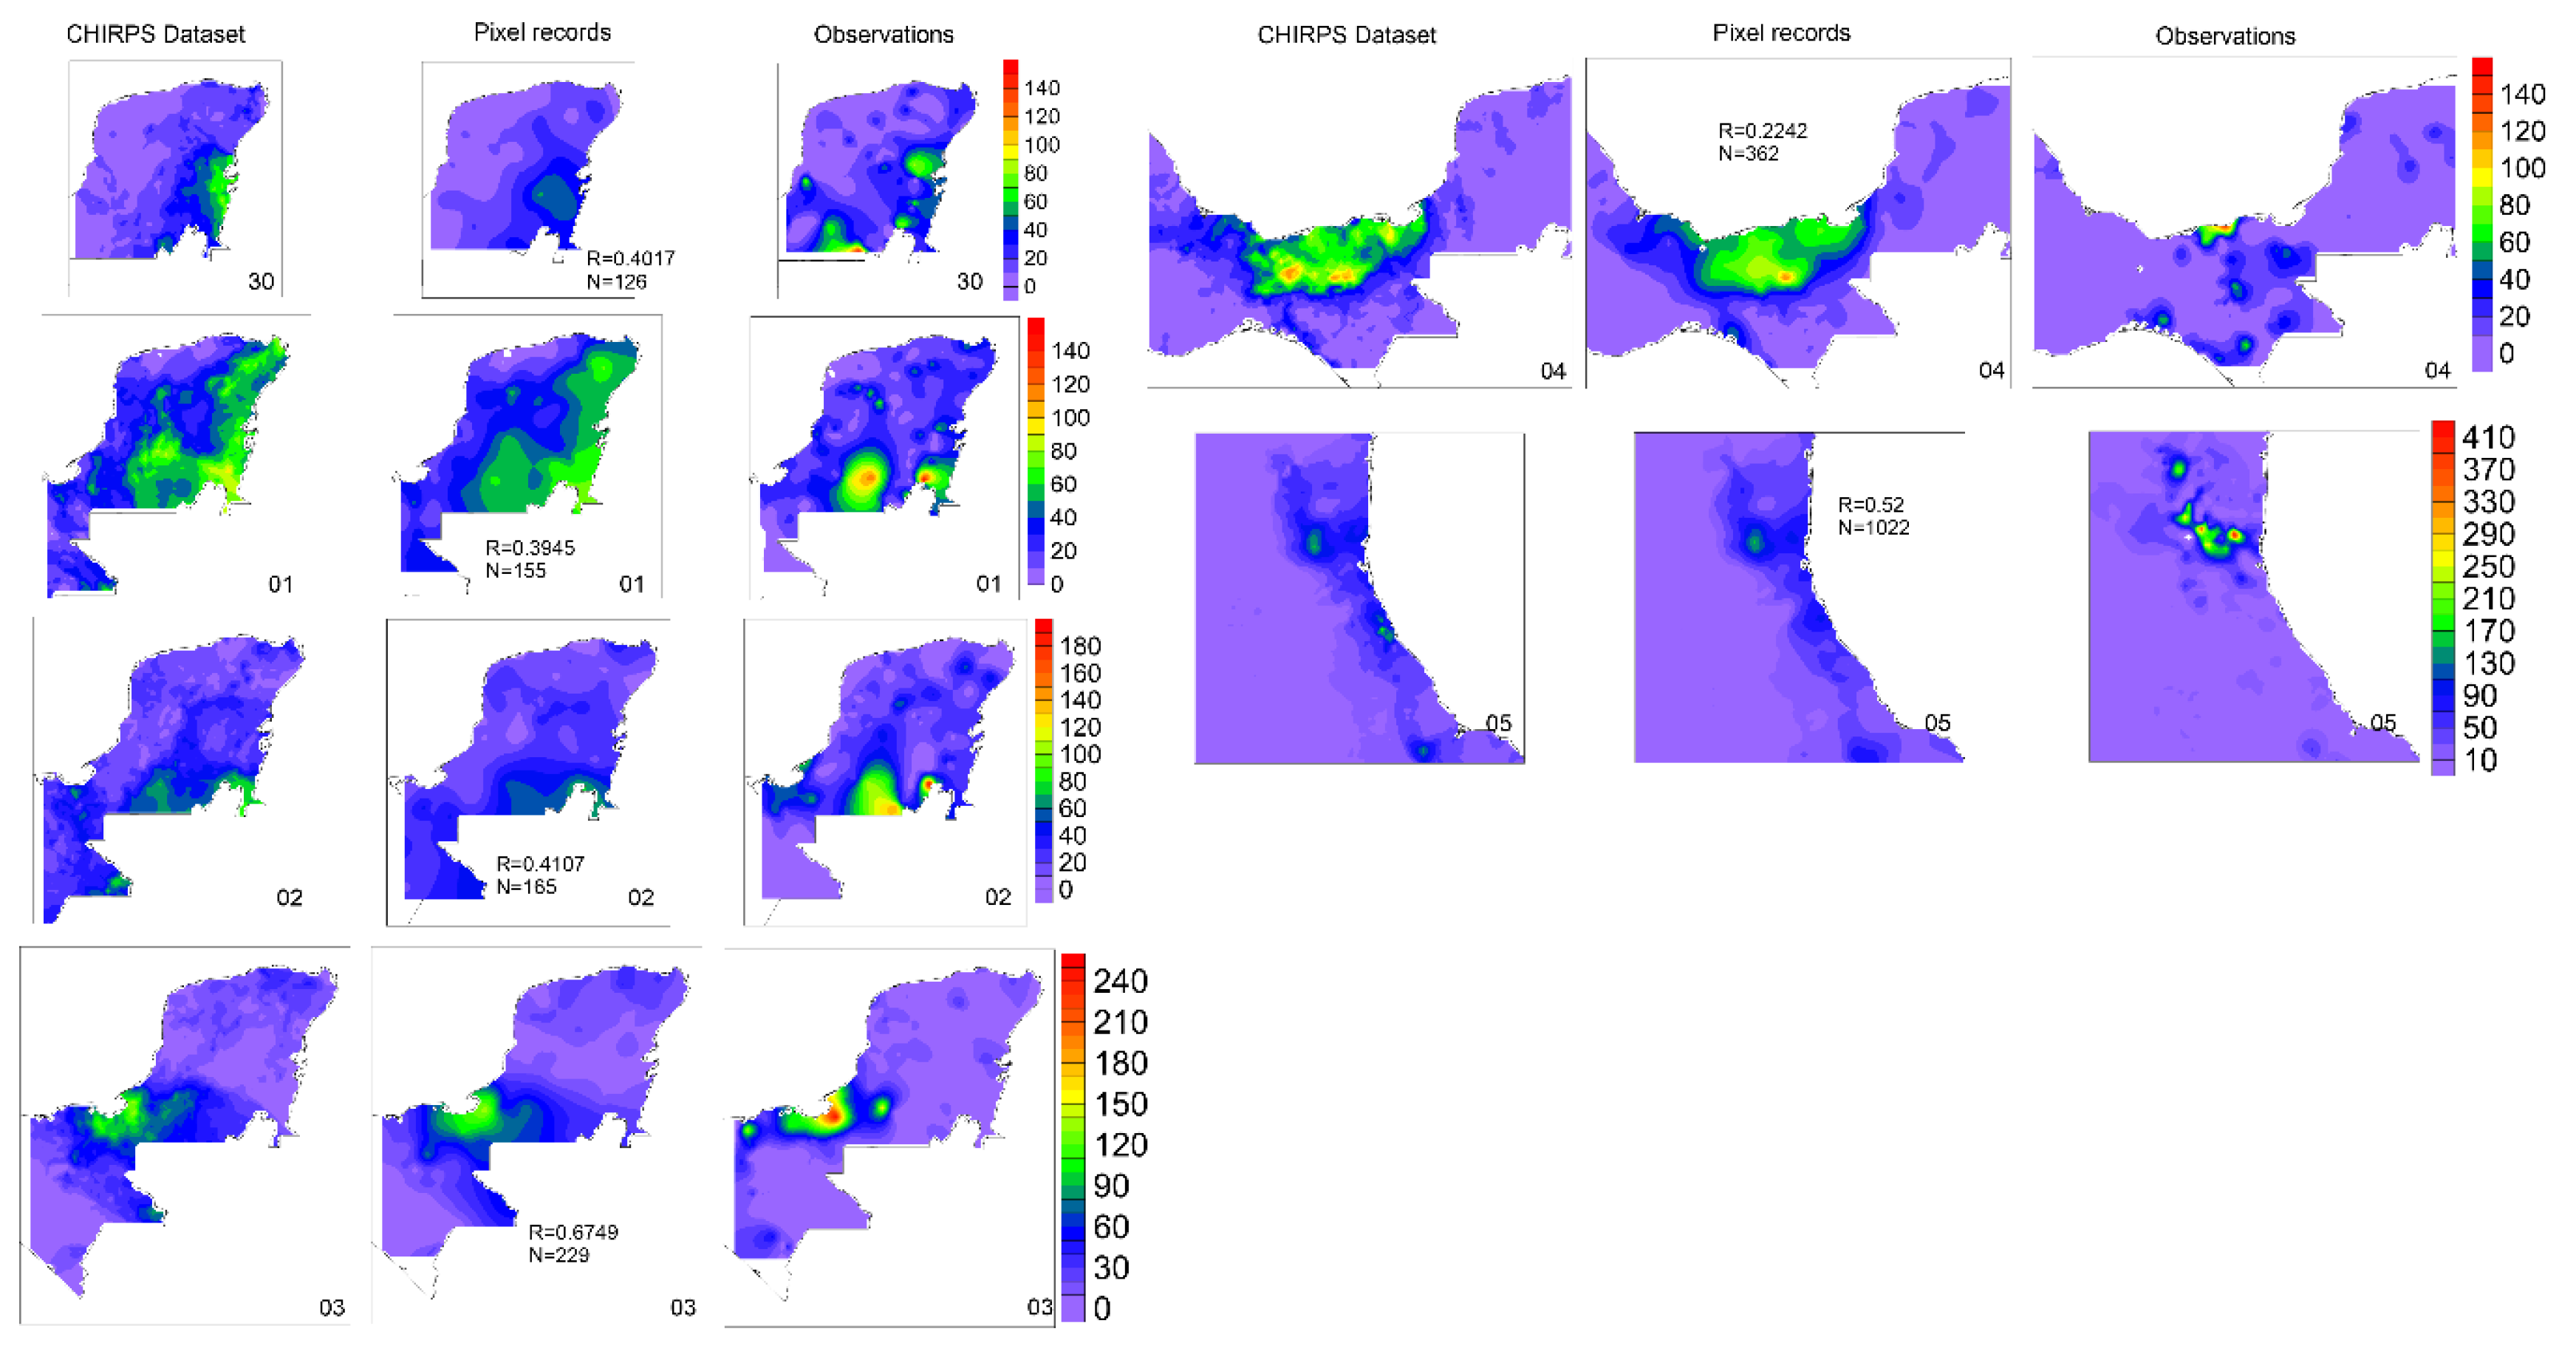
Figure 8.
Track of Hurricane Otis and the corresponding affected area. Insert panels display the relationship between precipitations (mm) from observations and CHIRPS data corresponding to each day of the hurricane track (at 12:00 UTC) whose category is displayed according to the color bar (TD=tropical depression; TS=Tropical storm; and H1–H5 categories). The black and dashed lines are the regression and 1:1 relationship lines, respectively. R=correlation coefficient, SD=Standard Deviation. Red (blue) points are pairs showing that estimated data from CHIRPS are one SD higher (lower) from the corresponding observation. Significant correlations are displayed in bold.
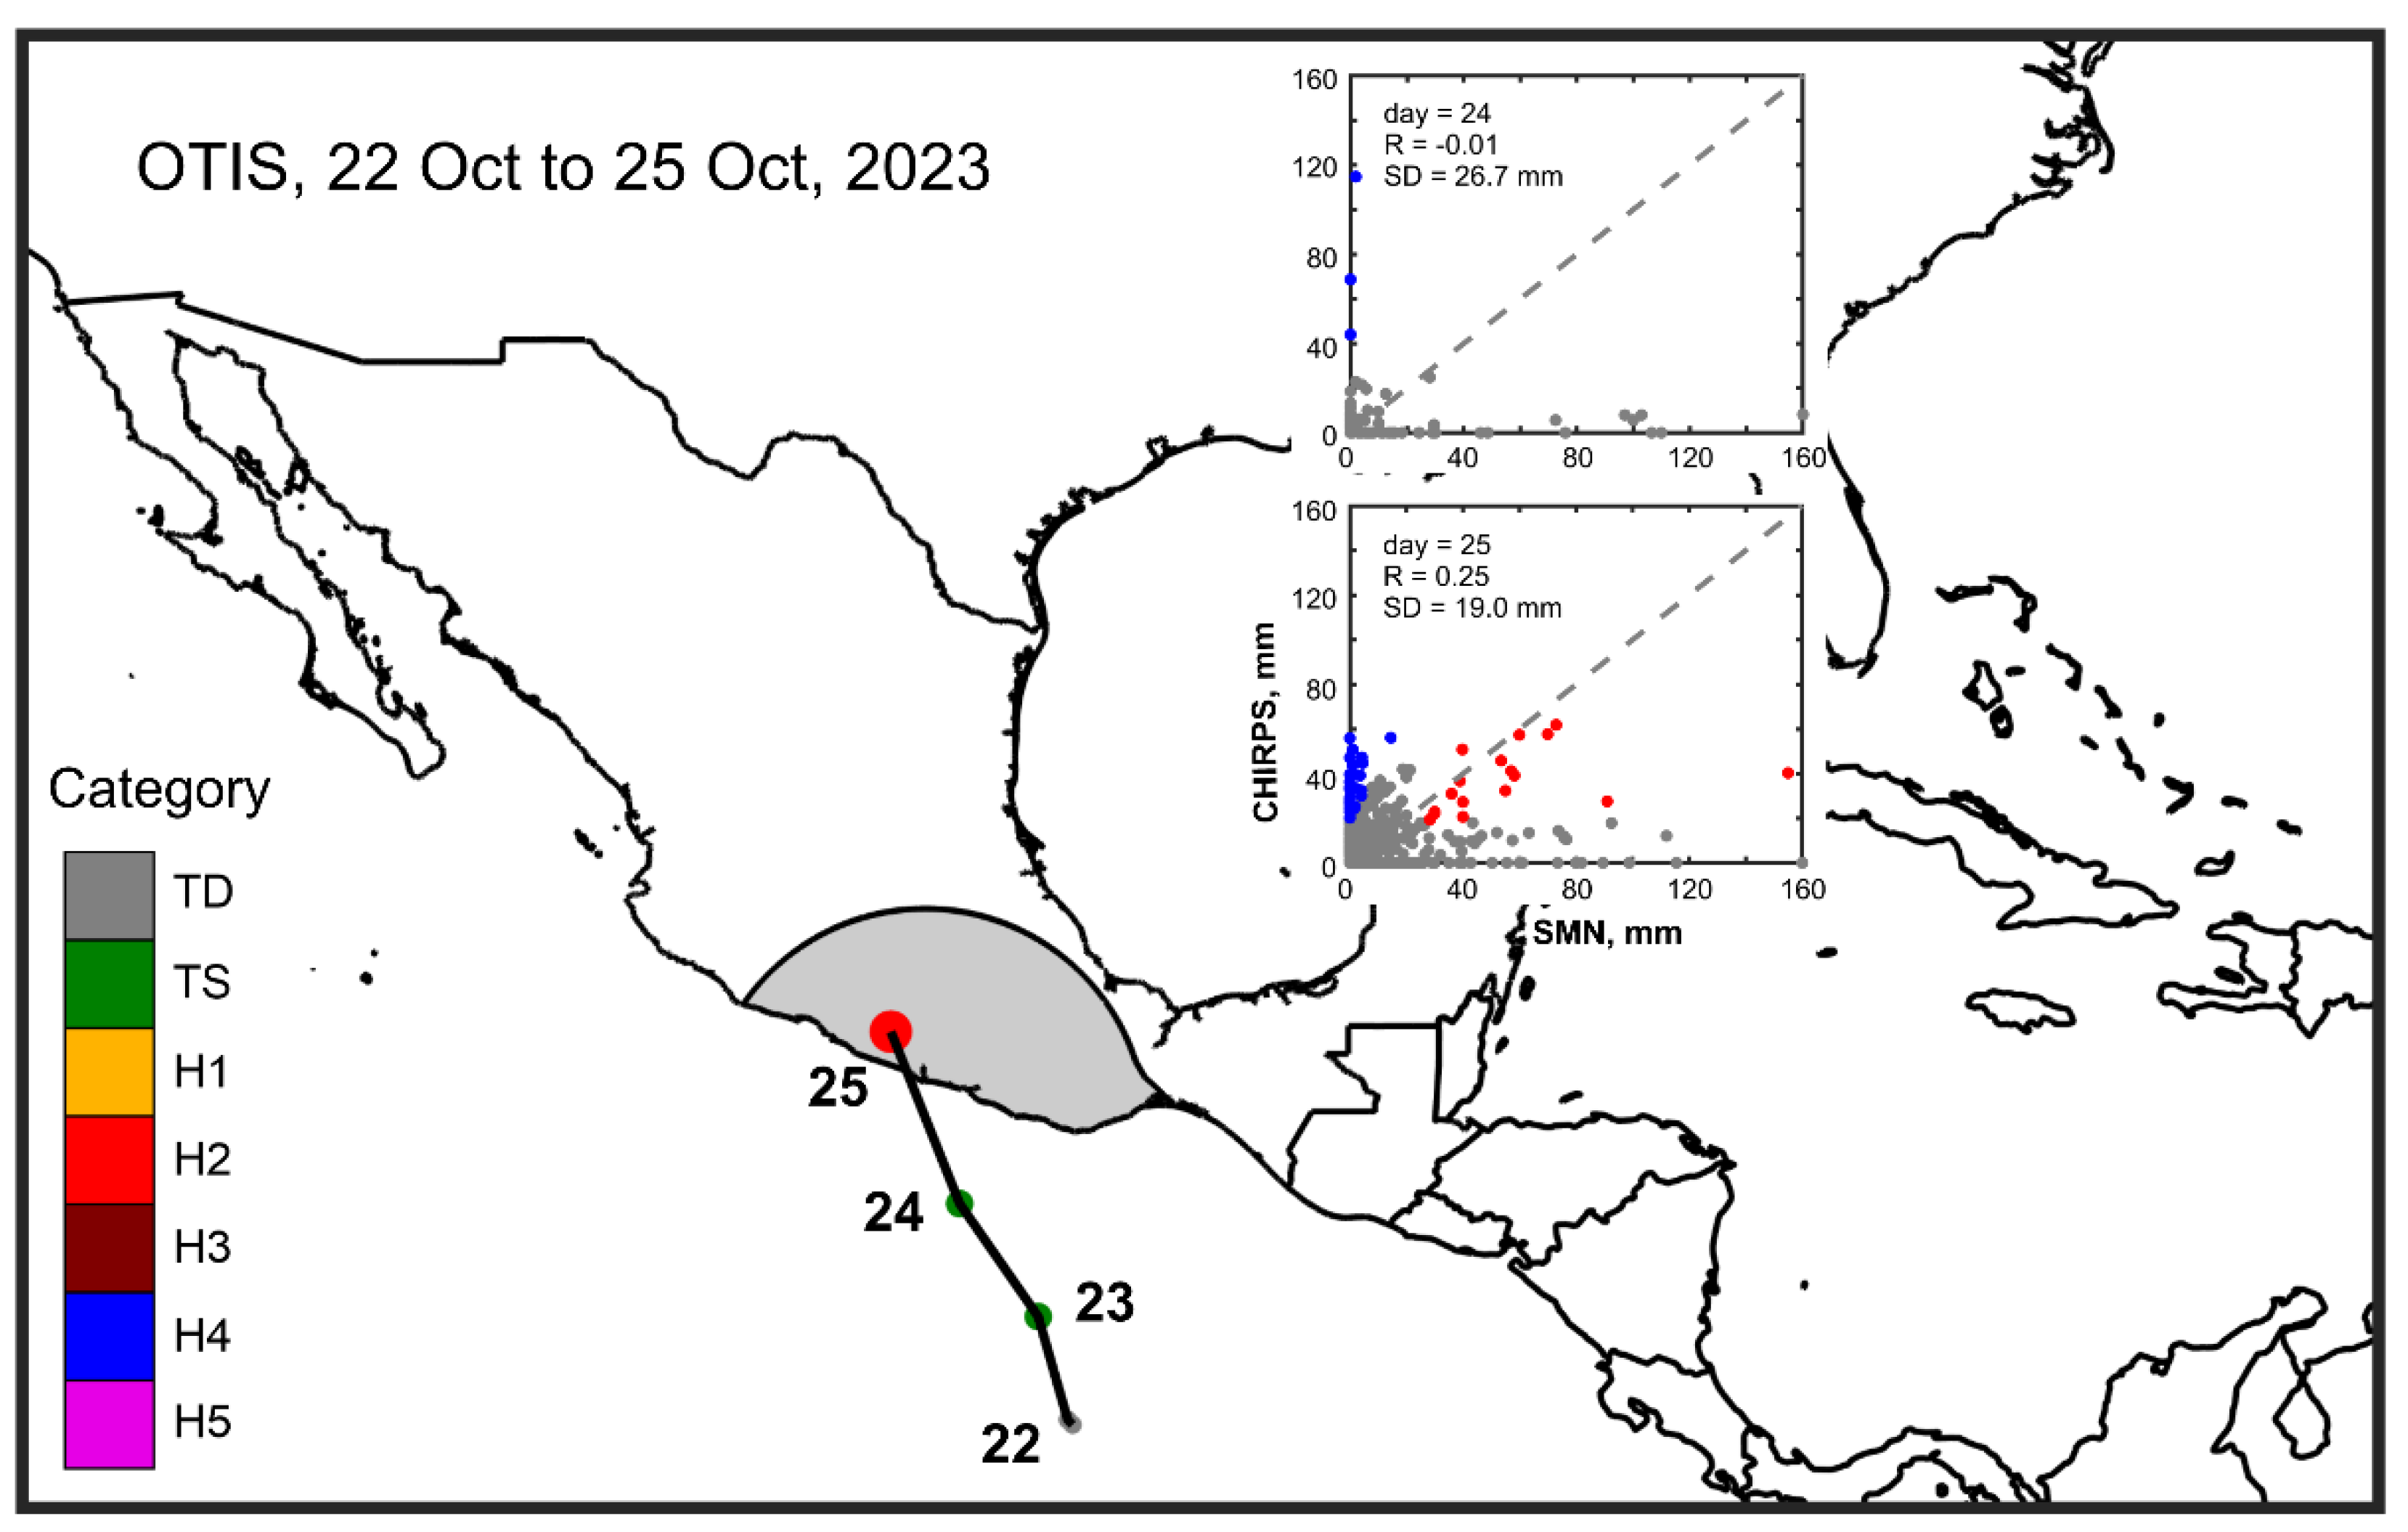
Figure 9.
Precipitation maps with data from CHIRPS (left column); pixel records (middle), and observations (right) for October 24–25, 2023 during the passage of Hurricane Otis.
Figure 9.
Precipitation maps with data from CHIRPS (left column); pixel records (middle), and observations (right) for October 24–25, 2023 during the passage of Hurricane Otis.
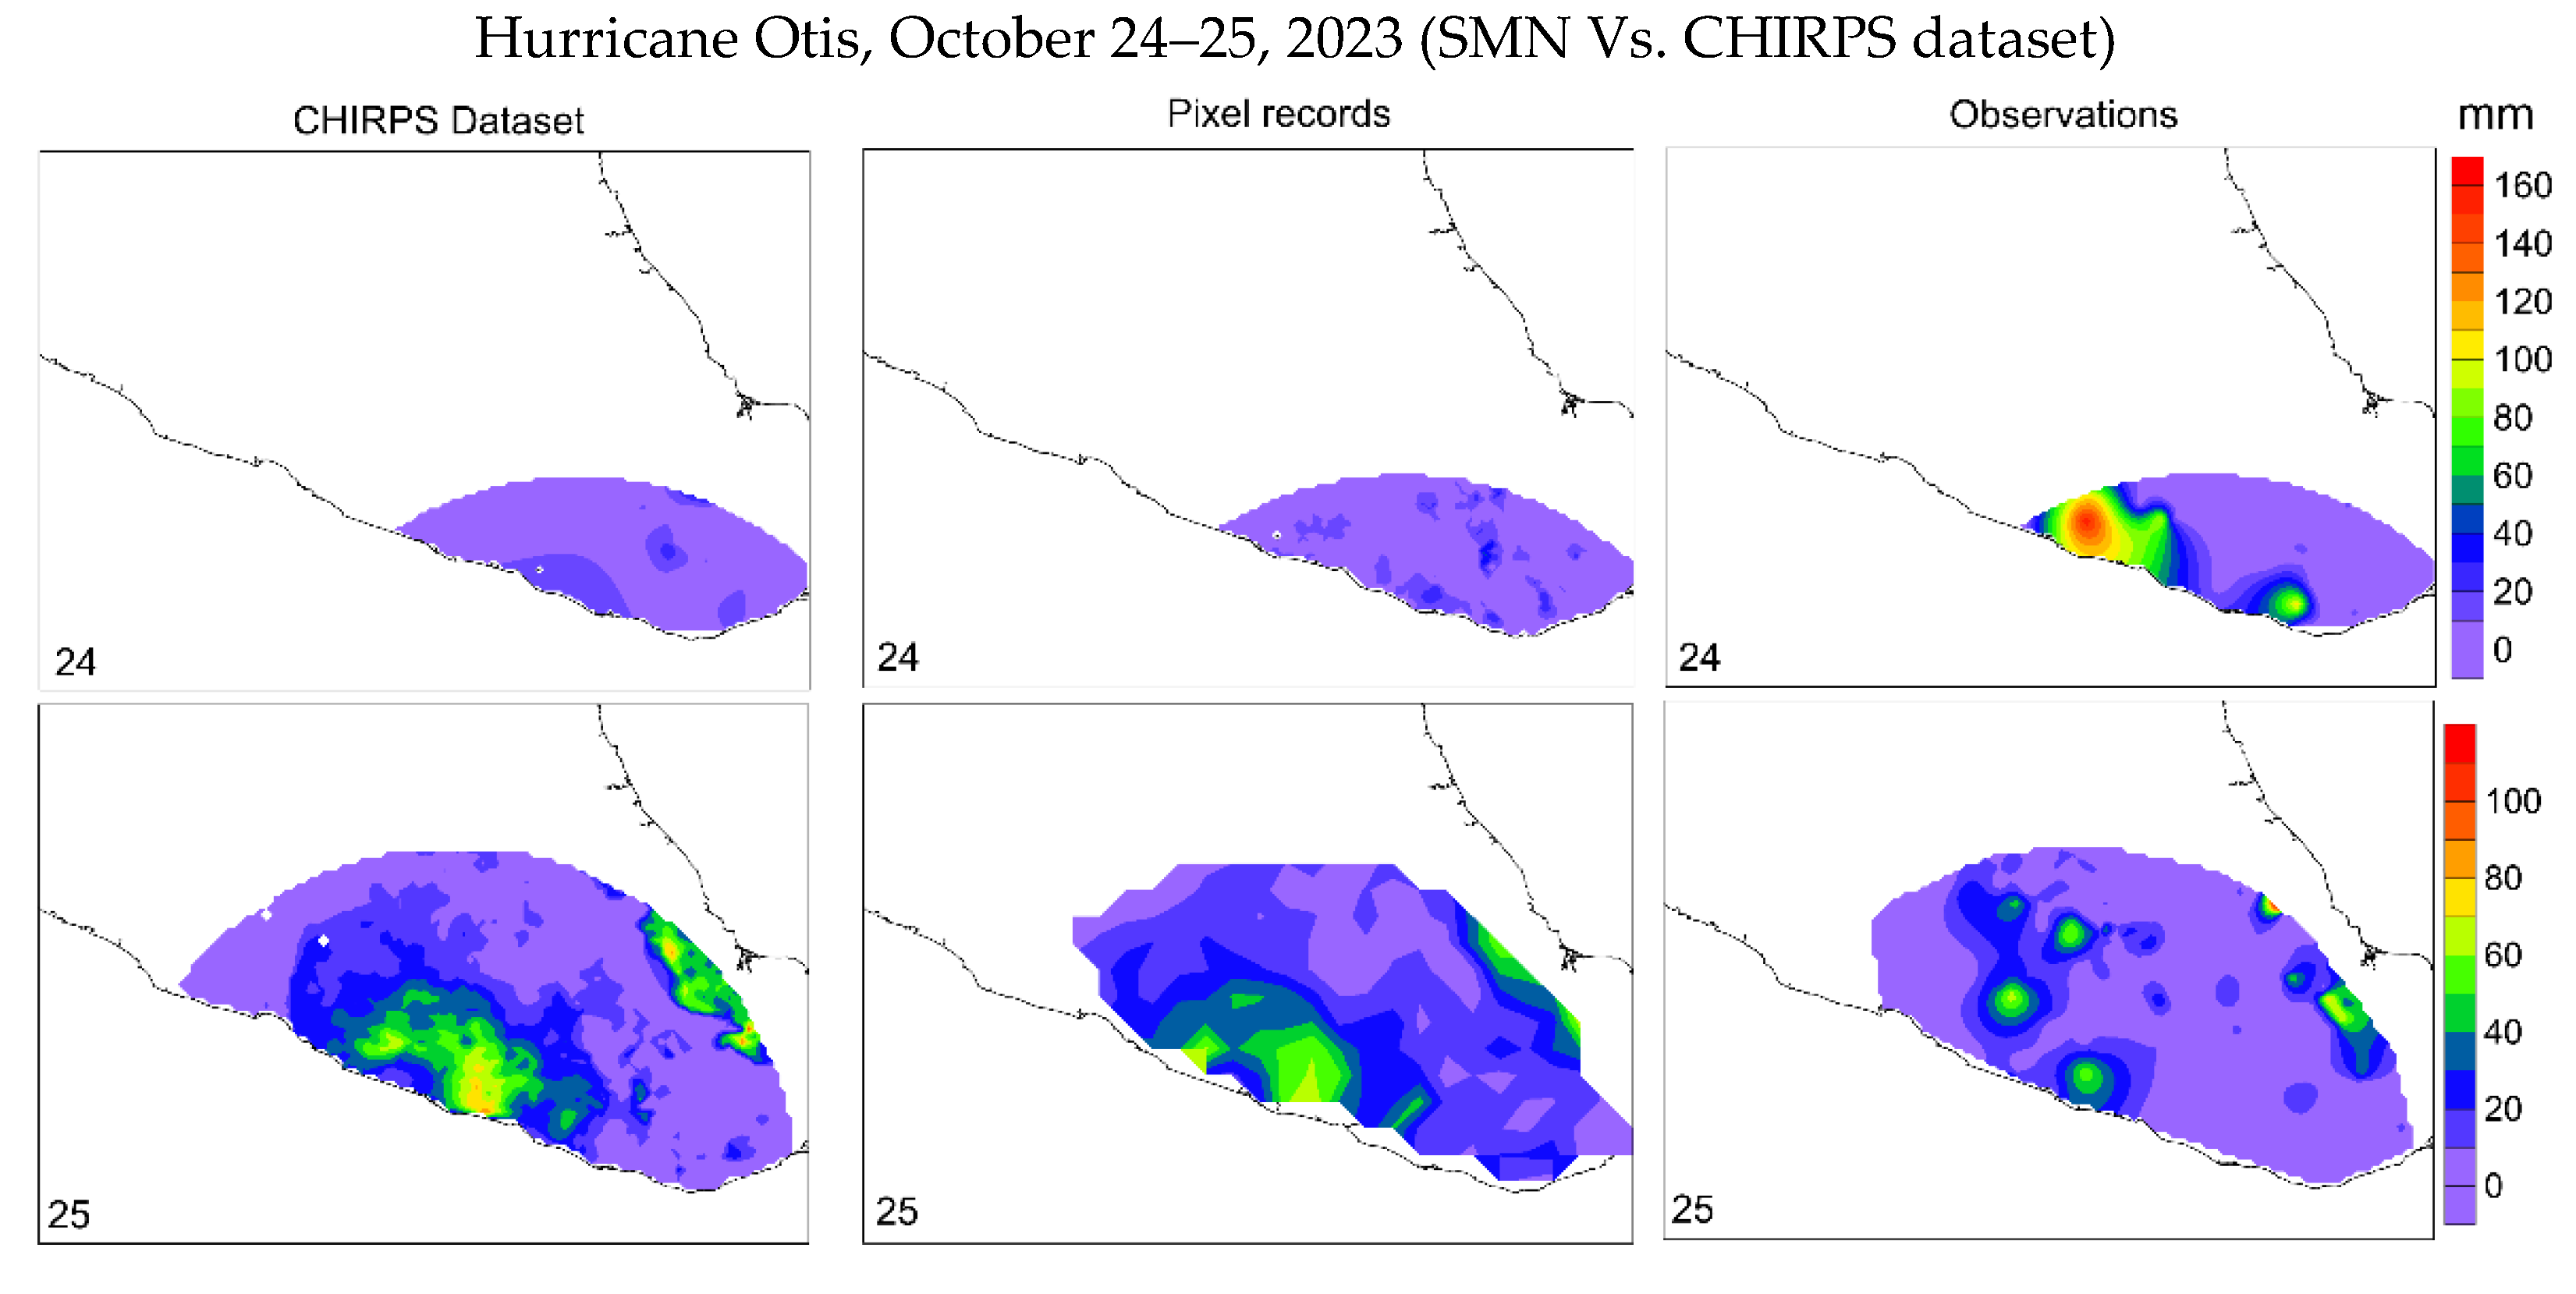
Figure 10.
Cross sections based on the NARR analyses from 15.0°N, 99.0°W through 19.5°N, 100.0°W parallel to the path of Otis, for (a) October 23; (b) October 24 and (c) October 25 2023. Fields include average horizontal wind vectors, specific humidity (white lines, g kg-1), divergence (black solid lines 10-6s-1). The terrain profile is given by vertical lines. SMO: Sierra Madre Occidental; SMOR: Sierra Madre Oriental; TVA: Trans-Volcanic Axis.
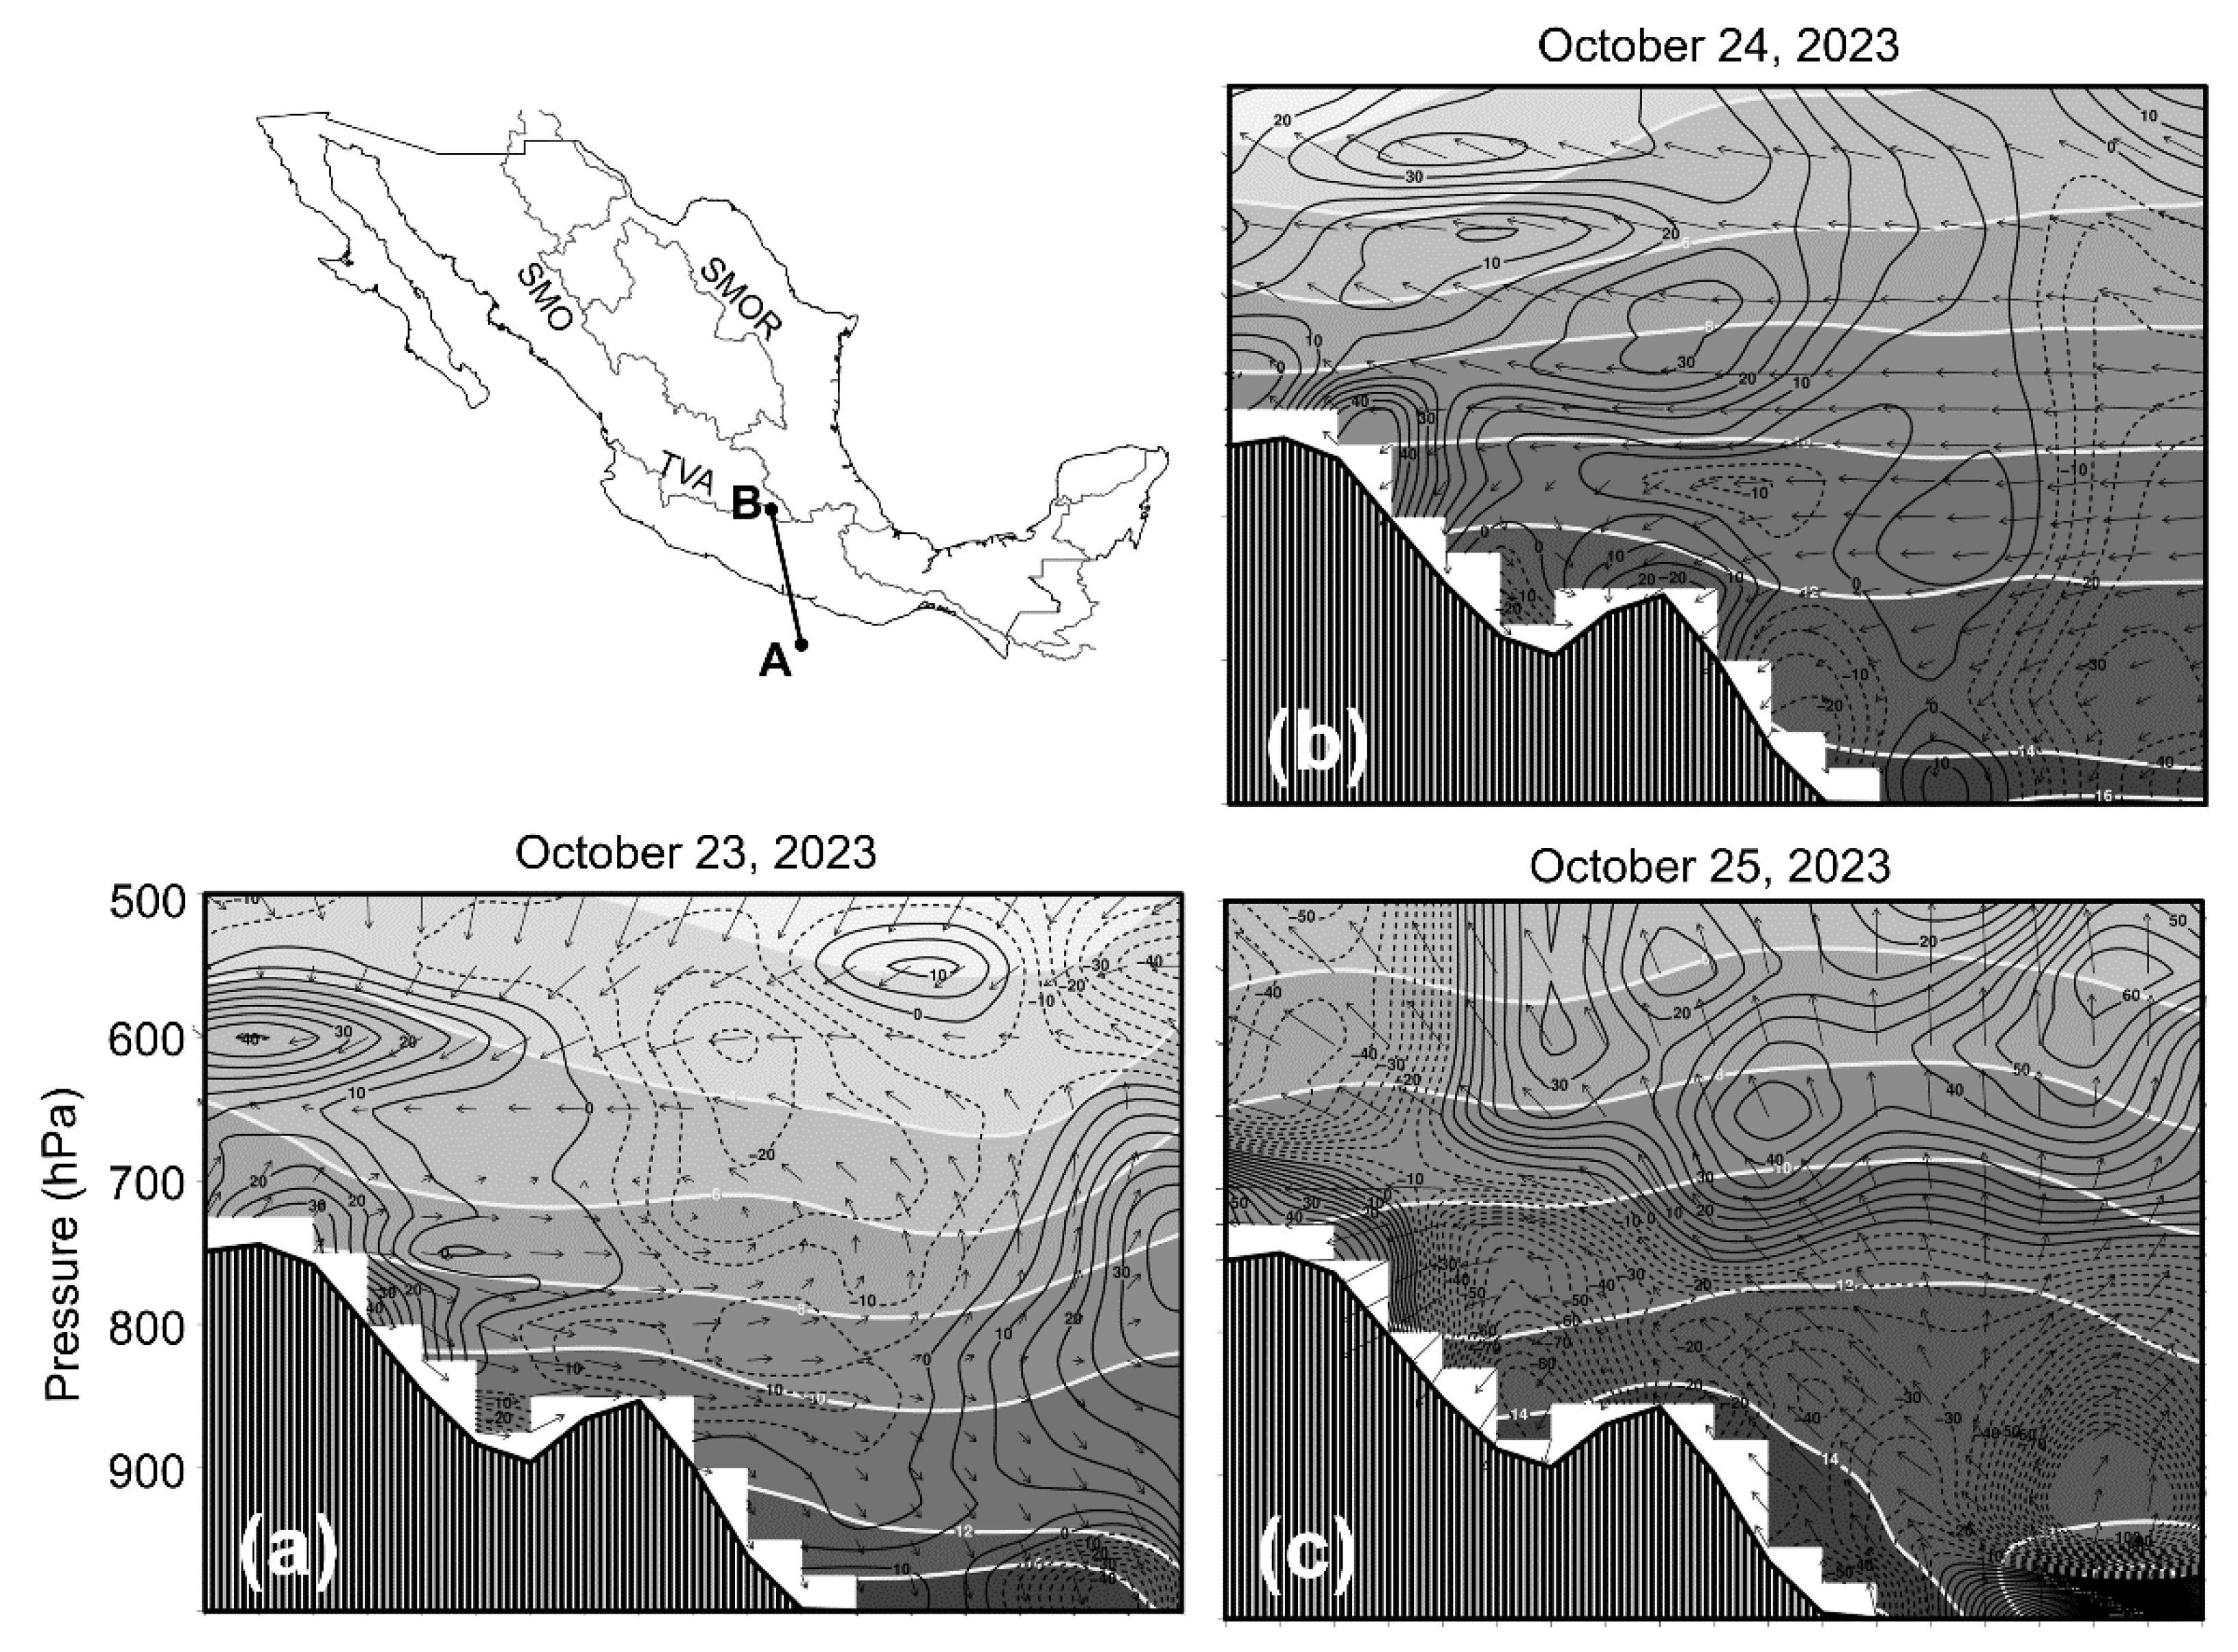

Table 1.
List of tropical cyclones that impacted Mexico during the period 1980–2024. The dates correspond to the available precipitation data within a 500-km radius of the tropical cyclone’s position.
Table 1.
List of tropical cyclones that impacted Mexico during the period 1980–2024. The dates correspond to the available precipitation data within a 500-km radius of the tropical cyclone’s position.
| Eastern Pacific Basin | |||
| No. | TC Name | Highest Category | Dates |
| 1 | Kiko | H3 | August 25–29, 1989 |
| 2 | Virgil | H4 | October 01–05, 1992 |
| 3 | Winifred | H3 | October 06–10, 1992 |
| 4 | Pauline | H4 | October 05–10, 1997 |
| 5 | Kenna | H5 | October 22–26, 2002 |
| 6 | John | H4 | August 28–September 04, 2006 |
| 7 | Lane | H3 | September 13–17, 2006 |
| 8 | Jimena | H4 | August 28–September 05, 2009 |
| 9 | Odile | H4 | September 09–18, 2014 |
| 10 | Patricia | H5 | October 20–24, 2015 |
| 11 | Willa | H5 | October 19–24, 2018 |
| 12 | Roslyn | H4 | October 20–24, 2022 |
| 13 | Lidia | H4 | October 03–11, 2023 |
| 14 | Otis | H5 | October 21–25, 2023 |
| 15 | John | H3 | September 22–27, 2024 |
| Atlantic Basin | |||
| 1 | Gilbert | H5 | September 14–18, 1988 |
| 2 | Roxanne | H3 | October 10–21, 1995 |
| 3 | Keith | H4 | September 30–October 06, 2000 |
| 4 | Isidore | H3 | September 21–25, 2002 |
| 5 | Emily | H5 | July 17–21, 2005 |
| 6 | Wilma | H5 | October 21–23, 2005 |
| 7 | Dean | H5 | August 21–23, 2007 |
| 8 | Grace | H3 | August 19–21, 2021 |
Table 2.
Major hurricanes in the Eastern Pacific Ocean that affected Mexico during the period 1981–2024. Hurricane categories (Cat) are shown, along with correlations (R) between the accumulated precipitation from observations and pixel records, pair numbers (n), statistical significance (p), and K0- and K-ratios.
| Name (Year) | Cat | n | p | |||
| Roslyn (2022) | H4 | 0.67 | 559 | 0.000 | 132/360 | 1.46 |
| Lidia (2023) | H4 | 0.65 | 446 | 0.000 | 141/163 | 1.16 |
| Kiko (1989) | H3 | 0.60 | 454 | 0.000 | 14/72 | 1.11 |
| Kenna (2002) | H5 | 0.58 | 329 | 0.000 | 13/61 | 1.20 |
| Willa (2018) | H5 | 0.55 | 478 | 0.000 | 47/71 | 1.02 |
| Virgil (1992) | H4 | 0.71 | 830 | 0.000 | 266/109 | 0.76 |
| Pauline (1997) | H4 | 0.66 | 1182 | 0.000 | 110/81 | 0.95 |
| John (2024) | H3 | 0.51 | 397 | 0.000 | 160/20 | 0.59 |
| Otis (2023) | H5 | 0.45 | 628 | 0.000 | 330/225 | 0.56 |
| Odile (2014) | H4 | 0.44 | 597 | 0.000 | 46/44 | 0.75 |
| Lane (2006) | H3 | 0.76 | 956 | 0.000 | 221/256 | 0.94* |
| Patricia (2015) | H5 | 0.71 | 1351 | 0.000 | 94/120 | 0.94* |
| John (2006) | H4 | 0.69 | 1235 | 0.000 | 45/91 | 0.98* |
| Winifred (1992) | H3 | 0.55 | 336 | 0.000 | 0/17 | 0.99* |
| Jimena (2009) | H4 | 0.40 | 472 | 0.000 | 8/44 | 0.79* |
| average | 0.56 |
*=Indicates discrepancies between the results of K0 and K coefficients.
Table 3.
Major hurricanes in the Atlantic Ocean that affected Mexico during the period 1981–2024. Hurricane category (Cat) is shown, along with correlations (R) between accumulated precipitation from observations and pixel records, pair numbers (n), statistical significance (p), and K0- and K-ratios.
| Name (Year) | Cat | n | p | |||
| Gilbert (1988) | H5 | 0.76 | 1002 | 0.000 | 76/145 | 1.19 |
| Wilma (2005) | H5 | 0.78 | 149 | 0.000 | 2/0 | 0.94 |
| Roxane (1995) | H3 | 0.77 | 909 | 0.000 | 213/145 | 0.88 |
| Emily (2005) | H5 | 0.49 | 1046 | 0.000 | 93/85 | 0.84 |
| Dean (2007) | H4 | 0.70 | 1062 | 0.000 | 0/121 | 0.86* |
| Isidore (2002) | H3 | 0.69 | 191 | 0.000 | 0/1 | 0.80* |
| Keith (2000) | H4 | 0.64 | 1753 | 0.000 | 696/306 | 1.06* |
| Grace (2021) | H3 | 0.60 | 1170 | 0.000 | 39/139 | 0.97* |
| average | 0.68 |
*=Indicates discrepancies between the results of K0 and K coefficients.
Table 4.
Major hurricanes in the Pacific Ocean that affected Mexico during the period 1981–2024. Dates and categories (Cat) of the hurricanes are shown, along with the highest correlations (R) achieved in each case from the regression analysis between the number of observations and pixel records from CHIRPS, statistical significance (p), and K0- and K-ratios.
| Name | Date | Cat | n | p | |||
| Kenna | Oct 25, 2002 | H3 | 0.58 | 329 | 0.000 | 13/61 | 1.20 |
| Winifred | Oct 09, 1992 | H1 | 0.53 | 323 | 0.000 | 7/86 | 1.04 |
| Kiko | Aug 27,1989 | H3 | 0.51 | 177 | 0.000 | 69/125 | 1.28 |
| Jimena | Sep 03, 2009 | H1 | 0.45 | 249 | 0.000 | 93/161 | 1.23 |
| Willa | Oct 23, 2018 | TD | 0.46 | 331 | 0.000 | 84/107 | 1.11 |
| John | Sep 26, 2024 | H1 | 0.70 | 199 | 0.000 | 149/58 | 0.39 |
| Virgil | Oct 02, 1992 | H2 | 0.69 | 200 | 0.000 | 127/75 | 0.59 |
| Odile | Sep 17, 2014 | TS | 0.65 | 179 | 0.000 | 131/123 | 0.54 |
| Pauline | Oct 08, 1997 | TS | 0.30 | 322 | 0.000 | 131/62 | 0.37 |
| Otis | Oct 25, 2023 | H5 | 0.25 | 623 | 0.000 | 345/272 | 0.79 |
| Roslyn | Oct 22, 2022 | TS | 0.70 | 107 | 0.000 | 31/41 | 0.47* |
| Patricia | Oct 23, 2015 | H5 | 0.62 | 179 | 0.000 | 0/8 | 0.59* |
| Lane | Sep 15, 2006 | TS | 0.60 | 312 | 0.000 | 49/71 | 0.65* |
| John | Sep 01, 2006 | H4 | 0.47 | 178 | 0.000 | 30/47 | 0.62* |
| Lidia | Oct 10, 2023 | H3 | 0.50 | 32 | 0.004 | 4/4 | 0.31* |
| average | 0.53 |
*=Indicates discrepancies between the results of K0 and K coefficients.
Table 5.
Major hurricanes in the Atlantic Ocean affecting Mexico during the period 1981–2024. Dates and categories (Cat) of the hurricanes are shown, along with the highest correlations (r) were achieved in each case from the regression analysis between the number of observations and pixel records from CHIRPS, their statistical significance (p) and K0- and K-ratios.
| Name | Date | Cat | n | p | |||
| Keith | Oct 03, 2000 | TS | 0.67 | 229 | 0.000 | 37/46 | 1.34 |
| Dean | Aug 22, 2007 | TD | 0.63 | 867 | 0.000 | 0/131 | 1.02 |
| Gilbert | Sep 16, 1988 | H4 | 0.57 | 3.44 | 0.000 | 0/140 | 1.01 |
| Emily | Jul 21, 2005 | TS | 0.51 | 840 | 0.000 | 196/234 | 1.78 |
| Roxanne | Oct 20, 1995 | TD | 0.61 | 594 | 0.000 | 295/225 | 0.75 |
| Wilma | Oct 21, 2005 | H4 | 0.54 | 147 | 0.000 | 53/10 | 0.39 |
| Isidore | Sep 23, 2002 | TS | 0.44 | 194 | 0.000 | 0/14 | 0.65* |
| Grace | Aug 20, 2021 | H1 | 0.42 | 316 | 0.000 | 64/122 | 0.31* |
| average | 0.55 |
*=Indicates discrepancies between the results of K0 and K coefficients.
Table 6.
Hurricane Otis in the Pacific affecting Mexico. Dates and categories (Cat) when the highest correlations (R) were achieved from the regression analysis between observations and CHIRPS, along with their statistical significance (p), and K0- and K-ratios.
Table 6.
Hurricane Otis in the Pacific affecting Mexico. Dates and categories (Cat) when the highest correlations (R) were achieved from the regression analysis between observations and CHIRPS, along with their statistical significance (p), and K0- and K-ratios.
| Name | Date | Cat | n | P | |||
| Otis | Oct 24, 2023 | H1 | 0.14 | 51 | 0.320 | 25/28 | 0.12 |
| Otis | Oct 25, 2024 | H2 | 0.31 | 487 | 0.000 | 209/106 | 1.12 |
Disclaimer/Publisher’s Note: The statements, opinions and data contained in all publications are solely those of the individual author(s) and contributor(s) and not of MDPI and/or the editor(s). MDPI and/or the editor(s) disclaim responsibility for any injury to people or property resulting from any ideas, methods, instructions or products referred to in the content. |
© 2025 by the authors. Licensee MDPI, Basel, Switzerland. This article is an open access article distributed under the terms and conditions of the Creative Commons Attribution (CC BY) license (http://creativecommons.org/licenses/by/4.0/).
Copyright: This open access article is published under a Creative Commons CC BY 4.0 license, which permit the free download, distribution, and reuse, provided that the author and preprint are cited in any reuse.


