
Submitted:
11 December 2025
Posted:
12 December 2025
You are already at the latest version
Abstract
Global population aging demands understanding the determinants of healthy cognitive aging. This study aimed to examine the interrelations among executive functions, instru-mental activities of daily living and quality of life in older adults, considering the mediat-ing role of depression. Structural equation modeling was employed to estimate direct and indirect pathways between latent and observed variables, with the inclusion of depression as covariate in a sample of 124 community-dwelling older adults from João Pessoa, Brazil. Results indicated that executive function components were interrelated and associated with instrumental activities of daily living performance but did not exert a significant di-rect effect on quality of life. Depression emerged as the strongest predictor of satisfaction with life, negatively impacting all domains and mediating the relationship between exec-utive functioning and functional autonomy. The final model explained the major variance in quality of life compared to the variance in instrumental activities of daily living, with model fit indices supporting adequacy. These findings underscore the central role of de-pression in determining the self-perceived quality of life in aging, suggesting that inter-ventions should target both cognitive and affective domains to promote autonomy and well-being in older populations.
Keywords:
cognitive aging
; executive function
; quality of life
; instrumental activities of daily living
; depression
; structural equation modeling
; older adults
1. Introduction
The epidemiological hypothesis suggests that the significant increase in longevity, that is, advancing age, does not keep pace with the development of economic and cultural resources, nor does it include the public health support needed to assist this population, especially in developing countries [1]. This increase in the proportion of older adults worldwide has been considered a relevant topic of public health interest, given that cognitive aging process is associated with a higher incidence of dementia, depression and a major need for support due to the loss of independence and functional autonomy [1,2].
The growing aging population in Brazil is due to the improved quality of life (QoL) resulting from improvements in public health conditions, which have contributed to the growth of the older adult population in recent decades, especially since the 2000s [3,4,5].
QoL is a multidimensional construct encompassing individuals’ subjective perceptions of their position in life, considering their cultural context, value systems, personal goals, and the physical, psychological, social, and environmental conditions in which they live. Within this framework, it represents an integrated assessment of well-being and functioning across various domains of human satisfaction with life [6,7,8].
Recent studies on aging have been closely linked QoL to functional autonomy, cognitive reserve, and mental health, serving as a key indicator of healthy aging and adaptive capacity to biopsychosocial transitions in older age [6,9,10]. Thus, the QoL concept transcends objective measures of health, incorporating subjective dimensions of satisfaction, life meaning, and social integration, which reflect a dynamic balance between personal potential and contextual challenges inherent to the aging process [6,7,8].
Identifying protective factors for cognitive decline is essential for charting trajectories of healthy cognitive aging. This concept refers to the process of developing and maintaining functional capacity, enabling older adults to live independently with quality and well-being [5]. Therefore, healthy aging can promote the preservation of functional capacities in the daily lives of older adults, influenced by various dimensions of quality of life [6,7].
Cognitive functions may affect functional abilities, social activities, mood and QoL in older adults [8]. Such conditions are associated with cognitive impairment, which in turn is closely related to impairments in executive function (EF) [9,10]. The EF are recruited for planning, self-regulation, and goal-directed problem-solving [11,12].
Even though functional capacity is determined by multiple factors, executive functioning has been identified as the most strongly correlated with healthy cognitive aging. Furthermore, there is well-established evidence in the literature that age-related decline in EF may negatively affect functionality in older adults [13,14,15,16,17]. Higher performance levels on tasks that measure EF are associated with greater success within functional outcomes and social skills. Similarly, it appears to contribute to functional independence and daily autonomy, which may improve the perceived QoL [18,19].
Executive dysfunctions are often associated with some type of brain injury, neurodevelopmental disorder, or neurodegenerative disorder. They present syndromes, or a series of signs and symptoms of cognitive and behavioral impairment. The consequences of executive impairment negatively influence adaptive behavior, planning, and problem-solving [20]. Therefore, the frequency and severity of impairments in IADL may indicate the fragility of an individual’s EF [21].
The Contextually Valid Executive Assessment (ConVExA) [22] is a theoretical framework model of EF in older adults which presents the individual’s interaction with their context as a central aspect. Therefore, it is understood that EF are strongly influenced by the environment in which individuals live. Therefore, this neurocognitive domain should not be investigated in isolation but analyzed in its relationship with contextual demands and the level of support offered by the environment of an individual. To this end, Suchy and colleagues [23] proposed that further research should be conducted with healthy and clinical groups to refine the understanding of theoretical and conceptual models, especially in older adults’ populations.
Furthermore, Bruderer-Hofstetter and colleagues [14] suggested that measures of inhibitory control, processing speed, and working memory would play an important role in the interaction between EF and IADL performance. Nevertheless, Satler et al. [24] have analyzed inhibitory control in a sample of highly educated older adults. Even Suchy and collaborators have been stated that working memory may be considered a lower order EF process in cognitive aging [21,22]. Besides, other investigations were also conducted on examining the role of cognitive flexibility by Corbo et al. [25] and El-Sayed et al. [26] which presented its influence on older adults’ capacity to adapt their behavior within environmental changes and on self-perceived psychological QoL.
In line with this, several studies presented evidence of correlation between the core components of EF and IADL [11,12,13,14,15,16,17,18,19,20,21,22,23,24,25,26]. This recent body of work has demonstrated that this is a topic widely consolidated in scientific literature, especially in the aging cognitive perspective.
However, gaps remain that generate opportunities for further research. First, there is a necessity to verify which components of the EF would play a critical and/or predictive role in the IADL performance in older adults [25]. Furthermore, other studies would improve the understanding of complex interactions to analyze the relationships between depression, EF, IADL and QoL in a sample of Brazilian older adults’ population [27].
Therefore, the present study aimed to examine the direct and indirect interactions between latent variables (e.g.: EF and QoL), observable variables (e.g.: working memory, flexibility, inhibition, IADL, health, psychological, social, and environment) and depression added as a covariate in a structural equation model (SEM). It happens to be the first Brazilian study to investigate the ConVExA theoretical framework employing SEM, also extending its understanding further cognitive and contextual factors but also including depression and QoL to test the model.
Given this problem, the following question was raised:
- How do executive function, instrumental activities of daily living, and quality of life interrelate in a community-dwelling sample of older adults, adding depressive symptoms as a covariate in a structural model of interrelation pathways?
2. Materials and Methods
2.1. Participants
A total of 124 participants aged between 60 to 92 years old of Metropolitan Region of João Pessoa, capital city of Paraíba state in Northeastern region, Brazil, were recruited on a voluntary basis from community centers.
Participants had agreed on the Free and Informed Consent Term. Of these, 92 were females (74.2%) and had mean age of 69.16 years (SD ± 7.32) and average 9.67 (SD ± 5.24) years of education. After signing informed consent, participants underwent a neuropsychological assessment of their executive functioning, screening of depression symptoms, functional scores, and perceived quality of life. The instruments and tasks used are described below.
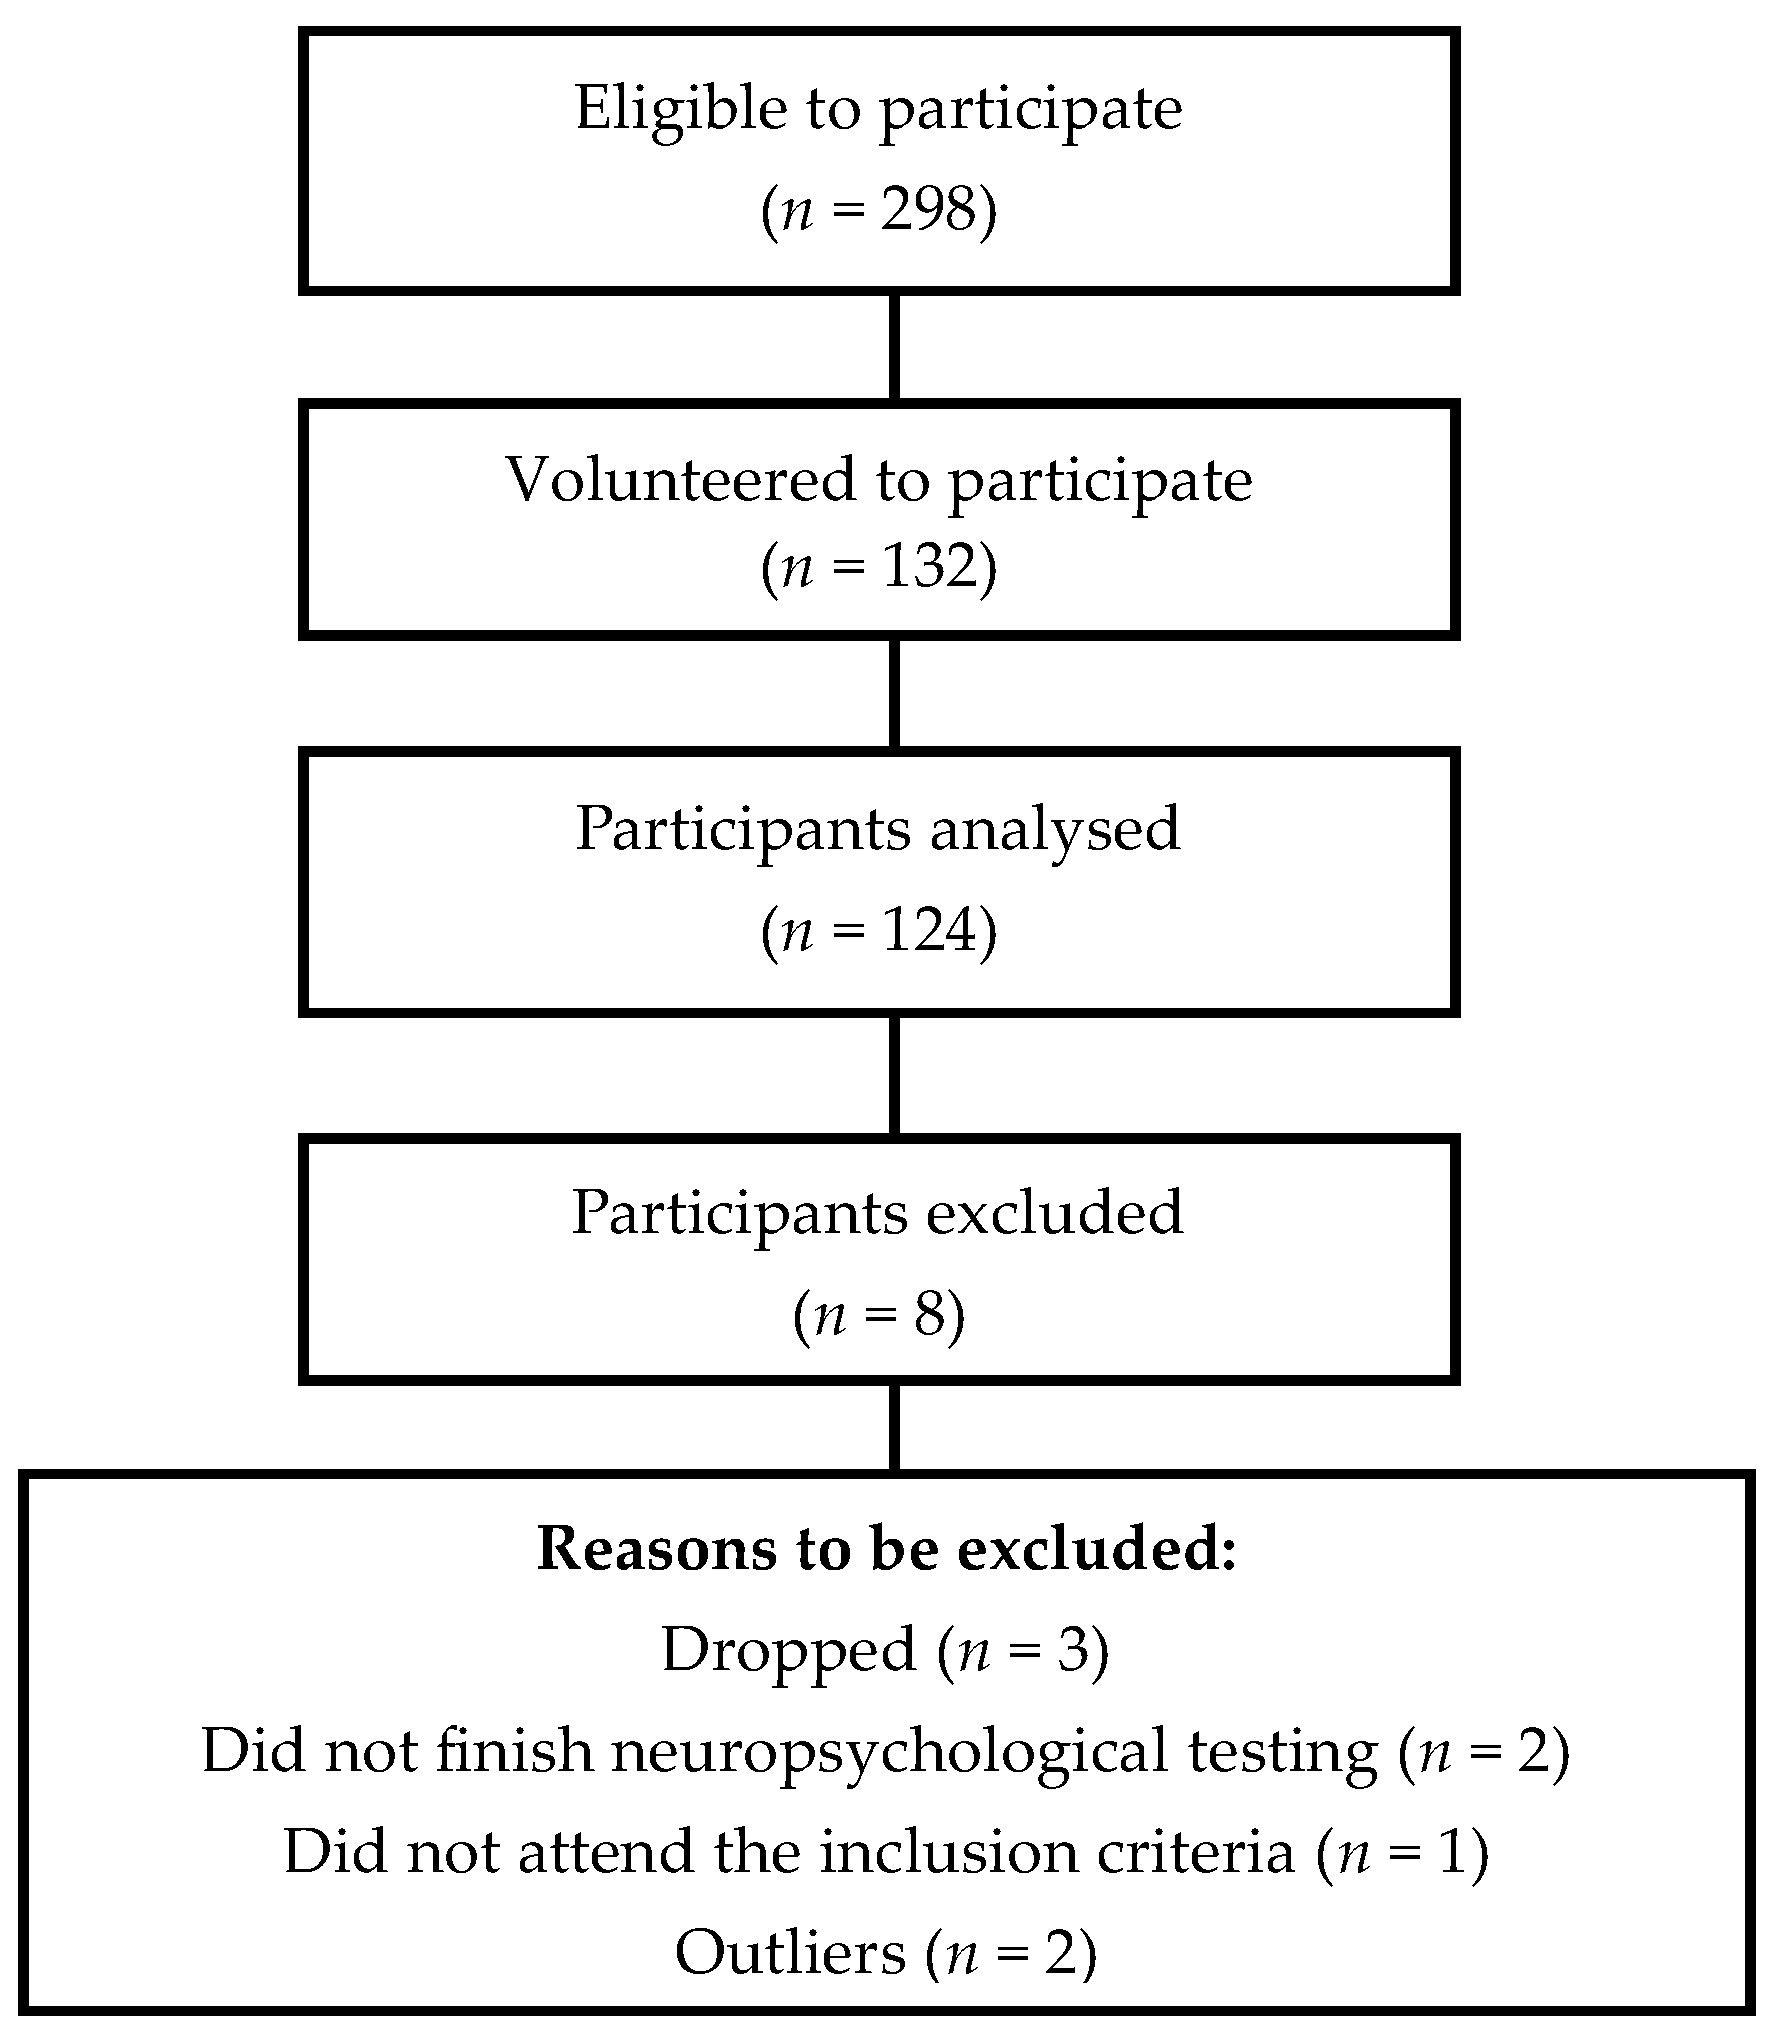
Inclusion criteria were: (1) male and female community-dwelling older adults (2) who voluntarily informed consent to participate on the collection data. Exclusion criteria were: (1) uncorrected visual and/or hearing impairments, (2) mild cognitive impairment (MCI), (3) Parkinson’s disease, (4) multiple sclerosis, (5) epilepsy, (6) stroke, (7) brain tumors, (8) meningitis and (9) schizophrenia. Eight subjects were excluded for not meeting the selection criteria (n = 1), not completing the neuropsychological assessment protocol (n = 2), dropped their participation in the research (n = 3) and for being outliers (n = 2).
2.2. Instruments
The participants were evaluated during one session of approximately 90 minutes performed by members of research team composed of a neuropsychologist and two psychology graduate students trained and supervised by a PhD professor. During the testing session, participants did not need the presence of a caregiver nor legal guardian to rely on the execution of the tasks applied. The instruments used to collect data in this study were adapted and validated to Brazilian population.
Sociodemographic and Health Conditions Questionnaire was applied to collect information regarding age, years of formal education, sex, self-reported visual and auditory acuity and physical, psychological and/or neurological conditions reported in the past two years (2023-2025). This instrument was built and employed based on Brazilian Institute of Geography and Statistics (IBGE) criteria, also on Luo et al. [28] findings on clinical characteristics of an older adults’ sample.
The 15-item Geriatric Depression Scale (GDS-15) [29] was used to screen depressive symptoms. The Brazilian adapted and translated in Portuguese version internal consistency is α = 0.75 [30].
Pfeffer’s Functional Activities Questionnaire (PFAQ) [31] was used to assess the Instrumental Activities of Daily Living (IADL). This scale has 10 items varying between 0 to 3 points to each item, which indicates that higher scores are considered a worse performance. The result varies between 0 to 30 points, score equal or less than 5 indicates a better functional performance. Internal consistency of the Brazilian version is considered satisfactory with Cronbach’s alpha (α = 0.95) [32].
The World Health Organization Quality of Life abbreviated version of the self-report questionnaire (WHOQOL-BREF) [33] with 26 items composed of four domains was administrated to measure the Quality of Life (QoL) on this sample. The domains of this instrument are: 1) Physical Health; 2) Psychological; 3) Social Relationships and 4) Environment. The internal consistency of the adaptation for Brazilian population is considered satisfactory with Cronbach’s alpha (α = 0.91) [34].
The Five-Digit Test (FDT) [35] used to measure cognitive flexibility and inhibitory control as two core components of executive functions (EF). This instrument is a time-based measure of EF with an average administration time between 5 to 10 minutes. Internal consistency measured by the Cronbach’s alpha (α = 0.726) is considered acceptable for heterogeneous samples of Brazilian older adults [36].
The Brazilian adapted third version of the Wechsler Adult Intelligence Scale (WAIS-III) was used with the administration of the Digit Span Backwards to assess verbal working memory [37,38].
As sustained for previous evidence from Suchy and Brothers [39], a composite of score tests are feasible and well advised to exhibit a considerable construct utility in terms of reliability to assess EF as a latent construct.
2.3. Statistical Analysis
We carried a descriptive analysis to characterize the sample in terms of demographic, clinical and cognitive variables using the software RStudio version 2025.05.1, also to analyze data and measurements of the structural equation modeling (SEM). SEM was employed to investigate the relationship between GDS-15, PFAP, EF and QoL variables. Depression was used as a covariate variable within the model. We utilized the following packages: lavaan (latent variable analysis) and semPlot to generate the path graphics. For all analyses, the main effect was examined by the Bonferroni test to correct the level of significance at p < 0.05.
We generated a path graphical model (see Figure 2) to explain the observed and the latent variables. Their interrelationship represents the influence of the variables on healthy cognitive aging. To test the differences between the observed covariance matrix and the theoretically matrix expected to establish the best adjustment, we measured the goodness of fitness defined for chi-square (X²).
The X² value is sensible to the sample size, also values near zero defines the best adjustment of the model. To this matter, we calculated X²/df (degrees of freedom) ratio, which means that values less than 3 indicate an acceptable model [40].
The comparative fit index (CFI), the Tucker-Lewis (TLI), the root mean square error of approximation (RMSEA), and the standardized root mean square residual (SRMR) were considered to assess the feasibility of the model. CFI and TLI indices equal to or greater than 0.9 and RMSEA and SRMR equal to or less than 0.08 characterize a good model as suggested by Kline [40] and Zhang [41].
We disclose the use of Generative Artificial Intelligence (GenAI), specifically Claude AI to assist in the development of this manuscript. Claude AI [42] was utilized to generate R code for statistical analyses conducted in RStudio, including data preprocessing, model specification, and output extraction. Additionally, Claude AI contributed to the automated generation of tables summarizing descriptive statistics and model results. All code and table outputs produced by Claude AI were reviewed and validated by the authors to ensure accuracy and compliance with methodological standards
3. Results
The flowchart (see Figure 1) depicted shows the process for participant selection in the study. Initially, 298 individuals were eligible to participate. Of these, 132 volunteered, and 124 were ultimately analyzed. Eight participants were excluded for the following reasons: dropped out (3), did not finish neuropsychological testing (2), did not meet inclusion criteria (1), or were identified as outliers (2).
Figure 1.
Flowchart of participants’ selection.
3.1. Descriptive Analysis
The descriptive analysis presented in Table 1 shows that most participants were married (42.7%) and report one minimum monthly wage (45.2%). The most frequently reported health conditions in the past two years were hypertension (76.61%), musculoskeletal diseases (39.52%), anxiety (30.65%), and diabetes (29.03%).
Data for categorical variables are presented as frequency (n) and percentage (%). Age and education are presented as Mean (M) and Standard Deviation (SD). The frequency of diseases was calculated from individual reports; the same participant may have reported multiple conditions. The table presents the 12 most frequent diseases.
3.2. Preliminary Analysis
Correlational analysis (see Table 2) indicates that working memory was negatively correlated with cognitive flexibility (r = -0.21, p < .05) and inhibitory control (r = -0.20, p < .05), while cognitive flexibility and inhibitory control were strongly correlated (r = 0.73, p < .001). QoL domains showed moderate to strong positive correlations with each other, and depressive symptoms had moderate negative correlations with QoL domains (e.g., r = -0.44 with environment). IADL were negatively associated with physical QoL (r = -0.27, p < .01) and positively with both cognitive flexibility and inhibitory control. IADL was significantly correlated with executive function measures, physical QoL, and depressive symptoms.
3.3. Structural Analysis
In a first attempt to examine our hypothesis, QoL was included as a latent variable in the model. The model showed acceptable but weaker fit (χ² (23) = 36.154, p = 0.040; CFI = 0.950; TLI = 0.921; RMSEA = 0.068; SRMR = 0.067). In our second and final attempt at building our model, we eliminated QoL as a latent variable but the four domains of QoL (e.g.: physic, social, psychological and environment) were included as observed variables, leading to a found better fit parameters. Consequently, the best fitting model was chosen to explain our results.
Factor loadings (see Table 3) indicate that all indicators used to measure the latent construct of EF were statistically significant (p < .001) with standardized loadings ranging from 0.241 to 0.892. These loadings suggest that these indicators are strong and reliable measures of the underlying latent construct, with higher absolute loadings indicating greater indicator reliability. The negative signs reflect the direction of the relationships, possibly due to the scoring or scaling of the original measures, but in standardized terms, these loadings can be interpreted as the strength of association, closer to absolute 1 indicates stronger measurement validity.
The significant loadings confirm that the individual indicators robustly load onto the EF latent factor, supporting the construct validity of the measurement model used in the structural analysis. The estimation procedure and significance levels highlight the robustness of these loadings in the context of SEM analysis, necessary for reliable structural modeling and subsequent interpretation of the relationships among constructs such as EF, IADL, depression, domains of QoL.
Model fit indices (Table 4) indicated an excellent fit of the structural equation model to the observed data. The non-significant chi-square statistic (χ² = 10.035, df = 12, p = 0.613) suggests no meaningful difference between the proposed model and the empirical covariance matrix, fulfilling the assumption of good model fit. Complementing this, the CFI is perfect at 1.000, surpassing the conventional threshold of ≥ 0.90 for acceptable fit and indicating the model adequately captures the data structure.
The RMSEA at 0.000 well meets the ≤ 0.08 criterion, further confirming the model’s parsimony and close approximation to the population covariance matrix. The SRMR is also low at 0.041, well below the ≤ 0.08 benchmark, indicating minimal average residual discrepancies between observed and predicted correlations. Finally, the AIC and BIC values are relatively low (5806.51 and 5896.76, respectively), suggesting this model maintains an optimal balance between fit and complexity compared to alternative models. These collective indices provide convincing evidence that the measurement and structural components of the model are statistically robust and appropriate for interpretation and further inferential analysis.
Path coefficients (see Table 4 and Figure 2) showed that depression is a consistent and statistically significant negative predictor of the four QoL domains: physical (β = -0.335, p < .001), psychological (β = -0.340, p < .001), social (β = -0.268, p = 0.003), and environmental (β = -0.431, p < .001). This underscores the critical role of depressive symptoms in diminishing multiple life quality aspects in older adults.
However, EF showed non-significant positive relationships across all QoL domains, with standardized coefficients ranging from 0.058 to 0.095 and p-values well above 0.05, indicating no direct robust impact in this model.
IADL similarly has not exerted significant influence on QoL domains in this model (all p > .05). EF’s effect on IADL is negative and marginally significant (β = -0.210, p = 0.056). Depression also has a modest significant positive effect on IADL (β = 0.172, p = 0.045) but no significant effect on EF (β = -0.070, p = 0.513).
The model explained (see Table 5) showed that EF showed varied explanatory strength: inhibitory control (IC) accounts for 79.5% of the variance, cognitive flexibility (Flx) explains 67.4%, and working memory (WM) explains only 5.8%. QoL domains displayed moderate explained variance, with the environmental domain showing the highest at 20.4%, followed by physical at 18.8%, psychological at 13.4%, and social at 7.1%. IADL accounted for 7.9% of variance, while the latent EF factor accounted for a minimal 0.5%, indicating that the measured executive components share considerable variance, but the latent factor captures relatively little unique variance beyond observed indicators.

Table 5.
Standardized Path Coefficients for Structural Model.
| Path | B | SE | β | 95% CI LL | 95% CI UL | p |
| EF → physical QoL | 0.426 | 0.515 | 0.075 | -0.582 | 1.435 | 0.407 |
| IADL → physical QoL | -0.124 | 0.084 | -0.190 | -0.288 | 0.040 | 0.139 |
| depression → physical QoL | -0.340 | 0.085 | -0.335 | -0.506 | -0.174 | < .001 |
| EF → psychological QOL | 0.331 | 0.461 | 0.058 | -0.572 | 1.233 | 0.473 |
| IADL → psychological QOL | -0.038 | 0.097 | -0.058 | -0.228 | 0.153 | 0.699 |
| depression → psychological QOL | -0.342 | 0.095 | -0.340 | -0.528 | -0.156 | < .001 |
| EF → social QoL | -0.269 | 0.535 | -0.035 | -1.317 | 0.779 | 0.615 |
| IADL → social QoL | 0.068 | 0.054 | 0.077 | -0.039 | 0.174 | 0.212 |
| depression → social QoL | -0.366 | 0.125 | -0.268 | -0.610 | -0.122 | 0.003 |
| EF → environmental QoL | 0.607 | 0.435 | 0.095 | -0.246 | 1.460 | 0.163 |
| IADL → environmental QoL | -0.012 | 0.037 | -0.017 | -0.085 | 0.060 | 0.740 |
| depression → environmental QoL | -0.491 | 0.075 | -0.431 | -0.638 | -0.344 | < .001 |
| FE → IADL | -1.840 | 0.964 | -0.210 | -3.729 | 0.049 | 0.056 |
| depression → IADL | 0.268 | 0.133 | 0.172 | 0.006 | 0.529 | 0.045 |
| depression → EF | -0.012 | 0.019 | -0.070 | -0.050 | 0.025 | 0.513 |
EF = Executive Functions; QoL = Quality of Life; IADL = Instrumental Activities of Daily Living. B = unstandardized coefficient; SE = standard error; β = standardized coefficient; CI = confidence interval; LL = lower limit; UL = upper limit.
Table 6.
Variance Explained and Model Parameters.
| Variable | R² | % Variance Explained |
| WM | 0.058 | 5.8% |
| Flx | 0.674 | 67.4% |
| IC | 0.795 | 79.5% |
| physical QoL | 0.188 | 18.8% |
| psychological QoL | 0.134 | 13.4% |
| social QoL | 0.071 | 7.1% |
| envoirnment QoL | 0.204 | 20.4% |
| IADL | 0.079 | 7.9% |
| EF | 0.005 | 0.5% |
R² = proportion of variance explained in variables.
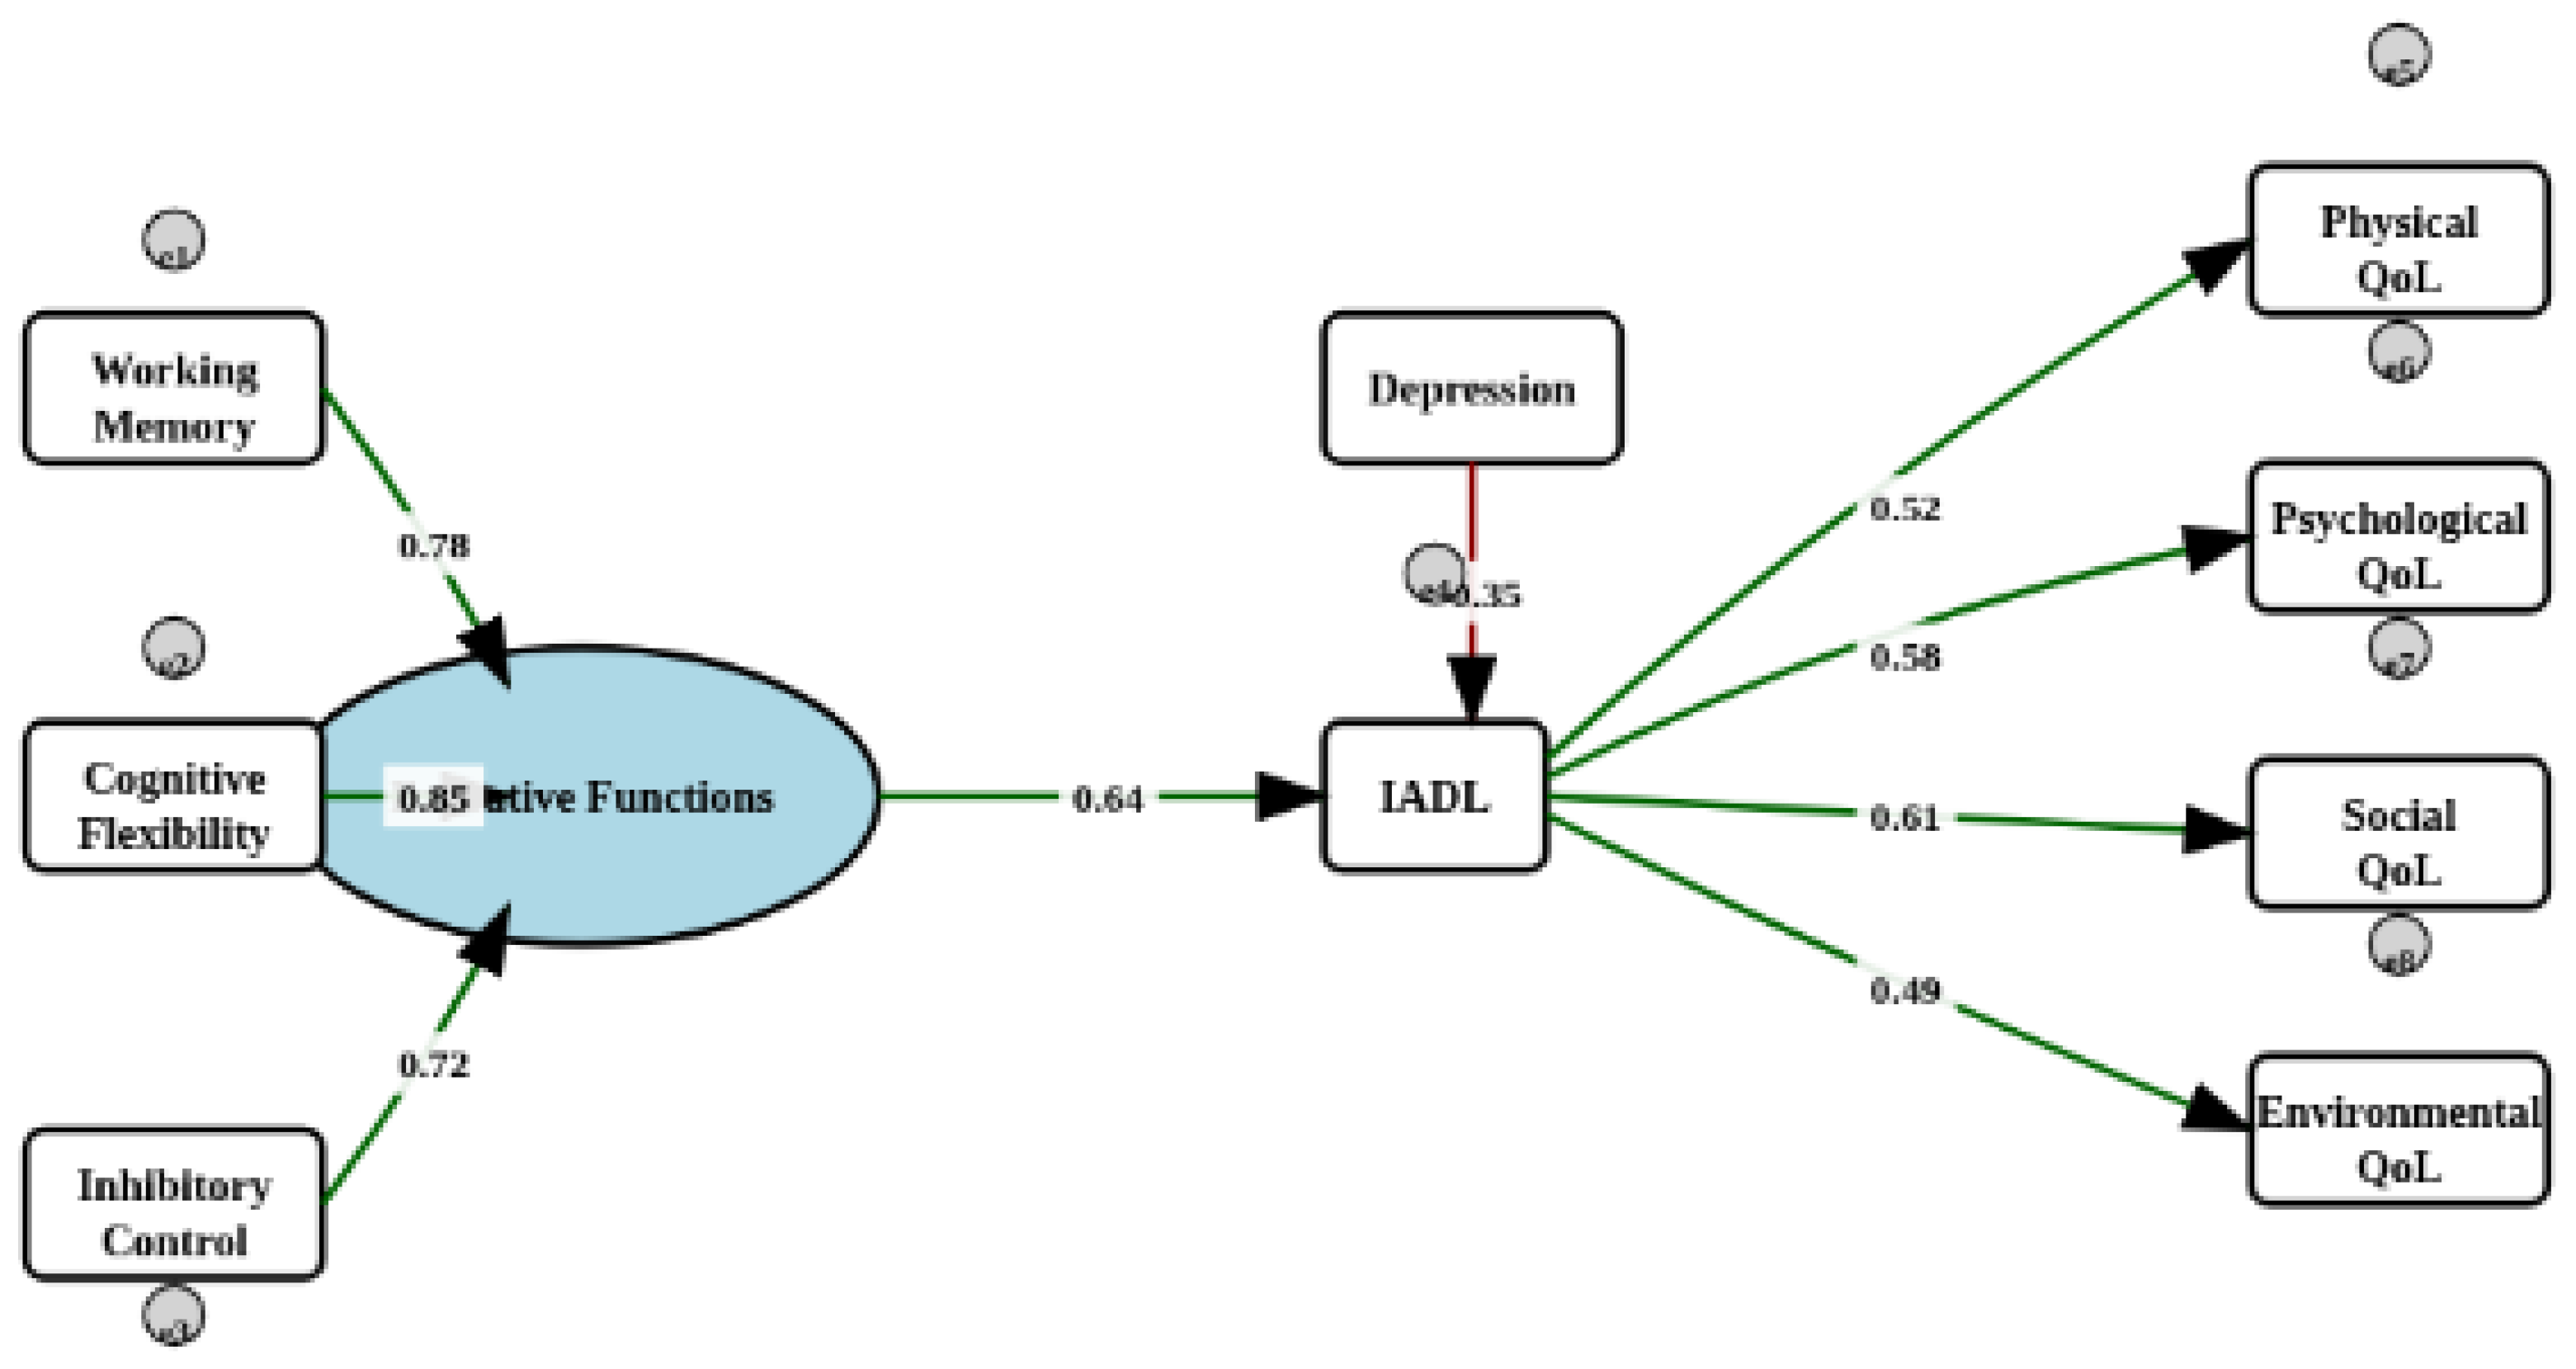
As shown below in Figure 2, a path diagram of the reformulated SEM model (FE → AIVD → QoL, four observed QoL dimensions, e.g.: physical, psychological, social and environmental). EF is modeled a latent variable defined by three components indicators (e.g.: working memory, inhibitory control, cognitive flexibility). These paths are shown with their corresponding standardized loadings, and the strongest paths are visually emphasized with thick lines, highlighting the substantial contributions from cognitive flexibility and inhibitory control.
The loadings near indicator boxes (e.g., “1.00”, “0.89”) represent the factor loadings from the measurement model. Numerical values on the arrows between latent and observed variables, as well as between endogenous variables (e.g., towards QoL domains), indicate the standardized beta coefficients described earlier.
This diagram synthesizes the structure, direction, and strength of modeled relationships visually, in line with the reported SEM results and tables.
Figure 2.
Path diagram of the modified model. Relationships between executive function (EF), instrumental activities of daily living (IADL), depression and QoL domains in aging. Circles: latent variables; squares: observed variables; single arrows: regression and structural model; dashed lines: indirect interaction. Unstandardized beta coefficients were used. The EF are from FDT and Digit-Span Backwards. The IADL is from PFAP. The physical, psychological, social and environmental domains are from the WHOQOL-BREF questionnaire. Depression is from GDS-15. Green arrows indicate positive standardized path coefficients, and the red arrow indicates a negative effect. Grey circular arrows represent residual variances for observed and latent variables.
4. Discussion
In the present study, SEM was employed to examine the relationships among EF, IADL, QoL and depression in a sample of older adult volunteers from community centers in the Metropolitan Area of João Pessoa, Brazil.
Preliminary analyses indicated that the components of EF such as working memory, cognitive flexibility, and inhibitory control were interrelated, with a particularly strong association observed between cognitive flexibility and inhibitory control. This finding supports the conceptualization of EF as a multidimensional construct [22], consistent with previous literature [18,19,20,21].
Notably, negative correlations between working memory and the other executive domains were observed, which may reflect lower order cognitive processes in older adults, as suggested by Suchy [22]. Age-related declines in cognitive functions, particularly working memory, aligns with prior studies results [28]. Working memory appears to be the component of executive functions most vulnerable to the aging process, as it may be related to fluid intelligence, a cognitive domain associated with abstract reasoning and problem-solving that is reduced at this stage of life as reported by Salthouse [43,44].
Our findings corroborate with earlier research linking EF to IADL performance [11,12,13,14,15], in accordance with Suchy’s theoretical model [22]. The impact of EF on IADL underscores its role in supporting the functionality required for daily tasks in real-world settings [13]. However, in contrast to some previous study [16], the pathway between IADL and QoL was not significant in our model, suggesting that when depression is controlled, functional capacity does not exert a substantial influence on QoL.
Inhibitory control and cognitive flexibility emerged as EF components associated with IADL, consistent with prior research findings [24,25,26]. Although, our results further demonstrated that depressive symptoms negatively affected inhibitory control performance and may exacerbate declines in EF, thereby impacting all four domains of QoL.
Depression was identified as a key predictor of QoL, exerting a negative effect across all domains. This is in line with recent prior studies employing SEM to understand the complexity of cognitive aging [45,46,47,48,49,50,51], reinforcing the established link between affective status and perceived QoL in older adults. Depression also showed negative associations with social and physical domains of QoL, highlighting the potential protective role of social resources and physical health in mitigating depressive symptoms [6,45,46,47,48,49,50,51]. Conversely, engagement in social activities and social relationships may enhance self-perceived social QoL, as reported by a recent Brazilian finding [50].
In this sense, depression was also associated negatively with social and physical perception on QoL, which emerged as an important finding that social resources availability and a satisfactory physical health-related QoL may prevent or light the depressive symptoms [49]. The other way around would be also discussed; thus, an engagement related to the social domain increased the self-perception of social QoL.
Our findings suggested that EF may benefit QoL by protecting against negative emotional states related to depression. Additionally, poorer IADL scores may contribute to executive dysfunction and lower self-perceived QoL, increasing the risk of depressive symptomatology.
In our study, the EF appears to indirectly influence the physical domain of QoL, which may negatively impact on the IADL scores. Aligned to Léon et al. [52] findings which have evidenced a negative association in the relationship between depression and QoL, indicating the influence on self-perception of QoL in older adults. Also, cognitive functions did not play an important role in influencing QoL outcomes. Benincá et al. [53] also have not found direct influence of EF on any domain of QoL. Although, da Silva Dantas and collaborators [54] have found that depression has been more closely associated with QoL than cognitive functioning aligned to our results.
These findings highlight not only intervention on EF, but also the importance of interventions focused on supporting older adults in their daily activities, for example management of the medication [19] and strengthening the quality of the social relationships [45,46,47,48,49,50,51] to prevent dementia in order to control modifiable factors to a pathological aging such as depression and a lack of social interaction [1].
Target interventions may focus on depression to suppress executive dysfunction, lack of functional autonomy and perception of QoL. Accordingly, due to its relevance to public health, the region where the study was conducted could benefit from preventive actions focused on cognitive interventions and the strengthening of social bonds to build support networks through preventive mental health programs.
The limitations of our study must be acknowledged. The cross-sectional design of our research cannot extend causal inference. Our results support interpretation of a specific group of older adults in a geographic region of Brazil. Furthermore, investigations must be conducted to test the variables of our model in populations with different demographic characteristics. Once, in our study, the demographic profile consists of sample reporting high rate of comorbidities and the relatively low educational which may limit the generalizability to healthier or more socioeconomically advantaged groups.
Another limitation may be the measurement of the EF relied on a limited set of tasks, which may not capture the full breadth of this construct [18]. Hence, tasks relying on demands of real-world would sustain its complexity, also would closely lead to an ecological validity [55,56].
Regarding our model shows a good fit index, the data must be expanded over this sample size, since SEM requires larger samples to stabilize the average and to confirm the statistical power [40]. In this sense, at least 200 individuals would be ideal to reach an adequate chi-square, besides our sample was composed of 124 older adults. Ultimately, the maximum likelihood optimization method is often utilized to examine greater consistency in larger samples. To this end, we followed the rule of stability of the average suggested of 5 data points per each variable observed [41].
Therefore, future studies should explore potential moderators (e.g., social support, mental health) to clarify the pathways linking cognition, mood, and QoL in aging populations. Also, longitudinal repeated measured design studies should be conducted to explore these relationships within a period to offer a causal understanding on the outcome.
5. Conclusions
Our findings contribute to the rationale on existing prior literature investigations on cognitive again by shedding light on the factors influencing health-related perception on quality of life in older adults. Our model is grounded in previous evidence that executive function is a key determinant of autonomy and well-being in aging.
Our results highlight the pivotal role of depression in determining quality of life among older adults, even after observing that executive functioning played a minor role than firstly hypothesized.
This approach is relevant for advancing theoretical models of executive functioning on aging developmental perspective and informing interventions aimed at preserving autonomy and psychological health in older adults. Our findings have implications for clinical practice and public health, highlighting the importance of targeting depression, executive function and instrumental activities of daily living to improve quality of life outcomes in older populations. Thus, emphasize the need for integrated approaches that address both cognitive and mood factors in aging.
Author Contributions
Conceptualization, R.C. and C.M.; Methodology, R.C. and C.M.; Software, R.C..; Validation, R.C. and C.M..; Formal analysis, R.C.; Investigation, R.C., M.A. and I.F.; Resources, R.C..; Data curation, R.C., C.M., M.A. and I.F.; Writing—original draft preparation, R.C. and C.M.; Writing—review and editing, R.C. and C.M.; Visualization, R.C., C.M., M.A. and I.F.; Supervision, C.M.; Project administration, R.C. All authors have read and agreed to the published version of the manuscript.
Funding
This research received no external funding.
Institutional Review Board Statement
The study was conducted in accordance with the Declaration of Helsinki, the Health Ministry of Brazil and the National Counsil of Health under resolutions no. 466/12 and no. 510/16 involving research conducted with humans and approved by the Research Ethics Committee of the Federal University of Paraíba (UFPB) (opinion no. 6.879.446 and date of approval 10 June 2024).
Acknowledgments
During the preparation of this study, the authors used Claude AI for the purpose of coding R script for the RStudio analysis. The authors have reviewed and edited the output and take full responsibility for the content of this publication.
Conflicts of Interest
The authors declare no conflicts of interest.
Abbreviations
The following abbreviations are used in this manuscript:
| NESMEP | Center of Studies in Mental Health, Education and Psychometrics |
| UFPB | Federal University of Paraíba |
| QoL | Quality of Life |
| EF | Executive Function |
| IADL | Instrumental Activities of Daily Living |
| ConVExA | Contextually Valid Executive Assessment |
| SEM | Structural Equation Modeling |
| SD | Standard Deviation |
| MCI | Mild Cognitive Impairment |
| n | Number of participants |
| IBGE | Brazilian Institute of Geography and Statistics |
| GDS-15 | 15-item Geriatric Depression Scale |
| PFAQ | Pfeffer’s Functional Activities Questionnaire |
| WHOQOL-BREF | World Health Organization Quality of Live abbreviated version |
| FDT | Five-Digit Test |
| WAIS-III | Wechsler Adult Intelligence Scale, third version |
| p | p-value |
| χ² | Chi-square |
| R² | R-squared (proportion of variance explained) |
| df | Degrees of freedom |
| CFI | Comparative Fit Index |
| TLI | Tucker-Lewis Index |
| RMSEA | Root Mean Square Error of Approximation |
| SRMR | Standardized Root Mean Square Residual |
| GenAI | Generative Artificial Intelligence |
| M | Mean |
| r | Correlation coefficent |
| WM | Working memory |
| CF | Cognitive flexibility |
| IC | Inhibitory control |
| B or β | Standardized coefficient |
| SE | Standard Error |
| CI | Confidence Interval |
| AVE | Average Variance Extracted |
| AIC | Akaike Information Criterion |
| BIC | Bayesian Information Criterion |
| LL | Lower Limit |
| UL | Upper Limit |
References
- Livingston, G.; Huntley, J.; Liu, K.Y.; Costafreda, S.G.; Selbæk, G.; Alladi, S.; Ames, D.; Banerjee, S.; Burns, A.; Brayne, C.; et al. Dementia prevention, intervention, and care: 2024 report of the Lancet standing Commission. Lancet 2024, 404, 572–628. [Google Scholar] [CrossRef]
- Castro-Costa, É.; Diniz, B.S.; Blay, S.L. Editorial: Cognitive Impairment and Inflammation in Old Age and the Role of Modifiable Risk Factors of Neurocognitive Disorders. Front. Psychiatry 2021, 12. [Google Scholar] [CrossRef] [PubMed]
- Moraes, E.; Pereira, A.; Azevedo, R.; Moraes, F. Avaliação Multidimensional do Idoso; Secretaria de Estado da Saúde do Paraná: Curitiba, Brazil, 2017. [Google Scholar]
- Instituto Brasileiro de Geografia e Estatística. Censo Demográfico 2022: População por Idade e Sexo: Pessoas de 60 Anos ou Mais de Idade: Resultados do Universo: Brasil, Grandes Regiões e Unidades da Federação; IBGE: Rio de Janeiro, Brazil, 2023. [Google Scholar]
- World Health Organization. Decade of Healthy Ageing: Baseline Report. 2020. Available online: https://www.who.int/publications/i/item/9789240017900 (accessed on 15 October 2024).
- Gattuso, M.; Butti, S.; Benincá, I.L.; Greco, A.; Di Trani, M.; Morganti, F. A Structural Equation Model for Understanding the Relationship between Cognitive Reserve, Autonomy, Depression and Quality of Life in Aging. Int. J. Environ. Res. Public Heal. 2024, 21, 1117. [Google Scholar] [CrossRef]
- Fleck, M.P.A.; Louzada, S.; Xavier, M.; et al. Application of the Portuguese Version of the WHOQOL-bref Instrument. Revista de Saúde Pública 2000, 34(2), 178–183. [Google Scholar] [CrossRef]
- World Health Organization. The World Health Organization Quality of Life Assessment (WHOQOL): Position Paper from the World Health Organization. Social Science & Medicine 1995, 41, 1403–1409. [Google Scholar] [CrossRef]
- Silva, J.V.; Baptista, M.N. Quality of Life and Advanced Activities of Daily Living among Older Adults: A Cross-Sectional Study. Braz. J. Dev. 2023, 9(3), 11939–11958. [Google Scholar]
- Souza-Júnior, E.V.; Silva, C.S.; Cruz, D.P.; et al. Sexuality and Depressive Symptomatology in Elderly Residents in Northeastern Brazil. Enfermería Global 2021, 64, 202–214. [Google Scholar]
- Guye, S.; Röcke, C.; Martin, M.; von Bastian, C.C. Functional Ability in Everyday Life: Are Associations With an Engaged Lifestyle Mediated by Working Memory? Journals Gerontol. Ser. B 2019, 75, 1873–1883. [Google Scholar] [CrossRef] [PubMed]
- Xue, H.; Huang, C.; Zhu, Q.; Zhou, S.; Ji, Y.; Ding, X.; Zhang, D.; Gu, D. Relationships Among Cognitive Function, Frailty, and Health Outcome in Community-Dwelling Older Adults. Front. Aging Neurosci. 2022, 13, 790251. [Google Scholar] [CrossRef]
- Raimo, S.; Maggi, G.; Ilardi, C.R.; Cavallo, N.D.; Torchia, V.; Pilgrom, M.A.; Cropano, M.; Roldán-Tapia, M.D.; Santangelo, G. The relation between cognitive functioning and activities of daily living in normal aging, mild cognitive impairment, and dementia: a meta-analysis. Neurol. Sci. 2024, 45, 2427–2443. [Google Scholar] [CrossRef]
- Bruderer-Hofstetter, M.; Gorus, E.; Cornelis, E.; Meichtry, A.; De Vriendt, P. Influencing factors on instrumental activities of daily living functioning in people with mild cognitive disorder – a secondary investigation of cross-sectional data. BMC Geriatr. 2022, 22, 1–14. [Google Scholar] [CrossRef]
- Velaithan, V.; Tan, M.-M.; Yu, T.-F.; Liem, A.; Teh, P.-L.; Su, T.T. The Association of Self-Perception of Aging and Quality of Life in Older Adults: A Systematic Review. Gerontol. 2023, 64. [Google Scholar] [CrossRef]
- Verga, C.E.R.; dos Santos, G.; Ordonez, T.N.; Moreira, A.P.B.; Costa, L.A.; de Moraes, L.C.; Lessa, P.; Cardoso, N.P.; França, G.D.; Neto, A.F.; et al. Executive functions, mental health, and quality of life in healthy older adults. Dement. Neuropsychol. 2024, 18, e20240156. [Google Scholar] [CrossRef]
- Ribeiro, O.; Teixeira, L.; Araújo, L.; Rodríguez-Blázquez, C.; Calderón-Larrañaga, A.; Forjaz, M.J. Anxiety, Depression and Quality of Life in Older Adults: Trajectories of Influence across Age. Int. J. Environ. Res. Public Heal. 2020, 17, 9039. [Google Scholar] [CrossRef]
- Suchy, Y. Introduction to special issue: Contextually valid assessment of executive functions in the era of personalized medicine. Clin. Neuropsychol. 2020, 34, 613–618. [Google Scholar] [CrossRef]
- Suchy, Y.; Ziemnik, R.E.; Niermeyer, M.A.; Brothers, S.L. Executive functioning interacts with complexity of daily life in predicting daily medication management among older adults. Clin. Neuropsychol. 2019, 34, 797–825. [Google Scholar] [CrossRef] [PubMed]
- Lezak, M.D.; Howieson, D.B.; Loring, D.W.; Fischer, J.S. Neuropsychological Assessment, 5th ed.; Oxford University Press: New York, NY, USA, 2012. [Google Scholar]
- Suchy, Y.; Niermeyer, M.A.; Franchow, E.I.; Ziemnik, R.E. Naturally Occurring Expressive Suppression is Associated with Lapses in Instrumental Activities of Daily Living Among Community-Dwelling Older Adults. J. Int. Neuropsychol. Soc. 2019, 25, 718–728. [Google Scholar] [CrossRef] [PubMed]
- Suchy, Y. Executive Functioning: A Comprehensive Guide for Clinical Practice; Oxford University Press: New York, NY, USA, 2015. [Google Scholar]
- Suchy, Y.; Mora, M.G.; DesRuisseaux, L.A.; Brothers, S.L. It’s complicated: Executive functioning moderates impacts of daily busyness on everyday functioning in community-dwelling older adults. J. Int. Neuropsychol. Soc. 2023, 29, 850–858. [Google Scholar] [CrossRef]
- Satler, C.; Faria, E.T.; Rabelo, G.N.; Garcia, A.; Tavares, M.C.H. Inhibitory control training in healthy and highly educated older adults. Dement. Neuropsychol. 2021, 15, 387–395. [Google Scholar] [CrossRef] [PubMed]
- Corbo, I.; Troisi, G.; Marselli, G.; Casagrande, M. The role of cognitive flexibility on higher level executive functions in mild cognitive impairment and healthy older adults. BMC Psychol. 2024, 12, 1–11. [Google Scholar] [CrossRef]
- El-Sayed, M.M.; Hawash, M.M.; Khedr, M.A.; Hafez, S.A.; Salem, E.-S.A.E.-H.; Essa, S.A.; Sayyd, S.M.; El-Ashry, A.M. Cognitive flexibility's role in shaping self-perception of aging, body appreciation, and self-efficacy among community-dwelling older women. BMC Nurs. 2024, 23, 1–11. [Google Scholar] [CrossRef]
- Fonseca, C.; Morgado, B.; Alves, E.; Ramos, A.; Silva, M.R.; Pinho, L.; João, A.; Lopes, M. The Functional Profile, Depressive Symptomatology, and Quality of Life of Older People in the Central Alentejo Region: A Cross-Sectional Study. Healthcare 2024, 12, 2303. [Google Scholar] [CrossRef] [PubMed]
- Luo, M.; Moulder, R.G.; Breitfelder, L.K.; Röcke, C. Daily activity diversity and daily working memory in community-dwelling older adults. Neuropsychology 2023, 37, 181–193. [Google Scholar] [CrossRef]
- Yesavage, J.A.; Brink, T.L.; Rose, T.L.; Lum, O.; Huang, V.; Adey, M.; Leirer, V.O. Development and validation of a geriatric depression screening scale: A preliminary report. J. Psychiatr. Res. 1983, 17, 37–49. [Google Scholar] [CrossRef]
- Almeida, O.P.; Almeida, S.A. Short Versions of the Geriatric Depression Scale: A Study of Their Validity for the Diagnosis of a Major Depressive Episode According to ICD-10 and DSM-IV. Int. J. Geriatr. Psychiatry 1999, 14(10), 858–865. [Google Scholar] [CrossRef]
- Pfeffer, R.I.; Kurosaki, T.T.; Harrah, C.H.; Chance, J.M.; Filos, S. Measurement of Functional Activities in Older Adults in the Community. J. Gerontol. 1982, 37, 323–329. [Google Scholar] [CrossRef] [PubMed]
- Sanchez, M.A.d.S.; Correa, P.C.R.; Lourenço, R.A. Cross-cultural Adaptation of the "Functional Activities Questionnaire - FAQ" for use in Brazil. Dement. Neuropsychol. 2011, 5, 322–327. [Google Scholar] [CrossRef] [PubMed]
- The Whoqol Group. Development of the World Health Organization WHOQOL-BREF Quality of Life Assessment. Psychol. Med. 1998, 28, 551–558. [Google Scholar] [CrossRef]
- Fleck, M.P.A.; Louzada, S.; Xavier, M.; Chachamovich, E.; Vieira, G.; Santos, L.; Pinzon, V. Aplicação da versão em português do instrumento abreviado de avaliação da qualidade de vida “WHOQOL-bref”. Rev. Saúde Pública 2000, 34(2), 178–183. Available online: https://www.fsp.usp.br/rsp. [CrossRef]
- Sedó, M.; de Paula, J.J.; Malloy-Diniz, L.F. O Teste dos Cinco Dígitos; Hogrefe, 2015. [Google Scholar]
- De Paula, J.J.; Oliveira, T.D.; Querino, E.H.G.; Malloy-Diniz, L.F. The Five Digits Test in the assessment of older adults with low formal education: construct validity and reliability in a Brazilian clinical sample. Trends Psychiatry Psychother. 2017, 39, 173–179. [Google Scholar] [CrossRef]
- Nascimento, E. Validação e adaptação do teste WAIS-III para um contexto brasileiro. Tese de Doutorado, Universidade de Brasília, Brasília, 2000. [Google Scholar]
- Nascimento, E.D.; de Figueiredo, V.L.M. WISC-III e WAIS-III: alterações nas versões originais americanas decorrentes das adaptações para uso no Brasil. Psicol. E Crit. 2002, 15, 603–612. [Google Scholar] [CrossRef]
- Suchy, Y.; Brothers, S.L. Reliability and validity of composite scores from the timed subtests of the D-KEFS battery. Psychol. Assess. 2022, 34, 483–495. [Google Scholar] [CrossRef]
- Kline, R.B. Principles and Practice of Structural Equation Modeling; 2011. [Google Scholar]
- Zhang, H. Structural Equation Modeling. In Models and Methods for Management Science; Zhang, H., Ed.; Springer: Cham, Switzerland, 2022; pp. 199–215. [Google Scholar] [CrossRef]
- Anthropic. Claude (Claude 3 Opus version) [Large language model]. 2025. Available online: https://claude.ai/ (accessed on 16 July 2025).
- Salthouse, T.A. The aging of working memory. Neuropsychology 1994, 8, 535–543. [Google Scholar] [CrossRef]
- Salthouse, T.A. Trajectories of normal cognitive aging. Psychol. Aging 2019, 34, 17–24. [Google Scholar] [CrossRef]
- Yi, Y.; Park, Y.-H. Structural equation model of the relationship between functional ability, mental health, and quality of life in older adults living alone. PLOS ONE 2022, 17, e0269003. [Google Scholar] [CrossRef]
- Huijun, L.; Xiange, Z.; Ming, Y.; Jiayi, S.; Juanjuan, P.; Wangquan, X.; Yueli, S.; Guixia, F. The mediating role of daily living ability and sleep in depression and cognitive function based on a structural equation model. BMC Geriatr. 2025, 25, 1–10. [Google Scholar] [CrossRef] [PubMed]
- Li, H.; Wang, C. The Relationships Among Structural Social Support, Functional Social Support, and Loneliness in Older Adults: Analysis of Regional Differences Based on a Multigroup Structural Equation Model. Front. Psychol. 2021, 12. [Google Scholar] [CrossRef] [PubMed]
- Muhammad, T.; Kumar, P.; Srivastava, S. How socioeconomic status, social capital and functional independence are associated with subjective wellbeing among older Indian adults? A structural equation modeling analysis. BMC Public Heal. 2022, 22, 1–12. [Google Scholar] [CrossRef] [PubMed]
- Navarra, G.A.; Tabacchi, G.; Scardina, A.; Agnese, M.; Thomas, E.; Bianco, A.; Palma, A.; Bellafiore, M. Functional fitness, lifestyle and demographic factors as predictors of perceived physical and mental health in older adults: A structural equation model. PLOS ONE 2023, 18, e0290258. [Google Scholar] [CrossRef]
- Oliveira, N.G.N.; Bolina, A.F.; Haas, V.J.; Tavares, D.M.d.S. Exploring the effect of the structural model of active aging on the self-assessment of quality of life among older people: A cross-sectional and analytical study. Sao Paulo Med J. 2024, 142, e2022609. [Google Scholar] [CrossRef]
- Mo, P.K.H.; Wong, E.L.Y.; Yeung, N.C.Y.; Wong, S.Y.S.; Chung, R.Y.; Tong, A.C.Y.; Ko, C.C.Y.; Li, J.; Yeoh, E.-K. Differential associations among social support, health promoting behaviors, health-related quality of life and subjective well-being in older and younger persons: a structural equation modelling approach. Heal. Qual. Life Outcomes 2022, 20, 1–12. [Google Scholar] [CrossRef] [PubMed]
- de León, L.P.; Mangin, J.P.L.; Ballesteros, S. Psychosocial Determinants of Quality of Life and Active Aging. A Structural Equation Model. Int. J. Environ. Res. Public Heal. 2020, 17, 6023. [Google Scholar] [CrossRef]
- Benincá, I.L.; Gattuso, M.; Butti, S.; Caccia, D.; Morganti, F. Emotional Status, Motor Dysfunction, and Cognitive Functioning as Predictors of Quality of Life in Physically Engaged Community-Dwelling Older Adults: A Structural Equation Modeling Approach. Int. J. Environ. Res. Public Heal. 2024, 21, 1469. [Google Scholar] [CrossRef]
- Dantas, B.A.d.S.; Cavalcante, A.C.V.; de Miranda, J.M.A.; Toscano, G.A.d.S.; Nobre, T.T.X.; Mendes, F.R.P.; de Miranda, F.A.N.; Maia, E.M.C.; Torres, G.d.V. Depression and quality of life in Brazilian and Portuguese older people communities. Medicine 2021, 100, e27830. [Google Scholar] [CrossRef]
- Pinto, J.O.; Pontes, D.; Peixoto, B.; Dores, A.R.; Barbosa, F. Ecological validity of neuropsychological interventions: A systematic review. Appl. Neuropsychol. Adult 2024, 1–20. [Google Scholar] [CrossRef] [PubMed]
- Suchy, Y.; DesRuisseaux, L.A.; Mora, M.G.; Brothers, S.L.; Niermeyer, M.A. Conceptualization of the term “ecological validity” in neuropsychological research on executive function assessment: a systematic review and call to action. J. Int. Neuropsychol. Soc. 2024, 30, 499–522. [Google Scholar] [CrossRef] [PubMed]
Table 1.
Descriptive Statistical Results of Demographic and Clinical Data (n = 124).
| Item | Mean (SD) | n (%) |
| Age | 69.16 (7.32) | |
| Education (years) | 9.67 (5.24) | |
| Marital Status | ||
| Married | 53 (42.7) | |
| Divorced | 27 (21.8) | |
| Widowed | 24 (19.4) | |
| Single | 18 (14.5) | |
| Stable Union | 2 (1.6) | |
| Income | ||
| 1 minimum wage | 56 (45.2) | |
| 3 to 5 minimum wages | 30 (24.2) | |
| Up to 2 minimum wages | 19 (15.3) | |
| 6 to 10 minimum wages | 14 (11.3) | |
| More than 10 minimum wages | 5 (4.0) | |
| Reported Diseases in the Past 2 Years (2023-2025) | ||
| High/low blood pressure (hypertension) | 95 (76.61) | |
| Arthritis, arthrosis, rheumatism or other musculoskeletal diseases | 49 (39.52) | |
| Anxiety | 38 (30.65) | |
| Diabetes | 36 (29.03) | |
| Chronic sleep problems | 29 (23.39) | |
| COVID-19 | 27 (21.77) | |
| Depression | 20 (16.13) | |
| Recurrent stomach problems, diarrhea | 17 (13.71) | |
| Migraine | 15 (12.10) | |
| Hearing impairment | 12 (9.68) | |
| Fibromyalgia | 8 (6.45) | |
| High fever | 8 (6.45) |
Table 2.
Descriptive Statistics and Correlation Matrix.
| Variable | M | SD | (1) | (2) | (3) | (4) | (5) | (6) | (7) | (8) | (9) | |
| (1) WM (2) CF (3) IC |
3.99 | 1.75 | — | |||||||||
| 46.40 | 35.27 | -0.21* | — | |||||||||
| 36.17 | 38.28 | -0.20* | 0.73*** | — | ||||||||
| (4) Physical (5) Social |
14.07 | 2.41 | 0.06 | -0.08 | -0.14 | — | ||||||
| 15.20 | 3.25 | 0.09 | 0.05 | 0.03 | 0.38*** | — | ||||||
| (6) Environment (7) Psychological (8) IADL (9) Depression |
14.36 | 2.70 | 0.20* | -0.07 | -0.13 | 0.38*** | 0.61*** | — | ||||
| 14.68 | 2.39 | 0.11 | -0.01 | -0.12 | 0.35*** | 0.31*** | 0.52*** | — | ||||
| 1.72 | 3.70 | -0.19* | 0.19* | 0.19* | -0.27** | 0.04 | -0.12 | -0.13 | — | |||
| 2.73 | 2.37 | -0.07 | 0.04 | 0.07 | -0.38*** | -0.25** | -0.44*** | -0.35*** | 0.19* — | |||
M = mean; SD= standard deviation. Correlations are shown below the diagonal. *p < .05. **p < .01. ***p < .001.
Table 3.
Factor Loadings for Measurement Model.
| Latent Variable | Indicator | B | SE | β | p |
|
Executive Functions (EF) |
|||||
| Working Memory (MT) | 1.000 | 0.000 | 0.241 | — | |
| Cognitive Flexibility (Flx) | -68.594 | 37.859 | -0.821 | 0.070 | |
| Inhibitory Control (CI) | -80.853 | 40.163 | -0.892 | 0.044 |
B = unstandardized coefficient; SE = standard error; β = standardized coefficient. All loadings statistically significant (p < .001).
Table 4.
Factor Loadings for Measurement Model.
| Index | Value | Criterion |
| Chi-square (χ²) | 10.035 | — |
| Degrees of freedom (df) | 12 | — |
| p-value | 0.613 | > .05 |
| Comparative Fit Index (CFI) | 1.000 | ≥ .90 |
| Root Mean Square Error of Approximation (RMSEA) | 0.000 | ≤ .08 |
| Standardized Root Mean Square Residual (SRMR) | 0.041 | ≤ .08 |
| Akaike Information Criterion (AIC) | 5806.51 | Lower |
| Bayesian Information Criterion (BIC) | 5896.76 | Lower |
Model estimated using maximum likelihood estimation. Fit criteria based on Kline [40].
Disclaimer/Publisher’s Note: The statements, opinions and data contained in all publications are solely those of the individual author(s) and contributor(s) and not of MDPI and/or the editor(s). MDPI and/or the editor(s) disclaim responsibility for any injury to people or property resulting from any ideas, methods, instructions or products referred to in the content. |
© 2025 by the authors. Licensee MDPI, Basel, Switzerland. This article is an open access article distributed under the terms and conditions of the Creative Commons Attribution (CC BY) license (http://creativecommons.org/licenses/by/4.0/).
Copyright: This open access article is published under a Creative Commons CC BY 4.0 license, which permit the free download, distribution, and reuse, provided that the author and preprint are cited in any reuse.


