Submitted:
11 December 2025
Posted:
14 December 2025
You are already at the latest version
Abstract
Voice-based approaches for screening and diagnostic applications, particularly in telemedicine, often rely on patient recordings collected outside clinical environments. Establishing normative baselines is essential to advance voice analytics and clinical utility. This pilot study examined acoustic parameters in 32 healthy young adults (ages 18–24) with no history of vocal pathology, neurological disorders, or speech impediments. Participants provided paired recordings of sustained vowels (/a/, /e/, /o/, /u/) and a standardized phonetically balanced phrase (“The sun sets in Cincinnati on Saturday”). Analyses focused on features including fundamental frequency, jitter, shimmer, harmonics-to-noise ratio, formants (F1–F3), speaking rate, intensity, and spectral measures. Preliminary results revealed significant differences between healthy controls and a reference dataset of laryngitis patients, suggesting acoustic features can serve as objective markers of vocal fold inflammation. However, pathology-specific biomarker identification was constrained by the quality of available laryngitis data. Simple statistical comparisons proved insufficient, emphasizing the value of advanced measures such as cepstral peak prominence (CPP) and mel-frequency cepstral coefficients (MFCC). Challenges in non-clinical data collection highlight the need for standardized, detailed annotation of patient recordings to improve diagnostic accuracy and strengthen the predictive power of future biomarker studies.
Keywords:
voice
; biomarker
; statistical baseline
; healthy adults
; clinical trial
1. Introduction
The human voice, a complex acoustic output, is increasingly recognized as a promising, non-invasive, and cost-effective biomarker in healthcare [1,2]. Voice contains intricate acoustic markers that have been linked to a wide array of health conditions, including neurodegenerative diseases such as dementia, mood disorders, and even various forms of cancer [1,3]. The expanding field of vocal biomarkers, defined as features from the audio signal of the voice associated with a clinical outcome, holds significant potential for patient monitoring, disease diagnosis, grading of severity, depression [4] and even drug development [5,6].
The inherent simplicity and accessibility of voice data collection, often achievable through commonly used technologies like smartphones, positions it as a cost-effective, highly scalable, and patient-friendly diagnostic and monitoring tool [6]. Indeed, this ease of collection and analysis has the potential to transform voice analysis from a specialized clinical assessment into a potential public health tool outside of clinical settings. It is easy to imagine how the convergence of voice science with advanced analytics and remote monitoring technologies can transform voice analytics into a tool for health assessment. AI-enhanced ambient listening tools are already being explored for cognitive and behavioral health assessments, with a clear trend towards broader language, population, and condition coverage [7]. The broader trend in vocal biomarker development, exemplified by initiatives like the Bridge2AI-Voice project (which aims to create ethically sourced flagship datasets for AI research) elevates the foundational importance of well-characterized healthy subject and pathology data baselines [1].
This work advances voice biomarker research by examining two key dimensions using recordings from a pilot study of healthy young adults in non-clinical settings. First, we address a gap in the literature - which often focuses on older adults or clinical populations with vocal deficits - by creating a dataset from college-age participants without pathology. This ensures clarity in data acquisition and annotation, overcoming limitations of existing public datasets. Second, we evaluate the utility of these healthy recordings as an external control benchmark against the Saarbrücken Voice Database (SVD) [8,9,10] which provides detailed pathological voice samples, including laryngitis across diverse demographics. Together, these analyses - healthy cohort characterization and benchmarking against pathology - define the scope and primary contributions of our study, highlighting the importance of normative baselines and comparative frameworks for advancing diagnostic voice analytics.
1.1. The Relationship Between Static and Dynamic Speech Components
The relationship between the acoustic properties of static (isolated) vowels and their manifestation in dynamic connected speech derives from the intersection of phonetics and speech technology[11]. While not always immediately obvious, an understanding of this link yields significant practical applications across various domains, primarily revolving around the phenomenon of “coarticulation” where the articulation of one speech sound is influenced by the preceding and following sounds. Coarticulation occurs when articulators such as the lips, jaw, and tongue anticipate the next sound before the current one is fully produced [12]. This anticipation creates acoustic shifts, meaning the ideal static vowel target is not always reached. Emerging applications such as speech recognition operate in everyday environments (i.e. telemedicine, mobile devices, or remote monitoring) and thus the ability to connect static vowel targets with their dynamic transitions becomes important in linguistics. Understanding the link between static and dynamic speech carries broad implications across fields ranging from speech synthesis to forensic phonetics and language learning.
In automatic speech recognition (ASR), formant frequencies are central to identifying vowels. Because coarticulation alters vowel realization in connected speech, models that account for both static targets and dynamic variations improve accuracy. Incorporating undershoot patterns toward vowel targets enhances word recognition and overall system performance [13].
Speech synthesis also benefits from coarticulatory modeling. Early systems that relied on static phoneme concatenation produced robotic speech. High-quality synthesis requires capturing natural transitions between sounds [14]. Modeling trajectories toward and away from static targets allows for more fluid, human-like output, such as distinguishing vowel transitions in words like “cat” versus “bat.” [15]
Forensic phonetics and speaker identification rely on unique dynamic features shaped by vocal tract morphology and habitual speech patterns [16]. Integrating static vowel data with dynamic trajectories enables more precise acoustic profiles. This combined approach strengthens methodologies for identifying speakers from recorded samples [17].
Finally, second language acquisition (SLA) highlights differences between native and non-native speech. Learners often produce isolated words closer to static forms, while native speakers reduce articulation in connected speech[18]. Teaching the distinction between static pronunciation and dynamic realization improves both production and comprehension[19]. Knowledge of the static-to-dynamic link is thus a key pedagogical element in SLA[20].
1.2. Core Acoustic Measurements
The current work involves the measurement and analysis of the core acoustic parameters briefly summarized in Table 1. In voice research, commonly referenced acoustic analysis parameters fall into two categories: (a) traditional measures and (b) newer cepstral/multidimensional measures. Traditional parameters, long used in voice analysis software (such as Python Praat scripts), provide specific, quantifiable insights into the biomechanical function and health of the vocal system and are frequently cited in literature for comparative research. However, their variability and sometimes limited diagnostic insight in certain contexts have led researchers to explore alternative approaches. Some studies favor measures like Mel-Frequency Cepstral Coefficients (MFCC) and spectrogram-based analyses, which offer improved pathology assessment reliability and richer information about voice characteristics.
1.3. Healthy Voice Baseline as an External Control
It has been proposed that a prerequisite for using voice as a reliable biomarker is the establishment of comprehensive baselines of healthy vocal patterns [21]. These baselines are essential for accurate comparison with pathological voices, forming the foundation for screening, diagnosis, and remote monitoring [7,21,22]. Because vocal features vary with demographic factors such as gender, age, and ethnicity, diverse global datasets are required [21,23]. Without standardized baselines across populations, identifying pathological deviations becomes unreliable, limiting the clinical adoption of vocal biomarkers. The human voice is a complex physiological signal generated by the coordinated action of the respiratory system, the larynx, and the vocal tract [24]. The fundamental principle underlying voice pathology detection is that any disease or pathology affecting these structures will inevitably produce measurable acoustic deviations from a typical, "healthy" voice.
In clinical research, the strongest method for tracking pathology is intra-subject comparison - evaluating a patient’s condition against their own pre-pathology state[25]. This approach accounts for individual biological variability and strengthens causal inference. However, ideal pre-pathology baselines are often unavailable due to acute onset, late diagnosis, or retrospective data collection. In such cases, external controls are used, drawing on data from other patients or prior studies [26].
While external controls risk “metric arbitrariness,” (where pathology variables may lack consistent meaning or scale), utilizing well-characterized healthy voice studies mitigates this bias by providing stable reference points [27]. These external baselines often prove more reliable than noisy person-specific data, particularly when pathology develops gradually. Ultimately, this approach enhances diagnostic accuracy and strengthens the predictive power of clinical trials.

| Acoustic Parameter | Definition | Significance |
| Fundamental Frequency (F0) | Average rate of vibration of the vocal folds (Hz) | Determines vocal clarity and intensity |
| Mean Fundamental Frequency | Average rate of vocal fold vibration across a sustained sound or speech sample. | It reflects overall pitch control and can shift with inflammation, strain, or other abnormalities. |
| Minimum Fundamental Frequency | Minimum Fundamental Frequency is the lowest pitch produced for a sample. | Indicates the lower limit of vocal fold vibration and drop w/ edema or impaired vibratory control. |
| Jitter Variance | Fundamental frequency variation over a period of time. | Measure of pitch stability; relevant to vowels, not phrases. Measured as a fraction. |
| Harmonics-to-Noise Ratio (HNR) | HNR quantifies how much harmonic (periodic) energy exists compared to noise. | Low HNR signals increased vocal irregularity and potential pathology. |
| Formant Frequencies (F1, F2, F3) | Formants are the resonant frequency peaks shaped by the vocal tract during speech. F1, F2, and F3 are the first three resonant frequency peaks that shape vowel sounds. | Reflect articulatory configuration and are key for distinguishing vowels and detecting pathological resonance changes. They reveal articulatory placement and can shift in predictable ways for vocal tract disrupted by pathology. |
| Intensity | Refers to the perceived loudness of sound, measured as the energy transmitted by vocal vibrations | It reflects the amplitude of vocal fold oscillations and is significant because variations in vocal loudness can indicate pathology. |
| Cepstral Peak Prominence (CPP) | An acoustic measure that quantifies the strength and clarity of the harmonic structure in the voice signal | It reflects vocal quality and stability, with lower CPP often linked to dysphonia or voice disorders. |
| Mel-Frequency Cepstral Coefficients (MFCC) | Features derived from the short-term power spectrum of speech related sound frequency perception. | MFCC’s represent how humans perceive sound frequencies, typically expressed through 13 coefficients, each representing unique vocal tract characteristics. |
| Root-Mean-Square Sound Pressure Level (RSPL) | Average acoustic energy of a voice signal, reflecting vocal loudness and stability over time | RSPL is significant as a biomarker because abnormal variations can indicate vocal fatigue, respiratory issues, or neurological disorders. |
| Maximum Phonation Time (MPT) | The longest duration a person can sustain a vowel sound on one breath. | Reflects respiratory support, vocal fold efficiency, and phonatory control, significant for assessing vocal function and detecting respiratory or laryngeal disorders. |
1.4. Sustained Vowel Phonation and Connected Speech Tasks
Clinicians and researchers have utilized both sustained vowel phonation and connected speech tasks to evaluate vocal function [32]. While sustaining a note isolates how the vocal cords work, speaking in sentences shows how the voice performs in the real world. The inclusion of both sustained vowels and connected speech in voice evaluations is advocated due to the distinct yet complementary information each stimulus provides [33].
Sustained vowel phonation is widely used in voice disorder assessment because it provides a relatively “steady-state” production that minimizes the effects of articulation, intonation, stress, and speaking rate, making intrinsic vocal fold function easier to analyze [34]. These tasks are particularly valuable for measuring stability and regularity of vocal fold vibration, enabling precise evaluation of perturbation parameters such as jitter and shimmer. Their time-invariance and ease of control make sustained vowels a cornerstone of baseline acoustic analysis [34].
In contrast, connected speech offers a realistic view of how individuals use their voices in daily communication. It captures dynamic behaviors such as voice onsets and offsets, pauses, voiceless phonemes, and continuous fluctuations in pitch and intensity shaped by prosody and phonetic context. Many voice disorders manifest primarily under these complex demands, making connected speech essential for evaluating intelligibility and naturalness [35,36].
Professional organizations, including ASHA, support diverse assessment methods that combine sustained vowels with connected speech tasks, integrating auditory-perceptual and laboratory measures [28]. Sustained vowels reveal the “engine” of the voice - the glottal source [32] - while connected speech demonstrates how this engine performs under real communicative “driving conditions.” The analysis of both sustained vowels and short phrases provides a comprehensive approach to characterizing the healthy vocal system. Some studies suggest that sustained vowels and vowel segments from continuous speech can yield similar acoustic and perceptual information, with differences largely tied to voice source variability across segmental and prosodic contexts [32]. Other research, however, shows significant statistical differences between the two tasks. For example, average fundamental frequency (F0) in sentences can be higher than in sustained vowels for men, and perturbation measures such as jitter and shimmer may display distinct patterns [32]. Table 2 summarizes the comparative strengths of sustained vowels versus short phrases for voice analysis.
Sustained vowels offer controlled, stable measures of intrinsic vocal fold function, enabling precise assessment of laryngeal stability. Short phrases, by contrast, capture dynamic performance under natural articulatory and prosodic demands, reflecting how the voice operates in everyday communication [2,32].
Although feature extraction in connected speech is more challenging due to variability, parameters derived from short phrases can sometimes be more reliable indicators of disorders such as hoarseness [32]. Together, sustained vowels and short phrases provide distinct yet equally vital insights into vocal physiology. Their combined use is essential for developing holistic vocal biomarkers and advancing evidence-based voice assessment protocols [28,29].
1.5. Source-Filter Theory for Voice Acoustics Analysis
Identifying what comes from the source (vocal folds) versus the filter (the vocal tract shaped by anatomy) is central to voice science research. In essence, vocal folds are the source of pitch and quality, while vocal tract anatomy provides a filter shaping resonance. Together, they explain voice variations across individuals and differences in individuals’ sound depending on articulation or vocal fold condition.
The source-filter theory of speech production explains how human voices generate distinct sounds through a two-stage process [37,38]. First, the vocal folds vibrate to produce a complex glottal tone, serving as the sound source for voiced phonemes such as vowels, liquids, nasals, and glides. Second, the vocal tract (comprising the throat, mouth, and nose) acts as a filter that shapes this tone into recognizable speech. By selectively amplifying certain frequencies while reducing others, the vocal tract determines which acoustic features reach the listener. Movements of the tongue, lips, and jaw alter the vocal tract’s shape, thereby changing the frequencies that pass through (or are suppressed). This dynamic filtering process is central to the perception of vowel sounds, as different vocal tract configurations create unique patterns of formant frequencies: these are known more commonly as formants, bands of concentrated acoustic energy. Formants are essentially resonant frequencies provide the cues that allow us to distinguish among vowel phonemes and understand spoken language.
Of interest in vocal fold source (phonation) are the fundamental frequency (F0), determined by vocal fold length, tension, and mass. Longer, heavier folds yield a lower F0 while shorter, lighter folds lead to higher F0. Voice quality measures involve different parameters such as jitter and shimmer which are cycle-to-cycle irregularities in frequency and amplitude. Cepstral peak prominence (CPP) is an indicator of breathiness, pressed voice, or overall glottal closure. Phonation pathology and physiology involve nodules, scarring, or stiffness alter vibration patterns, producing acoustic differences independent of vocal tract anatomy.
Commonly examined parameters for the vocal tract filter (anatomy and articulation) are formants F1, F2, and F3 that are resonances shaped by vocal tract length, tongue position, lip rounding, jaw opening. Longer vocal tracts (e.g., adult males) have lower formant frequencies and shorter vocal tracts (e.g., children) lead to higher formants. Individual anatomy has a role through oral cavity size, pharyngeal shape, and nasal coupling. These anatomical differences explain why two people with a similar fundamental frequency F0 can sound distinct. Coarticulation shifts formants in connected speech, but the “range” of possible values is constrained by anatomy. In other words, your mouth takes shortcuts between sounds when you speak quickly, which alters the exact acoustic tone, however, your anatomy sets a hard limit on how far those sounds can drift.
Table 2.
Comparative Strengths of Sustained Vowels vs. Connected Speech (compiled from various sources [32,37,39,40,41]).
| Feature | Sustained Vowels | Connected Speech |
| Type of Vocal Task | Isolated phonation | Dynamic speech production |
| Primary Info Captured |
Vocal fold vibratory stability, laryngeal function | Articulatory coordination, prosody, natural voice use |
| Acoustic Parameters Typically Measured | F0, cepstral peak prominence (CPP), Jitter, Shimmer, HNR, SPL, and MPT | Fundamental frequency F0 variability, SPL range, CPP in context. |
| Advantages | Controlled, repeatable, less articulatory influence, useful for multilingual analysis | Reflects real-life communication, captures dynamic vocal attributes, may be more reliable for qualities like hoarseness |
| Limitations/ Considerations |
May not reflect natural voice use, less dynamic information, many measures easy to extract. | More complex analysis, influenced by speaking rate, intonation, and articulation, thus feature extraction can be more difficult |
1.6. Laryngitis Case Study
In the present work we consider a case study in laryngitis, a common pathology involving the inflammation of the larynx, where the vocal cords reside. The resulting swelling and irritation cause the vocal cords to vibrate irregularly, leading to acoustic changes like hoarseness, reduced pitch range, and increased jitter and shimmer. Quantitatively and qualitatively, the voice's acoustic parameters such as fundamental frequency (F0), intensity, and spectral features will be distinctly different from a pre-pathology or healthy state. Of interest is the correlation between laryngitis (the pathology) and specific voice parameters (the biomarker).
To define differentiating acoustic characteristics, we compared healthy controls against pathological samples from the Saarbrücken Voice Database (SVD). The study focuses on chronic laryngitis - inflammation persisting longer than three weeks - as it reflects ongoing mechanical and environmental stressors (e.g., allergens, irritants) rather than temporary acute infections.
1.7. Research Scope
The pilot study involved 32 participants with the goal to explore how a cohort of this type has the potential to serve as a robust normative baseline in research on biomarkers. We seek to improve our understanding of the merit of the research trial outcomes as an external control for a case study on laryngitis based on voice samples drawn from the Saarbrücken Voice Database (SVD).
The research trial also creates the opportunity to study paired contributions of vowel and phrase data for a healthy profile, and how they diverge in a known pathology. We recognize that reading a phrase will intuitively produce different overall acoustic parameter results [42], but felt that quantification would inform subsequent research.
The general scope of the current work is directly to our interest in expanding available baselines, validating against pathology. Our research questions balance descriptive and comparative inquiry by first defining healthy norms, then contrasting with pathology, and finally evaluating applied utility.
- What are the normative acoustic characteristics of sustained vowel phonations and short phrase productions in healthy young adults?
- How do acoustic profiles from healthy young adults diverge from those in the pathological acute laryngitis from the Saarbrucken Voice Database?
- Can paired vowel and phrase data enhance the process of differentiating healthy versus pathological voice signals?
2. Materials and Methods
2.1. Participants and Ethical Approval
Healthy voice samples were collected from 32 participants (11 females and 21 males) between the ages of 18 and 24 on the Case Western Reserve University campus. The study was approved by the Case Western Reserve University Institutional Review Board. Participation was voluntary, and all individuals provided informed consent before contributing recordings. No personally identifying information was collected; each participant was assigned a numerical code to maintain anonymity.
2.2. Data Collection
Data collection took place in a quiet conference room with minimize background noise and the subject comfortably seated. A voice recorder (Sony ICD-UX570 Digital Voice Recorder) was held approximately 12 inches at about a 45-degree angle longitudinally from the subject to collect voice samples. Participants were instructed to pronounce a series of sustained vowels (/a/, /e/, /i/, /o/, /u/) and to recite the phrase, “The sun sets in Cincinnati on Saturday.” Demographic data (age and gender) and self-reported health status (“Do you feel healthy today?”) were reported before voice capture. A wide variety of voice recorders could have been used for this study; while technology makes a difference in acoustics research [43] and smartphone are becoming popular for research[44], a contemporary survey of “off-the-shelf” commercially available units guided the selection of the Sony recorder [45]. Subjects were requested to speak at their natural pace without any practice runs, so sampling duration varied slightly depending on the rate of speech of the subject. File names of recordings were anonymized by subject numerical code.
2.3. Signal Processing and Feature Extraction
Audio recordings were processed and analyzed using Python-based digital signal processing scripts developed by the research team. File preprocessing included signal normalization to standardize amplitude levels, trimming of silent segments to remove non-speech intervals, and conversion of each recording into a monophonic waveform for consistent analysis. Following preprocessing, spectrograms were generated to visualize acoustic energy across time and frequency, enabling inspection of pitch distribution and vocal energy patterns.
Feature extraction was performed using Python scripting, Microsoft Excel, Praat software [46], and parselmouth.praat and Librosa modules integrated into the Python workflow. Other statistical packages are available for research, but the literature suggests Praat is satisfactory for voice analysis [47]; though differences with other software can influence outcomes[48]. Further, more detailed reviews of estimating F0 have been performed [49] when a more detailed clinical use is required. Voice quality measures such as jitter, shimmer, and harmonics-to-noise ratio were calculated. Fundamental frequency (F0) was derived by extracting a pitch object from each recording, allowing calculation of the mean F0 across the entire sound. Minimum and maximum F0 values were estimated using pitch floor and ceiling settings combined with parabolic interpolation for improved accuracy.
Formant analysis was conducted using Burg’s method, a linear predictive coding technique included in the Praat software. Parameters included a 25 ms time step and window length, a maximum number of 5 formants, and frequency limits appropriate for adult male and female voices. Pre-emphasis from 50 Hz upward was applied to enhance high-frequency components. A Formant object was generated to track time-varying formant trajectories, and the first three formants (F₁, F₂, F₃) were sampled at the temporal midpoint of each sound file and reported in Hertz. This comprehensive process ensured accurate extraction of both spectral and temporal features for subsequent statistical analysis.
Descriptive statistics for each waveform were calculated as mean and standard deviation (±SD). To test differences between cohorts, we applied a two-tailed Student t-Test. The t-distribution non-rejection region corresponded to acceptance of the null hypothesis (H0) suggesting no statistically significant difference existed between datasets. For example, Figure 1 illustrates that at the chosen significance level α=0.05, the critical t-value was 1.997, while the calculated t-Statistic was 1.85. Because |t-Statistic| < t-Critical, we fail to reject H0, indicating no statistically significant difference between data sets; observed variation is likely random rather than a true effect.
All analyses were performed using the Microsoft Excel Data Analysis Toolpak. In addition to comparing t-Statistic with t-Critical, hypothesis testing was confirmed by evaluating the two-tailed p-value (“P(T≤t) two-tail”) against the significance level (α). If p < α, H0 is rejected; otherwise, it is retained. This dual approach ensures clarity and reliability in statistical decision-making. This approach provides an additional method for hypothesis testing by comparing the two-tailed p-value, labeled “P(T≤t) two-tail,” against the chosen significance level (α). If the p-value is less than α, we reject the null hypothesis; otherwise, we fail to reject it. This complements the comparison of the t-statistic with the critical t-value for decision-making.
Statistical evaluation and feature extraction also included calculating the Cepstral Peak Prominence (CPP) values, a widely used acoustic measure that quantifies the overall level of noise present in the vocal signal. It is strongly correlated with the auditory perception of voice quality, making it an important indicator in clinical and research settings. A higher CPP value generally reflects a clearer, more periodic voice signal, whereas lower values suggest increased noise and potential dysphonia. For this study, CPP was calculated using Python-based routines that integrate Parselmouth (Praat) and the Librosa package that also assisted in computing Maximum Phonation Time (MPT), a measure of vocal endurance. In addition, Mel-frequency Cepstral Coefficients (MFCCs) were extracted with the Librosa package to capture short-term spectral characteristics of the voice. MFCCs are commonly used in automatic speech and speaker recognition because they represent the power spectrum in a perceptually relevant way, functioning like a unique “fingerprint” of the voice for machine learning and signal classification tasks.
2.4. Saarbrücken Voice Database for Laryngitis Case Study
A systematic search of institutional and publicly available voice repositories was conducted to identify suitable acoustic datasets. Resources varied in sample size (number of recordings), data type (e.g., sustained vowels, sentences, continuous speech), and access permissions, with licensing models often limiting reproducibility. Projects such as PhysioNet [50,51] provide healthy voice samples via credentialed access, while many open-access databases feature small cohorts or narrow pathological focus. Following comparison, the Saarbrücken Voice Database (SVD) [10] was selected as the most comprehensive, fully open-access resource for our laryngitis case study. The SVD offers annotated recordings of both normal and pathological voices, including sustained vowels and standardized sentences. Its laryngitis subset provides controlled pathological phonation, enabling systematic comparison with healthy voices and consistent measurement of fundamental frequency, perturbation, and formant patterns. From the SVD's laryngitis dataset, we selected 18 male subjects (aged 50–60) as a distinct cohort reflecting age and pathology different from young healthy adults.
Although cross-linguistic differences may challenge comparisons between German and English datasets, prior research indicates that basic vowel parameters in healthy adults show notable similarity across languages [21,30,41,52]. These characteristics support the use of the SVD laryngitis subset for validating digital signal processing workflows and benchmarking feature extraction pipelines.
3. Results
3.1. Subject Demographics
Table 3 shows self-reported binary gender (male/female). Subjects were drawn from the CWRU Voice Study (CVS) and the Saarbrücken Voice Database (SVD).
3.2. Healthy Subject Results
Fundamental frequency (F0), determined by vocal fold length, tension, and mass, characterizes phonation. Table 4 and Table 5 present results for vowels and phrases, respectively.
We streamlined analysis to ten key parameters (defined in Table 1) that are relevant to medical voice analysis (phoniatrics) rather than linguistic speech analysis. Choice of parameters for voice vs linguistics relies on this context and emerging consensus standards [29,53]. The abbreviations used for the subsequent data comparisons (Table 6, Table 7, Table 8, Table 9, Table 10, Table 11, Table 12, Table 13 and Table 14) are listed below:
F0 Fundamental frequency, Hz
F3 Third formant frequency, Hz
Jitter Jitter variance, expressed as a fraction
Shimmer Cycle to cycle variation in voice amplitude, expressed as a fraction
HNR Harmoninc-to-noise ratio, dB
Intensity Energy transmitted by vocal vibrations
CPP Cepstral Peak Prominence
MFCCS-1 First Mel-Frequency Cepstral Coefficient
RSPL Root-Mean-Square Sound Pressure Level
MPT Maximum Phonation Time
3.3. Comparison of Healthy Subjects and SVD Subjects with Laryngitis
A paired sample Student t-tests were performed to compare key statistical outcomes between healthy male and female CVS subjects and for healthy male SVD subjects as well as SVD subjects with laryngitis. All data for the calculations is provided in the manuscript supplementary files.
In seeking discriminatory performance, F3 formant has been suggested as generally the best to compare between test subjects for speaker identification [54]. Higher formants (F3 and beyond) carry more speaker-specific characteristics than F1 and F2. F1 and F2 primarily define the vowel quality (which specific vowel sound is being made)[54,55]. Values for F3 and F4 are more determined by the unique anatomical characteristics and overall length of an individual's vocal tract, making them better for speaker discrimination.
3.4. F0 Contour Plots
As noted previously, laryngitis is characterized by inflammation and edema of the vocal folds, which increases their effective mass and reduces their capacity for regular vibration. These physiological changes manifest as distinct visual and statistical artifacts in the fundamental frequency (F0) contour. Figure 2 presents the F0 contours for a healthy male, a healthy female, and a male subject with laryngitis.
Consistent with our earlier calculations, the mean F0 for the healthy female was 215.8 Hz, for the healthy male 116.9 Hz, and for the male with laryngitis 133.5 Hz. The observed contours align with prior findings, reinforcing the expected deviations in periodicity associated with vocal fold pathology.
3.5. Intensity Profiles
Voice intensity profiles provide evidence of an involuntary association between variations in vocal intensity and a speaker’s underlying emotional or cognitive state. Changes in amplitude and energy, for example, often signal heightened emotions such as anger, fear, or excitement, which are typically characterized by elevated mean intensity levels compared to more subdued affective states such as sadness or contentment. Deviations from normative intensity measures may also serve as clinical indicators of medical conditions, including Parkinson’s disease or (in our case) laryngeal pathologies, both of which compromise vocal fold function and respiratory support. Diminished variability in intensity and the presence of prolonged pauses are frequently observed under conditions of increased cognitive load or mental fatigue. These features are illustrated in our results shown in Figure 3.
3.6. Spectrograph
Spectrograms offer a robust method for transforming raw audio into visual representations of frequency variation over time, revealing patterns often lost in averaged data. Unlike waveforms, which depict only amplitude, spectrograms decompose signals into their constituent frequencies. As illustrated in Figure 4, these visual maps highlight formants (specific frequency bands that appear as distinct patterns) facilitating the identification of vowels and consonants essential to speech recognition and linguistic analysis. It is an acquired skill to gain insight through spectrograms, but they admit detailed analysis for the visual isolation of speech impediments and background artifacts, such as hums or clicks, thereby supporting precise diagnostic evaluation and correction.
3.7. MFCC
In this study, we computed Mel-frequency Cepstral Coefficients (MFCCs) using the Praat software. MFCCs are widely used in speech recognition[56,57] because they compactly represent the vocal tract's spectral envelope [58,59]. By mapping frequencies to the non-linear Mel scale (which mimics human auditory perception) MFCCs isolate linguistic content while minimizing background noise [57]. Although influenced by formants, MFCCs are distinct parameters [60]. Figure 6 illustrates MFCCs C2–C12, highlighting the spectral variations between healthy and pathological voice samples. Due to their robustness, MFCCs are a standard feature set in machine learning frameworks [61].
Figure 6 displays MFCCs C2–C12, effectively distinguishing healthy from pathological voices. This visualization enhances separation by revealing subtle acoustic differences often obscured in traditional displays.
4. Discussion
Our discussion of results is structured around our three key research questions outlined in the Introduction.
- What are the normative acoustic characteristics of sustained vowel phonations and short phrase productions in healthy young adults?
- How do acoustic profiles from healthy young adults diverge from those in the pathological acute laryngitis from the Saarbrucken Voice Database?
- Can paired vowel and phrase data enhance the process of differentiating healthy versus pathological voice signals?
4.1. Acoustical Outcomes and Significance
Acoustical statistical outcomes generally support results reported in the literature and affirms many of the parameter values we have obtained [10,30,33,42,52,63,64,65,66,67]. Below, each of the key statistical voice parameters are discussed.
4.1.1. Vocal Frequency
Fundamental Frequency, F0, correlates directly with vocal pitch. In healthy young adults, F0 exhibits clear gender-dependent differences, with females typically having a higher F0 than males [29]. F0 differences were also apparent between the elderly group and the two younger groups[65]. Research also indicates that F0 can show increases or decreases in young adults when subjected to increased cognitive load, suggesting a link between mental stressors and vocal output [30]. While there are some common frameworks for collecting data among specific organizations (NIST guidelines for speaker recognition and IEEE/ASA standards for some acoustic measurements) there is no single set of universal standards for collecting and recording voice analytics. Thus, we anticipated that values of F0 might vary widely. By way of comparison, Table 16 illustrates F0 from other research efforts.
The mean CVS value of 215.8 (SD 26.2)for a healthy female, 116.93 (SD 26.8) for a healthy male from Table 5 compare favorably and consistent with values from the literature in Table 18.
The Student t-Test for healthy CVS female subject pronunciation of F0 for a vowel versus a phrase produced the expected result the null hypothesis H0 was false (Table 6). However, the F0 values for vowel versus phrase for the healthy male were so very nearly equal (116.93 vs 116.76) that H0 tested true, indicating no statistical significance. All other acoustical parameters listed in Table 6 and Table 7 resulted in H0 testing false, an intuitively expected result. Despite the logic of our outcomes, some researchers detected no difference in F0 for male/female, even with pathology [41].
4.1.2. Jitter and Shimmer
Jitter (frequency perturbation) and shimmer (amplitude perturbation) are acoustic measures that quantify the cycle-to-cycle variability in vocal fold vibration. Jitter represents the average variation in period length (often normalized as a coefficient between 0 and 1), while shimmer measures the variation in amplitude or loudness. Historically, these metrics have served as key correlates of dysphonia, with lower values indicating stable vocal fold oscillation[31]. Clinically, elevated jitter may signal vocal fold tension or neurologic tremors, whereas elevated shimmer is often associated with irregular vocal fold contact, vocal fatigue, or a breathy voice quality. Together, these metrics provide a comprehensive assessment of laryngeal function that extends beyond basic pitch analysis.
Regarding diagnostic thresholds, jitter values exceeding 0.5% and shimmer values at or above 5% are generally considered indicative of a pathological voice [24]. However, obtaining reliable measurements outside of a controlled clinical environment remains challenging; factors such as background noise and recording quality can significantly skew results, necessitating ongoing improvements in data collection techniques [68,69]. Methodologically, it is important to note that perturbation measures are widely considered valid only for sustained vowel productions; while our Praat routines calculated these metrics for phrases by default, this distinction is critical for interpretation. Additionally, research comparing young and aged speakers has generally found differences in these values to be nonsignificant, though multiple confounding factors have been proposed to explain this result [64].
Summary values for jitter and shimmer are provided in Table 19. Values, drawn from Table 6, Table 7, Table 10 and Table 14, have been converted from absolute relative number to percentage.
Normative data obtained from healthy adult speakers under controlled clinical conditions typically indicate mean values of jitter (local) in the range of 0.5–0.6% and shimmer (local) between 2.5–5%. However, no universally accepted “gold standard” exists for these perturbation measures, as the reported values are highly dependent on the specific algorithms employed for calculation. The Multi-Dimensional Voice Program (MDVP) has historically served as a reference point, with threshold values often cited as Jitter > 1.04% and Shimmer > 3.81% )[70]. While normative values for Praat-derived fundamental frequency (F0) indices are generally consistent with those reported by MDVP, estimates of jitter and shimmer demonstrate considerable variability across studies. Given that jitter and shimmer measures are highly susceptible to corruption by background noise and require nearly perfectly periodic voice signals, contemporary voice research and clinical practice are increasingly shifting toward more robust acoustic parameters, such as Cepstral Peak Prominence (CPP).
In the current study, data collection was conducted in a university conference room situated adjacent to a high-traffic public area. Background noise adds random energy that Praat interprets as "perturbation," thus increasing Jitter (to 0.8%)and Shimmer (to 5%). We acknowledge that the acoustic environment was not clinically isolated; consistent with prior literature, the presence of ambient noise in this setting may have artificially inflated the calculated values for jitter and shimmer.
4.1.3. Harmonic-to-Noise Ratio
Harmonics-to-Noise Ratio (HNR) quantifies the proportion of harmonic energy relative to noise within the voice signal, thereby reflecting the extent of additive noise present [65]. Clinically, HNR is associated with the perceptual evaluation of hoarseness and breathiness [31]. Additive noise originates from turbulent airflow at the glottis during phonation, typically resulting from incomplete closure of the vocal folds, which permits excessive airflow and generates turbulence. HNR provides an acoustic measure of voice quality by expressing, in decibels, the relationship between the periodic (harmonic) and aperiodic (noise) components of the speech signal [71] and is sometimes considered more important that jitter or shimmer[72]. Like jitter and shimmer, HNR describes the stability and clarity of the vocal fold vibration as indicators of pathology and quality rather than prosody and patterns characteristic of a phrase
Although the harmonic to noise energy is dimensionless, it is often expressed in decibels (dB). Higher HNR values indicate better voice quality, characterized by a stronger harmonic structure and reduced noise, whereas lower values suggest increased noise, often associated with voice disorders. Similar to other perturbation measures such as jitter and shimmer, there is no universally accepted gold standard for HNR. Research suggests that HNR can be a more sensitive index of vocal function than jitter [65]. Ultimately, overall voice quality assessment relies primarily on perceptual evaluation by trained clinicians.
Summary values for jitter and shimmer are provided in Table 19. Values are drawn from Table 6, Table 7, Table 10 and Table 14 have been converted from absolute relative number to percentage.
Identifying a robust baseline for HNR is a challenge. While research outcomes used in Table 20 indicates difference in HNR based on gender, other research does not [52]. Age is conventionally believed to lower HNR, but even in our case of the SVD Male laryngitis, lowering of HNR may be attributable in part to medications taken by the many elderly subjects.
Because no universally accepted gold standard exists for HNR, comparative assessment of our results is compromised. While our observed results appear to be consistent with prior research reports, it remains challenging to support HNR acceptability and relevance within the broader context of voice quality evaluation.
4.1.4. Relative Sound Pressure Level (SPL)
Relative sound pressure level (RSPL) represents the acoustic correlate of vocal loudness in this study. Measurements typically include habitual, minimum, and maximum RSPL values. As with fundamental frequency (F0), RSPL in young adults can fluctuate (increase or decrease) under conditions of heightened cognitive load [32]. For clinical interpretation, relative changes in sound pressure are perceptually meaningful: a shift of approximately 5 dB is clearly noticeable, a 10 dB increase is perceived as roughly twice as loud, and a 20 dB increase as about four times as loud. Shimmer does seem to be impacted by SPL [73], but that assessment was not evident from our data.
4.1.5. Formants
Formants are the resonant frequencies of the vocal track (the air tube from the larynx to the lips) with application to the analysis of vowel sounds as well as to connected speech. While Jitter and HNR measure different aspects of voice quality (frequency variation and periodic-to-noise energy, respectively), formants relate to the vocal tract's resonance and articulation. For a single vowel sound, specific formant values can be extracted, but in connected speech the formats shift in patterns as the speaker moves from one sound to the next. Thus, in presentation of results for the current work, specific values for formants are typically shown in Tables where vowel sounds are analyzed (e.g, Table 12) -- specific values are generally omitted in tables for phrases (e.g., Table 13). Figure 4 illustrates formants for a phrase that are typically depicted as patterns.
In acoustic analysis, the first five formants serve as the bridge between linguistic content and speaker identity. The first two formants (F1 and F2) are the primary determinants of speech intelligibility; their frequencies shift dynamically based on tongue positioning and jaw opening to distinguish specific vowels. Consequently, F1 and F2 drive the majority of conventional speech analysis tasks, such as speech-to-text and sentiment detection. In contrast, the higher formants (F3, F4, and F5) are largely governed by the static morphology of the speaker’s craniofacial and laryngeal structures. Because these frequencies remain relatively stable regardless of articulation, they function as biometric markers of voice quality and timbre.
As mentioned earlier, third formant (F3) is typically of importance when exploring voice pathology. Correlated primarily with vocal tract length, F3 is naturally resistant to voluntary manipulation. Therefore, deviations in F3 are robust indicators of structural or functional abnormalities rather than linguistic variation. Clinical research suggests that F3 captures subtle resonance shifts associated with conditions affecting the oral cavity, palate, or pharyngeal walls. For instance, F3 is a key metric in identifying hypernasality and the articulatory hypokinesia associated with Parkinson’s disease, often revealing pathology more reliably than the highly variable lower formants.
Published formant values vary by demographics and often exclude higher-order formants (F4, F5), limiting direct comparison [76,77]. As shown in Table 21, current findings (CVS) generally align with the range of selected prior studies. Notably, F3 remained relatively stable, contrasting with the expected variability of F1 and F2.
4.1.6. Cepstral Peak Prominence
While Cepstral Peak Prominence (CPP) applies to both sustained phonation and continuous speech, methodological variations can complicate age discrimination [78]. Consistent with prior literature [79], Table 22 shows lower CPP values in continuous speech than in sustained vowels. Furthermore, our findings confirm that vocal pathology reduces CPP.
Cepstral peak prominence (CPP) quantifies the overall level of noise present in the vocal signal and correlates with the auditory perception of overall voice quality. This measure is particularly valuable because it is robust across all types of voice signals [80], making it preferable over traditional perturbation measures for assessing voice quality in various vocal conditions. Healthy, normal voices are typically characterized by higher CPP values. Studies have also observed increased CPP measures in healthy young speakers under cognitive loading, further highlighting its sensitivity to physiological responses.
4.1.7. Mel-Frequency Cepstral Coefficients
Figure 6 illustrates MFCCs C2–C12, demonstrating distinct spectral variations between healthy and pathological voice samples. This visualization enhances the separation between the two categories, highlighting subtle acoustic differences that are often obscured in traditional displays. However, quantitative statistical comparisons presented a more complex picture. As detailed in Table 14, the t-test for the pronunciation of the vowel “a” between healthy CVS males and SVD subjects with laryngitis failed to show significance, although the comparison of fundamental frequency (F0) indicated a significant difference. This suggests that comparing subjects across different demographics (countries) requires analysis more granular than simple descriptive statistics. Conversely, Table 15 shows that for healthy SVD versus SVD laryngitis subjects, the pronunciation of “a” was again non-significant, while F0 remained significant. Furthermore, the analysis of phrase pronunciation between healthy CVS males and SVD laryngitis subjects rejected the null hypothesis, yet the F0 comparison in this instance did not show significance - a seemingly counter-intuitive result.
Overall, while the spectral and MFCC plots provide clear visual evidence of vocal pathology, prediction measures based on general statistical averages proved inconsistent. This discrepancy underscores the lack of a standardized healthy baseline, which complicates the utility of simple statistical comparisons.
4.1.8. Maximum Phonation Time
Maximum Phonation Time (MPT) measures the longest duration a sustained vowel can be produced on a single breath [10]. Normative data exists for adults, with typical ranges of 25-35 seconds for adult males and 15-25 seconds for adult females [34,81]. This measure provides insight into respiratory support and phonatory endurance. Our results appear to be inconsistent with reference literature and intuitive. While established normative data typically range between 10 and 20 seconds, with durations below 10 seconds indicative of laryngeal pathology, the values observed in this study were significantly lower, averaging only 2 to 3 seconds. We attribute this deviation primarily to methodological constraints in the elicitation protocol rather than physiological deficits in the cohort. First, the variability suggests that instructional delivery may have been insufficient; accurate MPT collection requires explicit coaching to ensure subjects inhale maximally and maintain consistent subglottal pressure. Second, environmental factors, specifically ambient noise, likely compromised the acoustic signal-to-noise ratio, affecting the accurate detection of phonation offset. Finally, the protocol may have suffered from insufficient trial repetition. Literature indicates that relying on single or dual attempts is unreliable due to the learning effect; typically, three to five trials are requisite to elicit a representative maximal effort. Consequently, these findings highlight the necessity for rigorous procedural standardization and environmental control in future aerodynamic assessments.
4.2. Divergence of Acoustical Profiles Between Healthy and Voices with Pathology
One objective of our research was to explore if acoustic profiles from healthy young adults diverge from those observed in pathological cases, specifically in the case of acute laryngitis from the Saarbrücken Voice Database.
Paired-sample Student t-tests were conducted to compare acoustic outcomes across healthy CVS subjects and SVD subjects, including those with laryngitis. For vowel pronunciation, comparisons between healthy CVS males and SVD males with laryngitis showed that the null hypothesis was accepted for F0, F3, jitter, and shimmer, while CPP and MFCCs rejected the null, indicating significant differences in these spectral measures. A similar comparison reported in Table 15 found the null hypothesis accepted for F0, F3, and jitter, but rejected for shimmer and CPP, consistent with the pattern observed in healthy male subjects. When analyzing phrase pronunciation, results were less consistent: there was a tendency to reject the null hypothesis for F0 and MFCCs, while CPP accepted the null, aligning with earlier findings in Table 8 comparing healthy CVS and SVD males. Unexpectedly, phrase-level comparisons between healthy SVD males and those with laryngitis universally affirmed the null hypothesis, despite the intuitive expectation of differences. Language comparisons revealed that English versus German phrase pronunciation showed clear differences, but within German speakers no differences were detected, even when one cohort had laryngitis.
Given that acoustic measures change with age [63,82] the results in Table 17 are somewhat surprising. To compare with Parkinson’s disease, values are expected to different [83] since this a neurodegenerative disorder that affects motor efficiency which is also required for voice production.
Overall, these outcomes suggest that traditional measures such as F0, F3, jitter, and shimmer are low-dimensional and prone to variability, which limits their ability to consistently reject the null hypothesis. In contrast, CPP and MFCCs are higher-dimensional, more robust descriptors of voice quality and spectral shape, making them more sensitive to systematic differences across groups. Some non-intuitive results may also reflect the lack of differentiation between mild and severe cases of laryngitis in the dataset.
4.3. Utility of Comparative Results from Paired Vowel Sources and Phrase Data
One aim of the current work was to explore the comparative diagnostic utility of paired vowel and phrase data in differentiating healthy versus pathological voice signals. Three outcomes are of interest.
Statistical Verification of Acoustic Differences. Table 6 and Table 7 consistently demonstrate significant differences when comparing the key statistical parameters of isolated vowel pronunciation versus phrase pronunciation within the Case Western Voice Study. As anticipated, the null hypothesis is rejected for all 10 parameters across both genders. These statistical results confirm that isolated vowels act as "steady-state" snapshots, whereas connected speech functions as a dynamic, moving target.
Spectral Analysis and Anatomical Constraints. While simple statistics highlight the divergence between the two modes of speech, Figure 5 provides deeper insight by mapping formants onto spectral diagrams. For example, while the mean F3 value for a healthy female shows a numerical discrepancy (2784 Hz for the vowel vs. 3320 Hz for the phrase), the spectral visualization suggests a stronger underlying relationship: the trend of F3 as a function of time maintains a baseline established by the vowel sound. This suggests that the isolated vowel does not "cause" the phrase to be spoken a certain way; rather, fixed physical constraints (specifically vocal tract length) determine the formants for the single vowel and subsequently govern the values observed in connected speech. Consequently, the single vowel serves as a stable, anatomical reference point.
Implications for Dynamic Modeling. The evidence presented in Figure 5 suggests that future analysis should move beyond exclusive reliance on simple statistical comparisons. Instead, static parameters should be embedded within dynamic models that capture how prosody, coarticulation, and articulation rate modulate the acoustic output over time [85]. Mathematically, this supports treating static vowel parameters as latent states and connected speech as their time-evolving observations. By using a state-space model to effectively "animate" the vowels, one can model how the "ideal" or "target" acoustic realization of the single vowel is reduced during the rapid articulation of a phrase[84]. Ultimately, this work establishes that the single vowel sound provides the essential, speaker-specific reference point for analyzing connected speech.
4.4. Limitations and Challenges
This study is subject to specific limitations related to the nature of voice samples:
- Discriminatory Power of Acoustics: As noted in recent literature [83], high variability in vowel acoustics (even for standard vowels such as /a/) suggests that acoustic measures alone may not be fully adequate for discriminating between healthy and disordered speech without supplementary modalities. A significantly larger dataset is required for accurately predict the potentially large number of parameters.
- Hardware and Environmental Variance: The reference dataset is subject to unknown variability in recording hardware and acoustic environments. These inconsistencies complicate direct comparisons with the locally collected healthy controls.
- Linguistic Mismatch: There is a linguistic divergence between the pathological dataset (German) and the control group (English). While the control group included diverse accents, the fundamental phonetic differences between languages may introduce confounding variables in formant and prosodic feature extraction. Within reported results can be difficult to differentiate between cultural accents and the detection and influence emotional state[85].
- Class Imbalance: The laryngitis subset comprises a relatively small fraction of the total pathological data, potentially limiting the statistical robustness of the analysis for this specific condition.
- Lack of Deep Phenotyping: The utility of the dataset for supervised machine learning is constrained by a lack of detailed clinical annotation. The data lacks metadata regarding severity, duration, or clinician-confirmed perceptual scores, preventing a deeper analysis of how acoustic features correlate with disease progression.
- Algorithm Performance: Our selection of the commonly used Pratt software provided convenience in streamlining analytic workflow, but research has shown that other software packages may not provide equivalent outcomes[48].
5. Conclusions
Voice-based approaches for emerging screening and diagnostic applications, particularly in telemedicine, often require patient recordings collected outside clinical environments. However, the variability of vocal parameters and limitations in data acquisition, combined with the absence of standardized protocols, hinder the development of reliable predictive models. While existing literature offers numerous “recommended practices” for data collection and analysis, the lack of harmonization underscores the need for a sustained, collaborative effort to establish consistent methodologies. Such a project would aim to quantify the compromises inherent in non-clinical recording conditions and to build robust datasets drawn from large, diverse populations, including individuals both with and without well-documented vocal pathologies
Author Contributions
Conceptualization, T.C., S.D., C.E., E.O., W.S., P.B. and C.K.D; methodology, T.C., S.D., C.E., P.B. and C.K.D; software, SD., C.E., T.C., E.O., formal analysis, T.C., SD., C.E., E.O., W.S., and C.K.D; investigation, SD., C.E., T.C., E.O., X.Y.Z., and W.S.; resources, C.K.D; data curation, T.C., S.D., C.E., E.O., and C.K.D. writing—original draft preparation, T.C., S.D., C.E., E.O., W.S., P.B. and C.K.D; writing—review and editing, P.B. and C.K.D.; supervision, C.K.D.; validation, C.K.D.; project administration, C.K.D. All authors have read and agreed to the published version of the manuscript.
Funding
This research received no external funding.
Institutional Review Board Statement
The study was conducted in accordance with the Declaration of Helsinki and approved by the Institutional Review Board of Case Western Reserve University (protocol code CWRU Study 2023-1013, “Collection of Voice Samples to Establish a Control for Voice Analytics,” 18 January 2024).
Informed Consent Statement
Written informed consent was obtained from all subjects involved in the study prior to participation. Participants were informed about the study’s purpose, procedures, potential risks, and their right to withdraw at any time without penalty.
Data Availability Statement
The data supporting the conclusions of this article will be made available on reasonable request from the corresponding author.
Acknowledgments
Research reported in this publication was internally funded by Case Western Reserve University Department of Biomedical Engineering. We are grateful for the study participant volunteers from the students at Case Western Reserve University. The authors have reviewed and edited the output and take full responsibility for the content of this publication.”
Conflicts of Interest
The authors declare no conflicts of interest.
Abbreviations
The following abbreviations are used in this manuscript:
| F0 | Fundamental frequency |
| F3 | Third formant frequency |
| Jitter | Jitter variance |
| Shimmer | Cycle to cycle variation in voice amplitude |
| HNR | Harmonic-to-noise ratio |
| Intensity | Energy transmitted by vocal vibrations |
| CPP | Cepstral Peak Prominence |
| MFCCS | Mel-Frequency Cepstral Coefficient |
| RSPL | Root-Mean-Square Sound Pressure Level |
| MPT | Maximum Phonation Time |
References
- Bensoussan, Y.; Sigaras, A.; Rameau, A.; Elemento, O.; Powell, M.; Dorr, D.; Payne, P.; Ravitsky, V.; Bélisle-Pipon, J.-C.; Johnson, A.; et al. Bridge2AI-Voice: An Ethically-Sourced, Diverse Voice Dataset Linked to Health Information.
- Lyberg-Åhlander, V.; Rydell, R.; Fredlund, P.; Magnusson, C.; Wilén, S. Prevalence of Voice Disorders in the General Population, Based on the Stockholm Public Health Cohort. J Voice 2019, 33, 900–905. [Google Scholar] [CrossRef] [PubMed]
- Skodda, S.; Grönheit, W.; Mancinelli, N.; Schlegel, U. Progression of Voice and Speech Impairment in the Course of Parkinson’s Disease: A Longitudinal Study. Parkinsons Dis 2013, 2013, 389195. [Google Scholar] [CrossRef] [PubMed]
- Solomon, C.; Valstar, M.; Morriss, R.; Crowe, J. Objective Methods for Reliable Detection of Concealed Depression. Frontiers in ICT 2015, 2. [Google Scholar] [CrossRef]
- Fagherazzi, G.; Fischer, A.; Ismael, M.; Despotovic, V. Voice for Health: The Use of Vocal Biomarkers from Research to Clinical Practice. Digit Biomark 2021, 5, 78–88. [Google Scholar] [CrossRef]
- Cordella, F. The Sounds of Health: Harnessing Vocal Biomarkers for Scalable Health Tracking. Available online: https://www.eitdigital.eu/newsroom/grow-digital-insights/the-sounds-of-health-harnessing-vocal-biomarkers-for-scalable-health-tracking/ (accessed on 12 July 2025).
- O’Connell, K. 5 Vocal Biomarker Trends to Watch in 2025. Canary Speech 2025. [Google Scholar]
- Saarbrücken Voice Dataset. Available online: https://stimmdb.coli.uni-saarland.de/ (accessed on 26 November 2025).
- Koreman, J. A German Database of Patterns of Pathological Vocal Fold Vibration. Phonus. Saarbrücken, Institut für … 1997. [Google Scholar]
- Pützer, M.; Barry, W.J. Saarbruecken Voice Database 2008.
- Kewley-Port, D.; Pisoni, D.B.; Studdert-Kennedy, M. Perception of Static and Dynamic Acoustic Cues to Place of Articulation in Initial Stop Consonants. J Acoust Soc Am 1983, 73, 1779–1793. [Google Scholar] [CrossRef]
- Kuhnert, B.; Nolan, F. The Origin of Coarticulation. FIPKM 1997, 35. [Google Scholar]
- Divenyi, P. Perception of Complete and Incomplete Formant Transitions in Vowels. J Acoust Soc Am 2009, 126, 1427–1439. [Google Scholar] [CrossRef]
- Birkholz, P. Modeling Consonant-Vowel Coarticulation for Articulatory Speech Synthesis. PLoS One 2013, 8, e60603. [Google Scholar] [CrossRef] [PubMed]
- Sussman, H.M.; Duder, C.; Dalston, E.; Cacciatore, A. An Acoustic Analysis of the Development of CV Coarticulation: A Case Study. J Speech Lang Hear Res 1999, 42, 1080–1096. [Google Scholar] [CrossRef] [PubMed]
- Story, B.H. Time-Dependence of Vocal Tract Modes during Production of Vowels and Vowel Sequences. J Acoust Soc Am 2007, 121, 3770–3789. [Google Scholar] [CrossRef]
- Nishida, M.; Ariki, Y. Speaker Verification by Integrating Dynamic and Static Features Using Subspace Method. Proceedings of the 6th International Conference on Spoken Language Processing (ICSLP 2000); ISCA 2000, vols. vols. 3, 1013-1016–0. [Google Scholar]
- Bodur, K.; Fredouille, C.; Rauzy, S.; Meunier, C. Exploring the Nuances of Reduction in Conversational Speech: Lexicalized and Non-Lexicalized Reductions. Speech Communication 2025, 173, 103268. [Google Scholar] [CrossRef]
- Smiljanić, R.; Bradlow, A.R. Temporal Organization of English Clear and Conversational Speech. J Acoust Soc Am 2008, 124, 3171–3182. [Google Scholar] [CrossRef]
- Lowie, W.; Verspoor, M. A Dynamic Systems Theory Approach to Second Language Acquisition. Bilingualism: Language and Cognition 2007, 10, 7–21. [Google Scholar] [CrossRef]
- Saggio, G.; Costantini, G. Worldwide Healthy Adult Voice Baseline Parameters: A Comprehensive Review. Journal of Voice 2022, 36, 637–649. [Google Scholar] [CrossRef]
- Guimarães, I.; Abberton, E. Health and Voice Quality in Smokers: An Exploratory Investigation. Logopedics Phoniatrics Vocology 2005, 30, 185–191. [Google Scholar] [CrossRef]
- Mizuta, M.; Abe, C.; Taguchi, E.; Takeue, T.; Tamaki, H.; Haji, T. Validation of Cepstral Acoustic Analysis for Normal and Pathological Voice in the Japanese Language. Journal of Voice 2022, 36, 770–776. [Google Scholar] [CrossRef]
- Jetté, M. Toward an Understanding of the Pathophysiology of Chronic Laryngitis. Perspect ASHA Spec Interest Groups 2016, 1, 14–25. [Google Scholar] [CrossRef] [PubMed]
- O’Connell, N.S.; Dai, L.; Jiang, Y.; Speiser, J.L.; Ward, R.; Wei, W.; Carroll, R.; Gebregziabher, M. Methods for Analysis of Pre-Post Data in Clinical Research: A Comparison of Five Common Methods. J Biom Biostat 2017, 8, 1–8. [Google Scholar] [CrossRef] [PubMed]
- Thorlund, K.; Dron, L.; Park, J.J.H.; Mills, E.J. Synthetic and External Controls in Clinical Trials – A Primer for Researchers. Clin Epidemiol 2020, 12, 457–467. [Google Scholar] [CrossRef] [PubMed]
- De Los Reyes, A.; Kazdin, A. When the Evidence Says, Yes, No, and Maybe So. Current directions in psychological science 2008, 17, 47–51. [Google Scholar] [CrossRef]
- Patel, R.R.; Awan, S.N.; Barkmeier-Kraemer, J.; Courey, M.; Deliyski, D.; Eadie, T.; Paul, D.; Švec, J.G.; Hillman, R. Recommended Protocols for Instrumental Assessment of Voice: American Speech-Language-Hearing Association Expert Panel to Develop a Protocol for Instrumental Assessment of Vocal Function. American Journal of Speech-Language Pathology 2018, 27, 887–905. [Google Scholar] [CrossRef]
- Titze, I.R.; Baken, R.J.; Bozeman, K.W.; Granqvist, S.; Henrich, N.; Herbst, C.T.; Howard, D.M.; Hunter, E.J.; Kaelin, D.; Kent, R.D.; et al. Toward a Consensus on Symbolic Notation of Harmonics, Resonances, and Formants in Vocalization. J Acoust Soc Am 2015, 137, 3005–3007. [Google Scholar] [CrossRef]
- de Felippe, A.C.N.; Grillo, M.H.M.M.; Grechi, T.H. Standardization of Acoustic Measures for Normal Voice Patterns. Brazilian Journal of Otorhinolaryngology 2006, 72, 659–664. [Google Scholar] [CrossRef]
- Kent, R. The MIT Encyclopedia of Communication Disorders; 2003; ISBN 978-0-262-27702-0. [Google Scholar]
- Gerratt, B.R.; Kreiman, J.; Garellek, M. Comparing Measures of Voice Quality From Sustained Phonation and Continuous Speech. J Speech Lang Hear Res 2016, 59, 994–1001. [Google Scholar] [CrossRef]
- Behlau, M.; Madazio, G.; Yamasaki, R. Dynamic Vocal Analysis: Vocal Functionality Evaluation. Codas 35 e20210083. [CrossRef]
- Goy, H.; Fernandes, D.N.; Pichora-Fuller, M.K.; Lieshout, P. van Normative Voice Data for Younger and Older Adults. Journal of Voice 2013, 27, 545–555. [Google Scholar] [CrossRef]
- Rodrigo, I.; Duñabeitia, J.A. Listening to the Mind: Integrating Vocal Biomarkers into Digital Health. Brain Sciences 2025, 15, 762. [Google Scholar] [CrossRef]
- Glaspey, A.M.; Wilson, J.J.; Reeder, J.D.; Tseng, W.-C.; MacLeod, A.A.N. Moving Beyond Single Word Acquisition of Speech Sounds to Connected Speech Development With Dynamic Assessment. Journal of Speech, Language, and Hearing Research 2022, 65, 508–524. [Google Scholar] [CrossRef] [PubMed]
- Kent, R.D. Vocal Tract Acoustics. Journal of Voice 1993, 7, 97–117. [Google Scholar] [CrossRef] [PubMed]
- Jongman, A. Acoustic Phonetics II: Source-Filter Theory of Speech Production. In Speech Prosody Studies Group; 2023. [Google Scholar]
- Anand, S.; Kopf, L.M.; Shrivastav, R.; Eddins, D.A. Using Pitch Height and Pitch Strength to Characterize Type 1, 2, and 3 Voice Signals. J Voice 2021, 35, 181–193. [Google Scholar] [CrossRef] [PubMed]
- Brinca, L.F.; Batista, A.P.F.; Tavares, A.I.; Gonçalves, I.C.; Moreno, M.L. Use of Cepstral Analyses for Differentiating Normal from Dysphonic Voices: A Comparative Study of Connected Speech versus Sustained Vowel in European Portuguese Female Speakers. J Voice 2014, 28, 282–286. [Google Scholar] [CrossRef]
- Hippargekar, P.; Bhise, S.; Kothule, S.; Shelke, S. Acoustic Voice Analysis of Normal and Pathological Voices in Indian Population Using Praat Software. Indian J Otolaryngol Head Neck Surg 2022, 74, 5069–5074. [Google Scholar] [CrossRef]
- Ma, E.P.-M.; Love, A.L. Electroglottographic Evaluation of Age and Gender Effects during Sustained Phonation and Connected Speech. J Voice 2010, 24, 146–152. [Google Scholar] [CrossRef]
- Vogel, A.P.; Maruff, P. Comparison of Voice Acquisition Methodologies in Speech Research. Behav Res Methods 2008, 40, 982–987. [Google Scholar] [CrossRef]
- Awan, S.N.; Shaikh, M.A.; Awan, J.A.; Abdalla, I.; Lim, K.O.; Misono, S. Smartphone Recordings Are Comparable to “Gold Standard” Recordings for Acoustic Measurements of Voice. Journal of Voice 2025, 39, 1019–1032. [Google Scholar] [CrossRef]
- Isaac Best Voice Recorder for Interviews. Academic Transcription Services 2022.
- Praat: Doing Phonetics by Computer. Available online: https://www.fon.hum.uva.nl/praat/ (accessed on 27 November 2025).
- Burris, C.; Vorperian, H.; Fourakis, M.; Kent, R.; Bolt, D. Quantitative and Descriptive Comparison of Four Acoustic Analysis Systems: Vowel Measurements. Journal of Speech, Language, and Hearing Research 2014, 57, 26–45. [Google Scholar] [CrossRef]
- Amir, O.; Wolf, M.; Amir, N. A Clinical Comparison between Two Acoustic Analysis Softwares: MDVP and Praat. Biomedical Signal Processing and Control 2009, 4, 202–205. [Google Scholar] [CrossRef]
- Parsa, V.; Jamieson, D.G. A Comparison of High Precision F0 Extraction Algorithms for Sustained Vowels. J Speech Lang Hear Res 1999, 42, 112–126. [Google Scholar] [CrossRef] [PubMed]
- Goldberger, A.L.; Amaral, L.A.; Glass, L.; Hausdorff, J.M.; Ivanov, P.C.; Mark, R.G.; Mietus, J.E.; Moody, G.B.; Peng, C.K.; Stanley, H.E. PhysioBank, PhysioToolkit, and PhysioNet: Components of a New Research Resource for Complex Physiologic Signals. Circulation 2000, 101, E215-220. [Google Scholar] [CrossRef] [PubMed]
- Cesari, U.; De Pietro, G.; Marciano, E.; Niri, C.; Sannino, G.; Verde, L. A New Database of Healthy and Pathological Voices. Computers & Electrical Engineering 2018, 68, 310–321. [Google Scholar] [CrossRef]
- Demirhan, E.; Unsal, E.M.; Yilmaz, C.; Ertan, E. Acoustic Voice Analysis of Young Turkish Speakers. J Voice 2016, 30, 378.e21–25. [Google Scholar] [CrossRef]
- Maurer, D. Acoustics of the Vowel; 2016; ISBN 978-3-0343-2391-8. [Google Scholar]
- Cavalcanti, J.C.; Eriksson, A.; Barbosa, P.A. Acoustic Analysis of Vowel Formant Frequencies in Genetically-Related and Non-Genetically Related Speakers with Implications for Forensic Speaker Comparison. PLOS ONE 2021, 16, e0246645. [Google Scholar] [CrossRef]
- Abhang, P. Technical Aspects of Brain Rhythms and Speech Parameters. In Introduction to EEG- and Speech-Based Emotion Recognition; 2016. [Google Scholar]
- Ramadhina, D.; Magdalena, R.; Saidah, S. Individual Identification Through Voice Using Mel-Frequency Cepstrum Coefficient (MFCC) and Hidden Markov Models (HMM) Method. Journal of Measurements, Electronics, Communications, and Systems 2020, 7, 26. [Google Scholar] [CrossRef]
- Banuroopa, K.; Shanmuga Priyaa, D. MFCC Based Hybrid Fingerprinting Method for Audio Classification through LSTM. International Journal of Nonlinear Analysis and Applications 2021, 12, 2125–2136. [Google Scholar] [CrossRef]
- Alkhatib, B.; Eddin, M. Voice Identification Using MFCC and Vector Quantization. Baghdad Science Journal 2020, 17, 1019. [Google Scholar] [CrossRef]
- Tracey, B.; Volfson, D.; Glass, J.; Haulcy, R.; Kostrzebski, M.; Adams, J.; Kangarloo, T.; Brodtmann, A.; Dorsey, E.R.; Vogel, A. Towards Interpretable Speech Biomarkers: Exploring MFCCs. Sci Rep 2023, 13, 22787. [Google Scholar] [CrossRef]
- Vasquez-Serrano, P.; Reyes-Moreno, J.; Guido, R.C.; Sepúlveda-Sepúlveda, A. MFCC Parameters of the Speech Signal: An Alternative to Formant-Based Instantaneous Vocal Tract Length Estimation. Journal of Voice 2025, 39, 1431–1439. [Google Scholar] [CrossRef]
- Vreča, J.; Pilipović, R.; Biasizzo, A. Hardware–Software Co-Design of an Audio Feature Extraction Pipeline for Machine Learning Applications. Electronics 2024, 13, 875. [Google Scholar] [CrossRef]
- Tracey, B.; Volfson, D.; Glass, J.; Haulcy, R.; Kostrzebski, M.; Adams, J.; Kangarloo, T.; Brodtmann, A.; Dorsey, E.R.; Vogel, A. Towards Interpretable Speech Biomarkers: Exploring MFCCs. Sci Rep 2023, 13, 22787. [Google Scholar] [CrossRef] [PubMed]
- Biever, D.M.; Bless, D.M. Vibratory Characteristics of the Vocal Folds in Young Adult and Geriatric Women. Journal of Voice 1989, 3, 120–131. [Google Scholar] [CrossRef]
- Brown, W.S.; Morris, R.J.; Michel, J.F. Vocal Jitter in Young Adult and Aged Female Voices. Journal of Voice 1989, 3, 113–119. [Google Scholar] [CrossRef]
- Ferrand, C.T. Harmonics-to-Noise Ratio: An Index of Vocal Aging. J Voice 2002, 16, 480–487. [Google Scholar] [CrossRef]
- Banh, J.; Naumenko, K.; Goy, H.; Van Lieshout, P.; Fernandes, D.; Pichora-Fuller, K. Establishing Normative Voice Characteristics of Younger and Older Adults. Canadian Acoustics - Acoustique Canadienne 2009, 37, 190–191. [Google Scholar]
- Dwire, A.; McCauley, R. Repeated Measures of Vocal Fundamental Frequency Perturbation Obtained Using the Visi-Pitch. J Voice 1995, 9, 156–162. [Google Scholar] [CrossRef]
- Brockmann, M.; Drinnan, M.J.; Storck, C.; Carding, P.N. Reliable Jitter and Shimmer Measurements in Voice Clinics: The Relevance of Vowel, Gender, Vocal Intensity, and Fundamental Frequency Effects in a Typical Clinical Task. J Voice 2011, 25, 44–53. [Google Scholar] [CrossRef]
- Teixeira, J.P.; Oliveira, C.; Lopes, C. Vocal Acoustic Analysis – Jitter, Shimmer and HNR Parameters. Procedia Technology 2013, 9, 1112–1122. [Google Scholar] [CrossRef]
- Lovato, A.; Colle, W.D.; Giacomelli, L.; Piacente, A.; Righetto, L.; Marioni, G.; Filippis, C. de Multi-Dimensional Voice Program (MDVP) vs Praat for Assessing Euphonic Subjects: A Preliminary Study on the Gender-Discriminating Power of Acoustic Analysis Software. Journal of Voice 2016, 30, 765.e1–765.e5. [Google Scholar] [CrossRef] [PubMed]
- Fernandes, J.; Teixeira, F.; Guedes, V.; Junior, A.; Teixeira, J. Harmonic to Noise Ratio Measurement - Selection of Window and Length. Procedia Computer Science 2018, 138, 280–285. [Google Scholar] [CrossRef]
- Sheena; Mary, B.B.; Aswin, V.A.; Suprent, A. Variation of Harmonics to Noise Ratio from the Age Range of 9–18 Years Old in Both the Genders. Indian J Otolaryngol Head Neck Surg 2022, 74, 5518–5523. [Google Scholar] [CrossRef] [PubMed]
- Orlikoff, R.F.; Kahane, J.C. Influence of Mean Sound Pressure Level on Jitter and Shimmer Measures. Journal of Voice 1991, 5, 113–119. [Google Scholar] [CrossRef]
- Bele, I.V. The Speaker’s Formant. Journal of Voice 2006, 20, 555–578. [Google Scholar] [CrossRef]
- Kent, R.D.; Vorperian, H.K. Static Measurements of Vowel Formant Frequencies and Bandwidths: A Review. J Commun Disord 2018, 74, 74–97. [Google Scholar] [CrossRef]
- Aalto, D.; Aaltonen, O.; Happonen, R.-P.; Jääsaari, P.; Kivelä, A.; Kuortti, J.; Luukinen, J.-M.; Malinen, J.; Murtola, T.; Parkkola, R.; et al. Large Scale Data Acquisition of Simultaneous MRI and Speech. Applied Acoustics 2014, 83, 64–75. [Google Scholar] [CrossRef]
- Tang, D.; Niziolek, C.A.; Parrell, B. Formant Variability Is Related to Vowel Duration across Speakers. JASA Express Lett. 2025, 5, 115202. [Google Scholar] [CrossRef]
- Buckley, D.P.; Abur, D.; Stepp, C.E. Normative Values of Cepstral Peak Prominence Measures in Typical Speakers by Sex, Speech Stimuli, and Software Type Across the Life Span. Am J Speech Lang Pathol 2023, 32, 1565–1577. [Google Scholar] [CrossRef]
- Murton, O.; Hillman, R.; Mehta, D. Cepstral Peak Prominence Values for Clinical Voice Evaluation. American Journal of Speech-Language Pathology 2020, 29, 1596–1607. [Google Scholar] [CrossRef]
- Anand, S.; Kopf, L.M.; Shrivastav, R.; Eddins, D.A. Using Pitch Height and Pitch Strength to Characterize Type 1, 2, and 3 Voice Signals. J Voice 2021, 35, 181–193. [Google Scholar] [CrossRef]
- Brewer, C. Norms For Voice, Motor Speech, & Resonance Assessments. Available online: https://theadultspeechtherapyworkbook.com/norms-for-voice/ (accessed on 14 July 2025).
- Stathopoulos, E.T.; Huber, J.E.; Sussman, J.E. Changes in Acoustic Characteristics of the Voice Across the Life Span: Measures From Individuals 4–93 Years of Age. Journal of Speech, Language, and Hearing Research 2011, 54, 1011–1021. [Google Scholar] [CrossRef]
- Abraham, E.A.; Geetha, A. Acoustical and Perceptual Analysis of Voice in Individuals with Parkinson’s Disease. Indian J Otolaryngol Head Neck Surg 2023, 75, 427–432. [Google Scholar] [CrossRef]
- Burridge, J.; Vaux, B. Brownian Dynamics for the Vowel Sounds of Human Language. Phys. Rev. Research 2020, 2, 013274. [Google Scholar] [CrossRef]
- Rabiei, M.; Gasparetto, A. A Methodology for Recognition of Emotions Based on Speech Analysis, for Applications to Human-Robot Interaction. An Exploratory Study. Paladyn, Journal of Behavioral Robotics 2014, 5. [Google Scholar] [CrossRef]
Figure 1.
Sample probability density distribution to illustrate the use of t-Critical and t-Statistic in the assessment of the Null hypothesis.
Figure 1.
Sample probability density distribution to illustrate the use of t-Critical and t-Statistic in the assessment of the Null hypothesis.
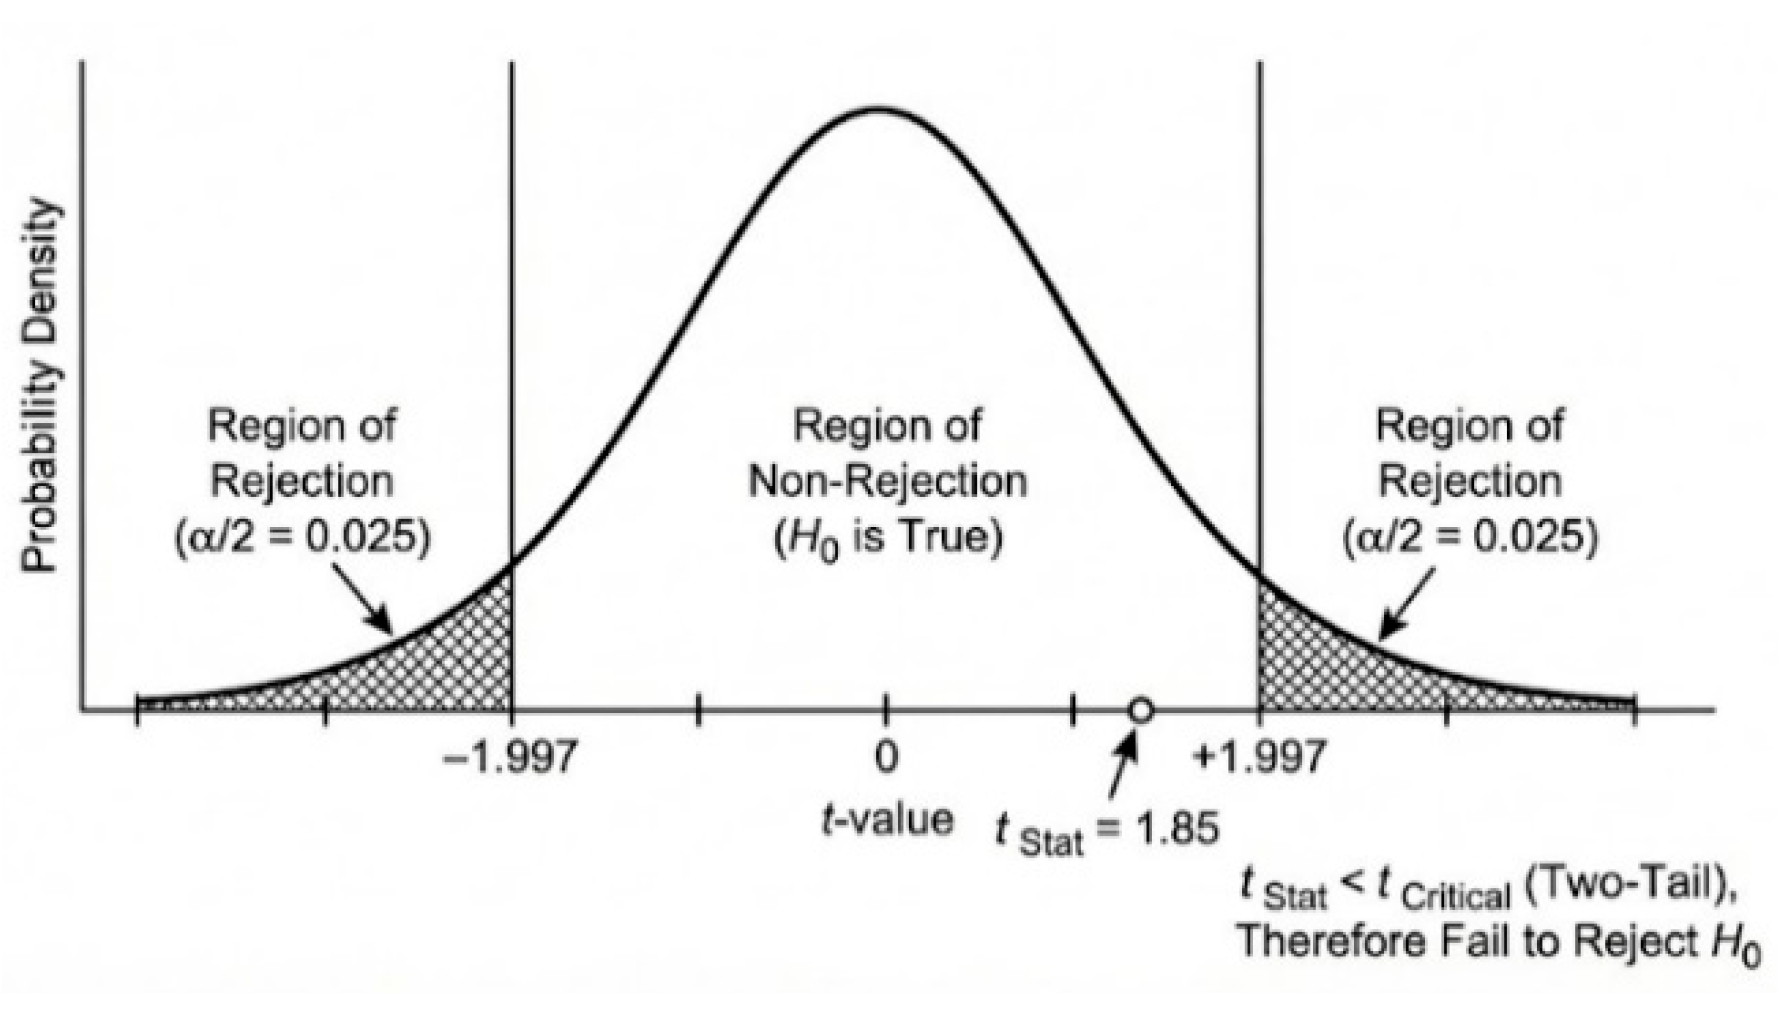
Figure 2.
Typical Fundamental Frequency F0 contours for healthy male, a healthy female, and a male subject with laryngitis.
Figure 2.
Typical Fundamental Frequency F0 contours for healthy male, a healthy female, and a male subject with laryngitis.
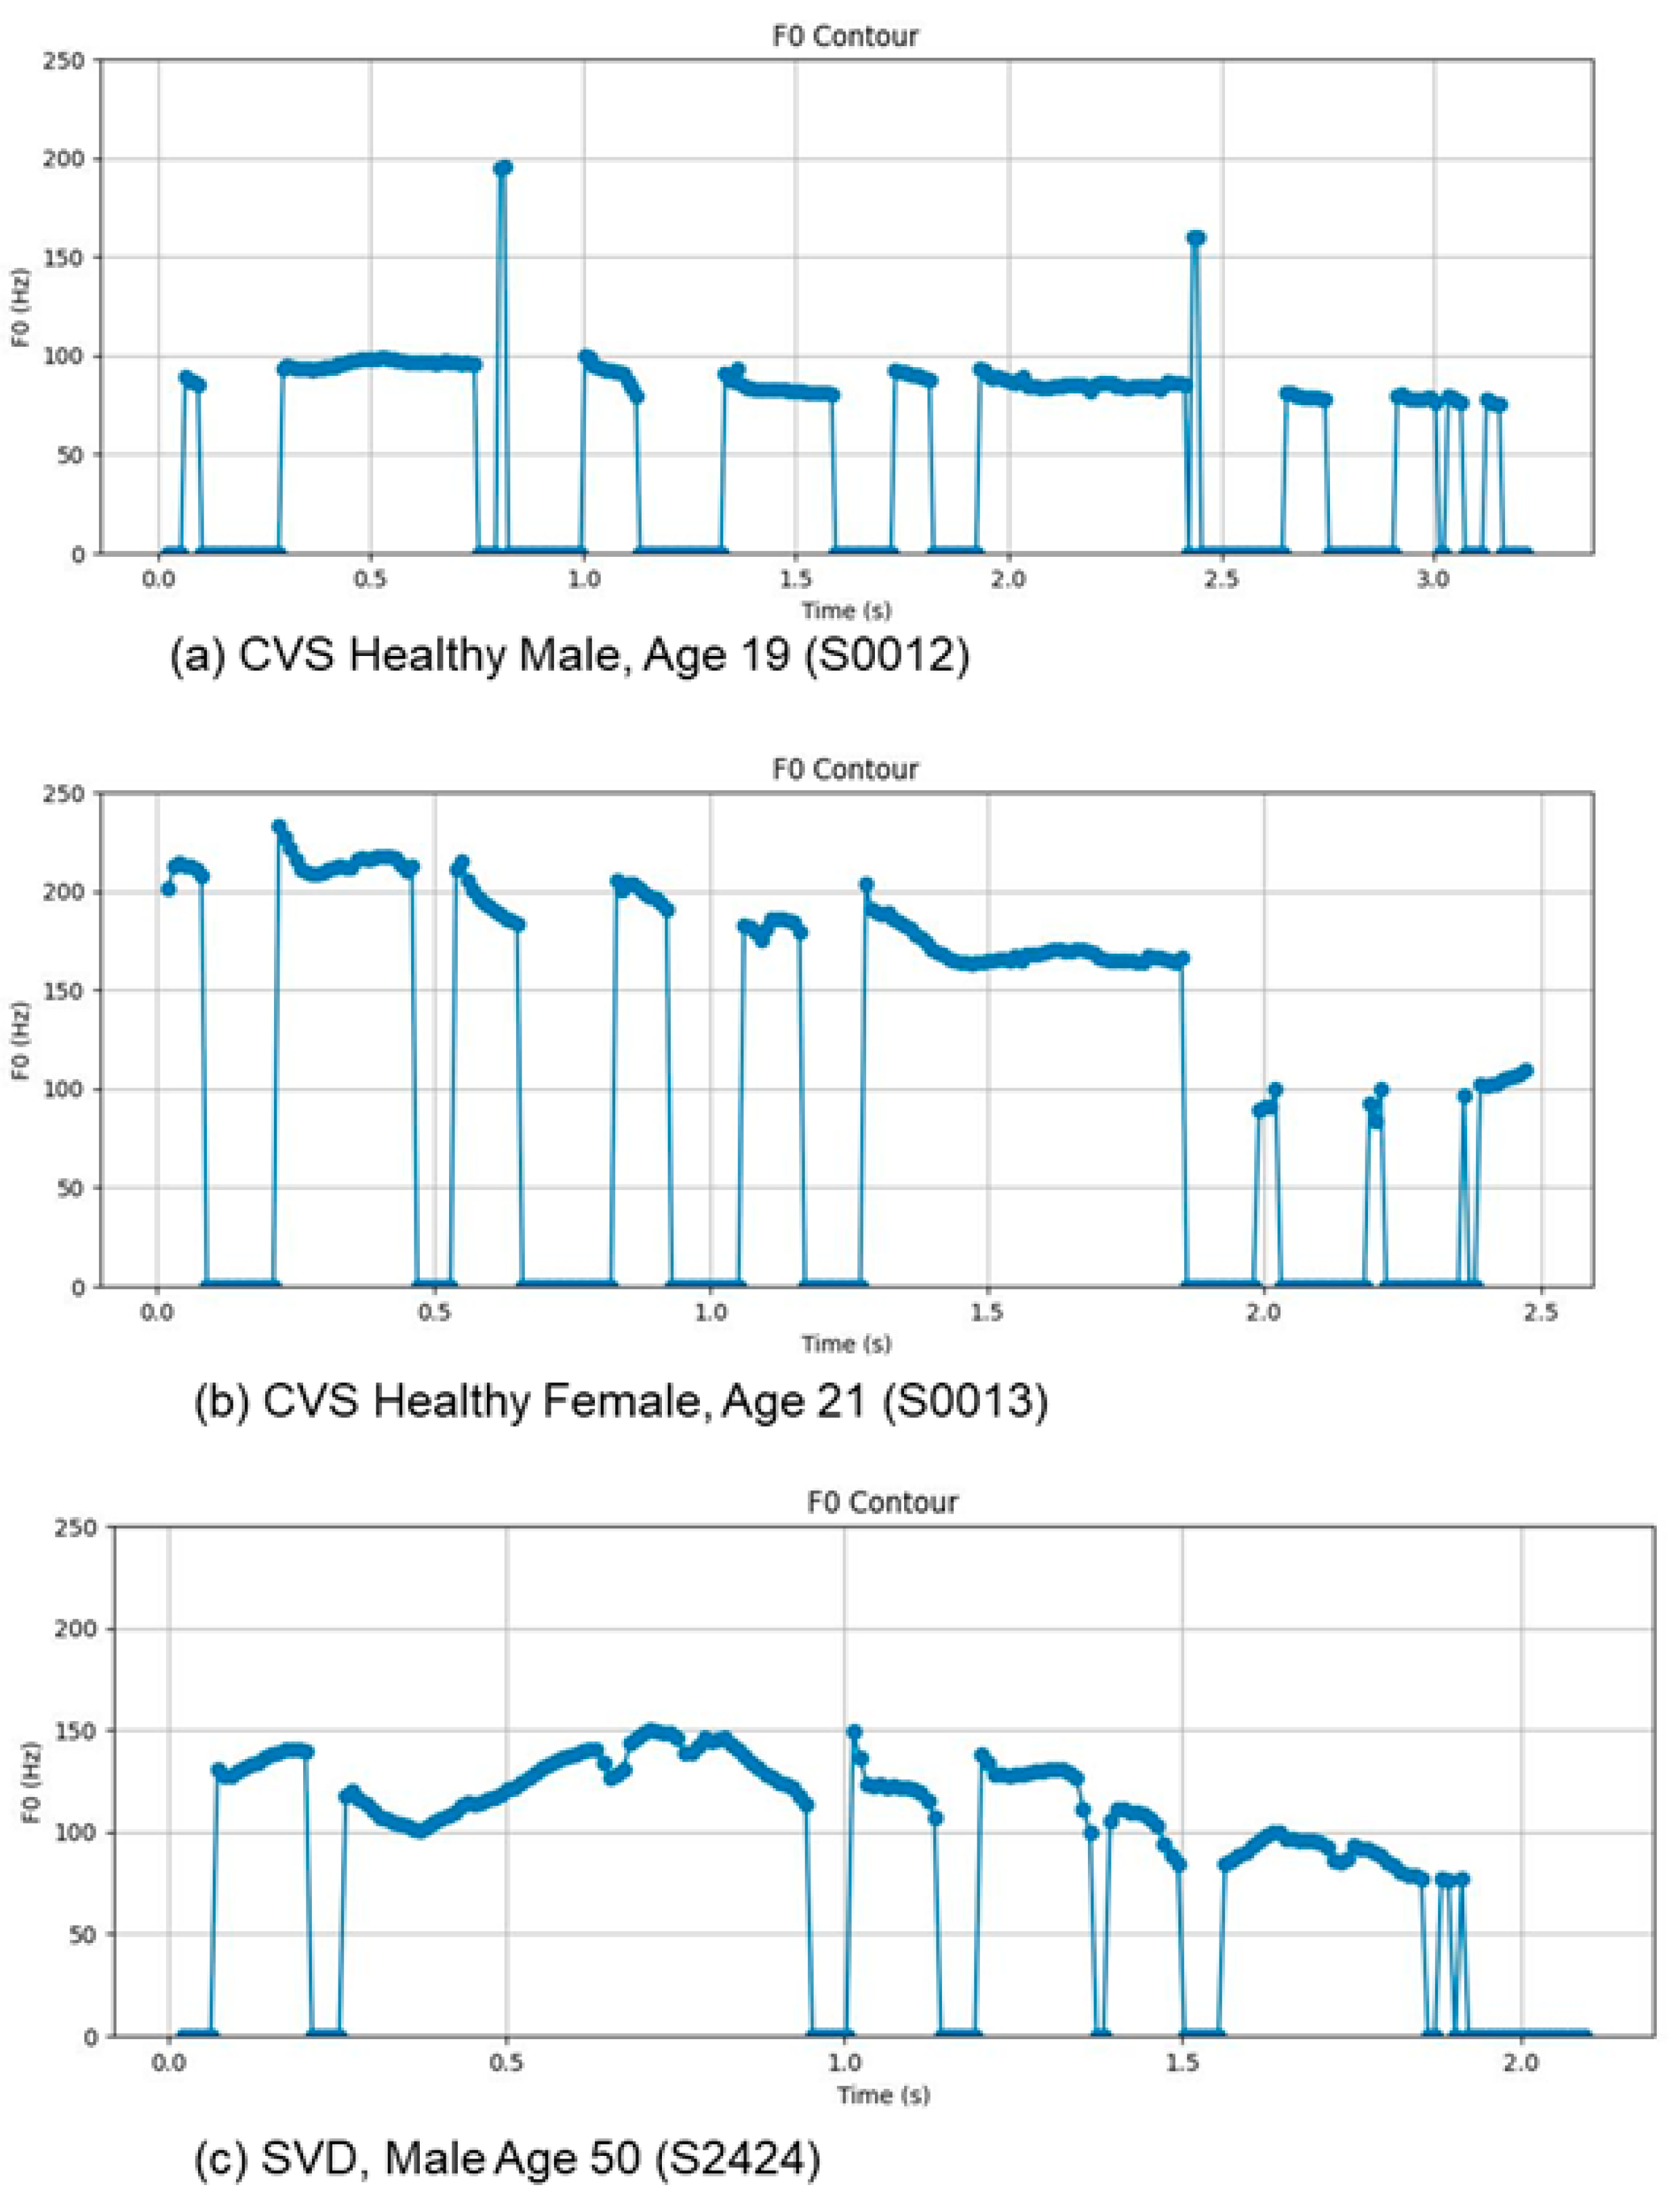
Figure 3.
Typical intensity contours for healthy male, a healthy female, and a male subject with laryngitis.
Figure 3.
Typical intensity contours for healthy male, a healthy female, and a male subject with laryngitis.
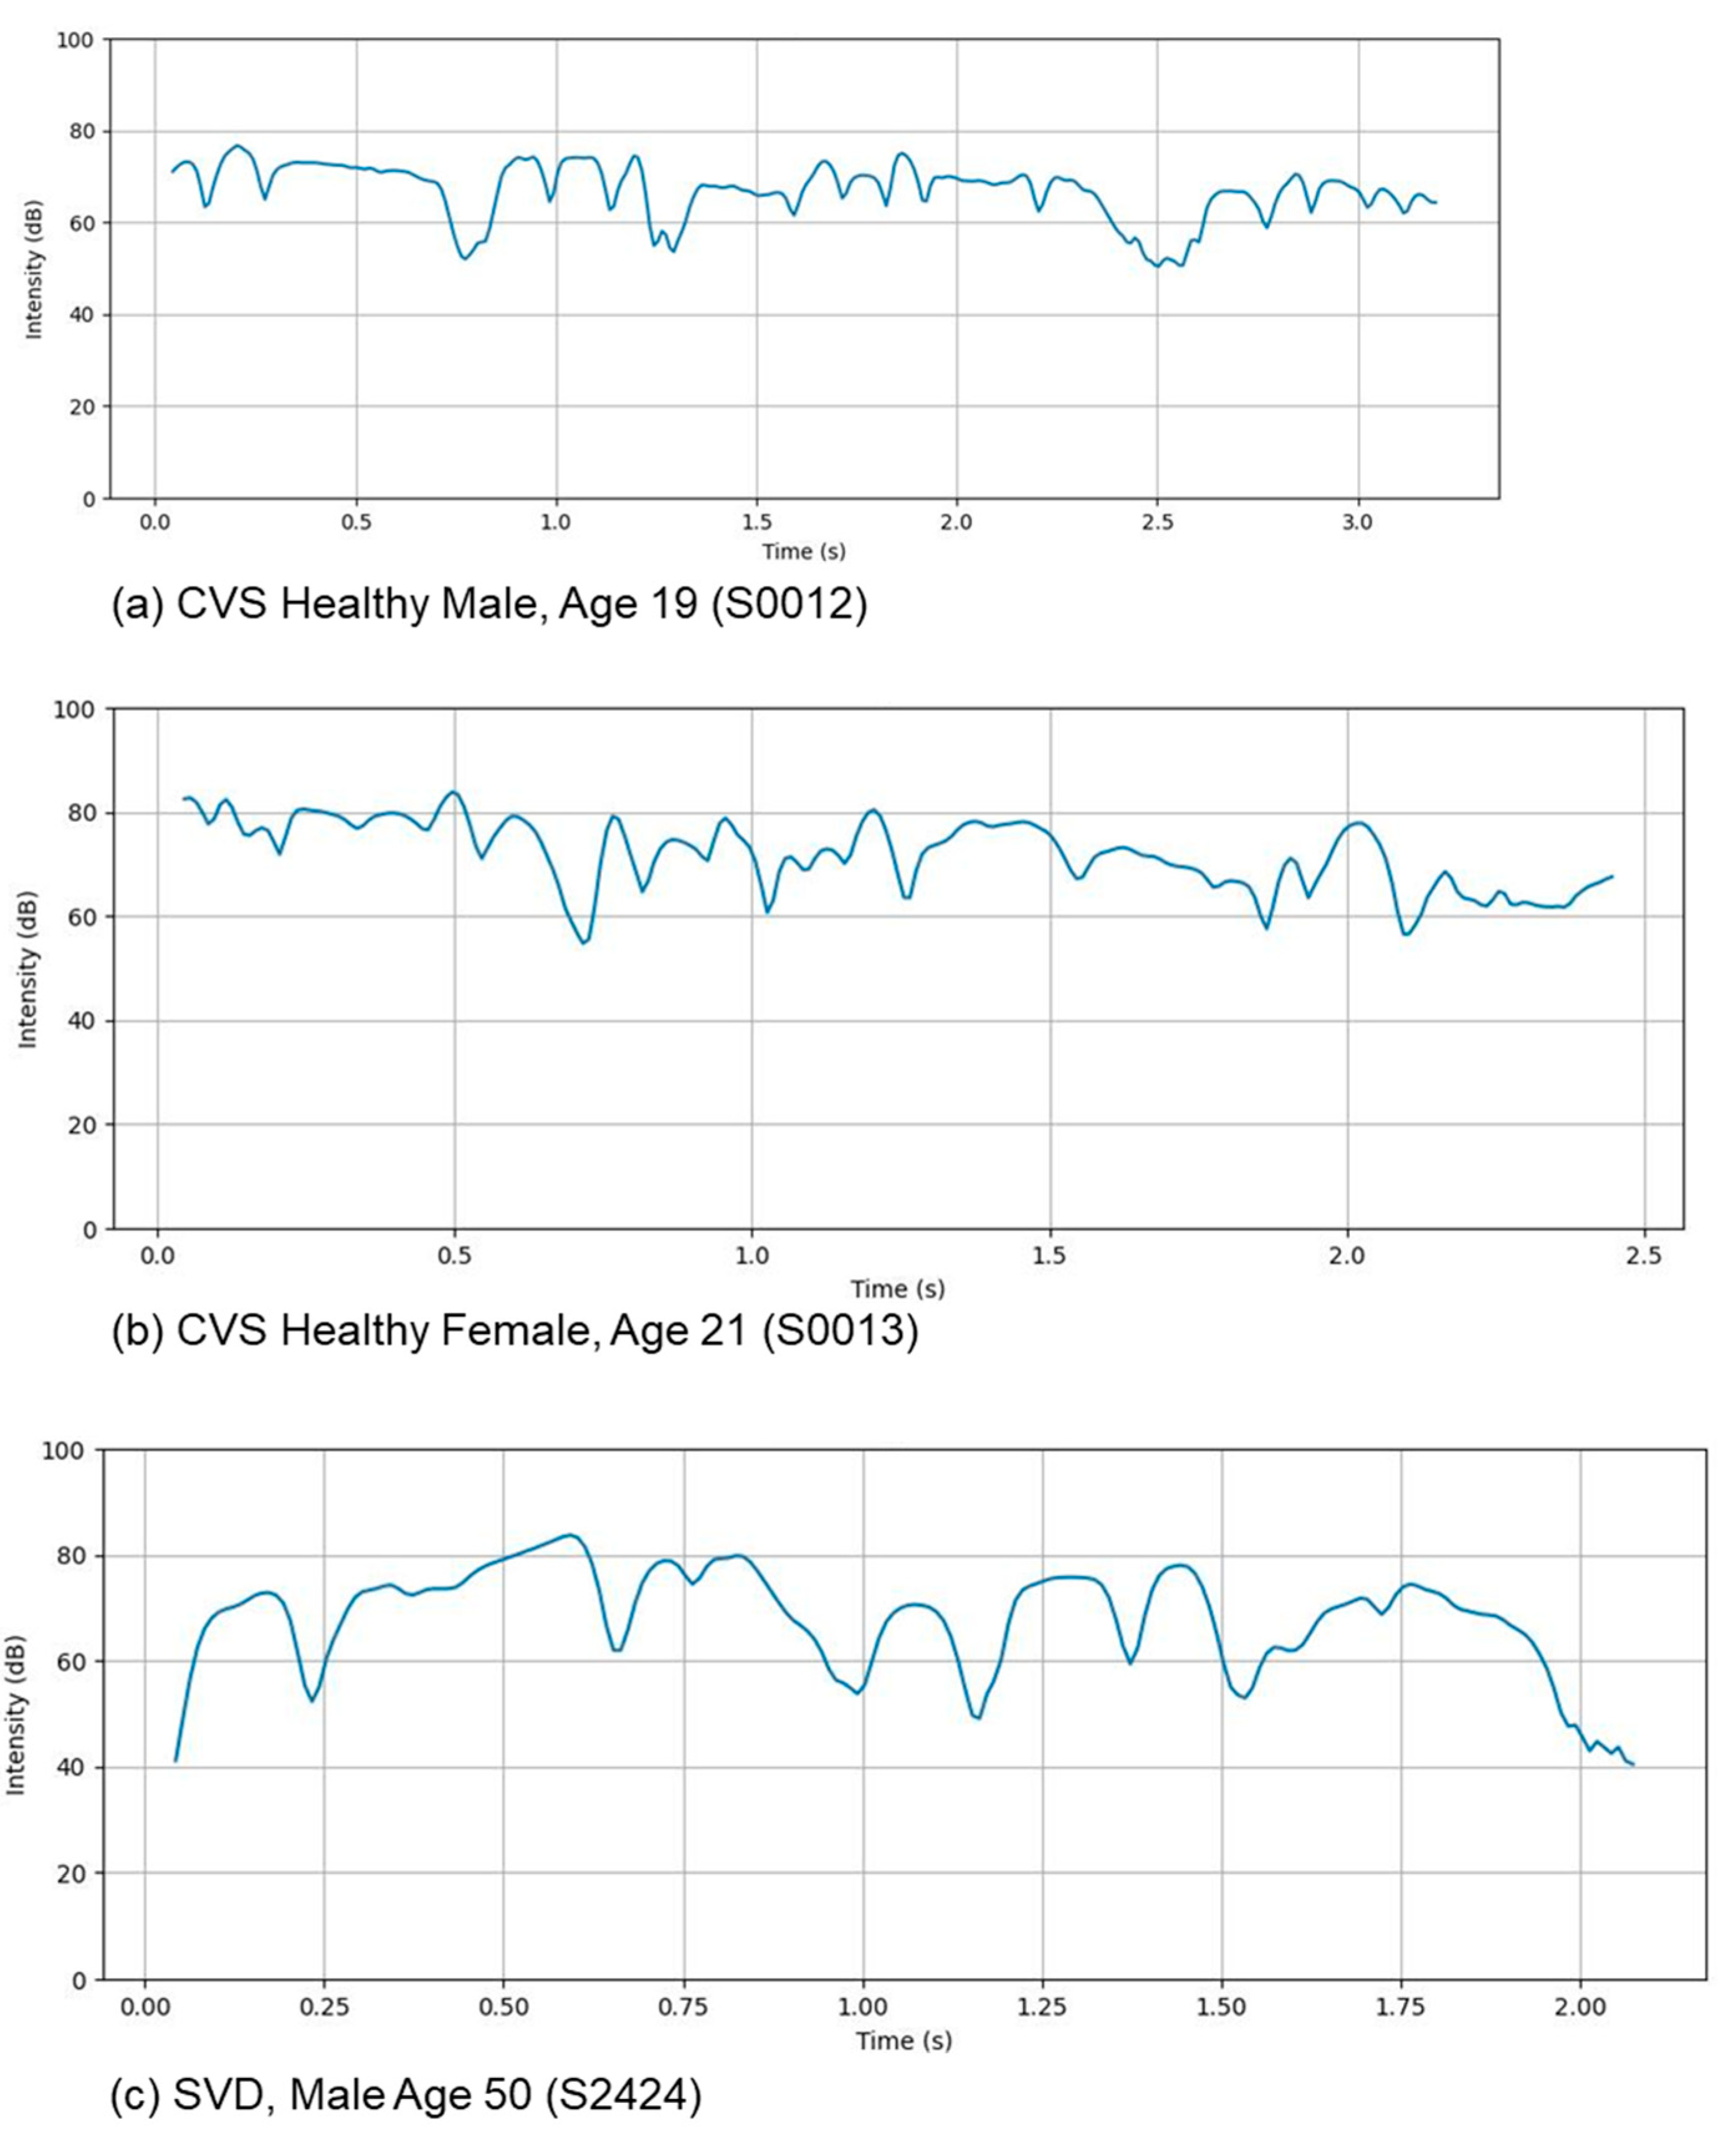
Figure 4.
Typical spectrogram for healthy male, a healthy female, and a male subject with laryngitis.
Figure 4.
Typical spectrogram for healthy male, a healthy female, and a male subject with laryngitis.
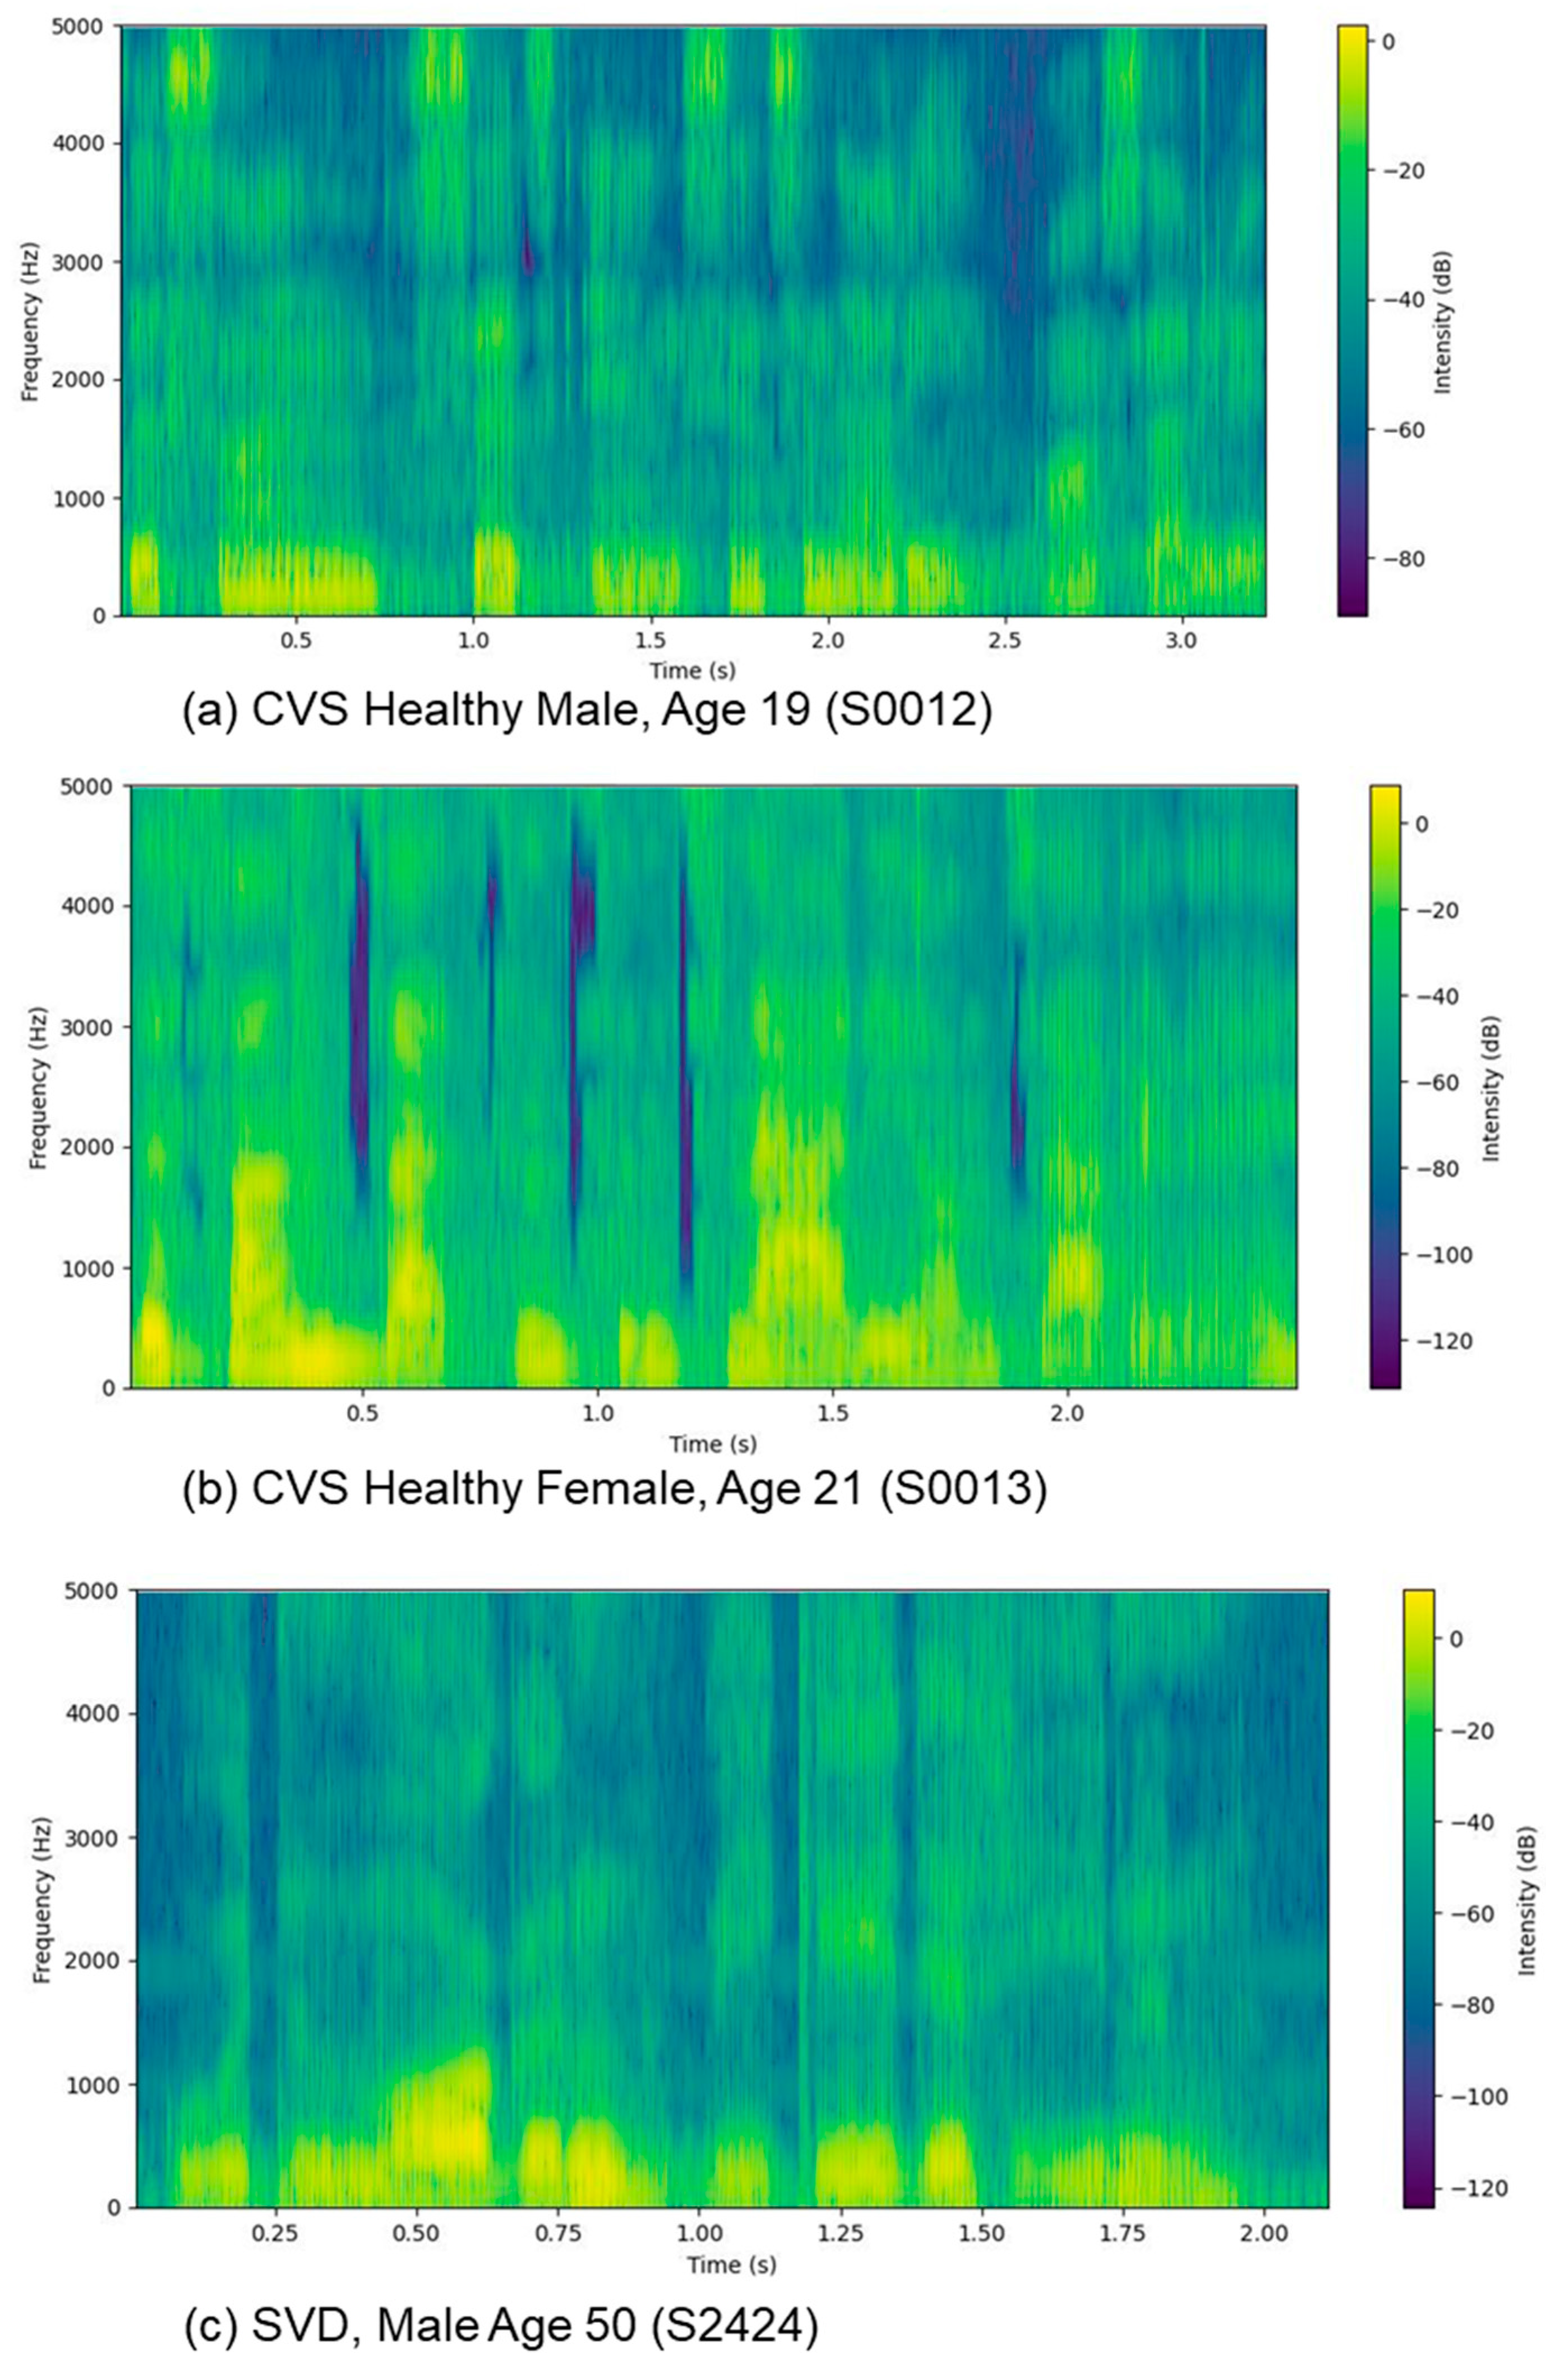
Figure 5.
Typical Formant values (in red) superimposed on a spectrogram for healthy male, a healthy female, and a male subject with laryngitis.
Figure 5.
Typical Formant values (in red) superimposed on a spectrogram for healthy male, a healthy female, and a male subject with laryngitis.
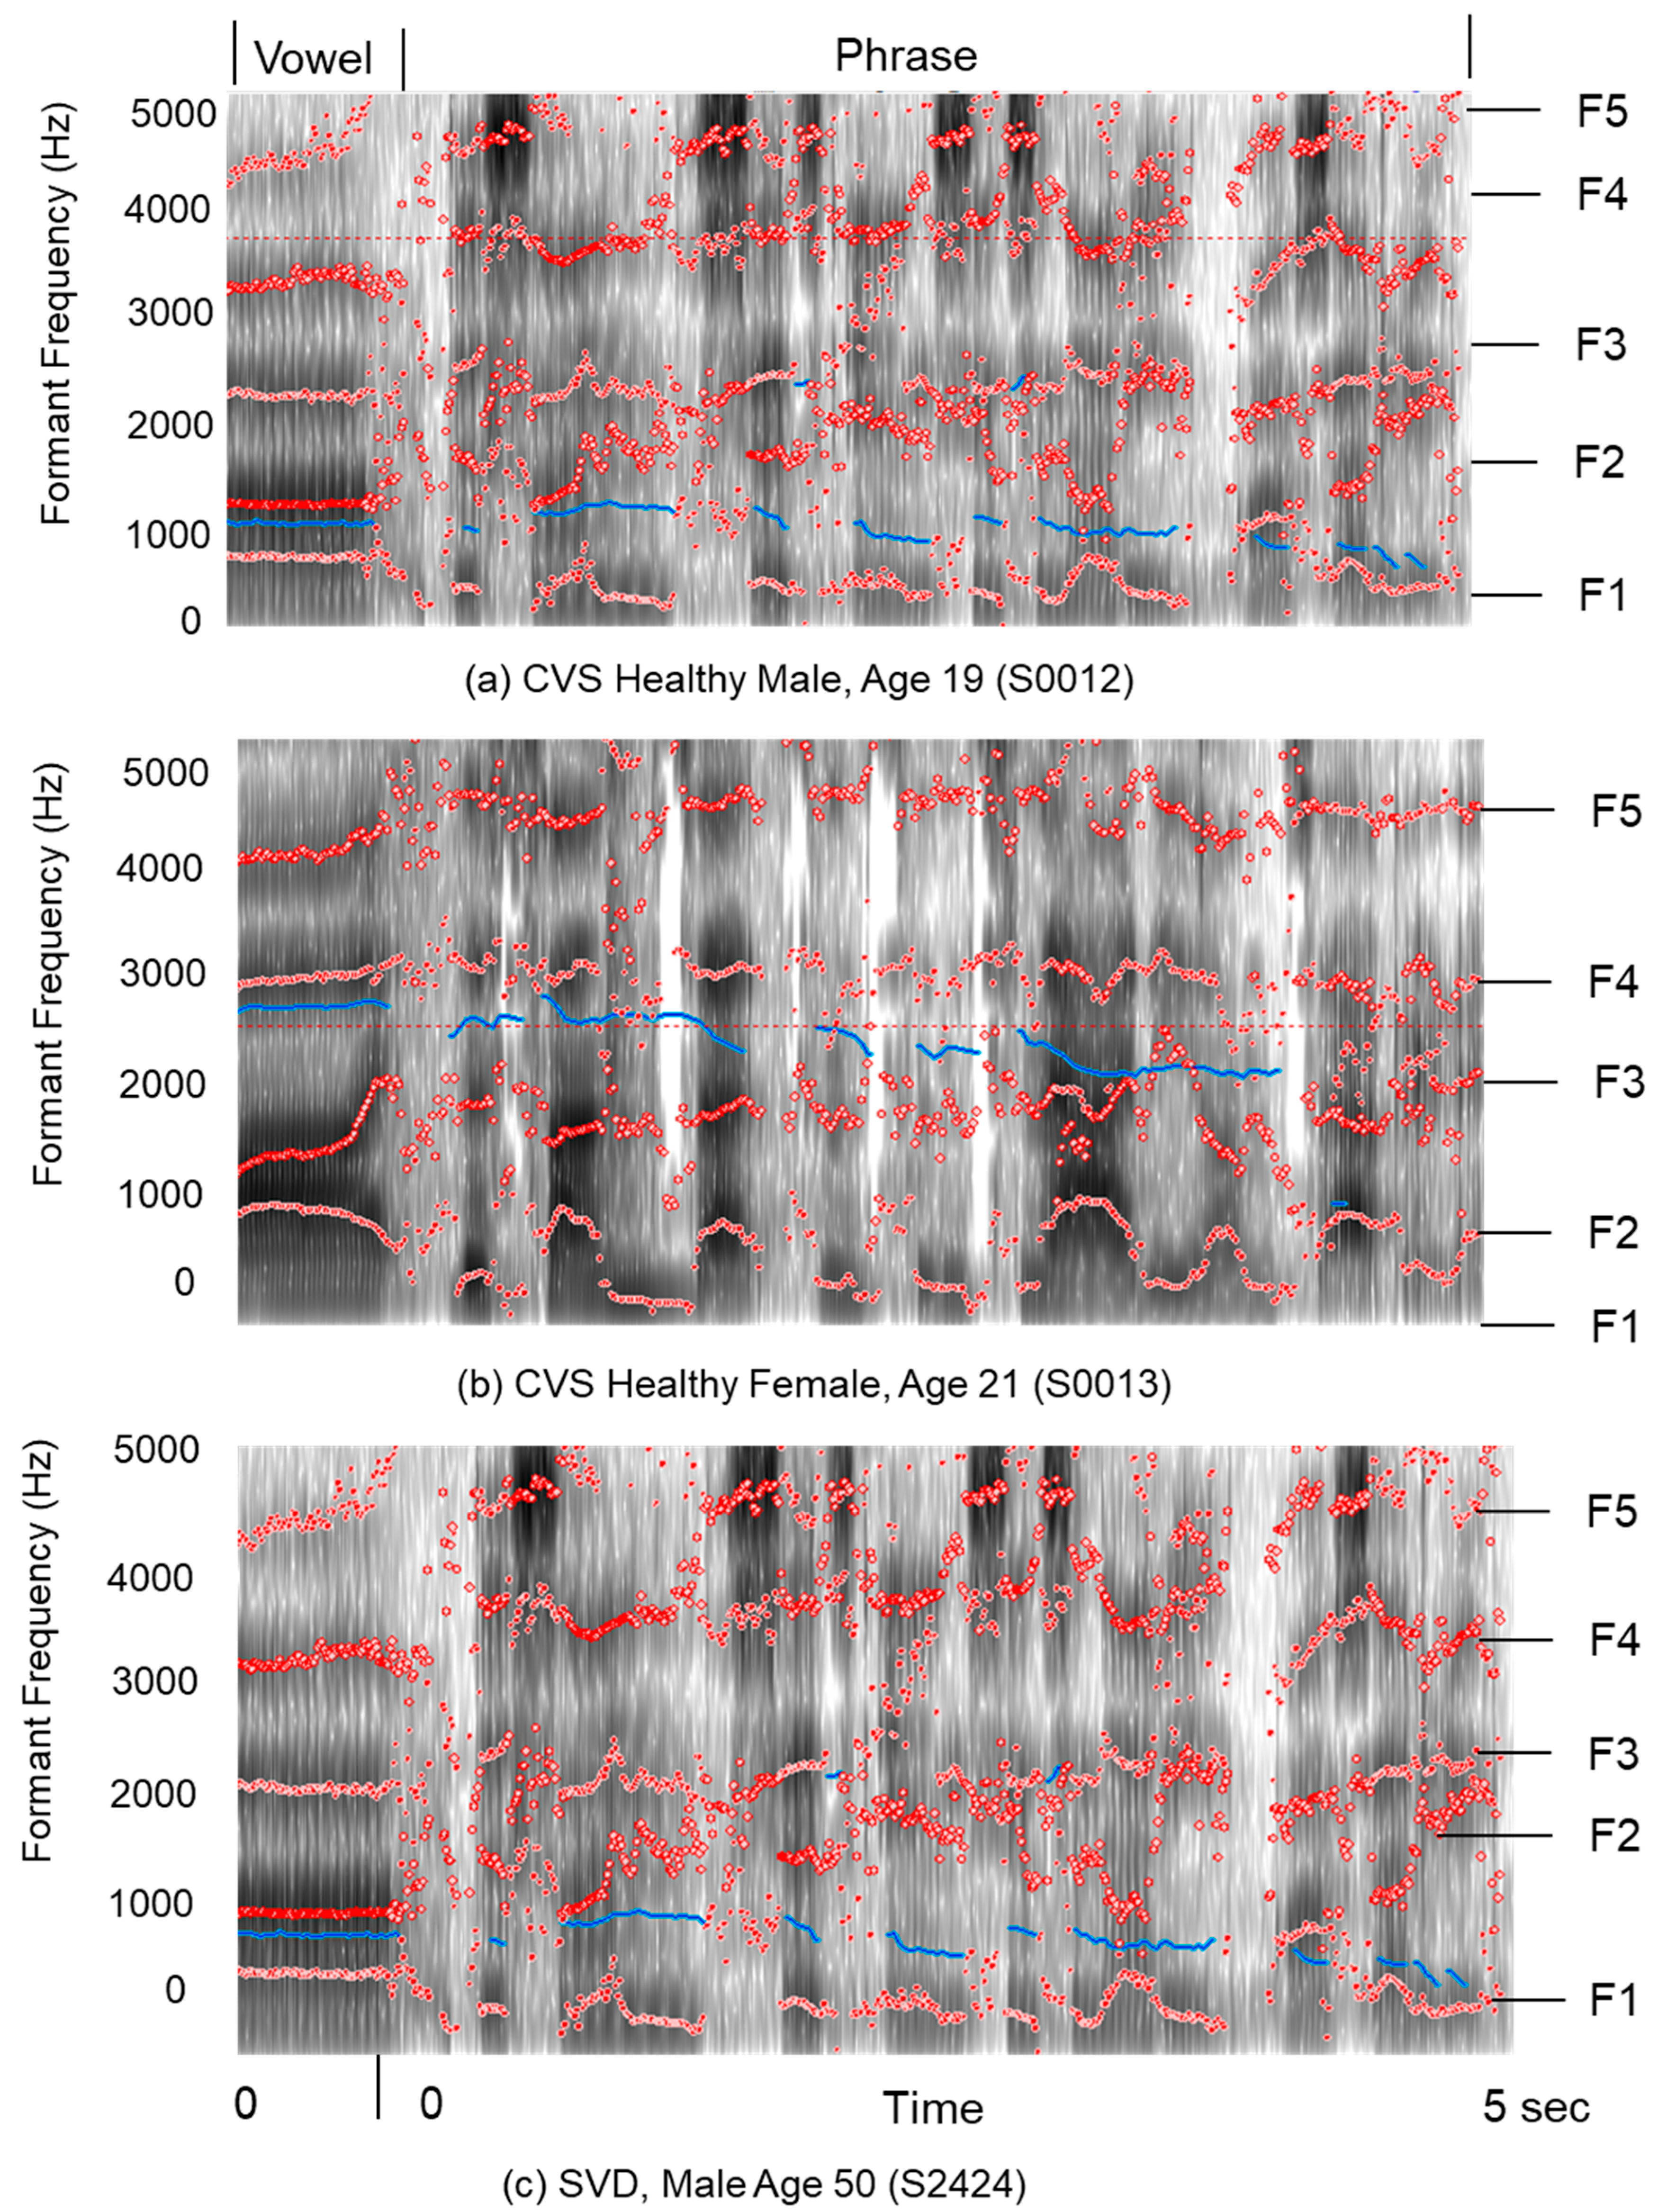
Figure 6.
Typical MFCCs C2–C12 for a healthy female, and a male subject with laryngitis. Note that the MFCC values shown are not normalized and are the raw value of the log-energy of the spectral energies post processed by a discrete cosine transform [56,62].
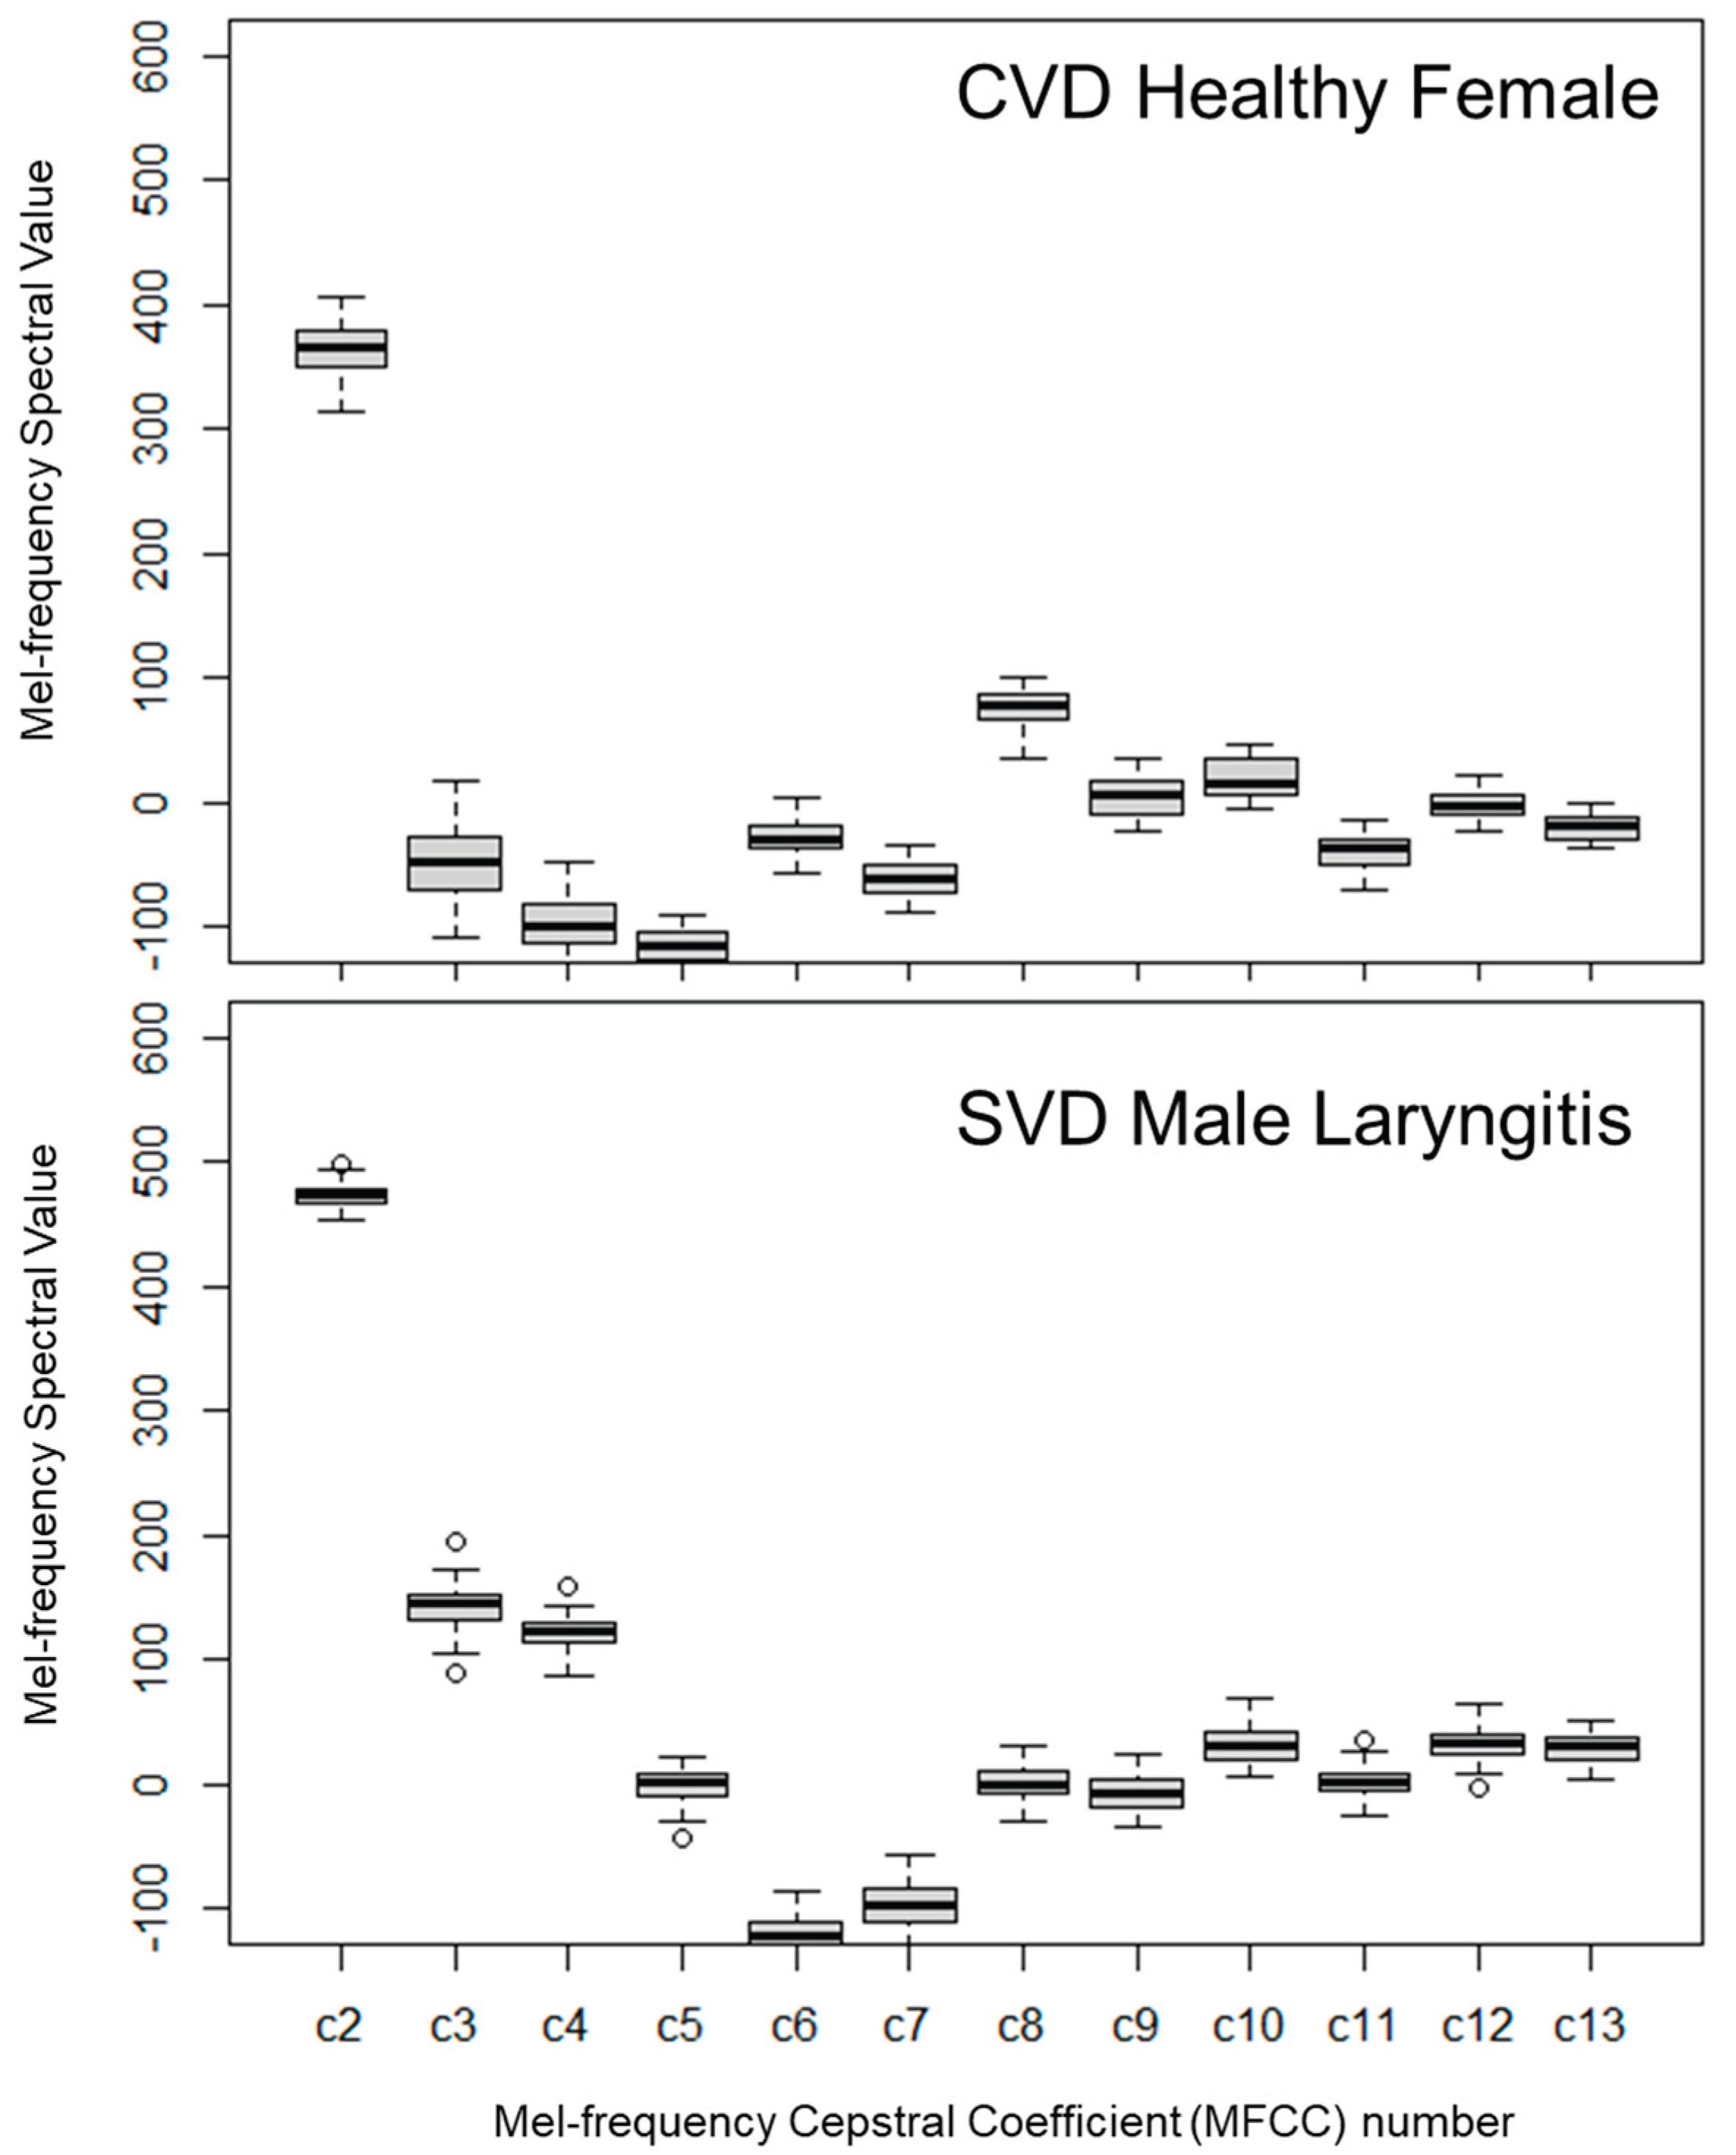
Table 3.
Baseline Demographic and Clinical Characteristics of Study Participants.
| Cohort | Status | Sex | Age | ||
| M/F | Mean (%) | n (SD) | Range | ||
| CWRU | Healthy | M | 21 (65.6%) | 20.1 (1.5) | 18-24 |
| (N=32) | Healthy | F | 11 (34.4%) | 20.5 (0.7) | 19-21 |
| Saarbrücken | Healthy | M | 20.3 (0.7) | 20-21 | |
| (N=21) | Laryngitis | M | 55.0 (4.0) | 50-60 | |
M=Male, F=Female, n = number of participants in a group, N = total number of participants, SD=Standard Deviation.
Table 4.
Pronunciation of a vowel: vocal fold source frequency, F0, in Hz.
|
Fundamental Frequency F0 |
Pronunciation of a vowel | |||
| CVS Female | CVS Male | SVD Male | SVD Male | |
| Healthy | Healthy | Healthy | Laryngitis | |
| Minimum | 195.03 (42.43) | 109.03 (22.89) | 131.81 (32.72) | 118.10 (29.00) |
| Mean | 215.78 (26.27) | 116.93 (26.80) | 136.89 (33.30) | 126.44 (25.93 |
| Maximum | 239.41 (28.82) | 125.55 (30.11) | 140.09 (33.84) | 133.86 (25.64) |
| Std Dev | 12.06 (10.32) | 4.79 (3.26) | 1.51 (0.70) | 3.55 (6.09) |
Table 5.
Pronunciation of a phrase: vocal fold source frequency, F0, in Hz.
|
Fundamental Frequency F0 |
Pronunciation of a phrase | |||
| CVS Female | CVS Male | SVD Male | SVD Male | |
| Healthy | Healthy | Healthy | Laryngitis | |
| Minimum | 82.85 (10.42) | 75.42 (1.78) | 84.99 (9.78) | 83.02 (9.99) |
| Mean | 116.87 (22.32) | 175.00 (15.12) | 136.78 (28.35) | 133.52 (23.94) |
| Maximum | 291.19 (190.06) | 331.38 (125.30) | 287.57 (163.83) | 197.96 (73.69) |
| StdDev | 53.96 (17.10) | 43.92 (45.42) | 32.20 (17.86) | 26.58 (11.13) |
We calculated the F0 standard deviation (SD) for each subject to characterize their individual range. The final table row displays the cohort-level SD, quantifying variability across all patients.
Table 6.
Comparison of key statistical parameters comparing the pronunciation of a vowel and pronunciation of a phrase for Case Western Voice Study (CVS) female.
Table 6.
Comparison of key statistical parameters comparing the pronunciation of a vowel and pronunciation of a phrase for Case Western Voice Study (CVS) female.
| Statistic | CVS Female Healthy | t-Test | H0 | ||||
| Vowel | Phrase | t stat | t- crit | ||||
| F0 | 215.779 | (26.67) | 184.308 | (18.17) | 3.234 | 2.101 | False |
| F3 | 2784.379 | (423.12) | 3270.688 | (510.01) | 2.434 | 2.093 | False |
| Jitter | 0.00568 | (0.002) | 0.22416 | (0.004) | 12.466 | 2.120 | False |
| Shimmer | 0.04550 | (0.012) | 0.09401 | (0.012) | 9.517 | 2.085 | False |
| HNR | 13.581 | (2.87) | 7.152 | (1.54) | 6.543 | 2.131 | False |
| Intensity | 78.760 | (3.01) | 74.372 | (1.73) | 4.197 | 2.120 | False |
| CPP | 26.403 | (2.84) | 16.238 | (4.68) | 6.155 | 2.119 | False |
| MFCCS-1 | 167.677 | (28.98) | 215.625 | (25.01) | 4.154 | 2.085 | False |
| RSPL | 14.723 | (3.00) | 18.739 | (1.79) | 3.806 | 2.120 | False |
| MPT | 0.473 | (0.13) | 2.517 | (0.30) | 20.578 | 2.160 | False |
Table 7.
Comparison of key statistical parameters comparing the pronunciation of a vowel and pronunciation of a phrase for Case Western Voice Study (CVS) male.
Table 7.
Comparison of key statistical parameters comparing the pronunciation of a vowel and pronunciation of a phrase for Case Western Voice Study (CVS) male.
| Statistic | CVS Male Healthy | t-Test | H0 | ||||
| Vowel | Phrase | t stat | t- crit | ||||
| F0 | 116.934 | (26.80) | 116.871 | (22.32) | 0.008 | 2.022 | True |
| F3 | 2662.566 | (167.25) | 3139.616 | (637.97) | 3.315 | 2.069 | False |
| Jitter | 0.00742 | (0.004) | 0.02393 | (0.006) | 10.599 | 2.035 | False |
| Shimmer | 0.04291 | (0.017) | 0.10224 | (0.012) | 12.925 | 2.030 | False |
| HNR | 10.476 | (3.52) | 4.853 | (1.74) | 6.555 | 2.045 | False |
| Intensity | 81.492 | (2.45) | 76.071 | (2.05) | 7.761 | 2.023 | False |
| CPP | 28.811 | (3.51) | 17.110 | (5.38) | 8.356 | 2.032 | False |
| MFCCS-1 | 112.329 | (35.95) | 173.388 | (28.44) | 6.001 | 2.024 | False |
| RSPL | 12.406 | (2.37) | 17.498 | (2.21) | 7.198 | 2.021 | False |
| MPT | 0.500 | (0.19_ | 2.391 | (0.46) | 17.231 | 2.052 | False |
Table 8.
Comparison of key statistical parameters for the pronunciation of the vowel sound “a” for healthy CVS and SVD subjects.
Table 8.
Comparison of key statistical parameters for the pronunciation of the vowel sound “a” for healthy CVS and SVD subjects.
| Statistic |
CVS Female Healthy Age: 20.5 (0.7) |
CVS Male Healthy Age: 20.1 (1.5) |
Student t-Test |
H0 | |||
| t stat | t- crit | ||||||
| F0 | 215.78 | (26.67) | 116.93 | (26.80) | 9.941 | 2.080 | False |
| F3 | 2784.38 | (423.12) | 2662.57 | (167.25) | 0.917 | 2.178 | True |
| Jitter | 0.00567 | (< 0.001) | 0.00742 | (<0.001) | 1.649 | 2.042 | True |
| Shimmer | 0.04550 | (<0.001) | 0.04291 | (<0.001) | 0.503 | 2.048 | True |
| HNR | 13.581 | (2.87) | 10.477 | (3.52) | 2.682 | 2.063 | False |
| Intensity | 78.760 | (3.01) | 81.491 | (2.45) | 2.593 | 2.109 | False |
| CPP | 26.403 | (2.84) | 28.811 | (3.51) | 2.096 | 2.059 | False |
| MFCCS-1 | 167.67 | (28.98) | 112.329 | (35.95) | 4.713 | 2.060 | False |
| RSPL | 14.724 | (3.00) | 12.406 | (2.37) | 2.223 | 2.110 | False |
| MPT | 0.473 | (0.13) | 0.500 | (0.19) | 0.468 | 2.048 | True |
Table 9.
Comparison of key statistical parameters pronunciation of a phrase for healthy male and female CVS subjects.
Table 9.
Comparison of key statistical parameters pronunciation of a phrase for healthy male and female CVS subjects.
| Statistic | CVS Female | CVS Male | Student | H0 | |||
| Healthy | Healthy | t-Test | |||||
| Age 20.5 (0.7) | Age 20.1 (1.5) | t stat | t-crit | ||||
| F0 | 184.308 | (18.17) | 116.871 | (22.32) | 9.200 | 2.064 | False |
| Jitter | 0.0224 | (0.0039) | 0.02393 | (0.0061) | 0.854 | 2.045 | True |
| Shimmer | 0.0940 | (0.0012) | 0.10224 | (0.0118) | 1.815 | 2.086 | True |
| HNR | 7.1518 | (1.540) | 4.8537 | (1.744) | 3.827 | 2.069 | False |
| Intensity | 74.373 | (1.725) | 76.071 | (2.055) | 2.473 | 2.064 | False |
| CPP | 16.239 | (4.683) | 17.110 | (5.375) | 0.475 | 2.069 | True |
| MFCCS-1 | 215.626 | (25.010) | 172.388 | (28.439) | 4.427 | 2.069 | False |
| RSPL | 18.739 | (1.795) | 17.499 | (2.212) | 1.711 | 2.064 | True |
| MPT | 2.517 | (0.304) | 2.391 | (0.464) | 0.925 | 2.045 | True |
Table 10.
Comparison of key statistical parameters for the pronunciation of the vowel sound “a” for healthy CVS Female and SVD Male subjects.
Table 10.
Comparison of key statistical parameters for the pronunciation of the vowel sound “a” for healthy CVS Female and SVD Male subjects.
| Statistic |
CVS Female Healthy Age: 20.5 (0.7) |
SVD-Male Healthy Age: 20.3 (0.7) |
Student t-Test |
H0 | |
| t stat | t- crit | ||||
| F0 | 215.78 (26.67) | 136.89 (33.30) | 7.279 | 2.060 | False |
| F3 | 2784.38 (423.12) | 2482.14 (330.84) | 2.062 | 2.110 | True |
| Jitter | 0.00567( < 0.01) | 0.00421 (<0.001) | 2.062 | 2.131 | True |
| Shimmer | 0.04550 (<0.001) | 0.03202 (<0.001) | 1.965 | 2.021 | True |
| HNR | 13.581 (2.87) | 19.409 (3.53) | 5.030 | 2.063 | False |
| Intensity | 78.760 (3.01) | 76.947 (2.99) | 1.622 | 2.085 | True |
| CPP | 26.403 (2.84) | 29.407 (3.81) | 2.568 | 2.055 | False |
| MFCCS-1 | 167.67 (28.98) | 216.200 (42.07) | 3.828 | 2.048 | False |
| RSPL | 14.724 (3.00) | 16.911 (3.01) | 1.956 | 2.089 | True |
| MPT | 0.473 (0.13) | 1.352 (0.37) | 9.751 | 2.052 | False |
Table 11.
Comparison of key statistical parameters for the pronunciation of the vowel sound “a” for healthy CVS Male and SVD Male subjects.
Table 11.
Comparison of key statistical parameters for the pronunciation of the vowel sound “a” for healthy CVS Male and SVD Male subjects.
| Statistic |
CVS Male Healthy Age: 20.1 (1.5) |
SVD-Male Healthy Age: 20.3 (0.7) |
Student t-Test |
H0 | |
| t stat | t- crit | ||||
| F0 | 116.93(26.80) | 136.89 (33.30) | 2.139 | 2.024 | True |
| F3 | 2662.57 (167.25) | 2482.14 (330.84) | 2.230 | 2.042 | True |
| Jitter | 0.00742 (<0.001) | 0.00421 (<0.001) | 3.686 | 2.506 | False |
| Shimmer | 0.04291 (<0.001) | 0.03202 (<0.001) | 2.530 | 2.045 | False |
| HNR | 10.477 (3.52) | 19.409 (3.53) | 8.212 | 2.021 | False |
| Intensity | 81.491 (2.45) | 76.947 (2.99) | 5.382 | 2.022 | False |
| CPP | 28.811 (3.51) | 29.407 (3.81) | 0.583 | 2.021 | True |
| MFCCS-1 | 112.329 (35.95) | 216.200 (42.07) | 8.602 | 2.023 | False |
| RSPL | 12.406 (2.37) | 16.911 (3.01) | 5.393 | 2.024 | False |
| MPT | 0.500 (0.19) | 1.352 (0.37) | 9.274 | 2.042 | False |
Table 12.
Pronunciation of a vowel: Jitter, shimmer, HNR and formants F1, F2, & F3.
| Mean Values | CVS Female | CVS Male | SVD Male | SVD Male |
| Healthy | Healthy | Healthy | Laryngitis | |
| Jitter | 0.006 (0.002) | 0.007 (0.004) | 0.004 (0.001) | 0.008 (0.008) |
| Shimmer | 0.045 (0.012) | 0.043 (0.017) | 0.032 (0.018) | 0.058 (0.046) |
| HNR | 13.58 (2.87) | 10.48 (3.52) | 19.41 (3.53) | 15.87 (6.30) |
| F1 | 905.40 (109.24) | 736.65 (81.05) | 626.61 (79.65) | 599.25 (48.07) |
| F2 | 1393.63 (89.66) | 1243.05 (146.18) | 1145.26 (118.36) | 1114.54 (117.33) |
| F3 | 2784.38 (423.12) | 2662.57 (167.25) | 2482.14 (330.84) | 2601.61 (374.81) |
Table 13.
Pronunciation of a phrase: Jitter, shimmer, and HNR.
| Mean Values | CVS Female | CVS Male | SVD Male | SVD Male |
| Healthy | Healthy | Healthy | Laryngitis | |
| Jitter | 0.023 (0.004) | 0.024 (0.006) | 0.025 (0.006) | 0.028 (0.012) |
| Shimmer | 0.095 (0.013) | 0.102 (0.012) | 0.092 (0.020) | 0.103 (0.032) |
| HNR | 7.091 (1.610) | 4.85 (1.74) | 10.17 (2.35) | 9.63 (3.44) |
Table 14.
Comparison of key statistical parameters for the pronunciation of the vowel sound “a” for healthy CVS male and SVD subjects with laryngitis.
Table 14.
Comparison of key statistical parameters for the pronunciation of the vowel sound “a” for healthy CVS male and SVD subjects with laryngitis.
| Statistic | CVS Male | SVD-Male | Student | H0 | |||
| Healthy | Laryngitis | t-Test | |||||
| Age: 20.5 (0.7) | 55.0 (4.0) | t Stat | t- Critical | ||||
| F0 | 116.93 | (26.8) | 126.44 | (25.93) | 1.168 | 2.021 | True |
| F3 | 2662.56 | (167.25) | 2601.61 | (374.81) | 0.681 | 2.048 | True |
| Jitter | 0.00742 | (< 1e-5) | 0.007885 | (<0.0001) | 0.236 | 2.048 | True |
| Shimmer | 0.04290 | (0.02) | 0.05751 | (0.05) | 1.353 | 2.056 | True |
| HNR | 10.476 | (3.52) | 15.875 | (6.30) | 3.430 | 2.039 | False |
| Intensity | 81.491 | (2.45) | 77.267 | (2.80) | 5.195 | 2.022 | False |
| CPP | 28.811 | (3.51) | 25.644 | (4.08) | 2.700 | 2.023 | False |
| MFCCS-1 | 112.329 | (35.95) | 212.441 | (39.40) | 8.602 | 2.021 | False |
| RSPL | 12.405 | (3.27) | 16.641 | (2.77) | 5.326 | 2.023 | False |
| MPT | 0.500 | (0.19) | 1.438 | (0.41) | 9.407 | 2.048 | False |
Table 15.
Comparison of key statistical parameters for the pronunciation of the vowel sound “a” for healthy SVD and SVD subjects with laryngitis.
Table 15.
Comparison of key statistical parameters for the pronunciation of the vowel sound “a” for healthy SVD and SVD subjects with laryngitis.
| Statistic | SVD Male | SVD-Male | Student | H0 | |||
| Healthy | Laryngitis | t-Test | |||||
| Age: 20.3 (0.7) | 55.0 (4.0) | t Stat | t- Critical | ||||
| F0 | 131.78 | (32.52) | 126.44 | (25.93) | 0.560 | 2.037 | True |
| F3 | 2482.14 | (330.84) | 2601.61 | (374.81) | 1.095 | 2.022 | True |
| Jitter | 0.00421 | (<1e-5) | 0.007885 | (<0.0001) | 2.035 | 2.080 | True |
| Shimmer | 0.03200 | (0.02) | 0.05751 | (0.05) | 2.344 | 2.039 | False |
| HNR | 19.409 | (3.53) | 15.875 | (6.30) | 2.245 | 2.039 | False |
| Intensity | 76.947 | (2.99) | 77.267 | (2.80) | 0.358 | 2.021 | True |
| CPP | 29.470 | (3.81) | 25.644 | (4.08) | 3.142 | 2.021 | False |
| MFCCS-1 | 216.196 | (42.07) | 212.441 | (39.40) | 0.299 | 2.021 | True |
| RSPL | 16.911 | (3.01) | 16.641 | (2.77) | 0.303 | 2.021 | True |
| MPT | 1.353 | (0.37) | 1.438 | (0.41) | 0.698 | 2.021 | True |
Table 16.
Comparison of key statistical parameters for the pronunciation of a phrase for healthy CVS male and SVD subject with laryngitis.
Table 16.
Comparison of key statistical parameters for the pronunciation of a phrase for healthy CVS male and SVD subject with laryngitis.
| Statistic | CVS Male | SVD-Male | Student | H0 | |||
| Healthy | Laryngitis | t-Test | |||||
| Age: 20.5 (0.7) | 55.0 (4.0) | t Stat | t- Critical | ||||
| F0 | 116.870 | (22.32) | 133.516 | (23.94) | 2.330 | 2.021 | False |
| Jitter | 0.02393 | (0.0061) | 0.02815 | (0.0123) | 1.414 | 2.045 | True |
| Shimmer | 0.10223 | (0.0118) | 0.10328 | (0.0325) | 0.138 | 2.062 | True |
| HNR | 4.853 | (1.74) | 9.630 | (3.44) | 5.680 | 2.042 | False |
| Intensity | 76.071 | (2.05) | 73.780 | (2.63) | 3.149 | 2.024 | False |
| CPP | 17.110 | (5.38) | 18.131 | (6.05) | 0.578 | 2.022 | True |
| MFCCS-1 | 171.708 | (29.00) | 307.407 | (43.92) | 11.695 | 2.030 | False |
| RSPL | 17.498 | (2.21) | 20.357 | (2.63) | 3.816 | 2.023 | False |
| MPT | 2.391 | (0.46) | 2.187 | (0.58) | 1.255 | 2.024 | True |
Table 17.
Comparison of key statistical parameters for the pronunciation of a phrase for healthy SVD subjects with SVD with laryngitis.
Table 17.
Comparison of key statistical parameters for the pronunciation of a phrase for healthy SVD subjects with SVD with laryngitis.
| Statistic | SVD Male | SVD-Male | Student | H0 | |||
| Healthy | Laryngitis | t-Test | |||||
| Age: 20.3 (0.7) | 55.0 (4.0) | t Stat | t- Critical | ||||
| F0 | 136.775 | (28.35) | 133.516 | (23.94) | 0.402 | 2.022 | True |
| Jitter | 0.02522 | (0.0062) | 0.02815 | (0.0123) | 0.977 | 2.042 | True |
| Shimmer | 0.91726 | (0.0205) | 0.10328 | (0.0325) | 1.379 | 2.032 | True |
| HNR | 10.173 | (2.35) | 9.630 | (3.44) | 0.598 | 2.030 | True |
| Intensity | 73.875 | (2.22) | 73.780 | (2.63) | 0.127 | 2.023 | True |
| CPP | 19.360 | (5.72) | 18.131 | (6.05) | 0.676 | 2.021 | True |
| MFCCS-1 | 298.069 | (31.10) | 307.407 | (43.92) | 0.764 | 2.028 | True |
| RSPL | 20.196 | (2.33) | 20.357 | (2.63) | 0.211 | 2.022 | True |
| MPT | 1.628 | (0.22) | 2.187 | (0.58) | 4.126 | 2.060 | False |
Table 18.
Average F0 from select literature for healthy subjects.
| Healthy General | Female Healthy | Male Healthy | |||
| Biever (1989) | 193.7 | Ferand (1997) | 209.7 | Gray (2008) | 125.0 |
| Brown (1989) | 211.0 | Bahn (2009) | 222.9 | Bahn (2009) | 177.8 |
| Fellippe (2006) | 162.8 | Hippargeka (2022) | 226.0 | Hippargeka (2022) | 131.6 |
| Ma (2010) | 224.1 | Davies (2015) | 125.0 | ||
| Average | 189.2 | 220.7 | 124.8 | ||
Table 19.
Jitter and shimmer results.
| Cohort | Jitter | Shimmer | ||
| CVS Female Healthy | 0.57% | (0.22) | 4.55% | (1.15) |
| CVS Male Healthy | 0.74% | (0.37) | 4.29% | (1.74) |
| SVD Male Healthy | 0.42% | (0.14) | 3.20% | (1.85) |
| SVD Male Laryngitis | 0.79% | (0.82) | 5.75% | (4.63) |
| Expected female normal [30] | 0.62% | 5.2% | ||
| Expected Male normal [30] | 0.49% | 5.2% | ||
Note: Values are presented as mean (standard deviation).
Table 20.
Harmonic-to-noise HNR results.
| Cohort | HNR | |
| CVS Female Healthy | 13.58 | (2.87) |
| CVS Male Healthy | 10.46 | (3.52) |
| SVD Male Healthy | 19.41 | (3.53) |
| SVD Male Laryngitis | 15.87 | (6.30) |
| Expected female normal range | 15.3 [30] - 19.5 [72] | |
| Expected male normal range | 16.7 [72] - 17.3 [30] | |
Note: Values are presented as mean (standard deviation).
Table 21.
Formants F1, F2, and F3 for pronunciation of a vowel /a/.
| Cohort | F1 | F2 | F3 | |
| Theatre Group (age varies) [74] | 496 | 1368 | 2506 | |
| Female Youth Healthy [75] | 625 | 2050 | 3050 | |
| Female Adult Healthy [53] | 717 | 2501 | 3289 | |
| CVS Healthy Female | 905 | 1393 | 2784 | |
| Male Adult Healthy [76] | 269 | 2143 | 3182 | |
| Male Adult Healthy [53] | 588 | 1952 | 2601 | |
| Healthy Male [8] | 626 | 1145 | 2482 | |
| Laryngitis Male [8] | 599 | 1114 | 2602 | |
| CVS Healthy Male | 736 | 1243 | 2662 | |
| Coefficient of variation (overall) | 0.28 | 0.31 | 0.11 | |
Table 22.
CPP comparison.
| Cohort | Vowel | Phrase | ||
| CVS Female Healthy | 26.40 | (2.84) | 16.24 | (4.68) |
| CVS Male Healthy | 28.81 | (3.51) | 17.11 | (5.38) |
| SVD Male Healthy | 29.41 | (3.81) | 19.36 | (5.72) |
| SVD Male Laryngitis | 25.64 | (4.08) | 18.13 | (6.05) |
Note: Values are presented as mean (standard deviation).
Disclaimer/Publisher’s Note: The statements, opinions and data contained in all publications are solely those of the individual author(s) and contributor(s) and not of MDPI and/or the editor(s). MDPI and/or the editor(s) disclaim responsibility for any injury to people or property resulting from any ideas, methods, instructions or products referred to in the content. |
© 2025 by the authors. Licensee MDPI, Basel, Switzerland. This article is an open access article distributed under the terms and conditions of the Creative Commons Attribution (CC BY) license (http://creativecommons.org/licenses/by/4.0/).
Copyright: This open access article is published under a Creative Commons CC BY 4.0 license, which permit the free download, distribution, and reuse, provided that the author and preprint are cited in any reuse.


