
Submitted:
11 December 2025
Posted:
12 December 2025
You are already at the latest version
Abstract
As an emerging technology, three-dimensional (3D) printing is gaining publicity among companies, manufacturers, and individuals to fabricate prototypes, parts, and samples. 3D printing can be used in various fields such as engineering, healthcare, education, etc. This study investigates the influence of FDM 3D printing parameters such as infill patterns (line, triangle, cubic, and gyroid), infill densities (20%, 60%, and 100%), layer thicknesses (0.1, 0.2, and 0.3 mm), and temperature according to the minimum and maximum manufacturer recommendations. This study investigated the most common filament used in FDM 3D printing, which is polylactic acid (PLA). Mechanical tests were performed on the 3D printed parts, which are uniaxial tensile test and 3-point bending test according to ASTM D638 Type-I and ISO 178 standards, respectively. Modulus of elasticity (E), fracture point (σF), maximum stress (σMax), and yield strength (σY) were obtained from the uniaxial tensile test. And for the 3-point bending test, strain at maximum load (ɛ), modulus of elasticity (Ebending), and flexural strength (σfMax) were obtained. This study showed that infill density and pattern are dominant factors in mechanical performance, while layer thickness and printing temperature provide fine-tuning effects.
Keywords:
FDM
; PLA
; mechanical testing
; three-point bending test
; uniaxial tensile test
; 3D printing parameters
1. Introduction
As an emerging technology, three-dimensional (3D) printing is gaining publicity among companies, manufacturers, and individuals to fabricate prototypes, parts, and samples [1]. 3D printing can be applied in numerous fields, including engineering, healthcare, and education [2]. Thus, the market value of 3D printing has increased in recent years, reaching around $230 billion in 2025, according to McKinsey Global Institute [3]. There are many techniques to 3D print, such as direct ink writing (DIW), selective laser sintering (SLS), stereolithography (SLA), fused deposition modelling (FDM), etc [4]. FDM is considered the most common 3D printing technique due to its ease of use and affordability. Various 3D printing parameters, such as infill pattern, infill percentage, layer thickness, temperature, etc., are used in FDM to produce a model [5].
In a study performed by Shuheng et al [6]. The authors investigated the impact of 3D printing angle, layer thickness, fill rate (infill density), and nozzle temperature on the mechanical properties of the 3D printed model by using polylactic acid (PLA) material. Dynamic mechanical analysis (DMA) was applied using a uniaxial tensile machine (UTM) at different temperatures. The study found that FDM 3D printing parameters affected the mechanical properties of printed materials. 3D printing angle influences fracture behavior, with angles below 45° causing interlayer fractures and angles above 45° leading to intralayer fractures. Thinner layers improve bonding strength, and higher fill rates reduce air gaps for better material bonding. Nozzle temperature impacts material flow; too low weakens bonding, while too high causes thermal degradation. Jayant Gir et al [7]. investigated various parameters such as layer thickness (mm), cooling rate, and printing orientation with PLA material. The researchers performed mechanical testing by using a UTM to study the tensile strength with respect to the build orientation. The study concluded that the peak tensile strength of 29.88 MPa was at a layer thickness of 0.1 mm for vertically oriented 3D prints. In horizontally oriented 3D prints, peak stress was 53.62 MPa with a layer thickness of 0.2 mm, given that the increase in layer thickness reduced the strength of the printed part. Furthermore, this study found that the cooling rate affects vertical more than horizontal 3D printing orientation. Also, higher rates of cooling decrease the 3D printed part's strength. Finally, thicker printing layers print faster than thinner layers, but they are weaker. A third research study conducted by M. Kamaal et al [8]. group, examined how FDM 3D printing parameters, such as layer height, infill percentage, and build direction, can affect the mechanical properties of 3D-printed parts with Carbon Fiber PLA filament. This study's results showed that maximum tensile strength was achieved at 80% infill and a 0.25 mm layer height. For impact resistance, building direction and infill percentage play a larger role than layer height. On the other hand, M Heidari-Rarani et al [9]. used the Taguchi method to examine the influence of three parameters, such as infill density, printing speed, and layer thickness, using PLA material. They concluded that the optimal parameters for both the modulus of elasticity and ultimate tensile strength were infill density 80%, printing speed 40 mm/s, and layer thickness 0.1 mm. The optimal parameters for the failure strain were infill density of 80%, printing speed of 40 mm/s, and layer thickness of 0.2 mm. In a study that focuses on PLA by Abhinav Chadha et al [10]. they examined the effects of primary layer thickness, bed temperature, and infill patterns on tensile and flexural strength of the 3D printed model. They concluded that increasing layer thickness improves both tensile and flexural strengths, with a 7.42% increase in tensile strength for honeycomb infill. Also, Agrawal AP et al [11]. evaluated a set of different parameters, such as infill pattern, infill density, and layer thickness, by using acrylonitrile butadiene styrene (ABS) material. The study recommended the use of minimum layer thickness combined with high infill density to improve layer bonding strength. Concentric infill pattern with density of 80% and layer thickness of 0.1 mm was the strongest among others and has tensile strength of 38.95 MPa and impact strength of 26.97 kJ/m^2. On the other hand, in another study that also used PLA by Nor Aiman Bin Sukindar et al [12]. they performed tensile tests on samples by varying three parameters: layer thickness, shell thickness (i.e., inner and outer wall), and printing speed. This study showed that shell thickness had the greatest impact on tensile strength. Reducing printing speed and using a lower layer thickness improved strength by enhancing bonding between layers. Harsh Chokshi et al [13]. studied the effect of layer thickness (0.06 mm, 0.1 mm, and 0.15 mm), infill geometry (Tri-Hexagonal, concentric, and gyroid), and number of perimeters (2, 4, and 6) on tensile strength and flexural strength by using PLA material. The investigators claimed that the tensile strength increases with a higher number of perimeters. Hence, claiming that a 0.1 mm layer thickness, 6 perimeter layers, and gyroid infill geometry had the highest tensile strength of 44.9 MPa. Moreover, they claimed that the flexural strength increases with a higher layer height because of a decrease in the air gap in the 3D printed part. The authors achieved a maximum flexural strength of 115.3 MPa at 0.15 mm layer thickness, 4 perimeter layers, and concentric infill geometry.
To this end, published research studies lacked a controlled environment, such as using the enclosure to regulate temperature and humidity during printing samples, also controlling the environment of the filament before and after the 3D printing process. Additionally, in some studies, they didn't apply more than one test run (i.e., N = 1) on the same combination, which might bias the results. Therefore, this study aims to comprehensively test previously tested infill patterns, such as line and triangle, in addition to the most used cubic and gyroid patterns. Also, this study will test layer thicknesses of 0.1mm, 0.2mm, and 0.3mm, infill densities of 20%, 60%, and 100%, and minimum and maximum manufacturer-recommended 3D printing temperatures for the filament (i.e., PLA+ Esun, China). The environment of the 3D printing will be controlled by placing the printer in a temperature-controlled enclosure. The printed samples will be evaluated for uniaxial tensile strength and bending strength according to ASTM D638 Type-I standard (i.e., “dogbone”) for tensile test and ISO 178 standard for bending test. Each combination of printing parameters will be printed and tested 5 times (i.e., N = 5) to increase the reliability of the data generated.
2. Methods
2.1.3. D Printing Parameters
Tested parameters were infill pattern, infill density, layer thickness, and temperature. The infill patterns used represent the geometric structure inside the 3D object, which directly influences the structural strength of the model. This study investigates these patterns to determine which provides the highest mechanical strength. The infill density refers to the percentage of the pattern (i.e., infill density per unit of volume) that fills the structure of the 3D object. A 20% infill density contains less material per unit volume than 60%, while 100% density is filled with the polymer, which is automatically adjusted to a rectilinear pattern. Layer thickness (i.e., layer height) is the slice height of the 3D printed part. For uniaxial tensile test samples, layer thicknesses of 0.1, 0.2, and 0.3 mm were used, resulting in 31, 16, and 11 layers, respectively. For the bending test samples, the same previously mentioned thicknesses were used, producing 39, 20, and 14 layers, respectively. Finally, the 3D printing nozzle temperature was set once to the minimum (i.e., 205 °C) and once to the maximum (i.e., 225 °C) factory-recommended range for PLA+ filament. The 3D printing surrounding environment was controlled by the presence of an enclosure. The environment was controlled by preheating the bed to the recommended bed temperature of 60 °C for 3 minutes before starting the printing. This was done to ensure that the ambient printing temperature was at 60 °C. The summary of the 3D printing parameters can be found in Table 1.

Table 1.
3D Printing Parameters Summary.
| Parameter | Values |
|---|---|
| Infill pattern | Line, Triangle, Cubic, Gyroid. |
| Infill density | 20%, 60%, 100% |
| Layer thickness | 0.1 mm, 0.2 mm, 0.3 mm |
| Printing temperature (PLA+) | 205 °C (minimum), 225 °C (maximum) |
2.2. 3D Printer and Material
A brand new (never used with any material before) Bambu Lab P1S with enclosure (Bambu Lab, Shenzhen, China) 3D printer with a nozzle diameter of 0.4 mm was used. A textured plate with polyetherimide (PEI) lamination was used. Bambu Studio software v. 1.10.1.50 (Bambu Lab, Shenzhen, China) was used to create g-code. As mentioned before, the printer is brand new and hasn't been used, so there are no material contamination or 3D printer intra-variability errors. The filament that has been used is from the same batch and manufacturer.
2.3. Sample Preparation
For the uniaxial tensile test, the samples were 3D printed according to ASTM D638 Type-1 (i.e., “dog bone”) standard with a length of 165 mm, width of 19 mm, length of narrow section of 57 mm, width of narrow section 13 mm, and thickness of 3.2 mm, as shown in Figure 1(a). The total number of sample groups was 72. Each sample group consisted of 5 identical samples, and the sixth sample was a backup (Figure 1(b)). For the combination of parameters with 100% infill, there was no infill pattern other than rectilinear. Therefore, for 100% infill, the infill pattern was excluded, reducing the number of sample groups from 72 to 54.
For the three-point bending test, the samples were 3D printed according to ISO-178 standard. The length was 80 mm, the width was 10 mm, and the thickness was 4 mm, as shown in Figure 2(a). The total number of sample groups was 72. Each sample group consisted of 5 identical samples, and the sixth was a backup (Figure 2(b)). Similar to uniaxial tensile test samples, for the combination of parameters with 100% infill, there was no infill pattern other than rectilinear. Therefore, for 100% infill, the infill pattern was excluded, reducing the number of sample groups from 72 to 54. As shown in Figure 2(b), four groups of samples with different infill patterns were 3D printed together due to the small size of the samples and to minimize the time needed for 3D printing. The infill patterns were: 1 was a “Line” infill pattern, 2 was a “Triangle” infill pattern, 3 was a “Cubic” infill pattern, and 4 was a “Gyroid” infill pattern.
2.4. Uniaxial Tensile Test and Three-Point Bending Test
The uniaxial tensile test was done on an (Instron 5965, Norwood, Massachusetts) machine with a load cell capacity of 5 kN as seen in Figure 3(a). The samples conformed to the standard ASTM D638 Type-1 (i.e., “dog bone”) geometry. Before testing, the sample dimensions were entered into the machine's software. Each sample was then securely clamped to the jaws of the testing machine, ensuring proper alignment with the area before the curve. As shown in Figure 3(b), both jaws start to pull the sample until the failure point.
The three-point bending test was performed using the same Instron 5965 universal testing machine as the uniaxial tensile test, but equipped with a different toolhead and support base, as shown in Figure 4(a). The samples conformed to the ISO 178 standard, and the relevant dimensions were entered into the machine’s software in the same manner as for the uniaxial tensile test. The three-point bending fixture consists of two supports and a central loading nose, which applies force at the midpoint of the sample as shown in Figure 4(b).
3. Results
From the uniaxial tensile test, the Young’s modulus (), fracture point (), maximum stress (), and yield strength () were acquired. From the three-point bending test, maximum load strain (ɛ), modulus of elasticity (bending), and flexural strength () were acquired. According to Song et al [14]. () was calculated from a 0.2% offset. The uniaxial tensile test (ASTM D638 type 1) and three-point bending test (ISO-178) have 108 groups in total, and they are divided into two main groups: the minimum 3D printing temperature group and the maximum 3D printing temperature group, 205 °C and 225 °C, respectively. In general, it was found that infill density was the most influential parameter affecting the mechanical properties of the 3D printed samples. Specifically, in the group printed at the minimum temperature (i.e., 205 °C), an increase in infill density leads to a corresponding increase in maximum stress (). This suggests that a denser internal structure improves the 3D printed sample's resistance to stress under both tensile and bending loading conditions.
3.1. Uniaxial Tensile Test
As shown in Figure 5, the uniaxial tensile samples after the tests were completed. Furthermore, plots of Figure 6 show the effects of infill density, infill pattern, layer thickness, and printing temperature on yield strength (), Young’s modulus (E), maximum stress (), and fracture strength (). Pointing out the highest maximum stress is () 47.12 MPa with following combination (line, 100%, 0.2 mm, 225 °C) and the lowest is () 22.43 MPa with combination (line, 20%, 0.1 mm, 225 °C).
Tables 2.1, 2.2, and 2.3 summarize tensile testing results of infill densities 20%, 60% and 100%.
Table 2.1.
Tensile test for 20% infill density.
| Property | Lowest (MPa) | Infill Pattern | Layer Height (mm) | Temperature (°C) | Highest (MPa) | Infill Pattern | Layer Height (mm) | Temperature (°C) |
|---|---|---|---|---|---|---|---|---|
| Yield Strength () | 15.96 | Line | 0.3 | 225 | 19.60 | Cubic | 0.3 | 225 |
| Young’s Modulus () | 768.31 | Line | 0.1 | 205 | 996.61 | Cubic | 0.3 | 225 |
| Maximum Stress () | 22.43 | Line | 0.1 | 225 | 30.73 | Cubic | 0.3 | 225 |
| Fracture Strength () | 11.58 | Gyroid | 0.1 | 205 | 16.05 | Cubic | 0.3 | 225 |
Table 2.2.
Tensile test for 60% infill density.
| Property | Lowest (MPa) | Infill Pattern | Layer Height (mm) | Temperature (°C) | Highest (MPa) | Infill Pattern | Layer Height (mm) | Temperature (°C) |
|---|---|---|---|---|---|---|---|---|
| Yield Strength () | 19.60 | Triangle | 0.1 | 205 | 25.56 | Cubic | 0.3 | 225 |
| Young’s Modulus (E) | 933.86 | Line | 0.1 | 205 | 1176.04 | Cubic | 0.2 | 225 |
| Maximum Stress () | 28.09 | Triangle | 0.1 | 205 | 35.17 | Cubic | 0.3 | 225 |
| Fracture Strength () | 8.58 | Line | 0.2 | 225 | 18.74 | Cubic | 0.3 | 225 |
Table 2.3.
Tensile test for 100% infill density.
| Property | Lowest (MPa) | Infill Pattern | Layer Height (mm) | Temperature (°C) | Highest (MPa) | Infill Pattern | Layer Height (mm) | Temperature (°C) |
|---|---|---|---|---|---|---|---|---|
| Yield Strength () | 27.56 | Line | 0.3 | 225 | 32.91 | Line | 0.2 | 225 |
| Young’s Modulus (E) | 1343.23 | Line | 0.3 | 225 | 1449.36 | Line | 0.1 | 225 |
| Maximum Stress () | 38.61 | Line | 0.3 | 225 | 47.12 | Line | 0.2 | 225 |
| Fracture Strength () | 19.91 | Line | 0.3 | 225 | 23.73 | Line | 0.1 | 205 |
3.2. Three-Point Bending Test
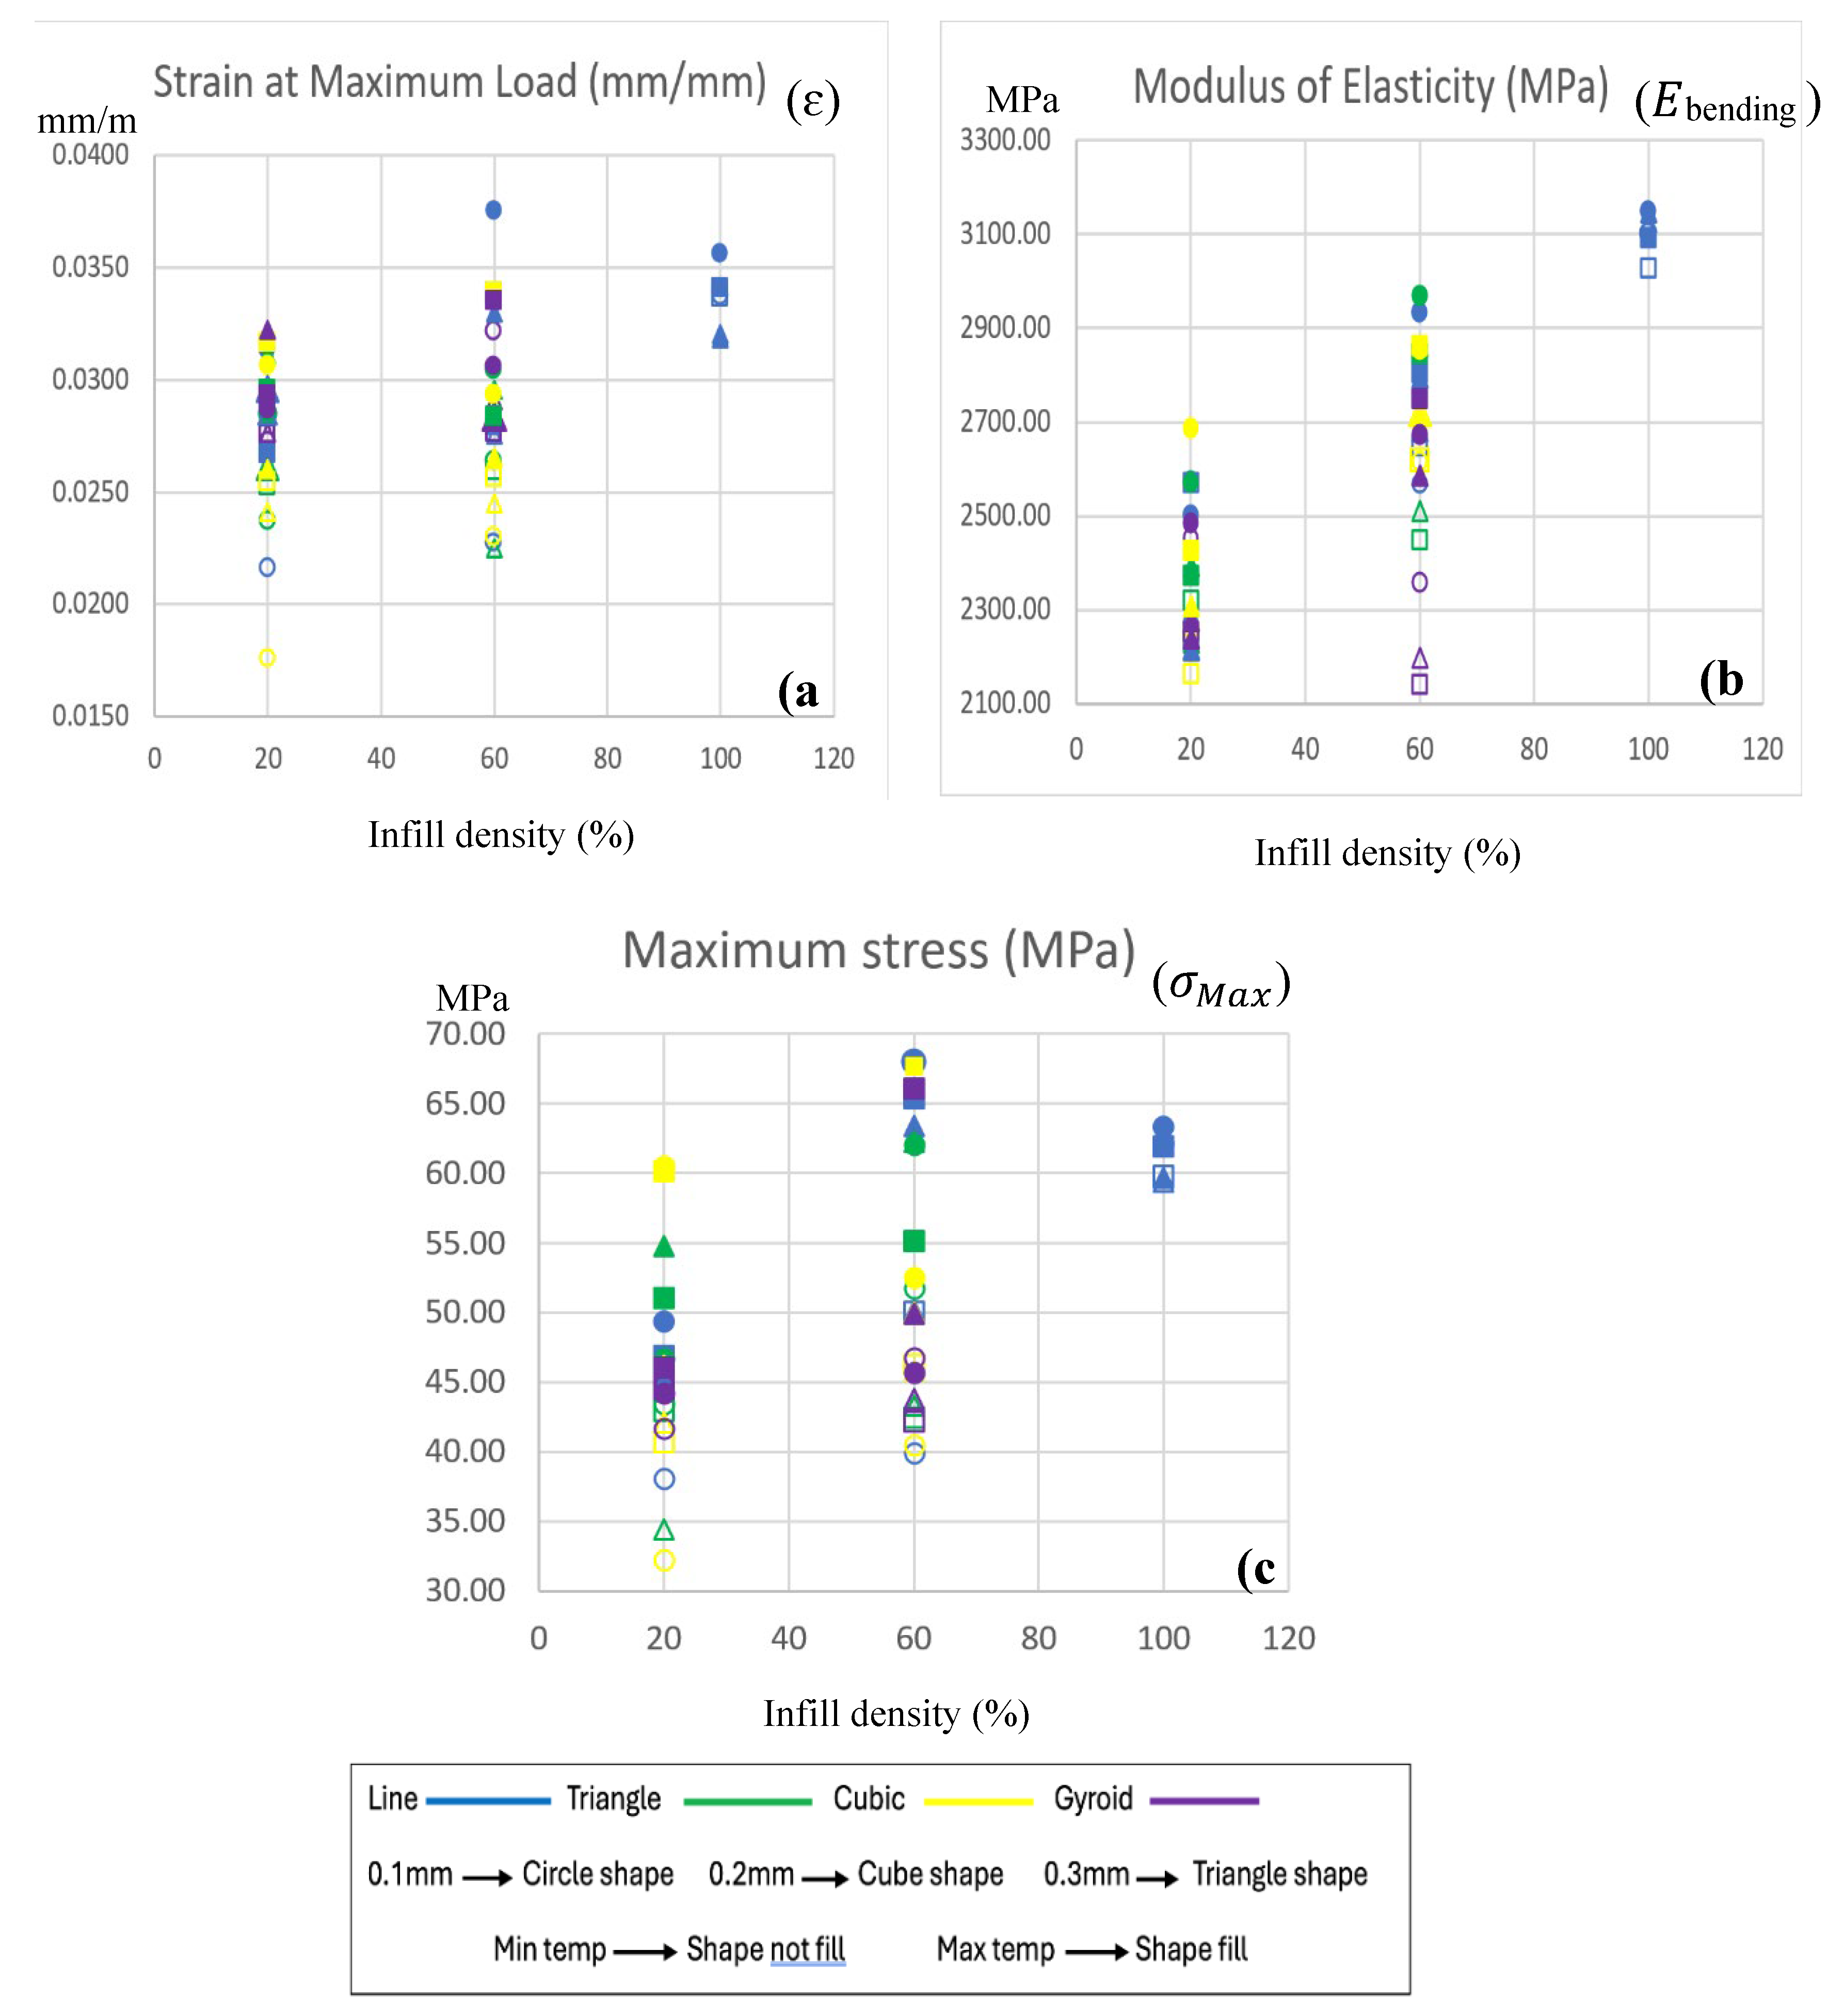
As shown in Figure 7, the three-point bending samples after the tests were completed. Furthermore, plots of Figure 8 show the effects of infill density, infill pattern, layer thickness, and printing temperature on flexural strength (), strain at maximum load (ɛ), and modulus of elasticity (bending). Pointing out the highest flexural strength () is 67.92 MPa with the following combination (line, 60%, 0.1 mm, 225° C) and the lowest () is 32.27 MPa with a combination (cubic, 20%, 0.1 mm, 205 °C).
Tables 3.1, 3.2, and 3.3 summarize three-point bending testing results of infill densities 20%, 60% and 100%.
Table 3.1.
Three-point bending test for 20% infill density.
| Property | Lowest | Infill Pattern | Layer Height (mm) | Temperature (°C) | Highest | Infill Pattern | Layer Height (mm) | Temperature (°C) |
|---|---|---|---|---|---|---|---|---|
| Flexural Strength () | 32.27 MPa | Cubic | 0.1 | 205 | 60.50 MPa | Cubic | 0.1 | 225 |
| Modulus of Elasticity () | 2163.73 MPa | Cubic | 0.2 | 205 | 2688.67 MPa | Cubic | 0.1 | 225 |
| Strain at Maximum Load (ɛ) | 0.0176 mm/mm | Cubic | 0.1 | 205 | 0.0322 mm/mm | Gyroid | 0.3 | 225 |
Table 3.2.
Three-point bending test for 60% infill density.
| Property | Lowest | Infill Pattern | Layer Height (mm) | Temperature (°C) | Highest | Infill Pattern | Layer Height (mm) | Temperature (°C) |
|---|---|---|---|---|---|---|---|---|
| Flexural Strength () | 39.91 MPa | Line | 0.1 | 205 | 67.92 MPa | Line | 0.1 | 225 |
| Modulus of Elasticity () | 2142.02 MPa | Gyroid | 0.2 | 205 | 2970.54 MPa | Triangle | 0.1 | 225 |
| Strain at Maximum Load (ɛ) | 0.0225 mm/mm | Triangle | 0.3 | 205 | 0.0375 mm/mm | Line | 0.1 | 225 |
Table 3.3.
Three-point bending test for 100% infill density.
| Property | Lowest | Infill Pattern | Layer Height (mm) | Temperature (°C) | Highest | Infill Pattern | Layer Height (mm) | Temperature (°C) |
|---|---|---|---|---|---|---|---|---|
| Flexural Strength () | 59.40 MPa | Line | 0.3 | 205 | 63.31 MPa | Line | 0.1 | 225 |
| Modulus of Elasticity () | 3027.33 MPa | Line | 0.2 | 205 | 3149.87 MPa | Line | 0.1 | 225 |
| Strain at Maximum Load (ɛ) | 0.0319 mm/mm | Line | 0.3 | 225 | 0.0357 mm/mm | Line | 0.1 | 225 |
4. Discussion
This study showed that the mechanical properties of a 3D printed model can be significantly affected by different 3D printing parameters, irrespective of 3D printing material and printing orientation. It was shown that Mechanical performance was strongly influenced by all four parameters (i.e., infill patterns, infill density, layer thicknesses, and printing temperature).
The highest maximum tensile strength () of 47.12 MPa was found to be at 100% infill density, 0.2 mm layer thickness, and 225 °C printing temperature, using the “Line” infill pattern. This combination likely produced strong interlayer adhesion and minimal internal voids, allowing efficient stress transfer throughout the specimen. A moderate layer thickness of 0.2 mm promotes optimal melting and bonding between layers, while high infill density minimizes structural porosity, resulting in a stiffer and stronger sample. Additionally, printing at 225 °C enhances molecular diffusion across layers, improving mechanical integrity without significant thermal degradation. In contrast, the lowest achieved maximum tensile strength () was 22.43 MPa at 20 % infill density with “Line” pattern, 0.1 mm layer thickness, and 225 °C printing temperature. This might be due to low infill density reducing the load-bearing cross-section. At the same time, the very thin layers increase the number of interfacial regions prone to delamination under tensile stress. It can be noticed that despite the printing temperature being the same for both the highest and lowest values of maximum tensile strength (), the strength doubled due to a change in layer height, infill pattern, and infill percentage.
The highest flexural strength () 67.92 MPa occurred at 60 % infill density, 0.1 mm layer thickness, and 225 °C printing temperature, using the “Line” infill pattern. This configuration balances stiffness and ductility — the moderate infill density reduces brittleness while maintaining sufficient structural support. The thin 0.1 mm layers increase interlayer contact area, enhancing bonding and resistance to bending deformation. Meanwhile, the “Line” infill pattern aligns filament paths parallel to the bending stress direction, promoting efficient load transfer along the printed lines. The elevated printing temperature (225 °C) further improves adhesion between adjacent layers. Conversely, the lowest flexural stress () was 32.27 MPa, obtained at “Cubic” infill pattern, 20% infill, 0.1 mm layer thickness, and 205 °C printing temperature. The combination of low infill and lower temperature creates more air gaps and weaker layer bonding, reducing stiffness under bending.
In general, this study suggests that moderate layer thickness (i.e., 0.2 mm), had higher maximum stress () in the uniaxial tensile test, associated with higher infill densities (i.e. 60% or 100%), while a thinner layer thickness (i.e., 0.1 mm) performed better in the three-point bending test, most probably due to increased interlayer bonding.
Furthermore, this study suggests that the “Cubic” infill pattern performed better in maximum stress during tensile tests at moderate densities, while the “Line” infill pattern excelled in bending tests due to its isotropic load distribution. Increasing the infill density led to higher strength and stiffness, with 100% infill consistently outperforming lower densities in both tensile and bending properties. Additionally, higher nozzle temperatures enhanced layer adhesion and overall strength within recommended limits, whereas excessively high or low temperatures reduced bonding quality and mechanical performance [15].
This study has a few limitations. The first, 3D printing was done by using one brand of PLA filament, which means that the results are strictly bound to this filament brand, from which other brands might have higher or lower mechanical properties. However, the main aim of this paper was to illustrate how much 3D printing parameters can affect the mechanical properties of the printed model, irrespective of filament brand and material type. The second, despite the high control of environmental factors that might affect the mechanical properties of 3D printed model, such as surrounding temperature, material cross-contamination, material batch variations, etc. There might be an affect due to variation in humidity during printing. However, due to the dry nature of the city and lab where the 3D printing and mechanical testing were performed, there might be no significant effect due to humidity.
5. Conclusions
This study evaluated the combined effects of infill density (20%, 60%, 100%), infill pattern (gyroid, cubic, triangle, line), layer thickness (0.1, 0.2, 0.3 mm), and nozzle temperature (205 °C, 225 °C) on the tensile and three point bending properties of PLA+ samples printed using a Bambu Lab P1S printer under controlled environmental conditions. Tensile maximum performance: () = 32.91 MPa (100% infill density, “Line” infill pattern, 0.2 mm layer highest, 225 °C printing temperature), () = 47.12 MPa (100% infill density, “Line” infill pattern, 0.2 mm layer highest, 225 °C printing temperature), (E) = 1449.36 MPa (100% infill density, “Line” infill pattern, 0.1 mm layer highest, 225 °C printing temperature), and () = 23.73 MPa (100% infill density, “Line” infill pattern, 0.1 mm layer highest, 205 °C printing temperature).
Three-point bending maximum performance: () = 67.92 MPa (60% infill density, “Line” infill pattern, 0.1 mm layer highest, 225 °C printing temperature, (E bending) = 3149.87 MPa (100% infill density, “Line” infill pattern, 0.1 mm layer highest, 225 °C printing temperature), (ɛ) = 0.0375 (60% infill density, “Line” infill pattern, 0.1 mm layer highest, 225 °C printing temperature).
This study suggests that infill density and pattern are dominating factors in the mechanical performance of 3D printed models, while layer thickness and printing temperature provide fine-tuning effects. This study was performed in controlled testing conditions and multiple sample replicates (N=5 for each group).
Author Contributions
Faisal S. Fakhouri: conceptualization (lead), formal analysis (equal), investigation (equal), methodology (equal), project administration (lead), resources (equal), supervision (lead), validation (equal), writing – original draft (equal). Ziyad S. Alatawi: conceptualization (supporting), data curation and collection (lead), formal analysis (equal), investigation (equal), methodology (equal), resources (equal), software (lead), validation (equal), visualization (lead), writing – original draft (equal). Abdulaziz I. Hadadi: conceptualization (supporting), data curation and collection (lead), formal analysis (equal), investigation (equal), methodology (equal), resources (equal), software (lead), validation (equal), visualization (lead), writing – original draft (equal). Mohammed E. Aldhafyan: formal analysis (equal), resources (equal).
Funding
This research was funded by Ongoing Research Funding program (ORFFT-2025-xxx), King Saud University, Riyadh, Saudi Arabia.
Data Availability Statement
The original contributions presented in this study are included in the article. Further inquiries can be directed to the corresponding author.
Acknowledgments
Ongoing Research Funding program (ORFFT-2025-xxx), King Saud University, Riyadh, Saudi Arabia.
Conflicts of Interest
The authors declare no conflicts of interest. The funders had no role in the design of the study; in the collection, analyses, or interpretation of data; in the writing of the manuscript; or in the decision to publish the results.
References
- Mohr, S.; Khan, O. 3D Printing and Its Disruptive Impacts on Supply Chains of the Future. Technology Innovation Management Review 2015, 5. [Google Scholar] [CrossRef]
- Haleem, A.; Javaid, M. 3D printed medical parts with different materials using additive manufacturing. Clin Epidemiol Glob Health 2020, 8. [Google Scholar] [CrossRef]
- Kim, H. Market analysis and the future of sustainable design using 3D printing technology. Archives of Design Research 2018, 31. [Google Scholar] [CrossRef]
- Karakurt, I.; Lin, L. 3D printing technologies: techniques, materials, and post-processing. Current Opinion in Chemical Engineering 2020, 28. [Google Scholar] [CrossRef]
- Additive manufacturing of composite materials by FDM technology: A review. Indian Journal of Engineering and Materials Sciences 2020, 27. [CrossRef]
- Wang, S.; Ma, Y.; Deng, Z.; Zhang, S.; Cai, J. Effects of fused deposition modeling process parameters on tensile, dynamic mechanical properties of 3D printed polylactic acid materials. Polym Test 2020, 86. [Google Scholar] [CrossRef]
- Giri, J.; Chiwande, A.; Gupta, Y.; Mahatme, C.; Giri, P. Effect of process parameters on mechanical properties of 3d printed samples using FDM process. Materials Today: Proceedings, 2021.
- Kamaal, M.; Anas, M.; Rastogi, H.; Bhardwaj, N.; Rahaman, A. Effect of FDM process parameters on mechanical properties of 3D-printed carbon fibre–PLA composite. Progress in Additive Manufacturing 2021, 6. [Google Scholar] [CrossRef]
- Heidari-Rarani, M.; Ezati, N.; Sadeghi, P.; Badrossamay, M.R. Optimization of FDM process parameters for tensile properties of polylactic acid specimens using Taguchi design of experiment method. Journal of Thermoplastic Composite Materials 2022, 35. [Google Scholar] [CrossRef]
- Chadha, A.; Ul Haq, M.I.; Raina, A.; Singh, R.R.; Penumarti, N.B.; Bishnoi, M.S. Effect of fused deposition modelling process parameters on mechanical properties of 3D printed parts. World Journal of Engineering 2019, 16. [Google Scholar] [CrossRef]
- Agrawal, A.P.; Kumar, V.; Kumar, J.; Paramasivam, P.; Dhanasekaran, S.; Prasad, L. An investigation of combined effect of infill pattern, density, and layer thickness on mechanical properties of 3D printed ABS by fused filament fabrication. Heliyon 2023, 9. [Google Scholar] [CrossRef] [PubMed]
- Sukindar NABin Bin, M.K.A.M.A.; Hang Tuah Bin, B.T.B.; Binti, C.N.A.J.; Bin, M.I.S.I. Analysis on the impact process parameters on tensile strength using 3d printer repetier-host software. ARPN Journal of Engineering and Applied Sciences 2017, 12. [Google Scholar]
- Chokshi, H.; Shah, D.B.; Patel, K.M.; Joshi, S.J. Experimental investigations of process parameters on mechanical properties for PLA during processing in FDM. Advances in Materials and Processing Technologies 2022, 8. [Google Scholar] [CrossRef]
- Song, Y.; Li, Y.; Song, W.; Yee, K.; Lee, K.Y.; Tagarielli, V.L. Measurements of the mechanical response of unidirectional 3D-printed PLA. Mater Des 2017, 123. [Google Scholar] [CrossRef]
- Liu, J.; Naeem, M.A.; Al Kouzbary Met, a.l. Effect of Infill Parameters on the Compressive Strength of 3D-Printed Nylon-Based Material. Polymers (Basel) 2023, 15. [Google Scholar] [CrossRef] [PubMed]
Figure 1.
(a) Dimensions of the uniaxial tensile test sample according to ASTM D638-type 1 standard. (b) Tensile samples in 3D printing phase.
Figure 1.
(a) Dimensions of the uniaxial tensile test sample according to ASTM D638-type 1 standard. (b) Tensile samples in 3D printing phase.
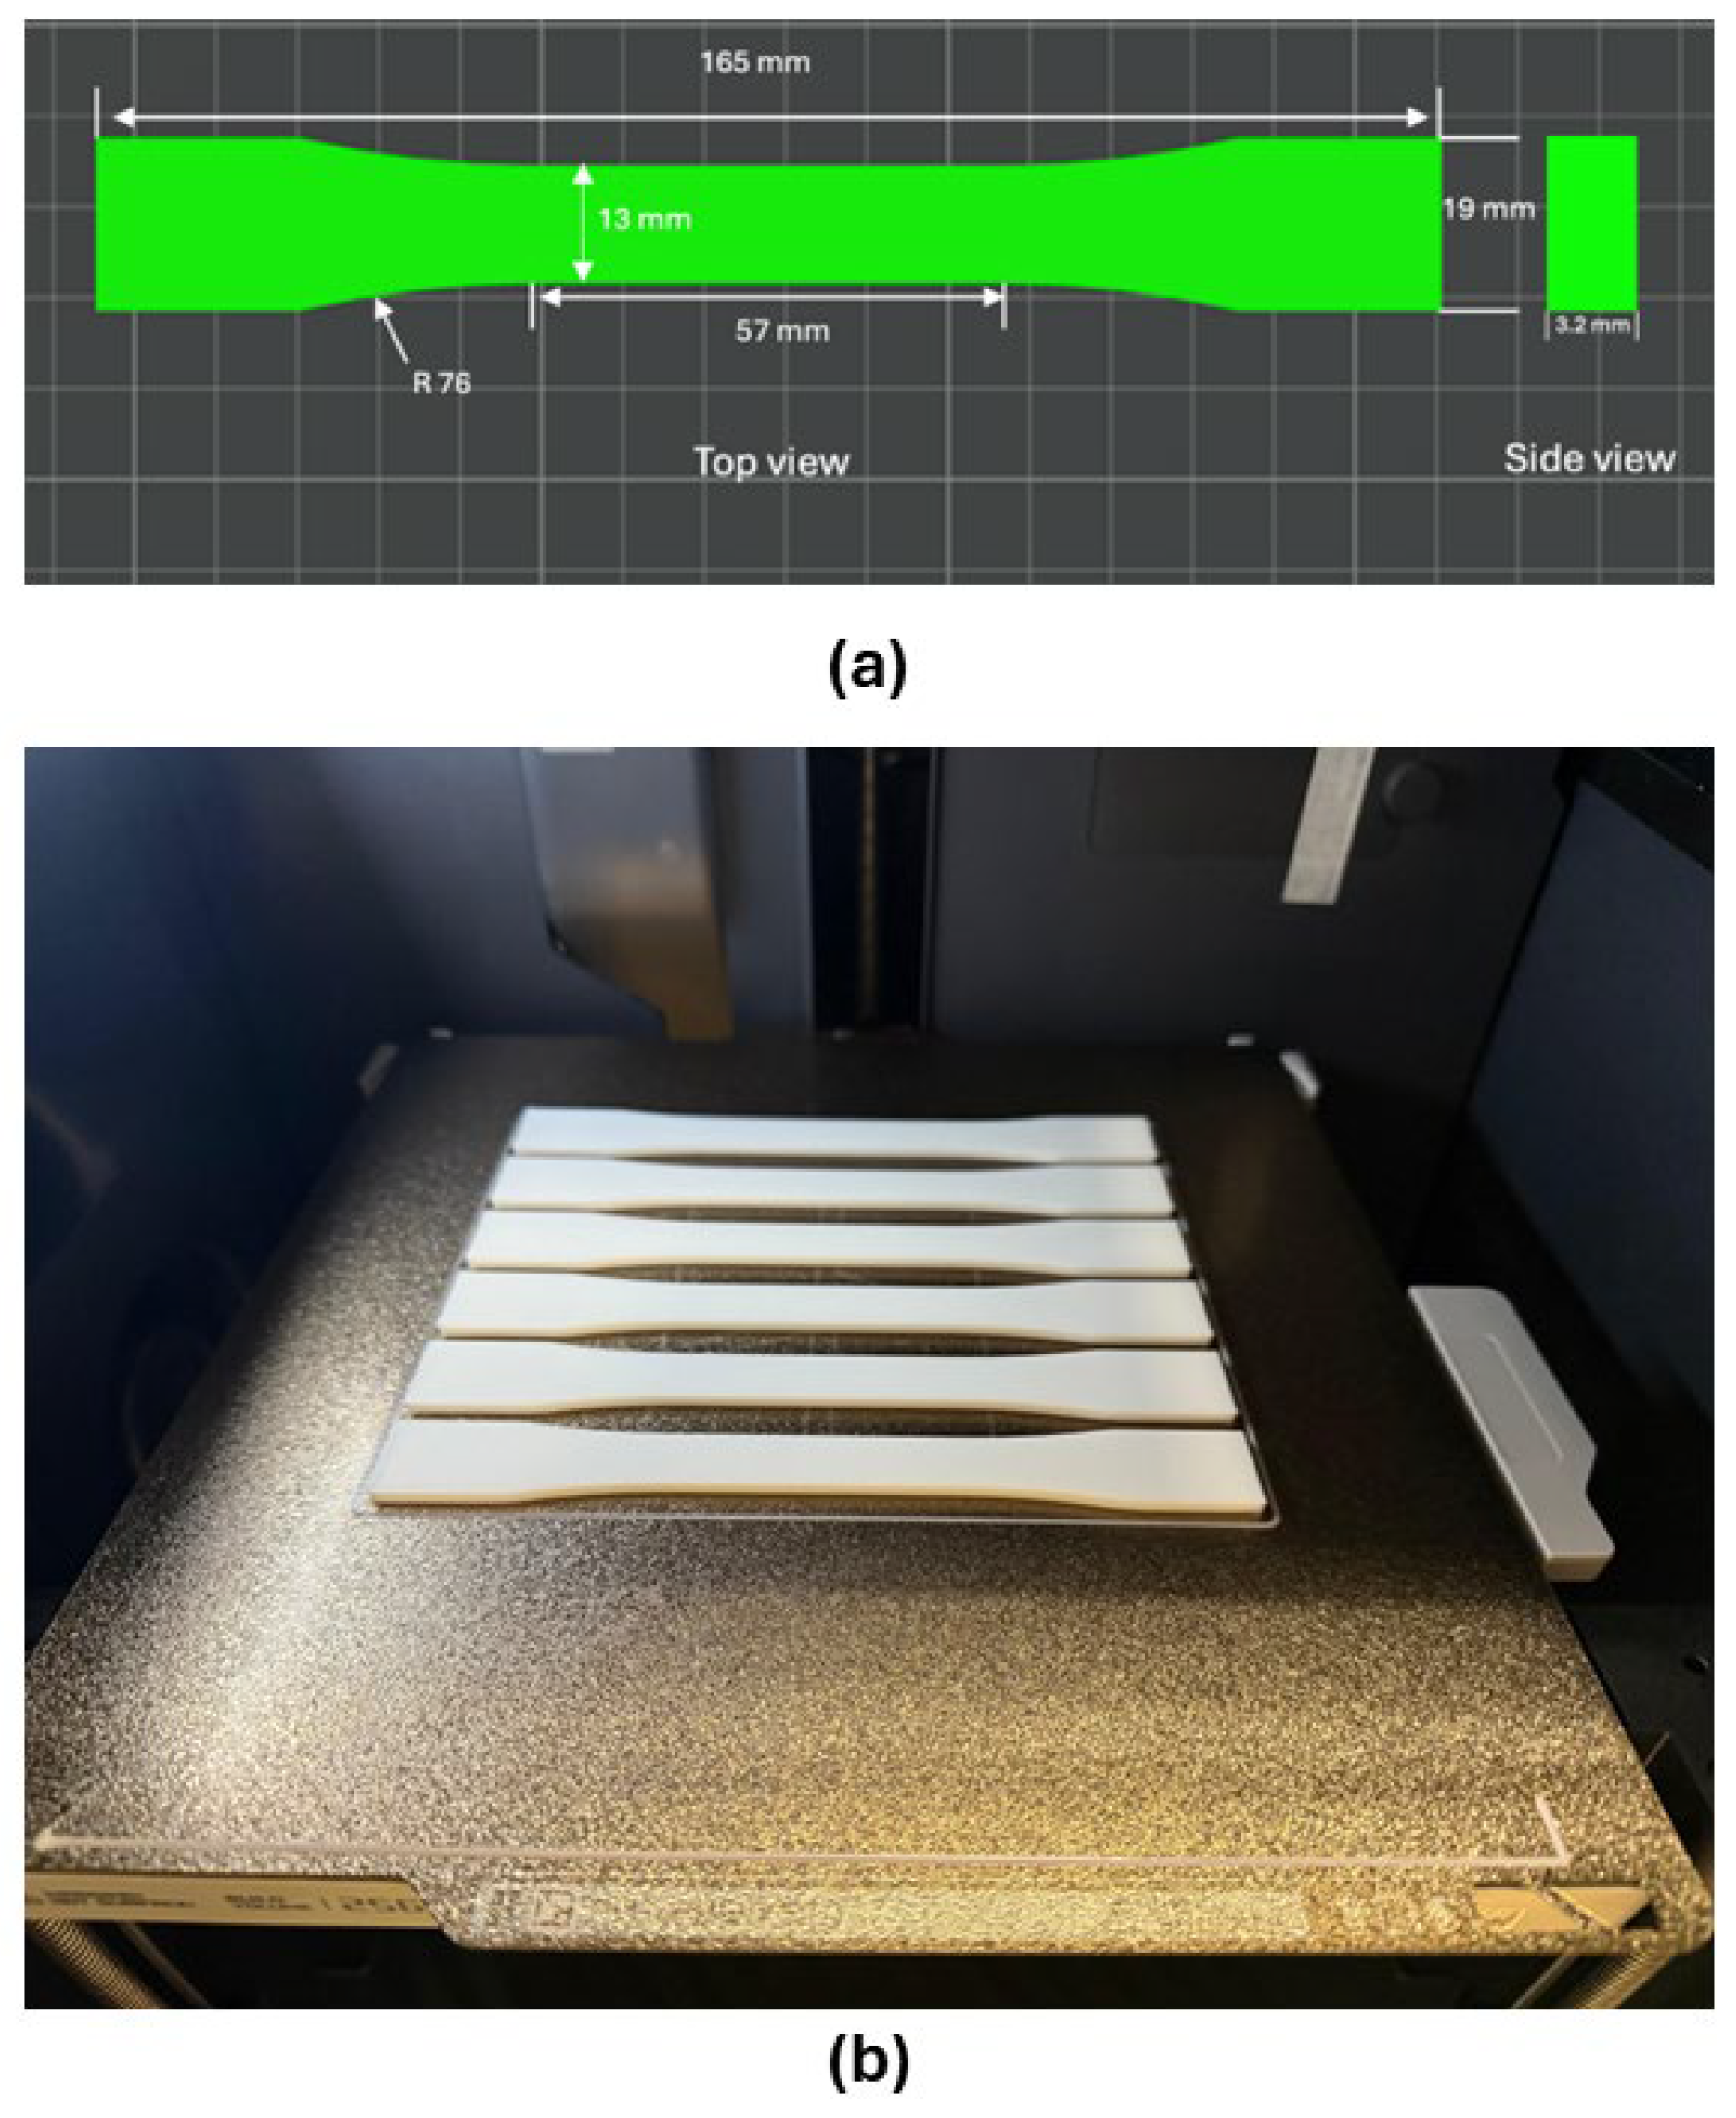
Figure 2.
(a) Dimensions of the bending test sample according to ISO-178. (b) Bending samples in the 3D printing phase.
Figure 2.
(a) Dimensions of the bending test sample according to ISO-178. (b) Bending samples in the 3D printing phase.
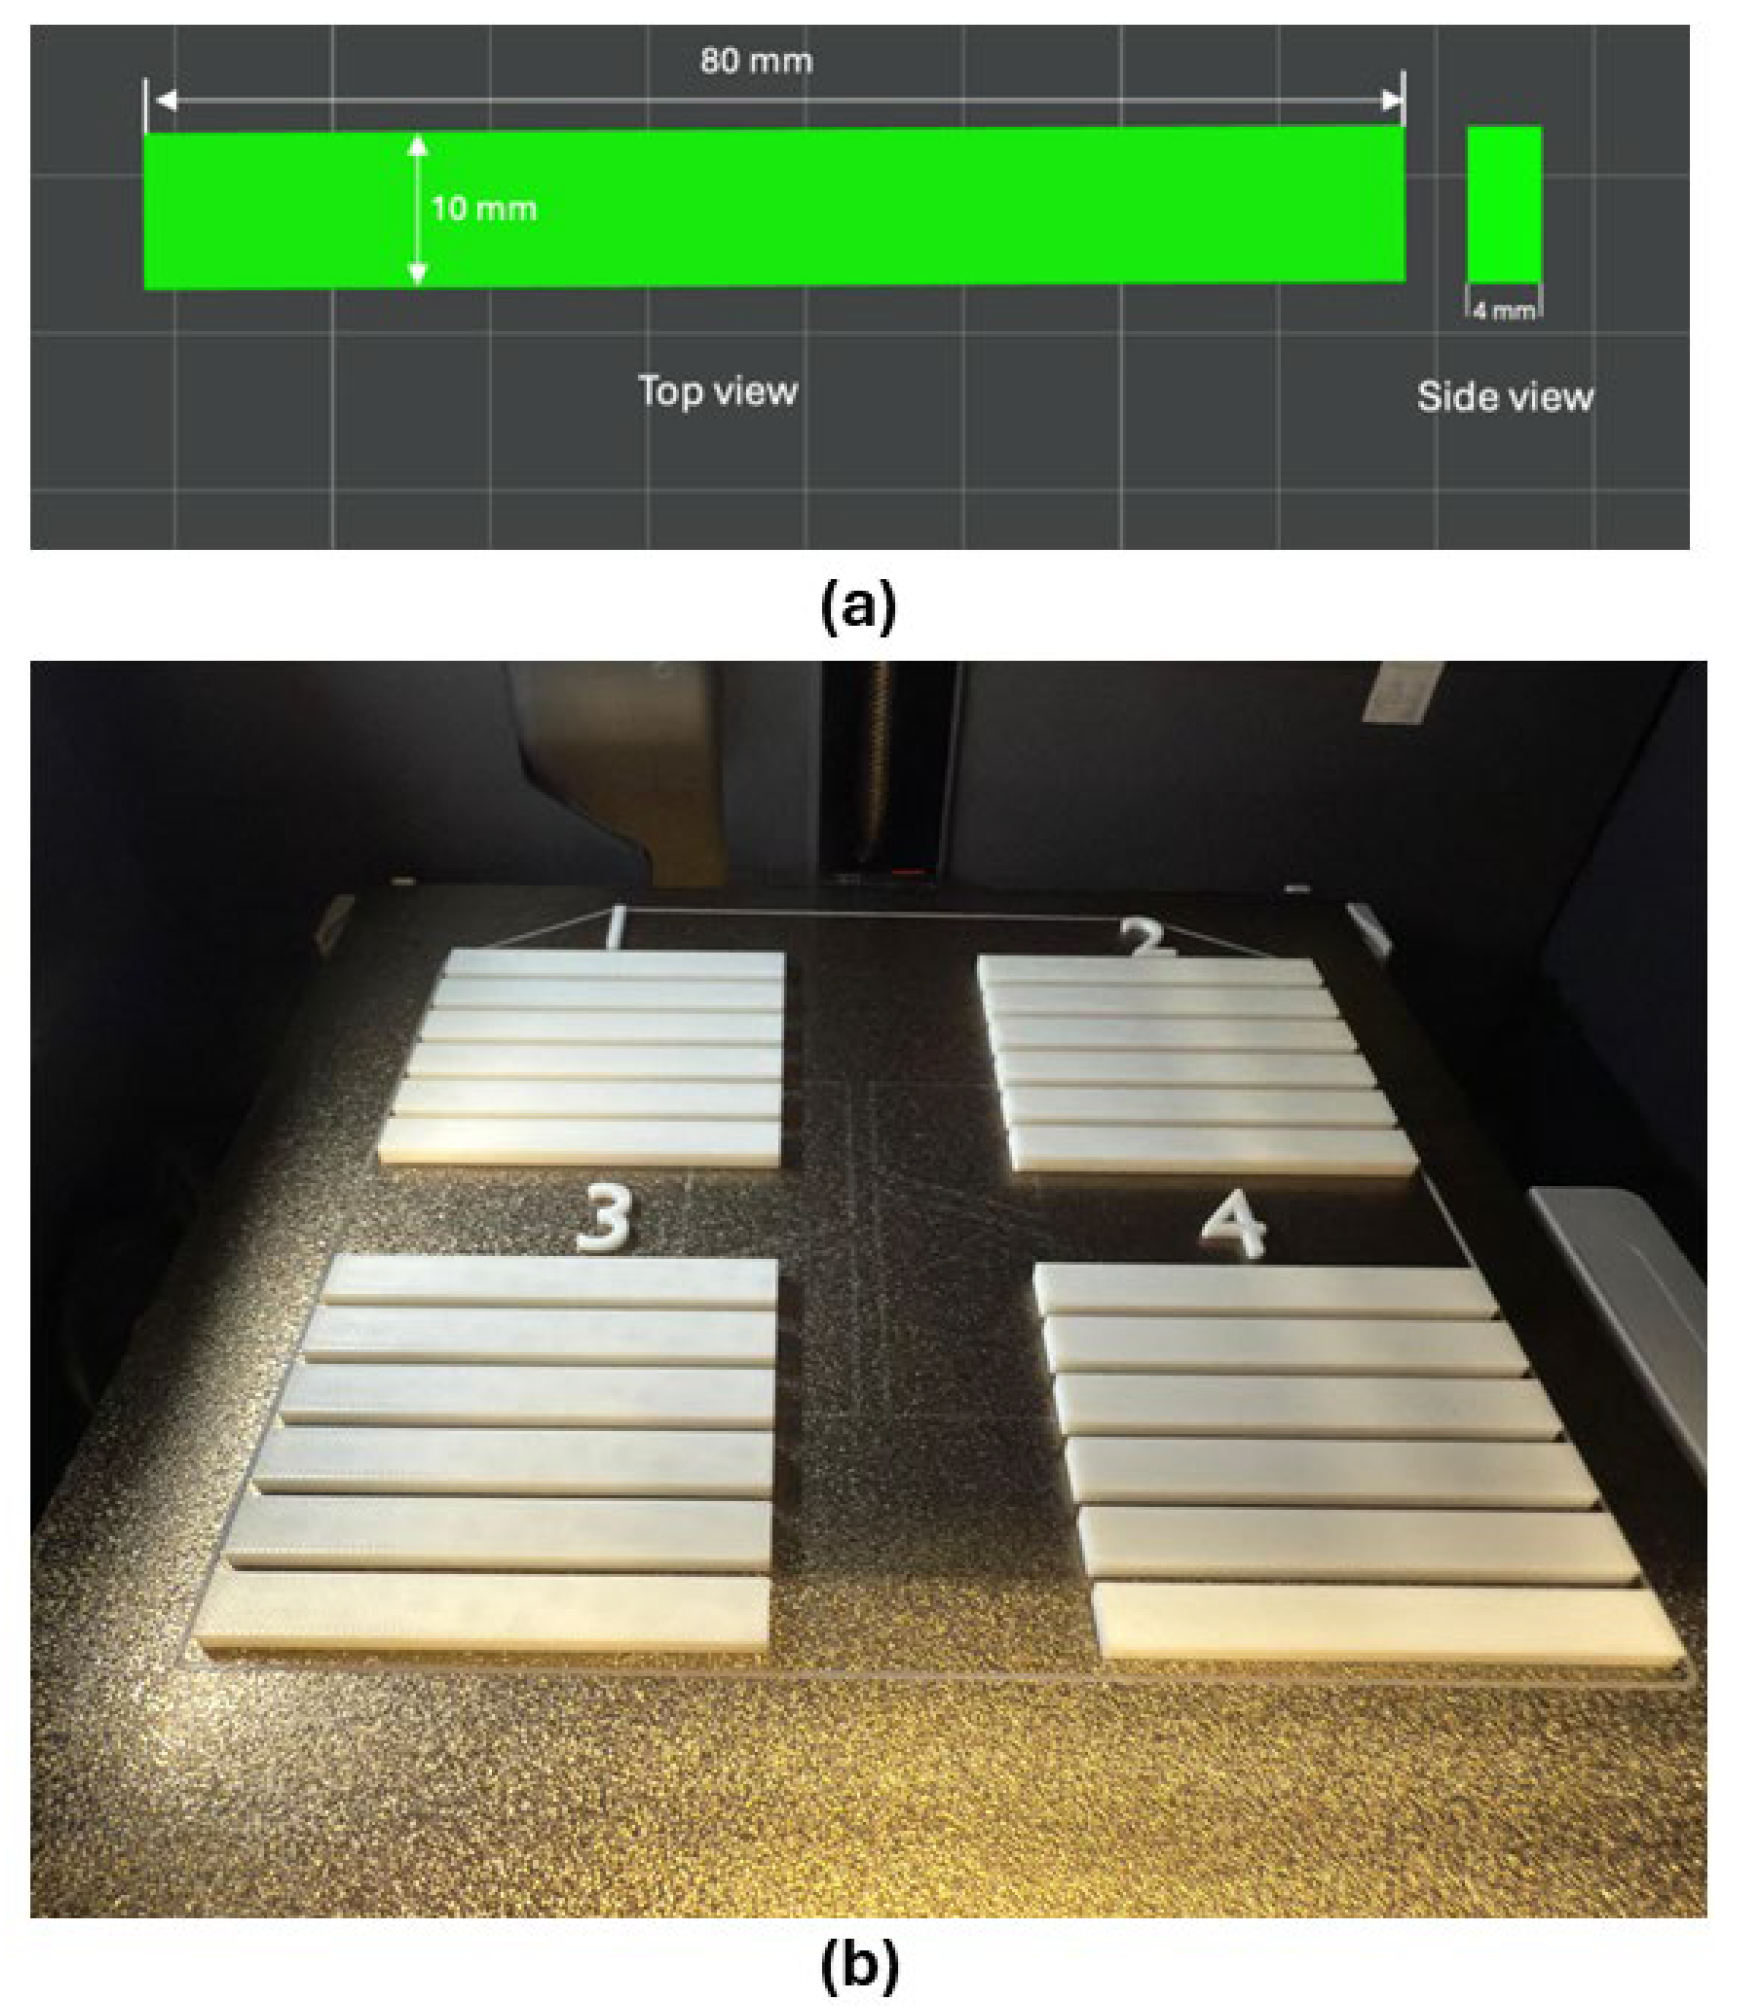
Figure 3.
(a) Uniaxial tensile testing machine (Instron 5965). (b) Tensile sample during the test.
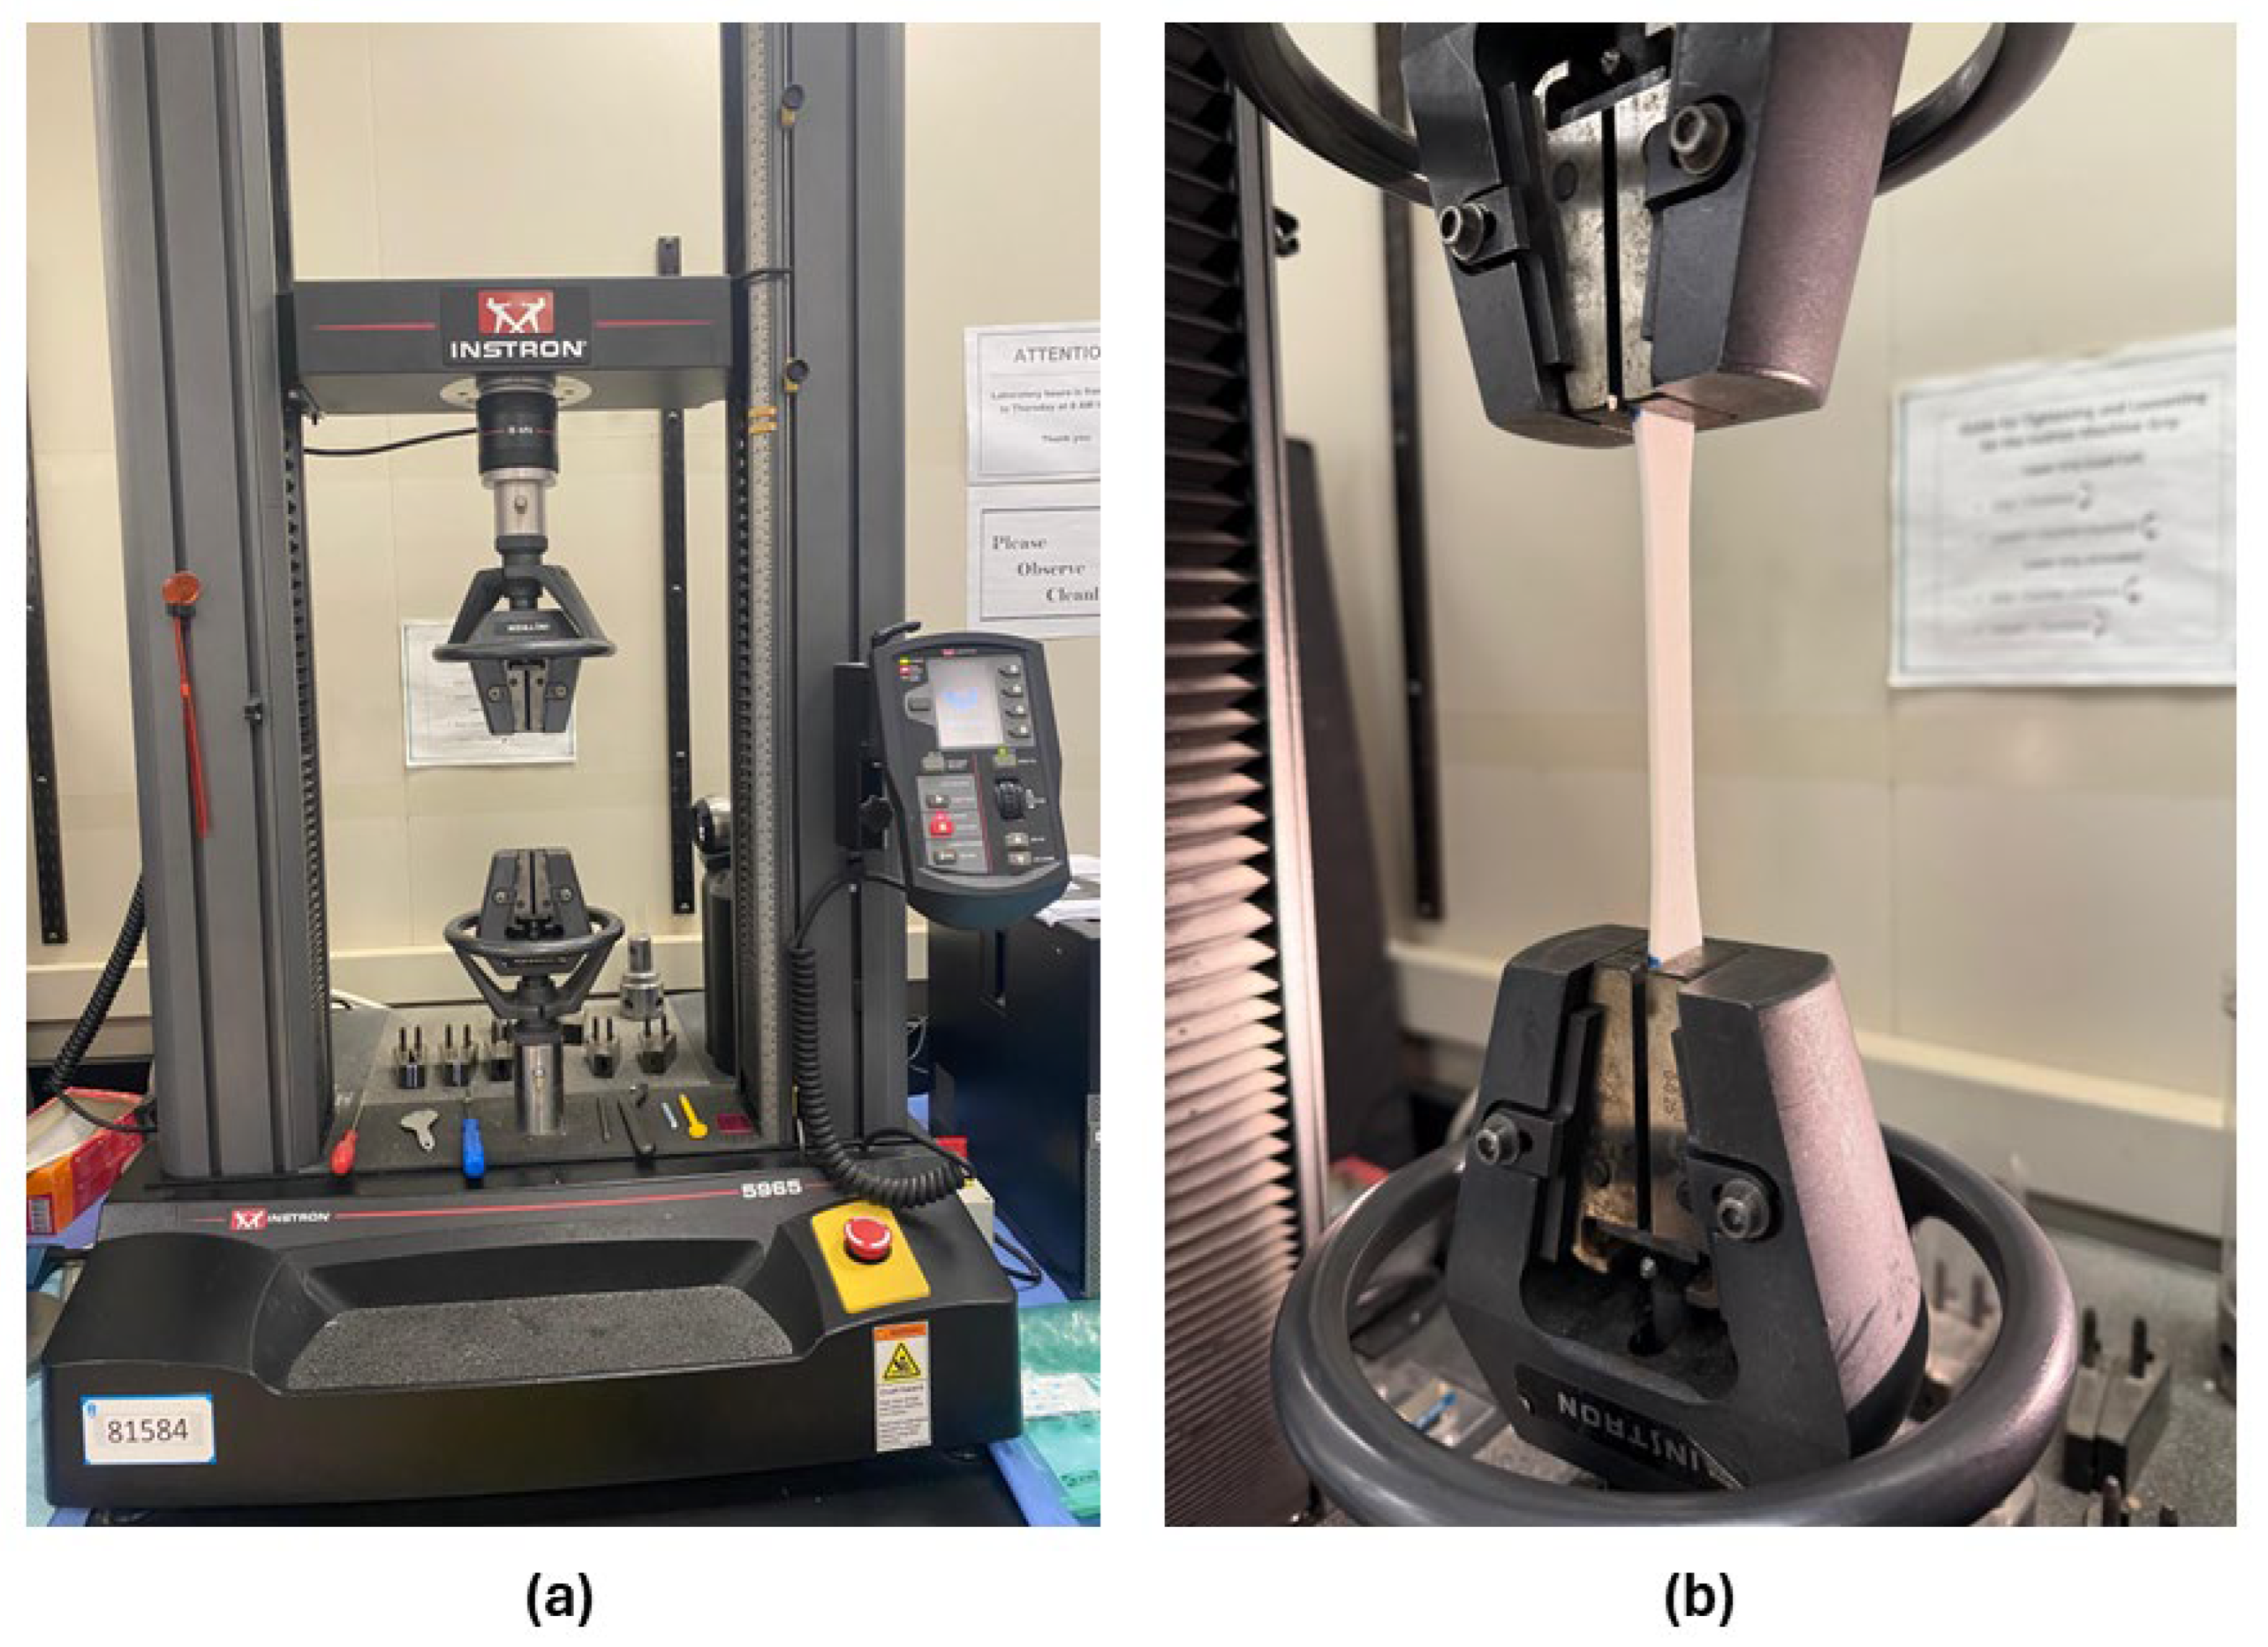
Figure 4.
(a) Three-point bending test tool head. (b) Bending sample during the test.
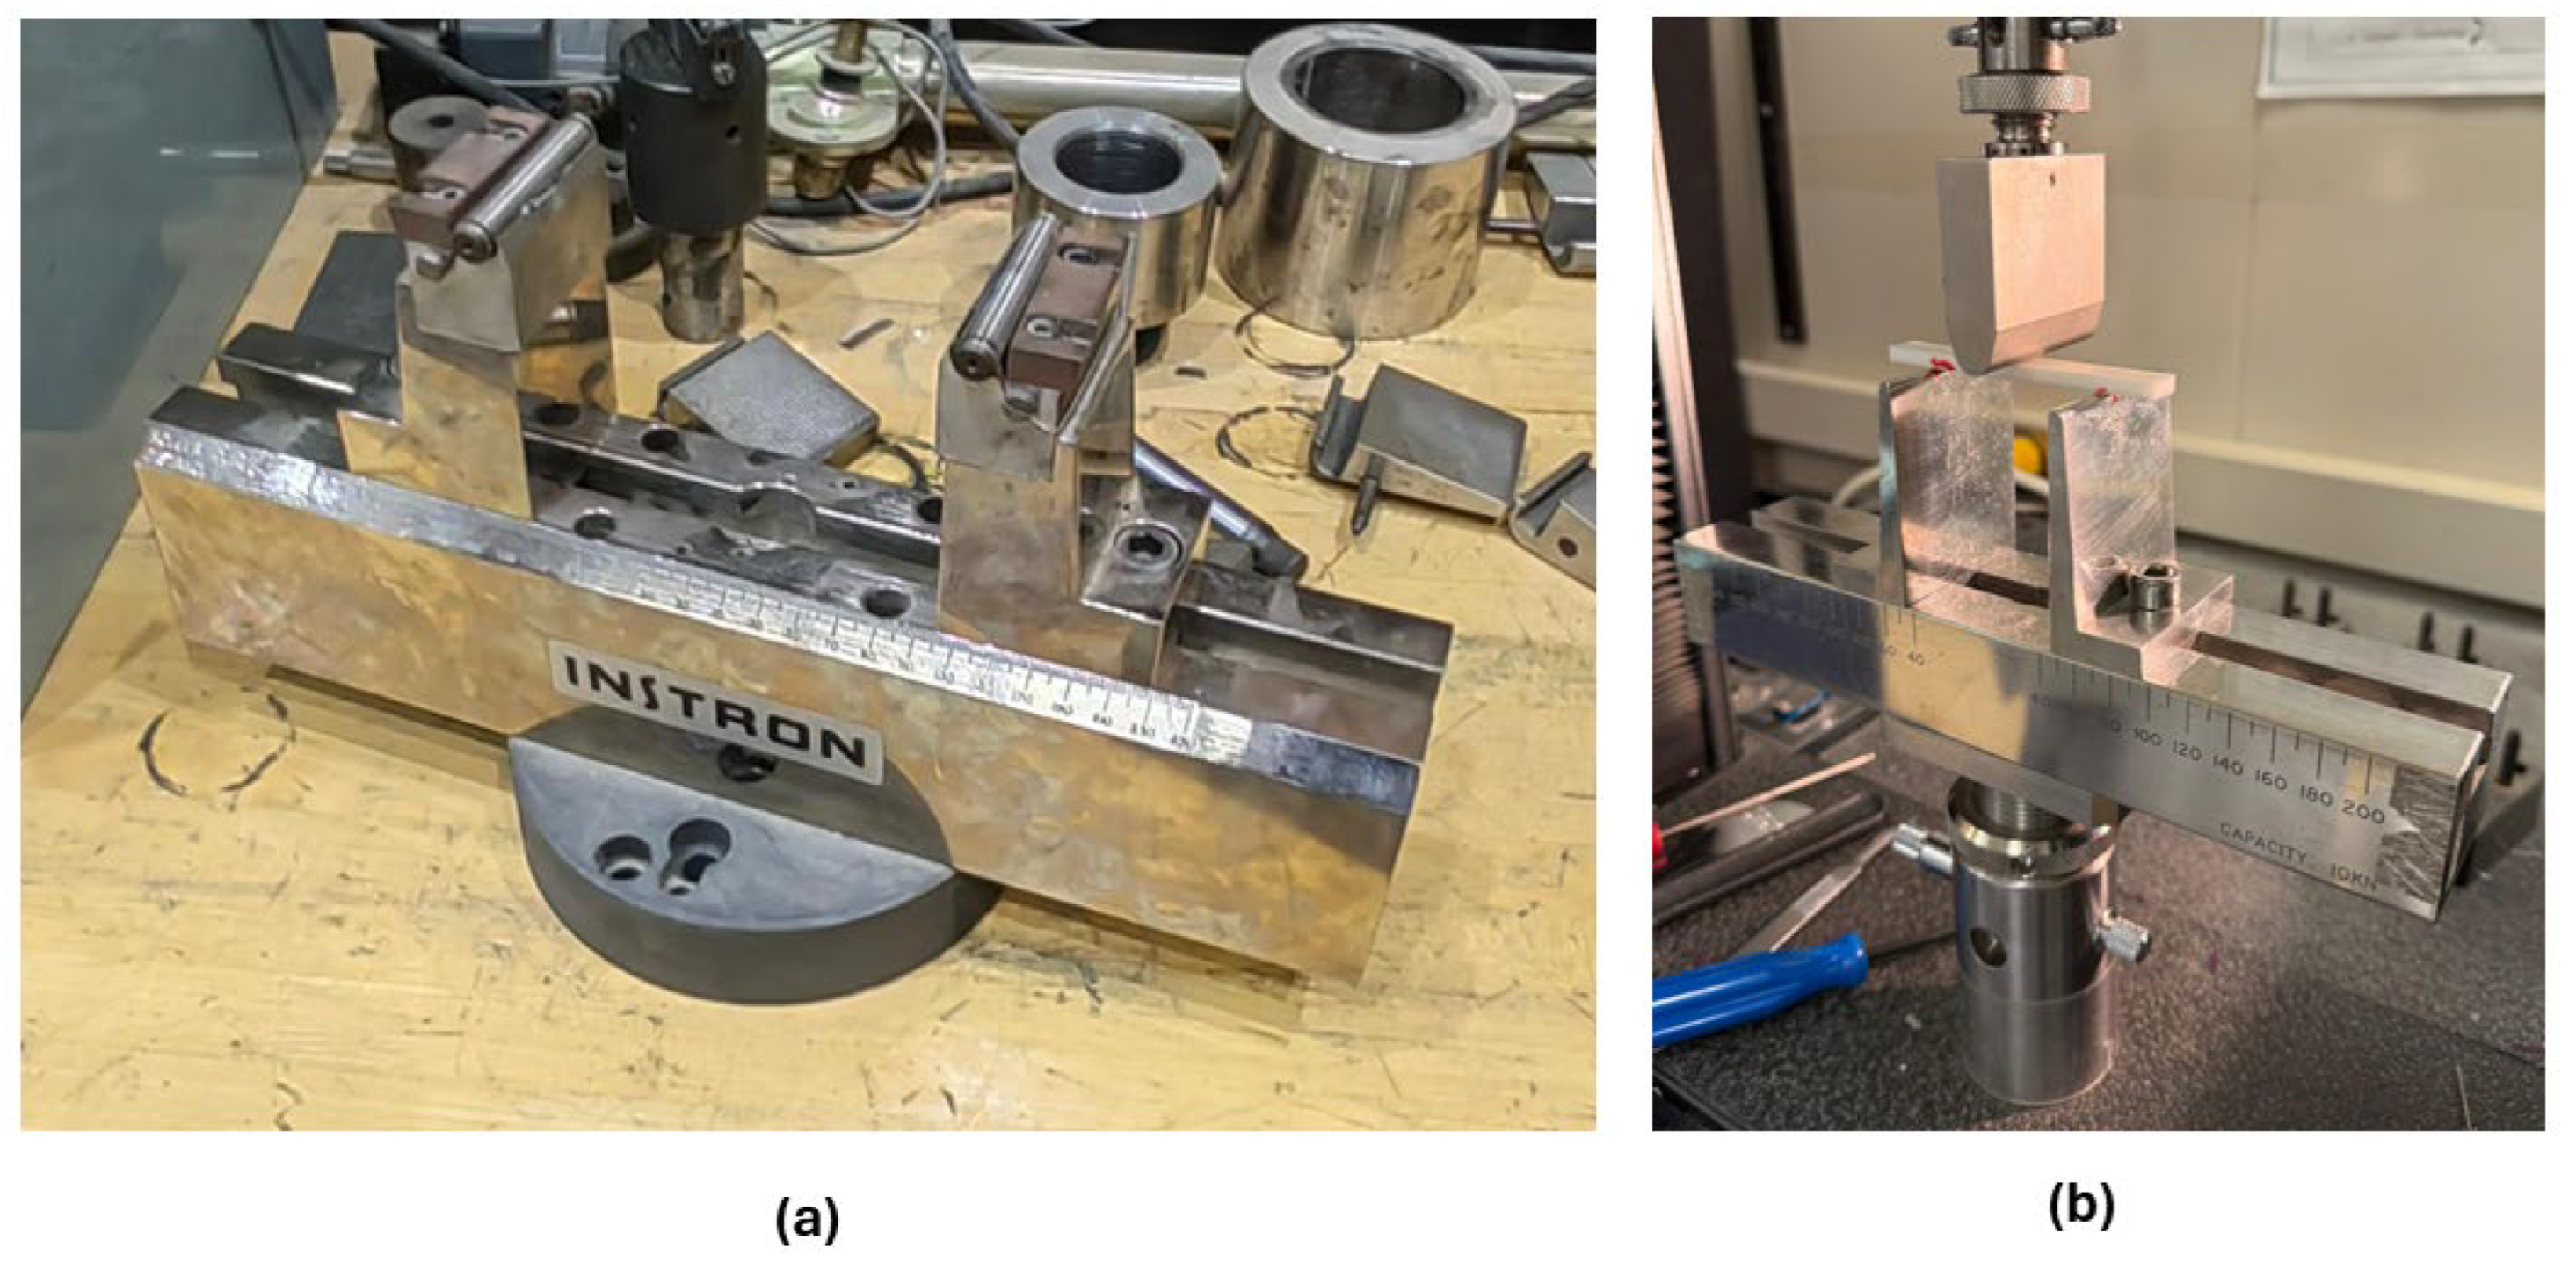
Figure 5.
Tensile samples after test.
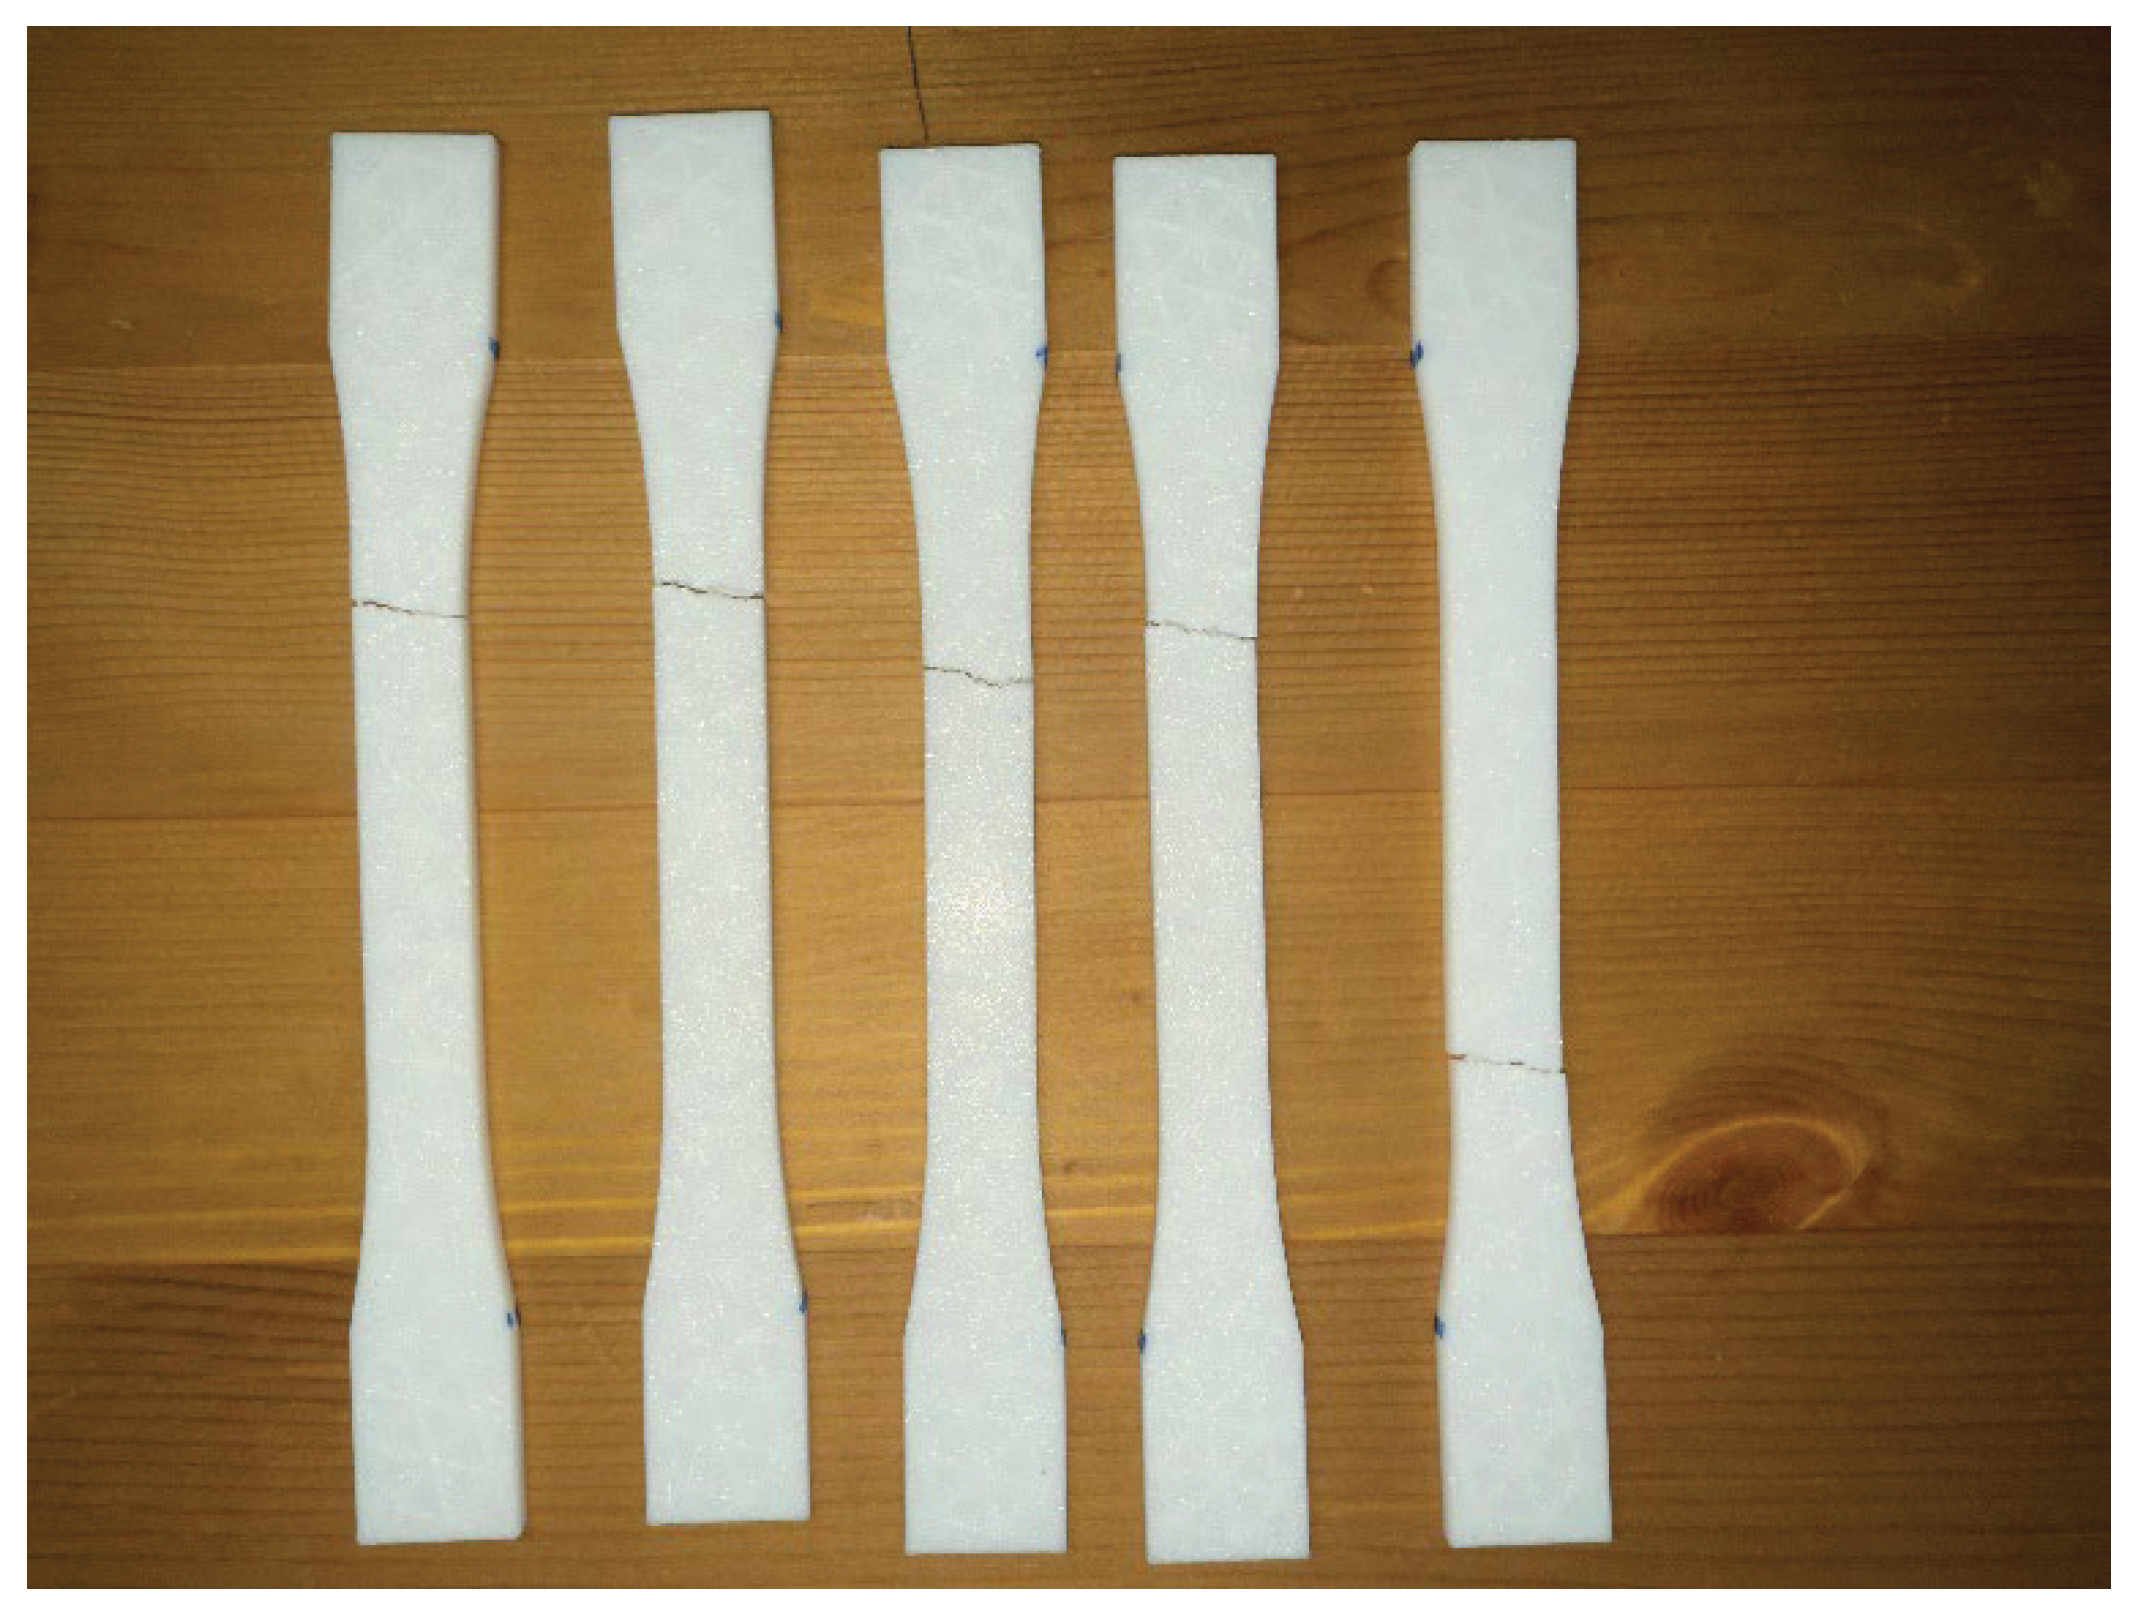
Figure 6.
(a) Tensile yield point versus infill density. (b) Maximum tensile stress versus infill density. (c) Tensile fracture point versus infill density. (d) Tensile Young’s modulus versus infill density.
Figure 6.
(a) Tensile yield point versus infill density. (b) Maximum tensile stress versus infill density. (c) Tensile fracture point versus infill density. (d) Tensile Young’s modulus versus infill density.
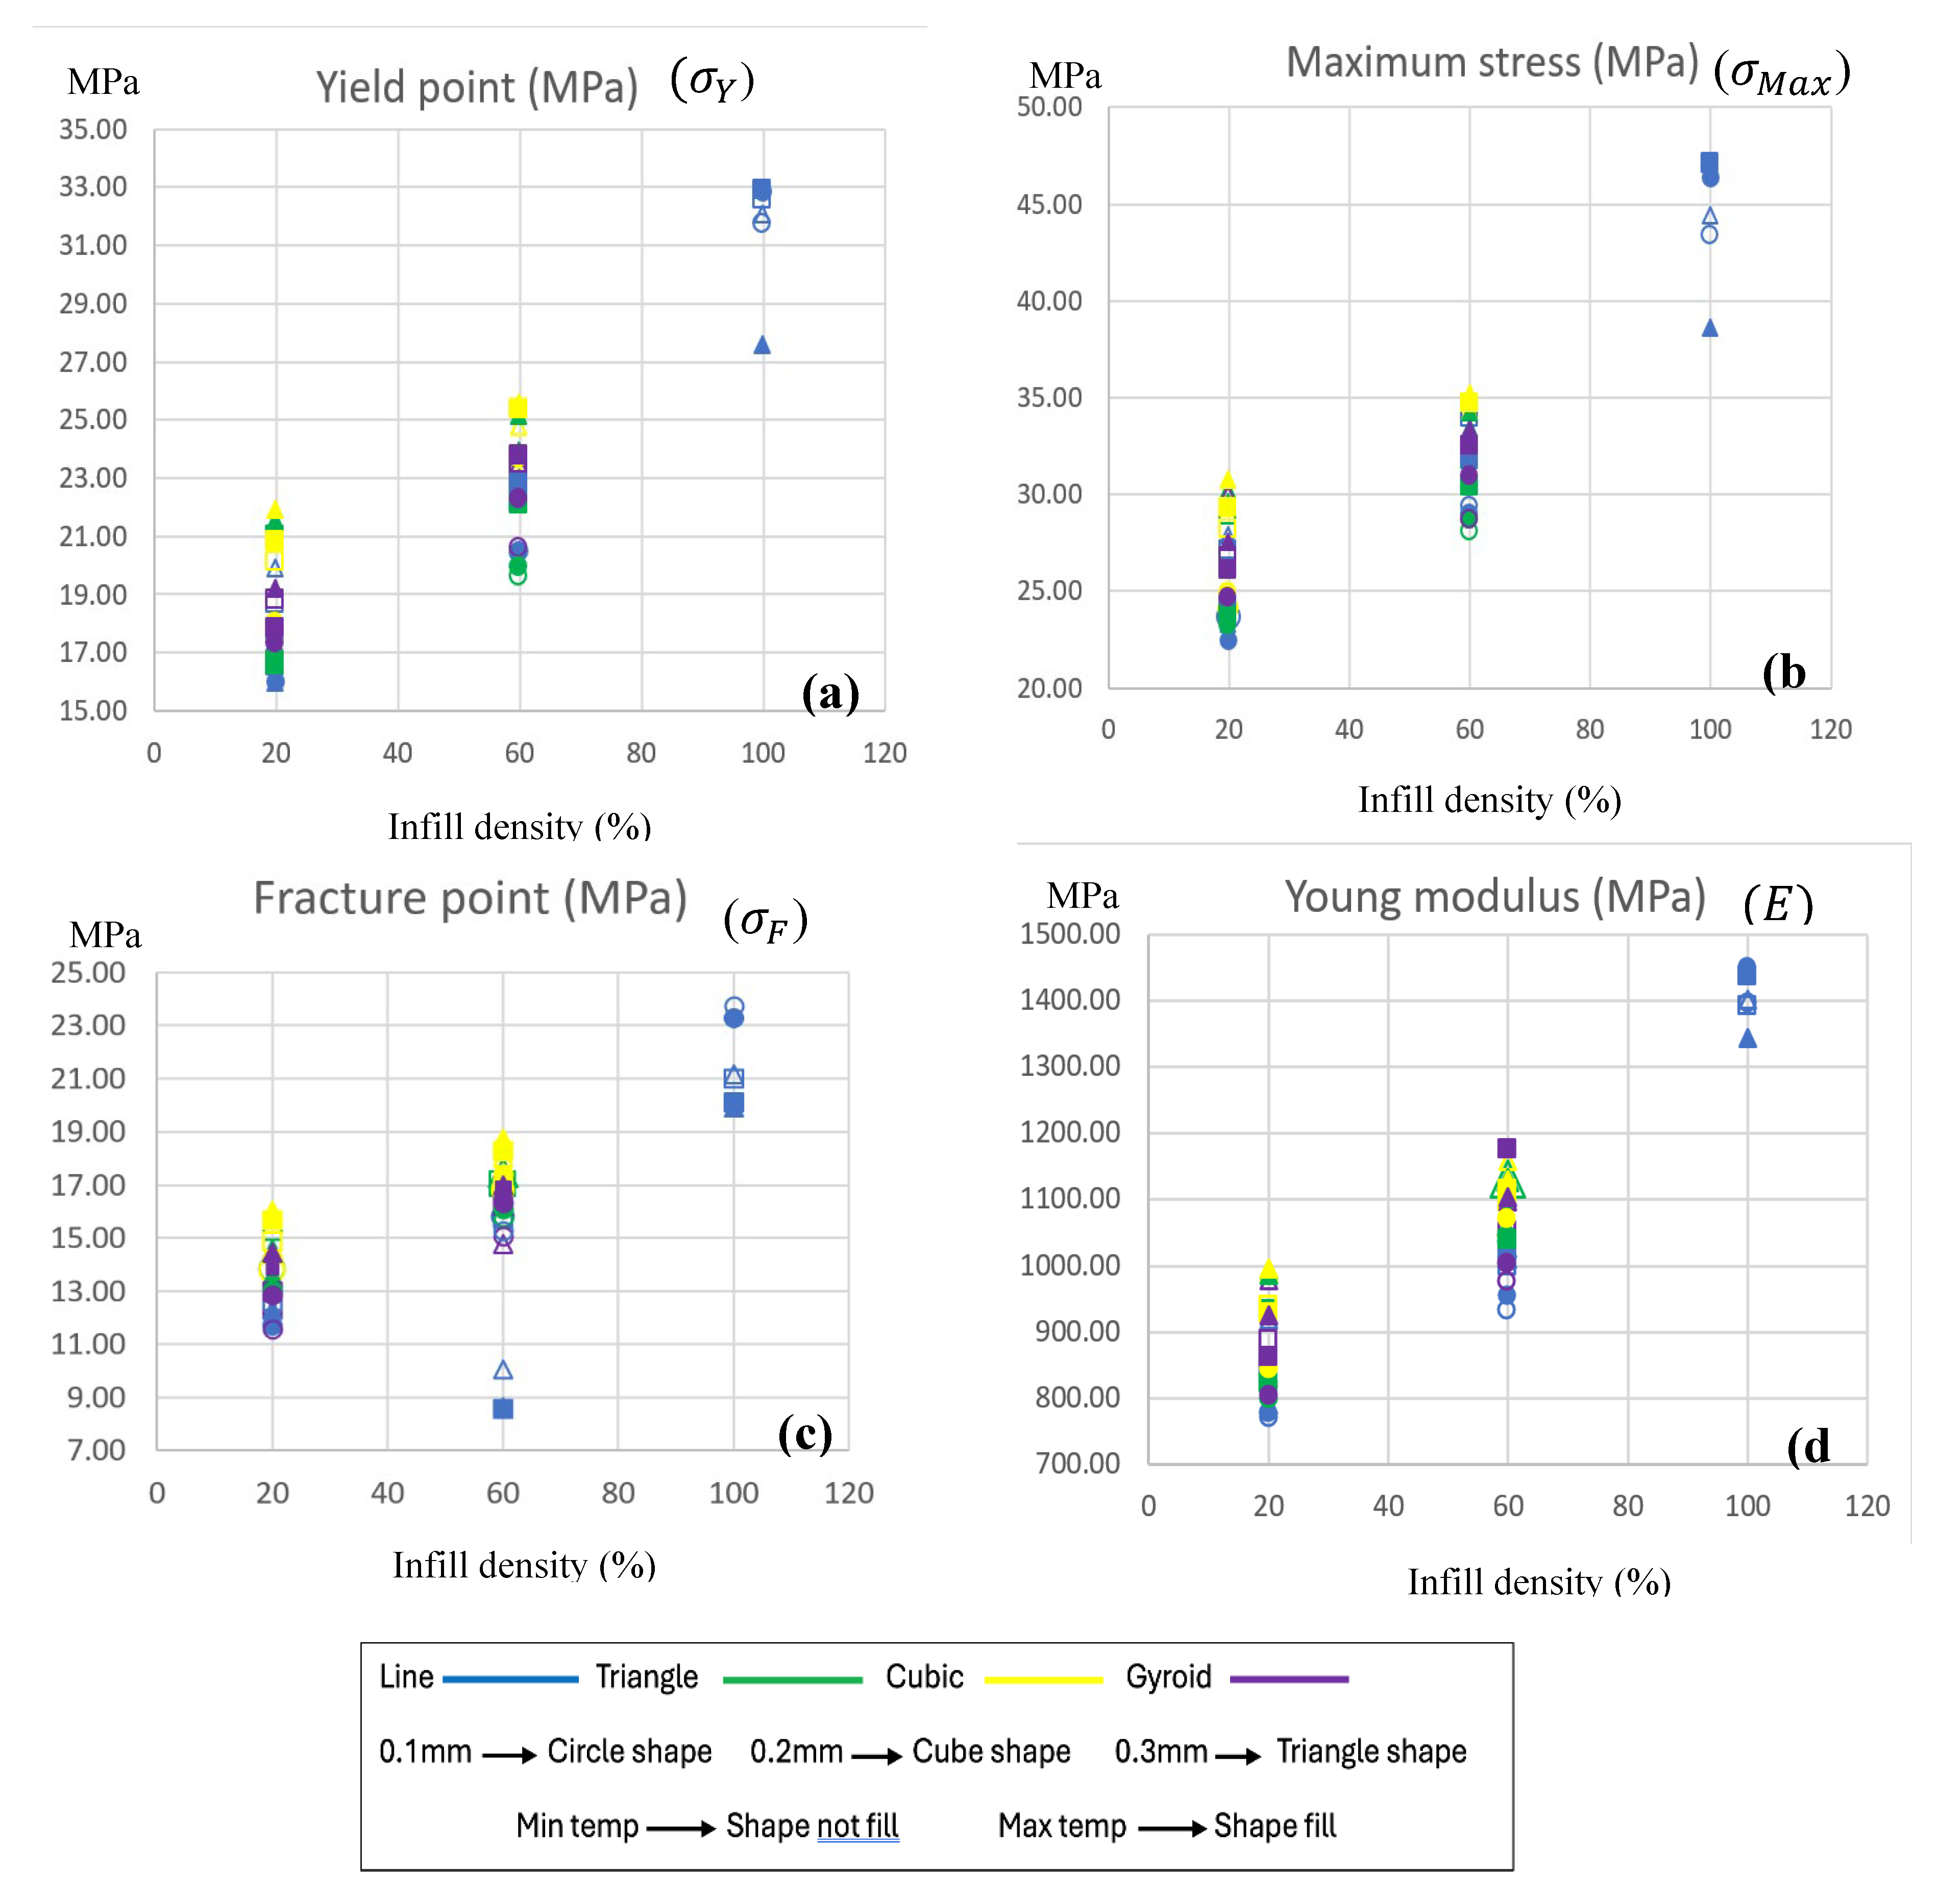
Figure 7.
Bending samples after the test.
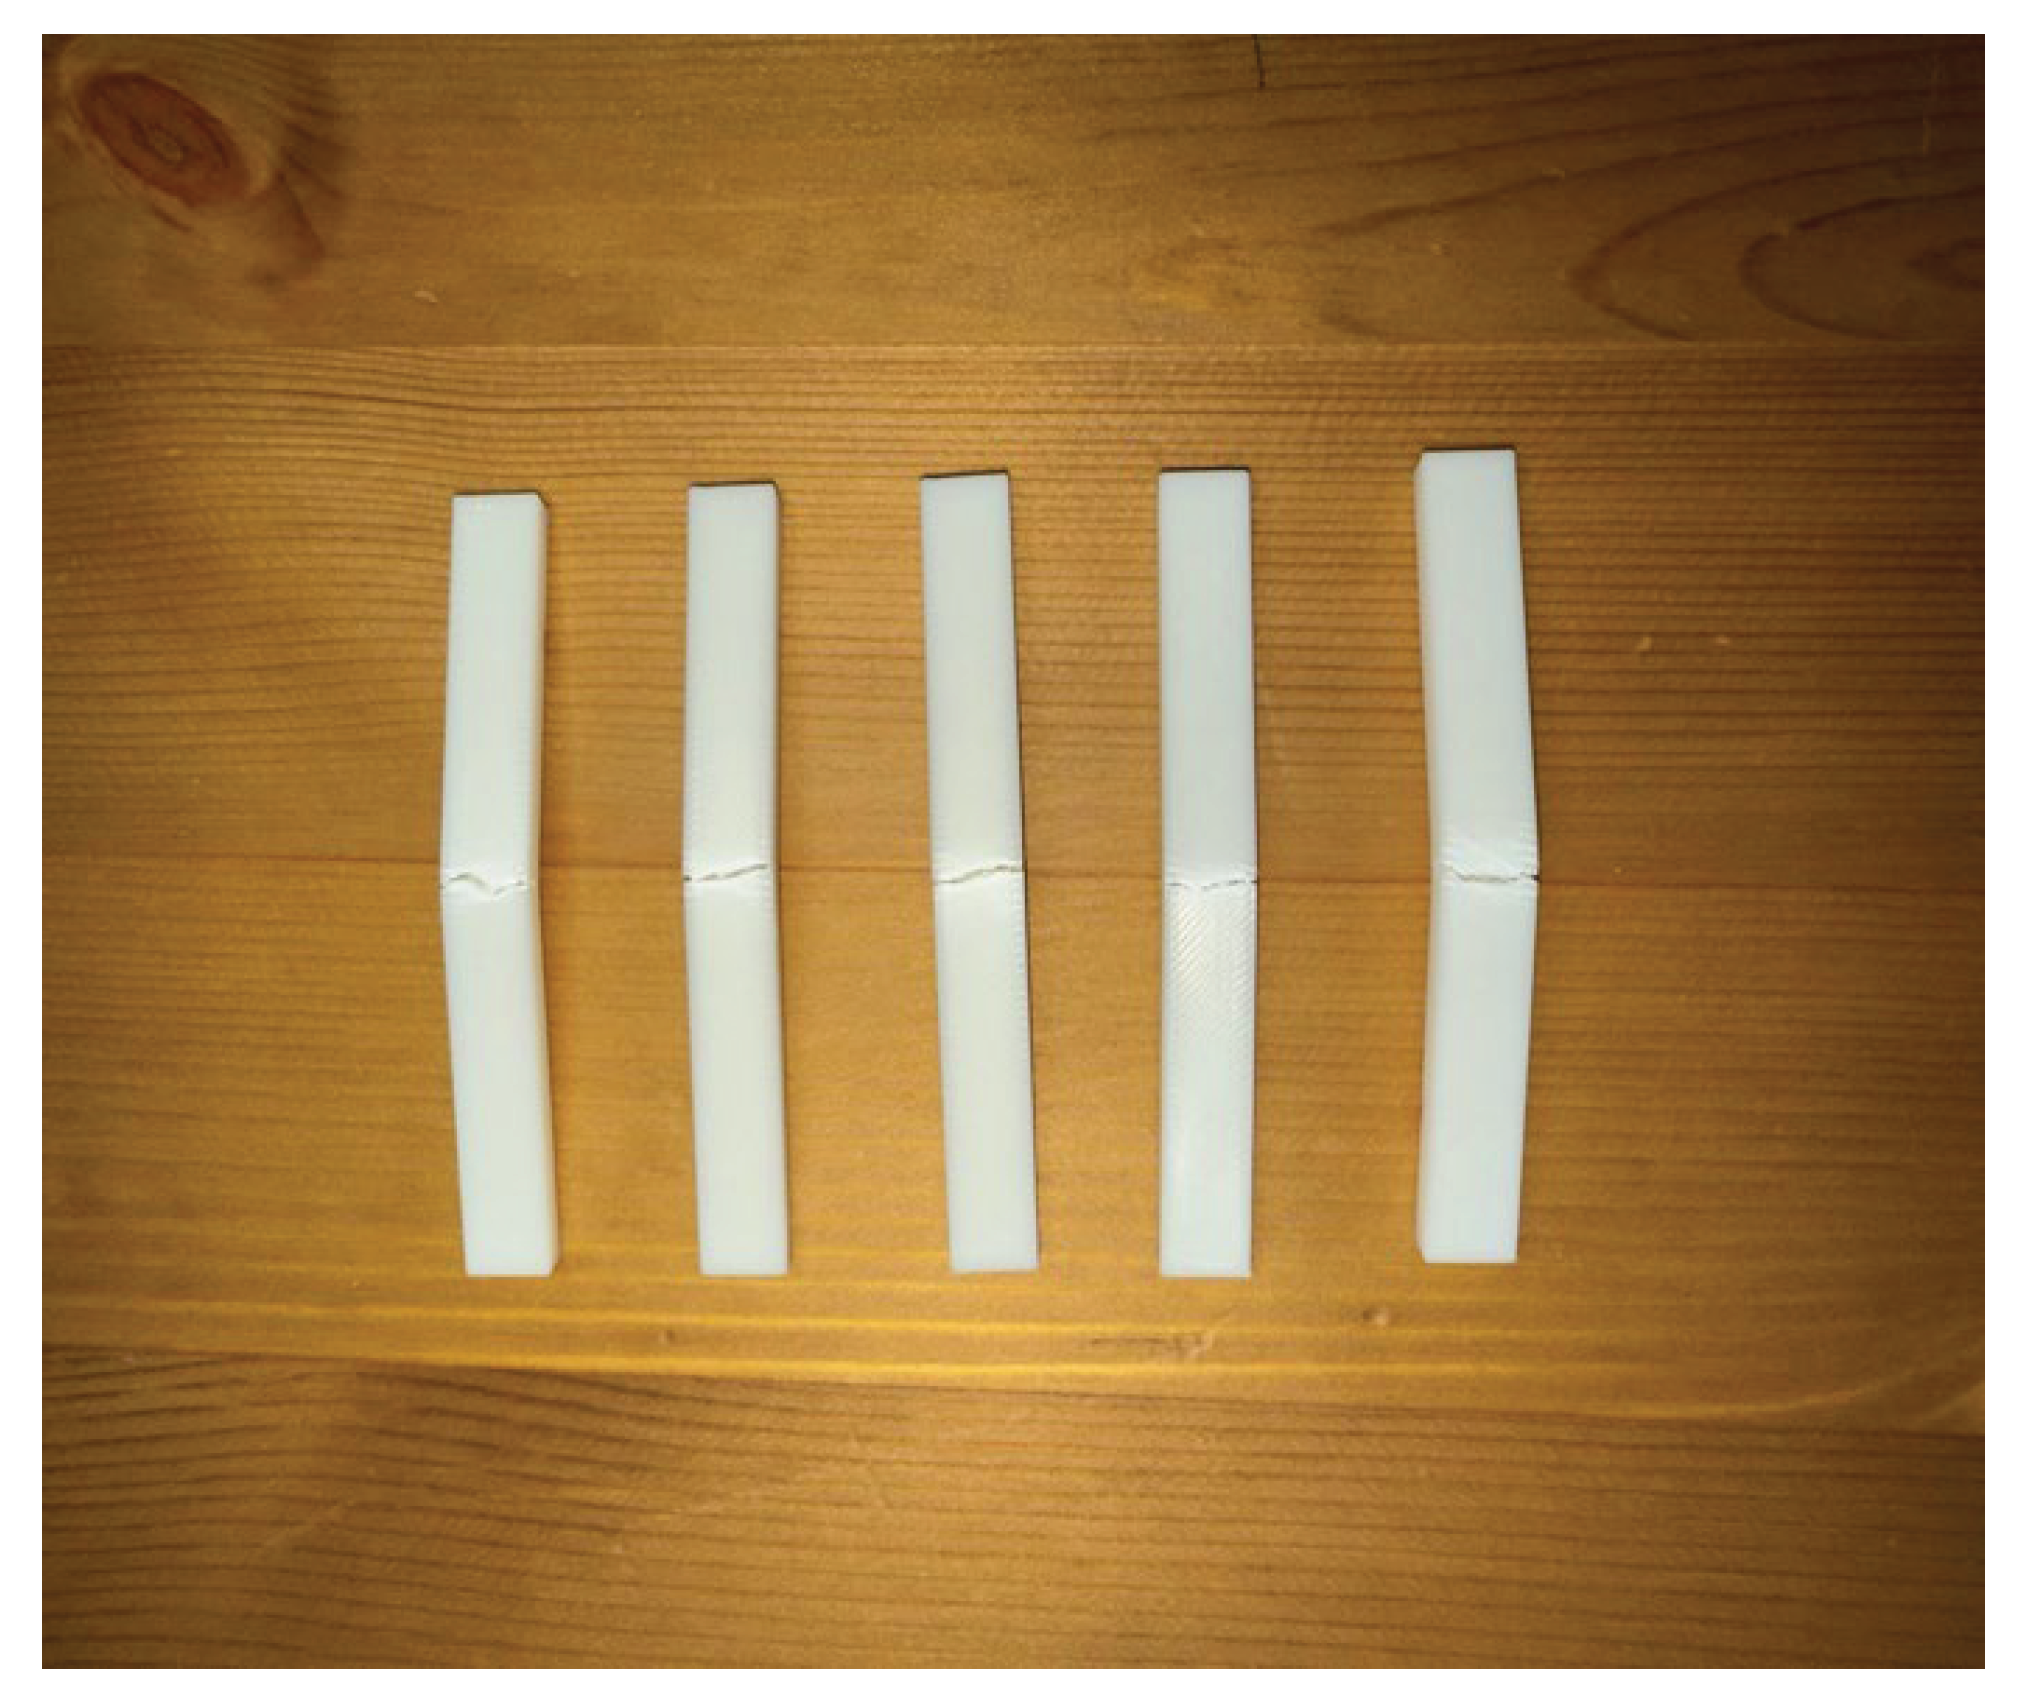
Figure 8.
(a) Maximum bending strain versus infill density. (b) Bending modulus of elasticity versus infill density. (c) Maximum bending stress versus infill density.
Figure 8.
(a) Maximum bending strain versus infill density. (b) Bending modulus of elasticity versus infill density. (c) Maximum bending stress versus infill density.
Disclaimer/Publisher’s Note: The statements, opinions and data contained in all publications are solely those of the individual author(s) and contributor(s) and not of MDPI and/or the editor(s). MDPI and/or the editor(s) disclaim responsibility for any injury to people or property resulting from any ideas, methods, instructions or products referred to in the content. |
© 2025 by the authors. Licensee MDPI, Basel, Switzerland. This article is an open access article distributed under the terms and conditions of the Creative Commons Attribution (CC BY) license (http://creativecommons.org/licenses/by/4.0/).
Copyright: This open access article is published under a Creative Commons CC BY 4.0 license, which permit the free download, distribution, and reuse, provided that the author and preprint are cited in any reuse.


