Submitted:
11 December 2025
Posted:
12 December 2025
You are already at the latest version
Abstract
Replication stress (RS) is a primary driver of genomic instability in cancer, yet the contribution of transcription-coupled repair to this process remains poorly understood. Here, we investigate how the TC-NER factor ERCC6 (CSB) shapes mutational landscapes under RS. We demonstrate that ERCC6 deficiency impairs replication restart and biases early damage signaling toward a 53BP1-mediated response, ultimately leading to senescence. Conversely, ERCC6-proficient cells prioritize survival and proliferative recovery but at the cost of distinct genomic alterations. Whole-exome sequencing reveals that ERCC6 drives the retention of stress-induced mutations specifically within coding regions of transcriptionally active loci, whereas ERCC6-deficient cells accumulate variants primarily in intergenic regions. These findings uncover a survival-mutagenesis trade-off: ERCC6 safeguards transcriptional continuity during replication stress but promotes mutational burdens in functional genomes. This mechanism parallels bacterial adaptive mutagenesis, identifying ERCC6 as a context-dependent driver of somatic evolution and tumor heterogeneity.
Keywords:
ERCC6 (CSB)
; transcription-coupled nucleotide excision repair (TC-NER)
; replication stress
; genomic instability
; mutagenesis
1. Introduction
Replication stress (RS) is a critical source of genomic instability in cancer, driving the accumulation of mutations and chromosomal rearrangements that promote tumor progression [1]. RS arises when replication forks encounter obstacles caused by DNA lesions, insufficient replication factors, oncogene activation, or conflicts with the transcription machinery [2,3,4,5,6,7]. Transcription–replication conflicts (TRCs) can generate R-loops [8]. These are three-stranded structures formed by an RNA:DNA hybrid and a displaced single-stranded DNA strand. These structures can stall replication forks and become sources of DNA damage if not properly resolved [9,10].
R-loops can be processed through the transcription-coupled nucleotide excision repair (TC-NER) pathway. TC-NER factors, including ERCC6, operate in cellular environments where R-loop–associated damage frequently coexists with strand breaks, linking transcription-coupled repair with genome instability under RS [11,12,13]. At DNA double-strand breaks (DSBs), ERCC6 has been shown to influence pathway choice by favoring homologous recombination (HR) through ATM- and CDK2-dependent displacement of RIF1 and 53BP1 [13,14]. ERCC6 also contributes to the resolution of transcription-blocking DNA–protein crosslinks [15,16,17], facilitates repair of oxidative DNA lesions within transcribed chromatin [18,19,20,21,22], and cooperates with PARP1 and PARP2 in single-strand break repair [23,24,25]. Notably, the repair functions of ERCC6 are not uniformly protective across all cellular contexts. However, under RS induced by camptothecin or hydroxyurea (HU), ERCC6 has been implicated to influence repair pathway choice and potentially shift the balance toward more error-prone mechanisms, including non-homologous end joining (NHEJ), alternative end joining (Alt-EJ), and break-induced replication (BIR) [13,14,26,27,28,29].
However, whether ERCC6 exerts a comparable pro-mutagenic role in human cells under RS, and which transcriptional changes accompany this process, remains unclear. Work in bacterial systems provides conceptual support for a link between transcription-coupled repair and adaptive mutagenesis. In bacteria, the ERCC6 functional homolog Mfd promotes stress-induced mutagenesis, both under non-growing or antibiotic stress conditions and at replication–transcription conflicts via an error-prone NER pathway and R-loop formation [30,31,32,33,34,35].
Additionally, evidence from mammalian systems indicates that TC-NER is not simply a faster repair pathway, but plays a non-redundant role in the removal of specific types of transcription-blocking DNA lesions, including certain oxidatively induced lesions that GG-NER poorly handles [36,37,38]. As a consequence, damage processing is unlikely to be uniformly distributed across the genome but instead concentrated within transcriptionally active loci.
The genomic distribution of somatic mutations is functionally relevant, as alterations affecting coding regions in oncogenes and tumour suppressor genes give rise to driver events that confer selective growth advantages, ultimately shaping clonal architecture and tumour evolution [39,40]. Moreover, several anticancer therapies induce RS as part of their mechanism of action [41,42,43]. In line with this, CRISPR-based screening in patient-derived organoids has identified ERCC6 as a determinant of cisplatin resistance in osteosarcoma [44]. Understanding how ERCC6 affects both survival and mutation patterns under RS therefore, has direct implications for therapeutic response.
We hypothesized that under RS, ERCC6-mediated repair may shift from a protective role to one that influences mutation patterns, particularly within transcriptionally active regions. To test this, we used human fibroblasts with or without functional ERCC6 and exposed them to HU to induce RS. We then evaluated DNA damage signaling, transcriptional remodeling, and mutational burden through immunofluorescence imaging, RNA sequencing, and whole-exome sequencing.
Our findings suggest that while ERCC6 supports transcription-associated repair under RS, its activity coincides with the retention of stress-associated mutations in coding regions, identifying ERCC6 as a context-dependent driver of genomic instability.
2. Materials and Methods
2.1. Cell Lines and Induction of Replication Stress
Human fibroblasts GM00637 (ERCC6_WT) and GM16095 (ERCC6_K337X) were obtained from the Coriell Cell Repository (www.coriell.org). Cells were cultured according to the manufacturer’s instructions in DMEM/F12 (Hyclone) supplemented with 15% non–heat-inactivated FBS (Gibco) and 50 U/mL penicillin-streptomycin (Gibco). RS was induced by treating cells with 2 mM HU (Sigma-Aldrich) for 1, 4, or 24 hours in complete medium. Recovery was performed by washing twice with supplemented medium followed by incubation in complete medium for the desired recovery time. All cells were maintained at 37 °C and 5% CO2 and collected at 70–80% confluence.
2.2. DNA Damage Induction with Illudin S
Following subculture at ~50% confluence, cells were exposed to increasing concentrations of Illudin S (Santa Cruz) for 72 hours (0.67, 1.67, 2.67, and 4 ng/mL) in complete DMEM/F12 medium. Cell viability was assessed using the MTS assay.
2.3. Cell Viability MTS Assay
Culture medium was removed, and 120 µL of a supplemented medium solution containing MTS and PMS reagents was added to each well. Plates were gently mixed and incubated at 37 °C for 3 hours. Absorbance was measured at 490 nm using a Cytation 3 plate reader (BioTek).
2.4. DNA Damage and Replication Stress Markers
Conventional immunofluorescence (IF) was performed by growing cells on coverslips (Marienfeld Superior™), fixing in 3.7% formalin (Sigma) in PBS for 10 min at room temperature (RT), and permeabilizing with 0.5% Triton X-100 in PBS for 10 min. Blocking was performed in 3% BSA / 0.05% Triton X-100 in PBS for 1 h at RT. Primary antibodies (Table S1) were incubated overnight at 4 °C, followed by secondary antibodies for 1 h at RT. DNA was stained with Hoechst (1 µg/mL, Invitrogen) for 5 min at RT, and slides were mounted with ProLong™ (Invitrogen). Images were acquired using an OLYMPUS BX53 microscope with Q-Capture Pro 7. Quantification of foci number and nuclear fluorescence intensity was performed from raw, non-processed images using ImageJ with consistent thresholding and analysis parameters across all conditions.
2.5. BrdU IF Assay
After completion of HU treatment, control and HU-treated cells were washed and subsequently pulsed with BrdU (20 µM) for 3 h before being fixed with 3.7% formalin in PBS. DNA hydrolysis was performed with 2 M HCl (PBS 1×, 0.1% Tween-20) for 15 min at 37 °C, followed by neutralization with 0.1 M borate buffer (pH 8.5). IF was then performed as above using blocking buffer (3% BSA, 0.01% Tween-20 in PBS).
2.6. Cell Viability and Apoptosis
Cell viability and apoptosis after HU treatment were assessed using CellTiter-Blue® and Apo-ONE® Caspase-3/7 Assay kits (Promega) following the manufacturer’s instructions. Fluorescence was recorded using a Cytation 3 plate reader (BioTek).
2.7. Propidium Iodide-Based Flow Cytometric Analysis of Cell-Cycle Phase and Sub G1 Population
Cells were harvested, washed with PBS, and fixed by gradual addition of cold 70% ethanol at −20 °C. Fixed cells were washed in cold PBS, treated with RNase A (10 µg/mL), and stained with propidium iodide (50 µg/mL) in a citrate/NP-40 staining solution to label total DNA content. Samples were kept protected from light and analyzed by FACS-Canto A Flow Cytometer.
2.8. Senescence-Associated β-Galactosidase (SA-β-Gal) Staining
SA-β-Gal activity was assessed by cytochemical staining at pH 6.0 as a marker of senescence [45]. Cells were fixed with 3.7% formalin for 5 min at room temperature, washed with PBS, and incubated overnight at 37 °C (without CO2) in a staining solution containing X-gal (1 mg/mL), citrate-phosphate buffer (pH 6.0), potassium ferri/ferrocyanide, and magnesium chloride. After staining, cells were washed with PBS and visualized by bright-field microscopy. SA-β-Gal–positive cells were identified by the presence of blue staining and quantified by screening the entire well. Positive and negative controls were included to validate the specificity of the assay.
2.9. Proximity Ligation Assay (PLA)
Cells grown on coverslips were fixed and permeabilized, then blocked and incubated overnight with primary antibodies against PCNA (mouse) and RNA polymerase II (rabbit). Duolink™ PLUS and MINUS PLA probes (anti-mouse and anti-rabbit) were applied, followed by ligation and rolling-circle amplification using the Duolink™ In Situ Red kit (Merck). Fluorescent PLA signals (red dot) were visualized by confocal fluorescence microscopy (C2+Spectral Confocal Microscope), and nuclei were counterstained with DAPI. Images were acquired as Z-stacks of 5 optical sections at 0.5 μm step size.
2.10. Perfil Transcriptómico (RNA-seq)
Total RNA was isolated from ERCC6_WT and ERCC6_K337X cells treated with 2 mM HU for 4 h. Untreated controls and time-zero (T0) samples were processed in parallel. ≥100 ng RNA per sample was sent to Novogene Co., Ltd. for mRNA library preparation (poly-A enrichment) and sequencing on NovaSeq X Plus (PE150; ~12 Gb raw data per sample). An average of >92% clean reads and >11.19 Gb clean bases per sample were obtained, with Q30 values exceeding 96.2%, indicating high sequencing quality. Read alignment was performed using Hisat2 v2.0.5 and gene quantification using featureCounts v1.5.0-p3. Differential expression was analyzed using edgeR (3.22.5) with Benjamini–Hochberg correction (p adj ≤ 0.05 and |log 2FC| ≥ 1). Reactome analysis was performed with clusterProfiler with corrected p value. GRCh38 was used as reference. Variant calling was conducted with GATK RNA-seq pipeline. Initial data processing (including quality control, alignment, quantification, and variant calling) was performed by Novogene, and downstream analyses were conducted by the authors.
2.11. Whole-Exome Sequencing (WES)
Genomic DNA was isolated from ERCC6_WT and ERCC6_K337X cells treated with 2 mM HU for 4 h, as well as from cells treated with 2 mM HU for 4 h followed by a 72 h recovery period in HU-free medium. Untreated controls and time-zero (T0) samples were processed in parallel. 1 µg per sample was sent to Novogene Co., Ltd. for exome library preparation (Agilent V6) and sequencing on NovaSeq X Plus (PE150; ~12 Gb raw data per sample). WES yielded high-quality data with >93.5% clean reads and >94.2% effective reads, and Q30 values exceeding 95.19%. Target enrichment efficiency resulted in an on-target rate of >68.4%, with an average on-target depth of >134.6×. Exome coverage exceeded 99.4% of target regions, with approximately 95% of bases covered at ≥20×, ~80% at ≥50×, and over 50% at ≥100×, enabling high-confidence variant detection, including low-frequency variants. This sequencing depth supports above 5–10% allele frequency, depending on local coverage. Reads were aligned using BWA to GRCh38, and BAM processing and duplicate marking were performed with Picard. Variant calling for SNVs and INDELs was performed using GATK Mutect2 v4.6.2.0 under sensitive detection settings. VCF files were normalized and filtered using bcftools v1.21, retaining variants supported by a minimum of five reads. Variant annotation was performed with ANNOVAR using the refGene database.
2.12. Statistical Analysis
Statistical tests are indicated in figure legends. Unless otherwise noted, experiments were performed in biological triplicate. Transcriptomic and whole-exome sequencing analyses were conducted using one biological sample per condition, as detailed in the figure legends. Distribution normality and homoscedasticity were assessed prior to parametric testing. A p value < 0.05 was considered significant. Analyses were performed using GraphPad Prism 8.0 and RStudio
All reagent details are provided in Table S1 in Supplementary File.
2.13. Declaration of Generative AI and AI-Assisted Technologies in the Writing Process
While preparing this work the author(s) used Grammarly and ChatGPT (Open AI) to improve the readability and language of the manuscript. After using this tool/service, the authors reviewed and edited the content as needed and take full responsibility for the content of the published article.
3. Results
3.1. Hydroxyurea-Induced Replication Stress in a TC-NER–Deficient Model
ERCC6_K337X cells showed functional loss of TC-NER, as demonstrated by their hypersensitivity to Illudin S, a DNA-damaging agent specifically repaired through this pathway (Figure S1). This confirms that the ERCC6_K337X line is a valid model for studying TC-NER deficiency.
Basal levels of replication protein A (RPA) were comparable between ERCC6_WT and ERCC6_K337X cells (Figure S2), indicating similar steady-state fork dynamics. Moreover, phosphorylation of RPA at serine 32 (pRPA) increased upon treatment with 2 mM HU for 1, 4, and 24 hours in both genotypes (Figure 1a,b), confirming that HU induces RS to a similar extent in WT and ERCC6-deficient cells.
3.2. ERCC6 Deficiency Compromises Transcription–Replication Conflict (TRC) Resolution and Promotes Early NHEJ Activation Under Replication Stress
ERCC6_WT cells showed a progressive increase in γH2AX levels, following short (1 and 4 hours) and long (24 hours) exposure to HU, with the strongest signal observed after 24 hours of treatment (Figure 1a,c), consistent with a fork collapse, DSBs generation, and active repair. In contrast, ERCC6_K337X cells did not display a significant increase in γH2AX signal after short-term HU exposure, with a significant increase observed only after 24 hours.
To evaluate if there these differences observed after short-term exposure were due to differences in the resolution of the TRCs, RNAPII–PCNA interactions were detected by proximity-ligation assay (PLA), as a proxy for identifying TRCs upon HU treatment (Figure S3). No significant differences in the number of PLA foci per nucleus were observed between control and HU-treated WT and mutant cells under any condition. Nevertheless, ERCC6K337X cells exposed to 2 mM HU during 4h exhibited a significant increase in the median volume of nuclear PLA foci relative to both control and WT cells, consistent with a reduced TRCs resolution capacity in ERCC6-deficient cells.
Thus, we evaluate if the lack of increase in γH2AX foci after short-term HU-exposure was due to DSB repair. After 24 hours of HU exposure, both ERCC6_WT and K337X cells showed elevated 53BP1 levels. However, short HU exposure (1–4 h) resulted in a marked 53BP1 recruitment in ERCC6_K337X cells, whereas ERCC6_WT cells showed a slight reduction compared to control (Figure 1a,d). Reactome pathway enrichment analysis of genes differentially expressed (DEGs) in HU-treated WT and mutant cells further supported these findings, showing an over-representation of pathways associated with NHEJ only in ERCC6_K337X cells after 4 hours of HU treatment (Figure 1e).
Together, these results suggest that ERCC6 deficiency limits the resolution of TRCs and shifts the damage response toward early NHEJ-mediated repair with short-time RS.
3.3. ERCC6 Deficiency Impairs Replication Dynamics and Promotes Senescence Under Replication Stress
DNA synthesis following RS was assessed in cells exposed to a 3-hour BrdU pulse immediately after HU washout (RS release). BrdU incorporation assays revealed distinct DNA synthesis dynamics between ERCC6_WT and ERCC6_K337X cells after release from HU-induced RS. In ERCC6_WT cells, the proportion of BrdU-positive nuclei increased gradually after prolonged exposure to HU, being significantly higher than control only in cells released after 24h HU treatment (Figure 2a,b). In contrast, ERCC6_K337X cells exhibited a significant increase in BrdU incorporation in cells released after short (1h and 4h) and long (24 h) HU treatment, consistent with a G1/S accumulation and rapid resumption of DNA synthesis in the absence of ERCC6. Cell-cycle profiling supported this interpretation (Figure 2c,d). HU did not induce major changes in the cell cycle distribution of ERCC6_WT cells after short HU-treatment. An increase in S-phase cells can be evidenced only after 24h of treatment. On the other hand, ERCC6_K337X cells showed a significant enrichment of G1-cells after 4 and 24h of treatment, consistent with replication fork collapse followed by cell-cycle arrest.
This difference in replication recovery was reflected in cell fate outcomes. Prolonged HU treatment (24 h) induced an approximately 30% decrease in viability in both genotypes relative to untreated controls (Figure 2e), which further declined to less than 20% after 72 h of recovery. On the other hand, a significant decrease in viability after 72h recovery from short-term HU exposure (4 h), was observed only in ERCC6-deficient cells (Figure 2e). Consistent with this pattern, increased apoptotic cell death was observed only after prolonged HU exposure and primarily in ERCC6-deficient cells (Figure 2f,g), whereas short-term HU treatment did not result in a significant apoptotic response. The decrease in viability in cells that survive the 4h HU exposure is accompanied by an increase in senescent cells (Figure 2h, i). ERCC6_WT cells displayed a transient increase in SA-β-Gal activity at 72 hours post-recovery, which declined by 120 hours, consistent with temporary growth arrest followed by proliferative recovery. In contrast, ERCC6_K337X cells exhibited a progressive and persistent increase in senescent cells, indicating stable growth arrest as a terminal outcome of unresolved RS. Together, these findings indicate that ERCC6 supports efficient replication restart and limits long-term growth arrest under RS. In its absence, cells experience delayed replication completion, replication fork collapse, and would fail to recover proliferative capacity, resulting in apoptosis or persistent senescence.
3.4. Divergent Transcriptional Programs Emerge Under Replication Stress Depending on ERCC6 Status
To further understand the differences in cell fate in ERCC6 null cells exposed during 4h to HU, we analysed the HU-induced differential transcriptional program in WT and deficient cells. Hierarchical clustering revealed clear transcriptional separation between ERCC6_WT and ERCC6_K337X cells under control and HU-induced RS conditions (Figure 3a). The two genotypes showed substantial differences in the total number of expressed genes; ERCC6_K337X cells displayed a broader transcriptional response to HU (2039 vs. 1247 DEG), with a predominance of upregulated genes (1128 vs. 496, in mutant and WT cells, respectively) (Figure S4). This indicates a distinct transcriptional program activation depending on ERCC6 status.
Among DEGs, there are genes previously linked to oncogenic pathways and DNA repair. Some of them are labeled in Figure 3b and Figure 3c. For instance, ERCC6_WT cells activated adaptive pro-survival genes, including WNT7B↑, MAP4K1↑, BMP2↑, MKI67↓, PTPN6↓, PTPRZ1↓ while suppressing senescence- and immune-surveillance–associated cytokines such as IL12B, IL15/IL15RA, and KLRG1. Notably, NEIL1 and ERCC5 (XPG) were downregulated after HU exposure, consistent with an efficient early damage resolution and proliferative recovery. In contrast, ERCC6_K337X cells instead upregulated stress- and inflammatory-response genes (IL6↑, LIF↑, FOS↑, EGR1↑, ATF3↑) together with checkpoint and DNA-damage regulators (RAD9B↑, DEPTOR↑, PIK3IP1↑), while downregulating proliferation- and metabolism-supporting genes (MYCL↓, PROM2↓, MAGEA3↓, MPL↓). Reactome pathway enrichment analysis of DEGs further supported long-term cell fate outcomes observed in WT and ERCC6 null cells, showing an over-representation of senescence and apoptosis-related pathways in ERCC6_K337X cells after 4 hours of HU treatment (Figure 3d,e).
Collectively, these data indicate that ERCC6_WT cells that survive a short-term RS would continue proliferating, whereas ERCC6_K337X cells would undergo a transcriptionally enforced arrest.
3.5. ERCC6 Status Determines Distinct Mutational Patterns and Expression–Mutation Coupling Under Replication Stress
Results described above suggest that ERCC6_WT cells can resolve TRCs and stalled forks efficiently. To evaluate whether TC-NER-dependent resolution of the RS is associated with mutagenesis, we performed whole-exome sequencing (WES) in cells exposed to HU for 4h and in cells exposed for 4h, followed by 72h recovery in fresh medium to evaluate the HU-related DNA damage (at 4 hours) and mutations in the surviving population of cells (72h after).
Overall, the distribution of variants (SNVs and Indels) by allelic frequency differed between ERCC6_WT and mutant cells, independent of the experimental condition (Figure 4a). In WT cells, SNVs were enriched around VAF ≈ 0.5 and in the high-frequency range (~0.8–1.0), consistent with stable clonal representation. In contrast, ERCC6_K337X cells showed a broader VAF distribution in the 0.2-0.8 range, indicating an increased subclonal diversification. The same differences in distribution by VAFs between WT and ERCC6_K337X cells were observed for Indels; however, in this case, the distribution of Indel VAFs varied with the experimental condition, particularly in variants with VAFs <0.3, with the highest frequency in ERCC6_K337X cells after 72h HU-recovery.
The mutational burden induced by HU was calculated as the difference in the total number of variants detected between HU-treated and untreated cells for each genotype and condition. Remaining SNVs and Indels were stratified according to their position relative to genes into tier-1 (gene-proximal: coding sequences, UTRs, and annotated ncRNAs) and tier-2 (intergenic) regions (Figure 4b). Following HU exposure, ERCC6_WT cells accumulated DNA damage (called as mutations) predominantly in tier 1 regions, while ERCC6_K337X cells showed an enrichment in intergenic (tier 2) regions. Consistently, variant calling performed on RNA-seq data revealed a higher number of expressed variants in ERCC6_WT cells and a reduced number in ERCC6_K337X cells following HU exposure (Figure S5a-b).
An overall reduction in mutation counts was detected after 72 hours of recovery in both ERCC6 WT and deficient cells. Nevertheless, only mutations classified as tier-1 were detected in the surviving population of cells, with an enrichment of SNVs in the 5’UTR region in ERCC6_K337X cells and exonic Indels in WT cells (Figure 4c).
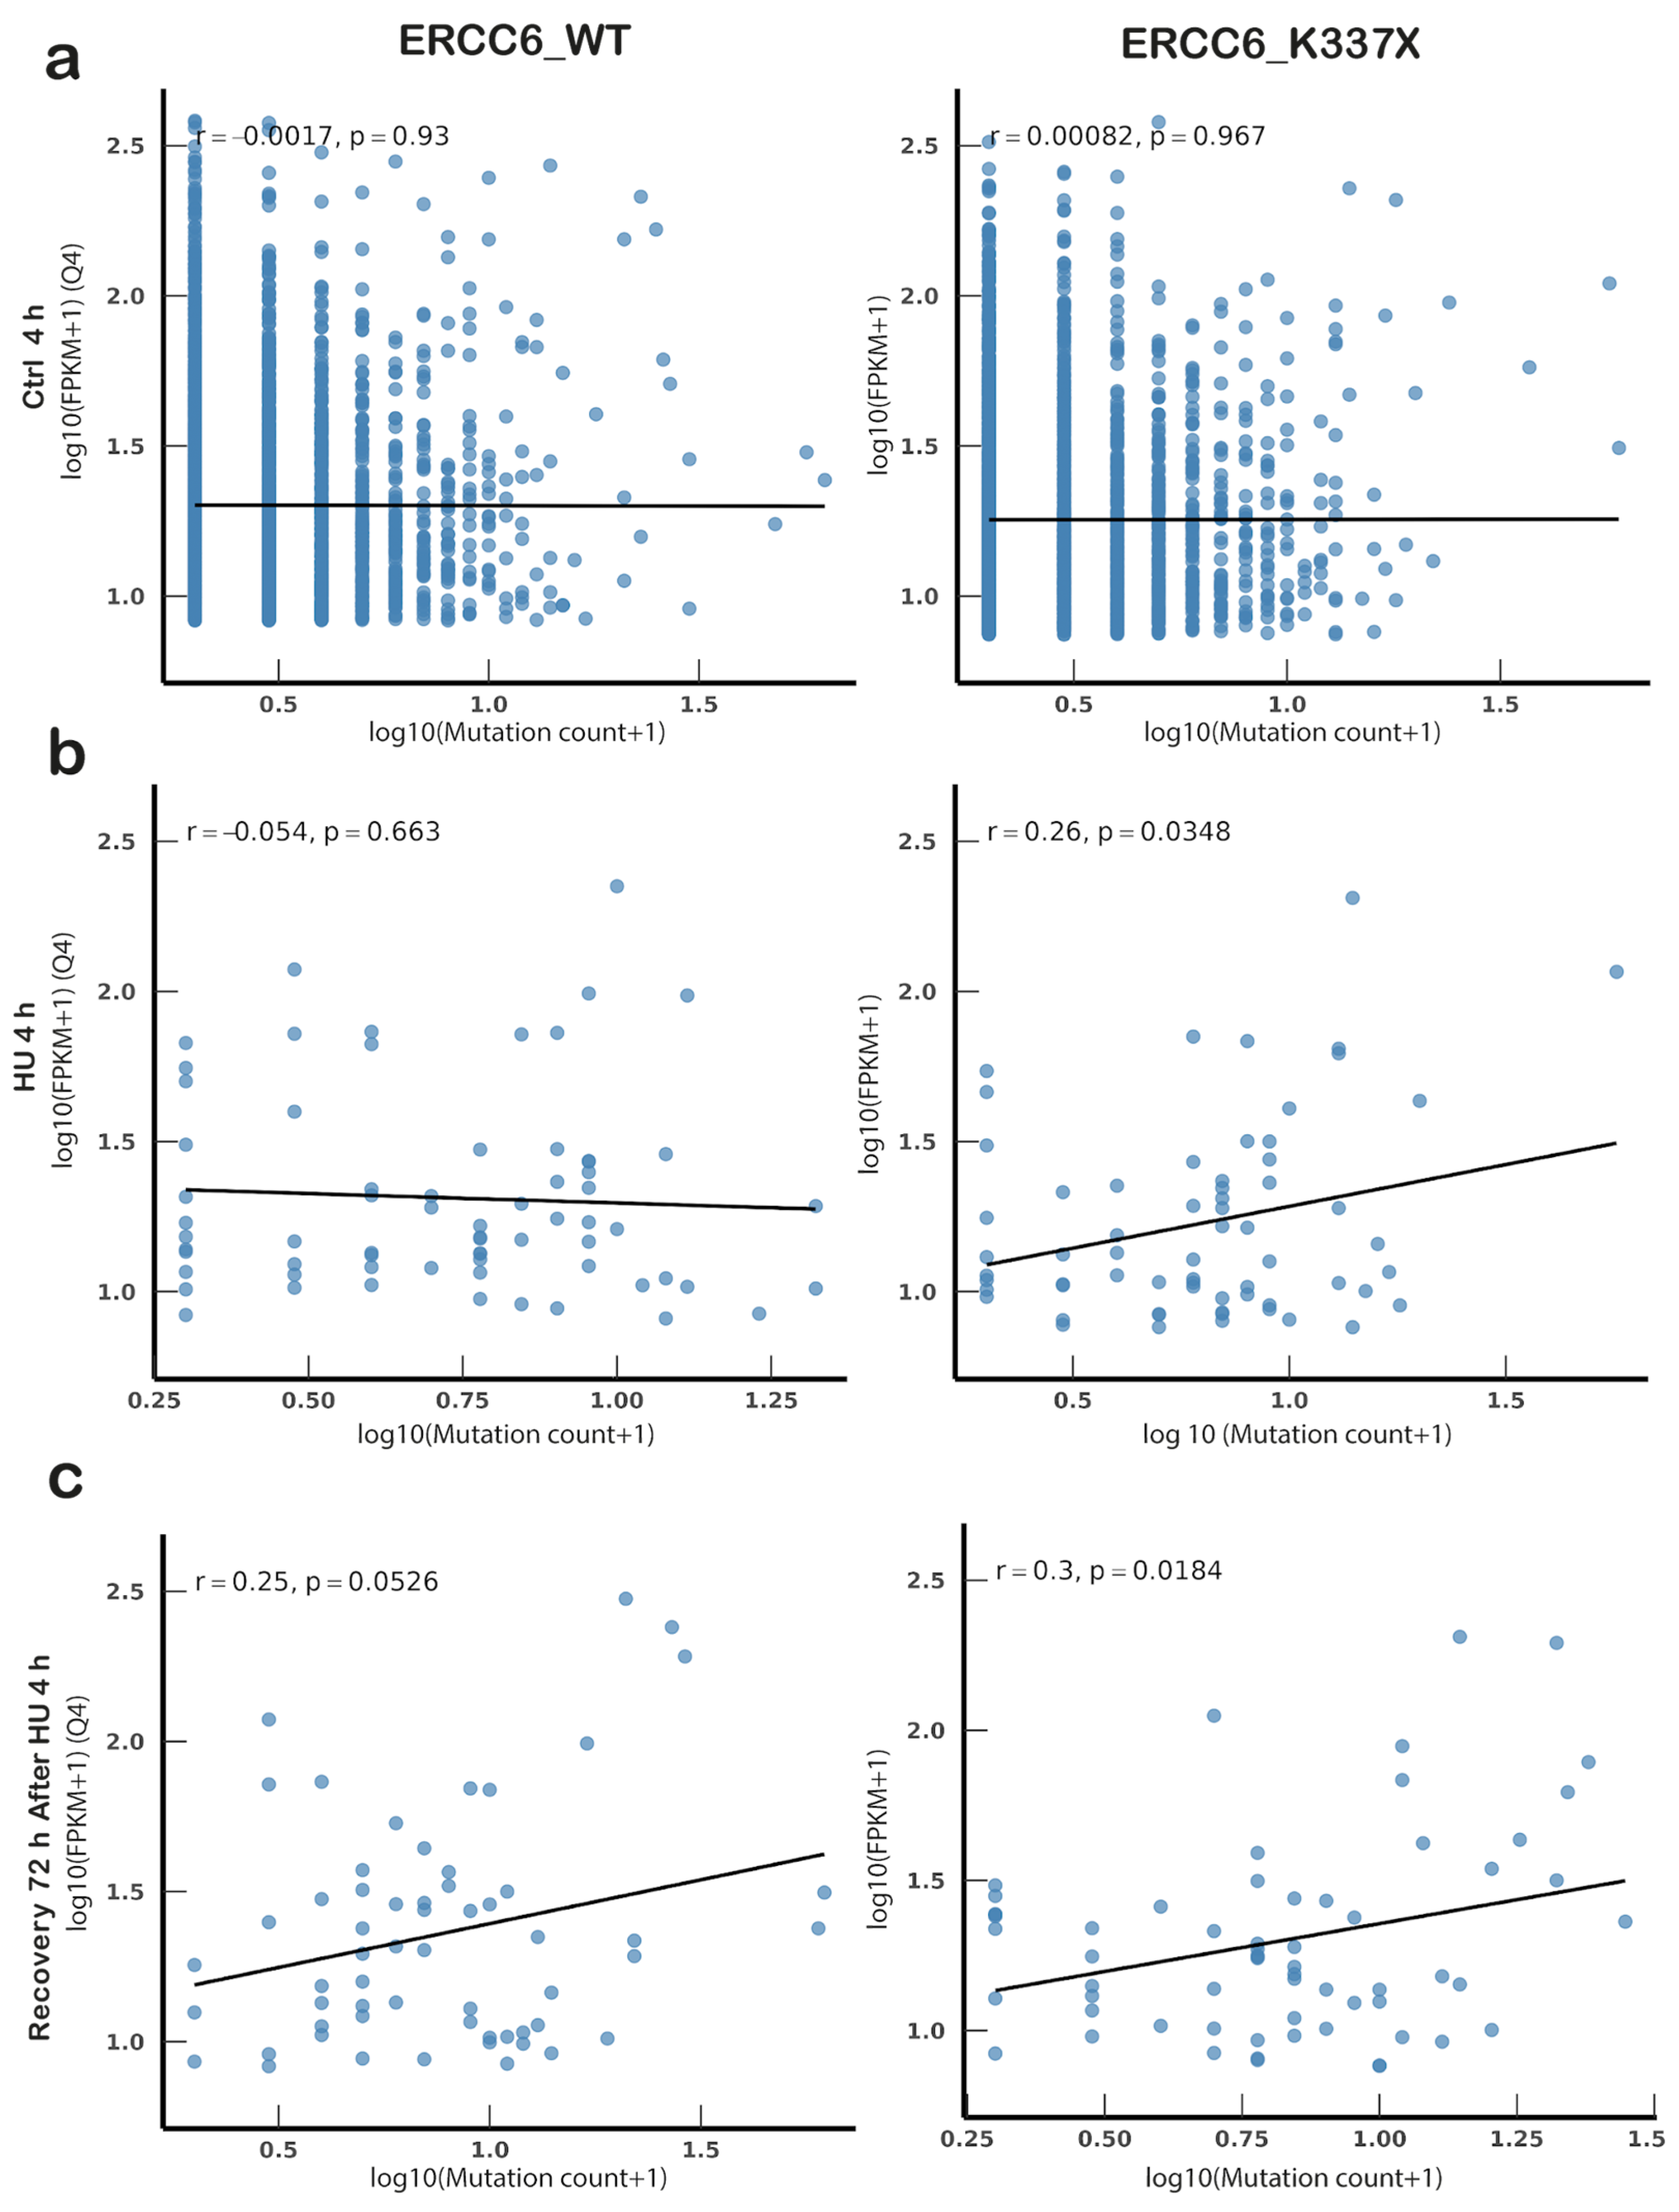
The distribution of mutations relative to the genes is consistent with the presence of DNA damage or missrepair following TC-NER-dependent TRCs resolution. To assess whether the presence of mutations was related to the transcriptional activity of the genes at the time of HU-induced RS, these were classified in quartiles according to their expression levels. Correlation between mutation counts and gene expression (FPKM) was assessed in highly expressed genes (Q4) (Figure 5a–c). No correlation was observed under basal (control) conditions, in WT or mutant cells. Likewise, mutations following 4 h of HU exposure showed no correlation with gene expression in ERCC6_WT cells. In contrast, a significant positive correlation was observed in ERCC6_K337X cells, suggesting that transcriptionally active loci become preferential targets for mutation when ERCC6 is absent. Moreover, this correlation is also observed when mutations remaining after 72 h of recovery were analyzed. At this time point, a weak, but non-significant, correlation was also observed in ERCC6_WT cells (r = 0.25, p = 0.0526). These results are consistent with unrepaired DNA damage enriched in unresolved TCRs exacerbated by ERCC6 deficiency.
Together, these findings reveal that ERCC6 status determines both the genomic distribution and the transcriptional dependency of mutagenesis under RS.
4. Discussion
Our results indicate that ERCC6 shapes the early DNA damage response to HU-induced RS. Notably, the reduced or absent γH2AX signal at early HU exposure in ERCC6-deficient cells is best explained by a faster 53BP1-driven repair response that promotes c-NHEJ, leading to rapid damage processing and accelerated γH2AX dephosphorylation [13,46,47]. This is consistent with biochemical and genetic evidence showing that 53BP1/RIF1 biases DSB pathway choice toward NHEJ [46], and that CSB/ERCC6 loss shifts repair away from HR toward NHEJ [13]. Moreover, γH2AX clearance during the fast-kinetic phase of DSB repair is driven by PP4-mediated dephosphorylation [47,48]. A fast-kinetic phase could explain why low γH2AX in ERCC6_K337X cells does not necessarily indicate the absence of damage, but rather reflects altered repair dynamics, with early NHEJ engagement likely compensating for the inability to resolve transcription-associated lesions through TC-NER. Although our data strongly support this model, they do not establish a single mechanistic route, and additional work will be required to dissect specific intermediates generated during TC-NER–associated DSB processing under RS.
Additionally, the trend toward increased RNAPII–PCNA proximity signal in ERCC6-deficient cells under HU suggests impaired TRC clearance, consistent with the role of TC-NER proteins in resolving R-loops and polymerase collisions at stalled forks [12,49]. Persistent TRCs are known to generate transcription-blocking lesions that require TC-NER-dependent processing; therefore, differences in TRC resolution are expected to contribute to differences in where RS-associated mutations accumulate and in how cells recover from damage. These results support—but do not definitively prove—that TRCs represent a significant source of unresolved lesions in ERCC6-deficient cells; however, the transcription-dependent mutation patterns observed are compatible with this interpretation.
Notably, ERCC6_WT cells accumulated more coding-region mutations following short HU exposure and exhibited a transient increase in senescence at 72 h, which declined by 120 h, indicating reversible growth arrest and recovery of proliferative capacity. This observation suggests that transcription-coupled repair can introduce errors under stress conditions, consistent with models described in bacterial systems [50]. By contrast, ERCC6_K337X cells exhibited reduced viability, not attributable to apoptosis, together with a progressive accumulation of senescent cells over time, consistent with stable proliferative arrest, a pattern also reported under oxidative stress conditions [51]. Importantly, hereditary premature aging disorders characterized by high RS, such as Cockayne syndrome (CS), do not exhibit an increased cancer incidence, unlike XPC-deficient NER disorders, which show strong tumor predisposition [52,53]. Our data provide a mechanistic framework for this distinction. When ERCC6/TC-NER is functional, cells attempt to maintain transcriptional continuity under RS, but at the cost of retaining RS-associated mutations. In contrast, when ERCC6 is absent, cells fail to tolerate RS and preferentially enter senescence, limiting the proliferative capacity of damaged, mutation-bearing cells.
These findings imply that TC-NER is essential for short-term survival and transcriptional continuity but may promote long-term genomic instability in dividing cells. Understanding this duality is particularly relevant in cancer biology [54], where RS and transcriptional hyperactivation coexist [55,56]. Although this study was performed in non-transformed human cells, investigating how mutagenesis emerges under RS in initially normal cells is essential for understanding the earliest molecular events that initiate genomic instability and tumorigenesis. Tumors do not arise in pre-existing cancer cells but evolve from genomically stable progenitors that progressively accumulate DNA damage and mutations. In this context, ERCC6 emerges as a key modulator of genomic maintenance under RS. Its dysfunction may shift the balance from adaptive repair toward mutagenesis, that increasing the probability of malignant transformation.
5. Limitations of the Study
This study has some limitations. For instance, we used HU as a model to induce RS, and although this is a well-established approach, indirect effects of HU may affect the results and may not make it the best surrogate for naturally occurring acute (1-4h) and long-term (24h) RS. We assessed TCRs using the RNAPII–PCNA PLA. Although this approach supports the presence of transcription–replication encounters, it does not directly establish causality with RS. In addition, our transcriptomic data represent a snapshot of the response to replication stress, and a more detailed time-course analysis would likely provide further insight into early and late transcriptional changes. Finally, although immortalized primary fibroblasts provide a controlled human model, responses in tumor-derived cells may differ. We hope that our findings encourage further studies exploring how ERCC6 shapes cellular responses to replication stress in additional systems and contexts.
Supplementary Materials
The following supporting information can be downloaded at the website of this paper posted on Preprints.org. Figure S1: Illudin S is selectively lethal in ERCC6-deficient cells; Figure S2: Comparable basal RPA signal in ERCC6_WT and ERCC6_K337X cells; Figure S3: Lack of ERCC6 impairs the resolution of TRCs under HU, showing an increase in PLA-detected conflict signals; Figure S4: Comparative differential gene expression across ERCC6 genotypes and replication stress conditions; Figure S5: Distribution of RNA-derived SNVs and INDELs by impact and genomic region after HU exposure; Table S1: Reagents and antibodies used in this study.
Author Contributions
EZ, KM: Conceptualization; EZ, CF: Investigation, Methodology, Formal analysis; EZ, FM, MM, RA, KM: Analysis, Validation, Visualization; EZ, KM, CF: Writing – original draft; EZ, CF, FM, MM, RA, KM: Writing – review and editing. KM, RA: Funding acquisition.
Funding
This work was supported by National Agency for Research and Development (ANID) Scholarship Program/DOCTORADO BECAS CHILE/2021 – 21210962; and Grants FONDECYT 1221162 (KM), FONDECYT 1221436 (RA), Anillo ACT210079 (RA/KM), and FONDAP 152220002 (CECAN) (KM,EZ). Funding sources were not involved in the study design, collection, analysis and interpretation of data, writing of the report and decision to submit the article for publication.
Institutional Review Board Statement
Not applicable.
Informed Consent Statement
Not applicable.
Data Availability Statement
Data supporting the reported results are available as Supplementary Material.
Acknowledgments
We thank the Flow Cytometry Facility, FONDEQUIP EQM130042.
Conflicts of Interest
The authors declare no conflicts of interest.
Abbreviations
| Abbreviation | Definition |
| ERCC6 | Excision Repair Cross-Complementation Group 6 |
| CSB | Cockayne Syndrome Group B protein |
| CS | Cockayne Syndrome |
| RS | Replication Stress |
| TC-NER | Transcription-Coupled Nucleotide Excision Repair |
| TRCs | Transcription–Replication Conflicts |
| DSBs | DNA Double-Strand Breaks |
| HR | Homologous Recombination |
| NHEJ | Non-Homologous End Joining |
| Alt-EJ | Alternative End Joining |
| BIR | Break-Induced Replication |
| GG-NER | Global Genome Nucleotide Excision Repair |
| ATM | Ataxia Telangiectasia Mutated kinase |
| CDK2 | Cyclin-Dependent Kinase 2 |
| PARP1 | Poly(ADP-ribose) Polymerase 1 |
| PARP2 | Poly(ADP-ribose) Polymerase 2 |
| RPA | Replication Protein A |
| pRPA | Phosphorylated Replication Protein A |
| γH2AX | Phosphorylated Histone H2AX (Ser139) |
| 53BP1 | p53-Binding Protein 1 |
| RNAPII | RNA Polymerase II |
| PCNA | Proliferating Cell Nuclear Antigen |
| PLA | Proximity Ligation Assay |
| HU | Hydroxyurea |
| BrdU | 5-bromo-2′-deoxyuridin |
References
- Saxena, S.; Zou, L. Hallmarks of DNA Replication Stress. Mol. Cell 2022, 82, 2298–2314. [Google Scholar] [CrossRef] [PubMed]
- Wendel, B.M.; Hollingsworth, S.; Courcelle, C.T.; Courcelle, J. UV-induced DNA Damage Disrupts the Coordination between Replication Initiation, Elongation and Completion. Genes Cells 2021, 26, 94–108. [Google Scholar] [CrossRef] [PubMed]
- In Het Panhuis, W.; Tsaalbi-Shtylik, A.; Schönke, M.; Van Harmelen, V.; Pronk, A.C.M.; Streefland, T.C.M.; Sips, H.C.M.; Afkir, S.; Willems Van Dijk, K.; Rensen, P.C.N.; et al. Rev1 Deficiency Induces Replication Stress to Cause Metabolic Dysfunction Differently in Males and Females. Am. J. Physiol.-Endocrinol. Metab. 2022, 322, E319–E329. [Google Scholar] [CrossRef] [PubMed]
- Jegadesan, N.K.; Branzei, D. DDX11 Loss Causes Replication Stress and Pharmacologically Exploitable DNA Repair Defects. Proc. Natl. Acad. Sci. 2021, 118, e2024258118. [Google Scholar] [CrossRef]
- Ito, S.S.; Nakagawa, Y.; Matsubayashi, M.; Sakaguchi, Y.M.; Kobashigawa, S.; Matsui, T.K.; Nanaura, H.; Nakanishi, M.; Kitayoshi, F.; Kikuchi, S.; et al. Inhibition of the ATR Kinase Enhances 5-FU Sensitivity Independently of Nonhomologous End-Joining and Homologous Recombination Repair Pathways. J. Biol. Chem. 2020, 295, 12946–12961. [Google Scholar] [CrossRef]
- Musiałek, M.W.; Rybaczek, D. Hydroxyurea—The Good, the Bad and the Ugly. Genes 2021, 12, 1096. [Google Scholar] [CrossRef]
- Hills, S.A.; Diffley, J.F.X. DNA Replication and Oncogene-Induced Replicative Stress. Curr. Biol. 2014, 24, R435–R444. [Google Scholar] [CrossRef]
- Niehrs, C.; Luke, B. Regulatory R-Loops as Facilitators of Gene Expression and Genome Stability. Nat. Rev. Mol. Cell Biol. 2020, 21, 167–178. [Google Scholar] [CrossRef]
- Lalonde, M.; Trauner, M.; Werner, M.; Hamperl, S. Consequences and Resolution of Transcription–Replication Conflicts. Life 2021, 11, 637. [Google Scholar] [CrossRef]
- Kumar, C.; Remus, D. Looping out of Control: R-Loops in Transcription-Replication Conflict. Chromosoma 2024, 133, 37–56. [Google Scholar] [CrossRef]
- Rinaldi, C.; Pizzul, P.; Longhese, M.P.; Bonetti, D. Sensing R-Loop-Associated DNA Damage to Safeguard Genome Stability. Front. Cell Dev. Biol. 2021, 8, 618157. [Google Scholar] [CrossRef] [PubMed]
- Sollier, J.; Stork, C.T.; García-Rubio, M.L.; Paulsen, R.D.; Aguilera, A.; Cimprich, K.A. Transcription-Coupled Nucleotide Excision Repair Factors Promote R-Loop-Induced Genome Instability. Mol. Cell 2014, 56, 777–785. [Google Scholar] [CrossRef] [PubMed]
- Batenburg, N.L.; Thompson, E.L.; Hendrickson, E.A.; Zhu, X. Cockayne Syndrome Group B Protein Regulates DNA Double-Strand Break Repair and Checkpoint Activation. EMBO J. 2015, 34, 1399–1416. [Google Scholar] [CrossRef]
- Batenburg, N.L.; Walker, J.R.; Noordermeer, S.M.; Moatti, N.; Durocher, D.; Zhu, X.-D. ATM and CDK2 Control Chromatin Remodeler CSB to Inhibit RIF1 in DSB Repair Pathway Choice. Nat. Commun. 2017, 8, 1921. [Google Scholar] [CrossRef] [PubMed]
- Oka, Y.; Nakazawa, Y.; Shimada, M.; Ogi, T. Endogenous Aldehyde-Induced DNA–Protein Crosslinks Are Resolved by Transcription-Coupled Repair. Nat. Cell Biol. 2024, 26, 784–796. [Google Scholar] [CrossRef]
- Van Sluis, M.; Yu, Q.; Van Der Woude, M.; Gonzalo-Hansen, C.; Dealy, S.C.; Janssens, R.C.; Somsen, H.B.; Ramadhin, A.R.; Dekkers, D.H.W.; Wienecke, H.L.; et al. Transcription-Coupled DNA–Protein Crosslink Repair by CSB and CRL4CSA-Mediated Degradation. Nat. Cell Biol. 2024, 26, 770–783. [Google Scholar] [CrossRef]
- Carnie, C.J.; Acampora, A.C.; Bader, A.S.; Erdenebat, C.; Zhao, S.; Bitensky, E.; Van Den Heuvel, D.; Parnas, A.; Gupta, V.; D’Alessandro, G.; et al. Transcription-Coupled Repair of DNA–Protein Cross-Links Depends on CSA and CSB. Nat. Cell Biol. 2024, 26, 797–810. [Google Scholar] [CrossRef]
- Tuo, J.; Jaruga, P.; Rodriguez, H.; Bohr, V.A.; Dizdaroglu, M. Primary Fibroblasts of Cockayne Syndrome Patients Are Defective in Cellular Repair of 8-hydroxyguanine and 8-hydroxyadenine Resulting from Oxidative Stress. FASEB J. 2003, 17, 668–674. [Google Scholar] [CrossRef]
- Dianov, G. Repair of 8-Oxoguanine in DNA Is Deficient in Cockayne Syndrome Group B Cells. Nucleic Acids Res. 1999, 27, 1365–1368. [Google Scholar] [CrossRef]
- Ranes, M.; Boeing, S.; Wang, Y.; Wienholz, F.; Menoni, H.; Walker, J.; Encheva, V.; Chakravarty, P.; Mari, P.-O.; Stewart, A.; et al. A Ubiquitylation Site in Cockayne Syndrome B Required for Repair of Oxidative DNA Damage, but Not for Transcription-Coupled Nucleotide Excision Repair. Nucleic Acids Res. 2016, 44, 5246–5255. [Google Scholar] [CrossRef]
- Menoni, H.; Wienholz, F.; Theil, A.F.; Janssens, R.C.; Lans, H.; Campalans, A.; Radicella, J.P.; Marteijn, J.A.; Vermeulen, W. The Transcription-Coupled DNA Repair-Initiating Protein CSB Promotes XRCC1 Recruitment to Oxidative DNA Damage. Nucleic Acids Res. 2018, 46, 7747–7756. [Google Scholar] [CrossRef] [PubMed]
- Kumar, N.; Raja, S.; Van Houten, B. The Involvement of Nucleotide Excision Repair Proteins in the Removal of Oxidative DNA Damage. Nucleic Acids Res. 2020, 48, 11227–11243. [Google Scholar] [CrossRef] [PubMed]
- Thorslund, T.; Von Kobbe, C.; Harrigan, J.A.; Indig, F.E.; Christiansen, M.; Stevnsner, T.; Bohr, V.A. Cooperation of the Cockayne Syndrome Group B Protein and Poly(ADP-Ribose) Polymerase 1 in the Response to Oxidative Stress. Mol. Cell. Biol. 2005, 25, 7625–7636. [Google Scholar] [CrossRef]
- Boetefuer, E.L.; Lake, R.J.; Dreval, K.; Fan, H.-Y. Poly(ADP-Ribose) Polymerase 1 (PARP1) Promotes Oxidative Stress–Induced Association of Cockayne Syndrome Group B Protein with Chromatin. J. Biol. Chem. 2018, 293, 17863–17874. [Google Scholar] [CrossRef] [PubMed]
- Bilkis, R.; Lake, R.J.; Cooper, K.L.; Tomkinson, A.; Fan, H.-Y. The CSB Chromatin Remodeler Regulates PARP1- and PARP2-Mediated Single-Strand Break Repair at Actively Transcribed DNA Regions. Nucleic Acids Res. 2023, 51, 7342–7356. [Google Scholar] [CrossRef]
- Deem, A.; Keszthelyi, A.; Blackgrove, T.; Vayl, A.; Coffey, B.; Mathur, R.; Chabes, A.; Malkova, A. Break-Induced Replication Is Highly Inaccurate. PLoS Biol. 2011, 9, e1000594. [Google Scholar] [CrossRef]
- Batenburg, N.L.; Mersaoui, S.Y.; Walker, J.R.; Coulombe, Y.; Hammond-Martel, I.; Wurtele, H.; Masson, J.-Y.; Zhu, X.-D. Cockayne Syndrome Group B Protein Regulates Fork Restart, Fork Progression and MRE11-Dependent Fork Degradation in BRCA1/2-Deficient Cells. Nucleic Acids Res. 2021, 49, 12836–12854. [Google Scholar] [CrossRef]
- Batenburg, N.L.; Walker, J.R.; Zhu, X.-D. CSB Regulates Pathway Choice in Response to DNA Replication Stress Induced by Camptothecin. Int. J. Mol. Sci. 2023, 24, 12419. [Google Scholar] [CrossRef]
- Batenburg, N.L.; Sowa, D.J.; Walker, J.R.; Andres, S.N.; Zhu, X.-D. CSB and SMARCAL1 Compete for RPA32 at Stalled Forks and Differentially Control the Fate of Stalled Forks in BRCA2-Deficient Cells. Nucleic Acids Res. 2024, 52, 5067–5087. [Google Scholar] [CrossRef]
- Martin, H.A.; Pedraza-Reyes, M.; Yasbin, R.E.; Robleto, E.A. Transcriptional De-Repression and Mfd Are Mutagenic in Stressed Bacillus Subtilis Cells. J. Mol. Microbiol. Biotechnol. 2011, 21, 45–58. [Google Scholar] [CrossRef]
- Million-Weaver, S.; Samadpour, A.N.; Moreno-Habel, D.A.; Nugent, P.; Brittnacher, M.J.; Weiss, E.; Hayden, H.S.; Miller, S.I.; Liachko, I.; Merrikh, H. An Underlying Mechanism for the Increased Mutagenesis of Lagging-Strand Genes in Bacillus Subtilis. Proc. Natl. Acad. Sci. 2015, 112. [Google Scholar] [CrossRef] [PubMed]
- Han, J.; Sahin, O.; Barton, Y.-W.; Zhang, Q. Key Role of Mfd in the Development of Fluoroquinolone Resistance in Campylobacter Jejuni. PLoS Pathog. 2008, 4, e1000083. [Google Scholar] [CrossRef] [PubMed]
- Ragheb, M.N.; Thomason, M.K.; Hsu, C.; Nugent, P.; Gage, J.; Samadpour, A.N.; Kariisa, A.; Merrikh, C.N.; Miller, S.I.; Sherman, D.R.; et al. Inhibiting the Evolution of Antibiotic Resistance. Mol. Cell 2019, 73, 157–165.e5. [Google Scholar] [CrossRef] [PubMed]
- Galhardo, R.S.; Hastings, P.J.; Rosenberg, S.M. Mutation as a Stress Response and the Regulation of Evolvability. Crit. Rev. Biochem. Mol. Biol. 2007, 42, 399–435. [Google Scholar] [CrossRef]
- Portman, J.R.; Brouwer, G.M.; Bollins, J.; Savery, N.J.; Strick, T.R. Cotranscriptional R-Loop Formation by Mfd Involves Topological Partitioning of DNA. Proc. Natl. Acad. Sci. U. S. A 2021, 118, e2019630118. [Google Scholar] [CrossRef]
- Sarmini, L.; Meabed, M.; Emmanouil, E.; Atsaves, G.; Robeska, E.; Karwowski, B.T.; Campalans, A.; Gimisis, T.; Khobta, A. Requirement of Transcription-Coupled Nucleotide Excision Repair for the Removal of a Specific Type of Oxidatively Induced DNA Damage. Nucleic Acids Res. 2023, 51, 4982–4994. [Google Scholar] [CrossRef]
- Khobta, A.; Sarmini, L. Transcription-Coupled Nucleotide Excision Repair: A Faster Solution or the Only Option? Biomolecules 2025, 15, 1026. [Google Scholar] [CrossRef]
- Sarmini, L.; Kitsera, N.; Meabed, M.; Khobta, A. Transcription Blocking Properties and Transcription-Coupled Repair of N2-Alkylguanine Adducts as a Model for Aldehyde-Induced DNA Damage. J. Biol. Chem. 2025, 301, 108459. [Google Scholar] [CrossRef]
- Vogelstein, B.; Papadopoulos, N.; Velculescu, V.E.; Zhou, S.; Diaz, L.A.; Kinzler, K.W. Cancer Genome Landscapes. Science 2013, 339, 1546–1558. [Google Scholar] [CrossRef]
- McGranahan, N.; Swanton, C. Biological and Therapeutic Impact of Intratumor Heterogeneity in Cancer Evolution. Cancer Cell 2015, 27, 15–26. [Google Scholar] [CrossRef]
- Parsels, L.A.; Karnak, D.; Parsels, J.D.; Zhang, Q.; Vélez-Padilla, J.; Reichert, Z.R.; Wahl, D.R.; Maybaum, J.; O’Connor, M.J.; Lawrence, T.S.; et al. PARP1 Trapping and DNA Replication Stress Enhance Radiosensitization with Combined WEE1 and PARP Inhibitors. Mol. Cancer Res. 2018, 16, 222–232. [Google Scholar] [CrossRef] [PubMed]
- Vesela, E.; Chroma, K.; Turi, Z.; Mistrik, M. Common Chemical Inductors of Replication Stress: Focus on Cell-Based Studies. Biomolecules 2017, 7, 19. [Google Scholar] [CrossRef] [PubMed]
- Colicchia, V.; Petroni, M.; Guarguaglini, G.; Sardina, F.; Sahún-Roncero, M.; Carbonari, M.; Ricci, B.; Heil, C.; Capalbo, C.; Belardinilli, F.; et al. PARP Inhibitors Enhance Replication Stress and Cause Mitotic Catastrophe in MYCN-Dependent Neuroblastoma. Oncogene 2017, 36, 4682–4691. [Google Scholar] [CrossRef] [PubMed]
- Xu, R.; Zhu, S.; Zhang, W.; Xu, H.; Tu, C.; Wang, H.; Wang, L.; He, N.; Liu, T.; Guo, X.; et al. A Dual Approach with Organoid and CRISPR Screening Reveals ERCC6 as a Determinant of Cisplatin Resistance in Osteosarcoma. Adv. Sci. 2025, 12, 2500632. [Google Scholar] [CrossRef]
- Dimri, G.P.; Lee, X.; Basile, G.; Acosta, M.; Scott, G.; Roskelley, C.; Medrano, E.E.; Linskens, M.; Rubelj, I.; Pereira-Smith, O. A Biomarker That Identifies Senescent Human Cells in Culture and in Aging Skin in Vivo. Proc. Natl. Acad. Sci. 1995, 92, 9363–9367. [Google Scholar] [CrossRef]
- Panier, S.; Boulton, S.J. Double-Strand Break Repair: 53BP1 Comes into Focus. Nat. Rev. Mol. Cell Biol. 2014, 15, 7–18. [Google Scholar] [CrossRef]
- Chowdhury, D.; Xu, X.; Zhong, X.; Ahmed, F.; Zhong, J.; Liao, J.; Dykxhoorn, D.M.; Weinstock, D.M.; Pfeifer, G.P.; Lieberman, J. A PP4-Phosphatase Complex Dephosphorylates γ-H2AX Generated during DNA Replication. Mol. Cell 2008, 31, 33–46. [Google Scholar] [CrossRef]
- Mentani, A.; Maresca, M.; Shiriaeva, A. Prime Editing: Mechanistic Insights and DNA Repair Modulation. Cells 2025, 14, 277. [Google Scholar] [CrossRef]
- Jeon, J.; Kang, T.-H. Transcription-Coupled Repair and R-Loop Crosstalk in Genome Stability. Int. J. Mol. Sci. 2025, 26, 3744. [Google Scholar] [CrossRef]
- Deaconescu, A.M. Mfd – at the Crossroads of Bacterial DNA Repair, Transcriptional Regulation and Molecular Evolvability. Transcription 2021, 12, 156–170. [Google Scholar] [CrossRef]
- Low, G.K.M.; Ng, G.Y.-Q.; Zeegers, D.; Ting, A.; Gopalakrishnan, K.; Khaw, A.K.; Jayapal, M.; Hande, M.P. Protective Role of Cockayne Syndrome B (CSB) Protein in Maintaining Genome Integrity in Human Cells under Oxidative Stress. Mutat. Res. - Genet. Toxicol. Environ. Mutagen. 2025, 907, 503887. [Google Scholar] [CrossRef]
- Herr, L.M.; Schaffer, E.D.; Fuchs, K.F.; Datta, A.; Brosh, R.M. Replication Stress as a Driver of Cellular Senescence and Aging. Commun. Biol. 2024, 7, 616. [Google Scholar] [CrossRef]
- Reid-Bayliss, K.S.; Arron, S.T.; Loeb, L.A.; Bezrookove, V.; Cleaver, J.E. Why Cockayne Syndrome Patients Do Not Get Cancer despite Their DNA Repair Deficiency. Proc. Natl. Acad. Sci. 2016, 113, 10151–10156. [Google Scholar] [CrossRef]
- Bilkis, R.; Lake, R.J.; Fan, H.-Y. ATP-Dependent Chromatin Remodeler CSB Couples DNA Repair Pathways to Transcription with Implications for Cockayne Syndrome and Cancer Therapy. Cells 2025, 14, 239. [Google Scholar] [CrossRef]
- Kotsantis, P.; Silva, L.M.; Irmscher, S.; Jones, R.M.; Folkes, L.; Gromak, N.; Petermann, E. Increased Global Transcription Activity as a Mechanism of Replication Stress in Cancer. Nat. Commun. 2016, 7, 13087. [Google Scholar] [CrossRef]
- Hidmi, O.; Shatleh, D.; Flayshman, S.O.; Monin, J.; Aqeilan, R.I. Super-Enhancers Shape the Landscape and Repair Dynamics of Transcription-Associated DNA Breaks in Cancer 2025.
Figure 1.
ERCC6 deficiency alters DNA damage signaling dynamics under replication stress. (a) Representative immunofluorescence (IF) images of ERCC6_WT and ERCC6_K337X fibroblasts under control conditions (0 h, 24 h), and HU exposure (1 h, 4 h, 24 h, 2 mM). Nuclei are shown in gray and pRPA, γH2AX and 53BP1 in red. Scale bar, 50 μm. (b–d) Integrated nuclear signal density (IntDen) for pRPA, γH2AX and 53BP1. Box-and-whisker plots follow the Tukey method. Data represent mean ± SD from three independent experiments (n > 180 nuclei). (e) Reactome pathway enrichment analysis of differentially expressed genes in ERCC6_WT and ERCC6_K337X cells under HU. Selected pathways relevant to DSBs response. Statistics: (b-d) Welch’s ANOVA with Brown–Forsythe correction, followed by Games–Howell post hoc test. Significance levels: p < 0.05 (*), p < 0.01 (**), p < 0.001 (***), p < 0.0001 (****). (e) Reactome significance threshold: p adj < 0.05. Pseudoreplicates (n=1 per condition) were used for pathway-level comparisons, analysis (p adj, BH correction).
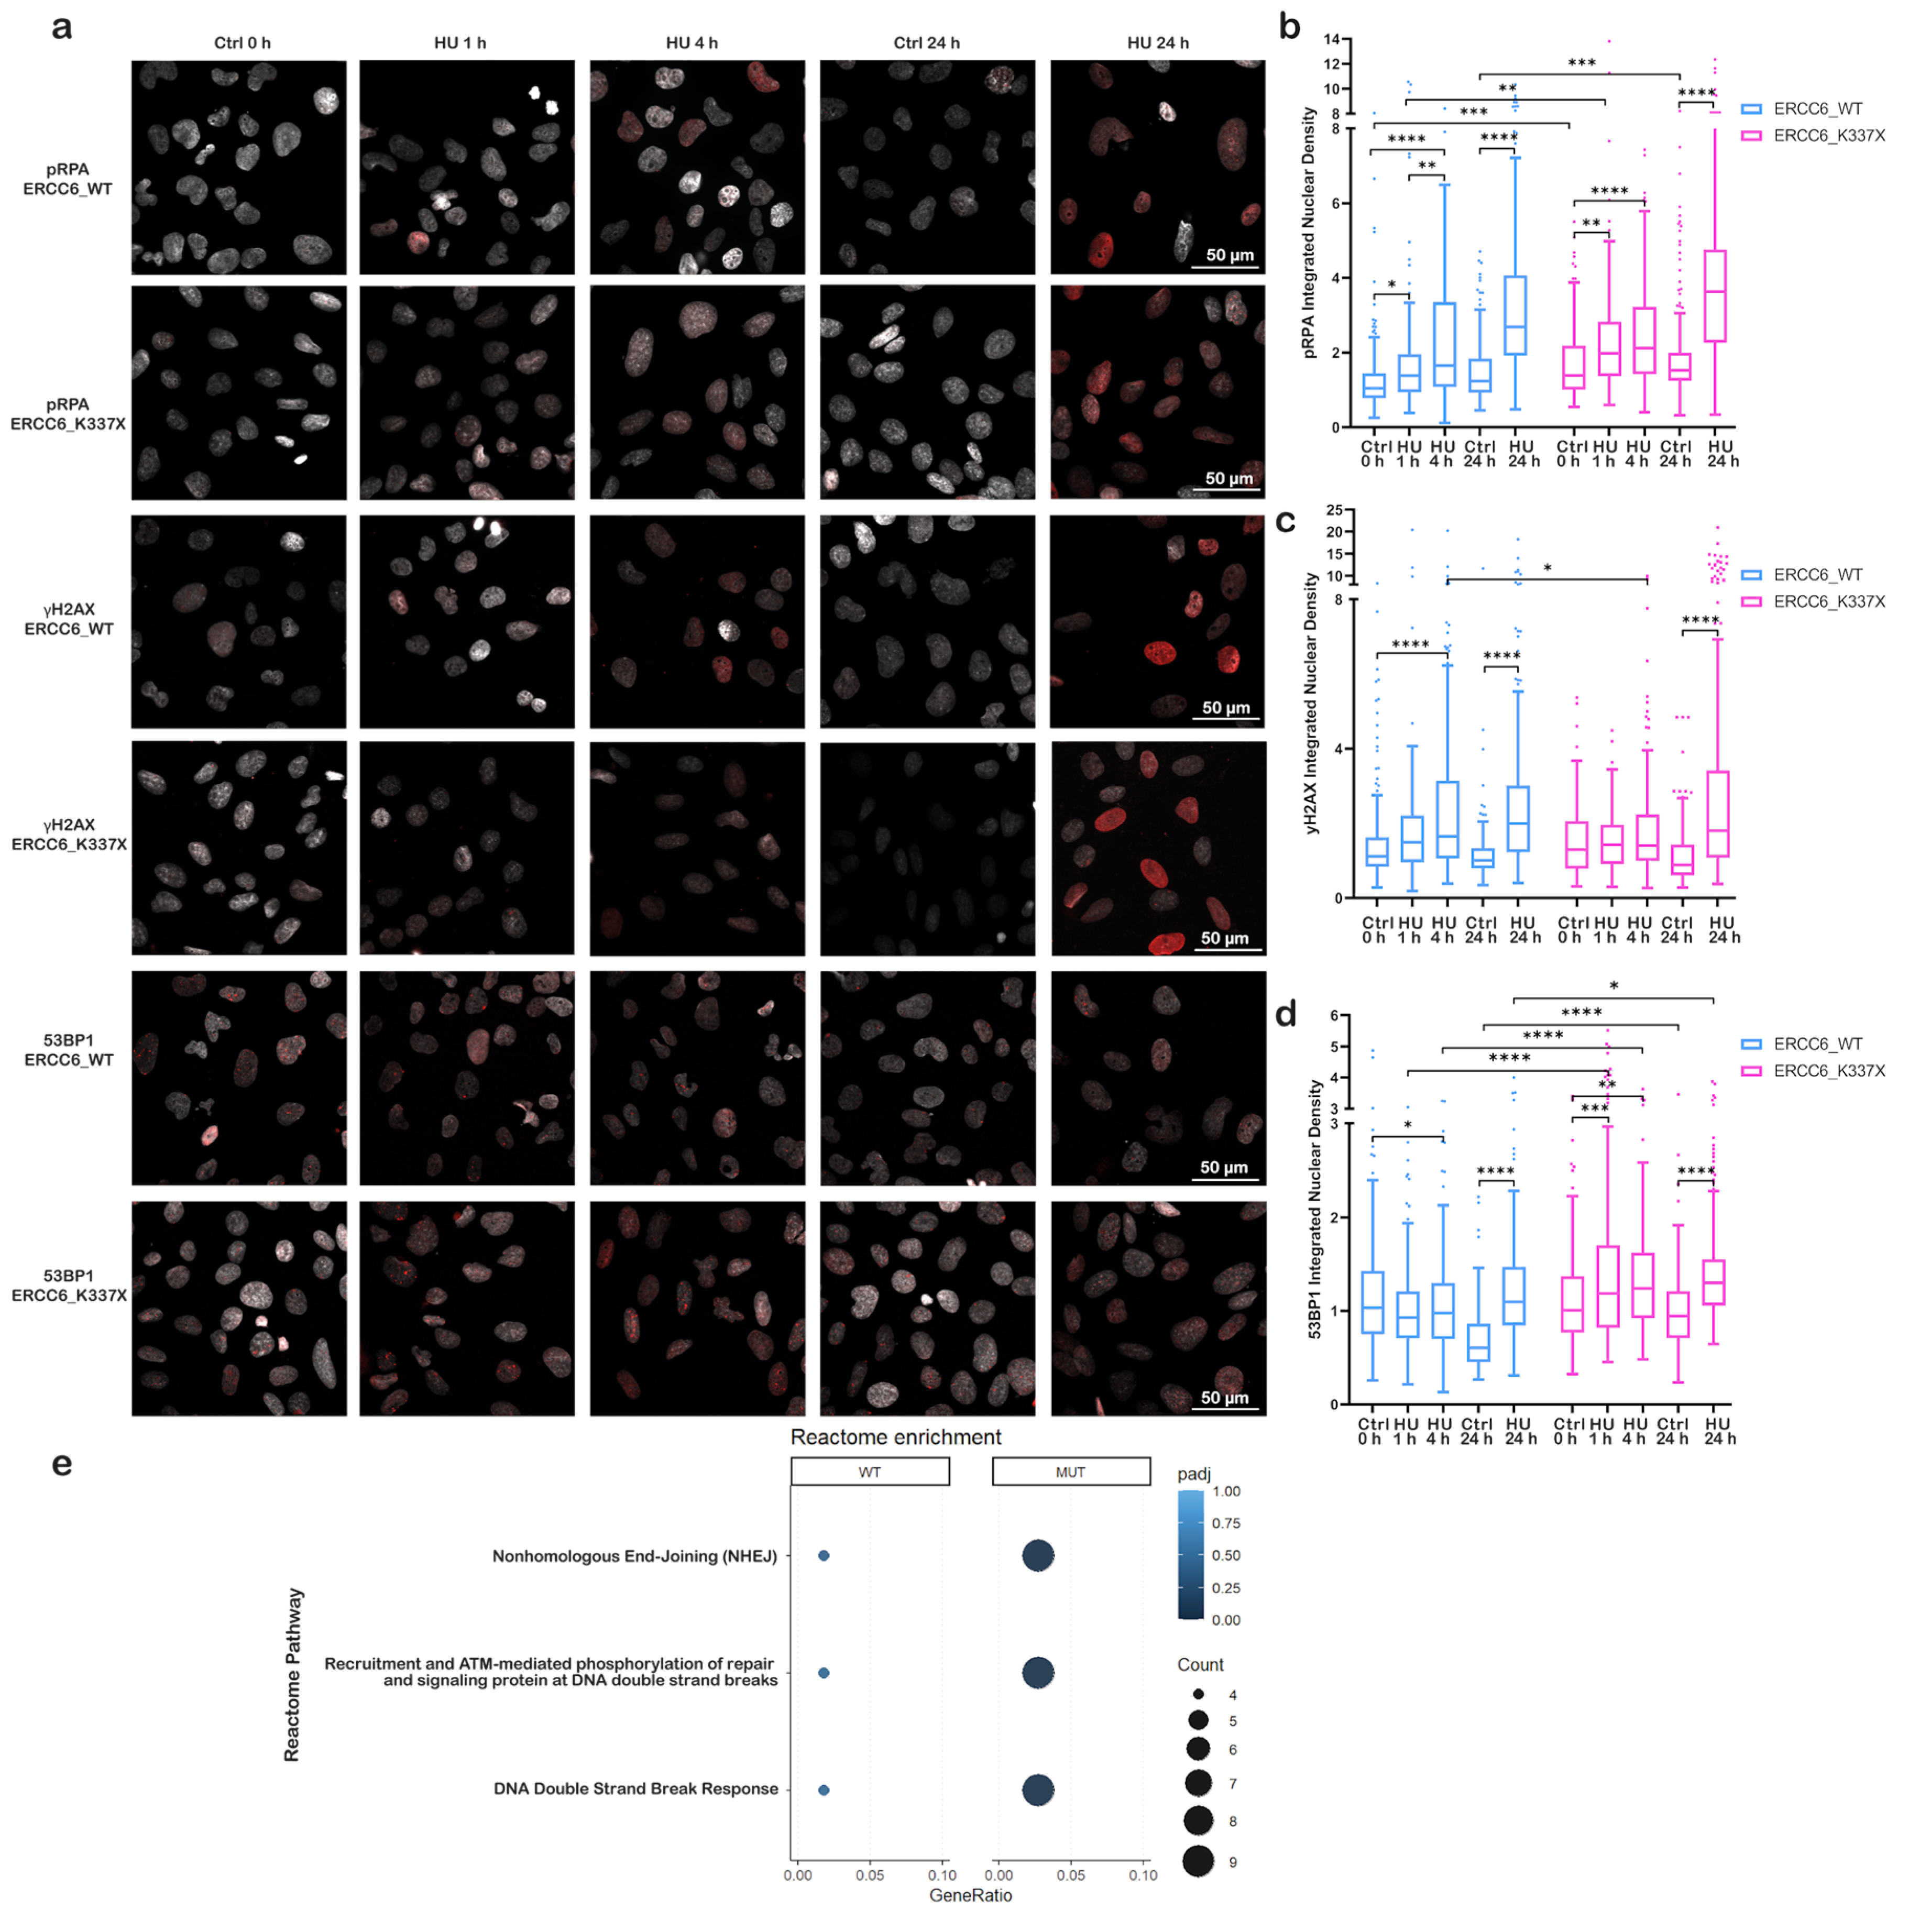
Figure 2.
ERCC6 determines replication restart and senescence outcomes. (a) Representative BrdU IF images of ERCC6_WT and ERCC6_K337X cells under control conditions and after HU exposure (1 h, 4 h, 24 h). Nuclei in grey, BrdU in green. Scale bar, 50 μm. (b) Percentage of BrdU-positive nuclei. Data represent mean ± SD from three independent experiments, 4-5 fields each (n=12-15 images). (c–d) Cell-cycle profiles (G1, S, G2/M) assessed by propidium iodide staining in ERCC6_WT (n=4) (c) and ERCC6_K337X (n=3) (d) cells under control, HU (1 h, 4 h, 24 h), and 72 h post-HU recovery. No statistical testing was applied. (e) Cell viability expressed as fold-change relative to the respective untreated control, measured after HU (4 h and 24 h) and after 72 h recovery (n=3). (f) Sub G1 population expressed as fold-change relative to the respective untreated control, measured after HU (4 h and 24 h) and after 72 h recovery (n=3) (g) Apoptosis levels expressed as fold-change relative to control, under the same HU exposure and recovery conditions (n=3, except 72 h recovery after HU 24 h (n=2)). (h) Representative images of SA-β-Gal staining. Senescent cells appear in blue. Scale bar, 100 μm. (i) Quantification of senescent cells normalized to control (fold-change) at HU 4 h, and at 72 h and 120 h recovery (n=3). Statistics: Two-way ANOVA with Tukey’s multiple-comparisons test (b, f, g, i) and two-way ANOVA with Benjamini, Krieger y Yekutieli (BKY) false-discovery rate (FDR) correction for multiple comparisons (e). Plots use Tukey distribution with all the replicates. Significance levels: p < 0.05 (*), p < 0.01 (**), p < 0.001 (***), p < 0.0001 (****).
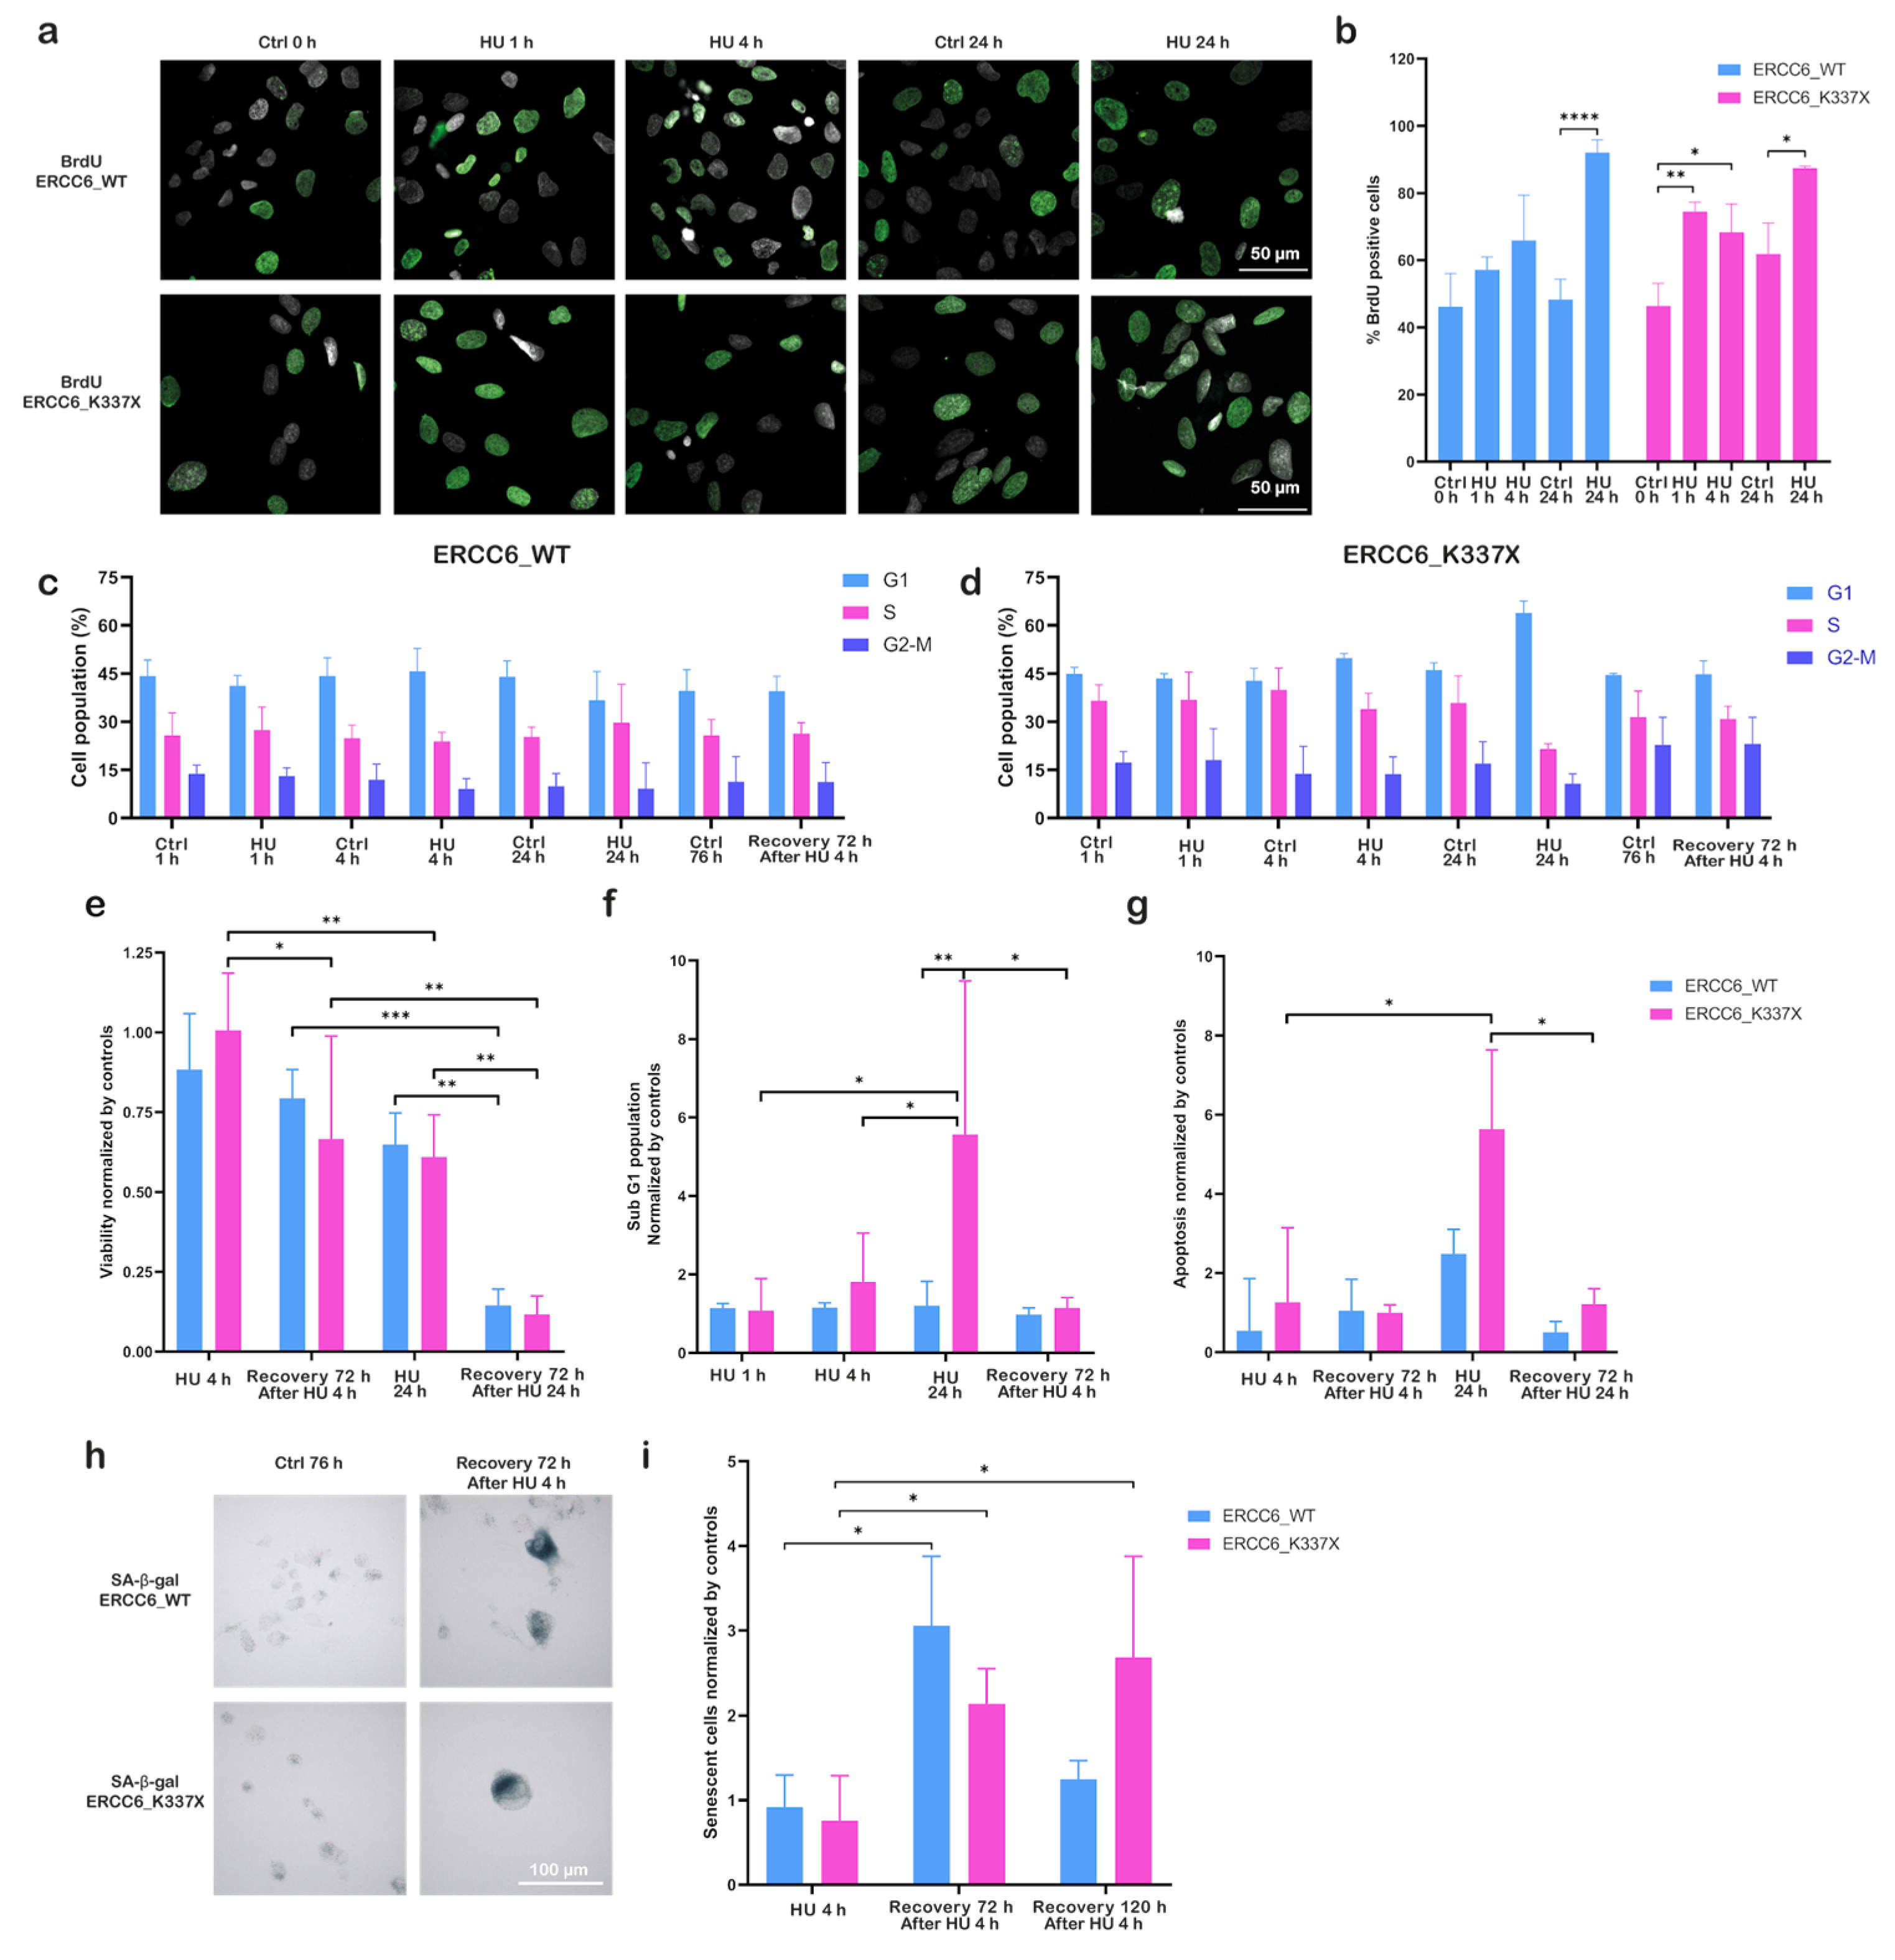
Figure 3.
ERCC6 status shapes transcriptional responses under replication stress. (a) Hierarchical clustering heatmap of differentially expressed genes (DEGs) in ERCC6_WT and ERCC6_K337X cells across three conditions: basal (T0), HU (4 h) and matched controls (4 h Ctrl). Each row represents a gene and each column a sample. Color scale represents expression normalized by log2(FPKM+1) and homogenized row by Z-score (red = high, green = low), hierarchical clustering was performed on the log2(FPKM+1) values to group genes with similar expression patterns. (b) Volcano plot showing DEGs in ERCC6_WT cells under HU versus control (c) Volcano plot showing DEGs in ERCC6_K337X cells under HU versus control. In (b–c), log2 fold change is plotted against −log10(p value); significantly regulated genes (p value < 0.05) are highlighted with red. Genes annotated to cancer pathways are indicated. Differential expression was determined using edgeR with pseudoreplicates (n=1 per condition). (d–e) Reactome pathway enrichment analysis of differentially expressed genes in ERCC6_WT (d) and ERCC6_K337X (e) cells under HU. Selected pathways relevant to RS response, DNA repair signaling, cell-cycle control and senescence are shown. Reactome significance threshold: p adj < 0.05. Pseudoreplicates (n=1 per condition) were used for pathway-level comparisons, analysis (p adj, BH correction).
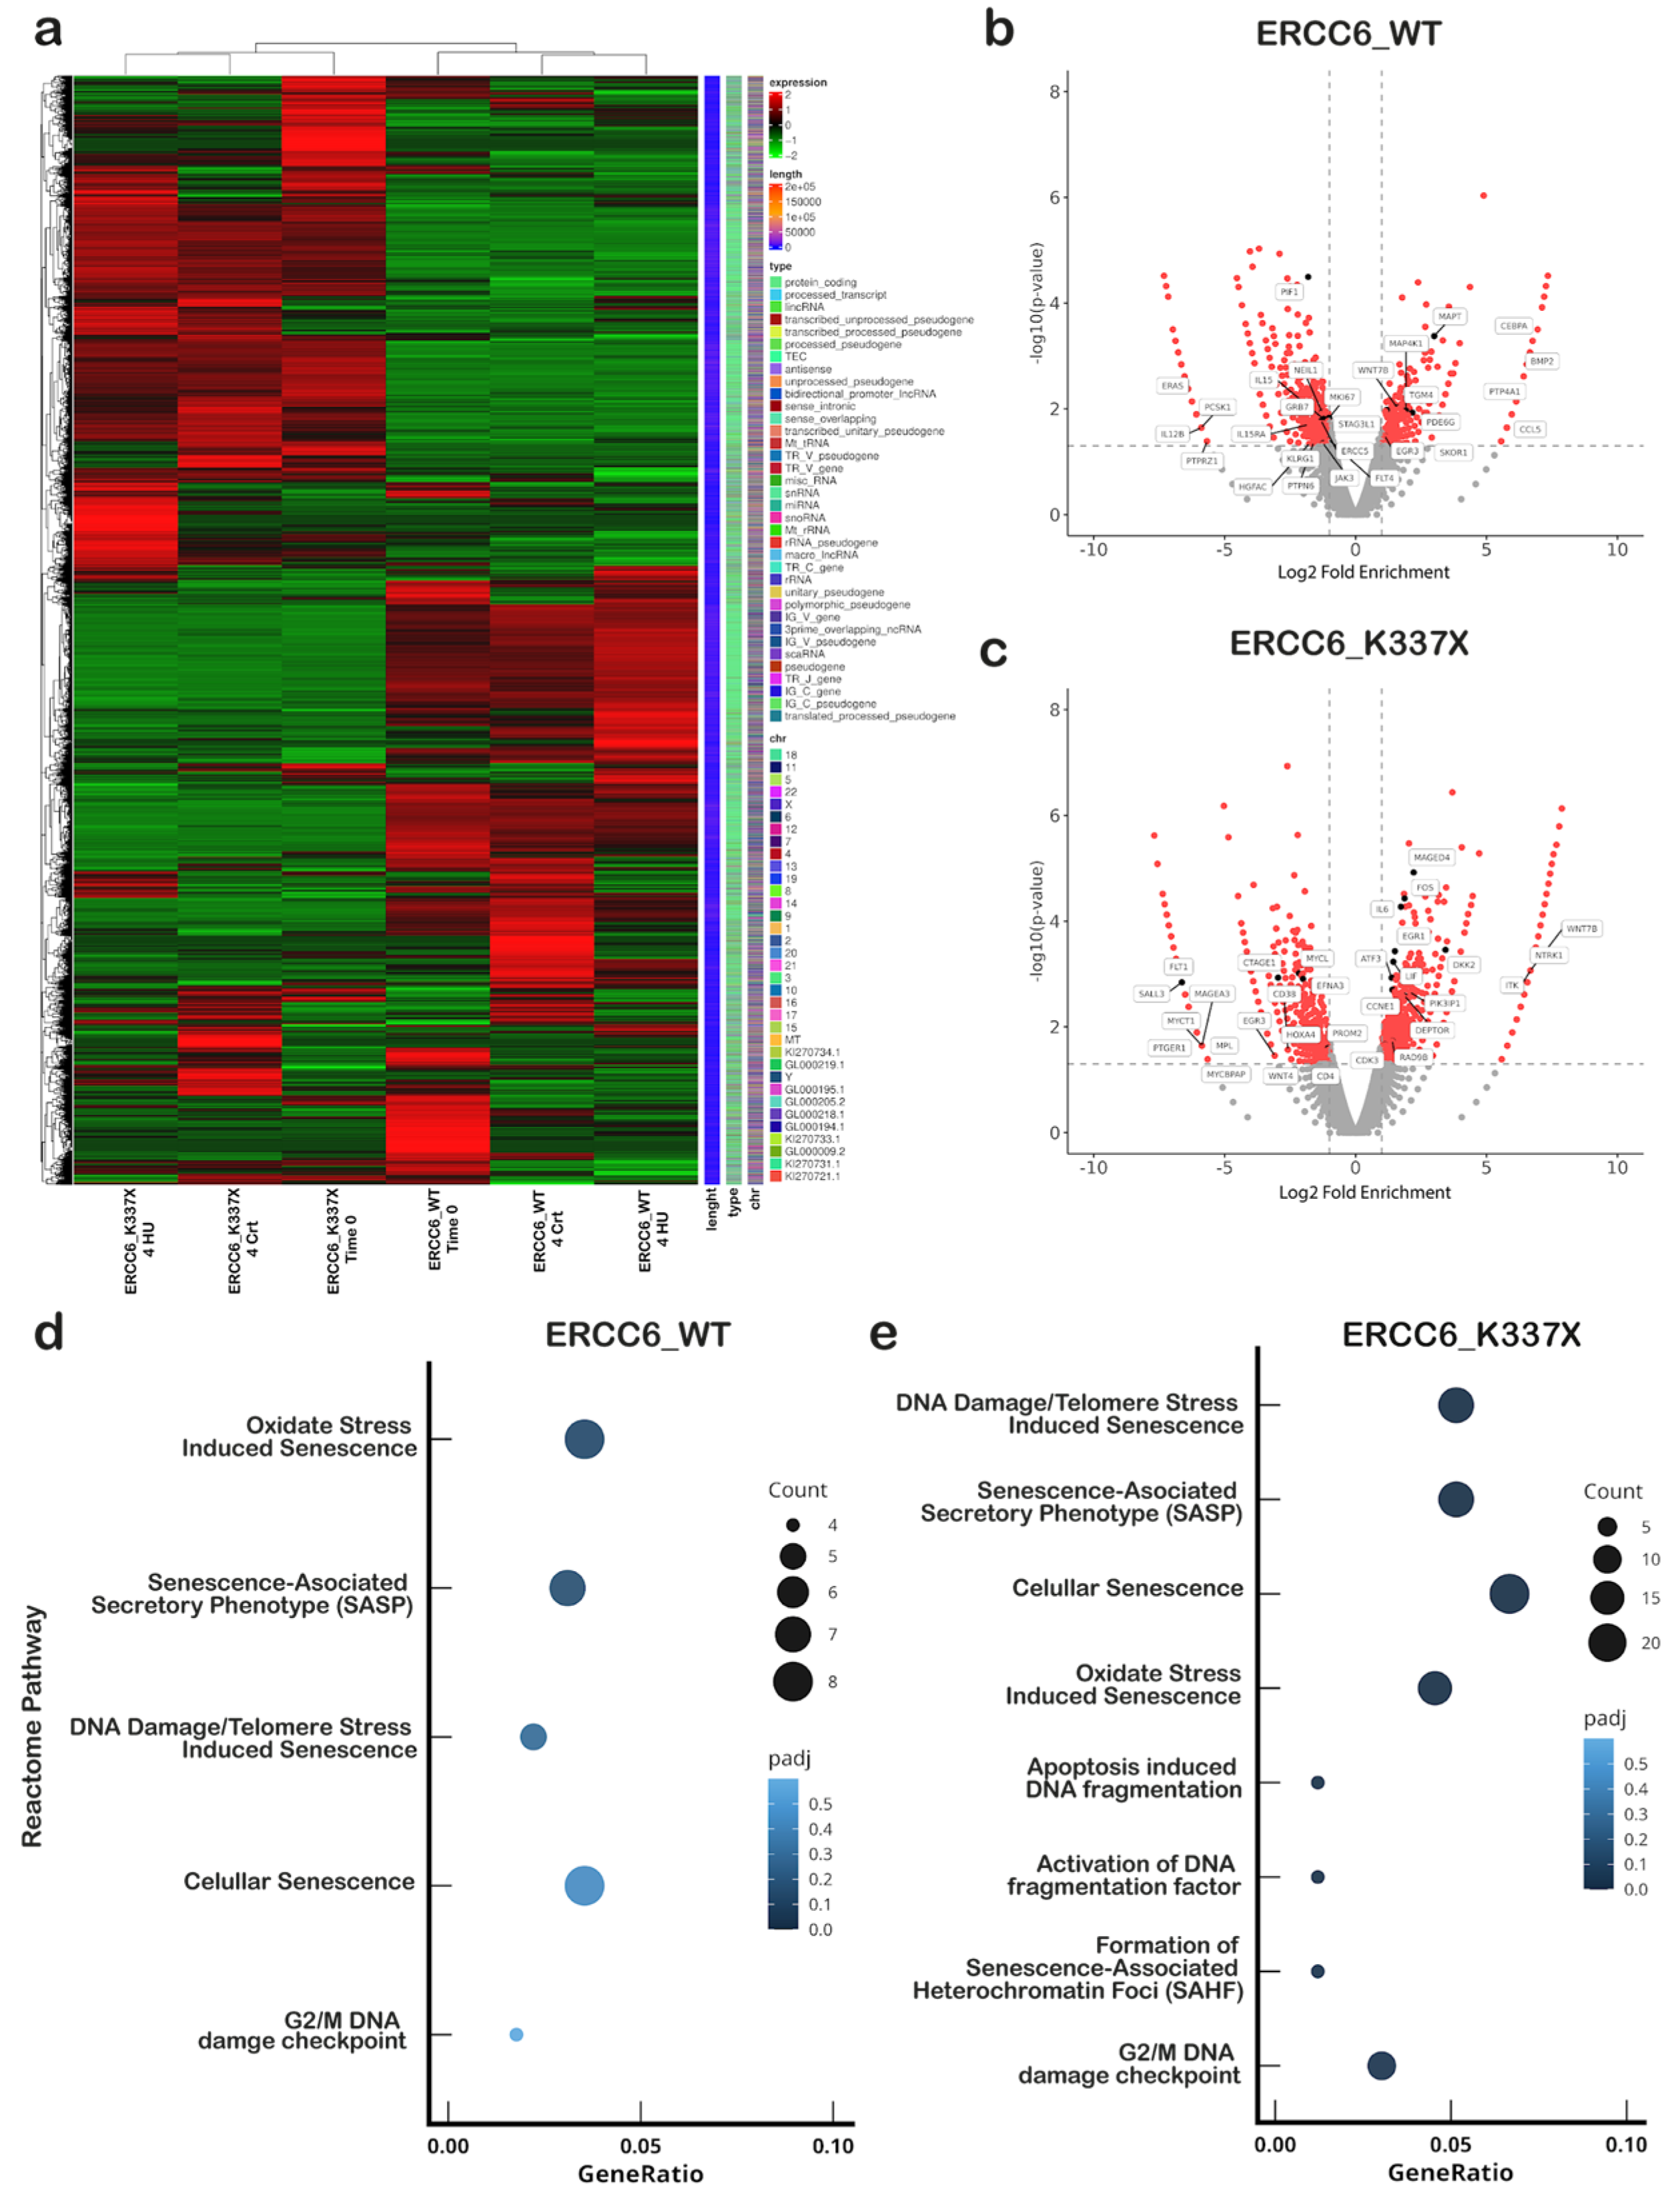
Figure 4.
Replication stress differentially redistributes mutation burden by genomic location depending on ERCC6 status. (a) Variant Allele Frequency (VAF) distributions of SNVs (Single Nucleotide Variants) (left) and Indels (insertion-deletion) (right) across ERCC6_WT and ERCC6_K337X cells under basal conditions (T0), HU (4 h), matched controls (4 h Ctrl), recovery (72 h post-HU), and its corresponding control (72 h Ctrl). Differences in distribution between WT and K337X cells were assessed using the Kolmogorov–Smirnov test. (b) Mutations grouped into Tier 1 (genic regions: exonic, intronic, UTRs, splicing-associated, upstream/downstream) and Tier 2 (intergenic) categories and further stratified by variant allele frequency ranges (<0.1; 0.1–0.4; 0.4–0.6; 0.6–0.85; >0.85). Bars represent the Δ mutation count (HU 4 h − Ctrl 4 h) for WT and K337X. (c) SNVs (left) and Indels (right) with Δ mutation counts restricted to specific genomic categories that showed HU-dependent changes (Downstream, Exonic, UTR3, UTR5). Values represent Δ positive of 72 h recovery after 4 hr HU − 72 h Ctrl.
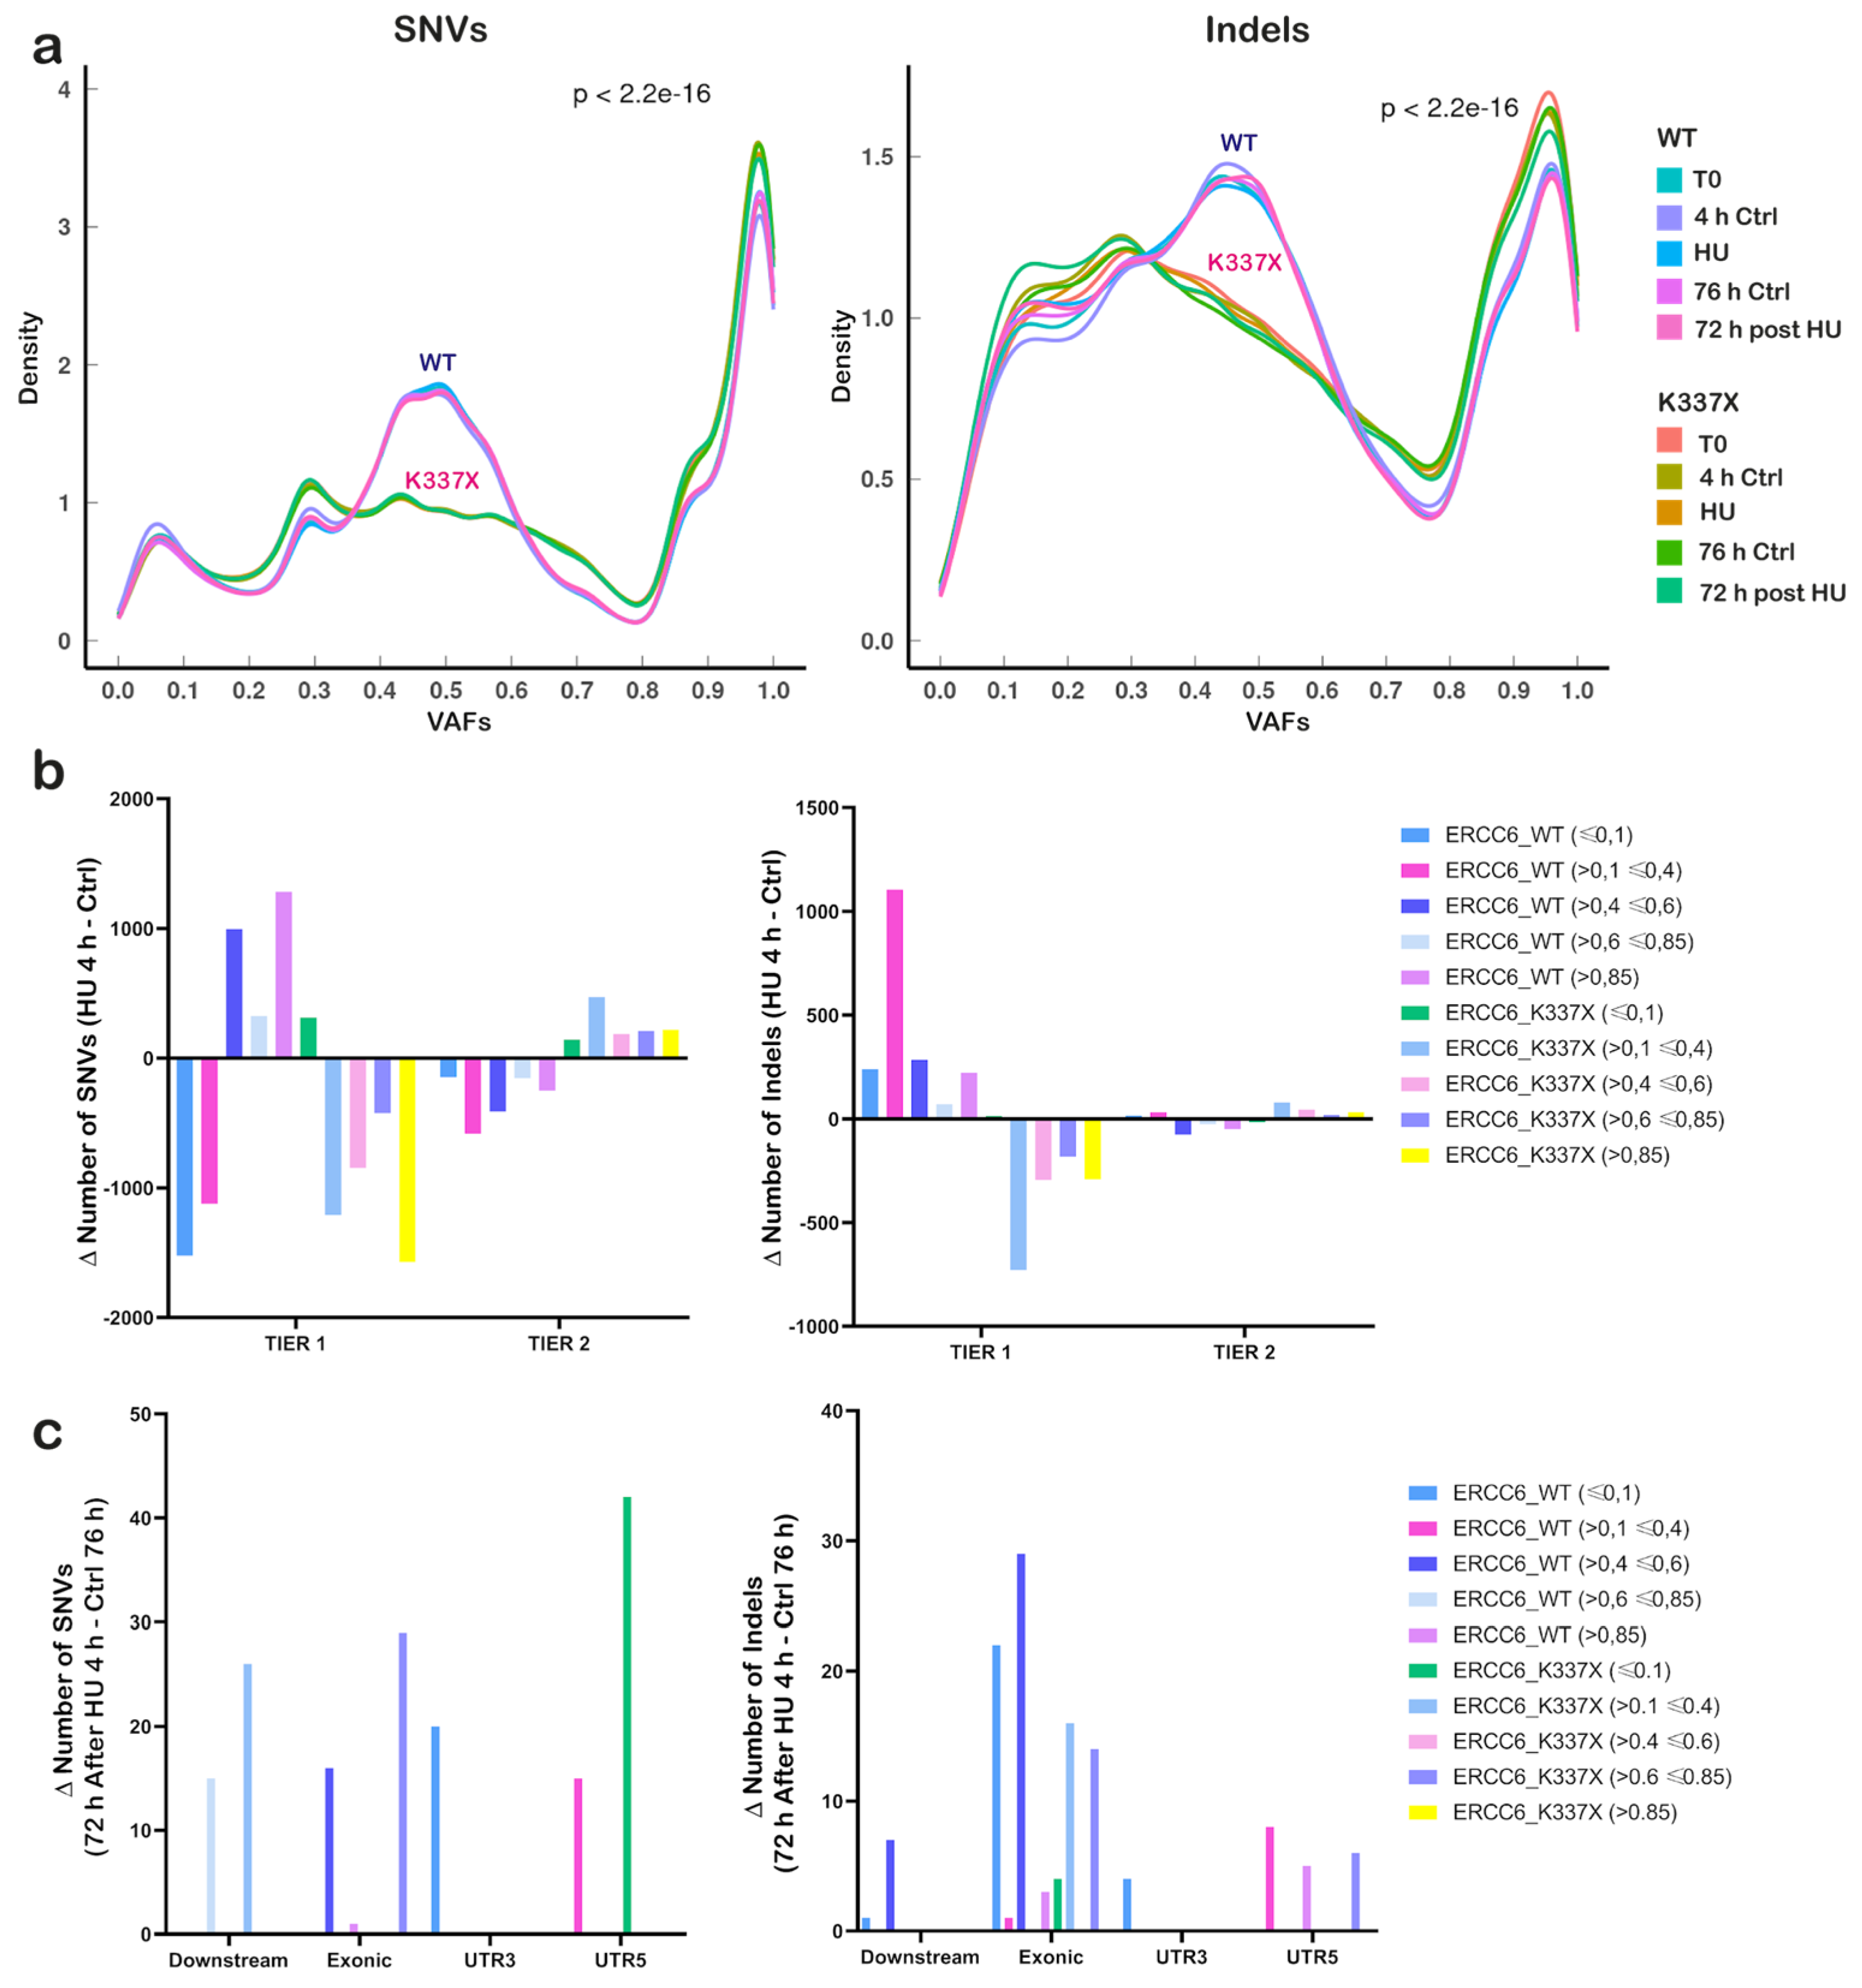
Figure 5.
Transcription-dependent mutation patterns differ between ERCC6-proficient and deficient cells. (a–c) Spearman correlation between gene transcriptional activity (expressed as log10(FPKM + 1)) and mutation counts (expressed as log10(mutation count + 1)) for highly expressed genes (top expression quartile, Q4) in control (a) and HU (b) conditions. In (e), only genes showing Δ ≥ 3 mutations relative to control were included, isolating stress-induced mutation gains. (c) Recovery (72 h post-HU), with mutation changes referenced to matched 72 h Ctrl, while expression corresponds to the HU (4 h) transcriptional state, reflecting the transcriptional environment in which mutagenesis was established. Rho and p values indicate Spearman correlation significance. WES and RNAseq was performed on a single biological sample per condition (n=1). Statistical comparisons were conducted at the variant level.
Disclaimer/Publisher’s Note: The statements, opinions and data contained in all publications are solely those of the individual author(s) and contributor(s) and not of MDPI and/or the editor(s). MDPI and/or the editor(s) disclaim responsibility for any injury to people or property resulting from any ideas, methods, instructions or products referred to in the content. |
© 2025 by the authors. Licensee MDPI, Basel, Switzerland. This article is an open access article distributed under the terms and conditions of the Creative Commons Attribution (CC BY) license (https://creativecommons.org/licenses/by/4.0/).
Copyright: This open access article is published under a Creative Commons CC BY 4.0 license, which permit the free download, distribution, and reuse, provided that the author and preprint are cited in any reuse.


