
Submitted:
10 December 2025
Posted:
11 December 2025
You are already at the latest version
Abstract
Background/Objectives: Mechanisms underlying treatment resistance in hematopoietic malignancies such as acute lymphoblastic leukemia (ALL) include: 1) enhanced activity of anticancer drug efflux mechanisms (MRP1); 2) suppressed activity of anticancer drug influx mechanisms (ENT-1); 3) enhanced drug detoxification activity (AKR1B10, AKR1C3, CYP3A4); 4) influence of the tumor microenvironment (GRP94) etc. We conducted this study to comprehensively and clinically examine treatment resistance due primarily to a decrease in the tumor intracellular anticancer drug concentrations.
Methods: The subjects were 19 ALL patients who underwent initial induction therapy with alternating Hyper CVAD/MA therapy. Antibodies against 23 types of treatment resistance-associated proteins were used for immunohistochemical analysis of tumor specimens obtained from the patients, and correlations between the results of immunohistochemistry and the overall survival (OS) were retrospectively analyzed using the Kaplan-Meier method.
Results: Based on the patterns of expression of the enzymes involved in treatment resistance, we classified the patients (Urayasu classification for ALL, which we believe would be very useful for accurately stratifying patients with ALL according to the predicted prognosis), as follows: Good prognosis group; n =1, 5%: AKR1B1(+)/AKR1B10(-), 5-year overall survival (OS), 100%; Intermediate prognosis -1 group; n= 9, 5%: AKR1B1(-)/AKR1B10(-) plus MRP1(-), 5-year OS, 68%; Intermediate-2 prognosis group; n = 6.3%: AKR1B1(-)/AKR1B10(-) plus MRP1(+), median survival, 17 months, 5-year OS, 20%; Poor prognosis group; n = 3, 16%: AKR1B1(-)/AKR1B10(+), median survival, 18 months, 5-year OS, 0%. n=2.
Conclusions: The Urayasu classification for ALL is considered as being reliable for predicting the prognosis of patients with ALL after the initial Hyper CVAD/MA remission induction therapy.
Keywords:
ALL
; urayasu classification
; prognostic index
; MRP1
; AKR1B10
; AKR1B1 AR1C3
; CYP3A4
; MDR1
; ENT1
1. Introduction
At least eight possible mechanisms underlying treatment resistance in hematopoietic malignancies such as acute lymphoblastic leukemia (ALL) have been reported [1]. 1) enhanced activities of drug efflux mechanisms: extracellular release of many anticancer drugs reduces the intracellular drug concentrations, leading to treatment resistance; 2) suppressed activities of drug influx mechanisms; 3) enhanced activities of drug detoxification pathways; 4) influence of the tumor microenvironment including immune system evasion; 5) presence of cancer stem cells; 6) changes in signaling pathways within the tumor cells: e.g., mutations of specific proteins to which molecular-targeted drugs bind; 7) genetic characteristics of the tumor prior to treatment (initial resistance) and genetic mutations acquired after the start of treatment (acquired resistance); and 8) epigenetic changes. Items 5) to 8) have been extensively studied in the medical field. However, items 1) to 4) have been primarily studied mainly in the pharmaceutical field, and there have been few clinical studies linking these factors to clinical treatment resistance. Furthermore, a few comprehensive evaluation of these topics has been published in the literature. We previously conducted a comprehensive evaluation of the patient survival time after treatment as an indicator of treatment resistance; our results are summarized in references 2-4 by the items 1) to 4).
The purpose of this study is to investigate candidate factors involved in the mechanism of drug resistance at the protein level in acute lymphoblastic leukemia (ALL) cells. The results may lead to stratified treatment for each ALL case in the future, contributing to improved ALL treatment outcomes.
According to the items 1) to 4), we have previously proposed prognostic classifications - the Urayasu Prognostic Classification for large B-cell lymphoma (LBCL) [2], aggressive T-cell lymphoma (TCL) [3], and acute myeloid leukemia (AML) [4] - based on the expression patterns of multiple treatment resistance factors present in the tumor cells even prior to the start of treatment (endogenous drug resistance).
According to the items 1) to 4), we have also proposed a new ALL Urayasu classification based on the combination of multiple (endogenous) protein factors that appear before treatment. We provide a brief explanation of the mechanisms of drug resistance with reference to a review [1]. Herein, we propose the ALL Urayasu classification based on the expression patterns of multiple resistance (endogenous) factors prior to the start of treatment.
According to the prognostic index for international ALL trial: MRC UKALL XII/ECOG E2993 [5], in patients with newly diagnosed ALL, presence of the Philadelphia chromosome (Ph) indicates a poor prognosis. In patients who test negative for Ph, the prognosis is related to age over 35 years, an elevated white blood cell count (over 30,000/μL for B-ALL and over 100,000/μL for T-ALL), and complete remission within 4 weeks.
About the protein level in patients with acute lymphoblastic leukemia (ALL) in the literature, we explains the protein level as follows:
1-1.Angiogenesis and vascular hyperplasia due to extracellular release of microenvironmental factors and escape from the immunosurveillance mechanism
1-1-1. Non-immune microenvironmental factors: Factors that facilitate overcoming stress conditions such as hypoxia and hypoglycemia in the tumor microenvironment.
GRP94 exists mainly in the endoplasmic reticulum and/or mitochondria. It is secreted outside the cell and regulates apoptosis, inflammation, and angiogenesis [6]. Upregulation of GRP94 has been observed in various cancers, including multiple myeloma, suggesting the clinical significance of developing treatment agents that can selectively target GRP94 [7].
GRP78 is mainly expressed in the endoplasmic reticulum. The expression of GRP78 is known to be associated with cancer and is a potential therapeutic target as well [8]. Expression of this protein has been identified in pediatric patients with high-risk B-cell acute lymphoblastic leukemia (B-ALL) [9]. It has been reported that combined GRP78, CAR-T cell + dasatinib therapy can substantially enhance its effector function [10].
TGFβ1 is involved in cell growth and differentiation, apoptosis, angiogenesis, and cellular immunity. In the early stages of cancer development, it inhibits cell transformation and prevents progression of cancer, whereas in the later stages, it promotes tumor progression through inducing mesenchymal transition, triggering angiogenesis, and inducing immunosuppression [11]. Failure of regulation of the TGFβ1 pathway has been reported in many hematological malignancies, including ALL and malignant lymphoma [12].
1-1-1-4. Tumor Necrosis Factor-α1 (TNFα1) [13]
TNFα is associated with decreased survival in patients with AML [13]. We previously reported that fibrosis due to TGF-β1 and TNFα1 produced by hematopoietic malignancies is associated with poor prognosis [14]. Soluble TNF initiates TNFR1 signaling, but not TNFR2 signaling, despite binding to its receptor [15]. TNFR1 is expressed in AML and promotes tumor cell proliferation [16]. In ALL, TNFR1 and caspase-10 induce cell death [17].
1-1-2. Immune Microenvironment Factors (3 Types) 1-1-2-1 Programmed Cell Death-1 (PD-1) (CD279) [18]
1-1-2-2 Programmed Cell Death-Ligand 1 (PD-L1, CD274) [19] PD-L1 expression is known to be associated with poor prognosis in ALL.
1-1-2-3 Programmed cell death-ligand 2 (PD-L2, CD273) [20] Expression of PD-1/PD-L1,2 on the surface of AML tumor cells is important. Patients benefit from immune checkpoint inhibitor therapy.
1-2. Decreased drug uptake activity
Equilibrative nucleoside transporter 1 (ENT1) increases drug uptake [21].
In patients with T-ALL, a decrease in tumor ENT1 expression could decrease cytarabine influx, resulting in treatment resistance.
1-3. Enhanced drug elimination activity
1-3-1. Multidrug Resistance 1 (MDR1) [22]: MDR1 is a molecular marker for predicting prognosis in ALL patients. 1-3-2. Multidrug Resistance-Associated Protein 1 (MRP1) [23]: MRP1 expression has a significant impact on the survival of ALL patients. 1-3-3. Multidrug Resistance-Associated Protein 4 (MRP4) [24]: MRP4 suppresses tumor growth and may be a promising target for novel drug therapies. 1-4. Alterations in Drug Metabolic Activity 1-4-1. Cytochrome P450 3A4 (CYP3A4) [25]: CYP3A4 plays a role in the metabolism of many therapeutic drugs. 1-4-2. CYP2B6 [26]: CYP2B6 mutations are associated with risk in patients with acute leukemia. 1-4-3. Aldo-keto reductase family 1 member C3 (AKR1C3) [27]: In acute leukemia (ALL), intracellular AKR1C3 degrades doxorubicin, leading to treatment resistance. 1-4-4. AKR1B1 [28]: AKR1B1 is structurally very similar to AR1B10, and the two competitively inhibit each other. 1-4-5. AKR1B10 [29]: The intracellular concentration of daunomycin in tumor cells is reduced, primarily by the presence of AKR1C3, as are the intracellular concentrations of idarubicin, but the reduction is only about one-fifth. AKR1B10 reduces the intracellular concentrations of not only daunomycin but also idarubicin. AKR1B10 catalyzes the reduction of the carbonyl group of intracellular daunomycin and idarubicin, converting these drugs to water-soluble, inactive alcohols. Like AKR1C3, it is involved in cisplatin resistance and also plays a role in cyclophosphamide resistance. AKR1C3 is also associated with methotrexate and vincristine resistance. AKR1B10 expression is controlled by a gene on chromosome 7q33. Chromosome 7 deletion results in dysregulated AKR1B10 expression and enhanced function. The Bcr-Abl tyrosine kinase inhibitor dasatinib regulates AKR1B10 expression and inhibits the metabolism of daunomycin and idarubicin, making it a promising treatment for AML. [30] The tyrosine kinase inhibitor ibrutinib regulates AKR1C3 expression and inhibits doxorubicin metabolism, making it a promising treatment for AML. 1-5. Other functional proteins 1-5-1. Thymidine phosphorylase (TP) [31]: Expression of TP is involved in tumor cell resistance to malnutrition, and in angiogenesis, invasion, and metastasis in lymphoma. Its anti-apoptotic and angiogenic effects result in poor prognosis.
1-5-2. P53 [32]: A more rigorous characterization of the resistance profiles and responses to therapy of TP53-mutated ALL is required before its clinical relevance can be established.
1-5-3. MYC [33]: An essential ERG- and c-MYC-dependent transcriptional network involved in the regulation of metabolic and ribosome biogenesis pathways in BCR::ABL1 B-ALL, from which previously unidentified vulnerabilities and therapeutic targets may emerge.
2. Materials and Methods
The flowchart for the method is as follows: 40 thin, serial sections are prepared as unstained specimens from paraffin blocks used to preserve bone marrow pathology biopsy specimens taken at the time of diagnosis from acute lymphoblastic leukemia (ALL) patients who underwent HyperCVAD therapy at our hospital. HE staining is performed on the unstained specimens, and immunohistochemistry specimens are prepared using each antibody. Two pathologists examine the specimens microscopically to determine whether each antibody is positive (over 50%) or negative (under 50%). If the determinations differ, a decision is reached through discussion. The statistical correlation between the positivity of each antibody and the survival time of each case is determined using the Kaplan-Meier method.
2.1. Patients and Sample Collection
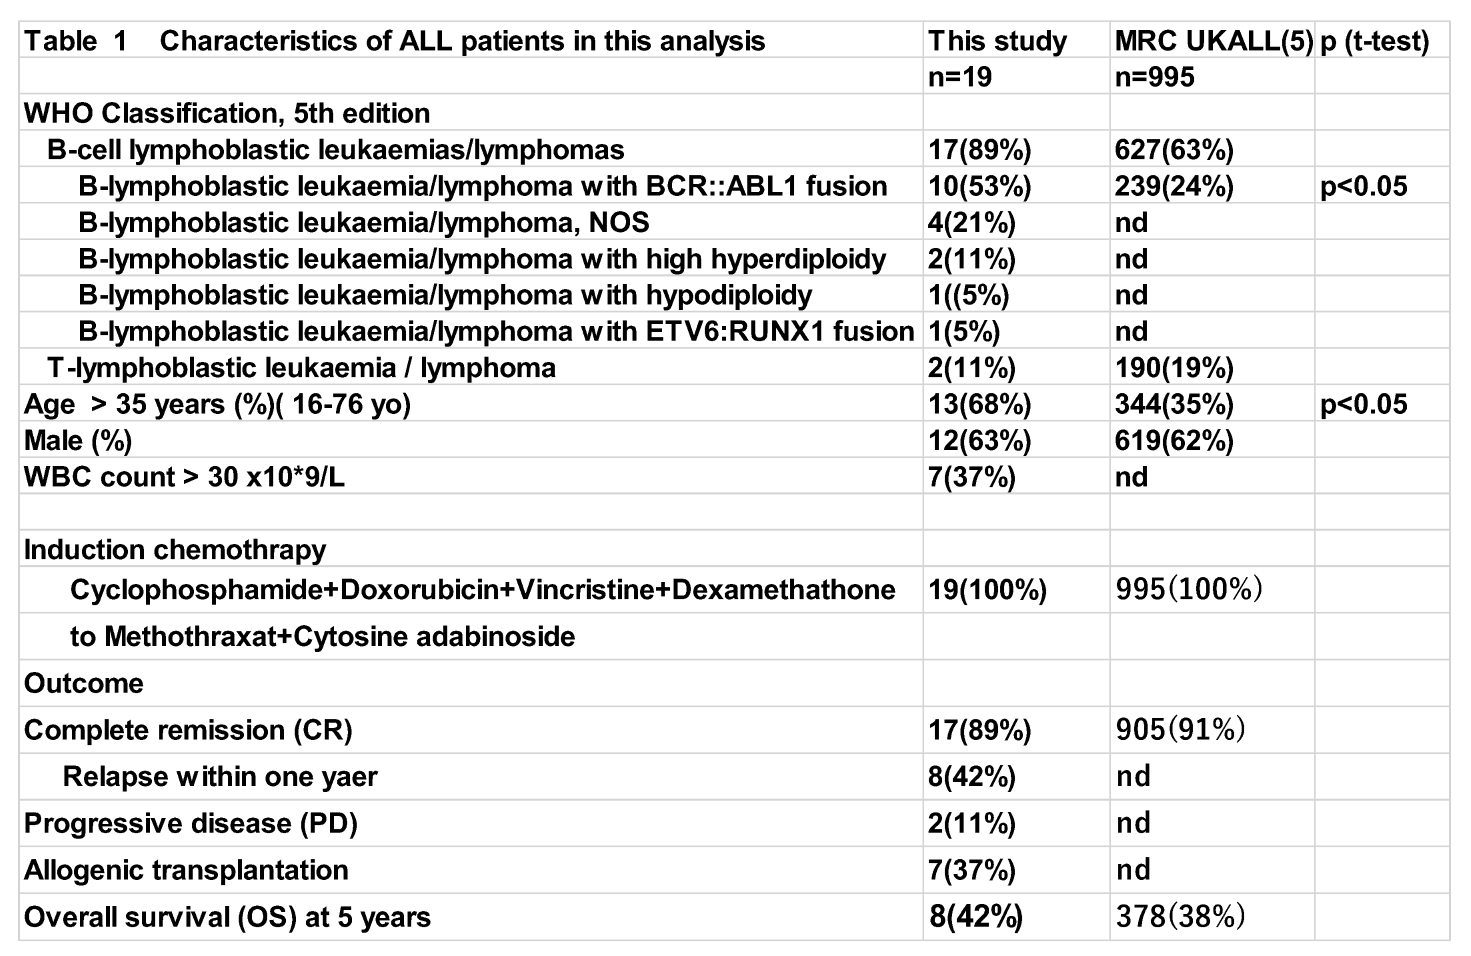
This study enrolled 19 ALL patients who received standard Hyper CVAD/MA combination therapy as initial induction therapy at our hospital between 2015 and 2020. The distribution of patient disease types is shown in Table 1. Pretreatment paraffin-embedded biopsy specimens from patients were subjected to immunohistochemistry (IHC) to examine the expression of 23 proteins previously reported as treatment resistance factors. Positive and negative staining was determined by light microscopy. Data were collated and analyzed retrospectively. Analytical models included variables such as anticancer drug metabolism factors, and overall survival (OS) after induction therapy was compared using the log-rank test. The MRC UKALL XII/ECOG classification [5] was used for comparison. The approval code for this study by our hospital’s ethics committee was U17-0016, and it was approved on December 9, 2022.
2.2. Immunohistochemistry
Histochemical staining (IHC) was performed. Primary antibodies against key proteins involved in anticancer drug metabolism were used: (1) GRP94: Proteintech (Rosemont, IL, USA), clone 1H10B7 (monoclonal antibody); (2) CYP3A4: Sigma-Aldrich (St. Louis, MO, USA), SAB1400064 (polyclonal antibody against CYP3A4); (3) AKR1C3: Proteintech 11194-1-AP (polyclonal antibody against AKR1C3); (4) MDR1 (P-glycoprotein): Proteintech, 22336-1-AP (polyclonal antibody against MDR1); (5) MRP1 (CD9): Proteintech, 60232-1-IG (monoclonal antibody against full-length MRP1); (6) TGF-beta1: Proteintech, 21898-1-AP (polyclonal antibody against TGF-beta); (7) GRP78: Proteintech, 66574-1-IG (monoclonal antibody against full-length GRP78); (8) Glutathione S-transferase-κ1 (GST): Proteintech, 14535-1-AP (polyclonal antibody against GST1); (9) Thymidine phosphorylase: Abcam (Cambridge, UK), ab226917 (polyclonal antibody); (10) MRP4 (ABCC4): SANTA CRUZ BIOTECHNOLOGY (Dallas, TX, USA), SC-376262 (monoclonal antibody against MRP4); (11) CYP2B6: LifeSpan BioSciences, Inc. (Seattle, WA, USA), LS-C352084 (polyclonal antibody against CYP2B6); (12) TNF1-alpha: Sigma-Aldrich, SAB4502982 (polyclonal antibody against TNF1-alpha) (13) PD-1; (14) PD-L1: Proteintech, 66248-1-IG, monoclonal antibody, clone 2B11D11; (15) PD-L2: Proteintech, 18251-1-AP16, rabbit IgG polyclonal antibody; (16) P53: Cell Signaling Technology, Inc. (3 Trask Lane, Danvers, MA, USA), DO-7 mouse monoclonal antibody #48818; (17) c-MYC: Abcam (Kendall Square, Cambridge, MA, USA), Y69 clone ab32072; (18) ENT-1 (equilibrative nucleoside transporter 1): Proteintech, 1337-1-AP, IgG polyclonal antibody. (19) AKR1B1: Sigma-Aldrich (3050 Spruce Street, Saint Louis, MO, USA), polyclonal antibody HPA052751. (20) AKR1B10: Sigma-Aldrich (3050 Spruce Street, Saint Louis, MO, USA), monoclonal antibody HPA020280. After immunostaining, two pathologists definitively interpreted the IHC staining results. IHC staining was considered positive if 50% or more of the tumor cells showed positive staining. The agreement rate between the two pathologists was approximately 81%. In cases of disagreement, the final diagnosis was made by consensus.
Polyclonal antibodies bind to multiple epitopes, which means they are more prone to inherent variability than monoclonal antibodies. However, by taking the following measures, we can significantly improve the consistency of immunohistochemistry (IHC) results: standardizing and strictly adhering to protocols, quality control of antibodies and addressing batch-to-batch differences, thorough controls, and using automated stainers. By combining these measures, we can significantly improve the consistency of IHC results, even when using polyclonal antibodies.
Optimizing IHC markers involves appropriately setting the following experimental conditions to specifically and efficiently detect the target antigen. Please contact us and we will provide you with detailed information on antigen retrieval methods, primary antibody dilution ratios, and blocking conditions. Positive controls can also be provided.
2.3. Statistical Analysis
To confirm the association between the OS and poor prognostic factors/factors involved in anticancer drug metabolism after the initial Hyper CVAD/MA therapy, survival curves were plotted by the Kaplan–Meier method, and factors significantly associated with the OS were evaluated by the log-rank test. The significance level in the statistical tests was set at 0.05 (two-tailed), and p < 0.05 was considered as being indicative of a statistically significant difference. Statistical analyses were performed using EZR version 2.7-1 software (Saitama Medical Center, Jichi Medical University, Saitama, Japan) [36].
If the sample size is too small, even if the log-rank test produces a "significant" result (usually a p-value of less than 0.05), the results may be unreliable. As a countermeasure, this study clarified that more data is needed to draw conclusions. We focused on presenting survival curves and visually illustrating the trends in the data as case report article.
Multiple comparisons were not considered because of the exploratory nature of this study.
3. Results
Abbreviations: yo; years old; Ph: Philadelphia chromosome; WBC: white blood cell;CR: complete remission; PD: progressive disease, nd: not described
Table 1 compares the prognostic factor classification stratification study of the international ALL trial: MRC UKALL XII/ECOG E2993, published in Blood in 2005 (reference 5). Table 1 shows no significant difference in 5-year survival rate between the two. The proportion of Philadelphia chromosome-positive patients in this study was significantly higher than in the MRC UKALL study.
3.1. Comparison of Survival Times Between Groups Using Kaplan–Meier Survival Curves and the Log-Rank Test
When comparing survival times in Figure 1, the Philadelphia chromosome-positive group (high-risk group in the MRC UKALL classification) was compared with the negative group (Figure 1B), and the high-risk group within the Philadelphia chromosome-negative group was compared with the other groups (Figure 1C). In other words, the ALL cases in this study were not well classified using the MRC UKALL classification.
3.1.1. Overall survival time of ALL patients (various prognostic factors) The median overall survival time for 19 patients was 57 months after initial induction therapy, and the 5-year overall survival rate was 44% (Figure 1). Overall survival time was compared using the log-rank test in relation to whether tumor cells were positive/negative for anticancer drug metabolic factors.There were no significant differences in the OS rates among the three patient groups classified according to the ALL MRC UKALL classification or between the groups that did and did not undergo allogeneic stem cell transplantation. However, a significant difference in the relapse rate within one year was seen between these latter two groups of patients.
3.1.2. Overall survival (OS) of ALL patients according to the presence or absence of prognostic factor expression after immunohistochemical staining. As shown in Figure 2, a log-rank test was performed to compare the overall survival (S) of ALL patients classified by the expression of anticancer drug-metabolizing enzymes and pumps. Significant differences were observed in the expression of AKR1B10 and AKR1C3. However, no significant differences in overall survival (OS) were observed between patients expressing AKR1B1, MRP1, PD-L2, or CYP2B6.
In summary, the results of univariate analyses showed that the decrease in OS rates differed significantly between patients showing positive/negative tumor cell expressions of (A) AKR1B10 (p<0.05), (B) AKR1C3 (p<0.05), (C) AKR1B1 (a competitive inhibitor of AKR1B10) (NS), (D) MPR1 (NS), (E) PD-L2 (NS), and (F) CYP2B6 (NS).
3.1.3. Univariate analysis of histological immunostaining revealed that the overall survival rate of ALL patients differed depending on the presence or absence of each of the two prognostic factors (Figure 3). The overall survival rate significantly differed between patients with different patterns of the enzymes AKR1C3, AKR1B10, AKR1B1 (which competitively inhibits AKR1B10), the pump MRP1, and the Philadelphia chromosome. The survival rates also differed significantly between patients with different combinations of AKR1C3 and AKR1B10 expression, AKR1B1 and AKR1B10 expression, AKR1B10 and CYP2B6 expression, MRP1 and AKR1C3 expression, and Philadelphia chromosome status and AKR1C3.
3.2. Urayasu Classification for ALL
As shown in Figure 4, we propose the Urayasu classification of ALL based on the expression of not only MRP1 but also treatment resistance factors (AKR1B1 and AKR1B10), as follows:
Group 1 (good prognosis group): AKR1B1(+) AKR1B10 (-), n =1
Group 2: AKR1B1(-) AKR1B10(-) MRP(-), n=9
Group 3: AKR1B1(-) AKR1B10(-) MRP(+), n=6
(Group 2 and Group 3 showed a more favorable prognosis than Group 4)
Group 4 (poor prognosis group): AKR1B1(-) AKR1B10(+), n=3. Significant differences in the OS rates were observed among the four groups. These results are also shown in Table 2.
Although the number of cases was small and this classification is only for reference, the Urayasu Classification in Figure 4 showed significant differences in survival time among the four groups, making it possible to stratify patients. This is very interesting.
Table 2 shows the results of immunohistochemical analysis for 23 treatment resistance factors. The median survival rate and 95% confidence interval (CI) of ALL19 patients calculated by the Kaplan-Meier method, as well as intergroup comparison (p-value: log rank test) are shown. Poor prognostic factors were evaluated based on the difference in survival time, and significant differences (p<0.05) are marked with a #.The outcomes were compared with those in the three groups of patients classified according to the MRC classification, which is the conventional prognostic classification.
3.3. Case Presentation: Urayasu Classification for ALL (Figure 5A–D)
All figures and tables should be cited in the main text as Figure 1, Table 1, etc.
Figure 5.
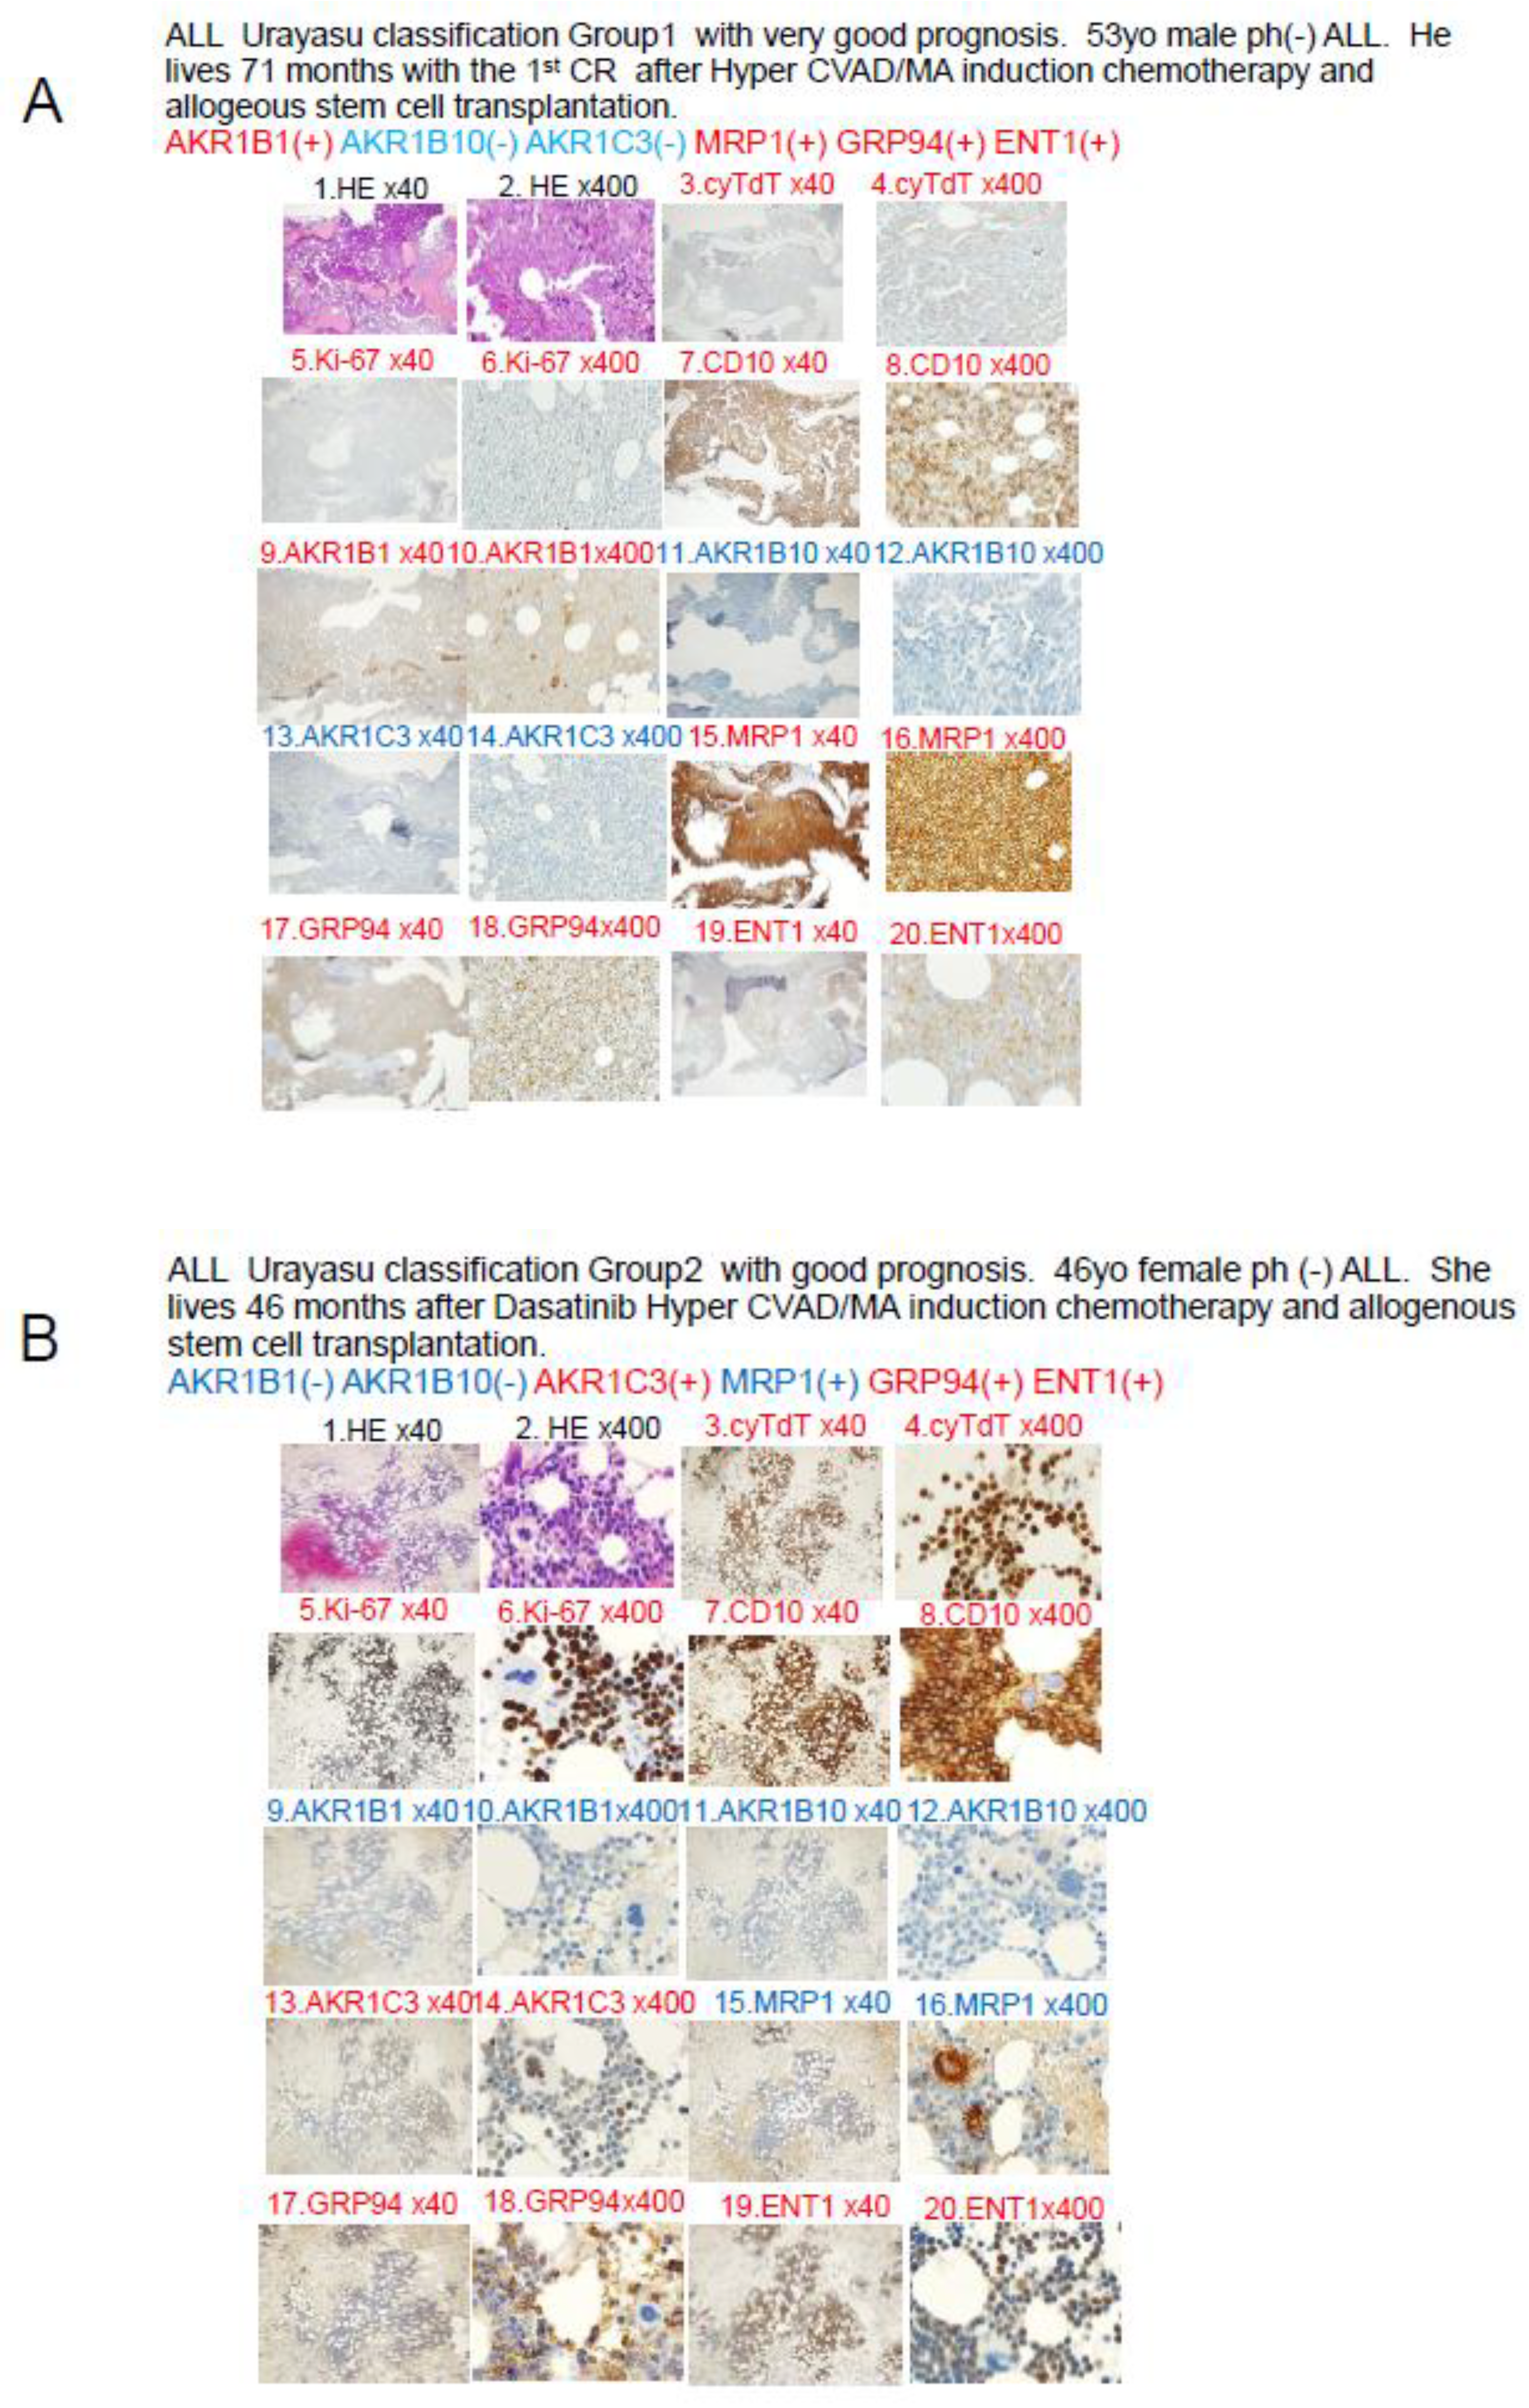
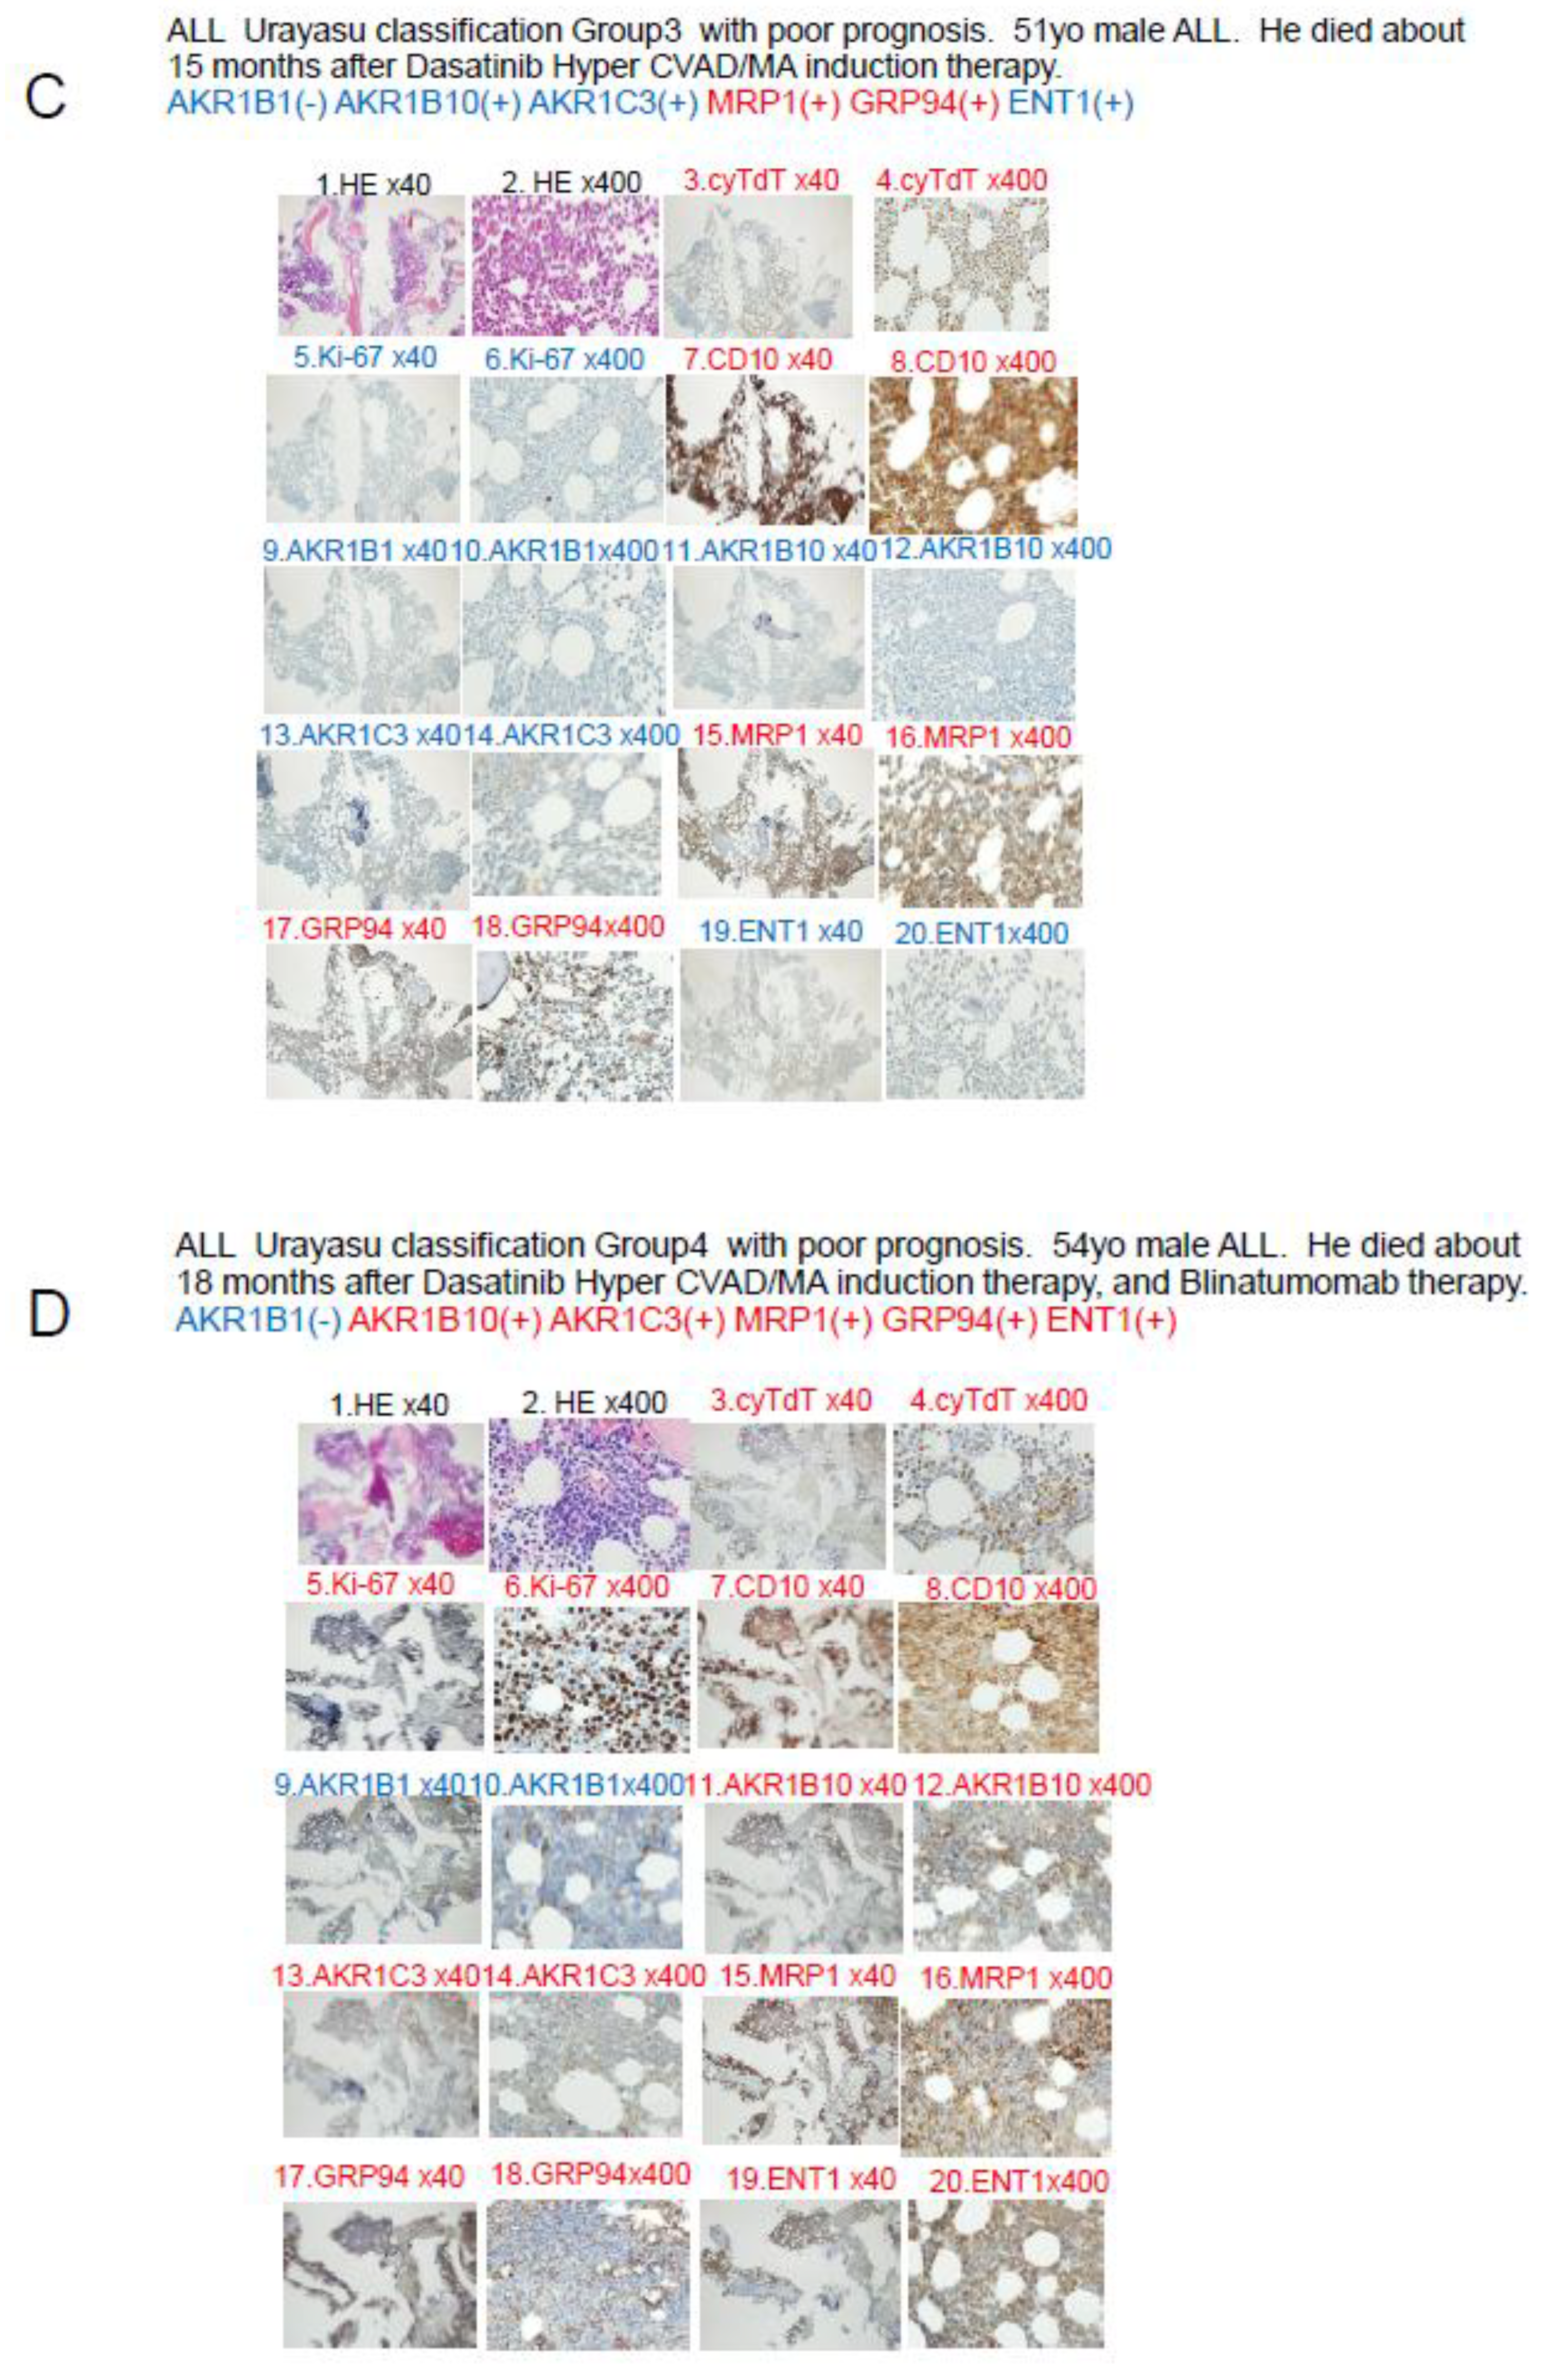
A. Case 1: A 52-year-old male patient. In April 2019, he visited a local doctor with testicular swelling, oral bleeding, and bloody stools. Blood tests showed an elevated WBC count of 100,000/μL, a serum LDH level of 2000 IU, and a reduced PLT count of 8000/μL. The patient was referred to our hospital and was diagnosed based on the results of a bone marrow biopsy as having Philadelphia chromosome-negative B-cell acute lymphoblastic leukemia. Complete remission was achieved with Hyper CVAD chemotherapy. He received consolidation therapy with MA and repeated Hyper CVAD/MA alternating therapy three times. Allogeneic hematopoietic stem cell transplantation was performed in October 2019 and the patient has survived for 71 months since, without recurrence. CVAD is a combination therapy regimen consisting of cyclophosphamide, vincristine, adriamycin (doxorubicin), and dexamethasone. MA is a combination therapy regimen consisting of methotrexate and arabinocytidine (cytarabine). Both TdT and Ki-67 are weakly positive when viewed under magnification, and both TdT and Ki-67 are written in red, which indicates a positive result. B. Case 2: A 46-year-old female patient with Philadelphia chromosome-negative B-ALL. The WBC count was 220,000 at diagnosis, and the patient was classified as high risk according to the MRC ECOG classification. Complete remission was achieved after Hyper CVAD/MA antibody therapy in February 2021. However, the patient developed relapse about 6 months later. Blinatumomab therapy and Hyper CVAD therapy were administered again, but complete remission failed to be achieved. In June 2022, after TBI+CY conditioning, she underwent allogeneic hematopoietic stem cell transplantation and achieved complete remission and has remained alive for 46 months since. C Case 3: A 51-year-old man presented with a history of redness, swelling, and tenderness in his right lower leg. A blood test showed an elevated white blood cell count of 24,700 (blasts 73.5%), and the patient was referred to our hospital, where we diagnosed him as having Philadelphia chromosome-positive acute lymphoblastic leukemia. Complete remission was achieved with Dasatinib + Hyper CVAD/MA therapy. However, relapse occurred. he patient did not wish to undergo allogeneic hematopoietic stem cell transplantation. Instead, he received palliative salvage therapy with ponatinib plus VP, to which he showed poor response. His disease continued to progress and he eventually died in March 2019. D Case 4 A 54-year-old man with Ph-positive ALL. As the initial induction therapy, we administered the tyrosine kinase inhibitor dasatinib + Hyper CVAD/MA therapy, which resulted in complete remission. After a total of four chemotherapy treatments (two each), the disease relapsed approximately six months later. He received ponatinib + Hyper CVAD/MA for treatment of the relapse, but the treatment proved ineffective. As the patient did not wish to undergo allogeneic transplantation, we administered blinatumomab four times and inotuzumab+ozogamicin twice, but these treatments were also ineffective, and the patient died approximately 16 months after the diagnosis. The family refused an autopsy.
Figure 5.
A. Case 1: A 52-year-old male patient. In April 2019, he visited a local doctor with testicular swelling, oral bleeding, and bloody stools. Blood tests showed an elevated WBC count of 100,000/μL, a serum LDH level of 2000 IU, and a reduced PLT count of 8000/μL. The patient was referred to our hospital and was diagnosed based on the results of a bone marrow biopsy as having Philadelphia chromosome-negative B-cell acute lymphoblastic leukemia. Complete remission was achieved with Hyper CVAD chemotherapy. He received consolidation therapy with MA and repeated Hyper CVAD/MA alternating therapy three times. Allogeneic hematopoietic stem cell transplantation was performed in October 2019 and the patient has survived for 71 months since, without recurrence. CVAD is a combination therapy regimen consisting of cyclophosphamide, vincristine, adriamycin (doxorubicin), and dexamethasone. MA is a combination therapy regimen consisting of methotrexate and arabinocytidine (cytarabine). Both TdT and Ki-67 are weakly positive when viewed under magnification, and both TdT and Ki-67 are written in red, which indicates a positive result. B. Case 2: A 46-year-old female patient with Philadelphia chromosome-negative B-ALL. The WBC count was 220,000 at diagnosis, and the patient was classified as high risk according to the MRC ECOG classification. Complete remission was achieved after Hyper CVAD/MA antibody therapy in February 2021. However, the patient developed relapse about 6 months later. Blinatumomab therapy and Hyper CVAD therapy were administered again, but complete remission failed to be achieved. In June 2022, after TBI+CY conditioning, she underwent allogeneic hematopoietic stem cell transplantation and achieved complete remission and has remained alive for 46 months since. C Case 3: A 51-year-old man presented with a history of redness, swelling, and tenderness in his right lower leg. A blood test showed an elevated white blood cell count of 24,700 (blasts 73.5%), and the patient was referred to our hospital, where we diagnosed him as having Philadelphia chromosome-positive acute lymphoblastic leukemia. Complete remission was achieved with Dasatinib + Hyper CVAD/MA therapy. However, relapse occurred. he patient did not wish to undergo allogeneic hematopoietic stem cell transplantation. Instead, he received palliative salvage therapy with ponatinib plus VP, to which he showed poor response. His disease continued to progress and he eventually died in March 2019. D Case 4 A 54-year-old man with Ph-positive ALL. As the initial induction therapy, we administered the tyrosine kinase inhibitor dasatinib + Hyper CVAD/MA therapy, which resulted in complete remission. After a total of four chemotherapy treatments (two each), the disease relapsed approximately six months later. He received ponatinib + Hyper CVAD/MA for treatment of the relapse, but the treatment proved ineffective. As the patient did not wish to undergo allogeneic transplantation, we administered blinatumomab four times and inotuzumab+ozogamicin twice, but these treatments were also ineffective, and the patient died approximately 16 months after the diagnosis. The family refused an autopsy.
3.4. Abstract Schema in This Study
Abstract schema of this study is shown in Figure 6.
3-6 Summarization of the review of the literature (references 1-3) plus findings of this study (Figure 7)
This is a summary of the Urayasu classification based on treatment resistance factors for four aggressive hematopoietic tumors.
4. Discussion
Among the mechanisms of resistance to anticancer drugs in hematopoietic malignancies, those involving a decrease in intracellular anticancer drug concentrations appear to be especially important, although there have been no comprehensive investigations of their association with clinical treatment resistance. In this study, we focused on the following mechanisms that can reduce the intracellular drug concentrations of anticancer drugs: 1) enhanced activities of anticancer drug efflux mechanisms; 2) suppressed activities of drug influx mechanisms; 3) enhanced activities of drug detoxification pathways; and 4) influence of the tumor microenvironment. In the following sections 4-1 to 4-3, we describe our study conducted in 19 cases of ALL (42 cases of LBCL in Reference 2, 16 cases of TCL in Reference 3, and 35 cases of AML in Reference 4) that underwent initial induction therapy at our hospital; we performed immunohistochemical analysis for 23 resistance-associated proteins in tumor specimens obtained from these patients. We retrospectively analyzed the correlations between the OS duration/rate of the patients and results of the immunohistochemical analyses by the Kaplan-Meier method. In section 4-4, we summarize the results of a literature search conducted by us to review the proposed drug resistance mechanisms in hematopoietic malignancies. Based on the clinical study and review of the literature, we have comprehensively demonstrated associations between the mechanisms of treatment resistance involving a decrease in intracellular anticancer drug concentrations and clinical treatment resistance.
4.1. Discussion Based on the Urayasu Classification for ALL Proposed in This Study (Table 1 and Table 2, Figure 1, Figure 2, Figure 3 and Figure 4)
In general, immunohistochemistry is considered as being an extremely useful tool, as it allows for determinations of positive/negative results based on the observation of tumor cells under an optical microscope. Positivity is defined as positive staining, including weakly positive staining, in ≥50% of tumor cells. In this study of ALL patients, we performed immunohistochemical analyses in tumor specimens obtained from 19 cases of ALL for 23 treatment resistance factors (6-34) determined as being clinically important based on a review of the literature (Table 1). In this cohort of ALL patients, there were no significant differences in the OS among patient groups classified according to the MRC UK ALLXIIECOG E2993 classification (Figures1B, C, and D). However, as shown in Figures 4A and 4B, the Urayasu classification for ALL allowed reliable prognostic stratification of the patients, with significant differences in the OS observed among the patients classified into the four groups according to this classification. Therefore, chemotherapy resistance factors are more specific for prognostic classification of ALL. We propose the Urayasu classification (UC) for ALL as a useful classification for predicting the outcomes after Hyper CVAD/MA therapy in newly diagnosed ALL patients (Figures 4A and 4B). The UC for ALL (groups 1 to 4) is shown below. In this study, the overall 5-year OS rate of the patients (n=19) was approximately 43%. The 5-year OS rate of patients (n=1521) classified by the MRC UKALLXIIECOG E2993 classification was approximately 38.5% (5). The 5-year OS rate was 100% in UC Group 1 (favorable prognosis group; AKR1B10(-) AKR1B1(+); n=1) versus 57% in the MRC UKALLXIIECOG E2993- Ph-negative Standard group. The 5- year OS was 48% in UC Group 2 (intermediate-1 prognosis group; AKR1B10(-) AKR1B1(-) MRP1(-); n=9) versus 35% in the MRC UKALLXIIECOG E2993-Ph-negative High group (n=594). The 5-year OS was 20% in UC Group 3 (intermediate-2; AKR1B10(-) AKR1B1(-) MRP1(+); n=6). The 5-year OS rate was 0% in Group 4 (poor prognosis group; AKR1B10(+) AKR1B1(-); n=3). As seen from the above, although the number of cases was small, the UC for ALL allows more reliable prognostic classification of patients into good- and poor-prognosis groups as compared with the UKALLXIIECOG E2993 classification (Figures 1B and 1C). We believe that this classification could contribute to stratification of treatment and promote development of treatment methods based on the mechanisms of treatment resistance.
4.2. Discussion Based on the Study of ALL Cases (Figure 5)
In Case 1 (Figure 5A), the blast cells at the time of diagnosis showed positive IHC staining for the factors known to enhance the therapeutic efficacy AKR1B1 and ENT1. The therapeutic inhibitors were negative for AKR1B10, AKR1C3, and CYP3A4, but positive staining for MRP1. The tumor was negative for AKR1B10 and AKR1C3, and the staining result was negative for enzyme AKR1. The patient was classified into Group 1 of the UC for ALL. The tumor was positive for the metabolic enzyme AKR1B1, suppressed for AKR1B10, and negative for AKR1B10 and AKR1C3. Thus, dasatinib, cyclophosphamide, doxorubicin, vincristine, and methotrexate were expected to be effective, and proved to be effective even in the presence of expression of the efflux pump MRP1. Cytarabine and methotrexate may have been highly effective as the positive tumor cell expression of the influx pump ENT1 would have allowed large amounts of these drugs to be taken up by the tumor cells. It is believed that complete remission was achieved quickly after Hyper CVAD/MA therapy and maintained for a long period of time based on the above pattern of expression of the prognostic factors.
In Case 2 shown in Figure 5B, the blast cells at diagnosis were AKR1B1(-), AKR1B10(-), and MRP1(-), so that the patient was classified into Group 2 of the UC for ALL. In regard to the expressions of drug-metabolic enzymes, the tumor was AKR1B10(-), but showed weakly positive staining for AKR1C3. The weak AKR1C3 positivity resulted in some degree of metabolism of dasatinib, doxorubicin, vincristine, and methotrexate. However, cyclophosphamide was highly effective because of the AKR1B10(-). Furthermore, cytarabine and methotrexate may have been highly effective as the positive tumor ENT1 expression would have allowed large amounts of these drugs to be taken up by the tumor cells. It is believed that the patient achieved complete remission after Hyper CVAD/MA therapy based on the above pattern of expression of the prognostic factors. However, because of the weak tumor cell positivity for AKR1C3, there was residual disease and early recurrence occurred approximately 6 months later. Radiation and cyclophosphamide, which are conditioning treatments for allogeneic hematopoietic stem cell transplantation after relapse, were effective because the tumor cells were negative for AKR1B10, which is a major radiation therapy resistance factor and the main cyclophosphamide-metabolizing enzyme. This is thought to be why the patient achieved long-term complete remission after allogeneic hematopoietic stem cell transplantation.
The blast cells at diagnosis in Case 3 shown in Figure 5C were AKR1B1(-), AKR1B10(-), and MRP1(+), so that the patient was classified into Group 3 of the UC for ALL. In regard to the expressions of drug-metabolic enzymes, the tumor cells were AKR1B10(-) and AKR1C3(-), so that the treatment was effective. However, due to the MRP1 positivity, dasatinib, doxorubicin, vincristine, and methotrexate were excreted from the tumor cells, which may have resulted in unsustained complete remission. The patient eventually developed disease relapse and received ponatinib plus VP therapy, which was not very effective. It was presumed that none of the drugs other than prednisolone was effective, because they were excreted from the tumor cells by the MRP1 pump, which led to disease progression and eventual death of the patient.
In Case 4 shown in Figure 5D, the blast cells at diagnosis were AKR1B1(-) and AKR1B10(+), so that the patient was classified into Group 4 of the UC for ALL. In regard to the expressions of drug-metabolic enzymes, the tumor cells were AKR1B10(+) and AKR1C3(+), and were therefore resistant to treatment. Metabolism of dasatinib, cyclophosphamide, doxorubicin, vincristine, and methotrexate was accelerated, and since the cells were also MRP1(+), these anticancer drugs were also excreted from the tumor cells, resulting in resistance to treatment. However, cytarabine was effective as the positivity of the tumor cells for ENT1(+) would have allowed large amounts of the drug to be taken up by the cells, and unsustained complete remission was achieved at one point. However, thereafter, the patient showed early disease relapse and the tumor burden was large, so that complete remission was not achieved even with ponatinib + Hyper CVAD/MA therapy, and the disease progressed, resulting in the death of the patient.
4.3. Discussion Based on the Study of ALL Cases (Figure 6)
Figure 6 discusses the effects of the expression patterns of the enzymes in Groups 1-4 of the UC for ALL described in Figure 4. For LBCL, TCL, and ALL, for which CHOP-like regimens are often selected as the initial regimens, the expression statuses of the HO (hydroxyl doxorubicin, oncovin)-metabolizing enzymes AKR1C3 and AKR1B10 are important. These enzymes are also involved in methotrexate metabolism. AKR1B10 plays a central role in cyclophosphamide metabolism. Furthermore, it is reasonable to assume that dasatinib has an AKR1B10-inhibitory effect in Ph-positive ALL cases. All drugs but cyclophosphamide are excreted by the MRP1 pump. Cytarabine enters the cells via the ENT-1 pump.
4.4. Discussion Based on the Findings of Both Our Previous Studies [1,2,3] and This Study (Figure 7)
Figure 7 summarizes the prognostic factors for aggressive hematopoietic tumors determined from previous studies (references 1-3) and this present study of ALL. Treatment resistance factors include microenvironmental factors and factors reducing the tumor cell concentrations of anticancer drugs. (1) LBCL: According to reference 1, the median survival time (OS) was 64 months, and microenvironmental factors included a high expression rate of GRP94 (90%) of factors reducing the intracellular concentrations of anticancer drugs (CYP3A4 7%, AKR1C3 62%, AKR1B10 62%, MDR1 40%, MRP1 26%), and of P53 (36%), all of which are treatment resistance factors. (2) TCL: According to reference 2, the OS was 34 months, representing a poor prognosis. Treatment resistance factors were mainly factors related to the tumor microenvironment (GRP94 63%, GRP78 63%, PD-1 31%, PD-L1 24%, TP 19%). Therefore, even if complete remission is achieved with standard chemotherapy alone, recurrence is likely to develop even if there is minimal residual disease containing cells expressing GRP94. In cases where complete remission was not achieved, AKR1C3 (63%) and P53 (13%) could have been involved. (3) AML: According to reference 3, the 5-year OS was 73%. Treatment resistance factors included factors reducing the tumor cell concentrations of anticancer drugs such as P53 (9%), MRP1 (9%), and AKR1B10 (49%). The microenvironment factor GRP94 was expressed at a high frequency of 94%, but it did not have any significant influence on the treatment efficacy. (4) ALL: According to the results of this study, the OS duration was 57 months, indicative of a poor prognosis. Because Hyper CVAD treatment is powerful, many patients achieved temporary complete remission, but many were also at a high risk of relapse. The main treatment resistance factors were factors that reduced the tumor cell concentrations of anticancer drugs, including AKR1B10 %, MRP1 46%, and AKR1C3 37%, which increased the risk of relapse. AKR1B1 is a factor that antagonizes AKR1B10 that enhances the efficacy of chemotherapy and is important in ALL (5%). (5) Common treatment resistance factors: There are no common treatment resistance factors across the four diseases. However, the two common treatment resistance factors across the first three diseases are P53 (LBCL 36%, TCL 19%, AML 9%) and MRP1 (ALL 46%, LBCL 26%, AML 9%).
To gain a deeper understanding of resistance to chemotherapy, molecular-targeted drugs and other therapeutic agents shown in Figure 7.
Based on the results of immunohistochemical analysis, a simple Urayasu 4 classification for ALL has been established for three types of treatment resistance proteins (AKR1B10, AKR1B1, and MRP1). This makes it possible to treat ALL with inhibitors that target the proteins that cause treatment resistance. We hope to verify this by analyzing further cases in the future. Recently, the gut microbiome has been shown to significantly influence the outcome of acute leukemia, especially in patients undergoing hematopoietic stem cell transplantation (HSCT). Disruption of the gut microbiota caused by chemotherapy, antibiotics, and alterations in the immune system contributes to complications such as graft-versus-host disease (GVHD), gastrointestinal disorders, and infections. Further research is needed to optimize microbiome-based therapies and ensure their safety and efficacy in the treatment of acute leukemia. In the future, we would like to investigate other hematological malignancies, elucidate the mechanisms of treatment resistance, and use this information to aid in treatment. (37). I would like to use this in my future research. I added the following text to the discussion section: Like TARGET, there are many publicly available RNA sequencing data sets with complete cytogenetic and outcome data. Although these data only provide RNA-level expression levels of target genes, they would still serve as a good validation set for validating the model.
5. Conclusions
We proposed the Urayasu prognostic classification for ALL. It consists of Group 1 (good prognosis), Group 2 (intermediate prognosis-1), Group 3 (intermediate prognosis-2), and Group 4 (poor prognosis). The use of AKR1B10 and MRP1 inhibitors may improve treatment outcomes in the future.
Author Contributions
Specific contributions of the authors to this paper are as follows: Planning of the study: HT, MN, Conduct of the study: HT, MF, Reporting: HT, MN TO, Conception of the study: HT, MN, Design of the study: HT, MN, CF, Acquisition of data: MF, ST, SK, HA, MO, TS, Analysis and interpretation of the data: HT, MN, MA, TN, HN, HIH, SM.
Funding
This research received no external funding.
Institutional Review Board Statement
Approval number U17-0016-U01 for studies involving humans. The study was conducted in accordance with the Declaration of Helsinki, and approved by the Institutional Ethics Committee ofJuntendo University (protocol code number U17-0016-U01 and December 16 in 2022 of approval) for studies involving humans.
Informed Consent Statement
Any research article describing a study involving humans should contain this statement. Please add “Informed consent was obtained from all subjects involved in the study.
Data Availability Statement
Our articles published in MDPI journals to share their research data.
Acknowledgments
We greatly appreciate the assistance we received from Kotobiken Medical Laboratories Inc. (Tokyo, Japan) for the immunohistochemical analyses.
Conflicts of Interest
The authors declare no conflicts of interest. The results of the study will be made known to the study participants on the homepage of our website.
Patient and Public Involvement
None of the patients was involved in the design of this study. The results of the study will be made known to the study participants on the homepage of our website.
Abbreviations
The following abbreviations are used in this manuscript:
ALL Acute lymphoid leukemia
AML:
CVAD: Cyclophosphamide, vincristine, Adriamycin, dexamethasone
MA: Methotrexate, cytosine arabinoside
OS: Overall survuval
IHC Immunohistochemical staining
MRP1 Multidrug resistance-associated protein 1
AKR1B10 Aldo-keto reductase family 1 member B10
AKR1B1 Aldo-keto reductase family 1 member B1
AKR1C3 Aldo-keto reductase family 1 member C3
CYP2B6 Cytochrome P450 2B6
ELN European Leukemia Net
MRC: Medical Research Council
LBCL Large B-cell lymphoma
TCL Aggressive T-cell lymphoma
GRP94 Glucose-regulated protein 94
GRP78 Glucose-regulated protein 78
AZA: Azacitidine
B-ALL B-cell acute lymphoblastic leukemia
CHO: Cyclophosphamide, Hydroxyl doxorubicin, oncovin
TGFβ1 Transforming growth factor β1
TNFα1 Tumor necrosis factor α1
TNFR Tumor necrosis factor receptor
IMIDs: Immunomodulatory Drugs
PD-1 Programmed cell death-1
PD-L1 Programmed cell death–ligand 1
ENT1 Equilibrative nucleoside transporter 1
MDR1 Multidrug resistance 1
CYP3A4 Cytochrome P450 3A4
TKI Tyrosin kinase inhibitor
TP Thymidine phosphorylase
GST Glutathione sulfate transferase
CR Complete remission
PD Progressive disease
M Months
NS Not significant
Ph: Philadelphia
References
- Bin Emran, T.; Shahriar, A.; Mahmud, A.R.; Rahman, T.; Abir, M.H.; Siddiquee, M.F.-.R.; Ahmed, H.; Rahman, N.; Nainu, F.; Wahyudin, E.; et al. Multidrug Resistance in Cancer: Understanding Molecular Mechanisms, Immunoprevention and Therapeutic Approaches. Front. Oncol. 2022, 12, 891652. [Google Scholar] [CrossRef]
- Nitta, H.; Takizawa, H.; Mitsumori, T.; Iizuka-Honma, H.; Araki, Y.; Fujishiro, M.; Tomita, S.; Kishikawa, S.; Hashizume, A.; Sawada, T.; et al. Possible New Histological Prognostic Index for Large B-Cell Lymphoma. J. Clin. Med. 2023, 12, 6324. [Google Scholar] [CrossRef]
- Nitta, H.; Takizawa, H.; Mitsumori, T.; Iizuka-Honma, H.; Ochiai, T.; Furuya, C.; Noguchi, M. A New Histology-Based Prognostic Index for Aggressive T-Cell lymphoma: Preliminary Results of the “TCL Urayasu Classification”. J. Clin. Med. 2024, 13, 3870. [Google Scholar] [CrossRef]
- Nitta, H.; Takizawa, H.; Mitsumori, T.; Iizuka-Honma, H.; Ochiai, T.; Furuya, C.; Araki, Y.; Fujishiro, M.; Tomita, S.; Hashizume, A.; et al. A New Histology-Based Prognostic Index for Aggressive T-Cell lymphoma: Preliminary Results of the “TCL Urayasu Classification”. J. Clin. Med. 2024, 13, 3870. [Google Scholar] [CrossRef]
- Mitsumori, T.; Nitta, H.; Takizawa, H.; Iizuka-Honma, H.; Furuya, C.; Fujishiro, M.; Tomita, S.; Hashizume, A.; Sawada, T.; Miyake, K.; et al. A New Histology-Based Prognostic Index for Acute Myeloid Leukemia: Preliminary Results for the “AML Urayasu Classification”. J. Clin. Med. 2025, 14. [Google Scholar] [CrossRef]
- Rowe, J.M.; Buck, G.; Burnett, A.K.; Chopra, R.; Wiernik, P.H.; Richards, S.M.; Lazarus, H.M.; Franklin, I.M.; Litzow, M.R.; Ciobanu, N.; et al. Induction therapy for adults with acute lymphoblastic leukemia: Results of more than 1500 patients from the international ALL trial: MRC UKALL XII/ECOG E2993. Blood 2005, 106, 3760–3767. [Google Scholar] [CrossRef]
- Duan, X.; Iwanowycz, S.; Ngoi, S.; Hill, M.; Zhao, Q.; Liu, B. Molecular Chaperone GRP94/GP96in Cancers: Oncogenesis and Therapeutic Target. Front. Oncol. 2021, 11, 629846. [Google Scholar] [CrossRef]
- Lee, A.S. Glucose-regulated proteins in cancer: Molecular mechanisms and therapeutic potential. Nat. Rev. Cancer 2014, 14, 263–276. [Google Scholar] [CrossRef]
- Akinyemi, A.O.; Simpson, K.E.; Oyelere, S.F.; Nur, M.; Ngule, C.M.; Owoyemi, B.C.D.; Ayarick, V.A.; Oyelami, F.F.; Obaleye, O.; Esoe, D.-P.; et al. Unveiling the dark side of glucose-regulated protein 78 (GRP78) in cancers and other human pathology: A systematic review. Mol. Med. 2023, 29, 1–33. [Google Scholar] [CrossRef]
- Angeles-Floriano, T.; Rivera-Torruco, G.; García-Maldonado, P.; Juárez, E.; Gonzalez, Y.; Parra-Ortega, I.; Vilchis-Ordoñez, A.; Lopez-Martinez, B.; Arriaga-Pizano, L.; Orozco-Ruíz, D.; et al. Cell surface expression of GRP78 and CXCR4 is associated with childhood high-risk acute lymphoblastic leukemia at diagnostics. Sci. Rep. 2022, 12, 1–11. [Google Scholar] [CrossRef]
- Hebbar, N.; Epperly, R.; Vaidya, A.; Thanekar, U.; Moore, S.E.; Umeda, M.; Ma, J.; Patil, S.L.; Langfitt, D.; Huang, S.; et al. CAR T cells redirected to cell surface GRP78 display robust anti-acute myeloid leukemia activity and do not target hematopoietic progenitor cells. Nat. Commun. 2022, 13, 1–14. [Google Scholar] [CrossRef]
- Haque, S.; Morris, J.C. Transforming growth factor-β: A therapeutic target for cancer. Hum. Vaccines Immunother. 2017, 13, 1741–1750. [Google Scholar] [CrossRef]
- Timmins, M.A.; Ringshausen, I. Transforming Growth Factor-Beta Orchestrates Tumour and Bystander Cells in B-Cell Non-Hodgkin Lymphoma. Cancers 2022, 14, 1772. [Google Scholar] [CrossRef]
- Idriss, H.T.; Naismith, J.H. TNF alpha and the TNF receptor superfamily: Structure-function relationship(s). Microsc. Res. Tech. 2000, 50, 184–195. [Google Scholar] [CrossRef]
- Takizawa, H.; Araki, Y.; Fujishiro, M.; Tomita, S.; Kishikawa, S.; Hashizume, A.; Mitsumori, T.; Nitta, H.; Iizuka-Honma, H.; Sawada, T.; et al. Role of TGF-beta1 and TNF-alpha1 produced by neoplastic cells in the pathogenesis of fibrosis in patients with hematologic neoplasms. J. Clin. Exp. Hematop. 2023, 63, 83–89. [Google Scholar] [CrossRef]
- Prada, J.P.; Wangorsch, G.; Kucka, K.; Lang, I.; Dandekar, T.; Wajant, H. A systems-biology model of the tumor necrosis factor (TNF) interactions with TNF receptor 1 and 2. Bioinformatics 2020, 37, 669–676. [Google Scholar] [CrossRef]
- Vinante, F.; Rigo, A.; Tecchio, C.; Morosato, L.; Nadali, G.; Ricetti, M.M.; Krampera, M.; Zanolin, E.; Locatelli, F.; Gallati, H.; et al. Serum levels of p55 and p75 soluble TNF receptors in adult acute leukaemia at diagnosis: Correlation with clinical and biological features and outcome. Br. J. Haematol. 1998, 102, 1025–1034. [Google Scholar] [CrossRef]
- Cisterne, A.; Baraz, R.; I Khan, N.; Welschinger, R.; Basnett, J.; Fung, C.; Rizos, H.; Bradstock, K.F.; Bendall, L.J. Silencer of Death Domains Controls Cell Death through Tumour Necrosis Factor-Receptor 1 and Caspase-10 in Acute Lymphoblastic Leukemia. PLOS ONE 2014, 9, e103383. [Google Scholar] [CrossRef]
- Xu, X.; Zhang, W.; Xuan, L.; Yu, Y.; Zheng, W.; Tao, F.; Nemechek, J.; He, C.; Ma, W.; Han, X.; et al. PD-1 signalling defines and protects leukaemic stem cells from T cell receptor-induced cell death in T cell acute lymphoblastic leukaemia. Nat. Cell Biol. 2023, 25, 170–182. [Google Scholar] [CrossRef]
- Cao, H.; Wu, T.; Zhou, X.; Xie, S.; Sun, H.; Sun, Y.; Li, Y. Progress of research on PD-1/PD-L1 in leukemia. Front. Immunol. 2023, 14, 1265299. [Google Scholar] [CrossRef]
- Mortensen, J.B.; Monrad, I.; Enemark, M.B.; Ludvigsen, M.; Kamper, P.; Bjerre, M.; D’Amore, F. Soluble programmed cell death protein 1 (sPD-1) and the soluble programmed cell death ligands 1 and 2 (sPD-L1 and sPD-L2) in lymphoid malignancies. Eur. J. Haematol. 2021, 107, 81–91. [Google Scholar] [CrossRef]
- Takagaki, K.; Katsuma, S.; Kaminishi, Y.; Horio, T.; Nakagawa, S.; Tanaka, T.; Ohgi, T.; Yano, J. Gene-Expression Profiling Reveals Down-Regulation of Equilibrative Nucleoside Transporter 1 (ENT1) in Ara-C-Resistant CCRF-CEM-Derived Cells. J. Biochem. 2004, 136, 733–740. [Google Scholar] [CrossRef]
- Valera, E.T.; Scrideli, C.A.; Queiroz, R.G.D.P.; Mori, B.M.O.; Tone, L.G. Multiple drug resistance protein (MDR-1), multidrug resistance-related protein (MRP) and lung resistance protein (LRP) gene expression in childhood acute lymphoblastic leukemia. Sao Paulo Med. J. 2004, 122, 166–171. [Google Scholar] [CrossRef]
- Jaramillo, A.C.; Cloos, J.; Lemos, C.; Stam, R.W.; Kaspers, G.J.; Jansen, G.; Peters, G.J. Ex vivo resistance in childhood acute lymphoblastic leukemia: Correlations between BCRP, MRP1, MRP4 and MRP5 ABC transporter expression and intracellular methotrexate polyglutamate accumulation. Leuk. Res. 2019, 79, 45–51. [Google Scholar] [CrossRef]
- Brüggemann, M.; Trautmann, H.; Hoelzer, D.; Kneba, M.; Gökbuget, N.; Raff, T. Multidrug resistance–associated protein 4 (MRP4) gene polymorphisms and treatment response in adult acute lymphoblastic leukemia. Blood 2009, 114, 5400–5401. [Google Scholar] [CrossRef]
- Gézsi, A.; Lautner-Csorba, O.; Kovács, G.; Szalai, C. In interaction with gender a common CYP3A4 polymorphism may influence the survival rate of chemotherapy for childhood acute lymphoblastic leukemia. Pharmacogenomics J. 2015, 15, 241–247. [Google Scholar] [CrossRef]
- Xiong, X.; Yu, D.; Gao, Q.; Zhang, Y.; Yin, Q.; Chen, X.; Tong, R. Association between CYP2B6 c. Medicine 2021, 100, 32. [Google Scholar] [CrossRef]
- Verma, K.; Zang, T.; Penning, T.M.; Trippier, P.C. Potent and Highly Selective Aldo–Keto Reductase 1C3 (AKR1C3) Inhibitors Act as Chemotherapeutic Potentiators in Acute Myeloid Leukemia and T-Cell Acute Lymphoblastic Leukemia. J. Med. Chem. 2019, 62, 3590–3616. [Google Scholar] [CrossRef]
- Laffin, B.; Petrash, J.M. Expression of the Aldo-Ketoreductases AKR1B1 and AKR1B10 in Human Cancers. Front. Pharmacol. 2012, 3, 104. [Google Scholar] [CrossRef]
- Penning, T.M.; Jonnalagadda, S.; Trippier, P.C.; Rižner, T.L. Aldo-Keto Reductases and Cancer Drug Resistance. Pharmacol. Rev. 2021, 73, 1150–1171. [Google Scholar] [CrossRef]
- Büküm, N.; Novotná, E.; Morell, A.; Želazková, J.; Laštovičková, L.; Čermáková, L.; Portillo, R.; Solich, P.; Wsól, V. Inhibition of AKR1B10-mediated metabolism of daunorubicin as a novel off-target effect for the Bcr-Abl tyrosine kinase inhibitor dasatinib. Biochem. Pharmacol. 2021, 192, 114710. [Google Scholar] [CrossRef]
- Xiong, X.; Yu, D.; Gao, Q.; Zhang, Y.; Yin, Q.; Chen, X.; Tong, R. Thymidine phosphorylase expression in B-cell lymphomas and its significance: A new prognostic marker? Anal. Quant. Cytopathol. Histpathol. 2013, 35, 301–305. [Google Scholar]
- van Leeuwen, F.N. Therapeutic targeting of mutated p53 in acute lymphoblastic leukemia. Haematologica 2020, 105, 10–11. [Google Scholar] [CrossRef]
- Behrens, K.; Brajanovski, N.; Xu, Z.; Viney, E.M.; DiRago, L.; Hediyeh-Zadeh, S.; Davis, M.J.; Pearson, R.B.; Sanij, E.; Alexander, W.S.; et al. ERG and c-MYC regulate a critical gene network in BCR::ABL1-driven B cell acute lymphoblastic leukemia. Sci. Adv. 2024, 10, eadj8803. [Google Scholar] [CrossRef]
- Baba, S.M.; Pandith, A.A.; Shah, Z.A.; Geelani, S.A.; Bhat, J.R.; Gul, A.; Guru, S.A.; El-Serehy, H.A.; Koul, A.M.; Mansoor, S. GSTT1null and rs156697 Polymorphism in GSTO2 Influence the Risk and Therapeutic Outcome of B-Acute Lymphoblastic Leukemia Patients. Front. Oncol. 2021, 11. [Google Scholar] [CrossRef]
- Davies, S.M.; Robison, L.L.; Buckley, J.D.; Tjoa, T.; Woods, W.G.; Radloff, G.A.; Ross, J.A.; Perentesis, J.P. GlutathioneS-Transferase Polymorphisms and Outcome of Chemotherapy in Childhood Acute Myeloid Leukemia. J. Clin. Oncol. 2001, 19, 1279–1287. [Google Scholar] [CrossRef]
- Kanda, Y. Investigation of the freely available easy-to-use software ‘EZR’ for medical statistics. Bone Marrow Transplant. 2013, 48, 452–458. [Google Scholar] [CrossRef]
- Todor, S.B.; Ichim, C. Microbiome Modulation in Pediatric Leukemia: Impact on Graft-Versus-Host Disease and Treatment Outcomes: A Narrative Review. Children 2025, 12, 166. [Google Scholar] [CrossRef]
Figure 1.
Overall survival rate of ALL patients by prognostic factors. Kaplan-Meier survival curves between the two groups and comparisons of disease and prognostic factors were performed using the log-rank test. Comparison of overall survival (OS) rates after initial induction therapy with Hyper CVAD/MA. (A) For all patients (n = 19), the median OS was 57 months, and the 5-year OS rate was 48%. Red text indicates OS for the ALL leukemia cell immunohistochemistry-positive group with and without prognostic factors, while black text indicates OS for the ALL immunohistochemistry-negative group. (B) No significant difference in OS was observed between the Philadelphia chromosome (Ph)-positive group (n = 9) and the Ph-negative group (n = 10) (not significant [NS]). The median OS rate for the Ph-positive group (n = 9) was 23 months, and the 5-year OS rate was 32%. (C) For Ph-negative patients, there was no significant difference in OS rate between the MRC high-risk positive group (n = 2) and the MRC high-risk negative group (n = 8) (NS). The 5-year OS rate was 100% in the MRC high-risk positive group. (D) There was no significant difference in OS between patients with B-ALL (n = 17) and T-ALL (n = 2) (NS). The median OS duration in the B-ALL group was 70 months, and the 5-year OS was 42%. (E) The group of patients who showed relapse within one year of treatment showed a significantly reduced OS duration and 5-year OS rate (n = 8; median OS, 23 months; 5-year OS rate 16%, p < 0.05). (F) There was no significant difference in the OS rate between patients who underwent (n=7)/did not undergo (n=12) allogeneic stem cell transplantation (NS). The median OS duration in the patients who underwent allogeneic stem cell transplantation was 70 months, and the 5-year OS rate was 40%.
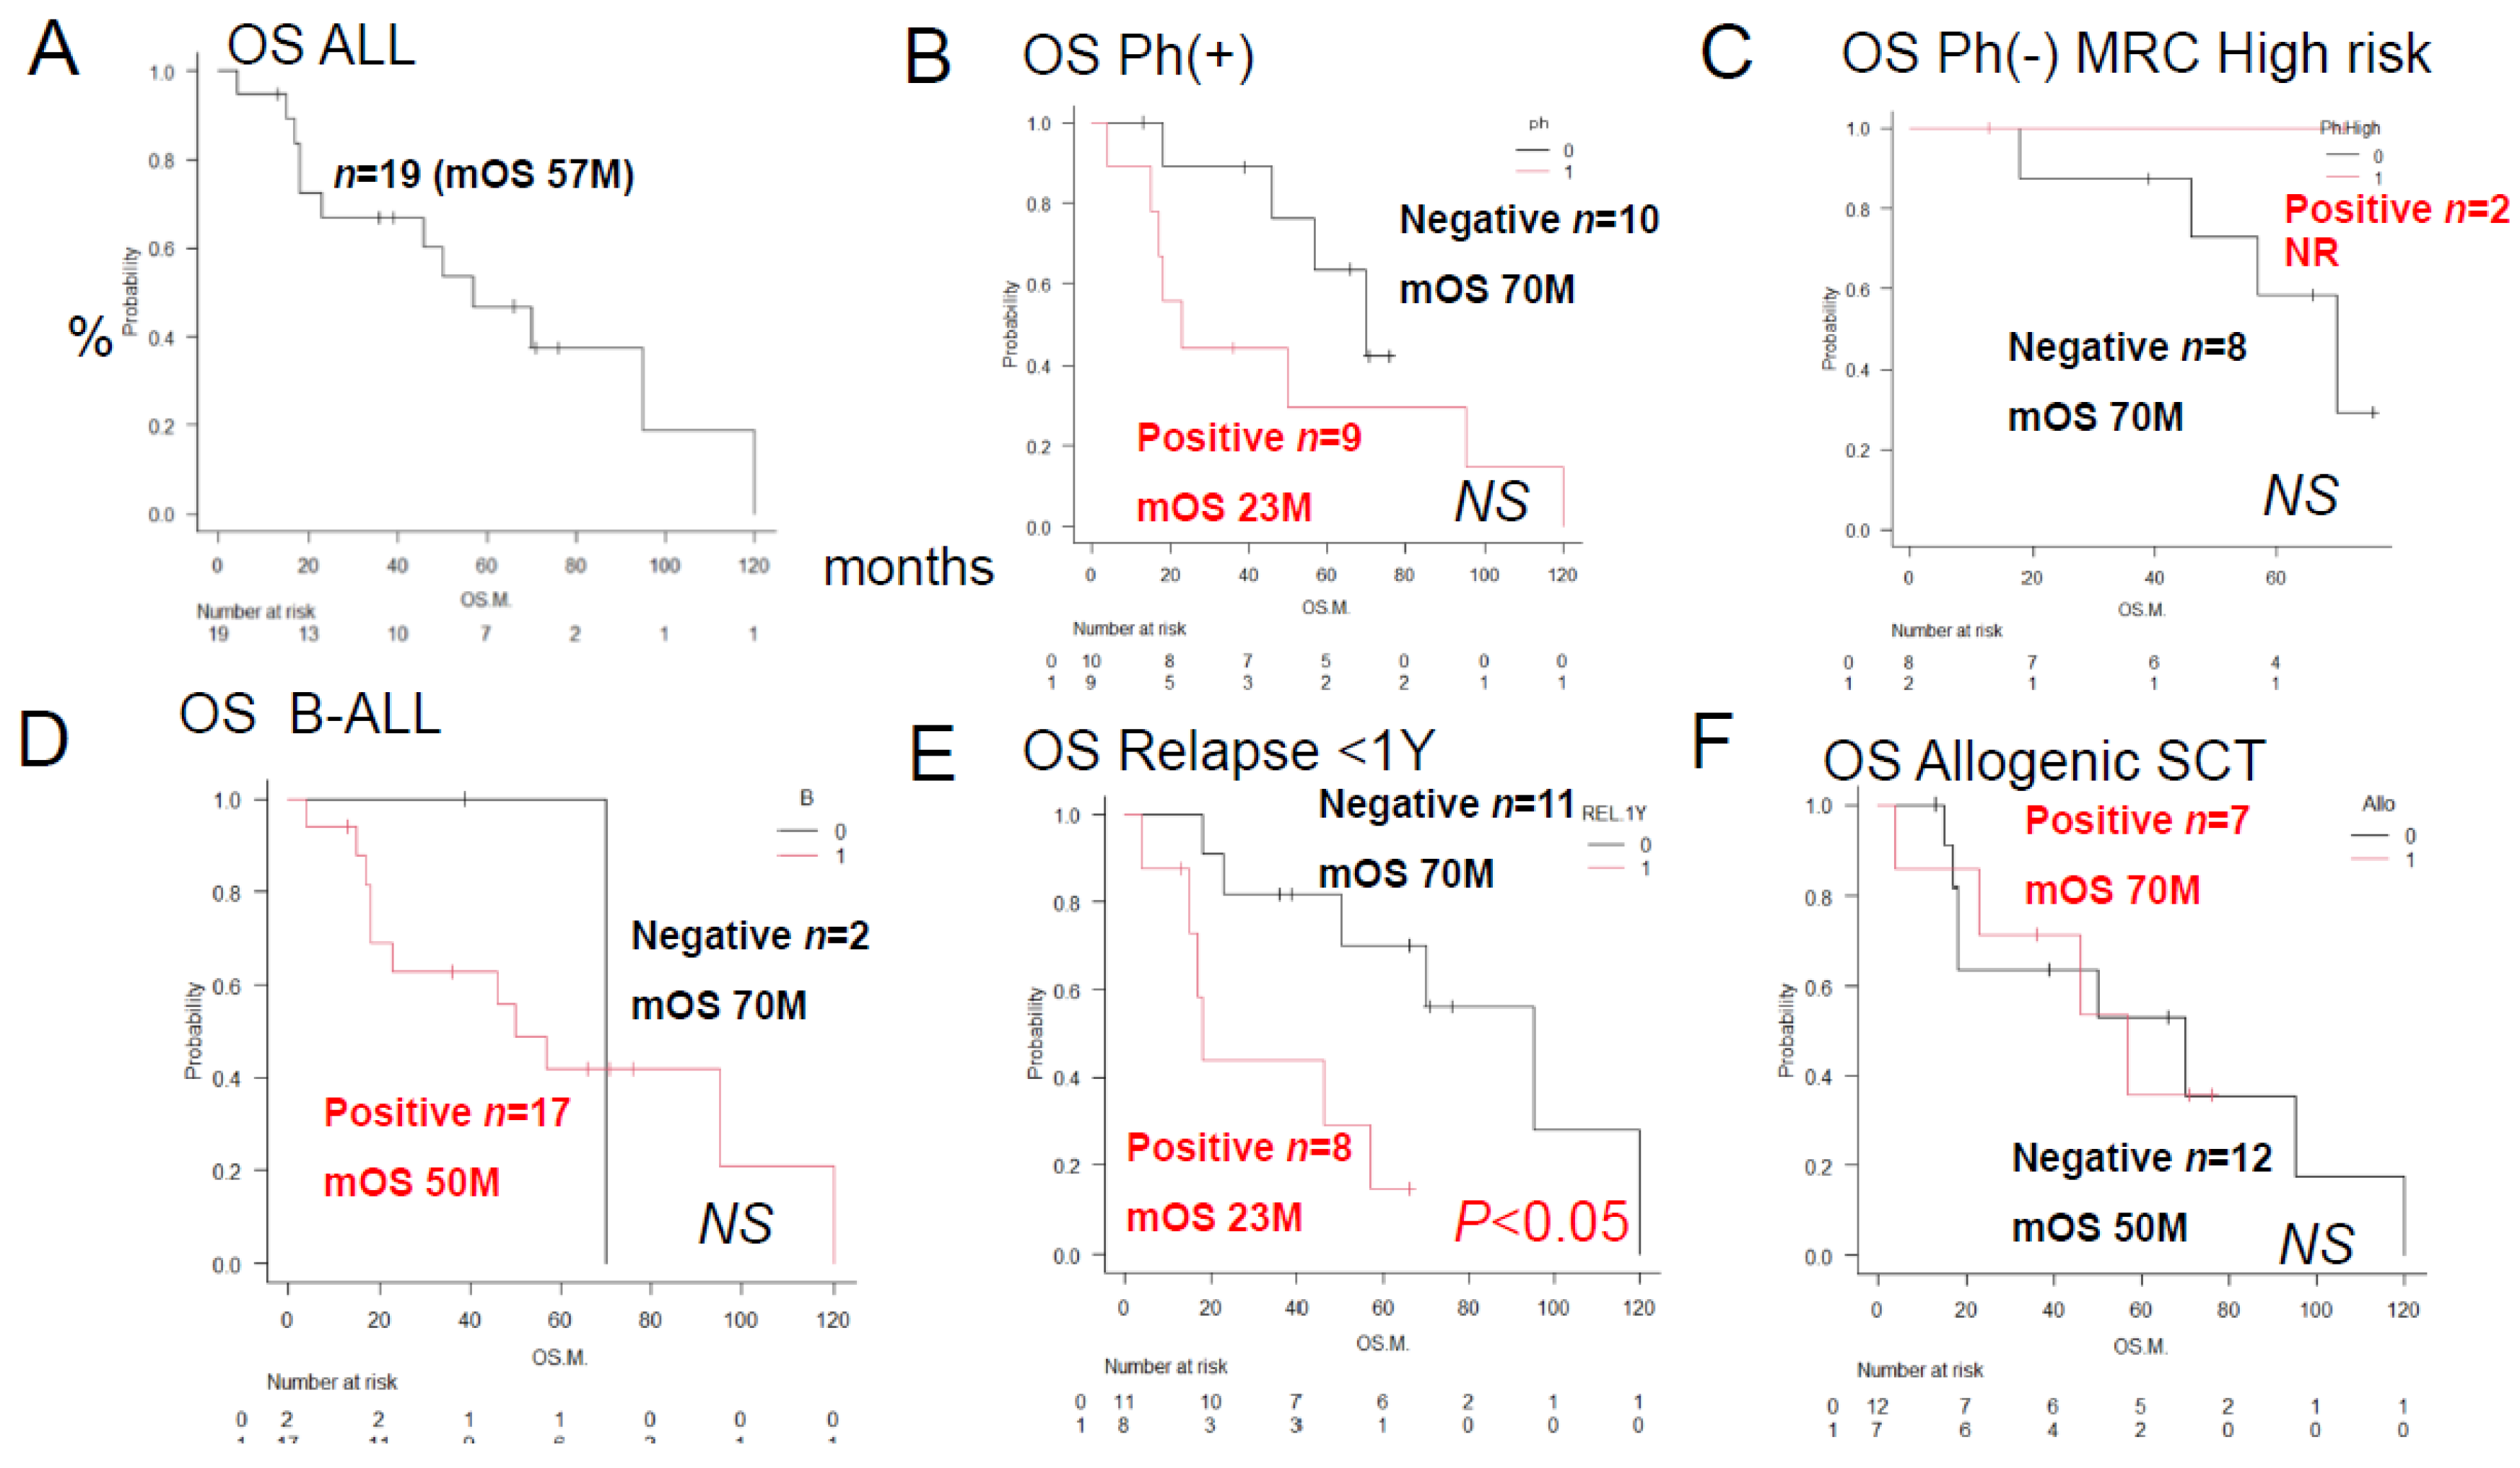
Figure 2.
Overall survival rates of ALL patients with and without prognostic factors. Kaplan–Meier survival curves and prognostic factors were compared between groups using the log-rank test. Comparison of overall survival (OS) after initial remission induction therapy. Below, the red line shows the survival curve for the group in which immunostaining of ALL blasts for the prognostic factor was positive, and the black line shows the survival curve for the group in which immunostaining was negative. (A) The AKR1B10-positive group showed a significantly reduced OS duration/2-year OS rate (n = 3; median OS, 18 months; 2-year OS rate, 0%; p < 0.05). (B). The AKR1C3-positive group showed a significantly reduced OS duration/2-year OS rate (n = 7; median OS, 35 months; 2-year OS, 18%; p < 0.05). (C). There was no significant difference in the OS rates between the AKR1B1-positive (n = 1) and AKR1B1-negative (n=18) groups (NS). The median OS was not reached in the AKR1B1-positive group, and the 5-year OS rate was 100%. (D) There was no significant difference in the OS rates between the MRP1-positive (n = 9) and MRP1-negative (n=10) groups (NS). The OS duration in the MRP1-positive group was 23 months, and the 5-year OS rate was 23%. (E) There was no significant difference in the OS rates between the PD-L2-positive (n=3) and PD-L2-negative (n=16) groups (NS). The OS duration in the PD-L2-positive group was 21 months, and the 2-year OS rate was 0%. (F) There was no significant difference in the OS rate between the CYP2B6-positive (n=1) and CYP2B6-negative (n=18) groups (NS). The median OS was not reached in the CYP2B6-positive group, and the 5-year OS rate was 100%.
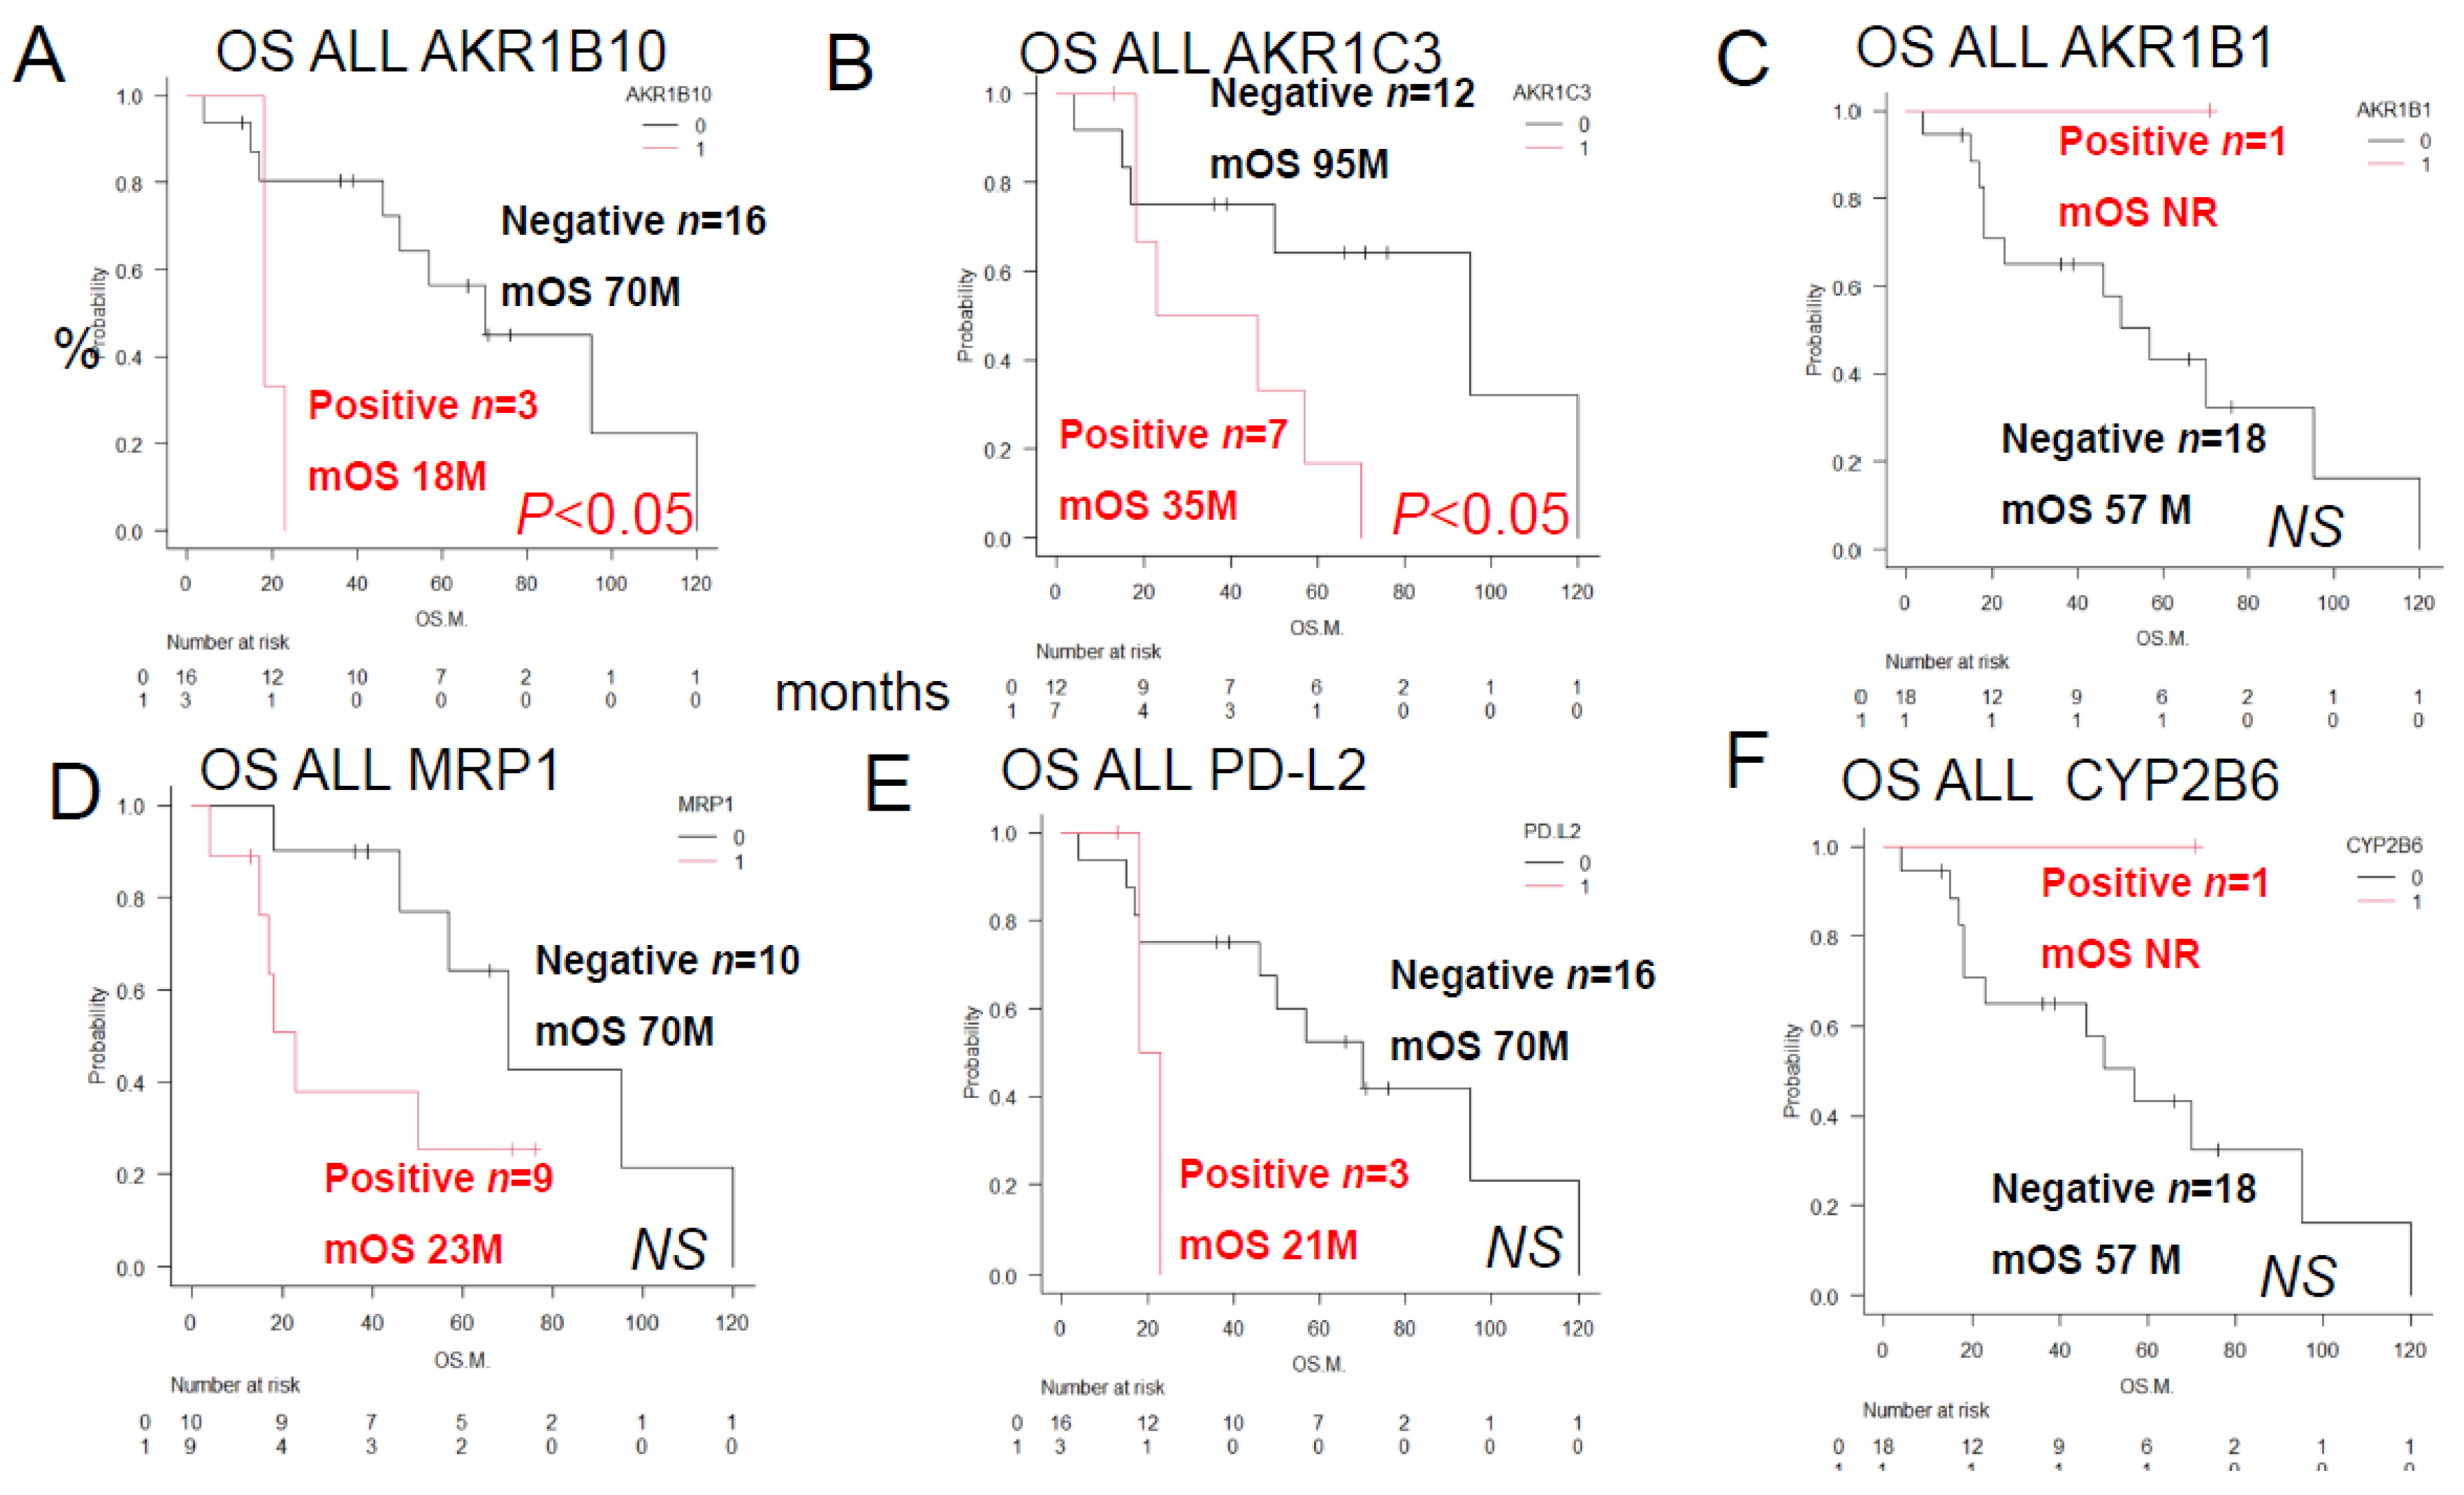
Figure 3.
Overall Survival of ALL Patients showing different combinations of AKR1C3 and AKR1B10 expressions, AKR1B1 and AKR1B10 expressions, AKR1B10 and CYP2B6 expressions, MRP1 and AKR1C3 expressions, Philadelphia chromosome status and AKR1C3 expression We compared the Kaplan–Meier survival curves and prognostic factors as assessed by immunostaining between 2 groups by the log-rank test. Data/OS outcomes are shown in black for cases where the results were negative for both factors, in blue for cases where the results were positive for both factors, in green and blue for cases where the result was positive for one and negative for the other factor of the prognostic combination. See Table 2 for the correlation between AKR1B10 and other factors. (A) Significant differences in the OS duration/OS rate were observed for different combinations of AKR1C3 (C3) and AKR1B10 (B10) expressions (p < 0.05): AKR1C3 (-) AKR1B10 (-), n = 12; mean OS 95 months, 5-year OS 63%; AKR1C3 (-) AKR1B10 (+), n = 3, mean OS 57 months, 5-year OS 33%; AKR1C3 (+) AKR1B10 (+), n = 3, mean OS 12 months, 5-year OS 0%;(B) Significant differences in OS were observed between the combinations of AKR1B1 (B1) and AKR1B10 (p < 0.05). (B) Significant differences in OS duration/OS rate were observed between different combinations of AKR1B1 (B1) and AKR1B10 expression (p < 0.05). AKR1B1 (+) AKR1B10 (-), n = 1, OS not reached, 5-year OS 100%. AKR1B1 (-) AKR1B10 (-), n = 15, median OS 70 months, 5-year OS 52%. AKR1B1 (-) AKR1B10 (+), n = 3, median OS 18 months, 2-year OS 0%. (C) Significant differences in OS were observed in different combinations of MRP1 (P1) and AKR1C3 expression (p < 0.05): MRP1(P1) (+) AKR1B10 (-), n = 1, OS not reached, 5-year OS 100%, CYP2B6 (-) AKR1B10 (-), n = 15, median OS 70 months, 5-year OS rate 52%, CYP2B6 (-) AKR1B10 (+), n = 3, median OS 18 months, 2-year OS rate 0%. The OS duration and rate for AKR1B1 (+) AKR1B10 (-) patients were identical to those for CYP2B6(+) AKR1B10 (-) patients. AKR1B1 (+) AKR1B10 (-), n=1, OS not reached, 5-year OS 100%. AKR1B1 (-) AKR1B10 (-), n=15, median OS 70 months, 5-year OS 52%. AKR1B1 (-) AKR1B10 (+), n=3, median OS 18 months, 2-year OS 0%. (C) Significant differences in OS were observed between the MRP1 (P1) and AKR1C3 combinations (p < 0.05): MRP1(P1) (+) AKR1B10 (-), n = 1, OS not reached, 5-year OS rate 100%; CYP2B6 (-) AKR1B10 (-), n = 15, median OS 70 months, 5-year OS rate 52%; CYP2B6 (-) AKR1B10 (+), n = 3, median OS 18 months, 2-year OS rate 0%. OS duration and rate for AKR1B1 (+) AKR1B10 (-) were identical to those for CYP2B6(+) AKR1B10 (-). (D) Significant differences in the OS duration/OS rates were observed for different combinations of MRP1 (P1) and AKR1C3 expressions (p < 0.05): MRP1 (-) AKR1C3 (-), n = 6, mean OS 108 months, 5-year OS rate100%; MRP1 (-) AKR1C3 (+), n = 4, mean OS 52 months, 5-year OS rate 34%; MRP1 (+) AKR1C3 (-), n = 6, mean OS 34 months, 5-year OS rate 26%; MRP1 (+) AKR1C3 (+), n = 3, mean OS 21 months, 2-year OS rate 0%; (E) Significant differences in the OS duration/OS rates were observed for different combinations of the tumor cell Philadelphia chromosome (Ph) status and AKR1C3 expression (p < 0.05): Ph(-) AKR1C3 (-), n = 5, median OS not reached, 5-year OS 100%; Ph (-) AKR1C3 (+), n = 5, median OS 52 months, 5-year OS rate 24%; Ph (+) AKR1C3(+), n=2, median OS 21 months, 2-year OS rate 0%. (F) No significant differences in the OS duration or rate were observed for different combinations of tumor Ph status and AKR1B10 expression; Ph(-) AKR1B10 (-), n = 9, median OS 70 months, 5-year OS rate 70%; Ph (+) AKR1B10 (-), n = 7, median OS 50 months, 5-year OS rate 38%; Ph (+) AKR1B10(+), n=2, median OS 21 months, 2-year OS rate 0%. Ph (-) AKR1B10(+), n=1, OS 18 months, 2-year OS rate 0%.
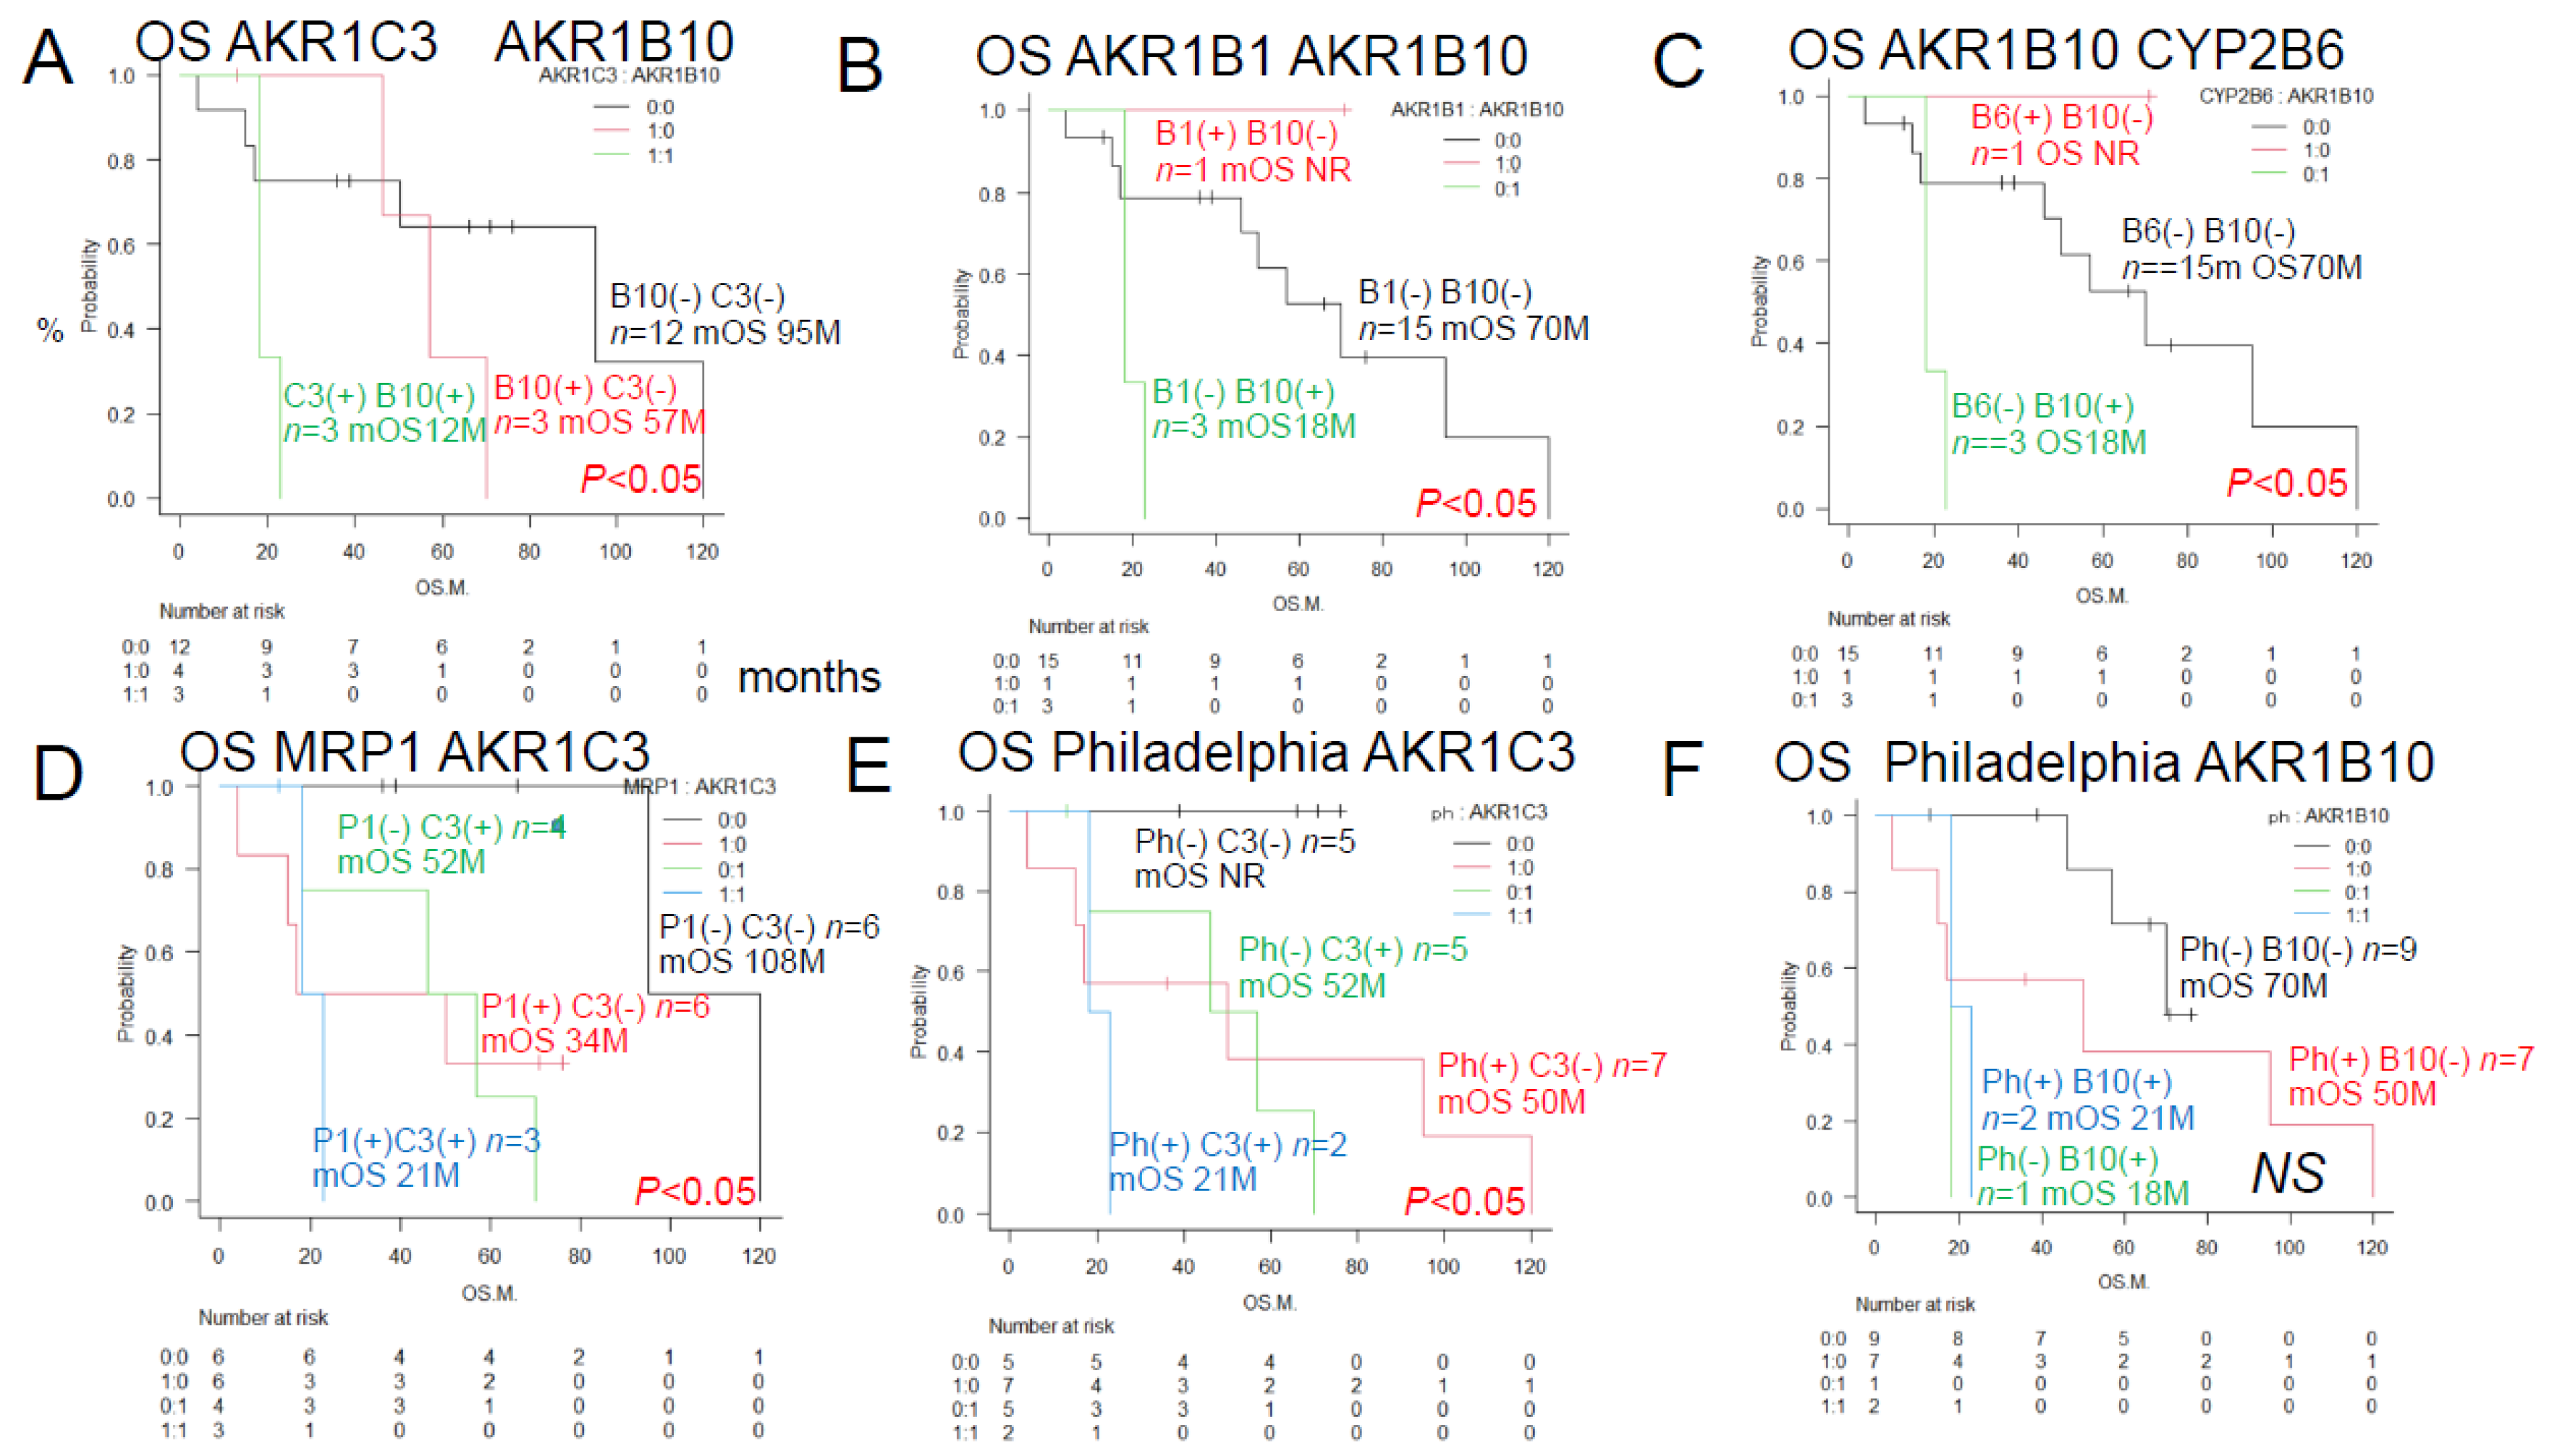
Figure 4.
Urayasu classification for ALL (groups 1-4) Group 1 (Good prognosis group): AKR1B1 (+) AKR1B10(-), n=1, median OS not reached, 5-year OS rate 100%. Group 2+Group 3 (Intermediate prognosis): AKR1B1 (-) AKR1B10(-), n=15, median OS 70 months, 5-year OS rate 52%. Group 4 (Poor prognosis): AKR1B1 (-) AKR1B10(+), n=3, median OS, 18 months, 2-year OS rate 0%. Group 2 (Intermediate-1 prognosis): AKR1B1 (-) AKR1B10(-) MRP1(-), n=9, median OS 70 months, 5-year OS rate 72%. Group 3 (Intermediate-2 prognosis): AKR1B1 (-) AKR1B10(-) MRP1(+) n=6, median OS 17 months, 5-year OS rate 20%.
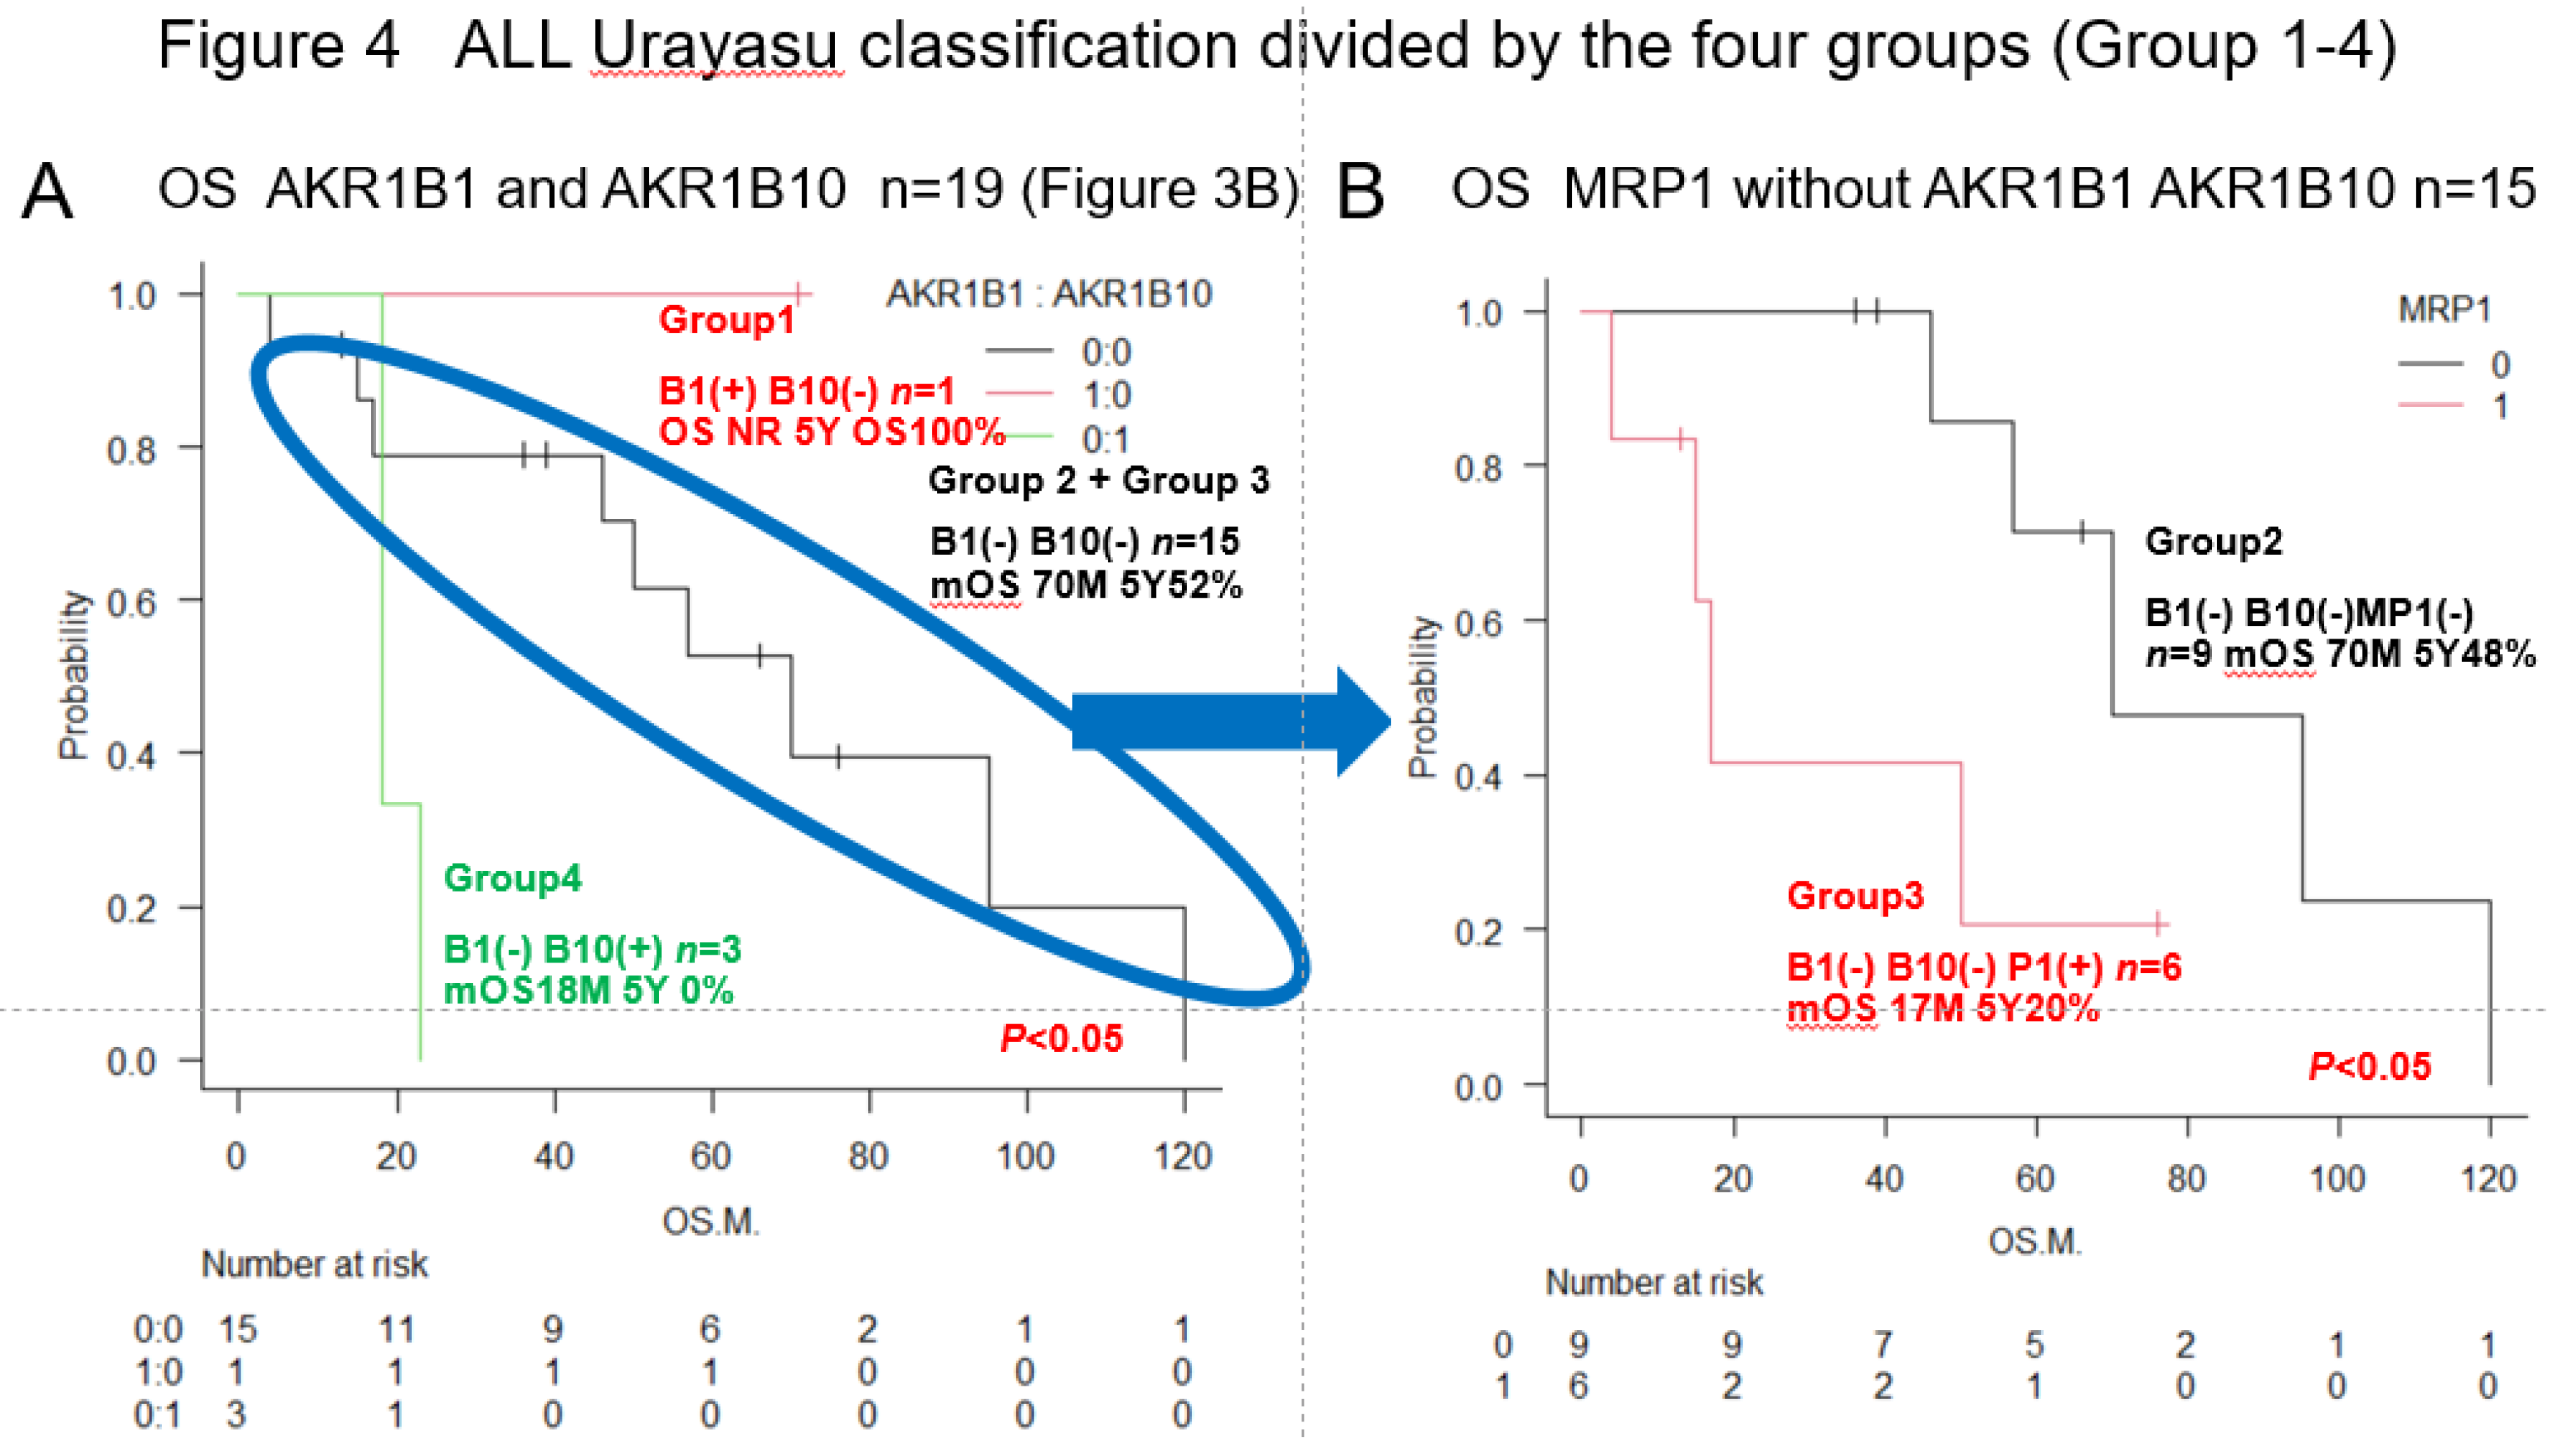
Figure 6.
Chemoresitance mechanism in ALL cells. Future AKR1B10 inhibitor therapy may require individualized treatment. AKR1B10 shares 70.6% amino acid sequence identity with the aldose reductase enzyme AKR1B1, and their structures and substrate specificities are very similar. Many compounds that inhibit AKR1B10 also inhibit AKR1B1 to the same degree. AKR1B10 positivity also confers resistance to cisplatin. It is also known to confer a high degree of resistance to cyclophosphamide (CY), which may reduce the effectiveness of CY used in allogeneic transplant conditioning regimens such as CY+YBI and CY+busulfan, potentially increasing the relapse rate. AKR1B10 expression is regulated by a gene on chromosome 7q33. Chromosome 7 deletions may result in activation of AKR1B10. The Bcr-Abl tyrosine kinase inhibitor dasatinib inhibits AKR1B10 and inhibits the metabolism of daunomycin and idarubicin, making it promising for therapeutic application. NSAIDs such as N-phenyl-anthranilic acid, diclofenac, and glycyrrhetinic acid competitively inhibit AKR1B10. Based on the above, dasatinib and other NSAIDs are considered promising AKR1B10 inhibitors for stratified treatment of ALL.
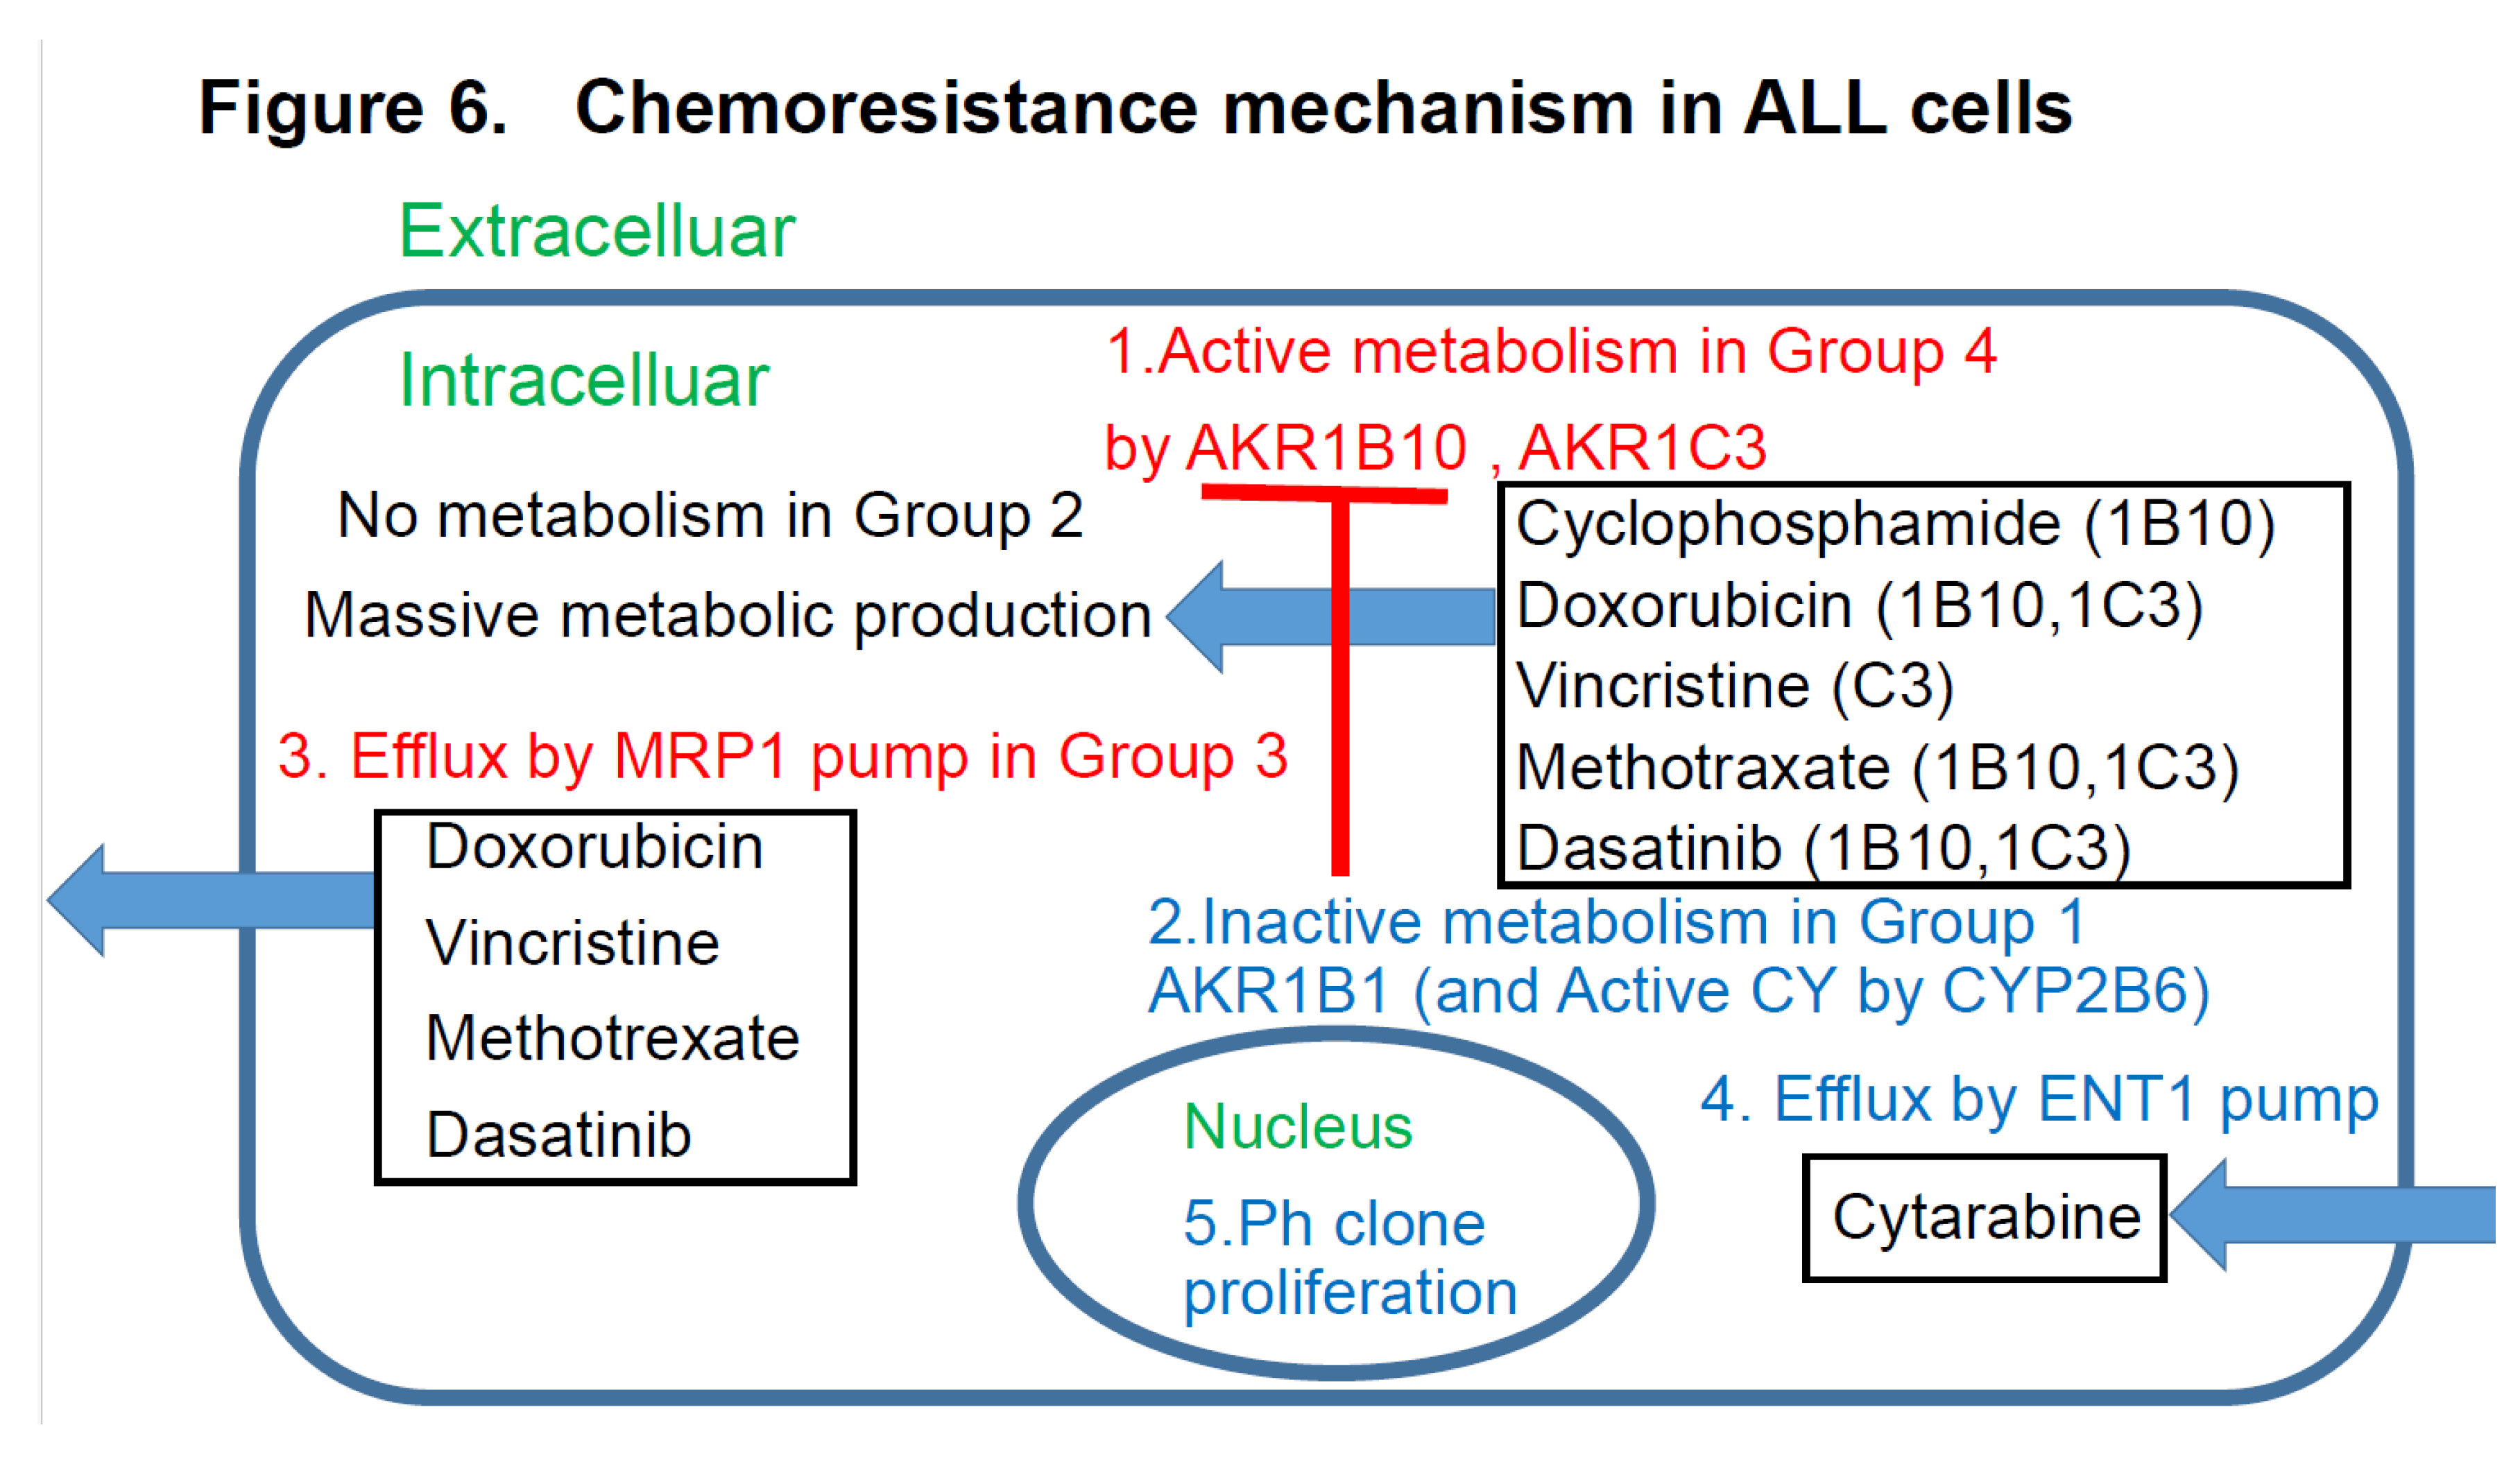
Figure 7.
Thereview of the literature (references 1-3) plus findings of this study. Regarding the relationship between treatment resistance factors in the Urayasu classification and this study’s LBCL [1], TCL [2], AML [3], and ALL [this study] This is a summary of the Urayasu classification based on treatment resistance factors for four aggressive hematopoietic tumors. The prognostic significances of the treatment resistance factors in the Urayasu classification for LBCL (2), UC for TCL (3), UC for AML (4), and UC for ALL (current study) are summarized in a Venn diagram for each disease. There were no factors that were common to all four diseases. Common factors in the first three diseases were the growth factor P53 (LBCL 36%, TCL 13%, AML 9%), which was more prevalent in LBCL, the efflux pump MRP1 (LBCL 25%, AML 9%, ALL 46%), and AKR1C3, the enzyme that metabolizes doxorubicin, methotrexate, vincristine, and dasatinib (LBCL, TCL, ALL). Common to LBCL, TCL were the microenvironmental adaptation factor, ER stress protein GRP94, and common to AML and ALL was AKR1B10, which metabolizes idarubicin, daunorubicin, cyclophosphamide, and cisplatin. Dasatinib inhibits AKR1B10. The tyrosine kinase inhibitor ibrutinib inhibits AKR1C3, thereby inhibiting doxorubicin metabolism and showing promise for potential therapeutic application. Five survival activators (PD-1, PD-L1, TP, GRP78, and GRP94), which are microenvironmental factors, are also important in TCL. CYP3A4, which detoxifies doxorubicin, and the doxorubicin efflux pump MDR1 are important in LBCL. The HO efflux pump MRP1 is more frequently expressed in ALL, AML, and LBCL than in TCL, which is dependent on microenvironmental adaptation factors. P53 is involved in many diseases other than ALL. However, the poor prognosis of TCL is largely due to p53 expression. p53 is an important tumor suppressor, and loss of p53 function due to mutations or other factors leads to cancer development. p53 mutations occur in more than 50% of human cancers. However, currently, no drugs have been approved for the clinical treatment of cancers expressing mutant p53. LBCL, AML, and TCL are most frequently positive for AKR1C3, an enzyme that inactivates doxorubicin, cyclophosphamide, and vincristine (AML 17/35: 46%, TCL 6/16: 38%, LBCL 26/42: 62%). Based on these findings, while R-CHOP and Pola-RCHP regimens are standard therapies, many LBCL tumors express AKR1C3, which may contribute to treatment resistance. AML patients with P53 (3/35 9%) or MRP1 (1/35 3%) mutations show a poor prognosis. Although the incidence rate is low (12%), even with combined treatment, MRP1 inhibitors have been developed. In addition to significant microenvironmental factors in TCL, AML cells can express AKR1B10, a drug that metabolizes the anthracycline anticancer drug idarubicin, which can result in treatment resistance. AKR1B1 shares 70.6% amino acid sequence identity with AKR1B10 and shares highly similar structure and substrate specificity. Many compounds that inhibit AKR1B10 also competitively inhibit AKR1B1 to a similar degree, reducing AKR1B10 activity and reversing treatment resistance. The Abl tyrosine kinase inhibitor dasatinib inhibits AKR1B10, inhibiting daunomycin and idarubicin metabolism, offering promise for potential therapeutic application. AKR1B10 is believed to be the primary pathway underlying cisplatin and cyclophosphamide resistance.29 In fact, caution is required in the case of AKR1B10-positive ALL, in which high-dose cyclophosphamide therapy used as a conditioning regimen for allogeneic hematopoietic stem cell transplantation may show reduced efficacy. Furthermore, AKR1B10 is regulated by a gene on chromosome 7q33. Loss of chromosome 7 may result in the activation of AKR1B10. Meanwhile, TCL has a superior ability to adapt to the microenvironment, and LBCL is also thought to have a superior ability to detoxify anticancer drugs.
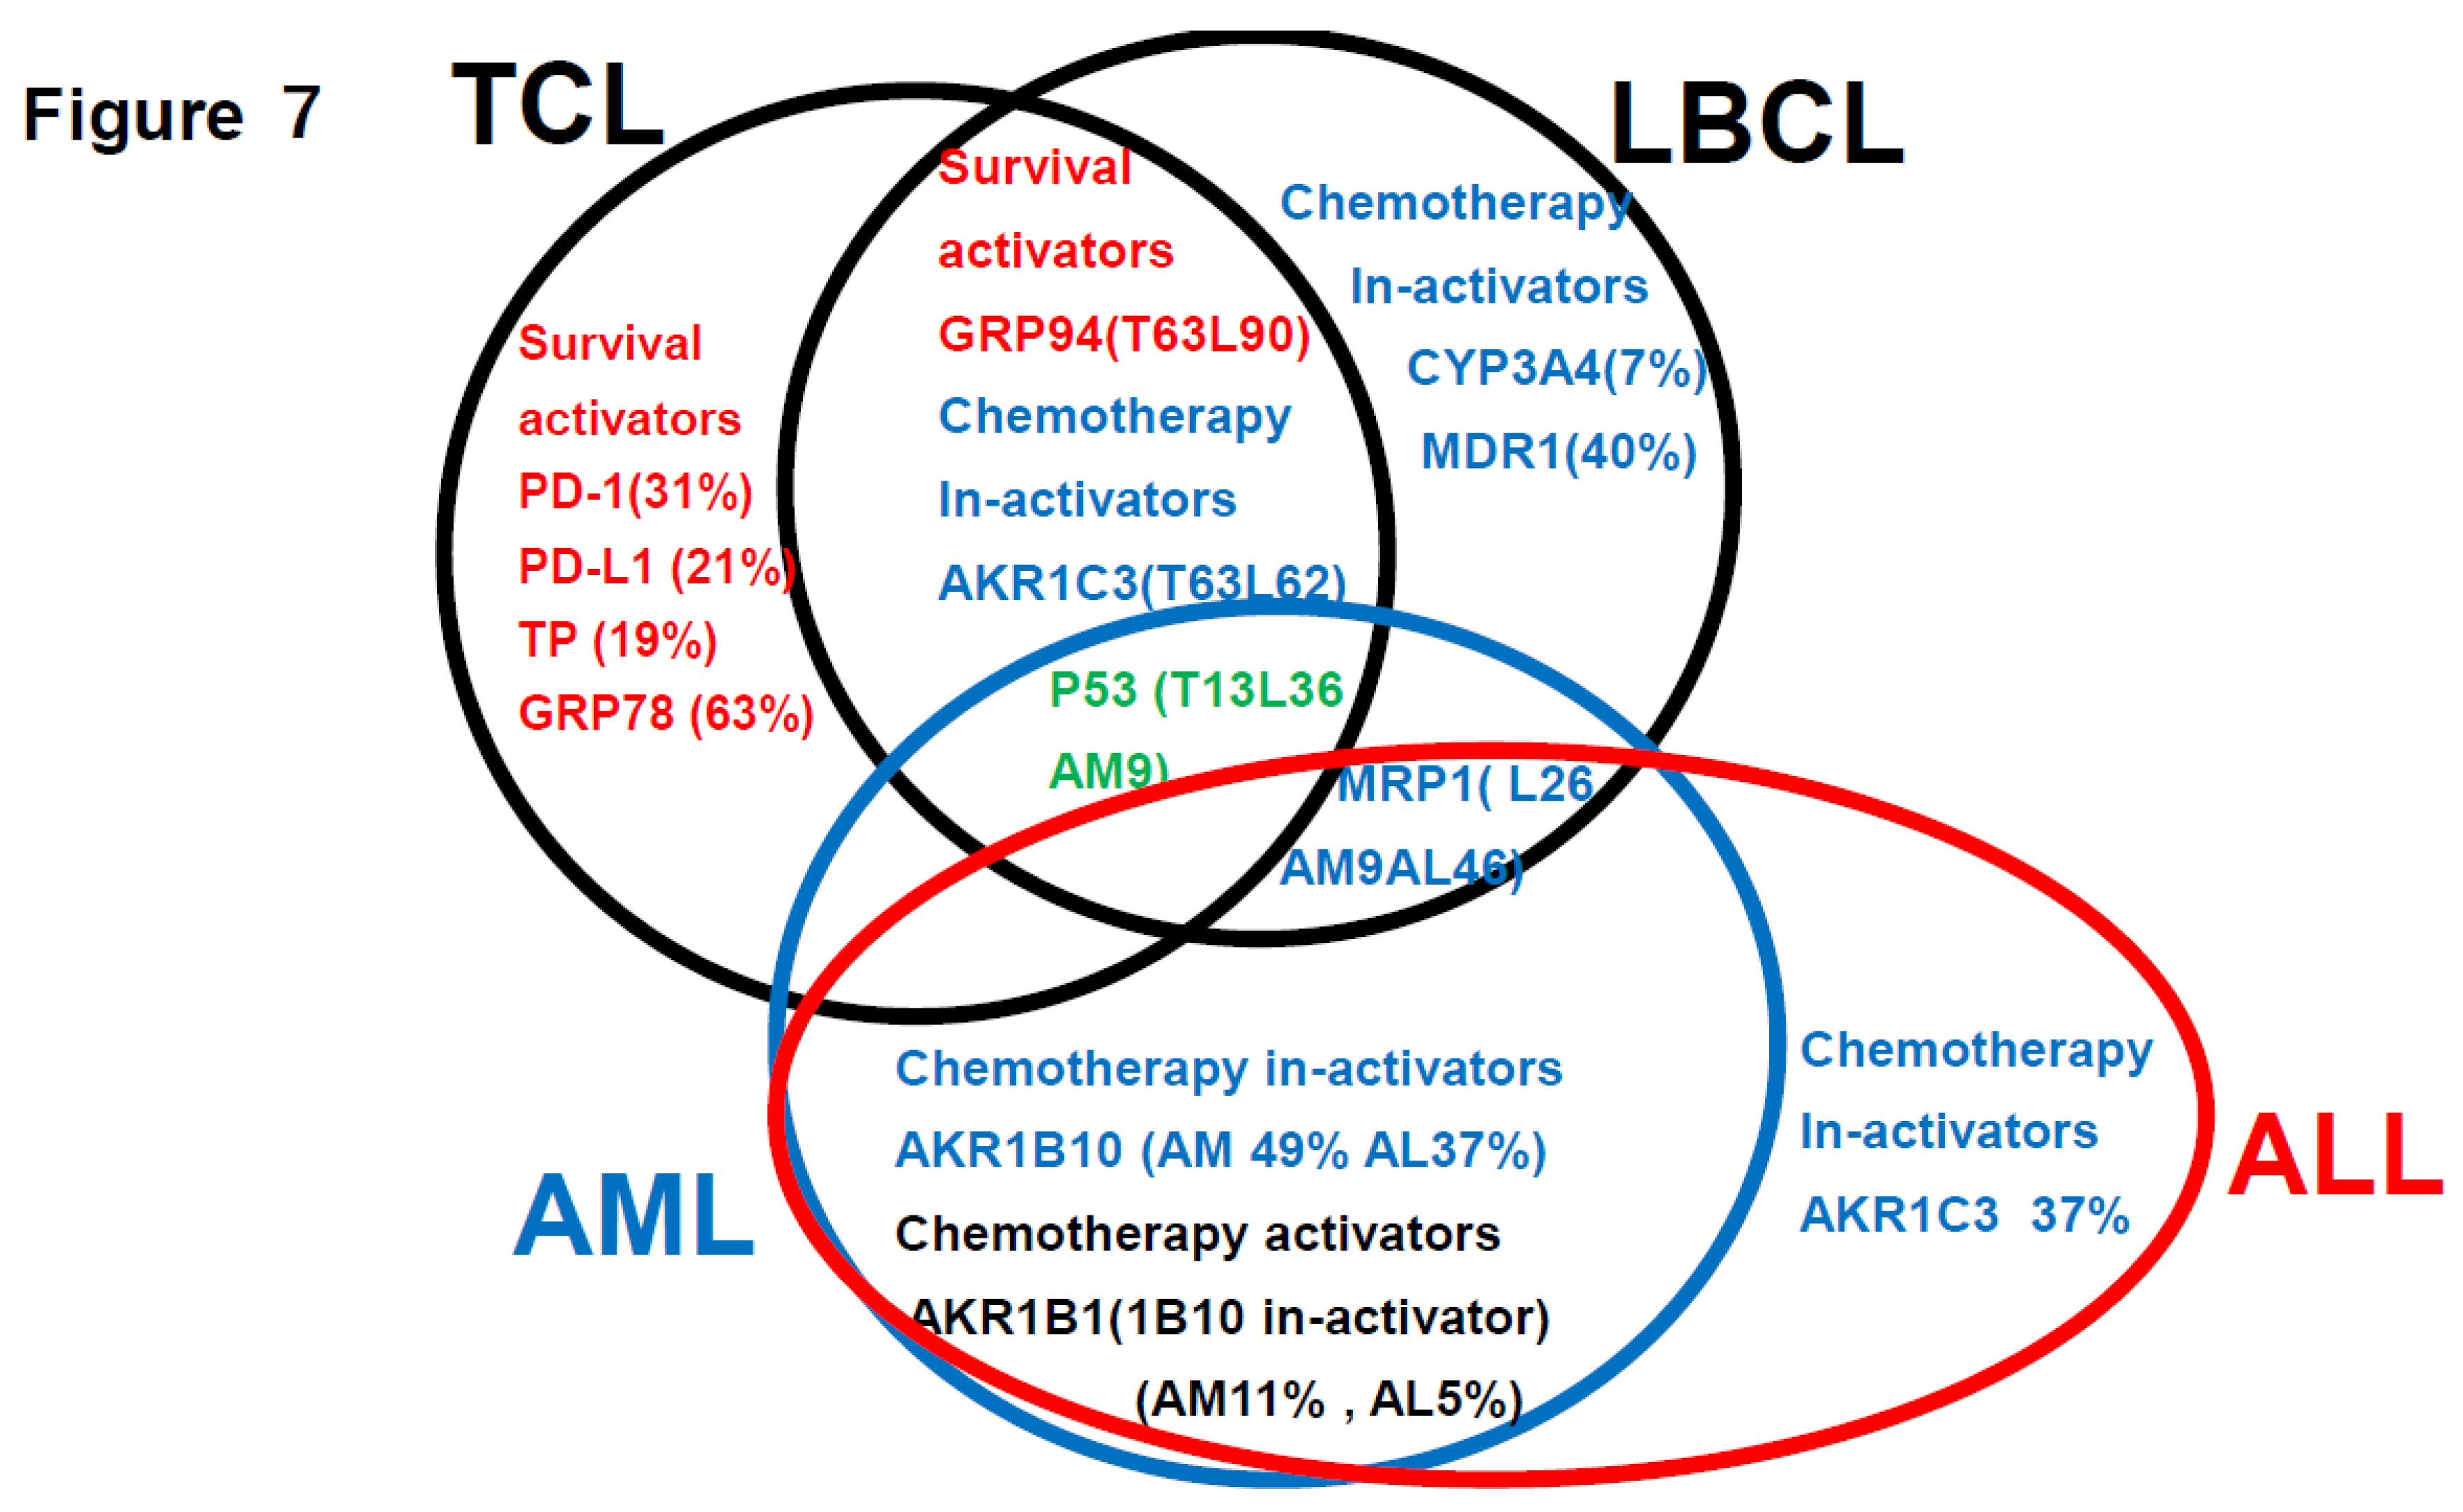

Table 2.
OS was significantly different between patients with different expression of prognostic factors (results of univariate analysis).
Table 2.
OS was significantly different between patients with different expression of prognostic factors (results of univariate analysis).
| Category | Factors (♯Significant Difference:) |
n | Median OS (Months) |
Years (Y) 5-Year Survival Rate | p Value | Figure |
|---|---|---|---|---|---|---|
| Total | ALL | 19 | 57M | 44% | 1A | |
| ALL MRC classification | MRC ph (+) | 9 | 23M | 28% | NS | 1B |
| MRC ph (-) High risk | 2 | NR | 100% | NS | 1C | |
| MRC ph (-) Standard risk | 8 | 70M | 58% | NS | 1D | |
| Other prognostic factors | Relapse <1Y | 8 | 23M | 14% | *p<0.05 | 1E |
| Transplantation | Allogeneic transplantation | 7 | 70M | 36% | NS | 1F |
| CHO metabolic enzyme | AKR1B10 (♯) | 3 | 18M | 0% | *p<0.05 | 2A |
| AKR1C3 | 7 | 35M | 18% | *p<0.05 | 2B | |
| AKR1B1 | 1 | NR | 100% | NS | 2C | |
| Fibrosis | Silver stain | 6 | 95M | 78% | NS | |
| HO efflux pump | MDR1 | 0 | ||||
| MRP1 | 9 | 23M | 22% | NS | 2D | |
| MTX efflux pump | MRP4 | 0 | ||||
| Immune check point | PD-1 | 0 | ||||
| PD-L1 | 0 | |||||
| PD-L2 | 3 | 21M | 0% | NS | 2E | |
| C activating enzyme | CYP2B6 | 1 | NR | 100% | NS | 2F |
| CHOP metabolic enzyme | CYP3A4 | 0 | ||||
| ER stress proteins | GRP78 | 8 | 70M | 56% | NS | |
| GRP94 | 13 | 57M | 48% | NS | ||
| TGF-beta1 | 7 | 50M | 42% | NS | ||
| TNF-alpha1 | ||||||
| Others | GST | 7 | 73M | 50% | NS | |
| Ki-67 | 12 | 46M | 22% | NS | ||
| MYC | 5 | 40M | 0% | NS | ||
| P53 | 1 | NR | 100% | NS | ||
| TP | 0 | |||||
| Significant prognostic combinations | AKR1C3(+), AKR1B10(+) (♯) | 3 | 18M | 0% | *p<0.05 | 3A |
| AKR1B1(-), AKR1B10(+) (♯) | 3 | 18M | 0% | *p<0.05 | 3B | |
| CYP2B6(-), AKR1B10(+) (♯) | 3 | 18M | 0% | *p<0.05 | 3C | |
| MRP1(+), AKR1C3(+) (♯) | 3 | 21M | 0% | *p<0.05 | 3D | |
| Ph(+), AKR1C3(+) (♯) | 2 | 21M | 0% | *p<0.05 | 3E | |
| Ph(+), AKR1B10(+) (♯) | 2 | 21M | 0% | NS | 3F | |
| Urayasu classification | ALL UG1 AKR1B1(+), AKR1B10(-) | 1 | NR | 100% | *p<0.05 | 4A, 3B |
| ALL UG2 AKR1B1(-),AKR1B10(-)MRP1(-) | 9 | 70M | 48% | *p<0.05 | 4B | |
| ALL UG3 AKR1B1(-),1AKRB10(-)MRP1(+) | 6 | 17M | 20% | *p<0.05 | 4B | |
| ALL UG4 AKR1B1(-), AKR1B10(+) | 3 | 18M | 0% | *p<0.05 | 4A, 3B |
Abbreviations: OS: overall survival; n: number; ALL: acute lymphoblastic leukemia; M: months; Y: years; MRC: Medical Research Council; ph: Philadelphia chromosome; NS: not significant; NR; not reached; CHO: cyclophosphamide+ hydroxyl doxorubicin+ oncovin; C: cyclophosphamide; AKR1B10:aldo-keto reductase family 1 member B10; AKR1C3:aldo-keto reductase family 1 member C3; AKR1B1: aldo-keto reductase family 1 member B1; MDR1: multidrug resistance; MRP1(4): multidrug resistance-associated protein 1(4); PD-1: programmed cell death-1, PD-L1 (2): programmed cell death–ligand 1(2); CYP2B6; cytochrome P450 2B6; CYP3A4: cytochrome P450 3A4; ER: endoplasmic reticulum; GRP78: glucose-regulated protein 78; GRP94: glucose- regulated protein 94; TGFβ1: transforming growth factor β1; TNFα1: tumor necrosis factor-α1; GST: glutathione sulfate transferase; TP: thymidine phosphorylase; UG: Urayasu classification Group,. ♯ Significant difference * denotes p < 0.05.
Disclaimer/Publisher’s Note: The statements, opinions and data contained in all publications are solely those of the individual author(s) and contributor(s) and not of MDPI and/or the editor(s). MDPI and/or the editor(s) disclaim responsibility for any injury to people or property resulting from any ideas, methods, instructions or products referred to in the content. |
© 2025 by the authors. Licensee MDPI, Basel, Switzerland. This article is an open access article distributed under the terms and conditions of the Creative Commons Attribution (CC BY) license (https://creativecommons.org/licenses/by/4.0/).
Copyright: This open access article is published under a Creative Commons CC BY 4.0 license, which permit the free download, distribution, and reuse, provided that the author and preprint are cited in any reuse.


