
Submitted:
28 May 2025
Posted:
29 May 2025
You are already at the latest version
Abstract
Objectives: The variability in outcomes among individuals is caused by multiple factors, including genetic variations in drug transporter genes known as ABCs. This study investigates the clinical impact of single nucleotide variants (SNV) in the ABCC1/MRP1, ABCC2/MRP2, and ABCC4/MRP4 genes on the clinical response and relapse of pediatric patients with central nervous system tumors. Methods: In a study involving 111 cancer patients, genotyping of ABCC1/MRP1, ABCC2/MRP2, and ABCC4/MRP4 was conducted using real-time PCR with TaqMan probes. Treatment response was evaluated using the Response Assessment in Neuro-Oncology (RANO) criteria. Results: Univariate and multivariate analyses using the Cox proportional hazards (adjusted) model. Multivariate analysis adjusted for sex and age showed a significant association between ABCC1 r.5540G>C; rs12921623 in the gene and non-response to treatment in the codominant model HR=2.095 (95% CI 1.202-3.650) p= 0.009 and in the dominant model HR= 2.025 (95% CI 1.199 -3.421), p=0. 008 and an increased risk of relapse in the codominant model HR= 9.09 (95% CI 1.04-78.85) p=0.04 and the dominant model HR= 3.912 (95% CI 1.139-13.436) p= 0.03. Furthermore, a significant association was found between ABCC2 c. 3972C>T; rs3740066 and relapse in the recessive model HR=3.5 (95% CI 1.02-12.17) p= 0.04. Conclusions: Our findings indicate that ABCC1 r.5540 G>C SNV and in the ABCC2 c. 3972C>T SNV are significant predictors of non-response and relapse in this group of pediatric patients with central nervous system tumors.
Keywords:
ABC gene
; non-response
; relapse
; SNV
; pediatric patients
; central nervous system tumors
1. Introduction
Cancer treatment-related mortality in children with cancer in low- and middle-income countries can be as high as 45% [1]. The use of a wide range of drugs has led to cancer cells developing resistance, a phenomenon known as multidrug resistance (MDR), which is currently the leading cause of therapeutic failure in 90% of patients [2,3]. One of the most studied mechanisms of resistance involves ABC transporters. Overexpression of ABC transporters is associated with multidrug resistance (MDR), leading to adverse clinical outcome, relapse, and mortality [4,5].
Adenosine triphosphate-binding cassette (ABC) subfamily B member 1 (ABCB1/MDR1), adenosine triphosphate-binding cassette subfamily G member 2 (ABCG2/BCRP), the adenosine triphosphate-binding cassette subfamily C member 1 (ABCC1/MRP1) transporters, adenosine triphosphate-binding cassette subfamily C member 2 (ABCC2/MRP2) and adenosine triphosphate-binding cassette subfamily C member 4 (ABCC4/MRP4), are transporters that can efflux a wide range of anticancer drugs and cause drug resistance when overexpressed in tumor cells. They are found in the apical membranes of intestinal epithelial cells, hepatocytes, and renal tubular cells. These efflux transporters play a key role in eliminating chemotherapeutic agents, toxic substances, and organic anions from the body, thus contributing to detoxification [6,7]. Drug export can lead to reduced drug concentrations, causing treatment failure, as seen in epilepsy [8,9] breast cancer [10], pancreatic cancer [11], and lung cancer [12].
Single nucleotide variants (SNV) have been identified in ABCC genes, which may affect the cellular disposition of chemotherapeutic drugs [13]. This can lead to increased or decreased drug efflux and predispose individuals to side effects such as toxicity [14,15,16] ultimately impacting clinical response [17,18].
Multiple drugs currently used in chemotherapy are ABCC substrates. Therefore, it is expected that some SNVs may affect the clinical response. This study investigates the clinical impact of SNV in the ABCC1, ABCC2, and ABCC4 genes on the clinical response and relapse of pediatric patients with central nervous system tumors.
2. Materials and Methods
2.1. Study Population
The study included patients under 18 years old who had a histologically confirmed central nervous system tumor. All cases were referred to the Oncology Department of the National Institute of Pediatrics in Mexico City from November 2018 to November 2020. Each patient received neoadjuvant chemotherapy according to treatment protocols aligned with the Mexican guidelines established by the Children’s Oncology Group [19]. The treatments administered included ifosfamide, carboplatin, etoposide, vincristine, cyclophosphamide, doxorubicin, cisplatin, and temozolomide. The treatment regimens were categorized as follows: 1. ICE (Ifosfamide, Carboplatin, Etoposide) 2. Non-ICE (Vincristine, Carboplatin, Cisplatin, Cyclophosphamide, Etoposide, Temozolomide, Actinomycin D). This research was approved by the institutional committees and is registered under the number 061/2018. All patients and/or their parents or guardians provided written informed consent to participate.
2.2. DNA Extraction
We collected 5 mL of peripheral blood from each patient with central nervous system tumors. The blood was centrifuged to obtain the leukocyte button, these were lysed. The DNA was extracted using the QIAamp DNA Blood Mini Kit according to the manufacturer’s instructions (Qiagen, Hilden, Germany). We quantified DNA samples and assessed their purity using a BioTek Epoch Microplate Spectrophotometer (Agilent Technologies), ensuring adequacy for genotyping analyses and the genomic DNA size was verified by 1% agarose gel electrophoresis.
2.3. SNV Genotyping
All single nucleotide variants (SNVs) were examined by genotyping through allelic discrimination using TaqMan probes. The assays were performed to study the Single Nucleotide Variants (SNVs). The reaction mixture consisted of 10 ng of genomic DNA, 10 pmol of each primer, 2 pmol of each probe, and 5 µl of 2x master mix (provided by Applied Biosystems) in a final volume of 10 µl. The thermocycling process involved 40 cycles: 30 seconds at 95°C and 60 seconds at 60°C. The PCR plates were read using the Applied Biosystems StepOne instrument. Version 2.2 of the SDS software (provided by Applied Biosystems) was used for genotype discrimination.
All selected SNPs from the NCBI Database of Short Genetic Variations (dbSNP) exhibited minor allele frequencies (MAF) above 0.02.
The SNVs that were studied include ABCC1/MRP1 rs12921623 (r.5540 G>C), rs12921748 (r.5522G>A), rs35605 (c.1684T>C, p.Leu562Leu), ABCC2/MRP2 rs2756109 (r.1658G>T), rs3740066 (c.3972C>T, p.Ile1324Ile, ABCC4/MRP4 rs1059751 (c.*4976), rs4148551 (c.*311), and rs3742106 (c.*38).
2.4. Outcome: Evaluation of Response to Treatment and Relapse
The evaluation of the response to treatment was carried out by a radiologist according to Response Assessment in Neuro-Oncology (RANO) criteria [20], in which it considers complete response (CR) to the complete disappearance of all measurable and non-measurable lesions sustained for at least four weeks, without new lesions; partial response (PR) to the decrease ≥50% of the sum of the perpendicular diameters of the measurable lesions compared to the baseline study for at least four weeks; stable disease (SD): criteria for complete response, partial response or progression disease (PT) are not met; disease progression: at increase ≥25% in the sum of perpendicular diameters compared to the minimum measurement obtained or concerning the baseline study. Only patients with CR were classified as responders, and patients with PR, SD, and PT were classified as non-responders.
Relapse was defined as the presence of an increase in tumor volume after remission of the disease, while relapse was defined as the presence of an increase in tumor volume after remission of the disease.
2.5. Statistical Analysis
2.5.1. Variables Definition
According to the data distribution, data for qualitative variables were expressed as numbers and percentages, and data for quantitative variables were expressed as median and interquartile range or mean ± standard deviation (SD).
Only patients with complete response were classified as responders, and patients with partial response, stable disease, or tumor progression were classified as non-responders.
SNVs were analyzed using codominant, dominant, and recessive genetic inheritance models: codominant (heterozygous vs. major allele homozygous)/(minor allele homozygous vs. major allele homozygous, dominant (minor allele homozygous + heterozygous vs. major allele homozygous), and recessive (minor allele homozygous vs. heterozygous + major allele homozygous).
Each genotype was analyzed independently to determine its association with response to chemotherapy and relapse.
2.5.2. Comparison of Proportions with χ2 Test
The χ 2 test was used to compare the proportions of patients according to the risk and genotypic factors. The time free of non-response to treatment was calculated from the date of diagnosis (biopsy) to the event.
2.5.3. Survival Analysis
The Kaplan-Meier method estimated survival curves for each genotype analyzed under the heritability models. The log-rank test was used to compare time to (non-response to treatment or relapse) between groups.
2.5.4. Multivariate Cox Regression Analysis
Were used to assess whether genotypes participated as prognostic factors for relapse and non-response to treatment adjusting for age, sex, clinical, histopathological characteristics and ICE treatment scheme (ICE: Ifosfamide + Carboplatin + Etoposide). The statistical package used for all analyses was SPSS 21.0 (Statistical Package for Social Sciences, SPSS Inc, Chicago, IL, USA). The p values were obtained with the log-rank test after employing the Bonferroni test for multiple testing, and statistical significance was set at p <0.05.
3. Results
3.1. Epidemiology, Clinical of the Central Nervous System Tumor Cohort
A cohort of 111 cases of central nervous system tumors that met the criteria was produced in a tertiary-level hospital. The epidemiological characteristics and tumor groups of the patients are shown in Table 1. The median age was 12 years (Q256-Q7515 years), and the men’s sex was predominant, N=61 (55%). The most frequent tumor was medulloblastoma N=31 (27.93%), high-grade tumors were the most frequent N=71 (64%), and the non-responder group N=83 (74.8%) was the most frequent. According to the frequency of treatment schemes, the ICE scheme (ifosfamide, carboplatin, and etoposide) ICE scheme was the most frequent of all the schemes administered N=48 (43.2%).
3.2. Survival Analysis
Kaplan Meier curves were performed for the ABCC transporters in the three models (dominant, codominant, and recessive) for each of the variables analyzed; Kaplan Meier curves showed that the ABCC1 r.5540G>C; rs12921623 gene was associated with an increased probability of non-response to treatment; under the codominant GG + CG model, the ABCC1 r.5540 G>C; rs12921623 variant was associated with an increased probability of non-response to treatment. (p=0.027) and dominant CC + CG vs. GG (p= 0.020) Figure 1, was also associated with an increased probability of relapse risk in the codominant model GG vs. CC (p=0.020) GG vs. CG (p=0.04), dominant CC + CG vs. GG (p=0.02) Figure 2.
Regarding the ABCC2 c. 3972C>T SNV, Kaplan Meier curves showed an increased risk of non-response to treatment in the codominant model (p=0.016) and the recessive model (p=0.013) Figure 3.
3.3. Correlation Between SNVs ABCC1 r.5540 G>C, ABCC2 c. 3972C>T and the Clinical Response and Relapse
A multivariate analysis was performed to estimate the influence of SNVs adjusted for sex, age, and clinical response. These results are shown in Table 2. A significant association was found between the ABCC1 r.5540 G>C; rs12921623 gene and non-response to treatment in patients in the codominant model; GG vs. GC (HR: 2.095, (CI95%:1.202-3.650 p=0.009) and in the dominant model CC+GC vs. GG (HR: 2.02, CI95%:1.199-3.421 p=0.008). No statistically significant association was found for the oth-er variants in the ABCC2 and ABCC4 genes.
The influence of these SNVs on relapse was also analyzed, adjusted for sex and age. These results are shown in Table 3. A significant association was found between ABCC1 r.5540 G>C; rs12921623 variant and relapse in the codominant model: GG vs. CC (HR:9.09, CI95%:1.04-78.85 p=0.04). A significant association was also found in the dominant model: CC+GC vs. GG (HR:3.912, CI95%:1.139-13.436 p=0.03).
A significant association was found between ABCC2 c. 3972C>T; rs3740066 variant and relapse in the recessive model: CC vs CT+CC (HR: 3.5, CI95%:1.02-12.17 p=0.04) Table 3.
4. Discussion
To our knowledge, this is one of the few studies describing the clinical significance of SNVs in ABCC with clinical non-response and relapse in pediatric patients with central nervous system tumors.
In our study, ABCC1 r.5540C>G; rs12921623 was significantly associated with treatment nonresponse and relapse in this cohort of pediatric patients with solid tumors. The multidrug resistance protein ABCC1 is an efflux pump located in the cell plasma membrane, which excretes various endogenous and exogenous compounds, including chemotherapeutic agents, which play an essential role in antineoplastic drug resistance in solid tumors. Although this SNV has not previously been associated with response or relapse, some studies have reported that SNVs in ABCC1, in non-coding regions such as introns, alter transporter expression, leading to an altered response to treatment [21].
Warren RB et al. (2008) discovered that two intronic region variants were significantly linked to methotrexate response in psoriasis patients. Carriers of these polymorphisms showed a poorer response to methotrexate treatment [22].
Tissue expression patterns and wide genetic variability make ABCC1/MRP1 an optimal candidate for use as a marker or member of a multiple marker panel to predict chemotherapy resistance [23].
The findings of this study also revealed an association of SNV ABCC2 c. 3972C>T; rs3740066 with relapse in the recessive model (p=0.04). According to a study in patients with epilepsy, the CT + TT genotypes were associated with increased resistance to antiepileptic drugs in people with epilepsy compared to the CC genotype (p= 0.038) [24]. According to a study in patients with epilepsy, the CT + TT genotypes were associated with increased resistance to antiepileptic drugs in people with epilepsy compared to the CC genotype [25]. This variant has been associated with reduced promoter activity and lower ABCC2 mRNA levels [26,27].
On the other hand, in colorectal neoplasms, the TT genotype was associated with greater severity of neurotoxicity syndromes when treated with fluorouracil, leucovorin, and oxaliplatin in individuals with colorectal neoplasms compared to CC + CT genotypes [28].
Hegyi M 2017 et al. found that the TT genotype was associated with reduced methotrexate concentrations in children with osteosarcoma compared to the CC + CT genotypes [29].
In patients with sarcomas treated with anthracyclines, the TT genotype was associated with shorter overall survival than CC + CT genotypes [30]. Thishya K et al. 2021 found that the variant was associated with mortality in renal transplant patients [31]. Numerous studies suggest that ABCC expression may be an indicator of chemotherapy efficacy [32,33,34,35,36].
Two major families of transporters are present in the blood-brain barrier: solute transporters (SLCs) and ATP-binding cassette (ABC) transporters. Efflux transporters play a crucial protective role by removing metabolic waste and preventing the entry of potential toxins and most therapeutic drugs that could affect the brain. The expression of transporters such as ABCB1, ABCC2, ABCG2, and ABCC4 at the blood-brain barrier is well established [37,38,39].
Resistance to chemotherapy can develop through several mechanisms. One suggested mechanism involves single nucleotide variants (SNVs) that affect the overexpression of ABC transporters. This overexpression can lead to increased drug efflux, which lowers the concentration of the drug in the cytoplasm. As a result, the drug’s effectiveness is reduced, potentially leading to the development of a drug-resistant phenotype. This variability may help explain the differences in patient responses and levels of toxicity [40,41,42,43].
Low expression levels of these MDR transporters, which may be caused by abnormalities in mRNA or defects in drug export proteins, can lead to the accumulation of drugs within cells. This occurs due to reduced export and slower removal of chemotherapeutic agents, potentially resulting in a prolonged cytotoxic effect. These conditions can negatively impact treatment response and decrease patient survival.
5. Conclusions
Our data suggests that genetic variants ABCC1 (rs12921623) and ABCC2 (rs3740066) may be crucial in predicting non-response and relapse in pediatric patients with central nervous system tumors.
The study of SNV in drug transport genes has the potential to provide valuable in-formation on predicting therapeutic responses to the use of different xenobiotics in the Mexican population and relapse. While genotyping response biomarkers for making more accurate predictions regarding reactions to chemotherapy drugs, it is also essential to consider other environmental factors.
Author Contributions
Conceptualization, L.M.T. and M.C.; Formal Analysis, LM.T.; M. C.; Investigation, LM.T.; JC. P.; and M.C.; Data Curation, JC.P.; Writing – Original Draft Preparation, LM. T. and M. C.; Writing – Review & Editing, L.V.; R.C.; A. A; A. D.; M.Z.; A.H. All authors contributed to the study conception and reviewed the manuscript.
Funding
Program E022 of the National Institute of Pediatrics supported this paper.
Institutional Review Board Statement
The study was conducted according to the Declaration of Helsinki. It was approved by the Research, Biosafety, and Ethics Committee (IRB) of the National Institute of Pediatrics on 31 January 2019, with approval number INP-061/2018. The committee’s approval has been renewed until 30 June 2025.
Informed Consent Statement
Informed consent was obtained from all individual participants included in the study.
Data Availability Statement
The datasets used and/or analyzed during the current study are available from the corresponding author upon reasonable request.
Conflicts of Interest
The authors report no conflicts of interest in this work.
References
- Ehrlich BS, McNeil MJ, Pham LT, et al. Treatment-related mortality in children with cancer in low-income and middle-income countries: a systematic review and meta-analysis. Lancet Oncol. 2023;24(9): 967-977. [CrossRef]
- Pote MS, Gacche, RN. ATP-binding cassette efflux transporters and MDR in cancer. Drug Discov Today. 2023; 28(5):103537. [CrossRef]
- Sajid A, Rahman H, Ambudkar SV. Advances in the structure, mechanism and targeting of chemoresistance-linked ABC transporters. Nat Rev Cancer. 2023; 23(11):762-779. [CrossRef]
- Kadioglu O, Saeed MEM, Munder M, et al. Effect of ABC transporter expression and mutational status on survival rates of cancer patients. Biomed Pharmacother. 2020; 131:110718. [CrossRef]
- Mansoori B, Mohammadi A, Davudian S, et al. The different mechanisms of cancer drug resistance: a brief review. Adv. Pharm. Bull. 2017; 7(3):339-348. [CrossRef]
- Yin J, Zhang J. Multidrug resistance-associated protein 1 (MRP1/ABCC1) polymorphism: from discovery to clinical application. Zhong Nan Da Xue Xue Bao Yi Xue Ban. 2011;36(10):927-38. [CrossRef]
- Conrad S, Kauffmann HM, Ito K, et al. Identification of human multidrug resistance protein 1 (MRP1) mutations and characterization of a G671V substitution. J Hum Genet. 2001;46(11):656-63. [CrossRef]
- Chen P, Yan Q, Xu H, et al. The effects of ABCC2 G1249A polymorphism on the risk of resistance to antiepileptic drugs: a meta-analysis of the literature. Genet Test Mol Biomarkers. 2014; 18(2):106-11. [CrossRef]
- Leandro K, Bicker J, Alves G, et al. ABC transporters in drug-resistant epilepsy: mechanisms of upregulation and therapeutic approaches. Pharmacol Res. 2019; 144:357-376. [CrossRef]
- Kiyotani K, Mushiroda T, Imamura CK, et al. Significant effect of polymorphisms in CYP2D6 and ABCC2 on clinical outcomes of adjuvant tamoxifen therapy for breast cancer patients. J Clin Oncol. 2010; 28(8):1287-93. [CrossRef]
- Gentiluomo M, Puchalt-García P, Galeotti AA, et al. Genetic variability of the ABCC2 gene and clinical outcomes in pancreatic cancer patients. Carcinogenesis. 2019;40 (4):544-550. [CrossRef]
- Campa D, Müller P, Edler L, et al. A comprehensive study of polymorphisms in ABCB1, ABCC2 and ABCG2 and lung cancer chemotherapy response and prognosis. Int J Cancer. 2012; 131 (12): 2920-2928. [CrossRef]
- Chen Z, Shi T, Zhang L, et al. Mammalian drug efflux transporters of the ATP binding cassette (ABC) family in multidrug resistance: A review of the past decade. Cancer Lett. 2016, 370;(1):153-64. [CrossRef]
- Xiao Q, Zhou Y, and Lauschke, VM. Impact of variants in ATP-binding cassette transporters on breast cancer treatment. Pharmacogenomics. 2020;21(18):1299–1310. [CrossRef]
- Megías-Vericat JE, Martínez-Cuadrón D, Herrero MJ et al. Impact of combinations of single-nucleotide polymorphisms of anthracycline transporter genes upon the efficacy and toxicity of induction chemotherapy in acute myeloid leukemia. Leuk Lymphoma. 2021; 62(3):659-668. [CrossRef]
- Butler E, Ludwig K, Pacenta HL, et al. Recent progress in the treatment of cancer in children. CA Cancer J Clin. 2021;71(4):315-332. [CrossRef]
- Sharma P, Singh N, Sharma S. Genetic variations in ABC transporter genes as a predictive biomarker for toxicity in North Indian lung cancer patients undergoing platinum-based doublet chemotherapy. J Bochum Mol Toxicol. 2023; 37(3):e23269. [CrossRef]
- Tian C, Ambrosone CB, Darcy KM, et al. Common variants in ABCB1, ABCC2 and ABCG2 genes and clinical outcomes among women with advanced stage ovarian cancer treated with platinum and taxane-based chemotherapy: a Gynecologic Oncology Group study. Gynecol Oncol. 2012;12483):575-81. [CrossRef]
- Rivera R. Protocols of seguro popular whichare based on children’s oncology group guidelines. 1st ed. Editores de Textos Mexicanos, S.A de C.V, México 2010.
- Chukwueke UN, and Wen PY. Use of the Response Assessment in Neuro-Oncology (RANO) criteria in clinical trials and clinical practice. CNS oncology. 2019; 8(1): CNS28. [CrossRef]
- Leschziner G, Zabaneh D, Pirmohamed M, et al. Exon sequencing and high-resolution haplotype analysis of ABC transporter genes implicated in drug resistance. Pharmacogenet Genomics. 2006;16(6):439–450. [CrossRef]
- Warren RB, Smith RL, Campalani E, et al. Genetic variation in efflux transporters influences outcome to methotrexate therapy in patients with psoriasis. J Invest Dermatol. 2008;128(8):1925–1929. [CrossRef]
- Kunická T, Souček P. Importance of ABCC1 for cancer therapy and prognosis. Drug Metab Rev. 2014;46(3):325-42. [CrossRef]
- Qu J, Zhou BT, Yin JY, et al. ABCC2 polymorphisms and haplotype are associated with drug resistance in Chinese epileptic patients. CNS Neurosci Ther. 2012;18(8): 647-51. [CrossRef]
- Escalante-Santiago D, Feria-Romero I.A, Ribas-Aparicio RM, et al. MDR-1 and MRP2 Gene Polymorphisms in Mexican Epileptic Pediatric Patients with Complex Partial Seizures. Front Neurol. 2014; 9(5):184. [CrossRef]
- Haenisch S, May K., Wegner D, et al. Influence of genetic polymorphisms on intestinal expression and rifampicin-type induction of ABCC2 and on bioavailability of talinolol. Pharm. Genom. 2008;18(4):357–365. [CrossRef]
- Haenisch S, Zimmermann U, Dazert E, et al. Influence of polymorphisms of ABCB1 and ABCC2 on mRNA and protein expression in normal and cancerous kidney cortex. Pharm. J. 2006; 7 (1):56–65. [CrossRef]
- Cecchin E, D’Andrea M, Lonardi S, et al. A prospective validation pharmacogenomic study in the adjuvant setting of colorectal cancer patients treated with the fluorouracil/leucovorin/oxaliplatin (FOLFOX4) regimen. Pharmacogenomics J. 2013; 13(5):403-9. [CrossRef]
- Hegyi M, Arany A, Semsei AF, et al. Pharmacogenetic analysis of high-dose methotrexate treatment in children with osteosarcoma. Oncotarget. 2017; 8(6):9388-9398. [CrossRef]
- Virgili-Manrique AC, Salazar J, Arranz MJ, et al. Pharmacogenetic Profiling in High-Risk Soft Tissue Sarcomas Treated with Neoadjuvant Chemotherapy. J Pers Med. 2022;12(4): 618. [CrossRef]
- Thishya K, Sreenu B, Raju S, Kutala VK. Impact of Pharmacogenetic Determinants of Tacrolimus and Mycophenolate on Adverse Events in Renal Transplant Patients. Curr Drug Metab. 2021; 22(5):342-352. [CrossRef]
- Megías-Vericat, JE, Martínez-Cuadrón D, Solana-Altabella, A et al. Systematic Review of Pharmacogenetics of ABC and SLC Transporter Genes in Acute Myeloid Leukemia. Pharmaceutics. 2022; 14(4):878. [CrossRef]
- Conseil G, Deeley RG, Cole SP. Polymorphisms of MRP1(ABCC1) and related ATP-dependent drug transporters. Pharmacogenet Genomics. 2005;15(8): 523–533. [CrossRef]
- Tanaka M, Okazaki T, Suzuki H, et al. Association of multi-drug resistance gene polymorphisms with pancreatic cancer outcome. Cancer. 2011; 117(4):744–751. [CrossRef]
- Hlaváč V, Václavíková R, Brynychová V, et al. Role of Genetic Variation in ABC Transporters in Breast Cancer Prognosis and Therapy Response. Int J Mol Sci. 2020; 21(24):9556. [CrossRef]
- Xiao H, Zheng Y, Ma L, et al. Clinically-Relevant ABC Transporter for Anti-Cancer Drug Resistance. Front Pharmacol. 2021; 12: 648407. [CrossRef]
- Baltira C, Aronica E, Elmquist WF, et al. The impact of ATP-binding cassette transporters in the diseased brain: Context matters. Cell Rep Med, 2024; 5 (6),101609. [CrossRef]
- Møllgård K, Dziegielewska KM, Holst CB et al. Brain barriers and functional interfaces with sequential appearance of ABC efflux transporters during human development. Sci Rep. 2017;7(1) 11603. [CrossRef]
- Ek CJ, Wong A, Liddelow SA, et al. Efflux mechanisms at the developing brain barriers: ABC-transporters in the fetal and postnatal rat. Toxicol Lett. 2010; 197(1):51–59. [CrossRef]
- Pote MS, Gacche RN. ATP-binding cassette efflux transporters and MDR in cancer. Drug Discov Today. 2023; 28(5), 103537. [CrossRef]
- Sone K, Oguri T, Uemura T, et al. et al. Genetic variation in the ATP binding cassette transporter ABCC10 is associated with neutropenia for docetaxel in Japanese lung cancer patient’s cohort. BMC Cancer, 2019;19(1): 246. [CrossRef]
- Robey RW, Pluchino KM, Hall MD, et al. Revisiting the role of efflux pumps in multidrug-resistant cancer. Nat Rev Cancer. 2018;18(7),452–464. [CrossRef]
- Afifah NN, Diantini A, Intania R, et al. Genetic Polymorphisms and the Efficacy of Platinum-Based Chemotherapy: Review. Pharmgenomics Pers Med. 2020; 13:427-444. [CrossRef]
Figure 1.
Comparison of treatment response probability curves for the ABCC1 r.5540 G>c; rs12921623 variant between patients with and without SNV. A) Co-dominant model and B) dominant model.
Figure 1.
Comparison of treatment response probability curves for the ABCC1 r.5540 G>c; rs12921623 variant between patients with and without SNV. A) Co-dominant model and B) dominant model.
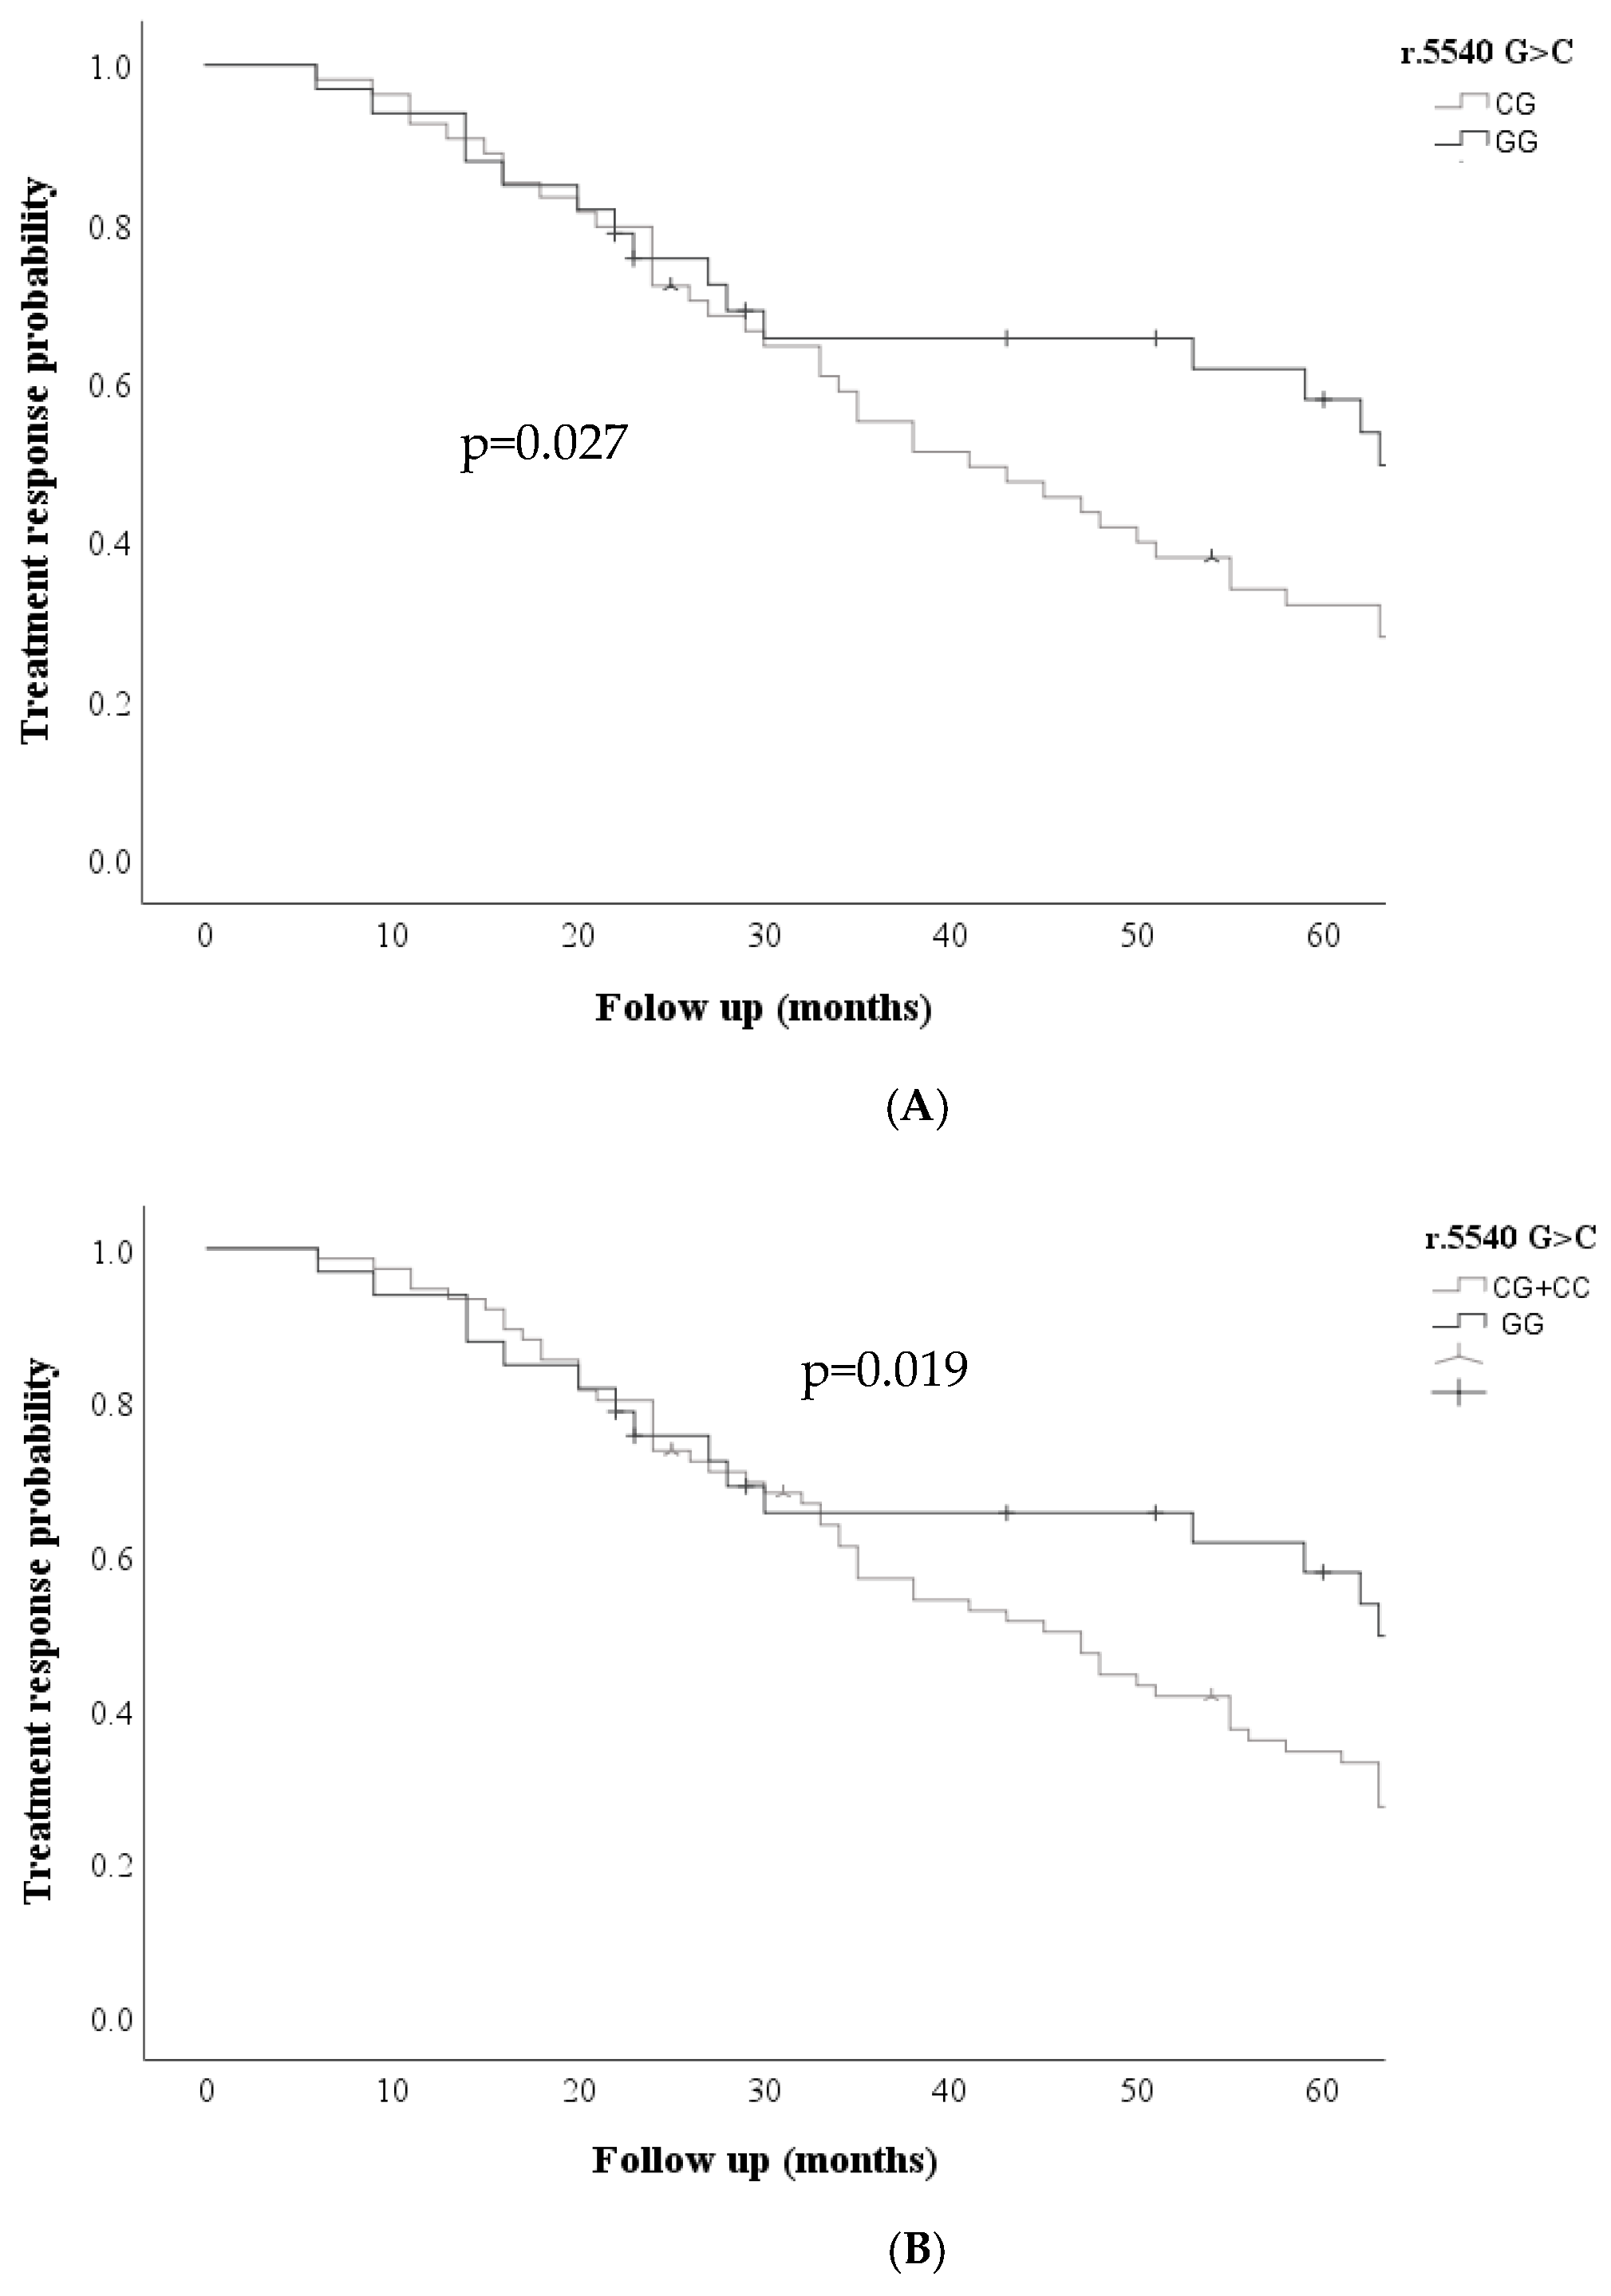
Figure 2.
Comparison of relapse probability curves for the ABCC1 r.5540C>G rs12921623 variant between patients with and without SNV (A) and (B) co-dominant model, (C) dominant model.
Figure 2.
Comparison of relapse probability curves for the ABCC1 r.5540C>G rs12921623 variant between patients with and without SNV (A) and (B) co-dominant model, (C) dominant model.
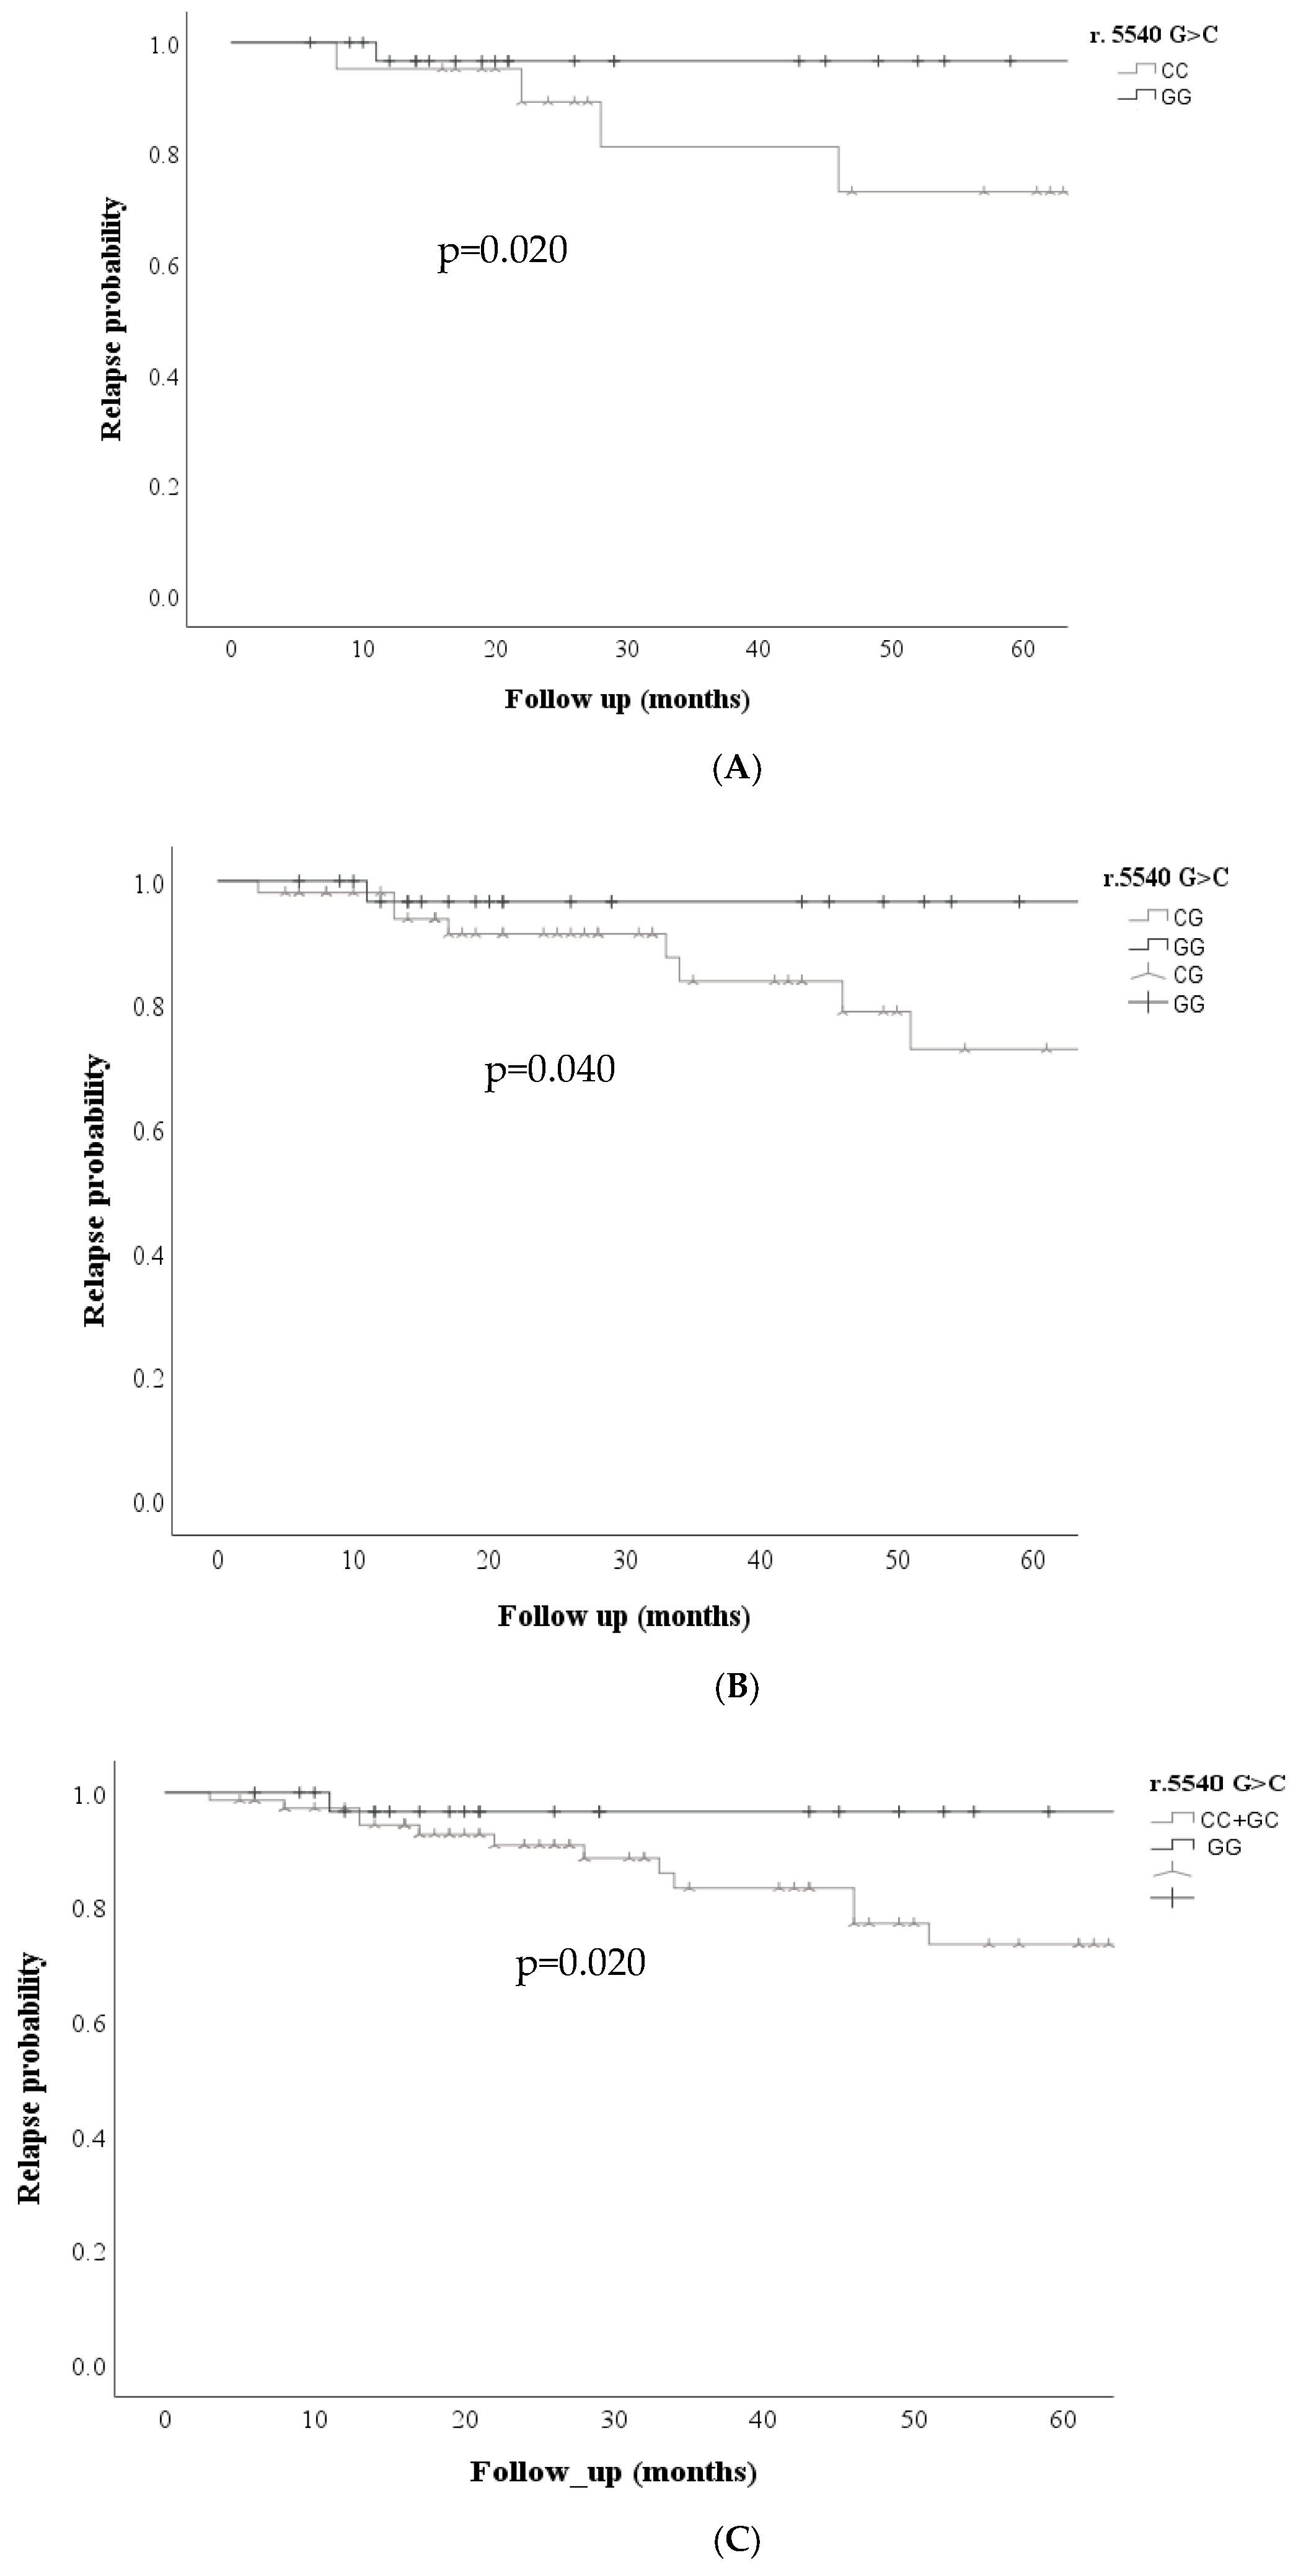
Figure 3.
Comparison of treatment response probability curves for the ABCC2 c. 3972C>T; rs3740066 variant between patients with and without SNV. (A) Co-dominant model and (B) Recessive model.
Figure 3.
Comparison of treatment response probability curves for the ABCC2 c. 3972C>T; rs3740066 variant between patients with and without SNV. (A) Co-dominant model and (B) Recessive model.
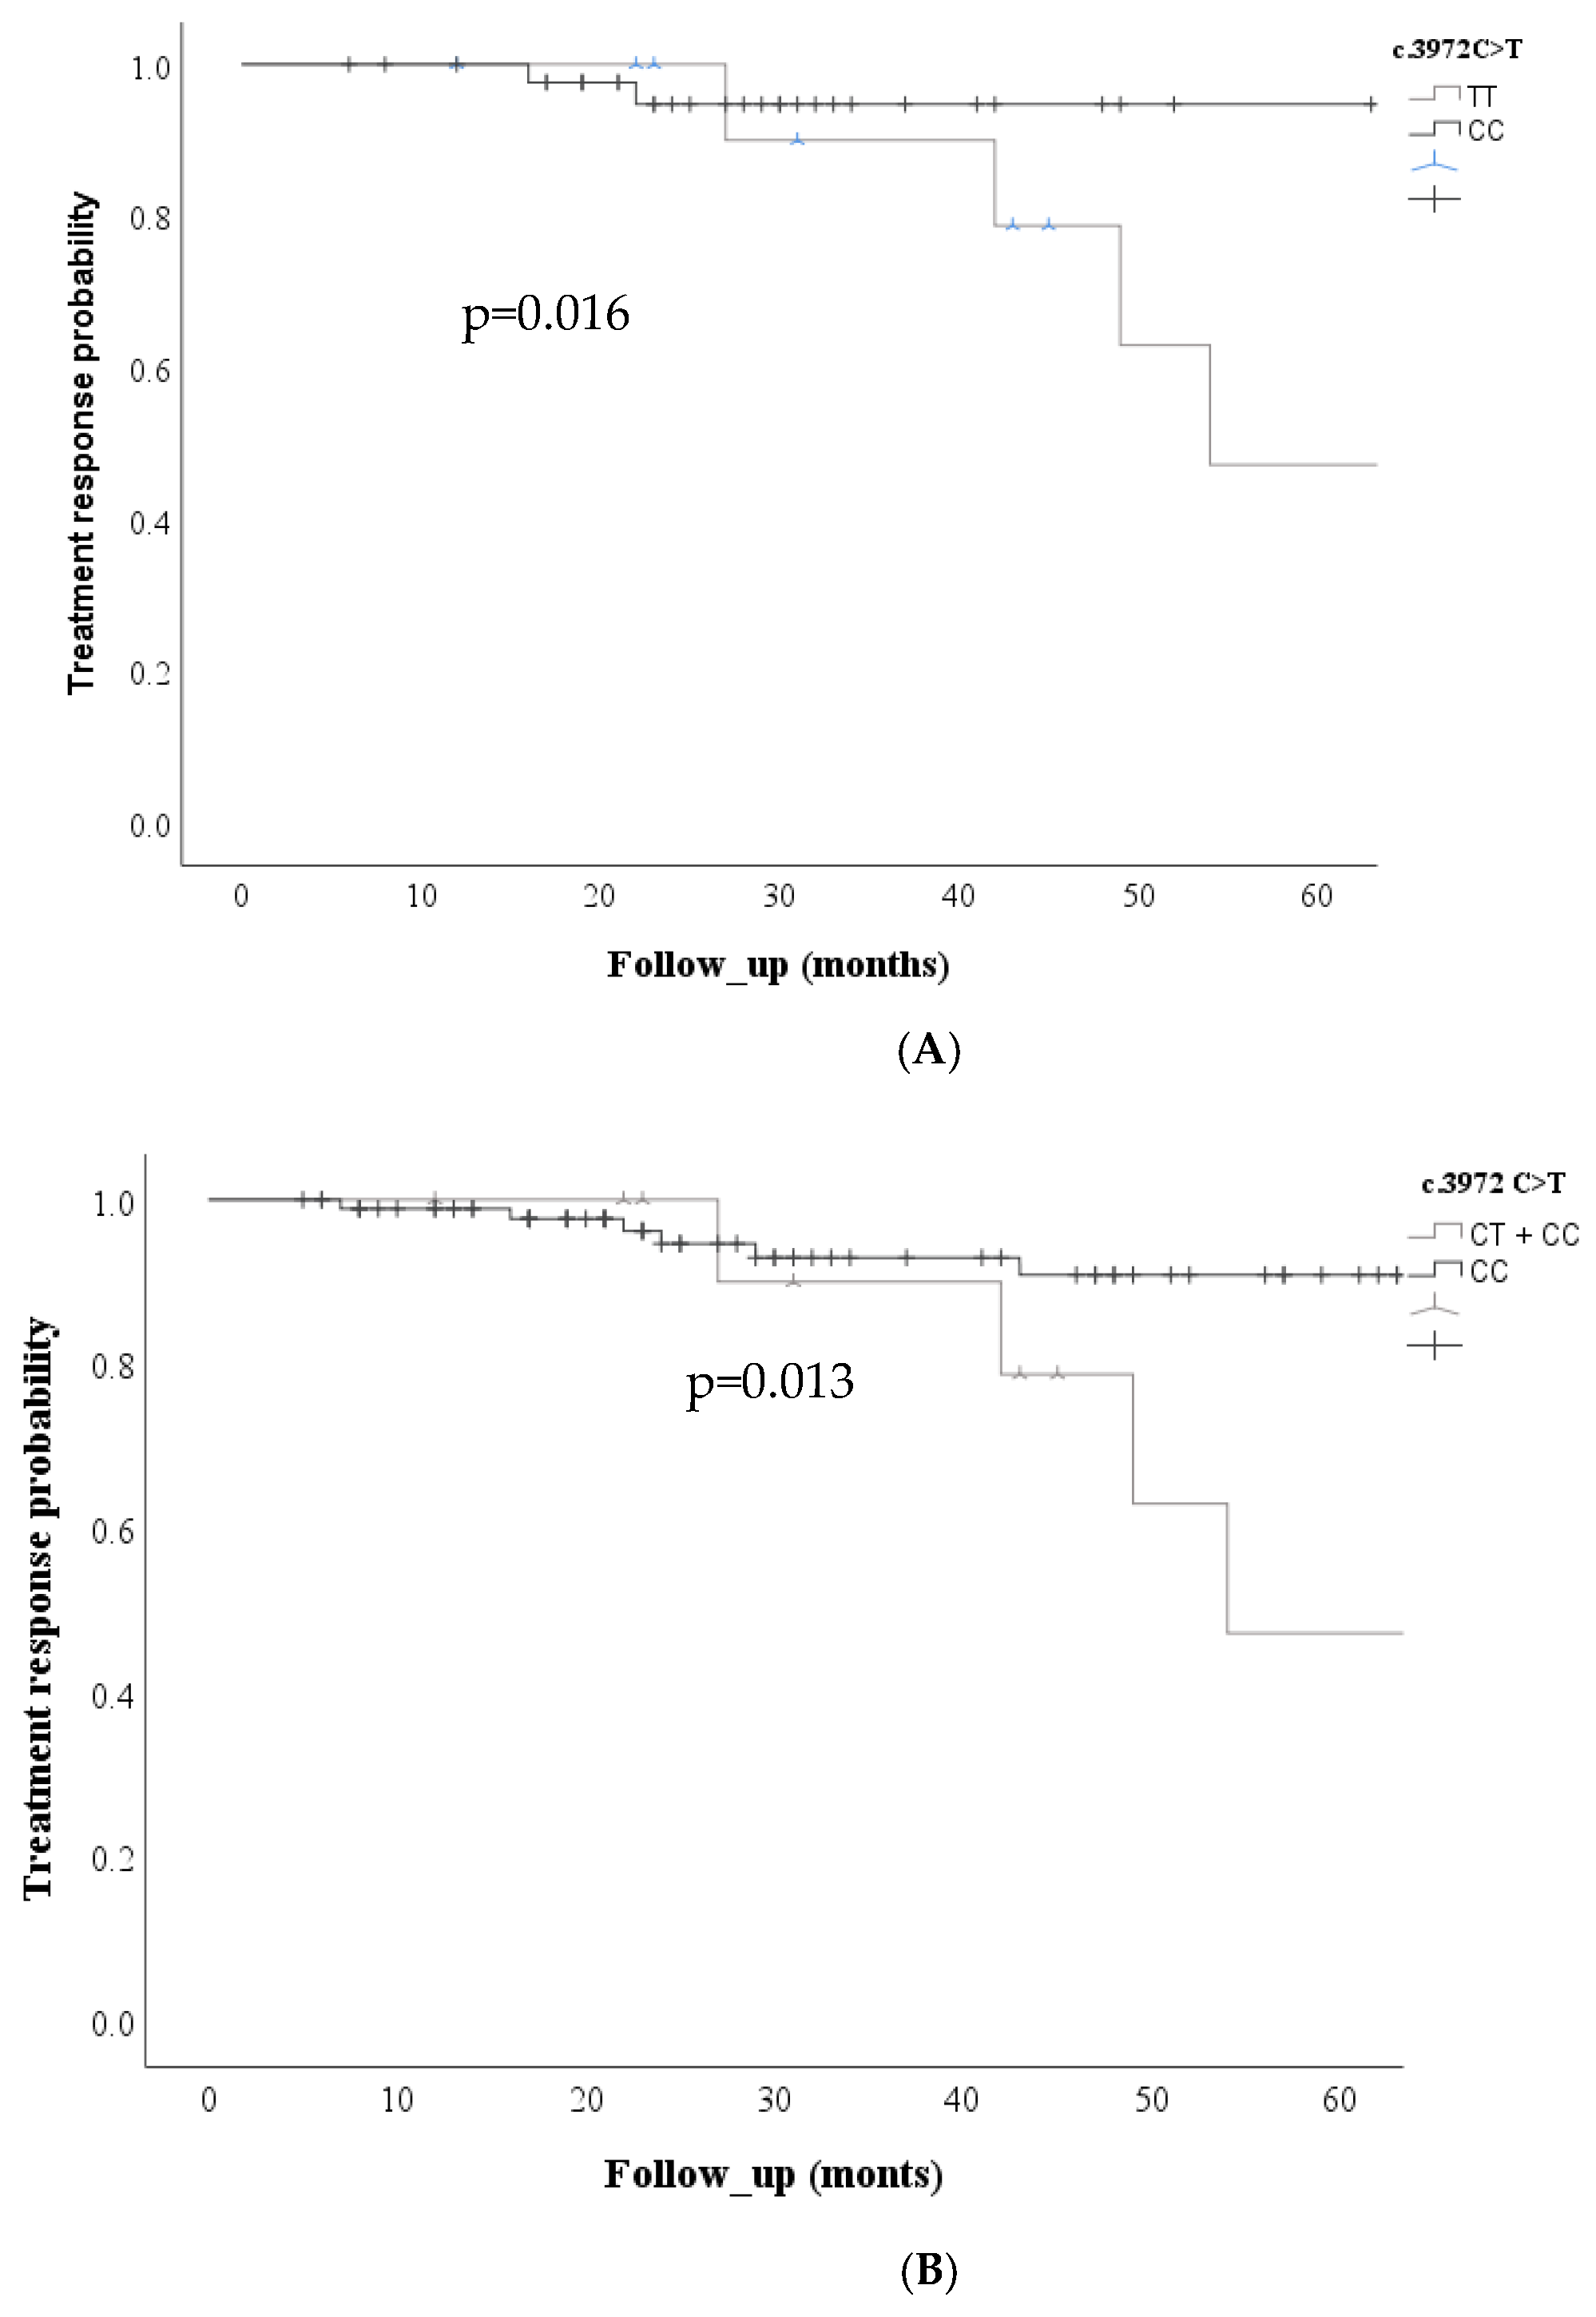

Table 1.
Characteristics of the study cohort.
| Characteristic | N (%) |
|---|---|
| Sex | |
| Men | 61 (55) |
| Women | 50 (45) |
|
Age at diagnosis (years) Median |
12 |
| Histologic lineage | |
| Glioma | 61 (55.0) |
| Embryonary | 39 (35.1) |
| Germinal | 8 (7.2) |
| Other | 3 (2.7) |
| Malignancy grade | |
| High grade | 71 (64) |
| Low grade | 40 (36) |
| Clinical response | |
| Complete response | 22 (19.8) |
| Partial response | 14 (12.6) |
| Stable disease | 24 (21.6) |
| Progression | 51 (45.9) |
| Treatment scheme | |
| ICE | 48 (43.2) |
| No ICE | 63 (56.8) |
| Relapse | |
| Present | 21 (18.9) |
| Absent | 90 (81.1) |
Table 2.
Multivariate analysis using the Cox proportional hazards model non-response.
| Gene | Codominant | Dominant | Recessive | |||||
|---|---|---|---|---|---|---|---|---|
| HR (95% CI) | p-value | HR (95% CI) | p-value | HR (95% CI) | p-value | HR (95% CI) | P value | |
| ABCC1 | ||||||||
| r.5540 G>C | 1.778 (0.918-3.44) | 0.088 | 2.095 (1.202-3.650) | 0.009* | 2.02 (1.199-3.421) | 0.008* | 1.22 (0.656-1.919) | 0.678 |
| Age | 0.962 (0.908-1.019) | 0.190 | 0.928 (0.882-0.977) | 0.004 | 0.931 (0.892-0.972) | 0.001 | 0.928 (0.886-0.971) | 0.001 |
| Sex | 0.590 (0.297-1.171) | 0.132 | 0.640 (0.392-1.044) | 0.074 | 0.692 (0.433-1.05) | 0.082 | 0.678 (0.440-1.044) | 0.078 |
|
ABCC2 c. 3972C>T |
0.710 (0.317-1.588) |
0.404 |
0.907 (0.565-1.456) |
0.685 |
0.895 (0.554-1.384) |
0.568 |
0.845 (0.401-1.782) |
0.658 |
| Age | 1.026 (0.531-1.982) | 0.939 | 0.733 (0.459-1.171) | 0.194 | 0.941 (0.901-0.963) | 0.007 | 0.939 (0.900-0.9809) | 0.004 |
| Sex | 0.953 (0.900-1.009) | 0.097 | 0.941 (0.898-0.986) | 0.011 | 0.734 (0.472-1.142) | 0.170 | 0.728 (0.468-1.131) | 0.158 |
HR: Hazard ratio, CI: Confidence interval. * Statistical significance was calculated using a multivariate Cox regression.
Table 3.
Multivariate analysis using the Cox proportional hazards model for Relapse.
| Gene | Codominant | Dominant | Recessive | |||||
|---|---|---|---|---|---|---|---|---|
| HR (95% CI) | p-value | HR (95% CI) | p-value | HR (95% CI) | p-value | HR (95% CI) | P value | |
|
ABCC1 r.5540 G>C |
9.09 (1.04-78.85) |
0.04* |
8.161 (0.909-73.29) |
0.06 |
3.912 (1.139-13.436) |
0.03* |
2.69 (0.89-8.11) | 0.07 |
| Age | 0.53 (0.09-2.66) | 0.42 | 0.432 (0.114-1.629) | 0.21 | 0.924 (0.847-1.007) | 0.07 | 0.98 (0.88-1.08) | 0.70 |
| Sex | 1.01 (0.87-1.17) | 0.88 | 0.942 (0.803-1.104) | 0.45 | 1.18 (0.502-2.773) | 0.70 | 0.60 (0.20-1.76) | 0.35 |
|
ABCC2 c. 3972C>T |
0.37 (0.08-1.56) |
0.17 |
1.26 (0.36-4.42) |
0.71 |
1.06 (0.35-3.19) |
0.91 |
3.5 (1.02-12.17) |
0.04* |
| Age | 0.99 (0.86-1.14) | 0.93 | 0.97 (0.85-1.14) | 0.66 | 0.99 (0.89-1.119 | 0.93 | 0.98 (0.87-1.10) | 0.76 |
| Sex | 0.46 (0.09-2.38) | 0.35 | 2.36 (0.65-8.57) | 0.19 | 1.58 (0.54-4.57) | 0.39 | 1.03 (0.32-3.30) | 0.95 |
HR: Hazard ratio, CI: Confidence interval. * Statistical significance was calculated using a multivariate Cox regression.
Disclaimer/Publisher’s Note: The statements, opinions and data contained in all publications are solely those of the individual author(s) and contributor(s) and not of MDPI and/or the editor(s). MDPI and/or the editor(s) disclaim responsibility for any injury to people or property resulting from any ideas, methods, instructions or products referred to in the content. |
© 2025 by the authors. Licensee MDPI, Basel, Switzerland. This article is an open access article distributed under the terms and conditions of the Creative Commons Attribution (CC BY) license (http://creativecommons.org/licenses/by/4.0/).
Copyright: This open access article is published under a Creative Commons CC BY 4.0 license, which permit the free download, distribution, and reuse, provided that the author and preprint are cited in any reuse.


