
Submitted:
10 December 2025
Posted:
12 December 2025
You are already at the latest version
Abstract
Rapid urbanization has intensified challenges in urban water management, highlighting the growing importance of sponge city development. However, at present, the unique role of groundwater aquifers in regulating the water cycle process has been ignored, and overly simplistic construction methods are relied on. To address these limitations, this study introduces an integrated spatial optimization framework for urban-scale sponge ecosystems by coupling hydrodynamic modeling, ArcGIS-based spatial analysis, and Monte Carlo simulation. The framework systematically incorporates surface water depth, formation lithology, and groundwater depth to construct a comprehensive evaluation system for sponge ecological suitability. Shenzhen serves as the empirical case to demonstrate the framework’s applicability. Surface water depth is quantified using the Finite-Volume Community Ocean Model (FVCOM), while groundwater conditions are assessed through a calibrated groundwater model, thereby improving the scientific precision of ecological suitability evaluation. Leveraging GIS and Monte Carlo simulation, the study develops a streamlined yet robust methodology for optimizing the spatial configuration of sponge ecological infrastructure. Building on ecological redlines and protected areas, a landscape ecology–oriented matrix–corridor–patch analysis is applied to delineate ecologically suitable zones. Tailored planning and management strategies are subsequently formulated for each zone based on its ecological attributes. The findings offer methodological advances for sponge ecosystem construction and contribute to enhancing urban climate resilience and adaptive capacity under accelerating environmental change.
Keywords:
sponge city
; groundwater
; FVCOM
; ecosystem
1. Introduction
The increase of extreme climate events and rapid urbanization has significantly raised the risk of urban flooding and storm surges in coastal areas [1]. According to “the World Meteorological Organization’s Atlas of Deaths and Economic Losses from Extreme Weather, Climate and Water Events (1970-2019)” (WMO,2021), there were more than 11,000 disaster events worldwide during this period. These events caused more than 2 million deaths and economic losses about $3.64 trillion [2,3]. Confronted with such a serious situation, traditional flood management strategies have proven inadequate to address these challenges. There is an urgent need for a more proactive and comprehensive solution to urban water management. The sponge ecosystems, which view cities as entire ecosystems, aim to enhance resilience and reduce environmental risks of natural disasters.
The construction of the sponge ecosystem is mainly based on landscape, and the research object is the flood storage wetland system, including the storm-flood area, wetland, river, low-lying land, etc. Sponge ecosystem mainly refers to the construction of a complete, connected, storm-flood patch-corridor-matrix network. Furthermore, it provides the basis for land function utilization and sponge city design [4]. Han Jingyan constructed a sponge ecosystem from three dimensions: storm-flood corridor inundation, and pollution using GIS [5]. Guo Rong et al. analyzed the superimposed flood area and potential runoff, identified the critical points, regions, and corridors of stormwater, and proposed reconstruction measures for river corridors and runoff depression, to achieve the purpose of stormwater safety [6]. Ding et al. built evaluation factors for point water sources, inundated patches and river corridors, and determined urban hazard buffers, urban elastic space areas and ecological conservation areas [7].
Based on the theory of landscape ecology, Zhang et al.[8] determined the space and location of three aspects: regional flood safety, runoff pollution control, and water resource protection, providing a basis for sponge city management. They tried the construction methods and practices of sponge ecosystem from different angles and levels [9].
There are two types of methods for the construction of urban-scale sponge ecosystems: one is the construction method based on an index evaluation system, and the other is the risk assessment construction method based on scenario simulation. The first method is to evaluate and analyze the factors that can affect stormwater safety in the region directly or indirectly, and then determine the safety level, function analysis, and system spatial structure. The second method refers to the simulation and analysis of the research area to finally obtain the functional partition and system spatial structure [5]. In practical application, the first method is suitable for the comprehensive planning of cities or large regions. The second approach is suitable for detailed risk analysis and response development.
There are three specific construction methods for the first method, and their principles and characteristics are shown in Table 1 below.
First of all, the factor superposition evaluation method is utilized to assess various impact factors collectively. These factors include soil conditions, the type of underlying surface, geological features, hydrology, and more. GIS is utilized for spatial analysis, including overlaying storm inundation areas with hydrological features, and assessing flood detention capacity. Because of its good visualization effect, the GIS tool is widely used in the factor superposition method. Dai Bingwu et al. [10] built a sponge ecosystem by comprehensively superimposing storm inundation range, water system, flood detention wetland, and other influencing factors using ArcGIS tools. Jiang Hongye et al. [11] applied fuzzy set theory to make decisions, that is, weighted impact factors by combining subjective and objective methods, and constructed a sponge ecosystem with ArcGIS. Secondly, the logical rule grouping method uses the logical combination principle to establish a new set of logical combinations by coupling two systems. This method is much clearer than the factor superposition method. It can also be used in combination with qualitative and quantitative research. Jiao et al. [4] constructed the structure of “spot - corridor - base” to calculate the amount of water that the patch needs to control and the depth at which it can be stored. Finally, the source-corridor method uses the patch-corridor-matrix model in landscape ecology to analyze the spatial pattern. This approach takes into account the interactions between different elements and determines how they affect the design of sponge ecosystems. Ding et al. [7] constructed a sponge ecosystem of “point water patch - inundated matrix - river corridor” in Xiamen, and proposed high, medium, and low-level stormwater prevention and control schemes.
The second method employ hydrological models to simulate inundation depth, duration, and area under different rainfall scenarios, and then determine the sponge ecosystem according to simulation results. The advantage of this method is that it can capture the entire rainfall-runoff process and provide the temporal and spatial dynamics of runoff. However, this method requires a large amount of monitoring data for model calibration. Wei Bowen et al.[12] simulated the flood inundate process in various scenarios based on the hydrodynamic coupling model, then used GIS to deal with terrain and other impact factors, and finally assessed the flood risk level in the study area. Li Jianhua et al. [13] used the SCS model to calculate the precipitation in the study area under extreme rainfall conditions and conducted a flood simulation analysis in Fangshan District of Beijing with the help of ArcGIS, and constructed the spatial structure of the sponge ecosystem according to the average submergence depth of each basin and river course. Taking Wuhan Optical Valley Center as an example, Ren Zhibo et al. [14] applied MIKE URBAN and MIKE 21 models to build 1D and 2D models of the study area, coupled with MIKE FLOOD to calculate the flood inundating process under the scenario of a rainstorm once in 50 years, and drew the flood risk map of the region.
In addition to the index evaluation system method and the risk assessment method, there are historical data statistical analysis method and the coupling method based on remote sensing and ArcGIS. While each method offers unique advantages, integrating multiple methods could provide a more comprehensive approach to design effective sponge ecosystems. We provide new analytical methods and improve the reliability of sponge ecosystem construction by multi-method integration. The specific steps are as follows:
1. The range, depth, and location of surface water were simulated through hydrodynamic model FVCOM.
2. The distribution of geological lithology, groundwater depth, and surface water depth were extracted by GIS technology.
3. Sponge ecological evaluation factors were selected based on the evaluation method of rainwater infiltration potential.
4. Each sponge’s ecological evaluation factor was graded.
5. The Monte Carlo method and multi-factor comprehensive evaluation method were used to construct a sponge ecologically suitable area evaluation system.
6.The sponge ecosystem was constructed according to the “matrix - corridor - patch” method of landscape ecology.
2. Materials and Methods
2.1. Study Area
The study area, Shenzhen, has been one of the fastest-growing cities in the world since the 1990s. Located in southern Guangdong Province, it is a major financial and technology hub in southern China. In the past 40 years, with the rapid development of the city, the population has increased from 30,000 in 1979 to the current 20 million.
With the intensification of urbanization, farmland and green space have been greatly reduced. From 1980 to 2008, the urbanization process area increased from 9% to 40%, and the urbanization rate reached 100% in 2016. In 2016, Shenzhen was listed as the second batch of sponge city pilot cities by China’s Ministry of Housing and Urban-Rural Development. As of July 2023, the total area of construction land in Shenzhen’s sponge cities exceeded 330 km2.
Shenzhen is located in South China (between 113°43 ‘-114°38’ E, 22°24 ‘-22°52’ N), Figure 1. Shenzhen faces Daya Bay and Mirs Bay to the east, the mouth of the Pearl River and Lingdingyang to the west, and Hong Kong across the Shenzhen River to the south. with a total land area of 1997.47 km2.
2.1.1. Climatic Conditions
Shenzhen has a subtropical maritime momsoon climate with an average annual temperature of 23 °C and an average annual relative humidity of 79%. It has long summers and short winters, a mild climate with plenty of sunshine and plenty of rainfall. Summer is affected by the Pacific monsoon, the prevailing southeast wind, high temperatures, and rain. The average annual precipitation in Shenzhen is 1935.8 mm. Temporal distribution of precipitation is uneven, with 86% of precipitation concentrated between April and September. The uneven distribution of precipitation leads to floods in summer and water shortages in other seasons. In addition, Shenzhen is often affected by weather disasters such as extreme precipitation, typhoons, and cold waves. Shenzhen is affected by about 4.8 typhoons a year on average. Typhoons are often associated with extreme rainfall, which can lead to larger-scale precipitation. This phenomenon is a significant factor contributing to weather disasters in Shenzhen.
2.1.2. Hydrology and Groundwater
Shenzhen’s hydrological conditions are complex, with 183 reservoirs and more than 160 rivers. Among them, there are six major rivers, including Shenzhen River, MaozhouRiver, Longgang River, Guanlan River, Pingshan River, and Dasha River.The average annual surface runoff in Shenzhen is 1.81 billion m3. The total amount of groundwater resources is 650 million m3/year, and the actual groundwater extraction is only 5.9 million m3/year, with low degree of groundwater resources exploitation.
2.1.3. Geology and Geomorphology
The terrain of Shenzhen is diverse. Hilly areas account for about 39.6% of the total area. Terraces, plains, and plateaus each account for more than 20% of the total area. The lower mountains occupy the smallest area. The terrain elevation varies greatly, but the ground slope is generally slower. More than 60% of the area has a slope of less than 10°. Shenzhen is surrounded by mountains and the sea, with complex geological conditions. Quaternary sediments are widely distributed in alluvial valleys and coastal plains, forming aquifers with high permeability and porosity. The maximum thickness of the Baoan Plain is 60 m. Sediments are interlayered with silt and quartz sand regolith. The tropical climate influences the even distribution of sediments along the foothills, with an average thickness of about 30 m. Shallow aquifers contain thicker groundwater. Groundwater circulation is limited due to bedrock’s low porosity and metamorphic processes sealing fractures. It primarily occurs in local tectonic fault zones.
2.1.4. Data
The extreme precipitation data of Shenzhen were monitored for 12 hours by 71 stations of the Shenzhen Meteorological Bureau and recorded every 30 minutes. The simulation used measured rainfall data as input(return-period of 100 years). The spatial distribution of precipitation in Shenzhen was generated by the inverse distance interpolation algorithm. ( http://weather.sz.gov.cn/)
The DEM data of Shenzhen City is extracted from remote sensing satellite and SRTM DEM data source provided by USGS with a resolution of 30m. The lithologic zoning data of Shenzhen City are derived from the hydrogeological map constructed by GBGP (unpublished regional Hydrogeological survey report of the Geological Bureau of Guangdong Province, China, with a scale of 1:200,000,1980) and Yang Equal in 2007. Shenzhen groundwater level data and calibration data are derived from GBGP (unpublished Regional Hydrogeological Survey Report of Guangdong Geological Bureau, China), and well restoration test analysis is derived from the groundwater regional survey report of Shenzhen Water Bureau.
2.2. Methods
2.2.1. FVCOM Hydrological Model and Water Depth
The FVCOM model is based on unstructured triangular meshp [15], and the original three-dimensional equations are differentially discretized by the finite volume method and internal and external mode separation techniques. First, complex boundaries and terrain can be accurately fitted by the vertical σ coordinate system and the horizontal grid of the unstructured triangle; Secondly, the finite volume method improves the computational efficiency and can satisfy the conservation of mass and momentum within the range. Third, the dry-wet discrimination technology can accurately identify the degree of surface water by unifying the viscous boundary layer supplemented at the bottom of the σ coordinate system into the triangular mesh. FVCOM can ensure the conservation of each physical quantity not only on each unit, but also in the whole calculation area, formula (2-1), and the governing equation in the x direction [16].
Where x,y,z——the middle, north and vertical axes of the rectangular coordinate system;
u,v,w——The velocity component in the x, y, z direction;
ρ——density;
Pa——sea surface pressure;
PH——hydrostatic pressure;
f——coriolis parameter;
Km——Vertical rotation viscosity coefficient.
When a triangular mesh is removed from the calculation, it is because the mesh is dry, its inner flow rate is 0, and its boundary flow is 0. Therefore, to ensure the conservation of fluid volume, the flow calculation only studies the wet mesh with flow.
The calculation range of this model covers the whole city of Shenzhen, as shown in Figure 2. Specifically, it is 113°43 ‘-114°38’ east longitude and 22°24 ‘-22°52’ north latitude. The study area is divided into 233,220 triangular nodes and 461,916 triangular units. We assign the corresponding DEM to each grid. The average side length of the grid is 100m and the time step is 0.2 seconds. Since the simulation target is the depth of surface water under the extreme precipitation scenario in Shenzhen City, the coastal boundary conditions are set to 0, and the initial conditions are 0.
2.2.2. GIS technology, Lithology Zoning, and Underground Depth
The hydrogeological zoning map of Shenzhen was extracted and generalized by GIS. The geological zoning map was drawn based on the regional hydrogeological survey report of the Geological Bureau of Guangdong Province, China, and divided Shenzhen into 6 hydrogeological units [17,18]. Different hydrogeological units have different lithology and permeability coefficients (K value). It can represent the difficulty of rainwater infiltration under different lithology conditions, that is, the thicker the groundwater aquifer, the larger the K value, the better the permeability effect, and the easier it is to store a large amount of rainwater.
The groundwater depth factor is subtracted by the surface elevation DEM and the steady-state groundwater level distribution model of Shenzhen city using GIS spatial computing technology. After precipitation, the water seeps into the ground through sponge facilities, and we have conducted long-term monitoring of groundwater depth and groundwater table fluctuations, as well as a quantitative assessment of the storage capacity of shallow aquifers. Among them, the groundwater level distribution is simulated by the numerical model of Shenzhen groundwater level under the steady-state condition constructed by MODFLOW.
2.2.3. Classification of Single Factor Based on Infiltration of Sponge City
The study’s objective on the distribution of sponge ecologically suitable areas is to promote rainwater infiltration, and the influencing factors of rainwater infiltration are selected to analyze, including surface water depth, stratigraphic lithology zoning, and groundwater depth. The surface water depth indicates the amount of water that rainwater penetrates the soil. When enough water seeps into the soil, the rate of infiltration becomes smaller and smaller over time, eventually reaching a plateau. Too much water, more than the amount of water in a certain period, will lead to the risk of flooding. The formation lithology and its K value represent the amount and speed of rainwater infiltration during the infiltration process. Groundwater depth indicates the storage space after groundwater infiltration, for example, the greater the depth of the buried depth within 3-6m, the greater the rainwater storage space.
The three single evaluation factors need to be calculated in spatial superposition on the GIS platform, so the classification of the number of grades should be consistent. The depth of surface water is divided into six levels according to how deep it is submerged; The lithology of strata can be divided into 6 grades according to the different properties and the size of the K value. The depth of the groundwater is divided into six levels according to the depth of the groundwater. We rate the scale from 0 to 5 based on the ease of infiltration and infiltration of rainwater. A score of 5 indicates that it is most conducive to rainwater infiltration and penetration, and a score of 0 indicates that it is least susceptible to rainwater infiltration and penetration.
2.2.4. Assessment of Sponge Ecological Suitability Area by Monte Carlo Method
The Monte Carlo method is a computational method based on statistical and probability theory methods. The Monte Carlo method first considers the mutual independence of each evaluation factor variable, formula (2-2).
When the output Y is determined by the fundamental variables x1, x2,... When xn is determined by a functional relationship, the model is:
Where x -- input quantity, x= x1, x2,... xn.
We use the Monte Carlo method for random calculations and assume that the weights are evenly distributed in the interval [0,1]. Monte Carlo sampling was used to extract 10000 groups of evaluation factors and assign weights, and then the probability distribution of scoring results was obtained. The mean represents the score of the ecologically suitable areas for sponges, while the standard deviation indicates the level of uncertainty in the study. Through the comparison and analysis of the results, we determined the distribution of sponge ecologically suitable areas in Shenzhen. A sponge ecosystem was then constructed based on the characteristics of these suitable areas [19].
3. Results
3.1. Water Depth Factor and Classification
Stagnant water is water that accumulates due to blockage or failure to drain. The depth of water accumulation indicates that the degree of water accumulation is mainly affected by meteorological conditions (precipitation), topography (surface elevation), drainage systems, and other factors. In this study, FVCOM was used to simulate the once-in-a-hundred-year precipitation process and build a water accumulation depth model with surface elevation in Shenzhen. The results showed the location and range of water accumulation depth in Shenzhen and graded according to the difficulty of infiltration and the risk of causing waterlogging..
3.1.1. Numerical Simulation of FVCOM Hydrological Model
The simulated precipitation data were obtained from 74 stations of Shenzhen Meteorological Bureau in 30 minutes, and the spatial distribution of precipitation in Shenzhen was generated by the inverse distance interpolation algorithm. The simulation will start at 12 o ‘clock on October 9, 2021, and the simulation time will be 12 hours. Using the rainfall threshold of Shenzhen, the total rainfall of 12 hours return-period of 100 years is 371mm, as shown in Figure 3. Through the FVCOM simulation of once-in-a-century precipitation, the final simulation result is the spatial distribution of water depth factors in Shenzhen.
Figure 3 shows that the precipitation space presents an uneven spatial distribution. The maximum precipitation in Nanshan and Shenzhen Bay is between 350-400mm, while the precipitation in Bao ‘an Dapeng, and Pingshan is between 100-150mm. The precipitation in Futian, Luohu, and Longgang is about 250-300mm.
3.1.2. Verification of Water Depth Factor
The website of Shenzhen Meteorological Bureau provides the spatial distribution of waterlogging points in Shenzhen. It is the actual urban waterlogging point checked under extreme precipitation in Shenzhen. Compared with the corresponding FVCOM simulation output results, the spatial location of the distribution of waterlogging points is in good agreement, that is, 84% of the actual waterlogging points are within the range of waterlogging in the simulation results, as shown in Figure 4. The difference between the waterlogging points and the simulation results is that the actual urban environment is more complex than the numerical simulation influence factors, such as blockage events caused by human activities, and some waterlogging points near rivers.
3.1.3. Classification of Water Depth Factors
The depth of water accumulation is the main evaluation index of rainwater infiltration and urban waterlogging. If the depth of the water is too small, no rainwater can seep into the soil. If the depth of water is too large, the risk of urban waterlogging increases. Figure 5 shows the spatial distribution of water depth, and Table 2 shows the classification of water depth. We refined the scale into six based on the need for rainwater infiltration. The National Disaster Prevention Code points out that the depth of urban water is divided into three grades: D< 0.5m, 0.5 ≤ D< 1.0m, D ≥ 1.0m, and the water is mild, moderate, and serious.
The water depth is between 0.2-0.5m, and some water depth is moderate. It can penetrate the soil and does not have the risk of waterlogging. The highest score is 5 points. The water depth of 0-0.2m covers the largest area, mainly in Baoan Plain, Nanshan Shenzhen Bay, and around Longgang District. The water accumulation is small but can permeate groundwater, with a score of 4. If the water is between 0.5-1.0m and has a certain risk of flooding, the score is 3 points. The water at 1.0-2.0m is at risk of flooding, and the rainwater needs to be quickly drained through rainwater pipes and pumps, and the score is 2 points. The water depth is 0m, there is no water here, there is no condition for infiltration, and the score is 1. A water depth of more than 2m is a high-risk water area, and drainage facilities need to be reformed to avoid disasters, so the score is 0.
3.2. Stratigraphic Lithology Factors and Classification
Stratigraphic lithology refers to the genesis and hardness of rocks, according to which rocks are classified into grades, such as granite, sedimentary rock, sandstone, etc. [20]. Different formation lithology has different permeability coefficients K. Permeability coefficient K is one of the indexes that comprehensively reflect soil permeability. The larger the value of K, the stronger the water permeability. The porosity reflects the proportion of all pore space volumes in the sample volume. Therefore, formation lithology, porosity, and K value are the main indexes to judge rainwater infiltration into groundwater aquifers.
3.2.1. Formation Lithology Factors
The hydrogeological zoning map of Shenzhen was drawn by searching literature [21]. According to the regional hydrogeological survey report of Guangdong Provincial Geological Bureau of China and the hydrogeological map of borehole geology, Shenzhen is divided into 6 hydrogeological units, as shown in Figure 6. In the figure, there are different lithology and permeability coefficient K values according to different hydrogeological units. It can indicate the difficulty of infiltration of rainwater with different lithologies. The larger the K value, the better the permeability effect, and the easier it is to adsorb and store a large amount of precipitation. Sponge facilities covering urban aquifers with a permeability coefficient of K greater than 1×10⁻⁵ m/s can have a strong permeability potential[22].
In Figure 6, the strata in Shenzhen are generalized into six hydrogeological units. Sandstone, shale, and siltstone are primarily found in the Longhua, Longgang, and Luohu districts, particularly in Guanlan Valley and Longgang River Valley. In contrast, sandstone, slate, and phyllite are mainly located in the Pingshanhe and Dapeng areas. It is important to note that the porosity of both types of sandstone is low. Additionally, volcanic sediments are predominantly distributed along the Longgang River and the Dapeng Peninsula. It allows this hydrological unit to absorb a significant amount of rainwater. Yantai Mountain and some areas of Guangming are mainly distributed with highly weathered granite. Highly dense granite is distributed in Maluan Mountain, Wutong Mountain, Dapeng Peninsula, and other places, due to its high density, the rainwater infiltration potential is weak. Quaternary sediments are located in alluvial valleys and coastal plains, namely Guangming, Bao an, and Nanshan areas, which have strong rainwater infiltration potential.
3.2.2. Classification of Geological Lithologic Factors
In combination with Figure 6, the lithology spatial distribution map, and Table 3 lithology grading, different lithologies have different characteristics. First, the volcanic sediments are mainly composed of tertiary tuff, loose volcanic rocks, and tuff. The permeability is high, the K value is 1×10⁻³m/s, and the score is 5. Quaternary sediments are aquifers with high permeability and porosity located in alluvial valleys and coastal plains, mainly in Bao’an Plain, and vary in thickness between 30 - 60m, with a maximum thickness of 60 m. The sediment is heterogeneous, the surface is composed of coarse sand and silty sand, the valley is gravel, and the coastal area is sandy clay, with a K value of 1×10⁻⁴m/s and a score of 4. Highly weathered granite, mainly distributed in Yangtai mountain. The structural density is very low, the surface is broken and weathered sediment, and the rock zone can usually extend to 30m below the surface, K value of 5×10⁻⁵-1×10⁻⁷m/s, a score of 3. Sandstone, SLATE, and phyllite, because these rocks have undergone large rock static loads, have very low porosity. The basement unit is a Paleozoic rock under the metamorphism of sandstone and shale, and the porosity is also very low. The metamorphism process greatly reduces the fracture pore size. The K value is 5×10⁻⁶-8×10⁻⁷m/s, and the score is 2 points. Sandstone, shale, siltstone, the Upper Paleozoic - Mesozoic unit consists of a sequence of quartz sandstone, siltstone, sandy siltstone, and shale, with sediments intersecting together. The sediment is lithiated, and even in coarser sediments, the porosity is very low, with a K value of 5×10⁻⁶-6×10⁻⁷m/s and a score of 1. Finally, the highly dense granite, in this unit is a faulted structure but has a thin weathering zone. Due to the steep shape and the downward movement of the rock due to gravity factors, the permeability is very low at 5×10⁻⁶-4×10⁻⁷m/s, and the lowest score is 1 point.
3.3. Groundwater Depth Factors and Classification
Groundwater depth refers to the distance from the surface of the groundwater to the surface. Groundwater depth and aquifer thickness have spatial heterogeneity. For example, in mountainous areas with high surface cutting intensity, groundwater depth is deeper, and aquifer thickness is different greatly. However, in the plain area, the surface cutting is weak, the groundwater is buried shallowly, and even emerges from the surface to form swamps, and there is no obvious difference in the thickness of aquifers. In the same area, groundwater depth and aquifer thickness are related to seasons. The thickness of the aquifer decreases with less rainwater recharge in less rainy season. In the rainy season, recharge increases, and groundwater depth becomes shallower. Groundwater depth can reflect the storage capacity of groundwater.
3.3.1. Groundwater Depth Factor
In this study, the steady-state model of groundwater level in Shenzhen was reconstructed through numerical simulation analysis, and this model has been calibrated. The surface elevation of Shenzhen City was extracted by ArcGIS, and then the spatial distribution of groundwater depth was obtained by subtracting the groundwater level from the surface elevation. Groundwater depth factor has a significant influence on rainwater infiltration. The fluctuation of groundwater depth and water table after rainfall infiltration is monitored for a long time, and the storage capacity of shallow aquifers is evaluated. The results show that groundwater responds differently to rainwater in different hydrogeological regions. The depth of groundwater burial can reflect the storage capacity of groundwater. For ordinary rainfall events, the water level rises 0.3-0.5m, while for extreme precipitation events, the maximum groundwater depth varies from 0.5-1m, and the cumulative increment in the rainy season is less than 3m. If the underground water depth is low, the water storage space is less. It is not conducive to rainwater infiltration. The groundwater depth is very high, such as greater than 30m. It also proves that there is no infiltration capacity here. Therefore, it is necessary to classify the groundwater depth as one of the evaluation factors of sponge ecologically suitable areas.
Shenzhen’s hydrogeological environment is complex, coastal mountains, there are foothills, and hills. Therefore, the spatial distribution of groundwater depth is highly uneven. Figure 7 shows the distribution of groundwater depth in Shenzhen. At the coastal border of Baoan, the 0.5-2.5km-wide strip of Shekou Port and Yantian Port has a groundwater depth of 0-3m, and the groundwater level is close to the surface, with less storage space. Part of the water table in the Longgang and Longhua valleys is close to the surface, causing soil to accumulate water and increasing the risk of flooding. The foothills of Yantai Mountain, Wutong Mountain, and Maluan Mountain have suitable groundwater depths and are natural water storage containers.
3.3.2. Classification of Groundwater Depth
The groundwater depth factor was graded according to the influence of groundwater depth on groundwater storage capacity (Table 4). First of all, since the cumulative increment of groundwater in the rainy season is less than 3m, considering that there is more groundwater storage space and it is not higher than the surface, the buried depth of 3-6m is the highest grade 5. Foothill areas with a water table of more than 4m have significant stormwater storage capacity and are therefore rated on a 4-point scale. The groundwater buried depth of 0-3m has a certain rainwater storage capacity but also has the risk of flooding, and the score is 3 points. The groundwater depth is 10-30m. It proves that it is difficult for rainwater to penetrate the aquifer under an ordinary environment, and the score is 2 points. The groundwater buried depth is greater than 30m, the groundwater circulation is limited, the groundwater is concentrated in the local structural fault zone, the infiltration capacity is weak, and the score is 1. If the groundwater is higher than the surface, the risk of soil water flooding is greater, so the score is 0.
3.4. Monte Carlo Factor Calculation Results
After analyzing the results of sponge ecological suitability by a single factor, we divided each factor into 6 grades according to whether it is suitable for rainwater infiltration. Firstly, the mesh of three sponge ecological suitability factors (surface water depth, stratigraphic lithology zoning, and groundwater depth) was unified and revamped. Each factor is divided into a spatial grid on the ArcGIS platform, and the grid is divided into 500m×500m. Secondly, based on the MATLAB platform, the Monte Carlo method is used for numerical simulation: 10,000 groups of three single factors are randomly selected to assign weights. It is assumed that the weights are uniformly distributed and that the weight intervals of the three evaluation factors are all [0,1]. Finally, the corresponding grid of each evaluation factor is calculated by 10000 times space superposition. Each calculation of the weighted weight of the three evaluation factors adds up to 1. Single-factor evaluation grade area ratio, as shown in Table 5; The area proportion of each sponge ecoregion after Monte Carlo factor calculation is shown in Table 6.
4. Discussion
4.1. Sponge ecological Suitable Area Evaluation
4.1.1. Sponge Ecological Suitable Area Evaluation
A sponge ecological suitable area is an area with natural conditions and an ecological environment suitable for sponge city construction or good sponge function. Sponge functions include water absorption, storage, seepage, water purification when it rains, and “release” and use of the stored water when needed. The average calculation of the combined superposition results of the three evaluation factors was carried out, and the grades were divided into four levels. The higher the score, the more suitable the sponge ecological zone was to be constructed. The sponge ecological optimum zone was 3-5 points, the sponge ecological suitable zone, the sponge ecological sub-appropriate zone, and the sponge ecological unsuitable zone were 2-3 points, 1-2 points, and 0-1 points respectively. The spatial distribution of specific sponge ecological suitable areas is shown in Figure 8.
Sponge ecological optimum zone (3-5 points): Because the regional distribution of 3-4 points and 4-5 points are integrated, this area is summarized as the ecological optimum zone. It is based on the conservation of water ecology and ecological conservation. Rainwater can penetrate smoothly into the aquifer, and it has sufficient storage space for groundwater. There is a certain amount of water on the surface of the area that can seep down. The lithology is permeable and the groundwater has storage space. It is mainly distributed in Baoan District and Guangming District of Shenzhen, as well as parts of Pingshan District. These areas can accommodate infiltration sponge facilities: rain gardens, biological retention ponds, sinking green Spaces, constructed wetlands, etc.
Sponge ecological suitable area (2-3 points): This area is a buffer zone for sponge ecology and focuses on ecological restoration. There is a certain amount of water on the surface of the area, and the formation lithology penetration is slow or the groundwater storage space is less. This area is mainly distributed around Yantai Mountain, Nanshan District, Luohu District, part of the Dapeng Peninsula, and the coastal narrow border zone of the Pearl River estuary. There is not enough water storage space in the coastal narrow boundary zone mainly because the groundwater depth is close to the surface, and the area near Yantai Mountain is difficult to penetrate because of the poor permeability of lithology. The sponge design of the area can be complemented by sponge facilities to slow runoff, reduce peak runoff, or transfer rainwater, in addition to infiltration functions. For example, based on rain gardens, biological retention pools, and sinking green Spaces, green roofs, grass ditches, and vegetation buffer zones can be combined.
Sponge ecological sub-suitable area (1-2 points): The ecological base of this area is poor, and it mainly protects ecological security. There is a large amount of water on the surface of the area, and the geological conditions are not easy to penetrate, the underground water is too small, and even the phenomenon of water in the soil appears in some locations. It is mainly distributed in Dapeng, Yantian, Longhua, and some areas of Longgang. The sponge facilities in this area are mainly to slow down runoff and reduce peak value. It also needs to be equipped with drainage facilities, such as green roofs, vegetation gullies, rain tanks, and a rainwater network.
Sponge ecological unsuitable area (0-1 points): This area is mainly prone to geological disasters, and ecological safety should be ensured to prevent urban waterlogging. It is mainly distributed in Maluan Mountain, Wutong Mountain, and some areas of Dapeng. There is too much surface water in this area, or the mountain aquifer is very thin and not permeable, or the groundwater table is flat with the surface and there is no groundwater storage space. According to the above situation, it is not easy to place sponge facilities, but mainly to increase a large number of drainage facilities for rainwater quick drainage to prevent urban waterlogging.
4.1.2. Uncertainty Analysis of Sponge Ecological Suitable Area
This study conducted uncertainty analysis by calculating the standard deviation of the spatial superposition of the three evaluation factors, as shown in Figure 9. The higher the standard deviation value, the farther away from the average value, the more unstable it is, and the greater the risk coefficient, ranging from 0 to 1. On the contrary, the smaller the standard deviation value, the more stable the system and the less risk.
As shown in Figure 9, the standard deviations of most spaces are small. It proves that the scoring grades of the three evaluation factors are the same, and the risk of sponge ecological construction is small. The high scores of Nanshan, Futian, and Luohu are because the geological conditions of the three regions are highly dense granite. Which is not easy to penetrate, and the score is 0, which is caused by a large gap between the two evaluation factors. The construction of sponge facilities in the three regions has certain risks. The reason for the high standard deviation near Daya Bay is that although the volcanic deposits have good permeability, there are mainly mountains here, there is no water on the surface, and the mountain area is not easy to build sponge facilities, so it has certain risks.
4.2. Optimization of Spatial Structure of Sponge Ecosystem
According to the spatial distribution of the above-mentioned sponge ecological suitable areas, combined with the existing landscape planning and urban planning of Shenzhen, the spatial structure of the sponge ecosystem of “sponge ecological matrix-sponge ecological corridor-sponge ecological patch” was constructed based on the theory of “matrix-corridor-patch”. Formulate stormwater management objectives and planning approaches for each district [23].
The spatial structure of the sponge ecosystem in Shenzhen was constructed by using the distribution diagram 9 of Sponge City’s suitable area, namely the most suitable area, suitable area, sub-suitable area, and unsuitable area of sponge ecology, combined with the ecological spatial pattern of “four belts and eight corridors” in Shenzhen’s existing territorial spatial master plan.
First, as shown in Figure 10, the distribution of sponge ecological suitable areas was coupled with the ecological protection red line and the distribution of major rivers in Shenzhen. Shenzhen’s ecological protection red Line (2021-2035) is a deep green natural ecological reserve, and the stability of the natural ecological area can ensure the safety of the natural ecological environment. Natural ecological reserves include forest parks, parks, and so on. In the sponge planning and design of this part, transformation is prohibited, and ecological restoration is the main thing to reduce the interference of urban construction on the natural ecosystem.
Secondly, we used the landscape analysis method of “matrix - corridor - patch” and combined it with the overall landscape planning of Shenzhen city to build the spatial structure of sponge ecology, as shown in Figure 11. The ecological matrix of the sponge is an ecological protection area controlled by the natural ecological red line of Shenzhen City. It is mainly distributed in Dapeng District, Pingshan District, Yantai Mountain, and Wutong Mountain. Most of these areas are natural ecological environments, and urban development and construction are prohibited [24,25]. The main sponge ecological corridor in Shenzhen is dominated by major rivers. They are the Guanlan River corridor, Dashahe River corridor, Maozhou River - Xixiang River corridor, Pingshan River corridor, Longgang River corridor, and Shenzhen River corridor. We combine the river with the surrounding green space as a sponge ecological corridor. It is an important storm-flood safety space for water transmission, water retention, and pipe network drainage. Each corridor is connected with an ecological matrix, wetland patch, and urban green patch, forming a systematic interwoven spatial network. Spongy ecological patches are composed of wetland patches and urban green patches. Wetland patches are mainly distributed in the areas of Maozhou River, Shenzhen Bay, Guanlan River, and Pingshan River. It has the function of conservation and protection of groundwater resources, prohibits mining, and can carry out regular monitoring. Urban green patches are mainly urban green Spaces and urban parks. It is mainly distributed in Futian, Nanshan, and other areas. These areas are important parts of stormwater retention and can regulate urban microclimate. Other areas can be protected, reconstructed, and planned according to the spatial distribution of the sponge ecoregion.
4.3. Optimization Strategy of Sponge Ecosystem Functional Area
The main goal of the sponge ecosystem research is that the structure of the urban-scale ecosystem is not easily destroyed, and the functions of the system are fully exerted. The primary objective of sponge ecosystem research is to ensure that the urban-scale ecosystem structure remains intact and that the system’s functions are fully utilized. It is scientific to construct the spatial structure of the sponge ecosystem according to the geological conditions, climate characteristics, and groundwater environment of different cities [26]. In the special planning phase of Sponge City, various stormwater control objectives and management strategies are implemented based on the characteristics of different functional areas. It can maximize the effectiveness of Sponge City planning and ensure scientific, rational stormwater management, Table 7.
5. Conclusions
In this paper, we constructed an urban-scale sponge ecosystem by combining hydrodynamic modeling with ArcGIS analysis. From the perspective of rainwater infiltration, we selected the multi-factor comprehensive evaluation method to evaluate the system. First, we identified the ecological evaluation factors for the sponge system and assessed each factor on a graded scale. The spatial location and size of surface water depth were determined through FVCOM simulations. For groundwater analysis, we utilized the ArcGIS platform to extract data on stratigraphic lithology zoning and the spatial distribution of groundwater depth. Secondly, we use the Monte Carlo method to calculate the allocation weight and space superposition of random evaluation factors, and then construct the sponge ecological suitable area evaluation model and carry out uncertainty analysis. Finally, based on the ecological red line and the designated ecological protection areas of the study area, we constructed the spatial structure of the sponge ecosystem. Additionally, we divided the ecologically suitable areas using the landscape ecology analysis method known as “matrix - corridor - patch.” We plan and optimize management strategies according to the distinct characteristics of each ecological functional area.
There are notable variations in surface water depth and geological conditions across different regions, as well as regional differences in groundwater recharge potential. The combination of these factors will lead to increased uncertainty and increase potential risks. In practical application, urban land use can be rationally planned according to the characteristics of different sponge ecological zones, such as the most suitable area to develop parks, green spaces, wetlands, etc., while the unsuitable area is mainly to ensure urban safety. Design the corresponding stormwater management facilities, such as infiltration facilities, and the second suitable area should be equipped with drainage facilities in addition to detention and runoff mitigation facilities; In sponge ecological buffer zone, vegetation restoration, wetland construction and other measures were used to restore water ecology; Increase groundwater recharge and improve water resource utilization efficiency through rainwater infiltration and storage facilities in suitable and most suitable areas, to optimize urban planning, improve rainwater management efficiency, improve ecological environment, and increase water resource utilization rate.
In addition, on the architectural scale, this study provides a scientific basis for the location of buildings. The site selection will give priority to ecologically suitable areas for construction to reduce the risk of flood disasters. At the same time, the above research results also provide key parameters for the waterlogging control design of the building basement and the development of underground space. In addition, the study systematically supports the optimization of sponge facility design, such as optimizing the LID facility combination scheme of architectural groups (such as the proportion of permeable pavement, green roof coverage, etc.) to improve the efficiency of stormwater management and realize the organic connection between the building drainage system and the urban sponge network.
This study presents a spatial optimization framework for urban sponge ecosystems. It combines integrated hydrodynamic modeling, ArcGIS spatial analysis, and Monte Carlo simulation. The framework aims to optimize urban sponge ecosystems by addressing significant shortcomings of traditional approaches that often overlook groundwater dynamics and oversimplify construction practices. Based on key factors such as surface water depth, stratigraphic lithology, and groundwater depth, a comprehensive evaluation system of sponge ecological suitability was established. Taking Shenzhen City as an example, the effectiveness of this method is verified, and the scientific rigor of ecological suitability assessment is improved. Based on ecological red lines and protected areas in the study area, we delimited the ecologically suitable areas by using the “matrix - corridor - patch” analysis method based on landscape ecology. On the urban scale, it can provide help for rational planning of urban land use and stormwater management. On the architectural scale, it provides systematic technical support for the scientific location of buildings and the design optimization of sponge facilities. In the future, we will include more types of data with higher precision, and consider more influencing factors to optimize the study. Our research contributes to improving urban climate resilience and enhancing urban resilience in the face of environmental change.
Author Contributions
Conceptualization, M.J. and T.Y.; methodology, M.J.; software, Q.Z.; validation, Q.Z., J.Y. and M.J.; formal analysis, M.J.; investigation, M.J.; resources, Y.S. and Y.Z.; data curation, Q.Z.; writing—original draft preparation, M.J.; writing—review and editing, Q.Z.; visualization, J.Y.; supervision, X.X.; project administration, M.J.; funding acquisition, Y.T. and M.J. All authors have read and agreed to the published version of the manuscript.
Funding
The study was supported by Shenzhen Basic Research General Project(Grant. No.JCYJ20250604135903005), Additional support was the National Natural Science Foundation of China (Grant Nos. 42477053 and 42071244).
Conflicts of Interest
The authors declare no conflicts of interest.
References
- Deng, JF; Zhang, R; Chen, S; et al. Spatiotemporal evolution and influencing factors of flood resilience in Beibu Gulf Urban Agglomeration. International Journal of Disaster Risk Reduction 2024, 103, 104025. [Google Scholar] [CrossRef]
- Wang, LH; Cui, SH; Li, YZ. A review of the flood management: from flood control to flood resilience. Heliyon 2022, 11(8). [Google Scholar] [CrossRef]
- Wang, N; Sun, FB; Koutsoyiannis, D. How can Changes in the Human-Flood Distance Mitigate Flood Fatalities and Displacements?. Geophysical Research Letters 2023, e2023GL105064. [Google Scholar] [CrossRef]
- Jiao, S; Han, J.Y; Zhou, M; et al. Study on urban low-impact development model based on stormwater safety pattern. Geographical Research 2018, 37(09), 1704–1713. [Google Scholar]
- Han, JY. Research on urban low-impact development model based on stormwater safety pattern. In Hunan University; 2018; pp. 12–18. [Google Scholar]
- Guo, R; Wu, T; Huang, MS. Study on construction and planning measures of rain flood safety pattern in Harbin. China Urban Planning Society, Guiyang City People’s Government New Normal: Inheritance and change - Proceedings of the 2015 China Urban Planning Annual Conference (01 Urban Safety and Disaster Prevention Planning),2015, 203-204.
- Ding, SY; Zeng, SP; Tian, J. Simulation and design strategy of flood safety pattern in Xiamen based on waterlogging disaster prevention and control. Urban Architecture 2017, 11(33), 118–122. [Google Scholar]
- Zhang, QP; Li, XC; Chen, YF. Study on the security pattern of urban storm-flood landscape under the background of sponge city. Modern Urban Research 2016, (07), 6–11. [Google Scholar]
- Chaitanya, JC; Sridharan, B; Kuiry, SN. The Rain-on-Grid Modeling Approach in Hydrological and Hydraulic Processes over a River Basin . World Environmental and Water Resources Congress; 2024. [Google Scholar]
- Dai, BW; Zeng, LT; Han, XL. The lowest cost route selection of scenic tour routes based on ecological security pattern: A case study of Fubucket Scenic Spot in Pingjiang County, Hunan Province. Modern Urban Research 2015, (01), 97–103. [Google Scholar]
- Jiang, HY; Deng, SH. The practical exploration of multi-factor comprehensive evaluation method in sponge city special planning. Planners 2019, (21), 77–84. [Google Scholar]
- Wei, B; Li, YK; Qi, YH. Flood risk assessment based on hydrodynamic and fuzzy integrated model. Water Resources and Hydropower (English and Chinese) 2022, (9), 45–56. [Google Scholar]
- Li, JH; Zhang, XC; Ren, BB. A study on regional storm-flood safety pattern under the concept of resilient urban and rural areas: A case study of Fangshan District in Beijing. Journal of Hebei University of Technology (Social Science Edition) 2021, (2), 79–85. [Google Scholar]
- Ren, ZB; Fu, XL; Li, NS. Risk analysis of urban waterlogging prevention: A case study of Wuhan Optics Valley Central City. Civil Engineering 2019, 8(2), 233–243. [Google Scholar]
- Zhang, ZK; Ling, MX; Lin, W; et al. “Yanshanian movement” induced by the westward subduction of the paleo-pacific plate. Solid Earth Science 2020, 5(2), 103–114. [Google Scholar]
- Chen, CS; Liu, HD; Beardsley, RC; et al. An unstructured grid, finite-volume,three-dimensional,primitive equations ocean model: Application to coastal ocean and estuaries. Journal of Atmospheric and Oceanic Technology 2003, 20(1), 159–186. [Google Scholar]
- Lancia, M; Zheng, CM; Yi, SP; et al. Analysis of groundwater resources in densely populated urban watersheds with a complex tectonic setting: Shenzhen, southern China. Hydrogeology Journal 2019, (27), 183–194. [Google Scholar]
- Yang, Z; Yi, S; Wang, X. Hydrogeological map of Shenzhen; Shenzhen Geological Contruction Engineering Company, 2007. [Google Scholar]
- Pizarro, A; Acuna, P; Dimitriiadis, P; et al. Past,present,and future of the Hurst-Kolmogorov dynamics in Stochastics: A bibliometric analysis of the last 50 years in water resources. Jounal of Hydrology 2024, 12, 643. [Google Scholar]
- Ouyang, ZZ; Fan, S.P; Sun, J. Ecological sensitivity analysis of sponge city planning. Yellow River 2020, (6), 33–35. [Google Scholar]
- Lancia, M; Su, H; Tian, Y; et al. Hydrogeology of the pearl river delta, southern China. Journal of Maps 2020, 16(2), 388–395. [Google Scholar] [CrossRef]
- Jin, MX; Lancia, M; Tian, Y; et al. The Role of Aquifers in Sustaining the Sponge City Concept in Chinese High-Density Housing. Water 2022, 14, 929. [Google Scholar] [CrossRef]
- Wu, JS; Zhang, PH. The impact of urban landscape pattern on urban waterlogging: a case study of Shenzhen. Acta Geographica Sinica 2017, 72(03), 444–456. [Google Scholar]
- Gao, H; Sabo, JL; Chen, X; et al. Landscape heterogeneity and hydrological process: A review of landscape-based hydrological models. Landscape ecology 2018, 33(9), 1460–1480. [Google Scholar]
- Donnell, E; Thorne, C; Ahilan, S. The blue-green path to urban flood resilience. Blue-Green Systems 2019, 2(1), 28–45. [Google Scholar] [CrossRef]
- Klemes. Operational testing of hydrological simulation models Vérification, en conditions réelles, des modèles de simulation hydrologique. Hydrological Sciences Journal 1986, 31(Issue 1). [Google Scholar] [CrossRef]
Figure 1.
The location and scope of the study area.
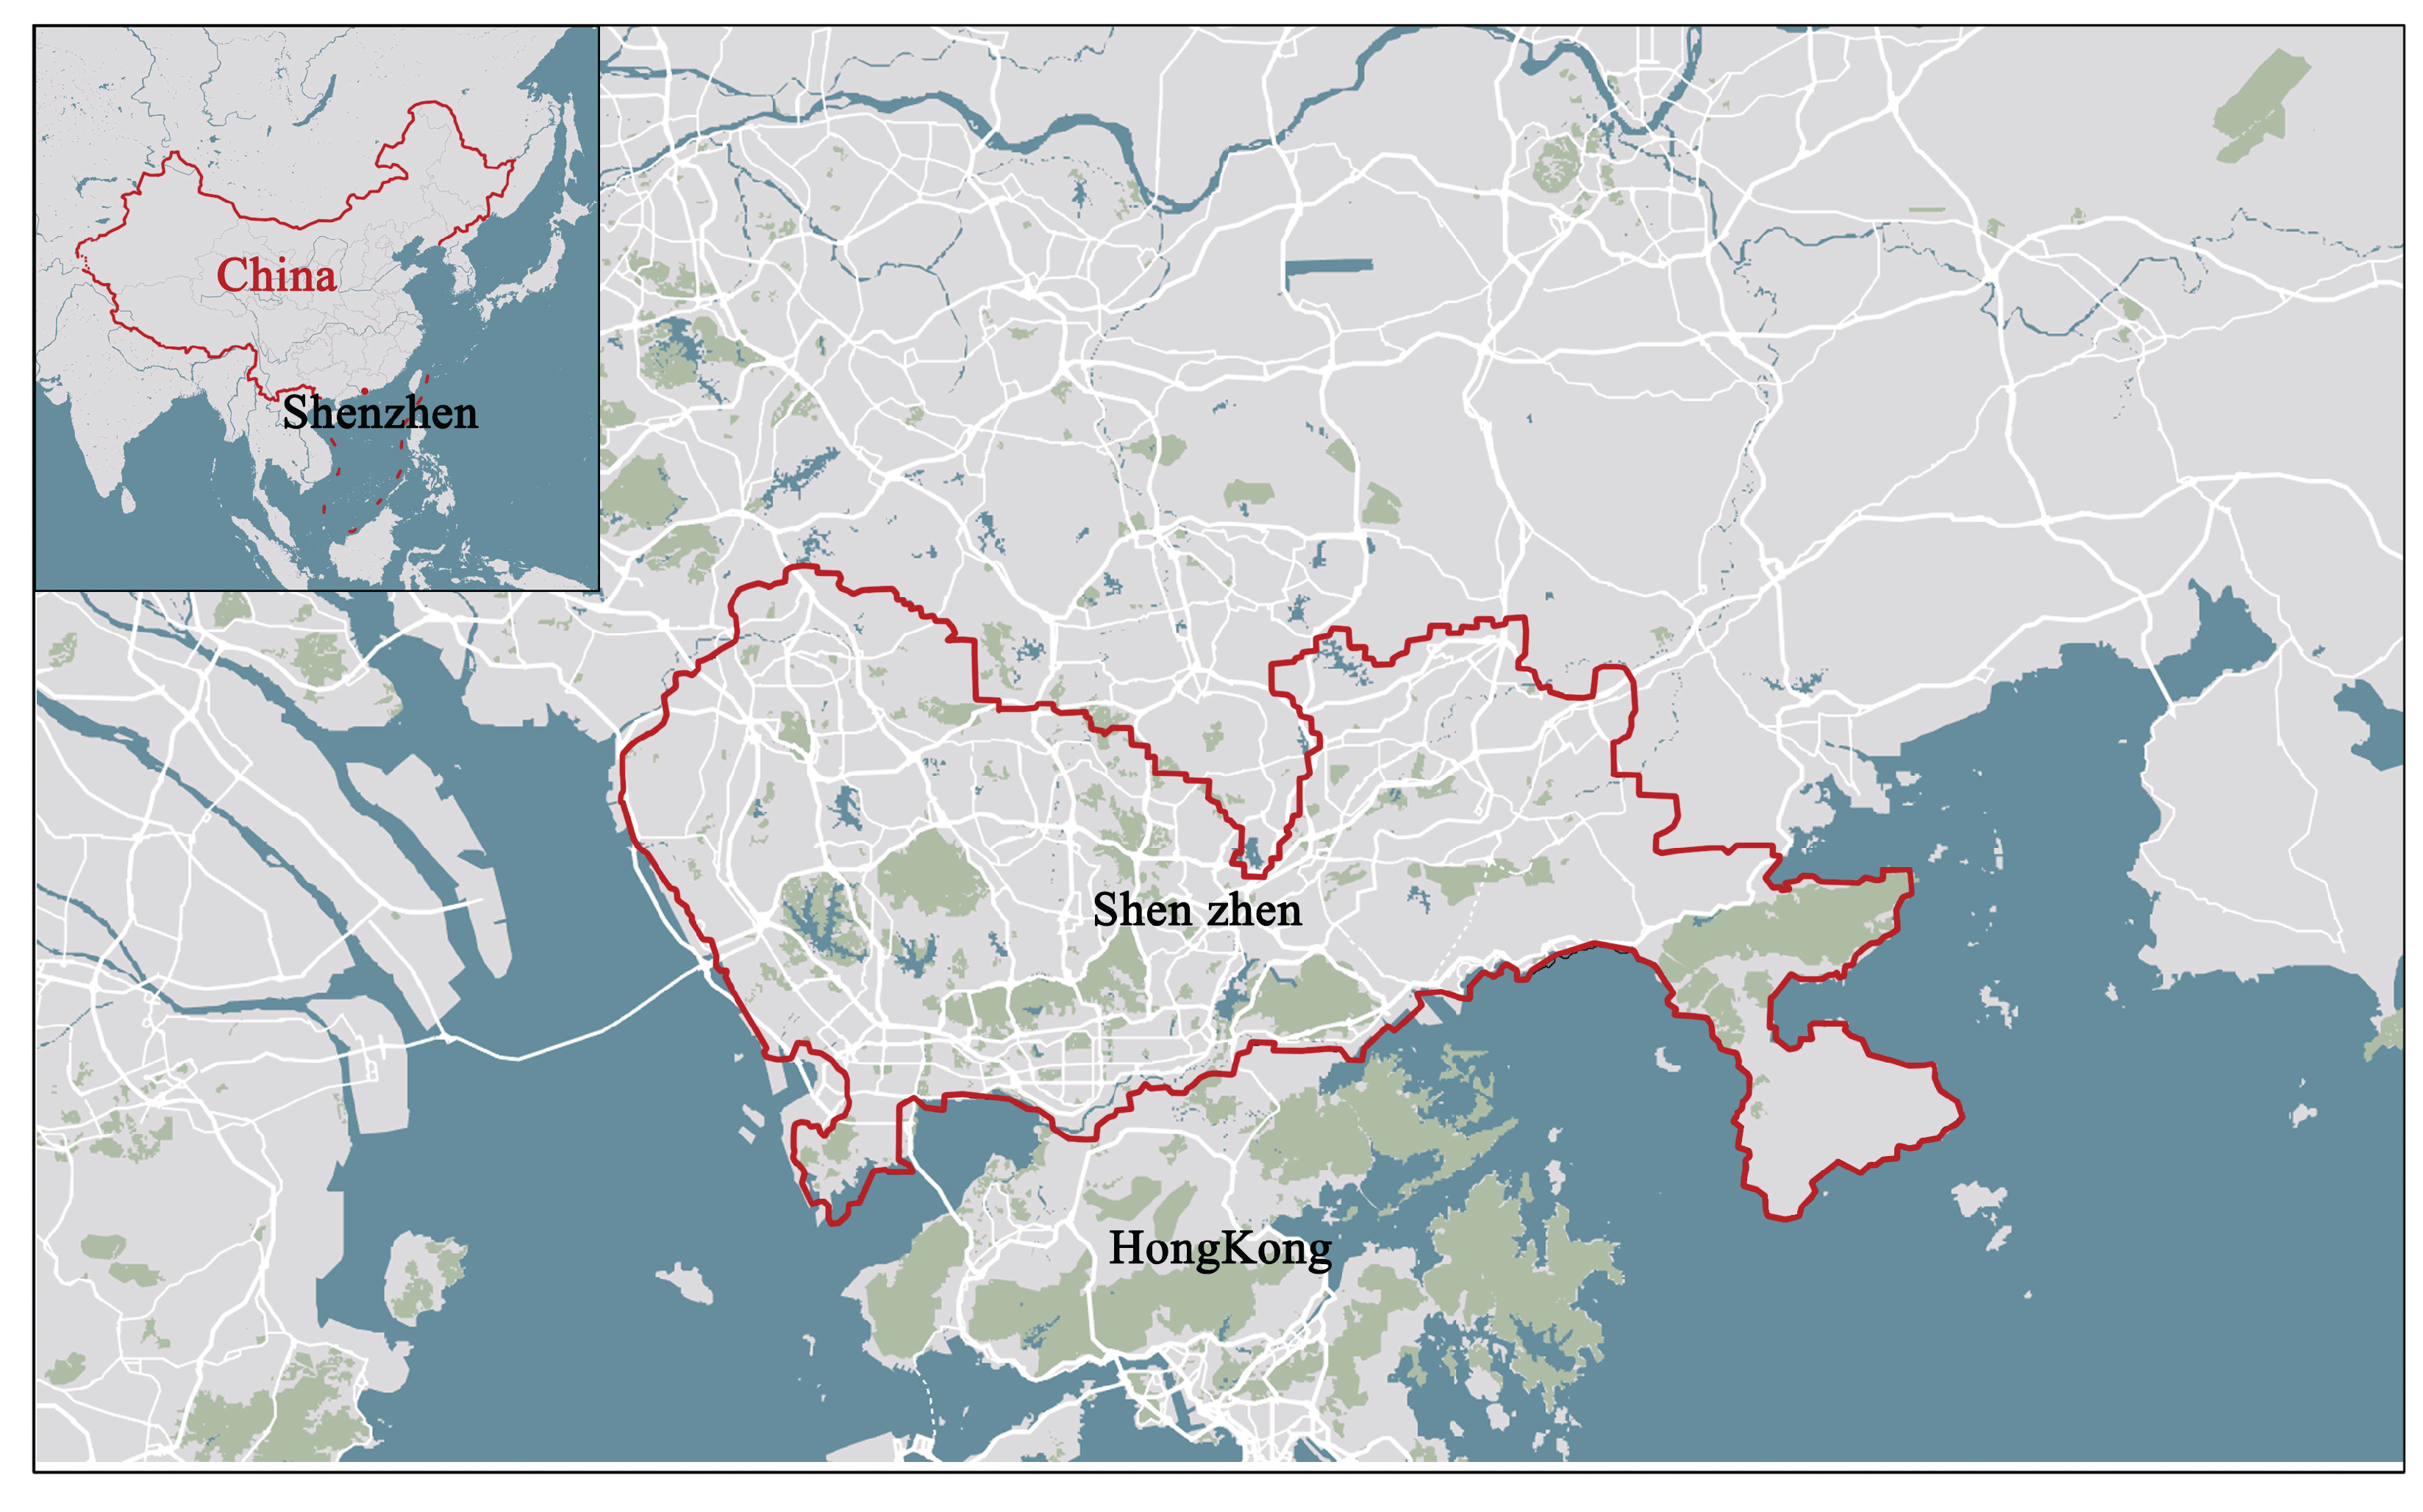
Figure 2.
FVCOM compute scope and compute grid.
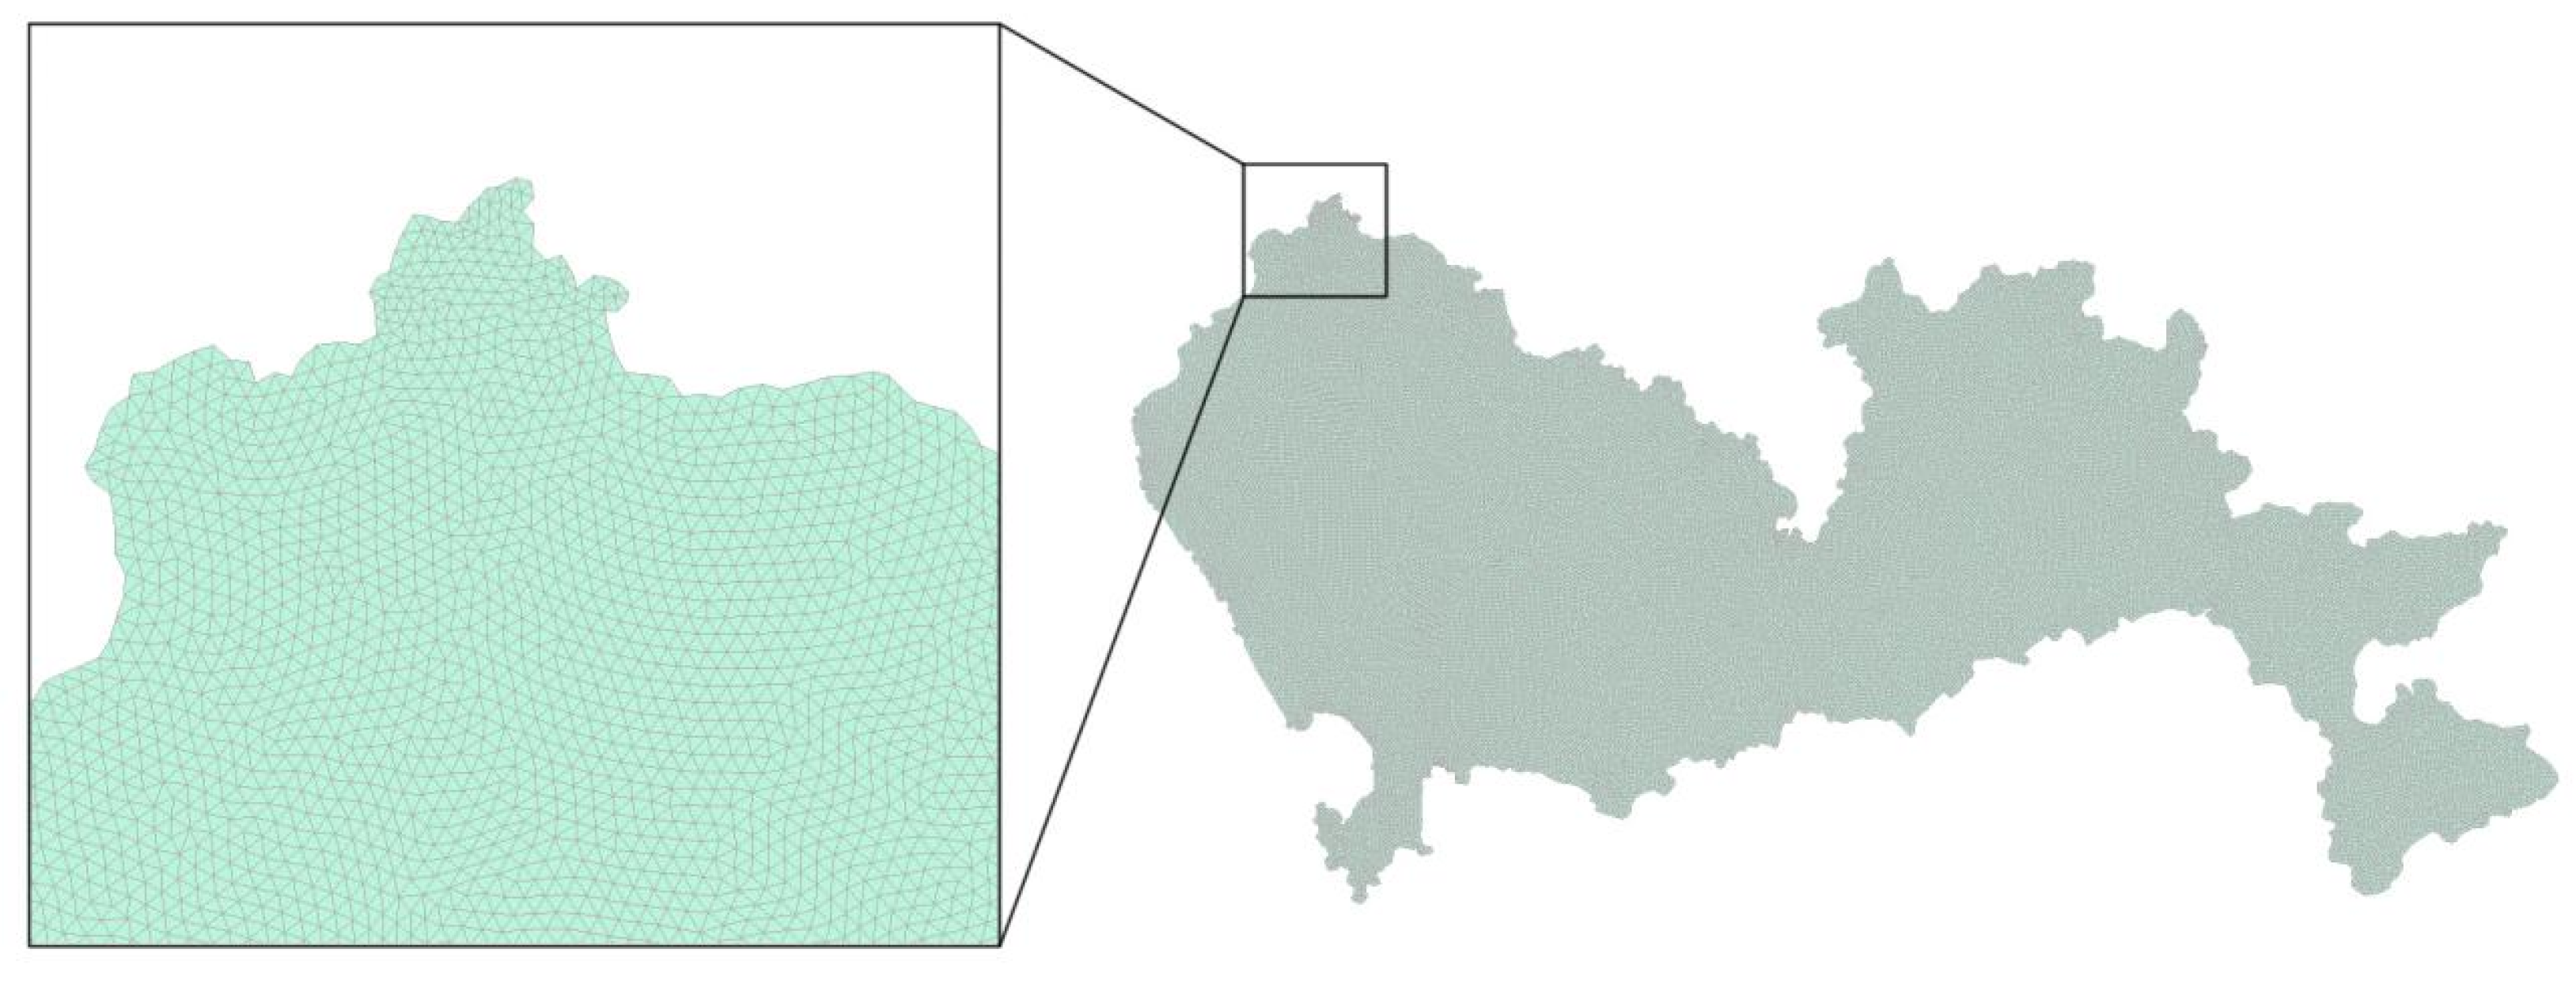
Figure 3.
Spatial distribution of once-in-a-century precipitation in Shenzhen on October 9, 2021.
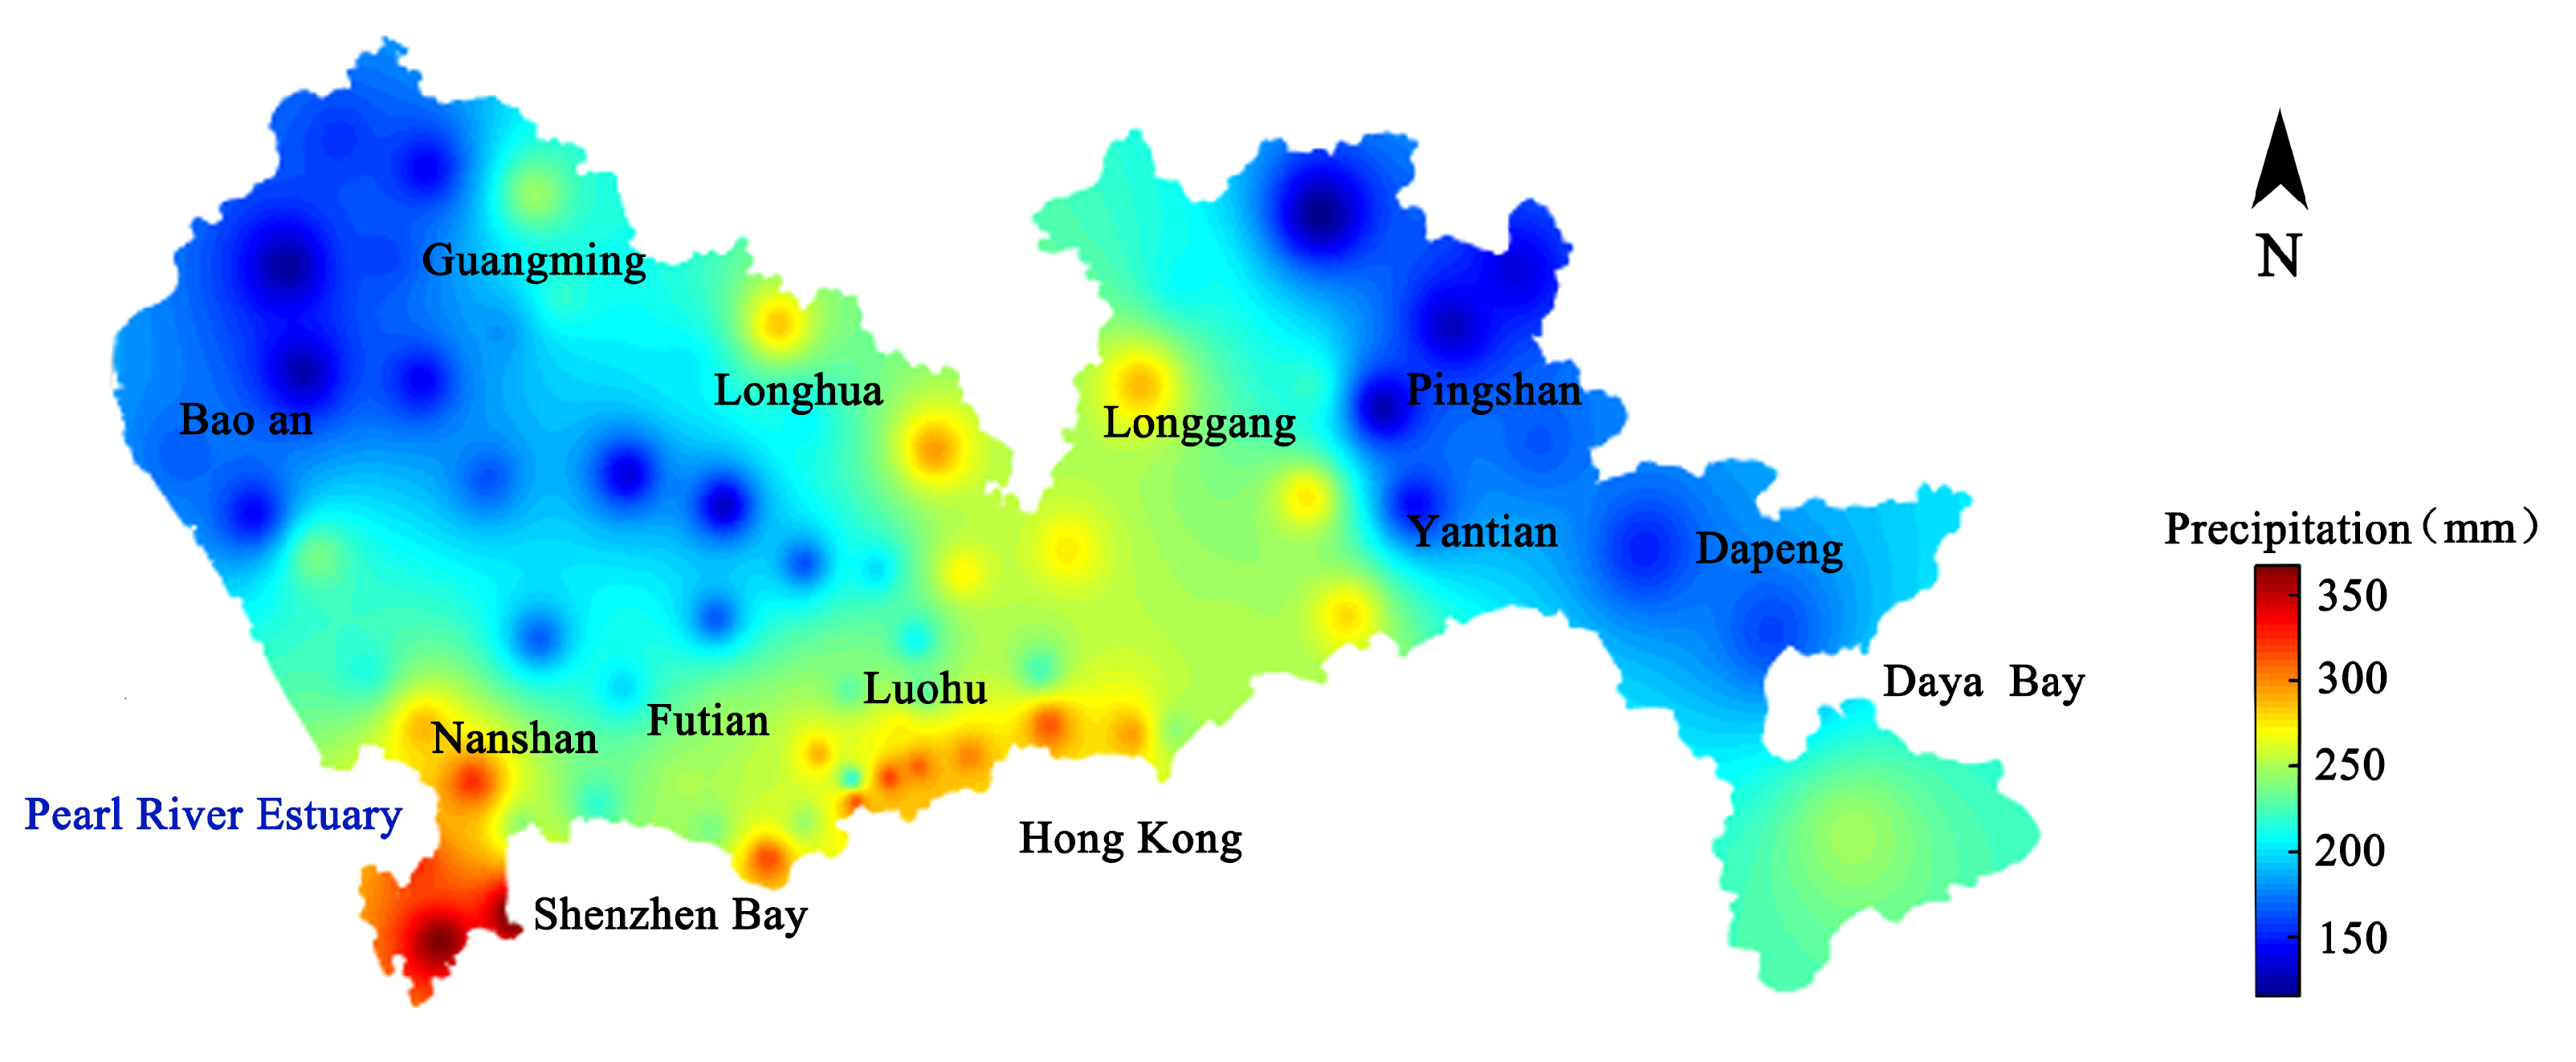
Figure 4.
Comparison of water depth and waterlogging point distribution.
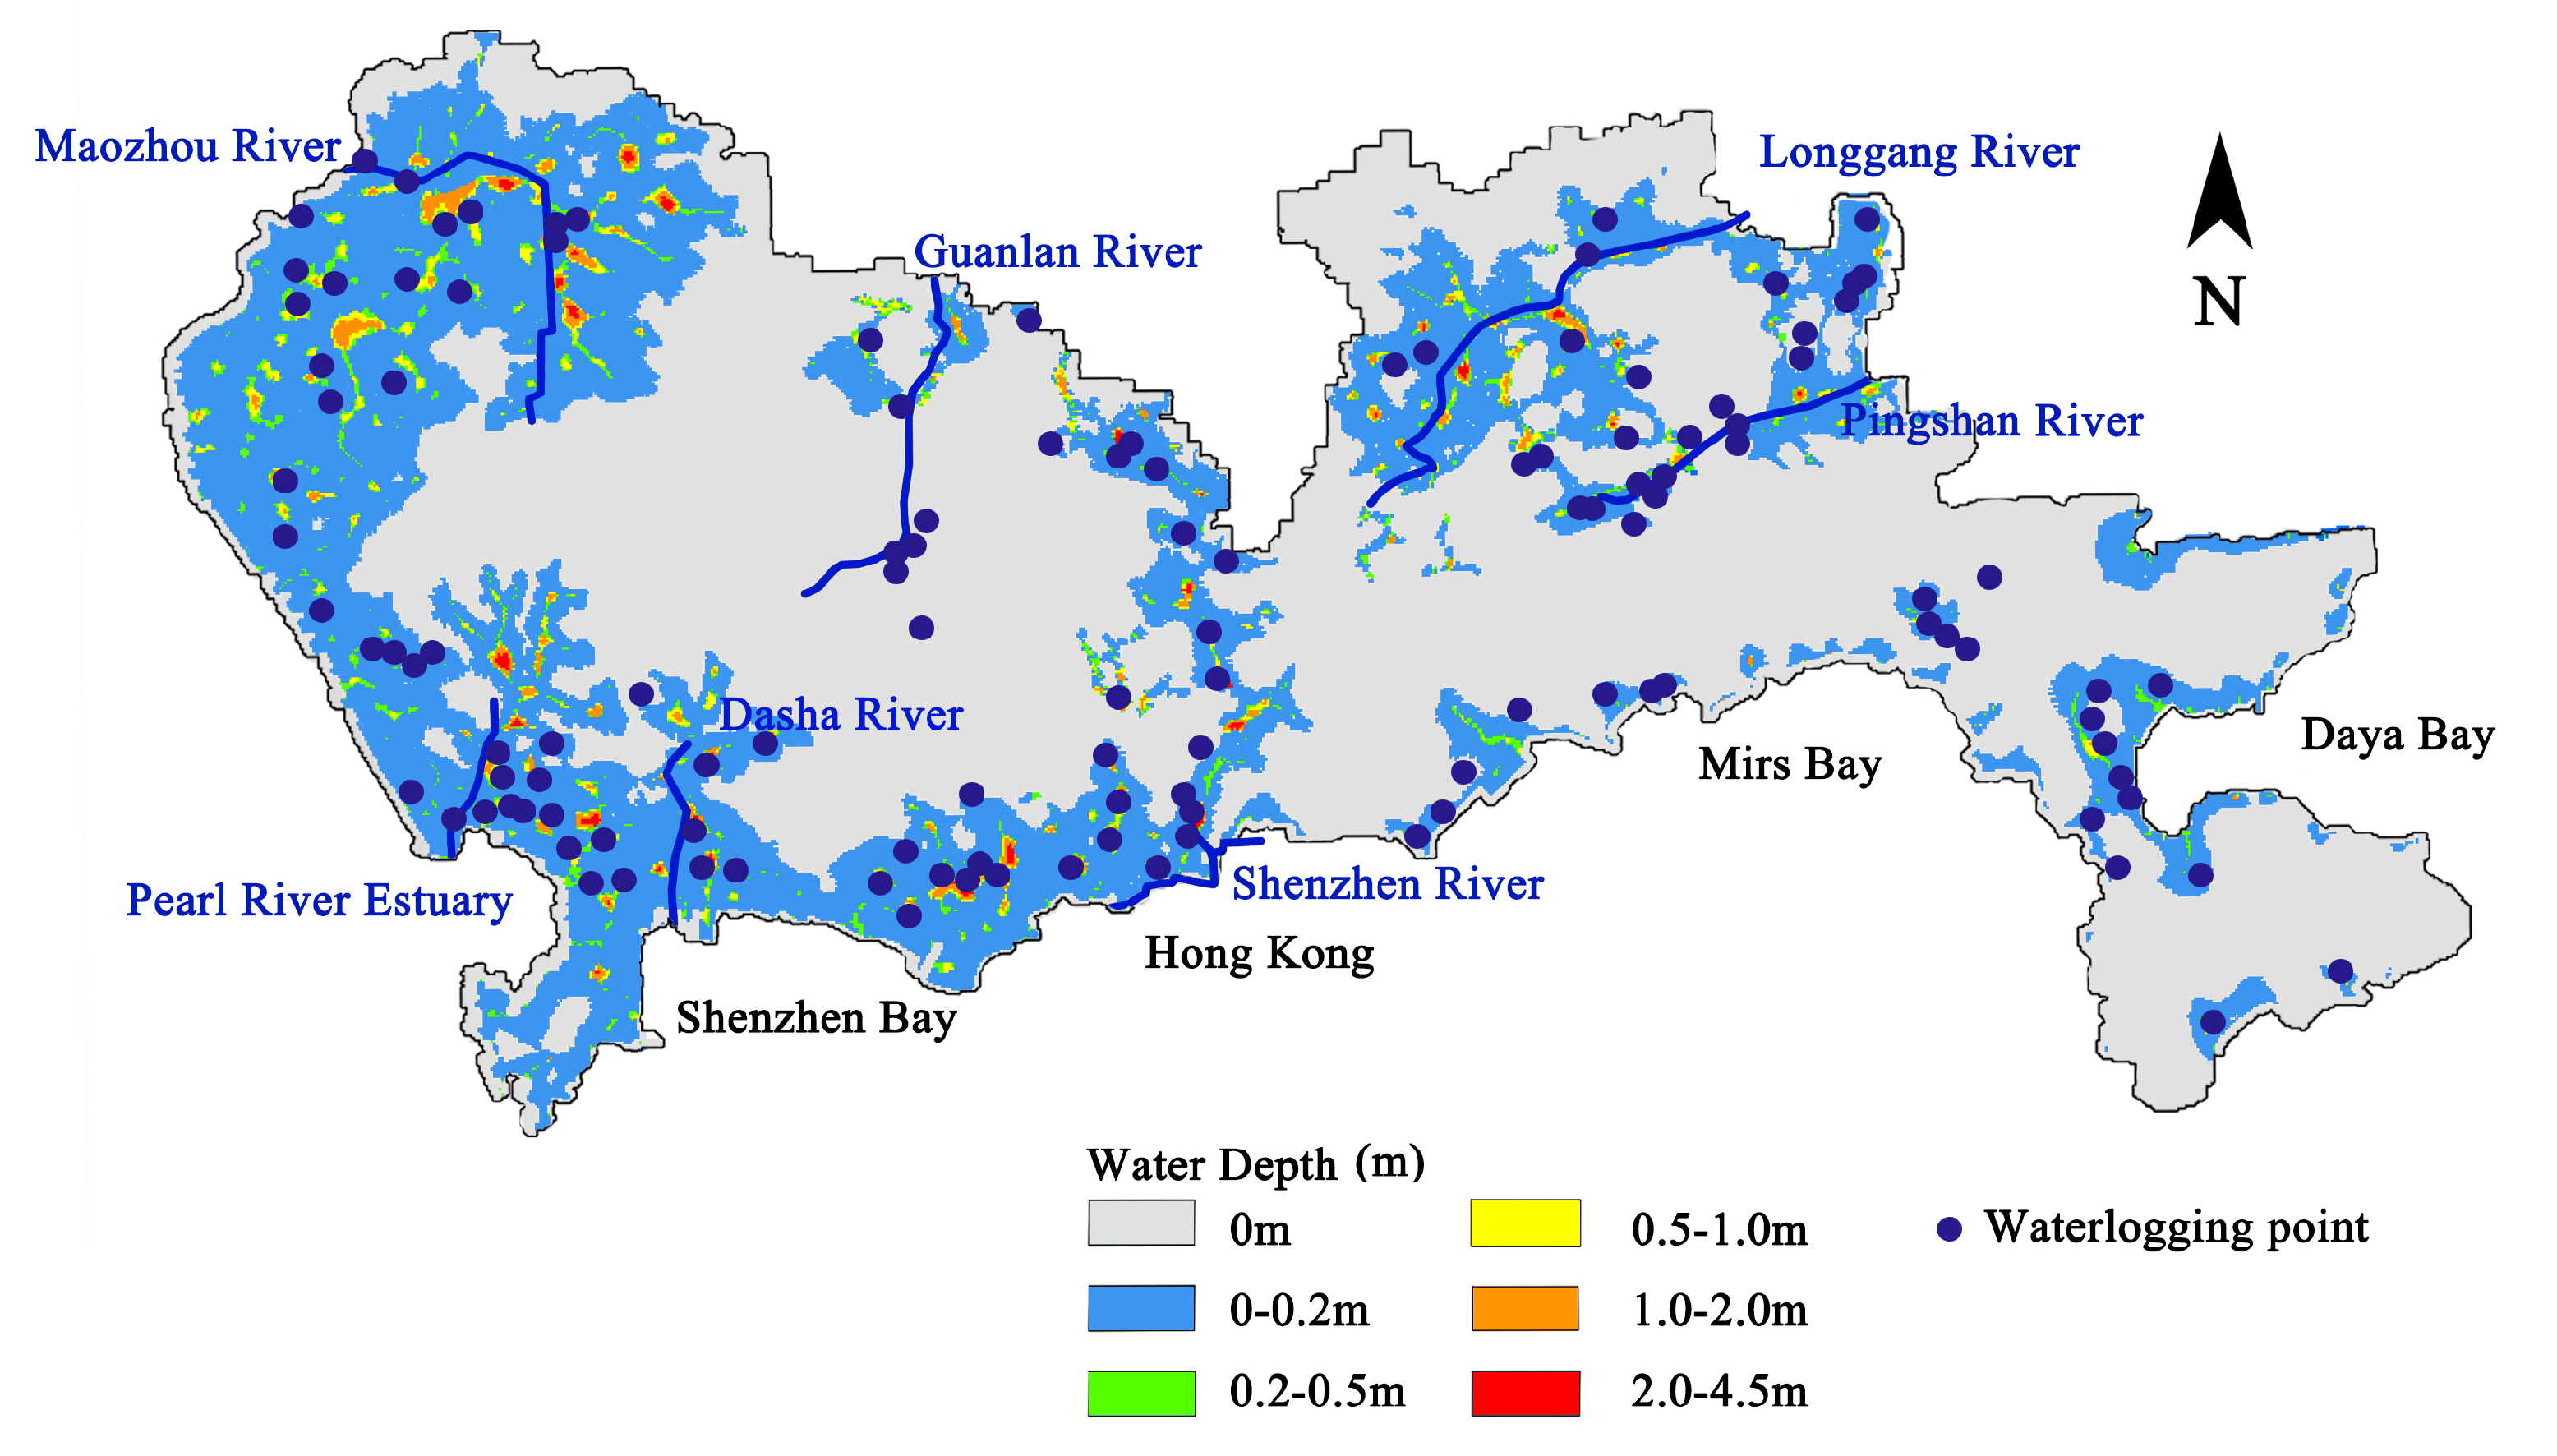
Figure 5.
Spatial distribution of water depth.
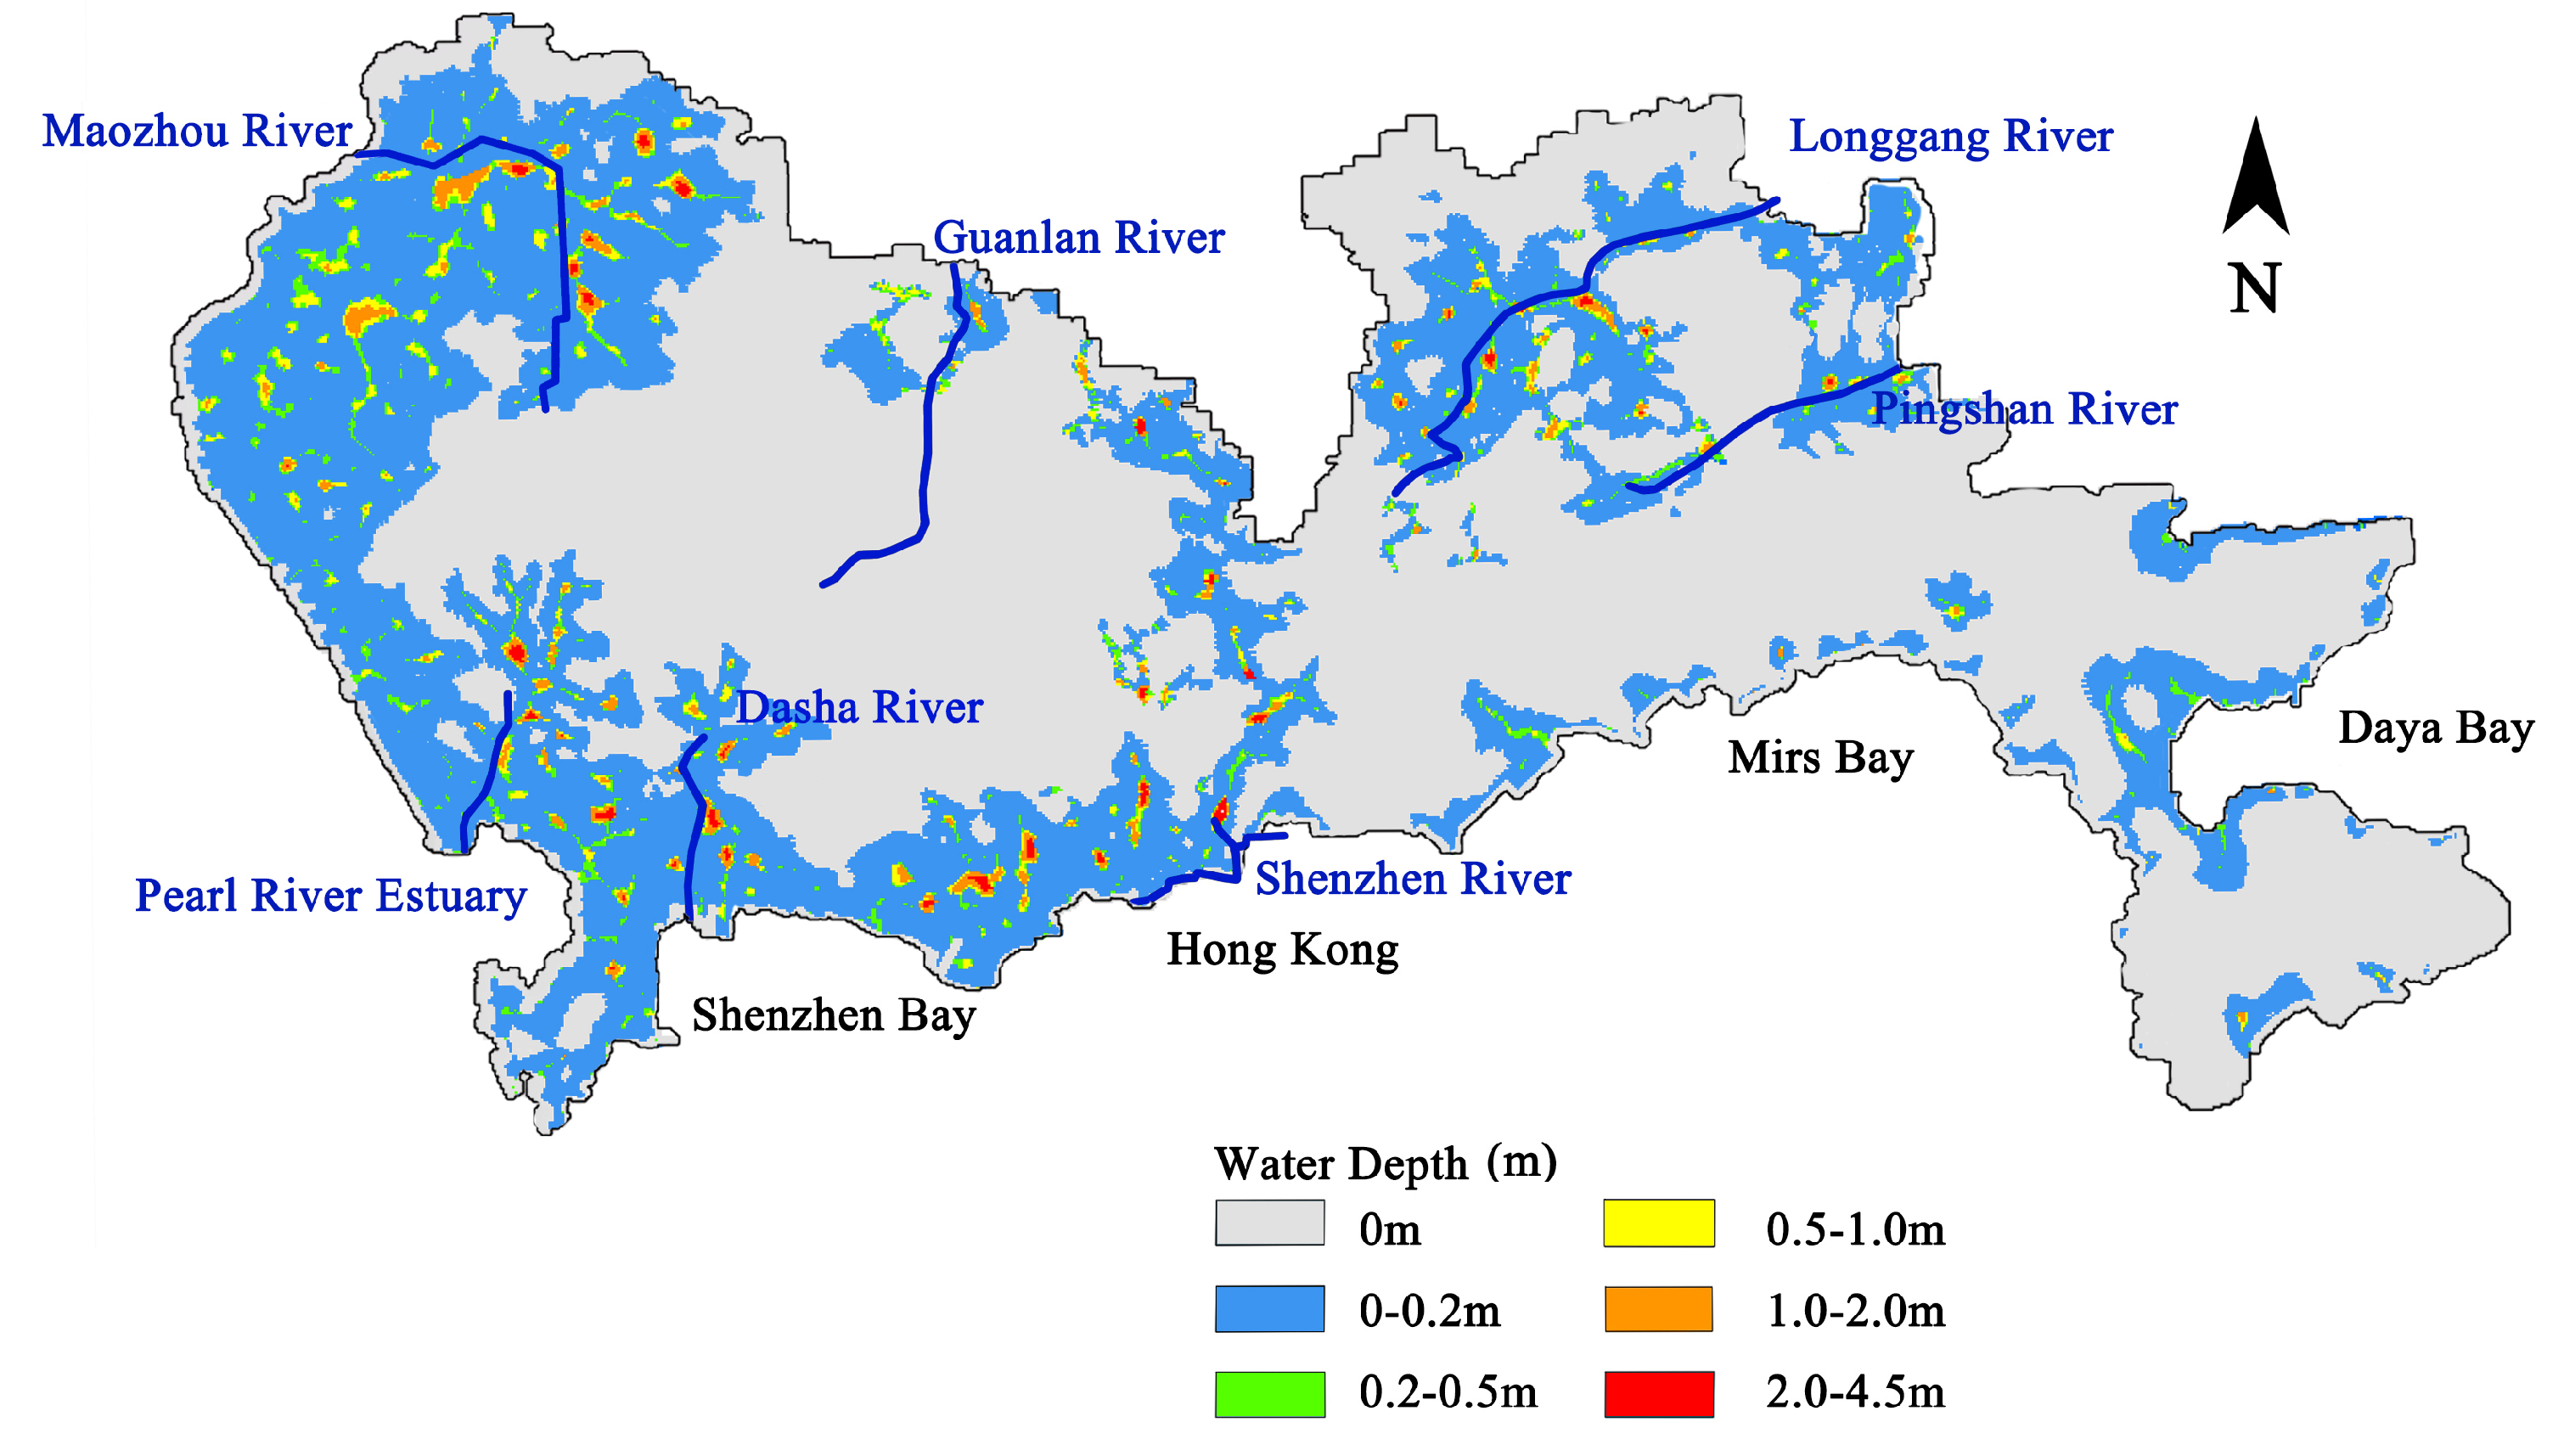
Figure 6.
Spatial distribution of geological lithology.
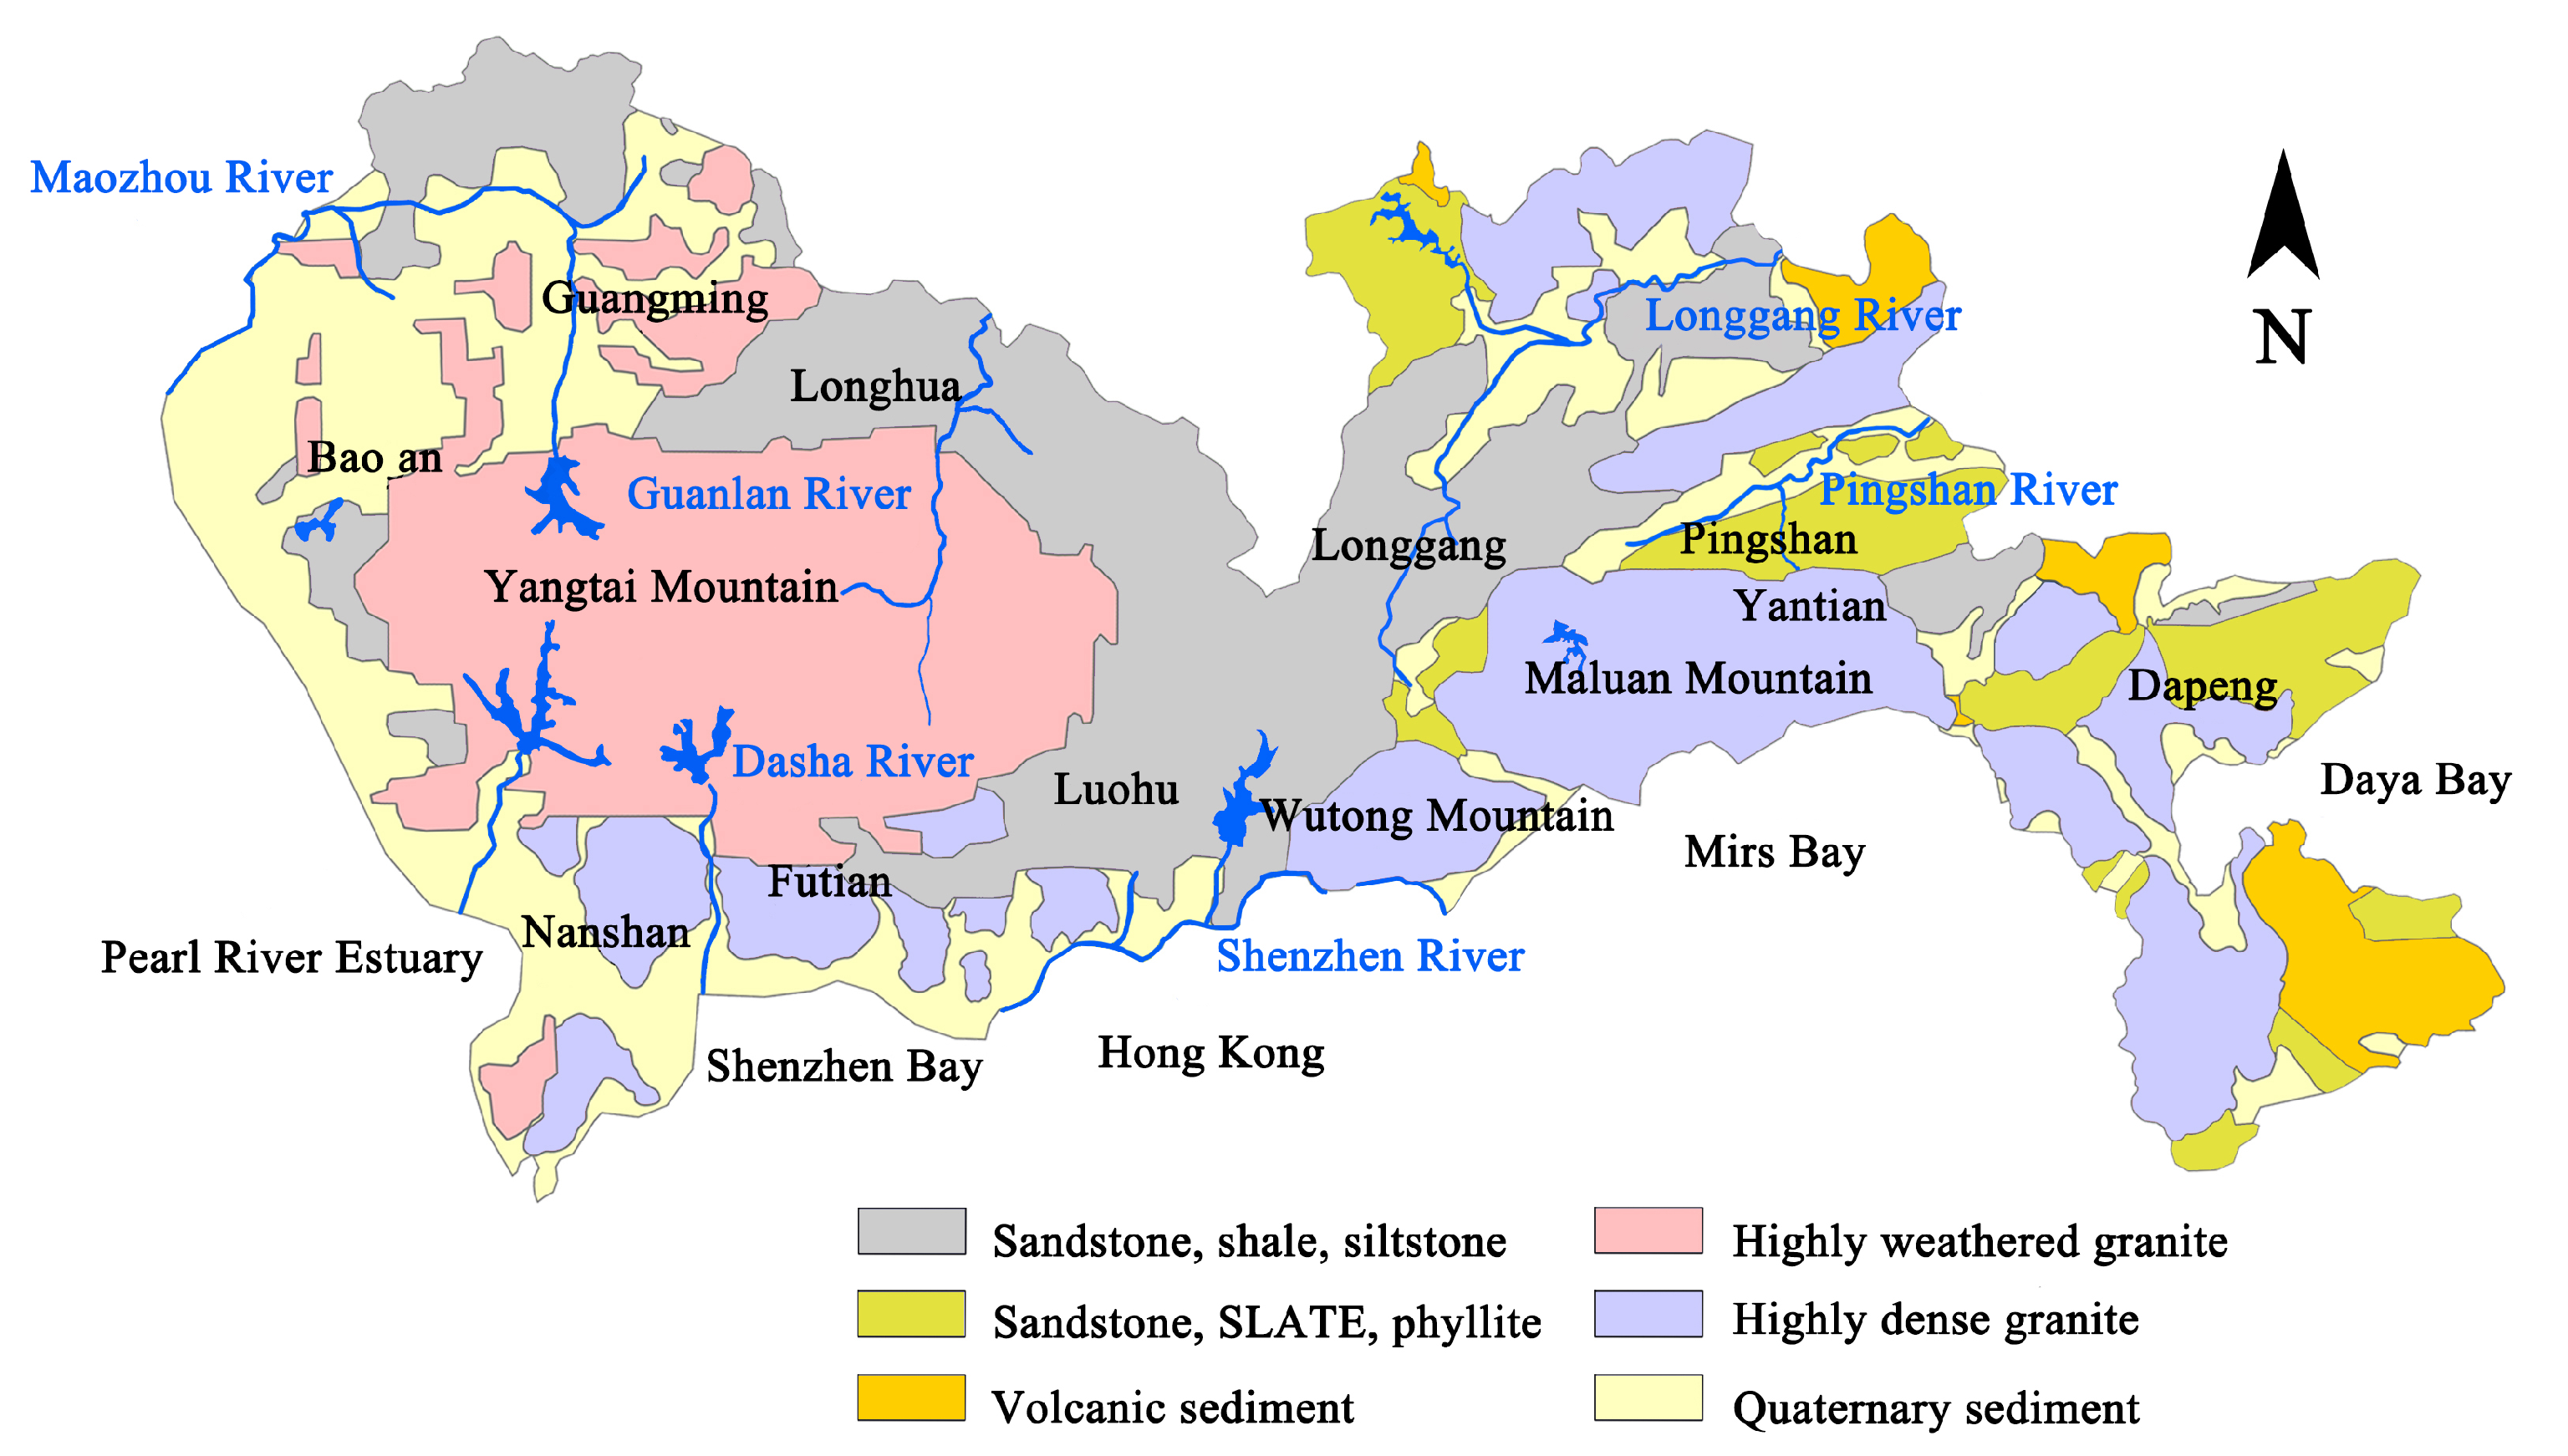
Figure 7.
Spatial distribution map of groundwater depth.
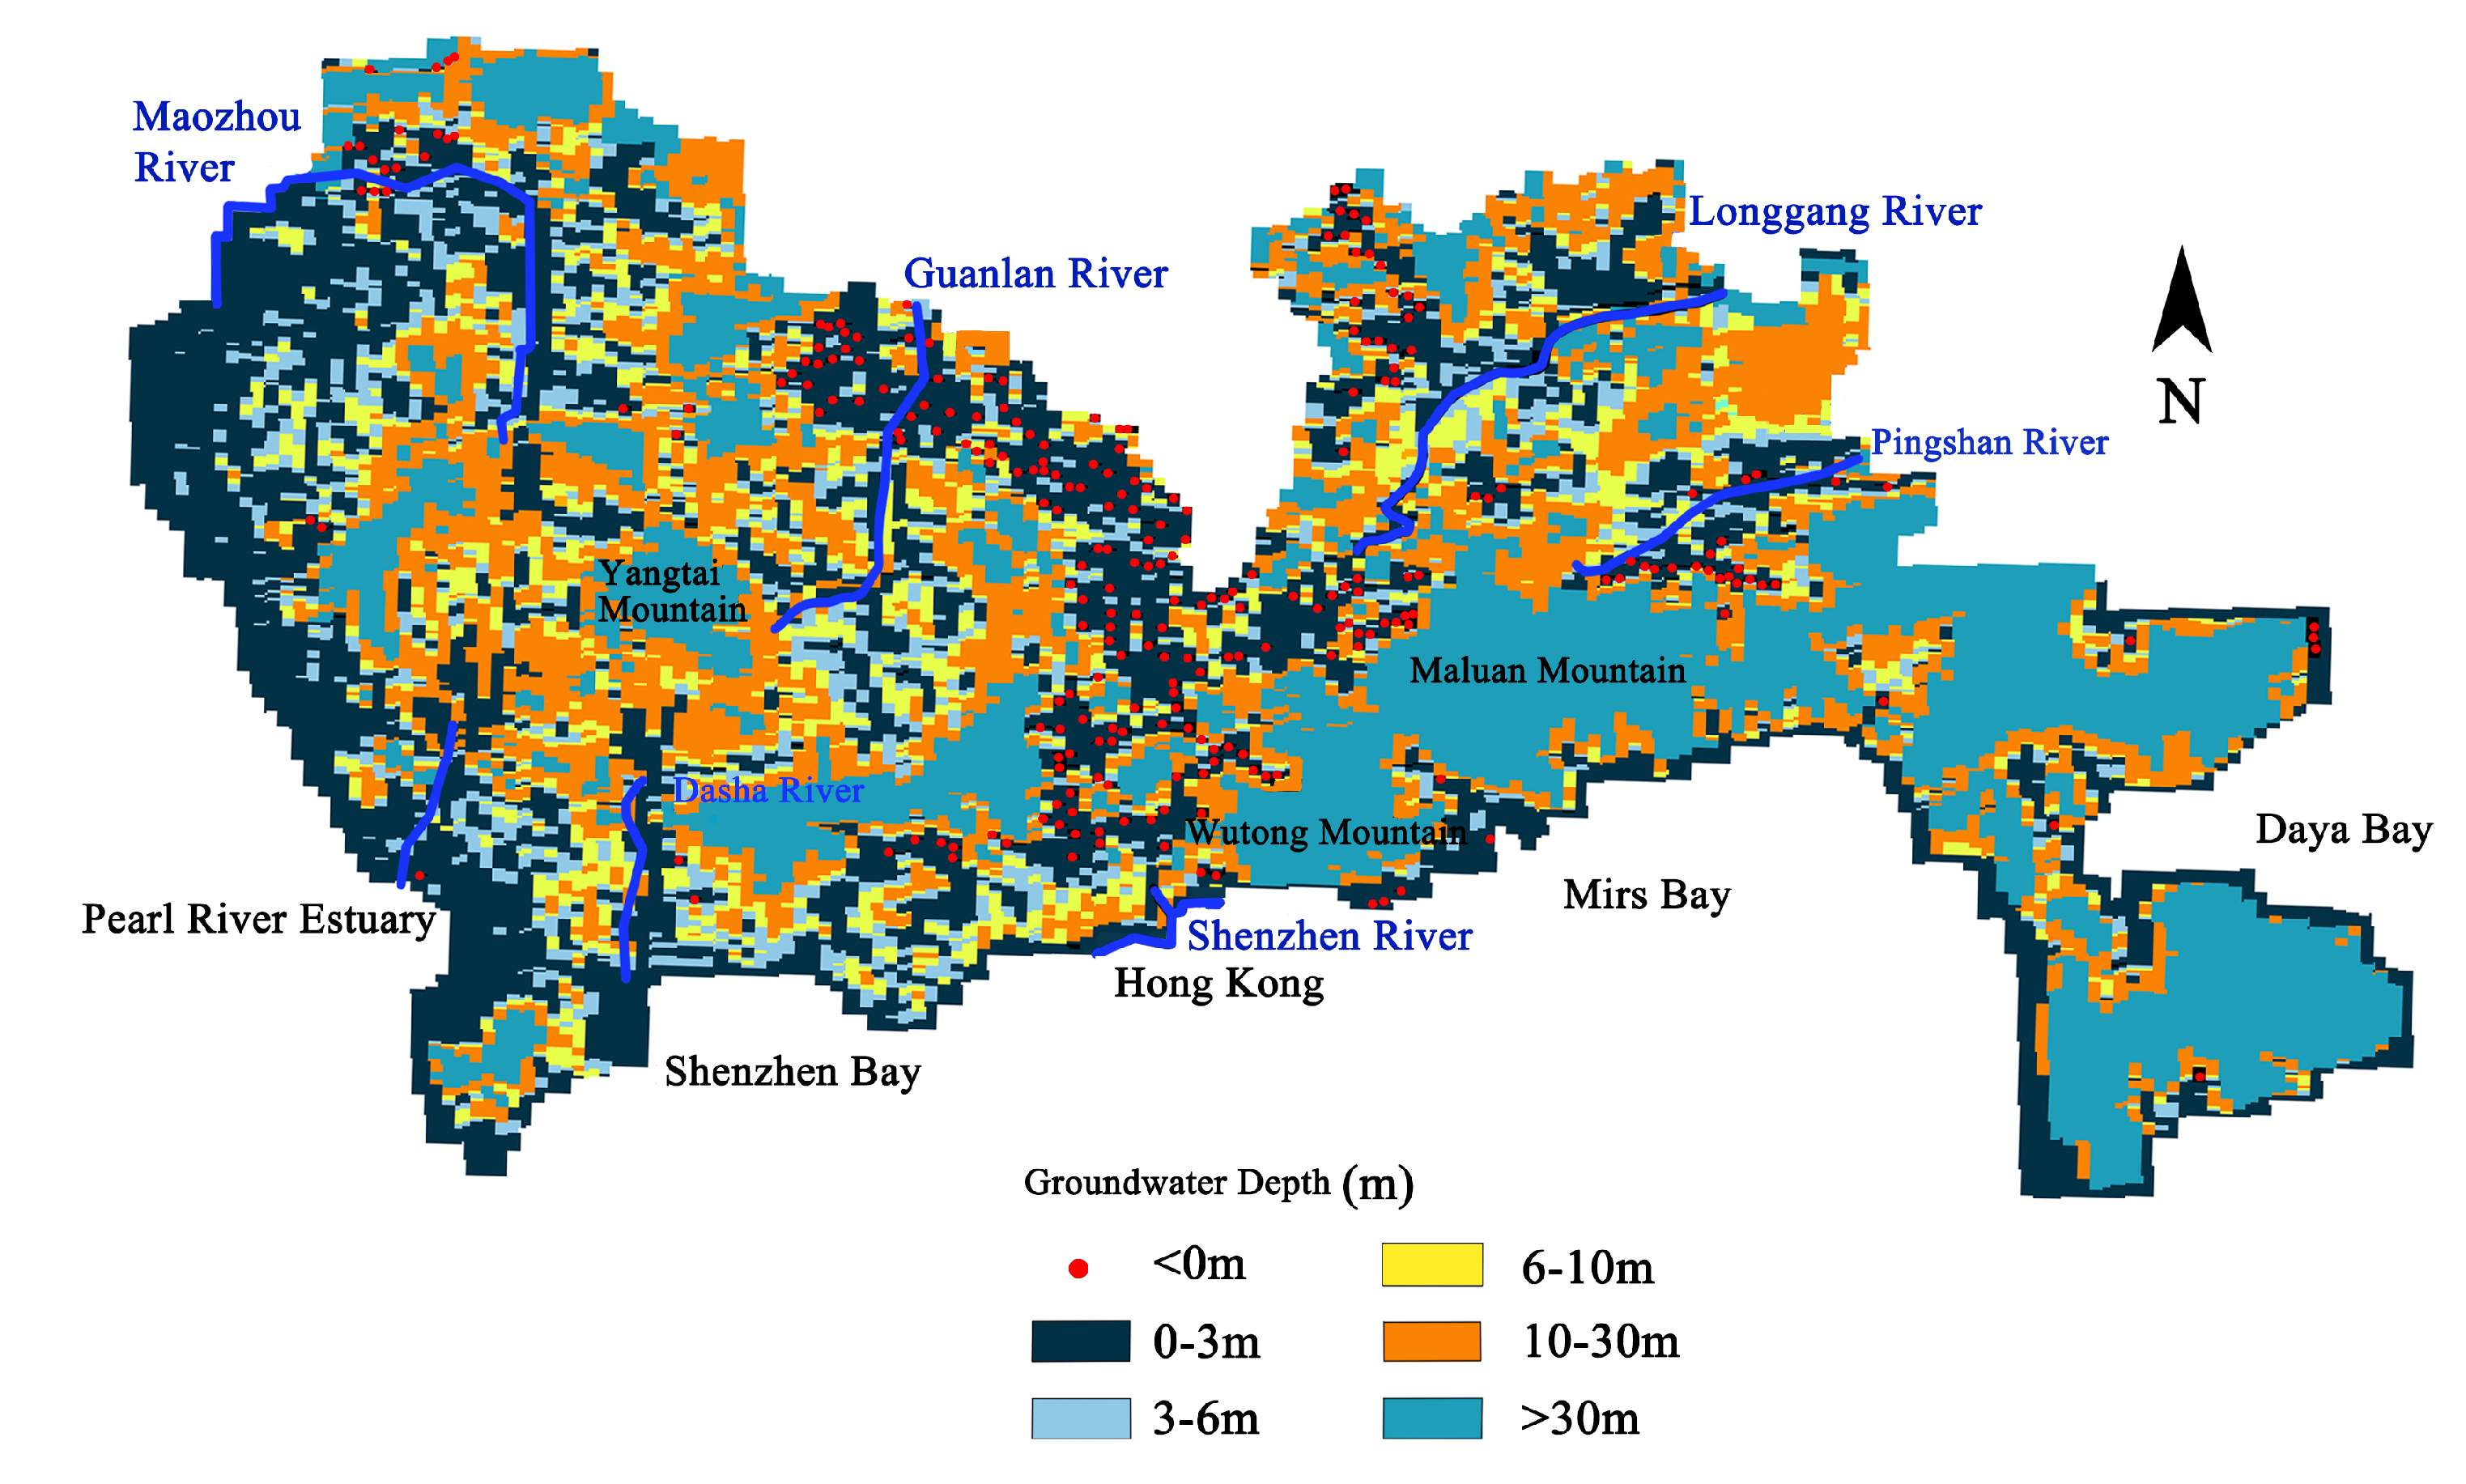
Figure 8.
Spatial distribution of sponge ecological suitable area.
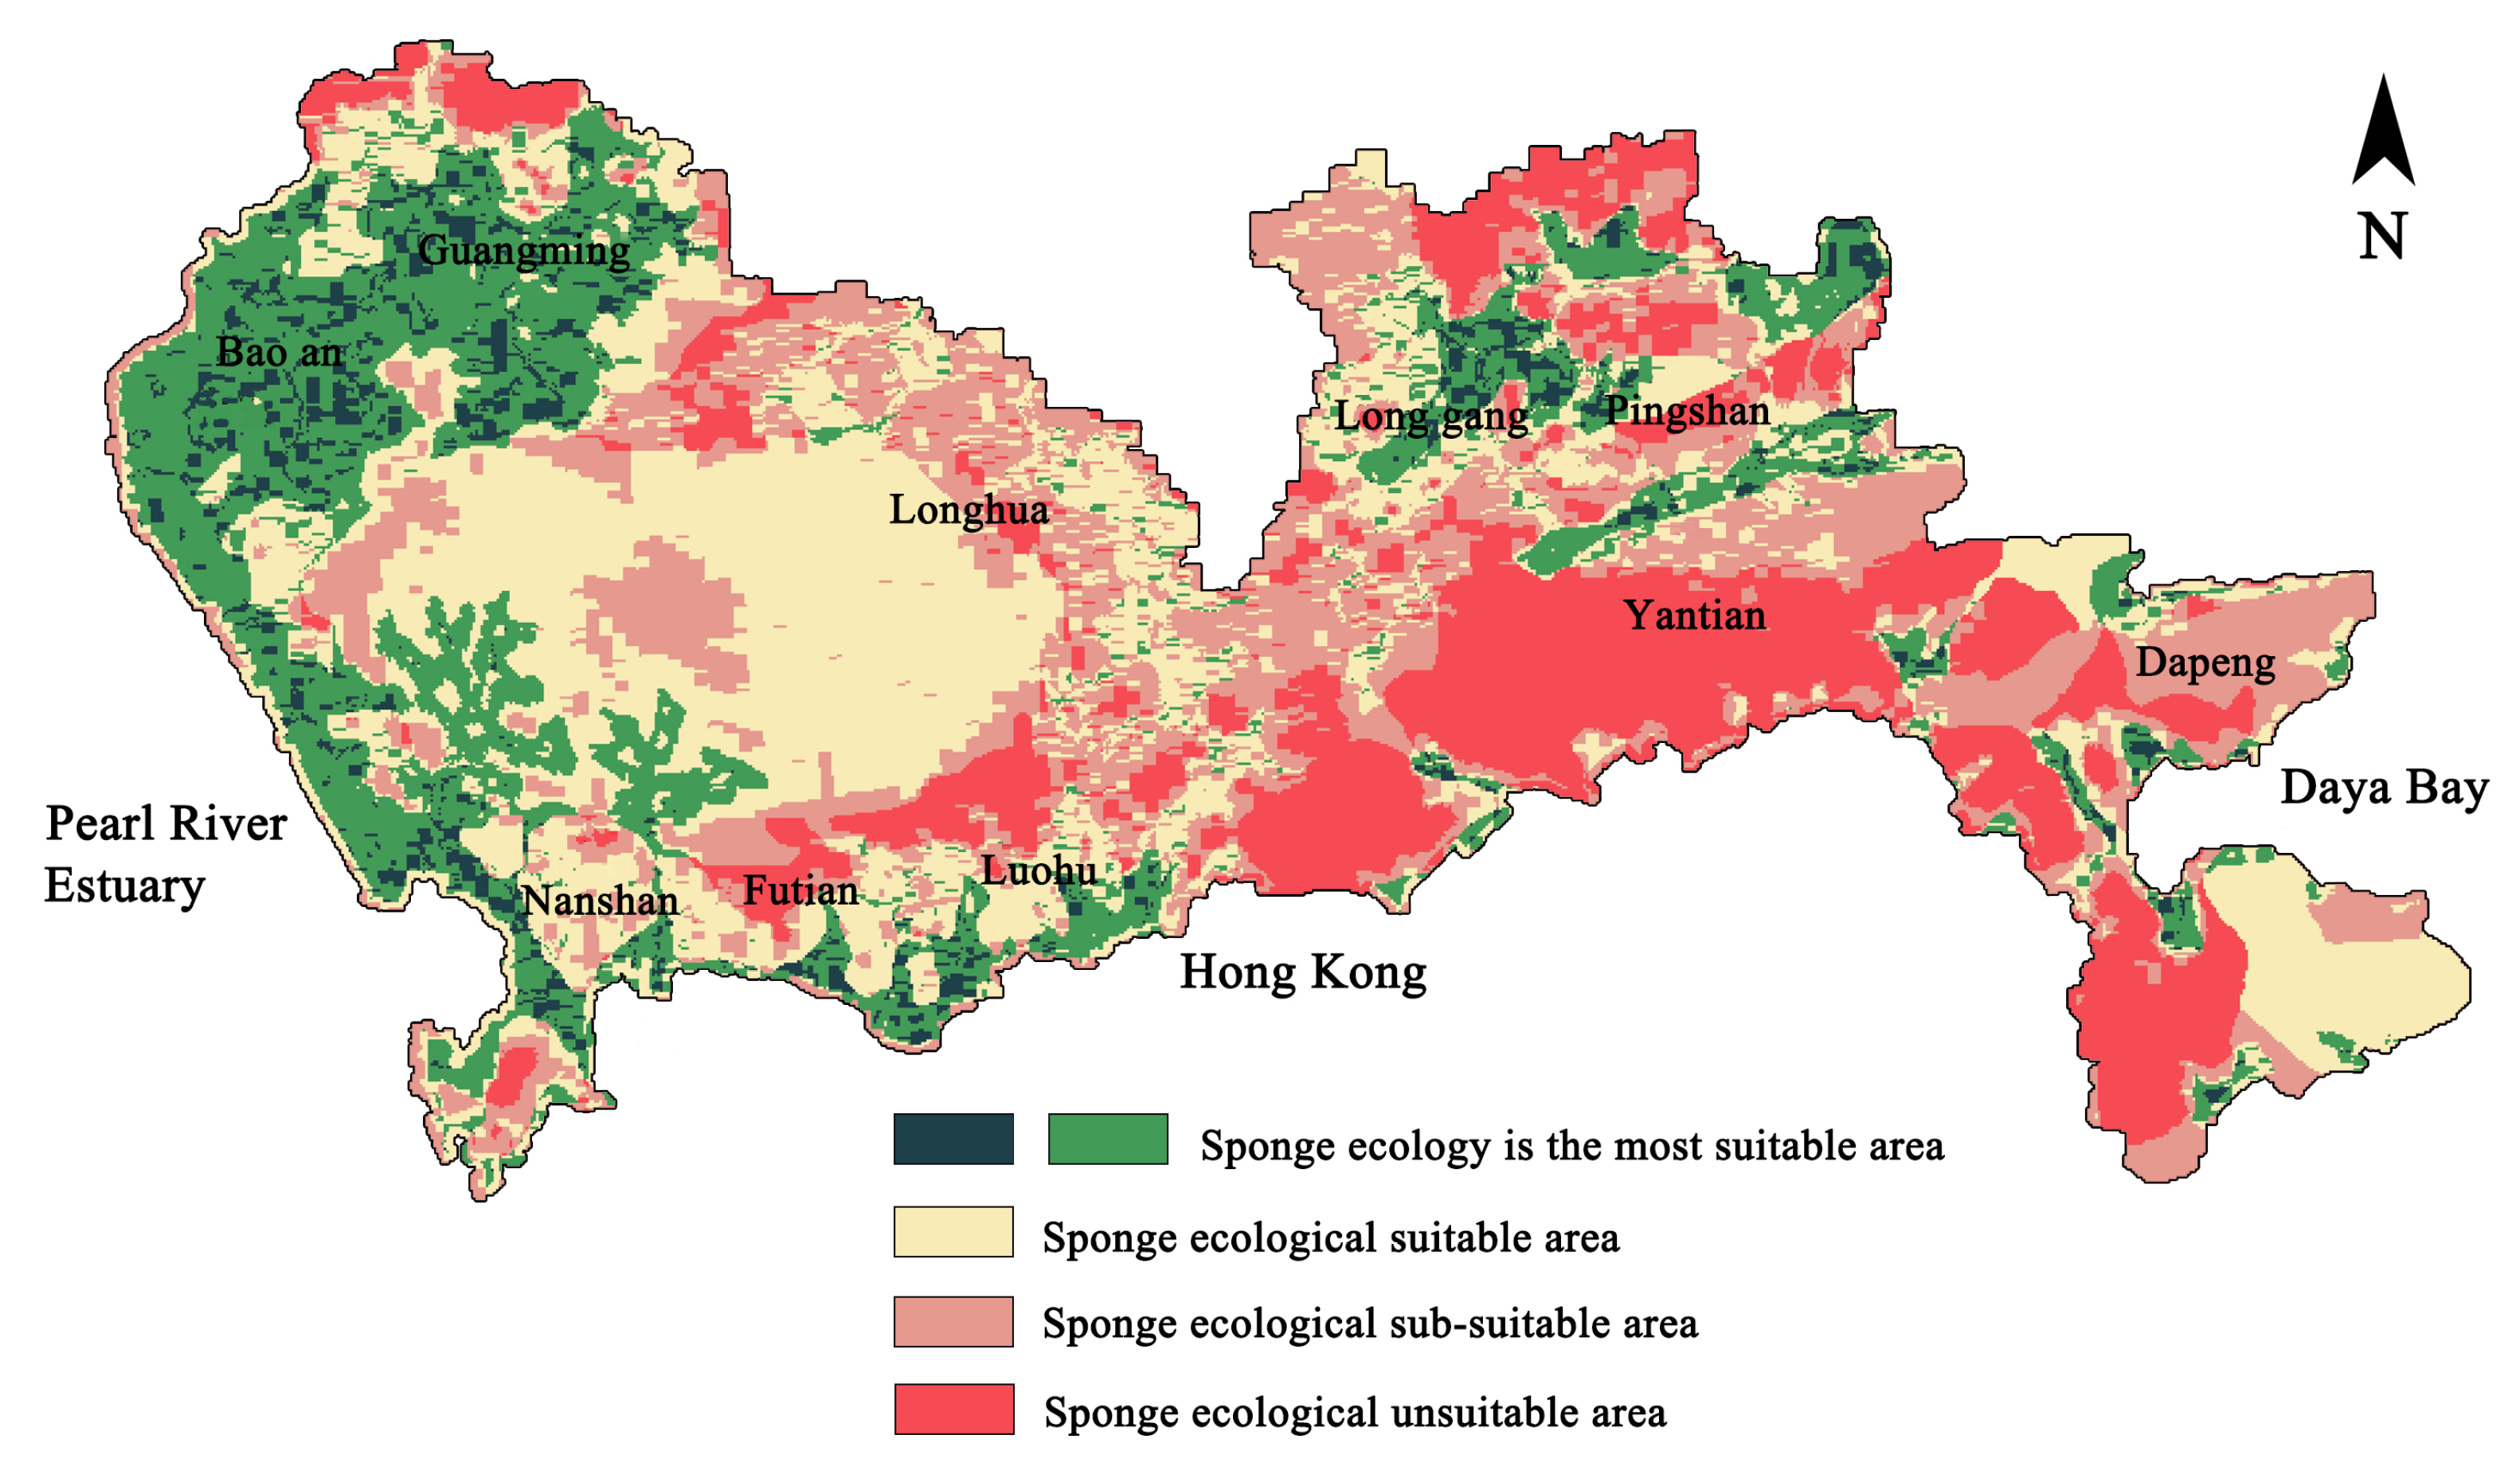
Figure 9.
Spatial distribution of standard deviation in sponge ecological suitable area.
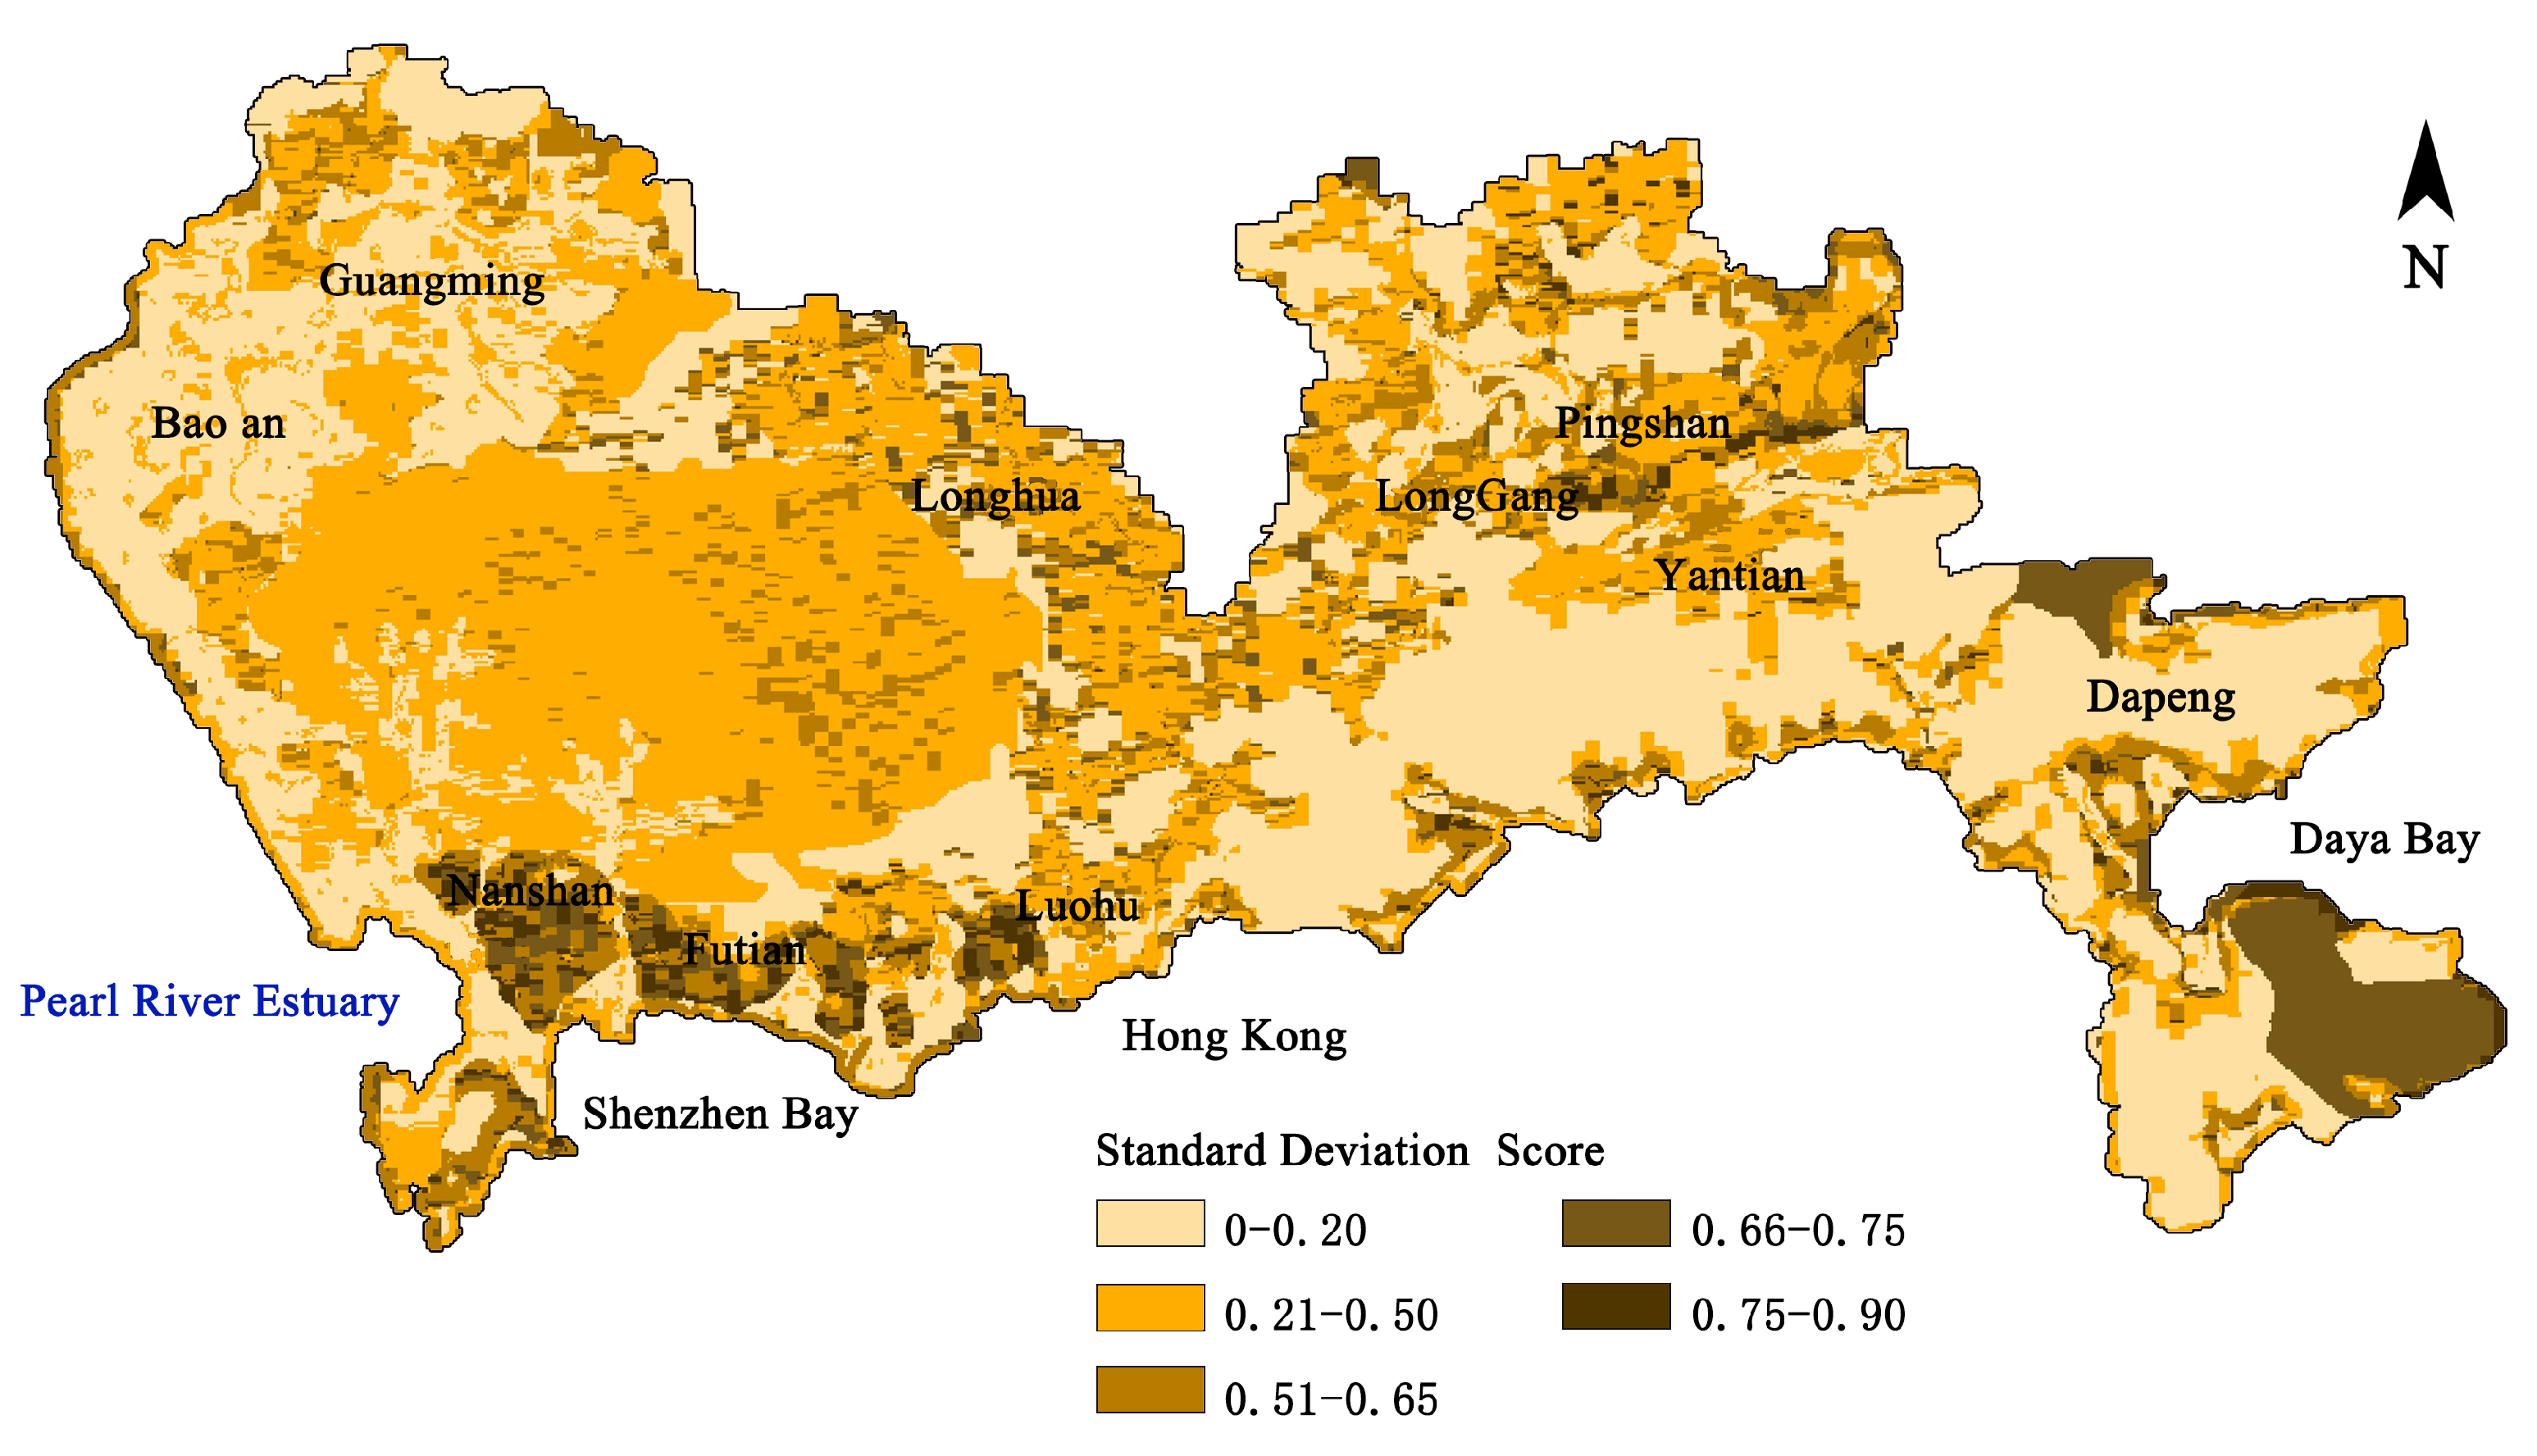
Figure 10.
The distribution of sponge ecological suitable area and the coupling of ecological protection red line.
Figure 10.
The distribution of sponge ecological suitable area and the coupling of ecological protection red line.
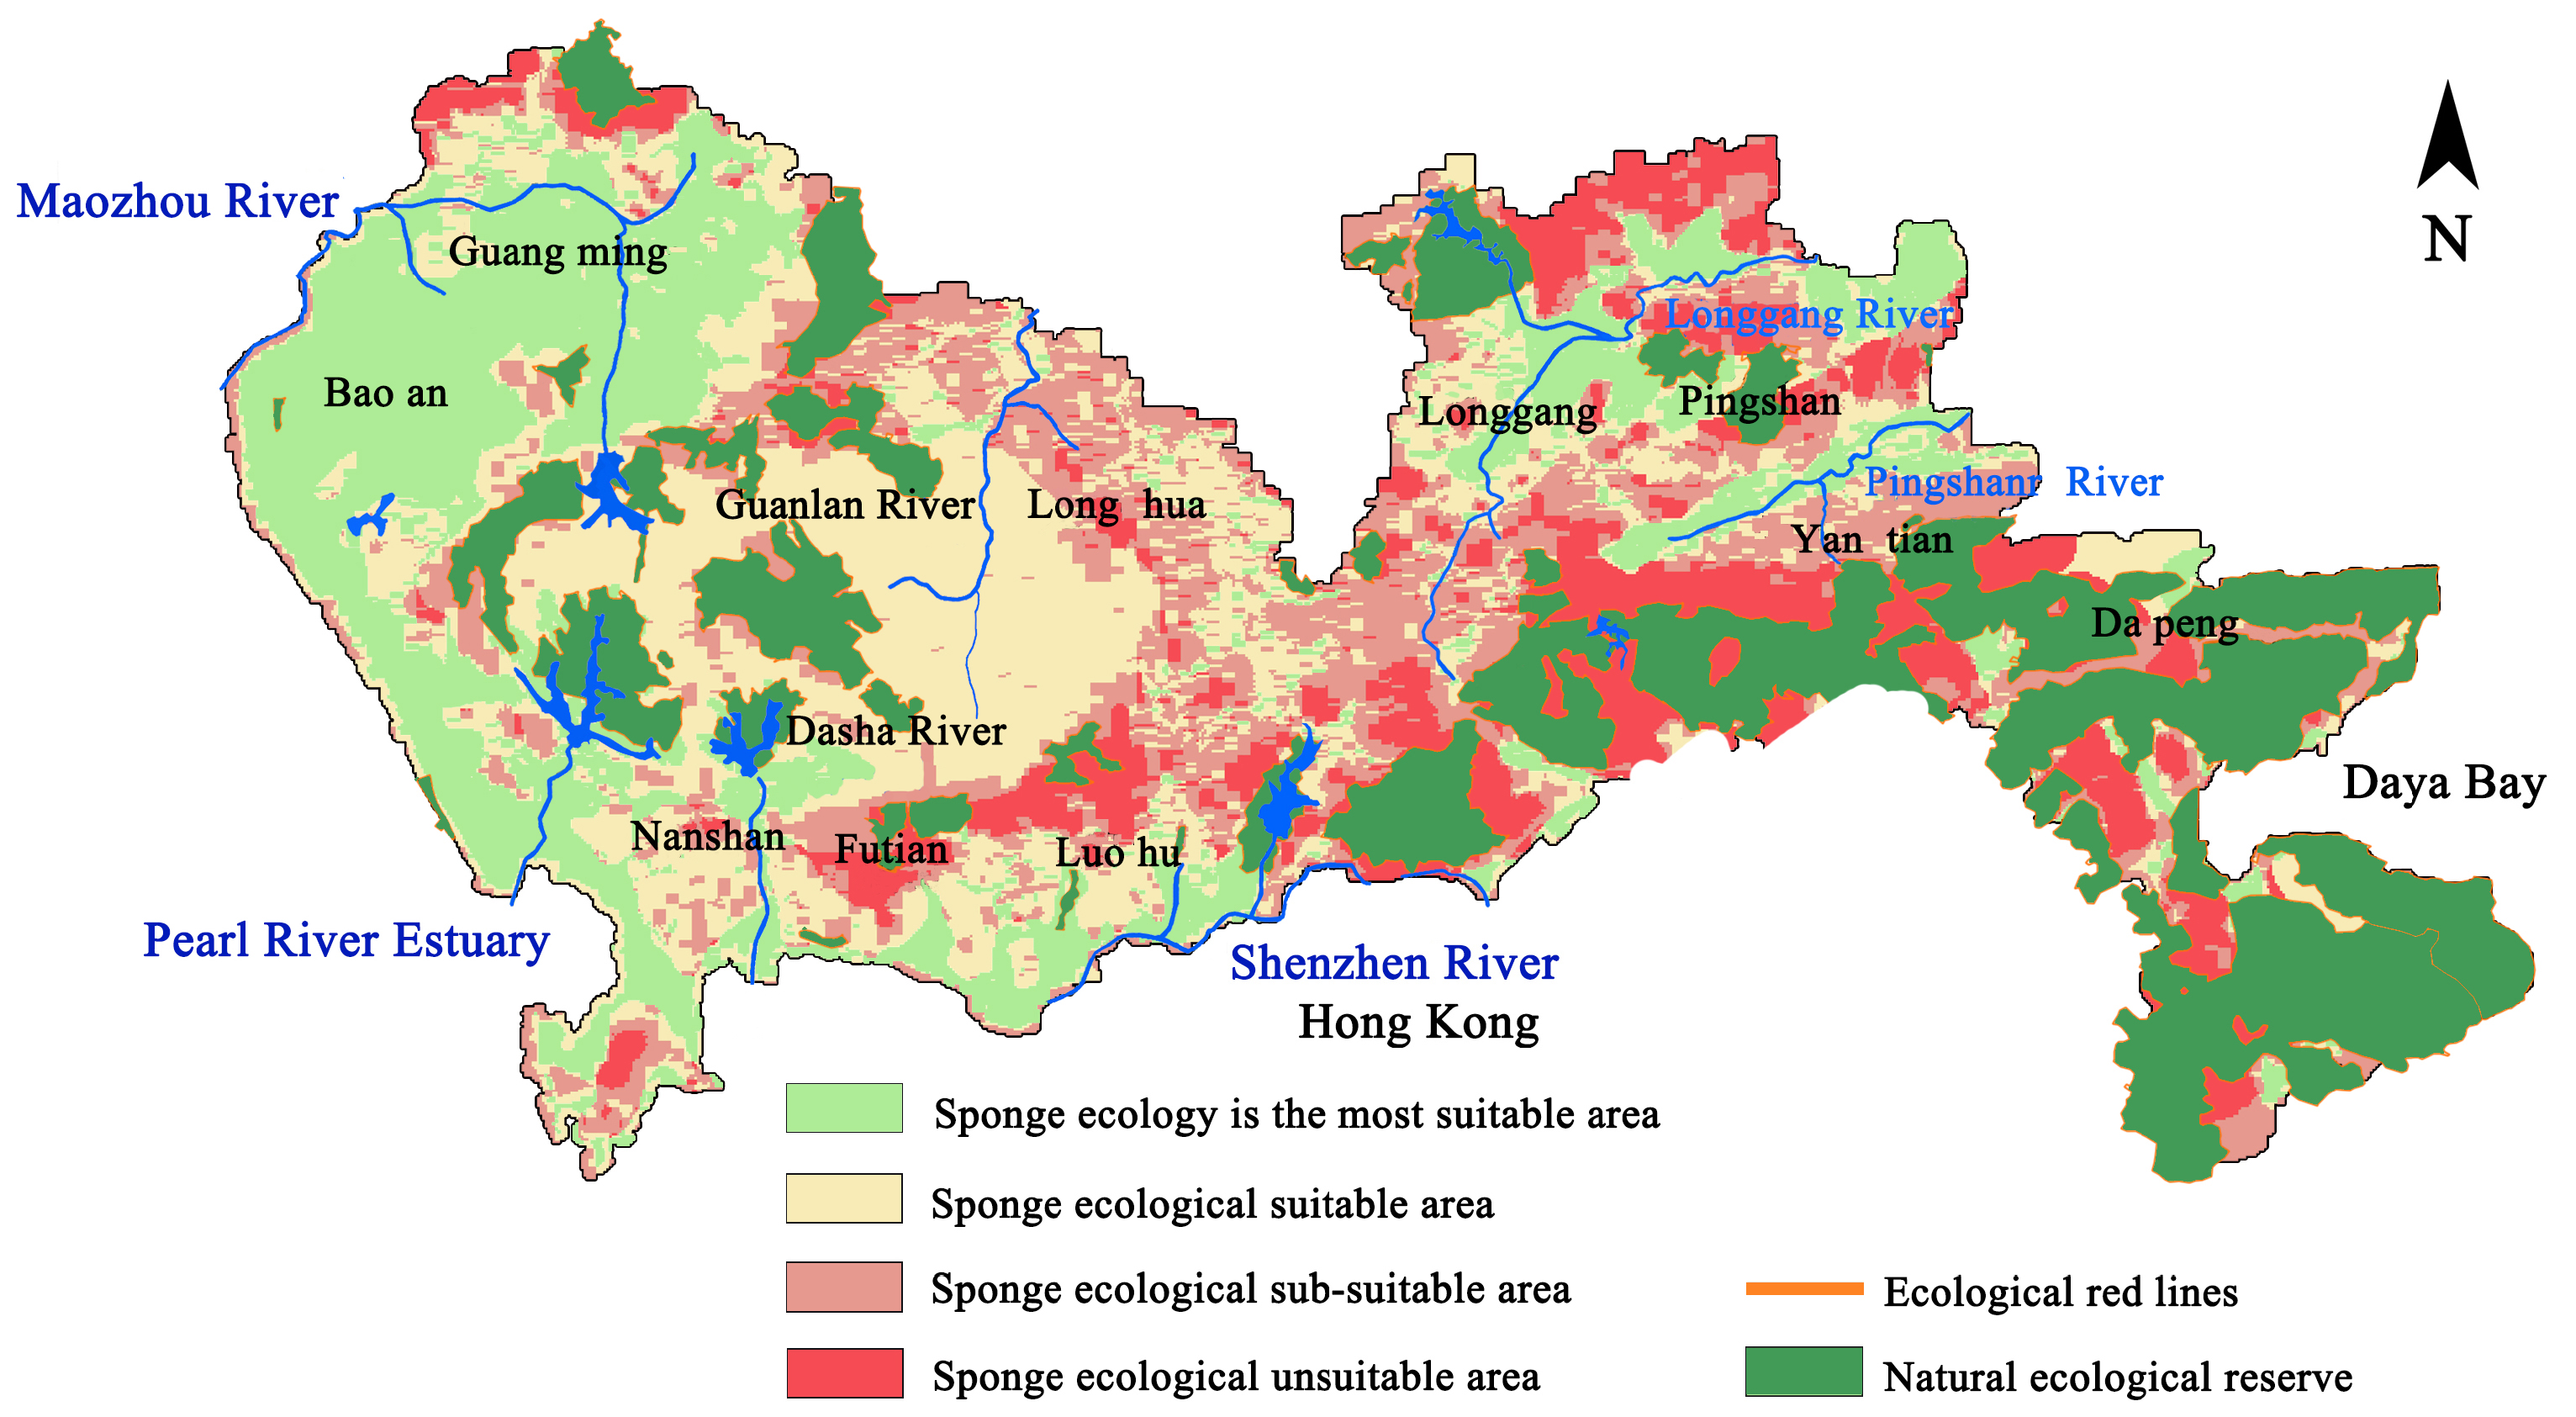
Figure 11.
Spatial structure of sponge ecosystem.
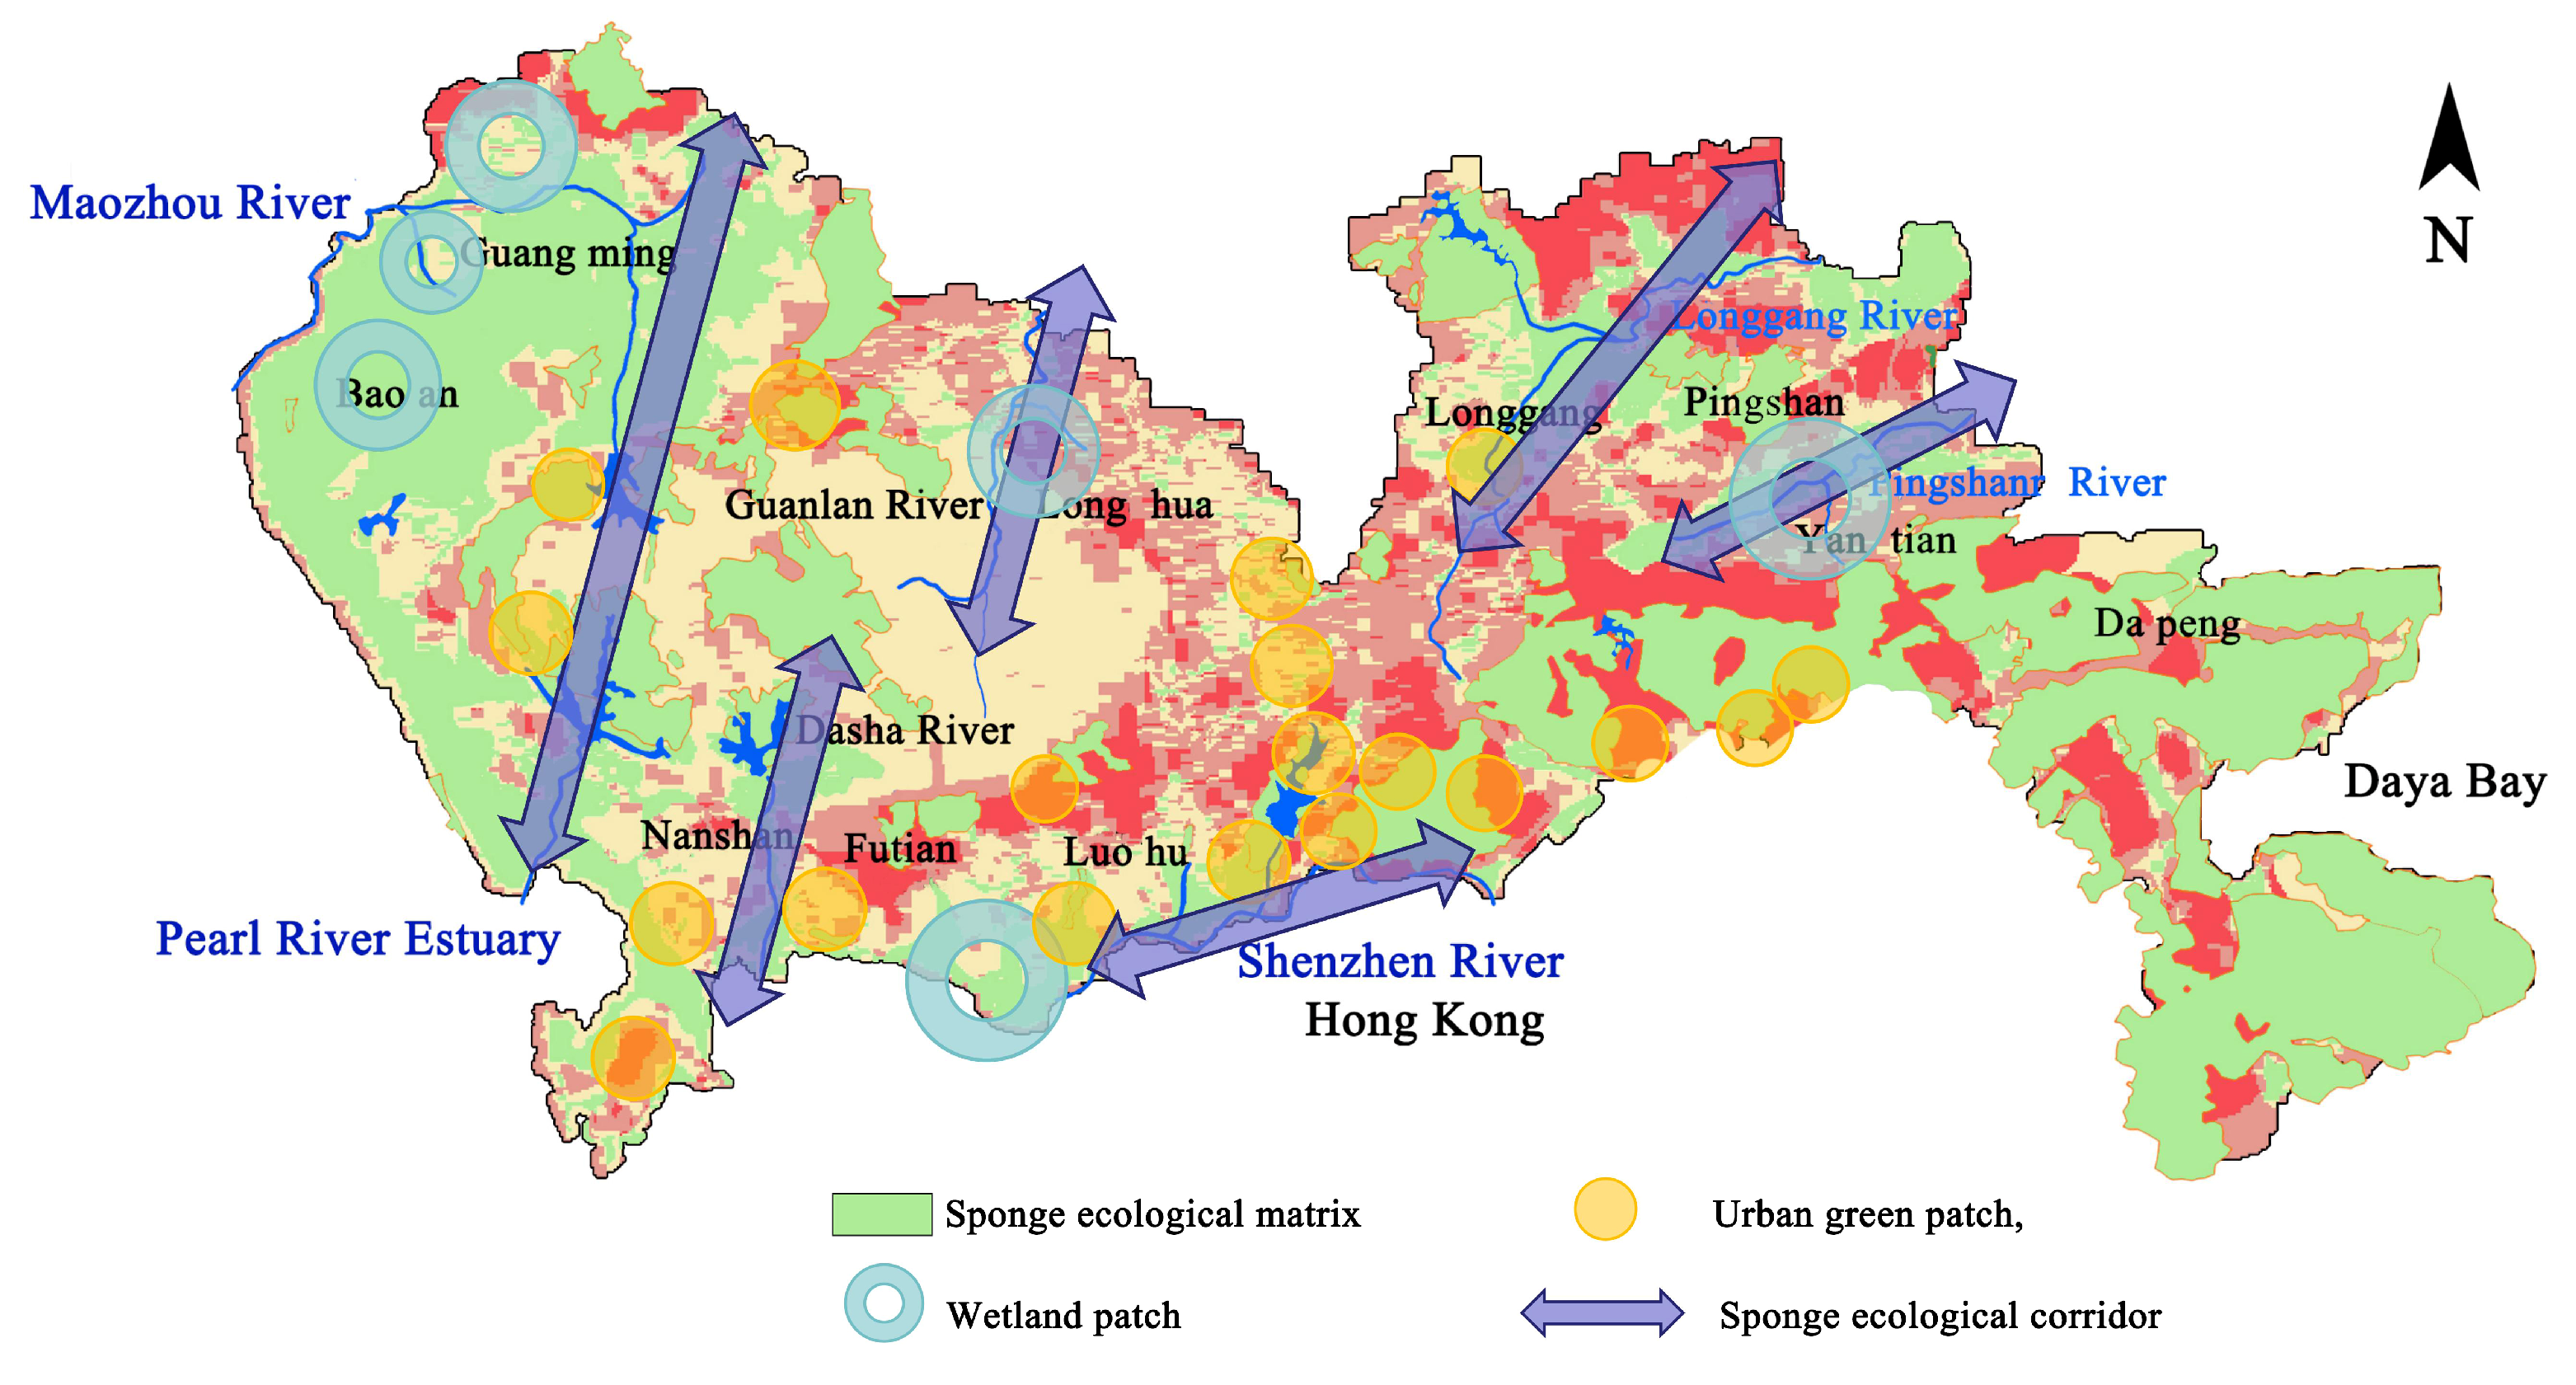

Table 1.
Construction method based on index evaluation system.
| Construction method | Principle | Characteristics |
| Factor superposition evaluation method | Based on the Mchager Multi-layer Steamed Bread(MMSB) model, the weight of each influence factor was calculated by various calculation methods, and then superposed analysis was carried out. | Strong visualization, the use of spatial analysis tools, need to obtain a large number of data, and the accuracy of the data requirements are high, using different weight calculation methods, the evaluation results will be different. Emphasize vertical stack, ignore horizontal. |
| The logical rule group method | According to the logical rules between the factors, the complex relationship between them is quantified, and the evaluation criteria is determined. | Logic is the core problem of combining the two evaluation systems and formulating logical rules to get the risk from high to low level. |
| Source-corridor method | Based on the theory of “patch - corridor - matrix” in landscape ecology, the fluidity of influencing factors and their interaction are considered. | The flow of horizontal factors is mainly considered. |
Table 2.
Classification of water depth.
| Serial number | Rank division | Water depth (m) | Grade rating |
| 1 | high | 0.2-0.5 | 5 |
| 2 | medium to high | 0-0.2 | 4 |
| 3 | intermediate | 0.5-1.0 | 3 |
| 4 | middle and low | 1.0-2.0 | 2 |
| 5 | slight | 0 | 1 |
| 6 | low | 2.0-4.5 | 0 |
Table 3.
Classification of geological lithology.
| Serial number | Rank division | Hydrogeological unit | K value (m/s) | Grade rating |
| 1 | high | Volcanic sediment | 1×10⁻³ | 5 |
| 2 | medium to high | Quaternary sediment | 1×10⁻⁴ | 4 |
| 3 | intermediate | Highly weathered granite | 5×10⁻⁵-1×10⁻⁷ | 3 |
| 4 | middle and low | Sandstone, SLATE, phyllite | 5×10⁻⁶-8×10⁻⁷ | 2 |
| 5 | slight | Sandstone, shale, siltstone | 5×10⁻⁶-6×10⁻⁷ | 1 |
| 6 | low | Highly dense granite | 5×10⁻⁶-4×10⁻⁷ | 0 |
Table 4.
Classification of groundwater depth.
| Serial number | Rank division | Groundwater depth (m) | Grade rating |
| 1 | high | 3-6 | 5 |
| 2 | medium to high | 6-10 | 4 |
| 3 | intermediate | 0-3 | 3 |
| 4 | middle and low | 10-30 | 2 |
| 5 | slight | >30 | 1 |
| 6 | low | <0 | 0 |
Table 5.
The area ratio of each single factor.
| Serial number | Water depth(%) |
Hydrogeological unit(%) |
Water depth(%) |
| 1 | 1.91 | 3.59 | 10.39 |
| 2 | 33.41 | 19.68 | 10.04 |
| 3 | 1.26 | 22.18 | 25.09 |
| 4 | 0.93 | 7.78 | 23.31 |
| 5 | 62.27 | 24.47 | 28.16 |
| 6 | 0.22 | 22.3 | 3.01 |
Table 6.
The area proportion of each sponge ecological region.
Table 7.
Optimal management strategy of sponge ecosystem function area.
| Spongy zone | Trait | Primary control objective | Management strategy |
| The most suitable area | Under the extreme precipitation scenario, 0.2-0.5m of water on the surface can seep down. The formation has strong permeability, moderate groundwater depth, moderate aquifer thickness, and strong water storage capacity. | Recharge ground water | Water ecological conservation and conservation. The sponge placement facilities are mainly infiltration type: permeable pavement, rain garden, sinking green space, constructed wetland, biological retention pond, etc. |
| Suitable area | There is a certain amount of water on the surface, but the infiltration of the ground lithology is slow or the groundwater storage space is less. | Reduce total runoff; Recharge ground water |
Sponge ecological buffer zone, mainly water ecological restoration. The sponge design can be combined with infiltration, transport, and retention, such as rain gardens and biological retention ponds, based on sinking green Spaces, which can be combined with green roofs, grass ditches, vegetation buffer zones, etc. |
| Sub-appropriate area | The ecological base is poor, a large amount of water can be generated in extreme precipitation scenarios, the geological conditions are not easy to penetrate the underground water is too small, and even the phenomenon of water in the soil appears in some locations. | Reduce total runoff; Delayed peak runoff |
To protect water ecological security. The sponge facilities are mainly designed to slow down runoff and reduce peaks, and drainage facilities are also required. For example, green roof, vegetation ditch, rainwater tank, and then equipped with box culverts, rainwater pipe network. |
| Inappropriate area | Geological disaster-prone areas, easily to be induced by heavy rainfall geological disasters, such as landslides, debris flows, and so on. Poor geological conditions are not easy to penetrate, or the underground water is too small, and the phenomenon of water in the soil is easy to occur. | Reduce the total runoff; Delayed peak runoff; Water resources recycling |
It is necessary to protect urban safety and prevent urban waterlogging. It is not easy to place sponge facilities, mainly to add a large number of drainage facilities for rainwater quick drainage to prevent urban waterlogging. |
Disclaimer/Publisher’s Note: The statements, opinions and data contained in all publications are solely those of the individual author(s) and contributor(s) and not of MDPI and/or the editor(s). MDPI and/or the editor(s) disclaim responsibility for any injury to people or property resulting from any ideas, methods, instructions or products referred to in the content. |
© 2025 by the authors. Licensee MDPI, Basel, Switzerland. This article is an open access article distributed under the terms and conditions of the Creative Commons Attribution (CC BY) license (http://creativecommons.org/licenses/by/4.0/).
Copyright: This open access article is published under a Creative Commons CC BY 4.0 license, which permit the free download, distribution, and reuse, provided that the author and preprint are cited in any reuse.


