
Submitted:
09 December 2025
Posted:
10 December 2025
You are already at the latest version
Abstract
This study focuses on identifying wine-growing subzones within the PDO Amyndeon and PGI Drama wine-growing zones in Northen Greece, with the aim of classifying their suitability to produce high-quality red wines from the Xinomavro (Vitis vinifera L.) and Cabernet Sauvignon (Vitis vinifera L.) grape varieties, respectively. The initial delimitation of suitability zones was carried out using readily available satellite data on soil, topography, and climate, which were validated using field data for two consecutive years from experimental vineyards in four different suitability categories. Preliminary results showed that this methodology was able to discern the most suitable areas for both varieties and regions with an acceptable relation to real grape and wine attributes as confirmed by the collection of data from the pilot vineyards. The overall performance of this method will eventually depend on the validity of the expert knowledge used to define the most critical parameters and their range. According to the results of this study, and given the relevance of the proposed suitability criteria, this method has the potential to provide an alternative solution for subzone delineation in cases were wine analytical and sensory data are not available.
Keywords:
terroir
; viticultural zonation
; subzones
; Vitis vinifera
; Xinomavro
; Cabernet Sauvignon
1. Introduction
The interactions between a geographical area, the grapevine variety, and the empirical human interventions shape what is commonly described as the “wine terroir” [1]. Wine appellations are geographical and regulatory systems that guarantee the typicity of the traditional style of wine produced in a wine region thereby applying and protecting the notion of terroir from any erroneous and misleading use [2].
Some of the viticultural parameters involved in the delineation of such geographical entities are related to local grape varieties and to traditional viticultural and winemaking techniques. However, the most important factors implicated in this regulatory system are the parameters of the environment which can vary considerably within relatively small areas creating the conditions necessary for the production of wines of distinctive character [3].
The major abiotic variables that make up the terroir ecosystem are those of climate (temperature, rainfall, radiation, wind etc.), and soil (mineralogy, texture, structure, water reserve, depth, colour etc.) [4] with topography (slope, exposure, altitude) creating their local variations. There has also been increasing scientific work in recent years regarding new factors with possible role in shaping wine terroir like berry/leaf/soil microbiome [5]. However, this field is relatively new in the context of terroir, and data still remain inconclusive.
In wine culture, the link between soil and wine typicity is very popular. The contribution of soil is considered among wine connoisseurs as the most closely related to the terroir effect [6]. However, there has been much debate whether soil effects are direct or mostly mediated through the depth and extension of the root system. Moreover, the effect of soil is dependent on complex interactions with plant material (variety, clone, rootstock, vine age) and with human decisions (amount and timing of irrigation, fertilization etc.). According to most studies, soil physical properties (texture, structure, etc.) seem to exert a more important influence on the terroir effect than chemical properties (calcium carbonate, organic matter, pH, etc.) [7]. As far as physical properties are concerned, texture is probably the most significant soil attribute in vineyard soils with sandy soils offering better drainage and depth and clayey soils offering better nutrient and water retention [8]. However, one soil chemical parameter which must not be overlooked is nitrogen nutrition which, apart from regulating vine vigour and growth, has a direct effect on the biosynthesis of many secondary metabolites since most of their biosynthetic pathways begin with amino acids [9].
The role of climate in the terroir effect is generally accepted as the most important since the vines are directly exposed to climatic factors. Among those, temperature has been extensively studied [10,11] since it directly affects photosynthesis and respiration (and therefore vine carbon balance), the succession of vine developmental stages and most importantly the biochemical processes of the ripening berry [12,13]. The recent changes in climatic conditions related to global warming have been altering the climatic foundations on which wine appellations are built. Increases in air temperature have been associated with shifts towards earlier ripening and possible changes in wine organoleptic properties [14] which suggests possible difficulty in maintaining traditional wine styles. Local varieties may therefore become less adapted since they ripen too fast resulting in a decoupling of technological and phenolic/aromatic maturities [15,16].
Viticultural zonation and terroir represent interconnected yet distinct frameworks within the field of viticulture, each contributing critically to the comprehension and optimization of grape growing and wine production. Since climate change destabilizes this equilibrium between soil, climate and local varieties, the future of appellations will depend on their ability to balance tradition with flexibility, ensuring both authenticity and resilience. Under these circumstances, there is need for an easy-to-use, accessible and reliable tool, able to recognize possible variations in the terroir parameters and to revise, if necessary, the boundaries or the regulations of wine appellations.
Viticultural zonation is a methodological approach used to classify vineyard regions into distinct units based on environmental, soil, and climatic characteristics, often described as Natural Terroir Units (NTU). The Unité Terroir de Base' (TBU) introduced first by Morlat [4] in his study of the viticultural areas of the Loir region. The Unité Terroir de Base' is defined as the smallest area of vineyard land consistent with practical use and whose vine respond reproduces its characteristics through the produced wines. A study by Tesic and Barbeau used a site index composed of physical properties of the soil and mesoclimate variables to investigate viticultural zonation in New Zealand [17]. In recent years the methodologies used to delineate subzones within viticultural areas frequently integrate Geographic Information Systems (GIS) and also machine learning algorithms to analyse geospatial data [18,19,20,21,22]. GIS serve as an essential tool for collecting, managing, and analysing georeferenced data, playing a pivotal role in viticultural zoning. These tools can analyse several layers of soil, climate, and topographical data to define areas of similar viticultural functionality [3,23].
This process presents similarities with methodologies which aim at the delineation of management zones within fields (i.e., within a vineyard block or an entire estate). However, this approach has different operational needs compared to the methodologies that aim at creating terroir subzones within appellations. The former aim at optimizing viticultural practices to improve vineyard productivity by site-specific applications of inputs or/and achieve higher grape quality by favouring selective harvest [24,25]. These approaches use proximal data sources (soil electrical conductivity, NDVI etc.) at a high resolution. The latter, on the other hand, focus mainly on natural factors such as landscape, climate and soil using in most cases long-term climate data, geomorphology (slope, aspect, elevation), soil maps and typically require a lower resolution of data like satellite images.
Management zones of single vineyard blocks can be directly validated using in situ measurements such as yield, vine vigour, and detailed soil metrics. However, terroir subzones ultimately require validation through wine quality and sensory expression, ideally through multiyear tasting series across multiple producers. In many emerging appellations, such long-term wine datasets are unavailable, necessitating the use of indirect validation and expert knowledge. In these cases, terroir zoning relies on proxy indicators of wine potential, an approach widely applied in PDO and terroir research programs (ref??). Pedological attributes (soil texture and depth, water holding capacity, drainage, organic matter etc.) serve as predictors of vine vigour, berry composition and expected wine style. Climatic parameters such as Growing Degree Days (GDD), diurnal temperature range, ripening period night temperatures etc., provide further information into phenotypic expression, and maturity patterns. Topographic factors (slope, aspect, elevation, etc.) additionally provide information indirectly related to soil and mesoclimate. While none of these proxies can independently confirm a terroir subzone, together they enable the formulation of reasoned, evidence-based hypotheses in the absence of long-term wine sensory datasets.
A diverse range of techniques and models has been employed in previous literature concerning the zoning of viticultural regions [26,27]. In Greece only one study has been carried out [28], providing an opportunity for further research on Greek grape varieties and wine growing regions. However, these approaches rely on the availability and collection of relevant data (on-site meteorological stations, detailed soil surveys and soil pits, etc.) which is often limited in Greece. Additionally, in some cases of newly established PDOs, the vineyards within the regions under study are either not yet planted or they are too young, resulting in insufficient historical data from previous cultivation periods. This further emphasizes the importance of developing methodologies that can utilize easily accessible data sources, such as satellite imagery and online information, to conduct zoning analyses in the absence of vineyard-specific data.
In Greece, there are many PDO and PGI appellations for both red and white wines. These areas cover a variety of landscape, soil and climate characteristics (mountainous, coastal, island, etc.) and present a high internal variability between their respective subzones. This knowledge, however, remains empirical among growers and winemakers since limited research has been conducted to assess their wine potential. In this context, the primary aim of the study was to develop a simple methodology based on easily accessible data and expert knowledge and to apply it in two wine appellation areas in Northern Greece in order to identify their viticultural subzones. After identification, experimental vineyards were established in each zone, from which viticultural and oenological data from two consecutive growing seasons (2021–2022) were examined to validate the differences in the quality characteristics of the grapes and wines between the zones. The main interest of this work was to enable subsequent applications to other Greek wine producing areas to strengthen the basis of our knowledge of their specific characteristics, to achieve the production of wines of high quality and individuality.
2. Materials and Methods
2.1. Chemicals
For the chemical analyses conducted in this study, ethanol, water (HPLC grade), and sodium metabisulfite were purchased from Merck (Zedelgem, Belgium). Hydrochloric acid (37%) for the analysis was purchased from Carlo Erba (Val de Reuil Chaussée du Vexin, France). Sodium carbonate and Folin–-Ciocalteu phenol reagent were obtained from Sigma Aldrich (Darmstadt, Germany).
2.2. Study areas and general characteristics
The study was conducted in two distinct wine growing areas of Northen Greece. The first is Protected Designation of Origin (PDO) Amyndeon and the Protected Geographical Indication (PGI) Drama. PDO Amyndeon is located in Western Macedonia, Greece. The region extends over a plateau surrounded by the mountains Vermio (2,052 m), Vitsi (2,128 m) and Vorras (2,554 m) (Figure 1). The average altitude of the area is approximately 600 m, and the climate is characterized as continental with cold winters and warm summers. The viticultural environment of the area is affected by its altitude as well as by the presence of four lakes: Lake Vegoritida, Lake Petron, Lake Chimaritida, and Lake Zazari. These lakes help moderate the weather extremes, creating a favourable environment for agriculture. The vineyards located in the PDO Amyndeon zone are predominantly planted with the indigenous Xinomavro (Vitis vinifera L.) grape variety, the sole grape variety authorized according to Amyndeon appellation regulations for the production of red, rose and rose sparkling wines. Xinomavro represents more than 60% of the total viticultural PDO area covering approximately 700 hectares.
Most of Amyndeon soils are characterized by a high sand percentage, ranging between 50–90%. Calcium carbonate of the topsoil is low to absent, but the entire area is formed over limestone bedrock. pH of the topsoil is ranging between 6 and 8 while organic matter is in most cases at average levels for vineyards (1–3%). The main soil factor differentiating Amyndeon subzones is sand percentage and to a lesser degree soil organic matter.
Climatic data for the area was provided by a METOS automatic weather station (Pessl Instruments, Werksweg 107, 8160 Weiz, Austria), located inside the PDO Amyndeo area (40°41'28.85"N, 21°42'28.25"E). The two years of the study presented normal climatic conditions with a heat summation of 1685 GDD for 2021 and 1668 GDD for 2022 which was a relatively warmer year. Amyndeon during the coolest years is classified into region II according to Winkler classification [29] and region III in the warmest years, which makes it one of the coolest wine producing areas in Greece. Comparing the two years the average growth season GDD is comparable, however 2022 had a particularly warm month of May while 2021 had slightly warmer temperatures during the summer months (Table 1). Rainfall was evenly distributed during the growth season reaching a sum of 240.9 mm in 2021 and 168.8 mm in 2022.
In contrast, the second wine growing region PGI Drama (Figure 2) is located in Eastern Macedonia, in Northern Greece, at an average altitude of 100–350 m. The region topography is flat with a valley floor at less than a 100 m altitude where the land is suitable for broad acre crops (i.e., corn, cotton and wheat). However, the area is surrounded by three of the highest mountains ranges of Eastern Greece namely Falakron to the north (2,232 m), Menikion to the southwest (1,963 m) and Pangaion to the southeast (1,956 m). These topography makes Drama a typical continental climate area although its distance from the sea is only about 45 km. Therefore, the climate of Drama is characterized as Mediterranean with continental influences, with mild, wet winters and hot, dry summers, offering optimal ripening conditions for mostly late and mid-season cultivars. Among those, Cabernet Sauvignon (Vitis vinifera L.) is one of the most widely cultivated grape variety of the PGI Drama wine region and has been producing some of the most iconic Greek wines in that area in the last 30 years.
Most soils of Drama region present a predominantly clay to clay-loam texture, with clay content typically ranging between 20–76%, sand between 13–61%, and silt between 11–43%. Calcium carbonate is generally low to moderate in the topsoil, with total CaCO3 ranging from 0 to 27% and active CaCO3 rarely exceeding 4%, reflecting the mixed geological parent materials of the region. Soil pH values fall consistently within the slightly acidic to moderate alkaline range (6.8 to 7.7), while organic matter remains low to moderate (1–3.7%). In Drama the main soil characteristic that distinguishes the subzones is the clay content, which influences both moisture availability and nutrient holding capacity.
Climatic data for the area was provided by a METOS automatic weather station (Pessl Instruments, Werksweg 107, 8160 Weiz, Austria), located inside the PGI Drama area (41°12'2.61"N, 23°57'1.43"E). The two years of the study in the region of Drama presented relatively typical climatic conditions, with heat summation of 1886 GDD in 2021 and 2005 GDD in 2022, indicating that 2022 was a warmer year. According to the Winkler classification [29] Drama falls within the region III during cooler years and may shift toward the lower limits of region IV in warmer years. Although the total GDD values of the two years were comparable, monthly temperature distribution varied. Warmer midsummer conditions characterized 2021, while 2022 showed increased spring temperatures, particularly in April and May (Table 2). Rainfall distribution varied between the two vintages. In 2021 precipitation during the growth season reached 307.5 mm, fairly well distributed across the months, while 2022 was notably wetter, accumulating 435.2 mm, mainly due to increased rainfall in April, May, and June.
2.3. Selection of subzone classification parameters
The criteria for selecting the input data used to delineate the subzones in the two study areas were based on variables that are readily accessible through satellite observations, providing a robust basis for the evaluation of all relevant parameters. In the context of a preliminary zoning study with limited available data, we selected two soil parameters, sand percentage and the carbon-to-nitrogen ratio (C/N) as integrative indicators of the physical and chemical functioning of vineyard soils [30]. Sand percentage provides a robust and widely validated measure of the physical environment in which vines grow. As the dominant driver of soil texture, it strongly influences water infiltration, drainage capacity, aeration, and root penetration. These properties determine vine water availability, the speed of soil warming, and the overall vigour potential of the vineyard, which are key factors that differentiate viticultural behaviour across terroirs. Even when deeper soil data (structure, stoniness, horizons) are unavailable, sand content remains a reliable index for hydrological behaviour and rooting conditions, allowing meaningful discrimination among zones.
The carbon-to-nitrogen ratio (C/N) was selected as a complementary indicator of the soil’s chemical and biological status. The C/N ratio integrates information about organic matter quality, nutrient cycling, and microbial activity, all of which influence the supply of nitrogen and other minerals to the vine [31,32]. Because nitrogen availability directly impacts vegetative growth, berry composition, and ultimately wine style, the C/N ratio is a powerful explanatory variable, particularly when full soil nutrient analyses are not accessible. Importantly, the C/N ratio captures not only the quantity but also the functionality of soil organic matter—providing insight into long-term fertility, organic matter mineralisation rates [33,34].
For the climatic component of the zoning methodology, we selected as critical period the month preceding harvest. This is a period where climatic parameters directly affect berry primary and secondary metabolism and particularly sugar accumulation, acid breakdown, phenolic content and extractability, and aroma compound synthesis [35]. Especially regarding secondary metabolites which are mostly responsible for wine aroma and flavour, there has been abundant literature regarding the effects of light, temperature, and water conditions [36]. These metabolites are in most cases increased under higher exposure of grapes to direct solar radiation [37] and by daytime temperatures of 25 °C coupled with cool (15–20 °C) nights [38] whereas significant reductions have been observed in grapes exposed to temperatures of 35 °C [39] especially under an excess of solar radiation [40]. In our methodology in order to describe the thermal conditions of the ripening period, we selected maximum and minimum temperature. Daytime temperature controls the rate of sugar accumulation and malic acid respiration while low nighttime temperature accelerates respiration of acids and reduces freshness. Aspect of slope is a simple but powerful index for incoming solar radiation and daily temperature regimes; in the northern hemisphere, south-facing slopes receive more radiation and warm faster in spring and through ripening, which shifts phenology and suitability for particular varieties [41].
Precipitation is a crucial factor both during the winter months and throughout the ripening period. In viticulture, where irrigation is typically limited, winter precipitation is vital for reloading water reserves required for spring growth [42]. During the ripening phase rainfall is an important factor of the quality of vintages, especially in cool climate areas planted with late ripening cultivars [43]. In most cases, rainfall is undesirable during the last stages of berry ripening since it can delay maturity and increase disease risk. On the contrary a steady but not excessive rainfall during the initial stages of the growing season has a positive impact on yield [44]. Growing season rainfall also functions as a primary driver of vine water status, influencing canopy development which allows protection over the grapes against extreme climatic conditions. Variability in rainfall across the study area can therefore be expected to translate into differences in vigour, ripening dynamics, and vintage consistency, making it a critical zoning criterion even in data-limited contexts.
In addition to soil and climatic variables, topography was incorporated as a key component of the zoning framework due to its strong and well-documented influence on mesoclimate, water redistribution, and vine physiological responses. Variations in elevation and slope can modulate exposure, soil moisture. Moreover, topographic heterogeneity interacts with soil texture and climate thus contributing to vigour patterns and ripening potential [45].
Given the complexity of these parameters, expert knowledge was deemed essential to guide the weighting and interpretation of each factor. The panel of experts was selected to ensure that the methodology integrates scientifically sound and locally relevant knowledge and provide reliable limits and factor weights. Experts included soil scientists, viticulture specialists, climatologists, and wine growers of each region.
2.4. Geospatial Datasets
Soil parameters included sand content and the carbon-to-nitrogen (C/N) ratio. Sand content data was obtained from SoilGrids [46] which offers high resolution soil property information across Europe at a 250 m spatial resolution. The C/N ratio was calculated by dividing soil organic carbon by nitrogen content, using corresponding SoilGrids data. For both of these variables, we used the 5–15 cm depth as input layer.
The climate dataset consisted of key variables relevant to vine growth and grape development:
• Precipitation: Winter (October–March), Growing Season (April–September), and Ripening Period (September)
• Temperature: Mean Daily Minimum Temperature (September) and Mean Daily Maximum Temperature (September)
All climatic variables were obtained from the Copernicus Climate Data Store (CDS), using the ERA5-Land hourly reanalysis data for the precipitation data [47] and the ERA5-Land post-processed daily statistics for the temperature data. From the raw hourly data we calculated the daily cumulative precipitation at the native spatial resolution of 9 km.
For the topographic classification, slope and aspect were extracted from the Copernicus Digital Elevation Model (COP-DEM), acquired through the Copernicus Data Space Ecosystem [48]. This DEM provides a spatial resolution of 30 meters, enabling detailed terrain characterization.
2.5. Geospatial subzone classification methodology
In this study, geospatial areas were classified based on their suitability for the cultivation of Xinomavro grape variety in the PDO Amyndeon region and Cabernet Sauvignon in the PGI Drama region and categorized into four classes using the Python programming language. The first class corresponds to areas with the optimal characteristics for the cultivation of each grape variety in the specific region, while the subsequent classes are less suitable but still viable. After acquiring the dataset and generating the relevant variables, all data were reprojected to a common coordinate system (WGS84) and resampled to a spatial resolution of approximately 30 meters using bilinear interpolation. A per-pixel analysis was then conducted.
To achieve this, for each pixel each variable was classified into four suitability classes based on its numeric value, as presented in Table 3 and Table 4. Additionally, a weight was assigned to each variable according to its importance in determining vineyard suitability. The suitability value for each variable was then calculated by multiplying its assigned weight by the class number (e.g., for Class 2: Weight × 2). The total suitability score for the given pixel was derived by summing all individual suitability values for that pixel. To enhance interpretability, the total suitability score for this pixel was then normalized to a scale of 0 to 100, indicating the relative suitability. Finally, to generate distinct suitability zones rather than a fragmented pixel-based representation, the normalized values were reclassified into four classes, where Class 1 represents the most suitable areas, and Class 4 corresponds to the least suitable, based on the thresholds defined in Table 3. In mathematical notation, the normalized score N for a given pixel p is calculated as:
Where is the suitability class of variable i at pixel p and its assigned weight drawn from the lookup Table 3 and Table 4, while and are the lowest and highest recorded value across all pixels. The reclassified score is then given by:
The next step in the geospatial suitability vineyard classification was to apply a majority filter to smooth the classes and make them more uniform. A Majority Filter is a spatial analysis tool that smooths or generalizes a raster by replacing each cell's value with the most frequently occurring (majority) value within a specified neighbourhood. This helps reduce noise and create a more generalized representation of the raster. For this study the SAGA Majority/Minority filter [49] was used using the parameter of kernel radius 3 px and kernel type Circle. Finally, the vineyard classification raster was clipped by ESA World Cover Land Cover [50] dataset to omit unnecessary classes of Tree cover, Shrubland, Grassland, Buit-Up, Permanent water bodies and Herbaceous wetland meaning that the focus area is composed mainly of Cropland and Bare/sparse vegetation classes.
Regarding the classification parameters for Amyndeon and their ranges for each suitability class, sand percentage was considered as a favourable attribute of the soil, since light-texture soils in cool areas with late ripening varieties are warmer in spring leading to an earlier beginning of the vine cycle [51] (Table 3). Early ripening for Xinomavro in Amyndeon is possibly the most critical characteristic for the suitability of certain area for the production of quality red wines and consequently this classification parameter was given a high weight of influence. The C/N ratio was considered most suitable at low values (high Nitrogen release) to balance the low percentage of organic matter [52]. Concerning the three rainfall indices, high winter rainfall and low growing season rainfall were considered as the most suitable for the production of premium red wines from Xinomavro, with summer rainfall given a higher weight. The maximum importance was attributed to the rain conditions of the ripening month (September) where clearly the lowest values were attributed to Class 1. Temperature and especially nighttime minima have been shown in current literature [53] to be the determining climatic factor for the biosynthesis of aroma compounds responsible for the varietal character of the wines. However, in the case of Xinomavro slightly higher nighttime temperatures are considered by experts as more desirable to sustain a steady ripening process under cool conditions and achieve a good phenolic ripeness. For daytime temperature, lower values were considered as optimal for Class 1, though with a lower weight compared to nighttime temperature. Finally, regarding the topographic characteristics, the highest slope was given the maximum positive weight while its exposure to the east was theoretically the more balanced one followed by south and west exposed slopes [54].
In Drama a similar reasoning regarding the ranges of the same parameters was used for the definition of the suitability classes, with slight modifications related to the differences between the two areas. The main change is found in the winter rainfall (which presented a reverse classification compared to Amyndeon) because according to expert knowledge, higher total rainfall for the period October-March in these heavier soils would possibly delay budburst and also sustain vigorous growth of vines for a longer period of time. Regarding temperature, lower values were considered as optimal for both daytime and also nighttime temperatures. Since Drama area is warmer than Amyndeon, experts prioritised cool conditions as critical during the ripening month (September). The same reasoning was used to assign different slope aspects to the suitability classes, with west exposed slopes considered as too hot for the production of premium wines and therefore attributed the lowest suitability.
2.6. Pilot vineyard plots
Specific vineyard plots were chosen inside every subzone proposed by the present methodology. The selection of vineyards within each suitability zone was based on following criteria: (A) age of the vineyards superior 10–15 years, (B) condition of the vineyard (absence of missing plants, trunk diseases, etc.), (C) absence of irrigation, and (D) uniformity in vineyard management techniques. Four representative vineyards were selected within the identified suitability zones of each region. In the PDO Amyndeon area (Figure 4), the selected plots cultivated the Xinomavro (Vitis vinifera L.) grape variety, while in the PGI Drama area (Figure 6), the selected plots cultivated Cabernet Sauvignon (Vitis vinifera L.).
The vineyards in PDO Amyndeon were 12 to 15 years old, grafted onto SO4 (Berlandieri x Riparia group) rootstock and had planting densities ranging from 4,000 to 4,500 plants per hectare. Similarly, in PGI Drama region, the vineyards were aged between 10–14 years, grafted on 110R (Berlandieri x Rupestris) rootstock, and planted at densities of 3,300–3,500 plants per hectare. The pruning system in all experimental vineyards was the bilateral cordon system limited to four spurs per cordon and with two buds on each spur. Weed management was achieved through cultivation. All the plots were dry farmed. Pesticide applications were consistent across all plots. The selected vineyards varied in their topographical characteristics, including altitude, aspect, soil composition, and proximity to water resources.
2.7. Validation of the subzone classification
2.7.1. Phenology, vine development, vigour and yield
The phenological stages of budburst, flowering, and veraison were documented when 50% of the buds, flowers, or berries had reached the respective event. Yield was restricted due to rigorous pruning. Differences in yield among plots primarily stemmed from variations in berry and cluster weights. Berry weight was monitored weekly from veraison until ripeness using a sample of approximately 400 berries for both regions.
2.7.2. Vine water status
Measurement of midday stem water potential (ΨMD) was performed in both study areas to assess vine water status. Measurements began at flowering and was carried out on four dates up to harvest. During the first year, stem water potential measurement dates were 16 June, 8 July, 11 August and 27 September for the PDO Amyndeon region, and 25 May, 21 June, 25 July, and 9 September for the PGI Drama region. While for the second year the same measurements were taken on 12 June, 10 July, 13 August and 29 September in PDO Amyndeon, and on 28 May, 26 June, 27 July and 12 September in PGI Drama. Measurements were obtained using a pressure chamber [55]. All measurements were performed on cloudless days at midday (between 12:00 and 14:00). Prior to measurement, leaves were enclosed in a plastic and foil bag for 45 to 120 minutes to reduce transpiration and equilibrate the leaf water potential with that of the stem. Subsequently, the leaves were cut off, and their water potential was determined, with the final value representing the average of four replicates per plant. Previous research [56,57,58] showed that a grapevine experiencing high water stress is defined by leaf water potential values less than −1.4 MPa. Values ranging from −1.3 to −1.4 MPa indicate moderate water deficit to severe water stress. Moderate water deficit is characterized by values between −1.1 and −1.3 MPa, while mild water deficit is indicated by values between −0.9 and −1.1 MPa. Stem water potential values greater than −0.9 MPa reflect an absence of water stress in plants. All the vineyards studied were non-irrigated, relying solely on soil water reserves and annual rainfall for their water supply.
2.7.3. Leaf area index and pruning weight
At full ripening, the total leaf area of eight vines from each treatment plot was estimated using a non-destructive method as outlined in [59]. Vine vigour was further assessed by calculating the average pruning weight, which was measured in December. The pruned mass was collected from five vines in each plot and weighed on site using a portable scale.
2.7.4. Berry weight, berry composition and bunch weight
From veraison through harvest, one hundred fifty berries were sampled weekly at random from five different bunches in each plot. Each sample from every plot was divided into three subsamples of 50 berries each. At harvest the mean weight of five healthy bunches per plot was recorded using a precision balance scale. These berries were immediately counted and weighed to determine the average fresh berry mass. Subsequently, they were placed in portable coolers with ice packs for transport to the laboratory. On the same day, the berries were pressed, and the juice was gently centrifuged to remove suspended solids. Sugar content was determined using digital refractometry (HI96841, HANNA Instruments, Woonsocket, RI, USA), pH was measured with a laboratory pH meter (HI2020-02, HANNA Instruments, Woonsocket, RI, USA). Titratable acidity was assessed manually using Bromothymol blue, with titration conducted using 0.1N NaOH until reaching a pH endpoint of 7.0. The remaining subsamples from each plot were preserved at −80 oC for later assessment of phenolic compounds.
2.7.5. Phenolic Content and Anthocyanins
The determination of phenolic content and total anthocyanins in whole berries was performed according to the protocol described by Iland [60]. 50 berries from each replicate were transferred to a 125 mL plastic beaker and homogenized for 1 minute at 24,000 rpm using an Ultra Turrax T25. Then, 1 g of the homogenate (in triplicate) was transferred to 10–15 mL centrifuge tubes, and 10 mL of 50% v/v aqueous ethanol (pH 2) was added to each tube and mixed for 1 h. After centrifugation at 3500 rpm for 10 min, the supernatant was used to measure the absorbance as follows: 0.5 mL of the supernatant was added to 10 mL of 1 M HC1 and mixed thoroughly. After 3 h, absorbances at 520 nm and 280 nm were recorded in a 10 mm cell. Anthocyanins (expressed as milligrams of anthocyanins per berry) were calculated from the absorbance measurement at 520 nm. The total phenolics (expressed as absorbance units per berry) were calculated from the measurement of the absorbance at 280 nm using a UV-VIS spectrophotometer.
2.7.6. Wine making process and analysis
Approximately 20 kg of grapes harvested from each vineyard cell were vinified individually. Initially the musts were treated with 5 g/hL with potassium metabisulphite. Pectolytic enzymes at 40 mg/L (Safizym Pres, Fermentis, Marquette-Lez-Lille, France) (previously hydrated in water 15 min, 38 °C) and nutrients at 30 g/tn were also added. The fermentation was performed with the use of Saccharomyces Cerevisiae Collezione Primavera ‘56 (Laffort, Bordeaux, France) at 300 mg/L to ensure the complete conversion of sugars into alcohol, under controlled conditions and with skin contact for 10–20 days. During the vinification process the containers were stored in a cool and dry place with temperatures ranging at 20–30 ◦C. Every day the mash caps of the containers were punched down. At the end of alcoholic fermentation each wine was separated from the skins to a new container and sulfite was added (10 g/hL SO2). Malolactic fermentation was purposely avoided, and wines were bottled for further analysis.
The basic physicochemical analysis of the wine samples (%vol, residual sugars, pH, total acidity) was performed using FTIR spectroscopy using an Oenofoss™ analyser (OenoFossTM type 4101, FOSS, Hilleroed, Denmark). In addition, the total phenolic content and the colour characteristics (colour intensity and hue) of the wine samples were assessed following the Folin–Ciocalteu [61] and the Glories method [62], respectively.
2.8. Statistical analysis
Data presented are means of three replicates (n = 3). Results were averaged per plot, and only plot averages were used in the ANOVA. Significant differences between treatments were detected using Duncan’s test at p < 0.05. All statistical analyses were performed using IBM SPSS Statistics for Windows, version 22.0 (Armonk, NY, USA, IBM Corp.).
3. Results
3.1. Maps of suitability classes
3.1.1. Maps of suitability classes for PDO Amyndeon
The classification system used in the present study firstly categorized, on a pixel level (Figure 3), vineyard suitability for the cultivation of Xinomavro grape variety based on the parameters in Table 3. Class 1, represented in dark green colour, indicates the optimal conditions for cultivating Xinomavro, ensuring high-quality grape production. Classes 2 and 3, represented in light green and orange, respectively, indicate very good and average suitability for the cultivation of Xinomavro, supporting the production of quality wines. Class 4, represented in red, signifies the least favourable areas but does not classify them as unsuitable for cultivation.
According to the pixel-based map for Amyndeon, the least suitable areas for the production of red wines from Xinomavro variety were all situated at the lowest parts around the two major lakes (Class 4-red colour), and this is likely associated with the lower temperatures occurring during the ripening period and may also reflect the slow warming of these soils throughout the season, which in turn delays the maturation process. The highest quality areas (Class 1-dark green colour) are situated at the foot slopes of the north part of the PDO area on gentle slopes exposed mostly to the east and to the south. Areas classified in the intermediated categories (Class 2 and 3 – light green and orange colour) covered the rest of the PDO area with Class 2 areas being closer to Class 1 and Class 3 neighbouring the low Class 4.
It is possible that within a wider area there might be parcels of all suitability classes, but this granularity is not practical for a regional-scale analysis and a general description of area suitability based on predominant suitability classes is required. Following the initial pixel-based classification, the application of the SAGA Majority/Minority filter (Figure 4) effectively enhanced the clarity of class separation and improved the visualization of spatial distribution across the study area. Figure 4 also shows the distribution of the four experimental plots. For each suitability class, a representative Xinomavro vineyard (plot) with similar planting and cultivation characteristics was selected. More specifically, for Class 1, a vineyard in Petres area was selected, for Class 2 a vineyard was selected in Lofos area, for Class 3 in Vegora area and finally for Class 4, a vineyard was selected in Limni area.
3.1.2. Maps of suitability classes for PGI Drama
Figure 5 presents the initial pixel-based suitability classification of the PGI Drama region for the cultivation of Cabernet Sauvignon. As in PDO Amyndeon, the classification was generated using key soil, climatic and topographical parameters. Class 1 areas (dark green) represent the most favourable conditions for the cultivation of Cabernet Sauvignon, while Classes 2 and 3 (light green and orange) indicate very good suitability, and Class 4 (red) represents the least favourable areas.
The spatial distribution of suitability classes shows that the semi-mountainous areas on the western and central parts of the region, where slopes increase and face predominantly towards north-east, are classified in the first class (Class 1-dark green colour), suggesting optimal conditions for producing high-quality red wines from Cabernet Sauvignon grape variety. In contrast, the lowland areas of the region are mostly classified as Class 3 (orange colour) and Class 4 (red colour), indicating that they are most probably unsuitable because of their higher soil fertility. Class 2 areas (light green colour) are found in low altitude areas mostly in the west part of the area.
Following the initial pixel-based classification, the SAGA Majority/Minority filter was applied to reduce spatial noise and enhance class harmony (Figure 6). This filtering step clarified the spatial structure of suitability zones and improved the regional interpretation of vineyard potential. Figure 6 also shows the location of the four representative plots selected for detailed field measurements. Specifically, one vineyard was selected within each suitability class: Agora for Class 1, Kali Vrysi for Class 2, Doxato for Class 3 and Mikrochori for Class 4.
3.2. Vineyard in-situ validation
3.2.1. Water conditions
To validate the subzones according to the classification methodology used in this study we performed midday measurements of stem water potential. Since all vineyards were not irrigated, the seasonal variation in water potential was mediated through soil and climate variables. Regarding Amyndeon, during the first year, the seasonal variation of stem water potential (Ψstem) showed little variability between samplings, with no clear differences among plots; however, in 2022 the vineyard at Petres (Class 1) showed the lowest Ψstem throughout the season together with the vineyard at Lofos (Class 2) (Figure 7). In Drama, Ψstem showed declining pattern in all plots during the season with consistently lower values in Agora (Class 1) and Kali Vrysi (Class 2).
3.2.2. Vine canopy and shoot growth
In Amyndeon, Lofos (Class 2) and Vegora (Class 3) consistently exhibited the highest total leaf area in both years (5.74–5.82 m2/vine in 2021 and 5.77–5.79 m2/vine in 2022), supported by similarly high main leaf area values (Table 5). Petres (Class 1) and Limni (Class 4) showed significantly lower leaf area in 2021 (3.52–3.96 m2/vine), although Limni presented a relatively high main leaf area that year (2.18 m2/vine). In 2022, leaf area decreased slightly in Petres (3.08 m2/vine) while remaining stable in the higher-vigour plots (Lofos and Vegora). Secondary leaf area followed a similar pattern, with Vegora (Class 3) showing the highest values across both years, whereas Lofos and Limni recorded reduced secondary leaf development in 2022.
In Drama, overall vegetative growth was lower than in Amyndeon but displayed distinct intraregional variation (Table 5). In 2021, Kali Vrysi (Class 2) presented the highest leaf area (2.93 m2/vine), followed by Mikrochori (Class 4) and Doxato (Class 3), while Agora (Class 1) showed the lowest value (2.15 m2/vine). In 2022, Doxato (Class 3) presenting the highest leaf area (2.94 m2/vine), while Kali Vrysi (Class 2) exhibited a notable decrease (2.25 m2/vine). Main leaf area was highest in Doxato (Class 3) and Mikrochori (Class 4) in 2022, whereas Mikrochori (Class 4) consistently recorded the lowest secondary leaf area across both vintages.
3.2.3. Yield components
In Amyndeon berry size followed a consistent pattern across vintages (Table 6). Significant variation was recorded among plots for berry weight (W50), skin weight, and bunch weight in both years. In 2021, Lofos (Class 2) and Vegora (Class 3) produced the largest berries (88.85 g and 85.32 g), whereas Petres (Class 1) showed the lowest berry weight (65 g). Limni (Class 4) exhibited intermediate berry weight but produced the heaviest bunches (192.6 g). Skin weight followed a different pattern: Petres showed the highest skin weight (9.23 g), while Vegora (Class 3) had lowest (7.48 g). In 2022, berry weight increased slightly across all plots. Lofos (Class 2) again produced the heaviest berries (91.24 g), followed by Limni (Class 4) (76.48 g). Petres and Vegora showed lower berry weights but remained statistically distinct. Bunch weight patterns remained consistent: Lofos (Class 2) and Limni (Class 4) produced the heaviest bunches (197.6 g and 190.2 g), while Petres (Class 1) again had the lowest bunch weight (147.6 g).
In Drama, berry and bunch weights also varied significantly between subzones (Table 6). In 2021, Mikrochori (Class 4) produced the largest berries (85.47 g), closely followed by Agora (Class 1) (84.38 g) and Kali Vrysi (Class 2) (82 g). Doxato (Class 3) recorded the lowest berry weight (80.12 g), though differences were small. Skin weight was highest in Agora (Class 1) (11.32 g) and lowest in Kali Vrysi (Class 2) and Doxato (Class 3) (9.45–9.88 g). Bunch weights showed a clearer separation: Agora (Class 1) consistently produced the heaviest bunches (281.1 g), while Kali Vrysi (Class 2) and Doxato (Class 3) recorded lower values (220–246 g). In 2022, the ranking among plots remained largely similar. Mikrochori (Class 4) again produced the largest berries (84.94 g), with Agora and Doxato following closely. Skin weight was highest in Doxato (Class 3) (11.91 g) and Mikrochori (Class 4) (11.65 g), while Kali Vrysi (Class 2) recorded lower values. Bunch weight patterns persisted, with Agora (Class 1) showing the highest values (278.7 g), and Kali Vrysi (Class 2) the lowest (211.8 g).
3.2.4. Vine balance
Yield and pruning weight varied significantly across the four suitability classes in both years, resulting in clear differences in vine balance (Table 7). In 2021, Vegora (Class 3) and Lofos (Class 2) produced the highest yields (5.64 and 5.51 kg/vine) and also showed the highest Ravaz indices (4.49 and 4.22), reflecting a more productive vine balance. Petres (Class 1) had the lowest yield (3.89 kg/vine) and one of the lowest Ravaz index values (3.71), indicating a more restrictive vine growth pattern. Limni (Class 4) exhibited comparable yield to the more productive plots but had a relatively low Ravaz index (3.75), suggesting higher vegetative allocation relative to fruit production. In 2022, the same general pattern persisted. Lofos (Class 2) and Vegora (Class 3) maintained the highest Ravaz indices (4.72 and 4.65), driven by relatively high yields and moderate pruning weights. Petres (Class 1) and Limni (Class 4) showed lower Ravaz index values (3.78 and 3.60), consistent with a less favourable reproductive-to-vegetative balance. Pruning weight was highest in Limni (Class 4) (1.42 kg/vine), supporting the lower Ravaz ratio observed in this plot.
In Drama, yield per vine showed limited variation between plots, but pruning weight and Ravaz index displayed clearer differentiation of vine balance (Table 7). In 2021, Doxato (Class 3) recorded the highest Ravaz index (3.27), reflecting slightly higher yield relative to vegetative growth. Kali Vrysi (Class 2), Mikrochori (Class 4), and Agora (Class 1) all showed lower Ravaz values (2.69–2.98), indicating a more vigorous vegetative profile relative to yield. Agora, despite a high pruning weight (1.36 kg/vine), exhibited one of the lowest Ravaz indices. In 2022, Kali Vrysi (Class 2) again presented one of the highest Ravaz values (3.24), closely followed by Doxato (Class 3) (2.86). Mikrochori (Class 4), however, exhibited the lowest Ravaz index (2.51), driven by its relatively high pruning weight (1.40 kg/vine). Yield remained similar across subzones, reinforcing that variation in vine balance was primarily the result of differences in vegetative growth rather than changes in productivity.
3.3. Wine evaluation
3.3.1. Berry composition
Significant differences were also observed on different berry composition variables in both years and in both wine growing regions (Table 8).
In all plots of Amyndeon, TSS (Total Soluble Solids) values showed moderate variation among plots, with a slight decrease in 2022 compared to 2021. In both years, The Limni (Class 4) recorded the highest values (23.3o Brix and 22.4 o Brix respectively). In contrast, the lowest values were found in the vineyard of Vegora (Class 3) with the values being statistically significantly lower compared to the other plots. The Petres (Class 1) vineyard, although it had no statistical differences in terms of TSS with the highest values, recorded the highest values of TA in both years, with a statistically significant difference compared to the rest of the plots as seen in Table 8. Lastly, minor differences were observed between the vineyards in terms of pH values, with Vegora (Class 3) recording the lowest values in both years.
In Drama, Kali Vrysi (Class 2) and Doxato (Class 3) exhibited the highest TSS values (22.43 and 22.1 o Brix), while Mikrochori (Class 4) recorded the lowest (21.0 o Brix). A similar trend was observed in 2022, with Kali Vrysi (Class 2) maintaining the highest TSS (22.9 o Brix) and Mikrochori (Class 4) again presenting the lowest value (21.4 o Brix). For titratable acidity (TA), the highest acidity value in both years was observed in Kali Vrysi (Class 2) (7.6 g/L in 2021 and 7.3 g/L in 2022), while the lowest values were recorded in Mikrochori (Class 4). Agora (Class 1) consistently exhibited the lowest pH among Drama plots in both years.
The total anthocyanins and total phenolics content showed statistically significant differences among the sub-zones in both viticultural regions (Table 9). Anthocyanin content, expressed as mg/berry, exhibited a remarkably consistent pattern across both years of observation. Among the four different plots, Vegora (Class 3) consistently showed the lowest total anthocyanin levels, while Petres (Class 1) and Limni (Class 4) presented the highest values. This trend was maintained in 2022: Petres (Class 1) and Limni (Class 4) again displayed the highest anthocyanin content, while Vegora (Class 3) remained the lowest (0.655 mg underscores the strong impact of geographic origin on anthocyanin biosynthesis and accumulation, potentially driven by site-specific environmental factors such as altitude, sunlight exposure, or soil composition that may promote pigment production in certain locations.
The evaluation of phenolic compound content over the two study years revealed no substantial differences, indicating a relative stability in phenolic concentration across seasons. Notably, Vegora (Class 3) consistently exhibited the lowest levels of phenolics in both years. In contrast, the highest concentrations were observed in Limni (Class 4) for one year and in Petres (Class 1) the following year. These variations suggest that while overall phenolic levels remained stable, specific environmental or microclimatic conditions at each location may have influenced local phenolic accumulation patterns.
In the region of Drama, anthocyanin concentrations were at their highest in 2021, where found in Agora (Class 1) (1.354 mg/berry) and Doxato (Class 3) (1.333 mg/berry) (Table 9). Phenolic content in Drama exhibited notable variable. In 2021, Agora (Class 1) had the highest phenolic content (2.227 mg/berry), followed by Doxato (Class 3) (2.153 mg/berry). In 2022, phenolics were generally higher in Kali Vrysi (Class 2) (2.151 mg/berry).
3.3.2. Wine Physicochemical Parameters
The oenological profiles of wines derived from the four subzones of the Amyndeon region, exhibited notable differences across both vintages (2021 and 2022), with more pronounced variation observed between plots rather than between years (Table 10). In terms of alcohol content (Vol%), Petres (Class 1) consistently recorded the highest values (13.8% in 2021 and 13.9% in 2022), suggesting more advanced grape maturity at harvest, while Limni (Class 4) showed relatively lower alcohol levels, particularly in 2021 (12.8%). Total acidity also varied notably among plots. Limni (Class 4) exhibited the highest acidity in 2021 (7.87 g/L tartaric acid) but showed a marked decline in 2022 (6.4 g/L), whereas Vegora (Class 3) maintained consistently high acidity across both years. The pH values generally remained within a narrow range (3.1–3.6), though Lofos (Class 2) displayed a significant pH increase in 2022 (from 3.3 to 3.6), possibly reflecting a decrease in acidity.
Within the Drama region, sub-zone differences also influence wine composition (Table 10). Alcohol content in 2021 ranged from 11.5% in Mikrochori (Class 4) to 12.9% in Agora (Class 1). In 2022, alcohol levels increased slightly in most plots, with Agora (Class 1) again showing the highest value (13.1%). Acidity patterns within the region showed clear differentiation. In 2021 Kali Vrysi (Class 2) produced wines with the highest TA (6.28 g/L), while in Mikrochori (Class 4) and Doxato (Class 3) presented lower acidity.
In terms of total phenolics (TP), Petres (Class 1) exhibited the highest values in both years (49.5 and 52 mg/L), indicating a richer phenolic composition likely influenced by grape variety expression and terroir (Table 11). Conversely, Limni (Class 4) showed a significant drop in TP from 42.4 mg/L in 2021 to 33.7 mg/L in 2022, highlighting year-to-year environmental variability. Colour parameters of the wines, specifically intensity and hue, varied considerably between the different vineyard plots and between the two vintages (Table 11). In 2021, Limni (Class 4) displayed the highest colour intensity (7.05 AU), followed by Lofos (Class 2) (6.69 AU), indicating wines with deep colour concentration. Petres (Class 1) (54.84) and Vegora (Class 3) (4.80 AU) exhibited lower intensity, with Vegora (Class 3) producing the lowest colour intensity values. However, a substantially lower values in colour intensity were observed in 2022 across all plots, particularly in Lofos (Class 2) (from 6.69 to 6.38 AU) and Vegora (Class 3) (from 4.80 to 4.37 AU). Hue values also varied. In 2021, hue ranged from 0.78 (Vegora-Class 3) to 0.99 (Petres - Class 1). In 2022, there was a notable increase in hue for Limni (Class 4) (1.48) and Vegora (Class 3) (1.02). Interestingly, Petres (Class 1) maintained a relatively stable hue (0.99 in 2021 vs. 0.79 in 2022), suggesting greater colour stability of the wines of this plot.
Total phenolics (TP) in Drama, varied moderately among the sub-zones (Table 11). In 2021, the highest phenolic concentration was found in Kali Vrysi (Class 2). A similar pattern was observed, with Kali Vrysi (Class 2) again presenting the highest TP (44.2 mg/L). Concerning wine colour parameters, in 2021, Kali Vrysi (Class 2) and Agora (Class 1) produced wines with the highest colour intensity (8.05 and 7.88 AU), indicating strong pigment extraction and deeper colour concentration. Doxato (Class 3) and Mikrochori (Class 4) showed lower intensities (6.13–6.47 AU), suggesting slightly reduced phenolic maturity. This pattern remained consistent in 2022, where Kali Vrysi (Class 2) (8.46 AU) and Agora (Class 1) (8.13 AU) again displayed the most intense wines, confirming the suitability of these sub-zones for producing deeply coloured Cabernet Sauvignon. Hue values remained low overall, reflecting the variety’s naturally stable anthocyanin profile. Nevertheless, differences among sub-zones were evident: Agora (Class 1) consistently showed the highest hue values (0.72 in 2021; 0.77 in 2022) while Mikrochori (Class 4) recorded the lowest hue values (0.59 and 0.61). Kali Vrysi (Class 2) and Doxato (Class 3) maintained intermediate hue values.
4. Discussion
The present study demonstrates that a zoning methodology based on freely available geospatial datasets, can effectively identify viticultural subzones within two Greek wine growing regions. The resulting classifications for both areas corresponded well with several in situ measurements and indicators, across two growing seasons (2021–2022), confirming the suitability of the approach.
The results in Amyndeon wine growing area indicated that foot slope areas such as Petres (Class 1) exhibit the most suitable conditions for Xinomavro cultivation, characterized by moderate slopes, balanced water stress, and favourable temperature conditions. This plot also exhibited strong vegetative growth, balanced canopy structure and moderate water stress, all of which, according to previous studies, are typical characteristics of areas for optimal cultivation of red grape varieties [63,64,65]. The wines produced from this class presented both years elevated colour and phenolic content and balanced acidity, factors that directly affect both the organoleptic experience and the longevity of the wine [66,67].
Lofos (Class 2) and Vegora (Class 3) presented the expected results both in terms of cultivation and winemaking. While both areas were very productive, they revealed less favourable growing conditions and oenological outcomes compared to other suitability classes. These zones supported high yields mainly due to high soil fertility and high nutrient supply, which according to previous research [68,69,70] leads to improved plant growth and consequently higher yields, however, in terms of oenological results and according to Prado et al. (2007) [71] wines from fertile soils can lead to lower total phenolic content and colour intensity in red wines. These results were confirmed in those two regions where wines presented greater variability between the two vintages and the low values in terms of total phenolics, colour intensity and in total acidity. In contrast, Limni (Class 4) evaluated as the least suitable area for the cultivation of Xinomavro, mainly due to its location in a flat area with very low temperatures and a favourable water status, possibly making this plot marginal for the full ripening of Xinomavro grapes [30,32]. This plot consistently produced wines with elevated acidity.
Within the Drama region, the identification and classification also successfully differentiated sub-zones with varying suitability for Cabernet Sauvignon cultivation. Agora (Class 1) consistently produced wines with the highest alcohol content and total phenolics, indicating favourable ripening conditions and strong extraction potential in the wines. This sub-zone also exhibited more balanced vegetative growth leading to a better must and skin chemical composition of the berries across the two growing years of study. Kali Vrysi (Class 2) and Doxato (Class 3) showed intermediate suitability. Kali Vrysi (Class 2) tended to produce wines with higher total acidity and lower pH, while Doxato (Class 3) wines showed moderate acidity and alcohol levels, reflecting a balanced but less intense ripening profile. These results indicate that both zones have favourable conditions for Cabernet Sauvignon but exhibit distinct ripening dynamics influenced by their topography and microclimate. Mikrochori (Class 4) consistently showed lower alcohol levels, lower anthocyanins, and reduced maturity indices, suggesting less favourable ripening conditions compared to the other sub-zones. However, phenolic values remained generally stable across vintages.
Delineating subzones in red wine producing areas depends mainly on environmental factors controlling vigour and yield. According to van Leeuwen and Seguin [72] the most important criteria for a successful choice of a suitable location for the production of premium red wines, are the matching of the region’s climatic characteristics with the given variety’s thermal requirements, and the presence of a limiting soil factor restricting vegetative and reproductive growth. The first criterion basically aims at selecting varieties which ripen towards the end of September to mid-October, thereby avoiding daytime temperature extremes and also taking advantage of the cooler nighttime conditions [73]. The second criterion ensures an early arrest of shoot growth allowing a higher translocation of assimilates to the ripening berries; this factor is most commonly the limited availability of water or nitrogen without however exceeding the thresholds of a severe deficit [44]. Selecting classification parameters for the delineation of subzones within PDO/PGI areas, should therefore meet this dual objective.
In the conditions of this study, we included simple and openly accessible dataset of soil, climate, and topography parameters of the two areas able to cover the aforementioned requirements. The methodology demonstrated is scalable, cost-effective, and transferable to other regions, especially to those where conventional viticultural datasets are limited. Its application, however, requires hand-tuning of parameters weight, informed by experts. In order to validate our approach, this new methodology was applied in two areas producing red wines from late ripening varieties and adjusted each parameter’s range according to the specific area characteristics and wine styles. It is obvious that to establish the correct limits of the suitability classes and to delineate subzones of a meaningful oenological quality, expert knowledge is a key factor.
In the future this new approach will be substantially improved by the advances in machine learning technologies and artificial intelligence, both of which are particularly adapted to the multi-disciplinary nature of terroir. Further research incorporating multi-year datasets, meteorological monitoring, and sensory evaluation of wines will be essential to strengthen the link between subzone classification and the typicity of wines. Nevertheless, this study provides a solid foundation for future terroir-based research in Greek viticulture.
5. Conclusions
This study presents a practical, reproducible methodology for delineating viticultural subzones based entirely on publicly accessible geospatial datasets. By incorporating both remote sensing datasets and local grower knowledge, the geospatial model was able to identify meaningful variability within two major wine regions of Northen Greece, PDO Amyndeon and PGI Drama, and its predictions were validated through two years of in situ vine performance indicators, confirming that soil texture, C/N ratio, climatic conditions during the growing and ripening period, and topographical characteristics constitute a robust set of characteristics for preliminary subzone discrimination.
Although the resulting wines did not always fully reflect the differences predicted by the suitability classes, the overall coherence between geospatial classification and vineyard behaviour supports the reliability of the approach, particularly in data-limited contexts where long-term wine datasets or detailed soil surveys are unavailable. Importantly, the method proved highly effective in capturing the natural variability of each region and revealed patterns consistent across two vintages, highlighting its potential for broader application. As Greek wine appellations and other emerging viticultural regions face increasing pressure from climate variability, such accessible and scalable tools provide a valuable foundation for improving terroir characterization, guiding vineyard establishment, and ultimately helping preserve or redefine regional wine typicity.
Author Contributions
Conceptualization, Stefanos Koundouras and T.G., methodology, T.G., Stefanos Koundouras, S.T., S.K.; software, S.K., N.L.T.; validation, T.G., S.T. and Stefanos Koundouras; formal analysis, T.G., C.K., S.T., G.K.; investigation, T.G., C.K., S.K., N.L.T.; resources, Stefanos Koundouras; data curation, S.K., N.L.T.; writing—original draft preparation, T.G., C.K., S.K., N.L.T.; writing—review and editing, T.G., S.T., N.L.T.,C.K. and Stefanos Koundouras; visualization, T.G., S.K.; supervision, Stefanos Koundouras; project administration, Stefanos Koundouras, G.C.Z. All authors have read and agreed to the published version of the manuscript.
Funding
This research received no external funding.
Data Availability Statement
The raw data supporting the conclusions of this article will be made available by the authors on request.
Acknowledgments
The authors would like to thank all the wineries that provided their vineyards for the purposes of the experiments. Specifically, we would like to thank Alpha Estate in PDO Amyntaio, and in PGI Drama Wine Art Estate in Mikrochori, Nico Lazaridi in Agora, and Ktima Michailidis in Agios Athanasios, Greece.
Conflicts of Interest
The authors declare no conflicts of interest. The funders had no role in the design of the study; in the collection, analyses, or interpretation of data; in the writing of the manuscript; or in the decision to publish the results.
References
- Van Leeuwen, C.; Friant, P.; Choné, X.; Tregoat, O.; Koundouras, S.; Dubourdieu, D. Influence of Climate, Soil, and Cultivar on Terroir. Am J Enol Vitic. 2004, 55, 207–217. [Google Scholar] [CrossRef]
- Argentero, A.; Caillé, S.; Nolleau, V.; Godet, T.; Mouls, L.; Rigou, P. Exploring the Aromatic Typicity of Blended Red Wines from Geographically Close Sub-Regions in AOC Corbières: A Sensory and Chemical Approach. OENO One 2024, 58. [Google Scholar] [CrossRef]
- Del Río, S.; Álvarez-Esteban, R.; Alonso-Redondo, R.; Hidalgo, C.; Penas, Á. A New Integrated Methodology for Characterizing and Assessing Suitable Areas for Viticulture: A Case Study in Northwest Spain. European Journal of Agronomy 2021, 131, 126391. [Google Scholar] [CrossRef]
- MORLAT, R. Le Terroir Viticole: Contribution A` l’e´tude de Sa Caracte´risation et de Son Influence Sur Les Vins; Application Aux Vignobles Rouges de La Moyenne Valle´e de La Loire; University of Bordeaux II: Bordeaux, 1989. [Google Scholar]
- Bekris, F.; Papadopoulou, E.; Vasileiadis, S.; Karapetsas, N.; Theocharis, S.; Alexandridis, T.K.; Koundouras, S.; Karpouzas, D.G. Vintage and Terroir Are the Strongest Determinants of Grapevine Carposphere Microbiome in the Viticultural Zone of Drama, Greece. FEMS Microbiology Ecology 2025, 101, fiaf008. [Google Scholar] [CrossRef] [PubMed]
- Seguin, G. ‘Terroirs’ and Pedology of Wine Growing. Experientia 1986, 42, 861–873. [Google Scholar] [CrossRef]
- Costantini, E.A.C.; Bucelli, P.; Priori, S. Quaternary Landscape History Determines the Soil Functional Characters of Terroir. Quaternary International 2012, 265, 63–73. [Google Scholar] [CrossRef]
- Lavaud, M.; Schmutz, M.; Cavailhes, J.; Falco, N. Exploring Soil–Plant Interactions in Vineyards Using Geophysics and Hyperspectral Imaging. OENO One 2025, 59. [Google Scholar] [CrossRef]
- Bell, S.-J.; Henschke, P.A. Implications of Nitrogen Nutrition for Grapes, Fermentation and Wine. Aust J Grape Wine Res 2005, 11, 242–295. [Google Scholar] [CrossRef]
- Koufos, G.C.; Mavromatis, T.; Koundouras, S.; Jones, G.V. Response of Viticulture-related Climatic Indices and Zoning to Historical and Future Climate Conditions in Greece. Intl Journal of Climatology 2018, 38, 2097–2111. [Google Scholar] [CrossRef]
- Jones, G.V.; Davis, R.E. Using a Synoptic Climatological Approach to Understand Climate-Viticulture Relationships. Int. J. Climatol. 2000, 20, 813–837. [Google Scholar] [CrossRef]
- Ollat, N.; Van Leeuwen, C.; Garcia De Cortazar-Atauri, I.; Touzard, J.-M. The Challenging Issue of Climate Change for Sustainable Grape and Wine Production. OENO One 2017, 51, 59. [Google Scholar] [CrossRef]
- Van Leeuwen, C.; Destrac-Irvine, A. Modified Grape Composition under Climate Change Conditions Requires Adaptations in the Vineyard. OENO One 2017, 51, 147. [Google Scholar] [CrossRef]
- Mavromatis, T.; Koufos, G.C.; Koundouras, S.; Jones, G.V. Adaptive Capacity of Winegrape Varieties Cultivated in Greece to Climate Change: Current Trends and Future Projections. OENO One 2020, 54, 1201–1219. [Google Scholar] [CrossRef]
- Santos, J.A.; Fraga, H.; Malheiro, A.C.; Moutinho-Pereira, J.; Dinis, L.-T.; Correia, C.; Moriondo, M.; Leolini, L.; Dibari, C.; Costafreda-Aumedes, S.; et al. A Review of the Potential Climate Change Impacts and Adaptation Options for European Viticulture. Applied Sciences 2020, 10, 3092. [Google Scholar] [CrossRef]
- Poni, S.; Gatti, M.; Palliotti, A.; Dai, Z.; Duchêne, E.; Truong, T.-T.; Ferrara, G.; Matarrese, A.M.S.; Gallotta, A.; Bellincontro, A.; et al. Grapevine Quality: A Multiple Choice Issue. Scientia Horticulturae 2018, 234, 445–462. [Google Scholar] [CrossRef]
- Tesic, D.; Barbeau, G. Evaluation of the Site Index Model for Viticultural Zoning. 2004. [Google Scholar]
- Gavrilović, M.; Jovanović, D.; Božović, P.; Benka, P.; Govedarica, M. Vineyard Zoning and Vine Detection Using Machine Learning in Unmanned Aerial Vehicle Imagery. Remote Sensing 2024, 16, 584. [Google Scholar] [CrossRef]
- Ghilardi, F.; Virano, A.; Prandi, M.; Borgogno-Mondino, E. Zonation of a Viticultural Territorial Context in Piemonte (NW Italy) to Support Terroir Identification: The Role of Pedological, Topographical and Climatic Factors. Land 2023, 12, 647. [Google Scholar] [CrossRef]
- Karlik, L.; Marián, G.; Falťan, V.; Havlíček, M. Vineyard Zonation Based on Natural Terroir Factors Using Multivariate Statistics – Case Study Burgenland (Austria). OENO One 2018, 52, 105–117. [Google Scholar] [CrossRef]
- Martínez, A.; Gomez-Miguel, V.D. Vegetation Index Cartography as a Methodology Complement to the Terroir Zoning for Its Use in Precision Viticulture. OENO One 2017, 51, 289. [Google Scholar] [CrossRef]
- Vaudour, E. The Quality of Grapes and Wine in Relation to Geography: Notions of Terroir at Various Scales. Journal of Wine Research 2002, 13, 117–141. [Google Scholar] [CrossRef]
- Mathews, A.J. Applying Geospatial Tools and Techniques to Viticulture. Geography Compass 2013, 7, 22–34. [Google Scholar] [CrossRef]
- Deidda, A.; Sassu, A.; Mercenaro, L.; Nieddu, G.; Fadda, C.; Deiana, P.F.; Gambella, F. A Decision-Supporting System for Vineyard Management: A Multi-Temporal Approach with Remote and Proximal Sensing. Precision Agric 2024, 25, 3001–3032. [Google Scholar] [CrossRef]
- Delval, L.; Bates, J.; Jonard, F.; Javaux, M. Field Heterogeneity of Soil Texture Controls Leaf Water Potential Spatial Distribution in Non-Irrigated Vineyards. 2024. [Google Scholar] [CrossRef]
- Lu, B.; Tian, F.; Chen, C.; Wu, W.; Tian, X.; Chen, C.; Lv, X. Identification of Chinese Red Wine Origins Based on Raman Spectroscopy and Deep Learning. Spectrochimica Acta Part A: Molecular and Biomolecular Spectroscopy 2023, 291, 122355. [Google Scholar] [CrossRef] [PubMed]
- Atencia Payares, L.K.; Tarquis, A.M.; Hermoso Peralo, R.; Cano, J.; Cámara, J.; Nowack, J.; Gómez Del Campo, M. Multispectral and Thermal Sensors Onboard UAVs for Heterogeneity in Merlot Vineyard Detection: Contribution to Zoning Maps. Remote Sensing 2023, 15, 4024. [Google Scholar] [CrossRef]
- Karapetsas, N.; Alexandridis, T.K.; Bilas, G.; Theocharis, S.; Koundouras, S. Delineating Natural Terroir Units in Wine Regions Using Geoinformatics. Agriculture 2023, 13, 629. [Google Scholar] [CrossRef]
- Del Río, M.S.; Raventós, L.; Garza, V. Zoning of the Querétaro Wine Region. BIO Web Conf. 2023, 68, 01029. [Google Scholar] [CrossRef]
- Rebrov, A.; Lopatkina, E. Influence of Variety of Soil-Ground Conditions of Sandy Soils (by the Example of the Ust-Donetsk Sandy Massif) on the Quality of the Grape Vine. BIO Web Conf. 2022, 53, 01002. [Google Scholar] [CrossRef]
- Choné, X.; van Leeuwen, C.; Chéry, P.; Ribéreau-Gayon, P. Terroir Influence on Water Status and Nitrogen Status of Non Irrigated Cabernet Sauvignon (Vitis Vinifera): Vegetative Development, Must and Wine Composition. S. Afr. J. Enol. Vitic 2001, 22, 8–15. [Google Scholar]
- Van Leeuwen, C.; Roby, J.-P.; De Rességuier, L. Soil-Related Terroir Factors: A Review. OENO One 2018, 52, 173–188. [Google Scholar] [CrossRef]
- Šimanský, V.; Horváthová, J.; Jonczak, J.; Polláková, N. Suitability of Carbon and Nitrogen Management Indices for the Evaluation of Soil Organic Matter Under Different Soil Management Practices in a Productive Vineyard. J. Ecol. Eng. 2021, 22, 150–162. [Google Scholar] [CrossRef]
- Grechi, I.; Vivin, Ph.; Hilbert, G.; Milin, S.; Robert, T.; Gaudillère, J.-P. Effect of Light and Nitrogen Supply on Internal C:N Balance and Control of Root-to-Shoot Biomass Allocation in Grapevine. Environmental and Experimental Botany 2007, 59, 139–149. [Google Scholar] [CrossRef]
- Van Leeuwen, C.; Destrac-Irvine, A. Modified Grape Composition under Climate Change Conditions Requires Adaptations in the Vineyard. OENO One 2017, 51, 147–154. [Google Scholar] [CrossRef]
- Koundouras, S. Environmental and Viticultural Effects on Grape Composition and Wine Sensory Properties. Elements 2018, 14, 173–178. [Google Scholar] [CrossRef]
- Jeong, S.T.; Goto-Yamamoto, N.; Kobayashi, S.; Esaka, M. Effects of Plant Hormones and Shading on the Accumulation of Anthocyanins and the Expression of Anthocyanin Biosynthetic Genes in Grape Berry Skins. Plant Science 2004, 167, 247–252. [Google Scholar] [CrossRef]
- Downey, M.O.; Dokoozlian, N.K.; Krstic, M.P. Cultural Practice and Environmental Impacts on the Flavonoid Composition of Grapes and Wine: A Review of Recent Research. Am J Enol Vitic. 2006, 57, 257–268. [Google Scholar] [CrossRef]
- Mori, K.; Goto-Yamamoto, N.; Kitayama, M.; Hashizume, K. Loss of Anthocyanins in Red-Wine Grape under High Temperature. Journal of Experimental Botany 2007, 58, 1935–1945. [Google Scholar] [CrossRef]
- Spayd, S.E.; Tarara, J.M.; Mee, D.L.; Ferguson, J.C. Separation of Sunlight and Temperature Effects on the Composition of Vitis Vinifera Cv. Merlot Berries. Am J Enol Vitic. 2002, 53, 171–182. [Google Scholar] [CrossRef]
- Wine, Terroir and Climate Change; Gladstones, J.S., Ed.; Wakefield Press: Adelaide, 2007; ISBN 978-1-86254-924-1. [Google Scholar]
- Benettin, P.; Manca Di Villahermosa, F.; Dani, A.; Verdone, M.; Andreotti, C.; Tagliavini, M.; Penna, D. Ecohydrological Dynamics and Temporal Water Origin in European Mediterranean Vineyards: A Case Study in Tuscany, Central Italy 2023.
- Jones, G.V.; White, M.A.; Cooper, O.R.; Storchmann, K. Climate Change and Global Wine Quality. Climatic Change 2005, 73, 319–343. [Google Scholar] [CrossRef]
- Keller, M. The Science of Grapevines: Anatomy and Physiology, 2nd edition.; Elsevier/AP, Academic Press is an imprint of Elsevier: Amsterdam Boston, 2015; ISBN 978-0-12-419987-3. [Google Scholar]
- Bramley, R.G.V.; Ouzman, J.; Boss, P.K. Variation in Vine Vigour, Grape Yield and Vineyard Soils and Topography as Indicators of Variation in the Chemical Composition of Grapes, Wine and Wine Sensory Attributes: Vineyard Variation in Wines, Grapes and Soils. Australian Journal of Grape and Wine Research 2011, 17, 217–229. [Google Scholar] [CrossRef]
- Poggio, L.; De Sousa, L.M.; Batjes, N.H.; Heuvelink, G.B.M.; Kempen, B.; Ribeiro, E.; Rossiter, D. SoilGrids 2.0: Producing Soil Information for the Globe with Quantified Spatial Uncertainty. SOIL 2021, 7, 217–240. [Google Scholar] [CrossRef]
- Copernicus Climate Change Service ERA5-Land Hourly Data from 1950 to Present 2019.
- Airbus Copernicus DEM 2022. European Space Agency.
- Conrad, O.; Bechtel, B.; Bock, M.; Dietrich, H.; Fischer, E.; Gerlitz, L.; Wehberg, J.; Wichmann, V.; Böhner, J. System for Automated Geoscientific Analyses (SAGA) v. 2.1.4. Geosci. Model Dev. 2015, 8, 1991–2007. [Google Scholar] [CrossRef]
- Zanaga, D.; Van De Kerchove, R.; De Keersmaecker, W.; Souverijns, N.; Brockmann, C.; Quast, R.; Wevers, J.; Grosu, A.; Paccini, A.; Vergnaud, S.; et al. ESA WorldCover 10 m 2020 V100 2021.
- Quezada, C.; Soriano, M.A.; Díaz, J.; Merino, R.; Chandía, A.; Campos, J.; Sandoval, M. Influence of Soil Physical Properties on Grapevine Yield and Maturity Components in an Ultic Palexeralf Soils, Central-Southern, Chile. OJSS 2014, 04, 127–135. [Google Scholar] [CrossRef]
- Verdenal, T.; Dienes-Nagy, Á.; Spangenberg, J.E.; Zufferey, V.; Spring, J.-L.; Viret, O.; Marin-Carbonne, J.; Van Leeuwen, C. Understanding and Managing Nitrogen Nutrition in Grapevine: A Review. OENO One 2021, 55, 1–43. [Google Scholar] [CrossRef]
- Deis, L.; Martínez, L.; Da Costa, B.S.; Vilanova, M. The Influence of Climatic Conditions Associated with Altitude on the Volatile Composition of Cabernet Sauvignon Wines from Argentina, Spain and Portugal. Horticulturae 2024, 10, 870. [Google Scholar] [CrossRef]
- White, R.E. Understanding Vineyard Soils, 2nd ed.; Oxford university press: Oxford, 2015; ISBN 978-0-19-934206-8. [Google Scholar]
- Scholander, P.F.; Bradstreet, E.D.; Hemmingsen, E.A.; Hammel, H.T. Sap Pressure in Vascular Plants: Negative Hydrostatic Pressure Can Be Measured in Plants. Science 1965, 148, 339–346. [Google Scholar] [CrossRef] [PubMed]
- Lovisolo, C.; Perrone, I.; Carra, A.; Ferrandino, A.; Flexas, J.; Medrano, H.; Schubert, A. Drought-Induced Changes in Development and Function of Grapevine (Vitis Spp.) Organs and in Their Hydraulic and Non-Hydraulic Interactions at the Whole-Plant Level: A Physiological and Molecular Update. Functional Plant Biol. 2010, 37, 98. [Google Scholar] [CrossRef]
- Rienth, M.; Laurent, C.; Scholasch, T. Review of Plant-Based Methods for Assessing Vine Water Status: Sourced from the Research Article: “State-of-the-Art of Tools and Methods to Assess Vine Water Status” (OENO One, 2019). In Original Language of the Article: English; Technical Reviews; 2023. [Google Scholar] [CrossRef]
- Van Leeuwen, C.; Trégoat, O.; Choné, X.; Bois, B.; Pernet, D.; Gaudillère, J.-P. Vine Water Status Is a Key Factor in Grape Ripening and Vintage Quality for Red Bordeaux Wine. How Can It Be Assessed for Vineyard Management Purposes? OENO One 2009, 43, 121. [Google Scholar] [CrossRef]
- Lopes, C.; Pinto, P.A. Easy and Accurate Estimation of Grapevine Leaf Area with Simple Mathematical Models. VITIS - Journal of Grapevine Research 2015, 55 Pages. [Google Scholar] [CrossRef]
- Iland, P. Techniques for Chemical Analysis and Quality Monitoring during Winemaking; Patrick Iland Wine Promotions: Campbelltown, S. Aust., 2000; ISBN 978-0-646-38435-1. [Google Scholar]
- Waterman, P.G.; Mole, S. Analysis of Phenolic Plant Metabolites; Blackwell Scientific Publications: Oxford, 1994. [Google Scholar]
- Glories, Y. La Couleur Des Vins Rouges. Lre Partie : Les Équilibres Des Anthocyanes et Des Tanins. OENO One 1984, 18, 195. [Google Scholar] [CrossRef]
- Vitale, A.; Janni, M.; Buonanno, M.; Erbaggio, A.; Albrizio, R.; Giorio, P.; De Micco, V.; Cirillo, C.; Petracca, F.; Giaccone, M.; et al. How Can We Support Irrigation Management in Viticulture to Preserve Grape Quality in Southern Italy?: The Case Study of Aglianico Grapevine. 2025. [Google Scholar] [CrossRef]
- Pellegrino, A.; Lebon, E.; Simonneau, T.; Wery, J. Towards a Simple Indicator of Water Stress in Grapevine (Vitis Vinifera L.) Based on the Differential Sensitivities of Vegetative Growth Components. Aust J Grape Wine Res 2005, 11, 306–315. [Google Scholar] [CrossRef]
- Koundouras, S.; Van Leeuwen, C.; Seguin, G.; Glories, Y. Influence of Water Status on Vine Vegetative Growth, Berry Ripening and Wine Characteristics in Mediterranean Zone (Example of Nemea, Greece, Variety Saint-George, 1997). OENO One 1999, 33, 149. [Google Scholar] [CrossRef]
- Waterhouse, A.L. Wine Phenolics. Annals of the New York Academy of Sciences 2002, 957, 21–36. [Google Scholar] [CrossRef]
- Tarola, A.M.; Milano, F.; Giannetti, V. Simultaneous Determination of Phenolic Compounds in Red Wines by HPLC-UV. Analytical Letters 2007, 40, 2433–2445. [Google Scholar] [CrossRef]
- Li, Q.; Andom, O.; Li, Y.; Cheng, C.; Deng, H.; Sun, L.; Li, Z. Responses of Grape Yield and Quality, Soil Physicochemical and Microbial Properties to Different Planting Years. European Journal of Soil Biology 2024, 120, 103587. [Google Scholar] [CrossRef]
- Arnó, J.; Rosell, J.R.; Blanco, R.; Ramos, M.C.; Martínez-Casasnovas, J.A. Spatial Variability in Grape Yield and Quality Influenced by Soil and Crop Nutrition Characteristics. Precision Agric 2012, 13, 393–410. [Google Scholar] [CrossRef]
- Giffard, B.; Winter, S.; Guidoni, S.; Nicolai, A.; Castaldini, M.; Cluzeau, D.; Coll, P.; Cortet, J.; Le Cadre, E.; d’Errico, G.; et al. Vineyard Management and Its Impacts on Soil Biodiversity, Functions, and Ecosystem Services. Front. Ecol. Evol. 2022, 10, 850272. [Google Scholar] [CrossRef]
- De Andrés-de Prado, R.; Yuste-Rojas, M.; Sort, X.; Andrés-Lacueva, C.; Torres, M.; Lamuela-Raventós, R.M. Effect of Soil Type on Wines Produced from Vitis Vinifera L. Cv. Grenache in Commercial Vineyards. J. Agric. Food Chem. 2007, 55, 779–786. [Google Scholar] [CrossRef] [PubMed]
- Van Leeuwen, C.; Seguin, G. The Concept of Terroir in Viticulture. Journal of Wine Research 2006, 17, 1–10. [Google Scholar] [CrossRef]
- Wine, Terroir and Climate Change; Gladstones, J.S., Ed.; Wakefield Press: Adelaide, 2007; ISBN 978-1-86254-924-1. [Google Scholar]
Figure 1.
Geographical location of the Protected Designation of Origin (PDO) area of Amyndeon in Greece, with indication of the study area boundaries and nearby landscape features. In the top left corner, the mini map shows the position of the study region within Greece. The yellowish outline in the main map marks the boundaries of the PDO Amyndeon zone.
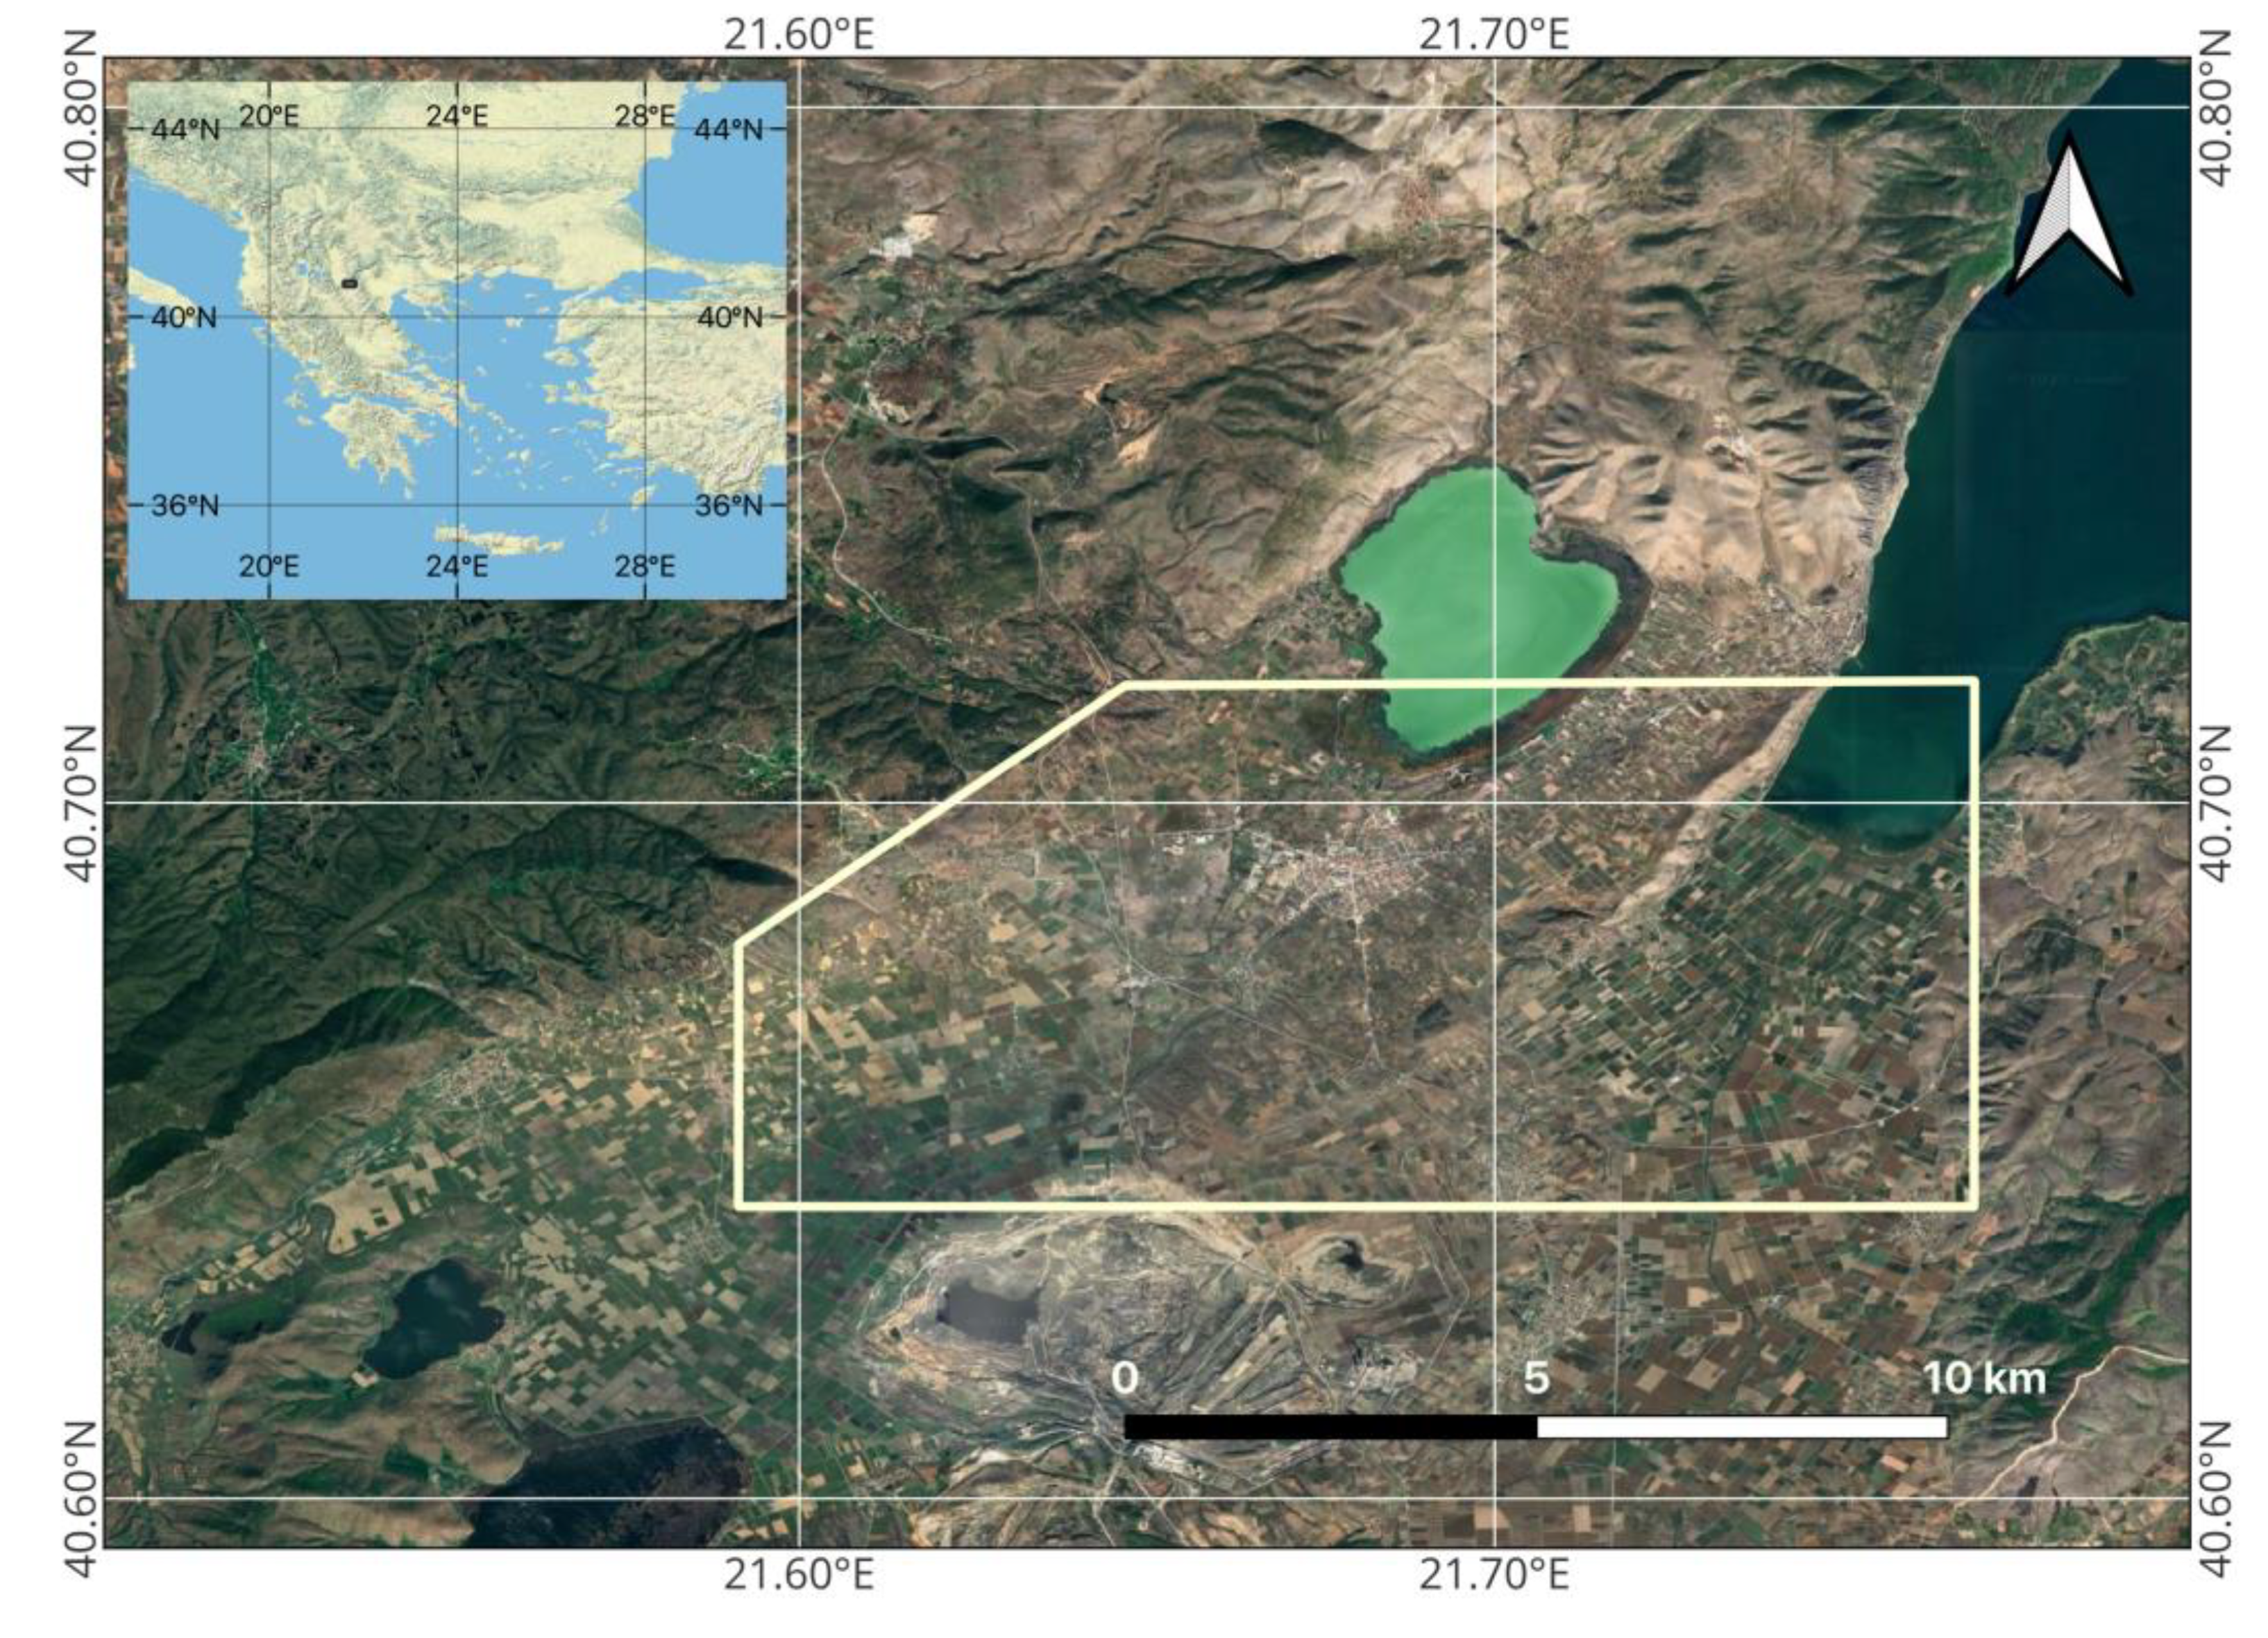
Figure 2.
Geographical location of the Protected Geographical Indication (PGI) area of Drama in Greece, with indication of the study area boundaries and nearby landscape features. In the top left corner, the mini map shows the position of the study region within Greece. The yellowish outline in the main map marks the boundaries of the PGI Drama zone.
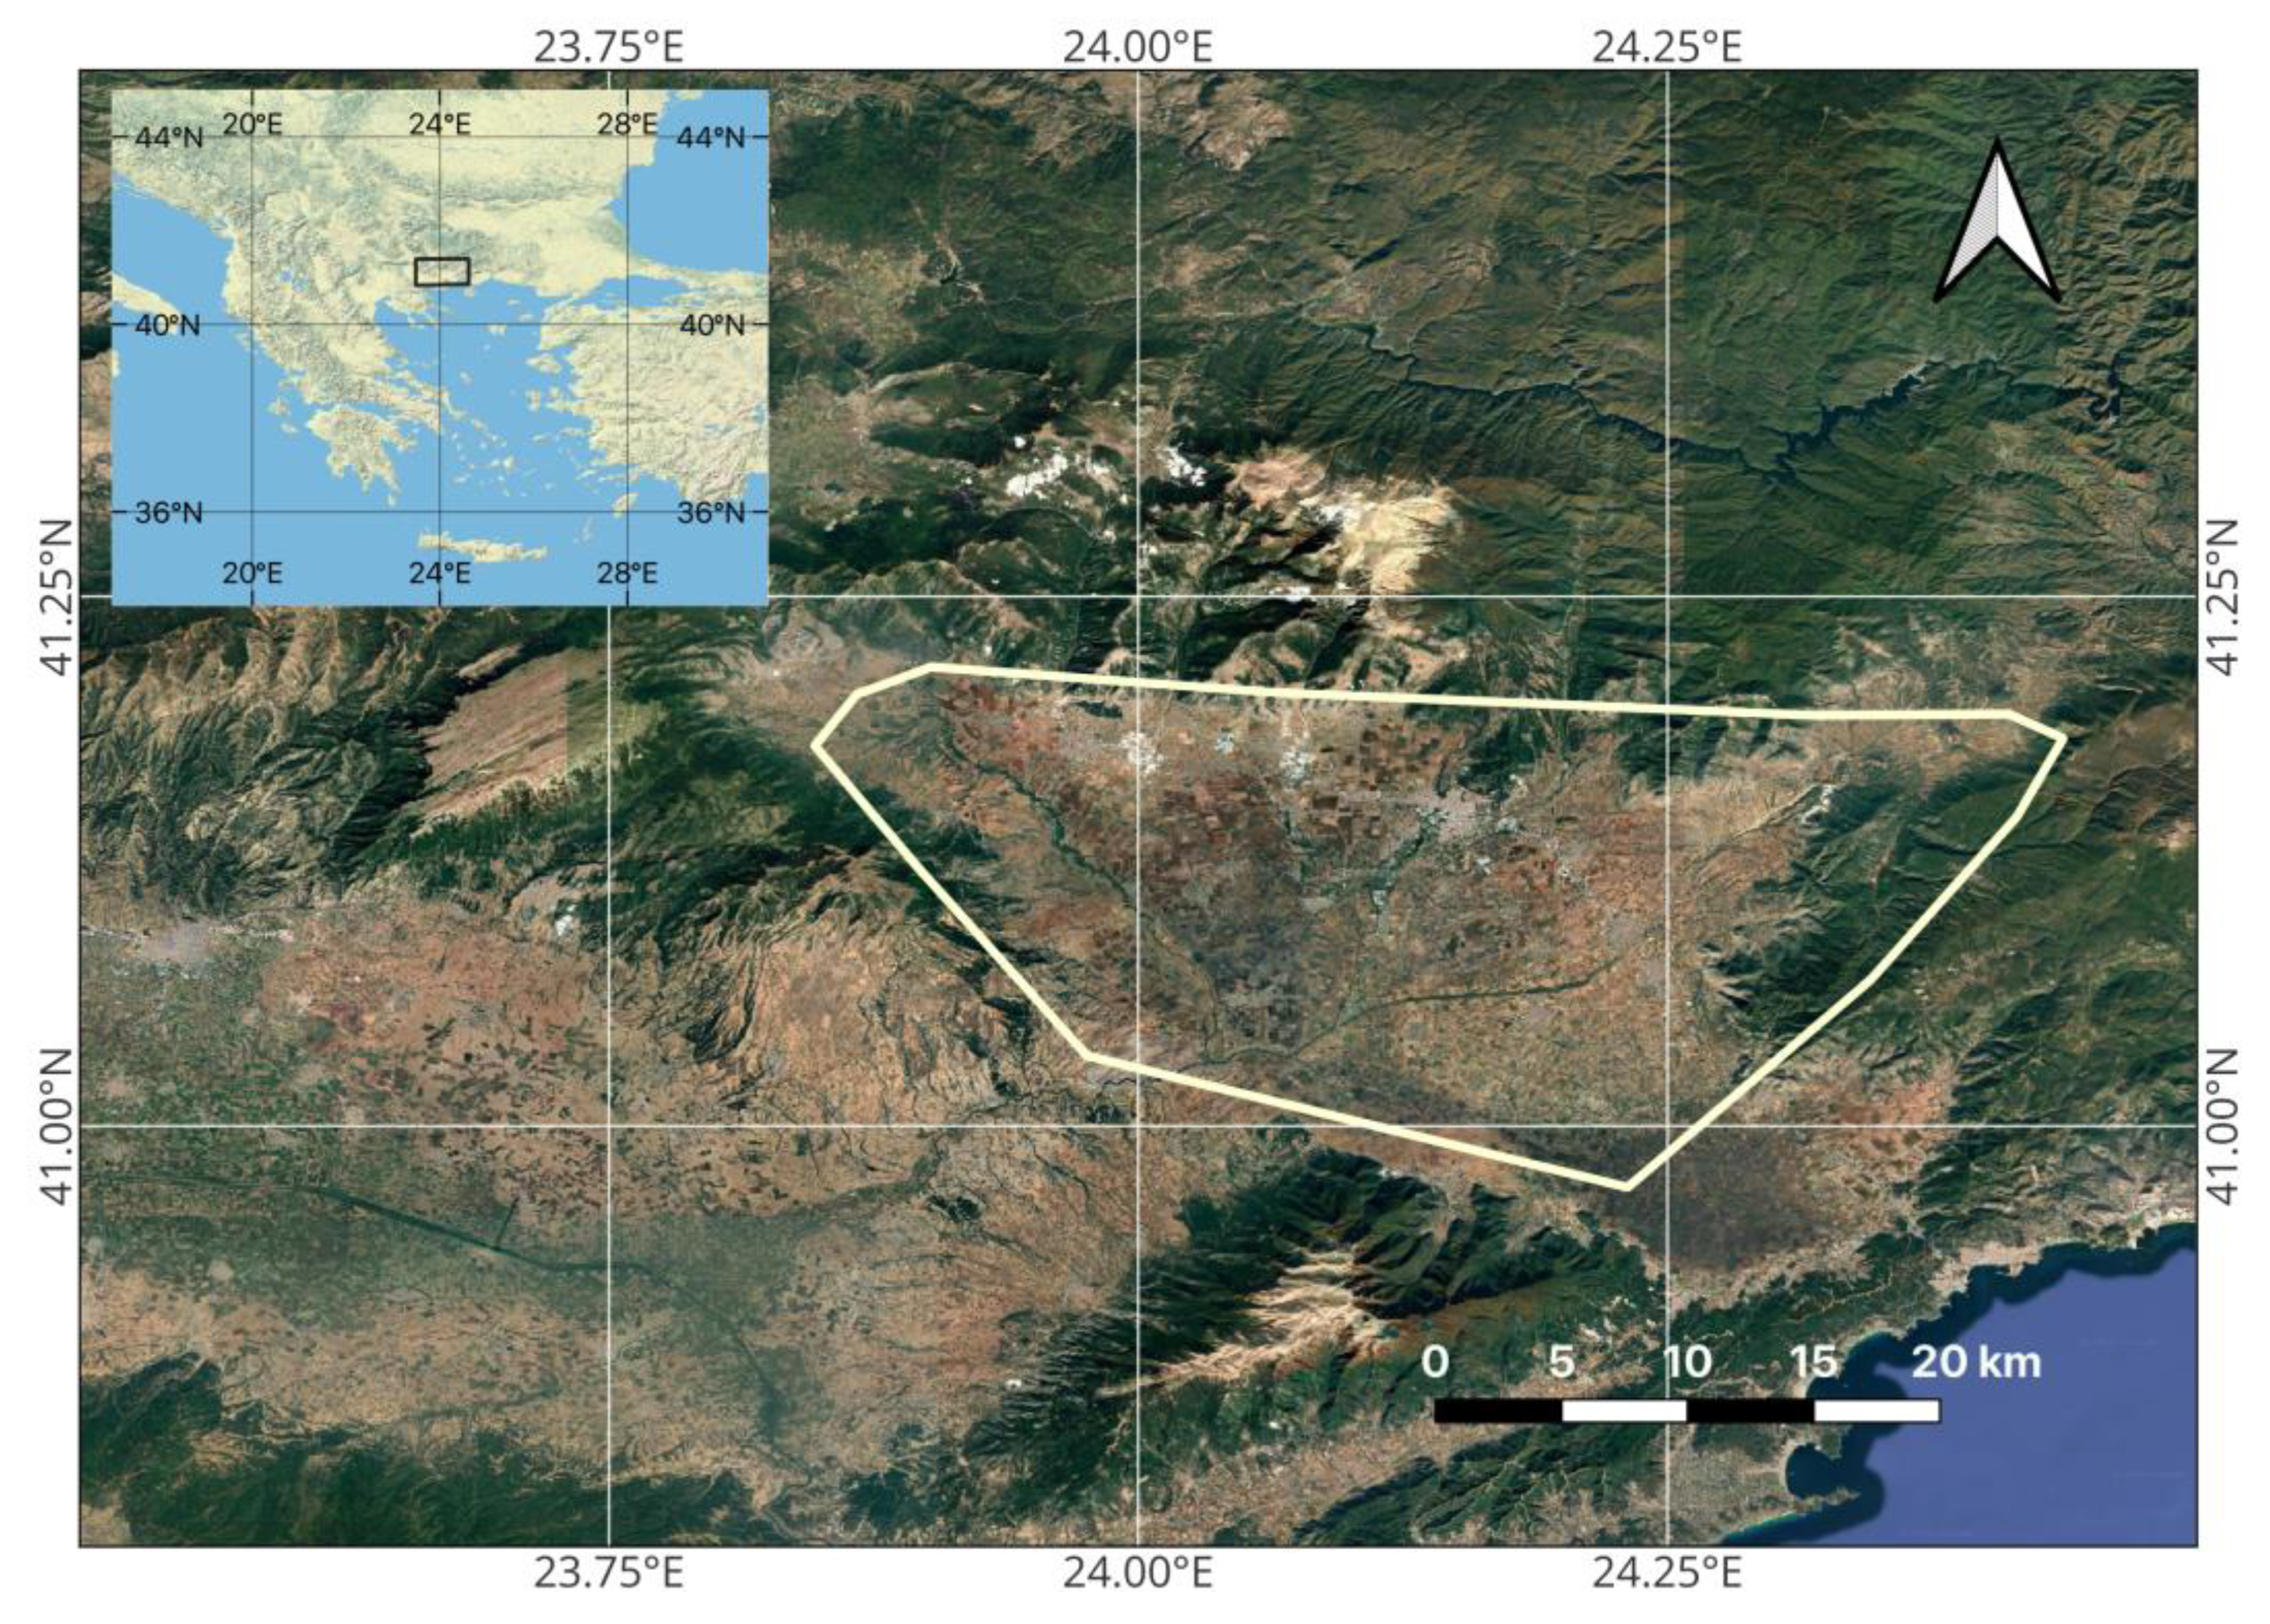
Figure 3.
Distribution of suitability classes in the study area of PDO Amyndeon, based on pixel-based analysis.
Figure 3.
Distribution of suitability classes in the study area of PDO Amyndeon, based on pixel-based analysis.
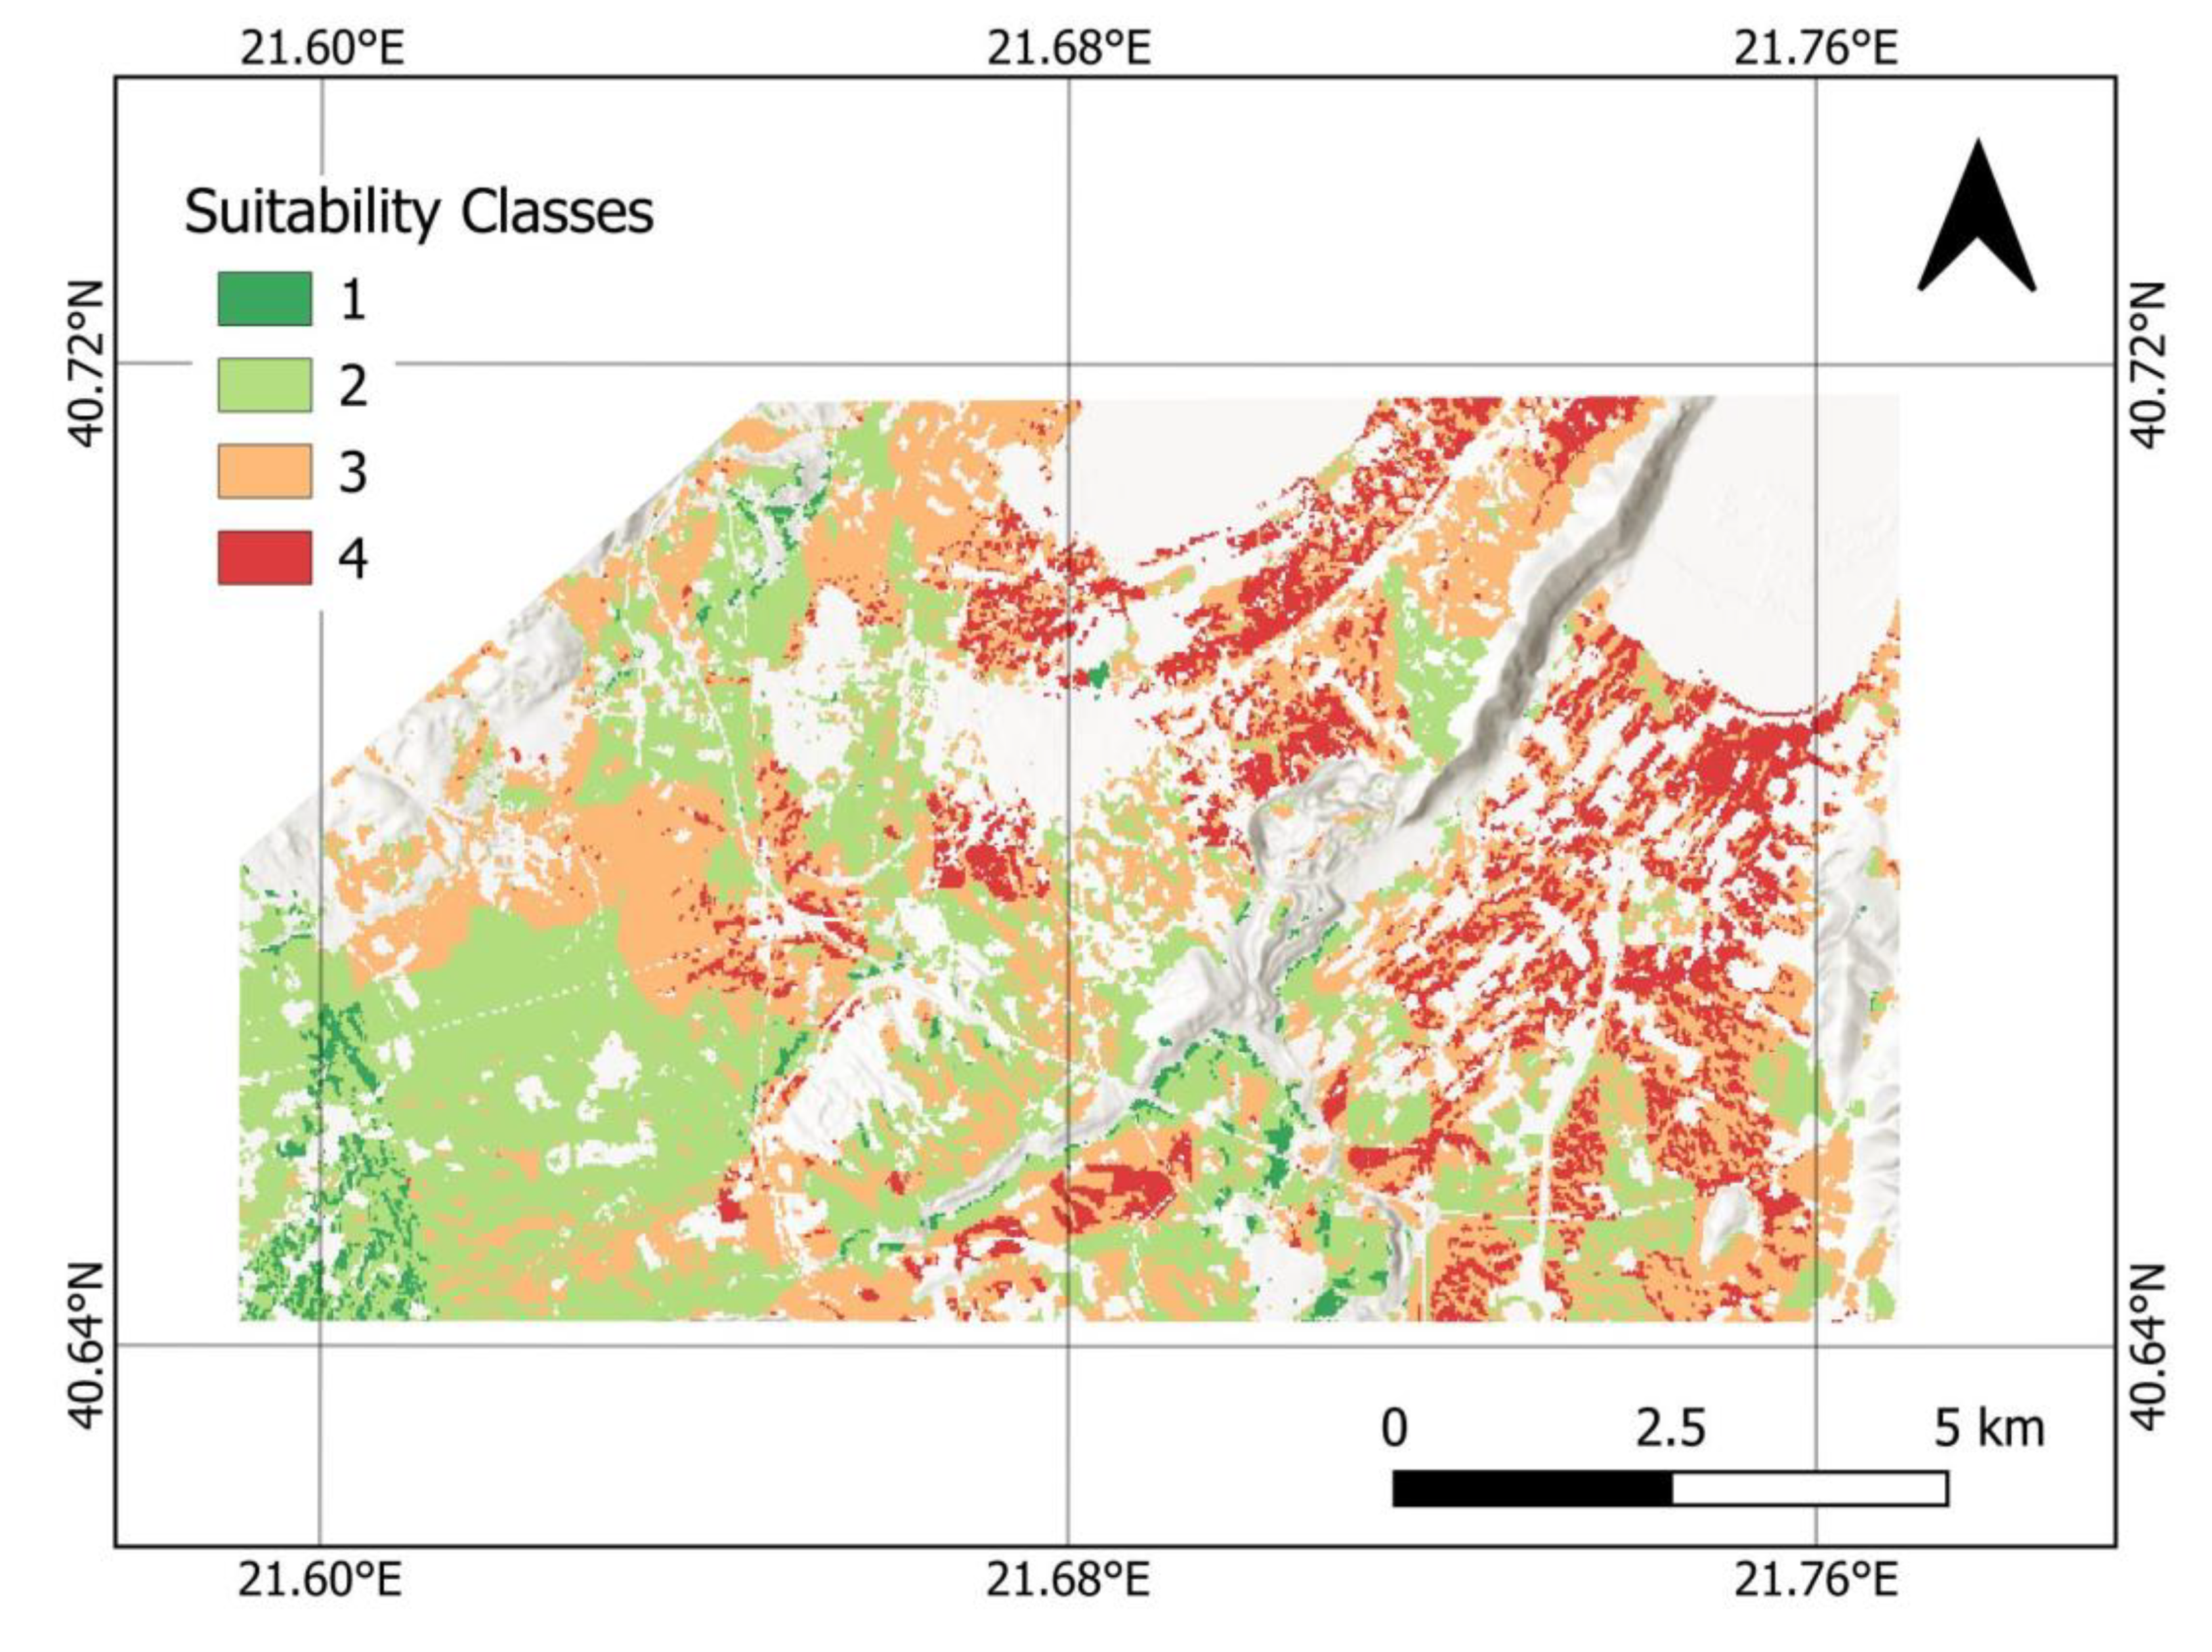
Figure 4.
Distribution of suitability classes in the study area of PDO Amyndeon after the application of the majority filter and allocation of the four experimental plots (Petres Class 1, Lofos Class 2, Vegora Class 3, Limni Class 4).
Figure 4.
Distribution of suitability classes in the study area of PDO Amyndeon after the application of the majority filter and allocation of the four experimental plots (Petres Class 1, Lofos Class 2, Vegora Class 3, Limni Class 4).
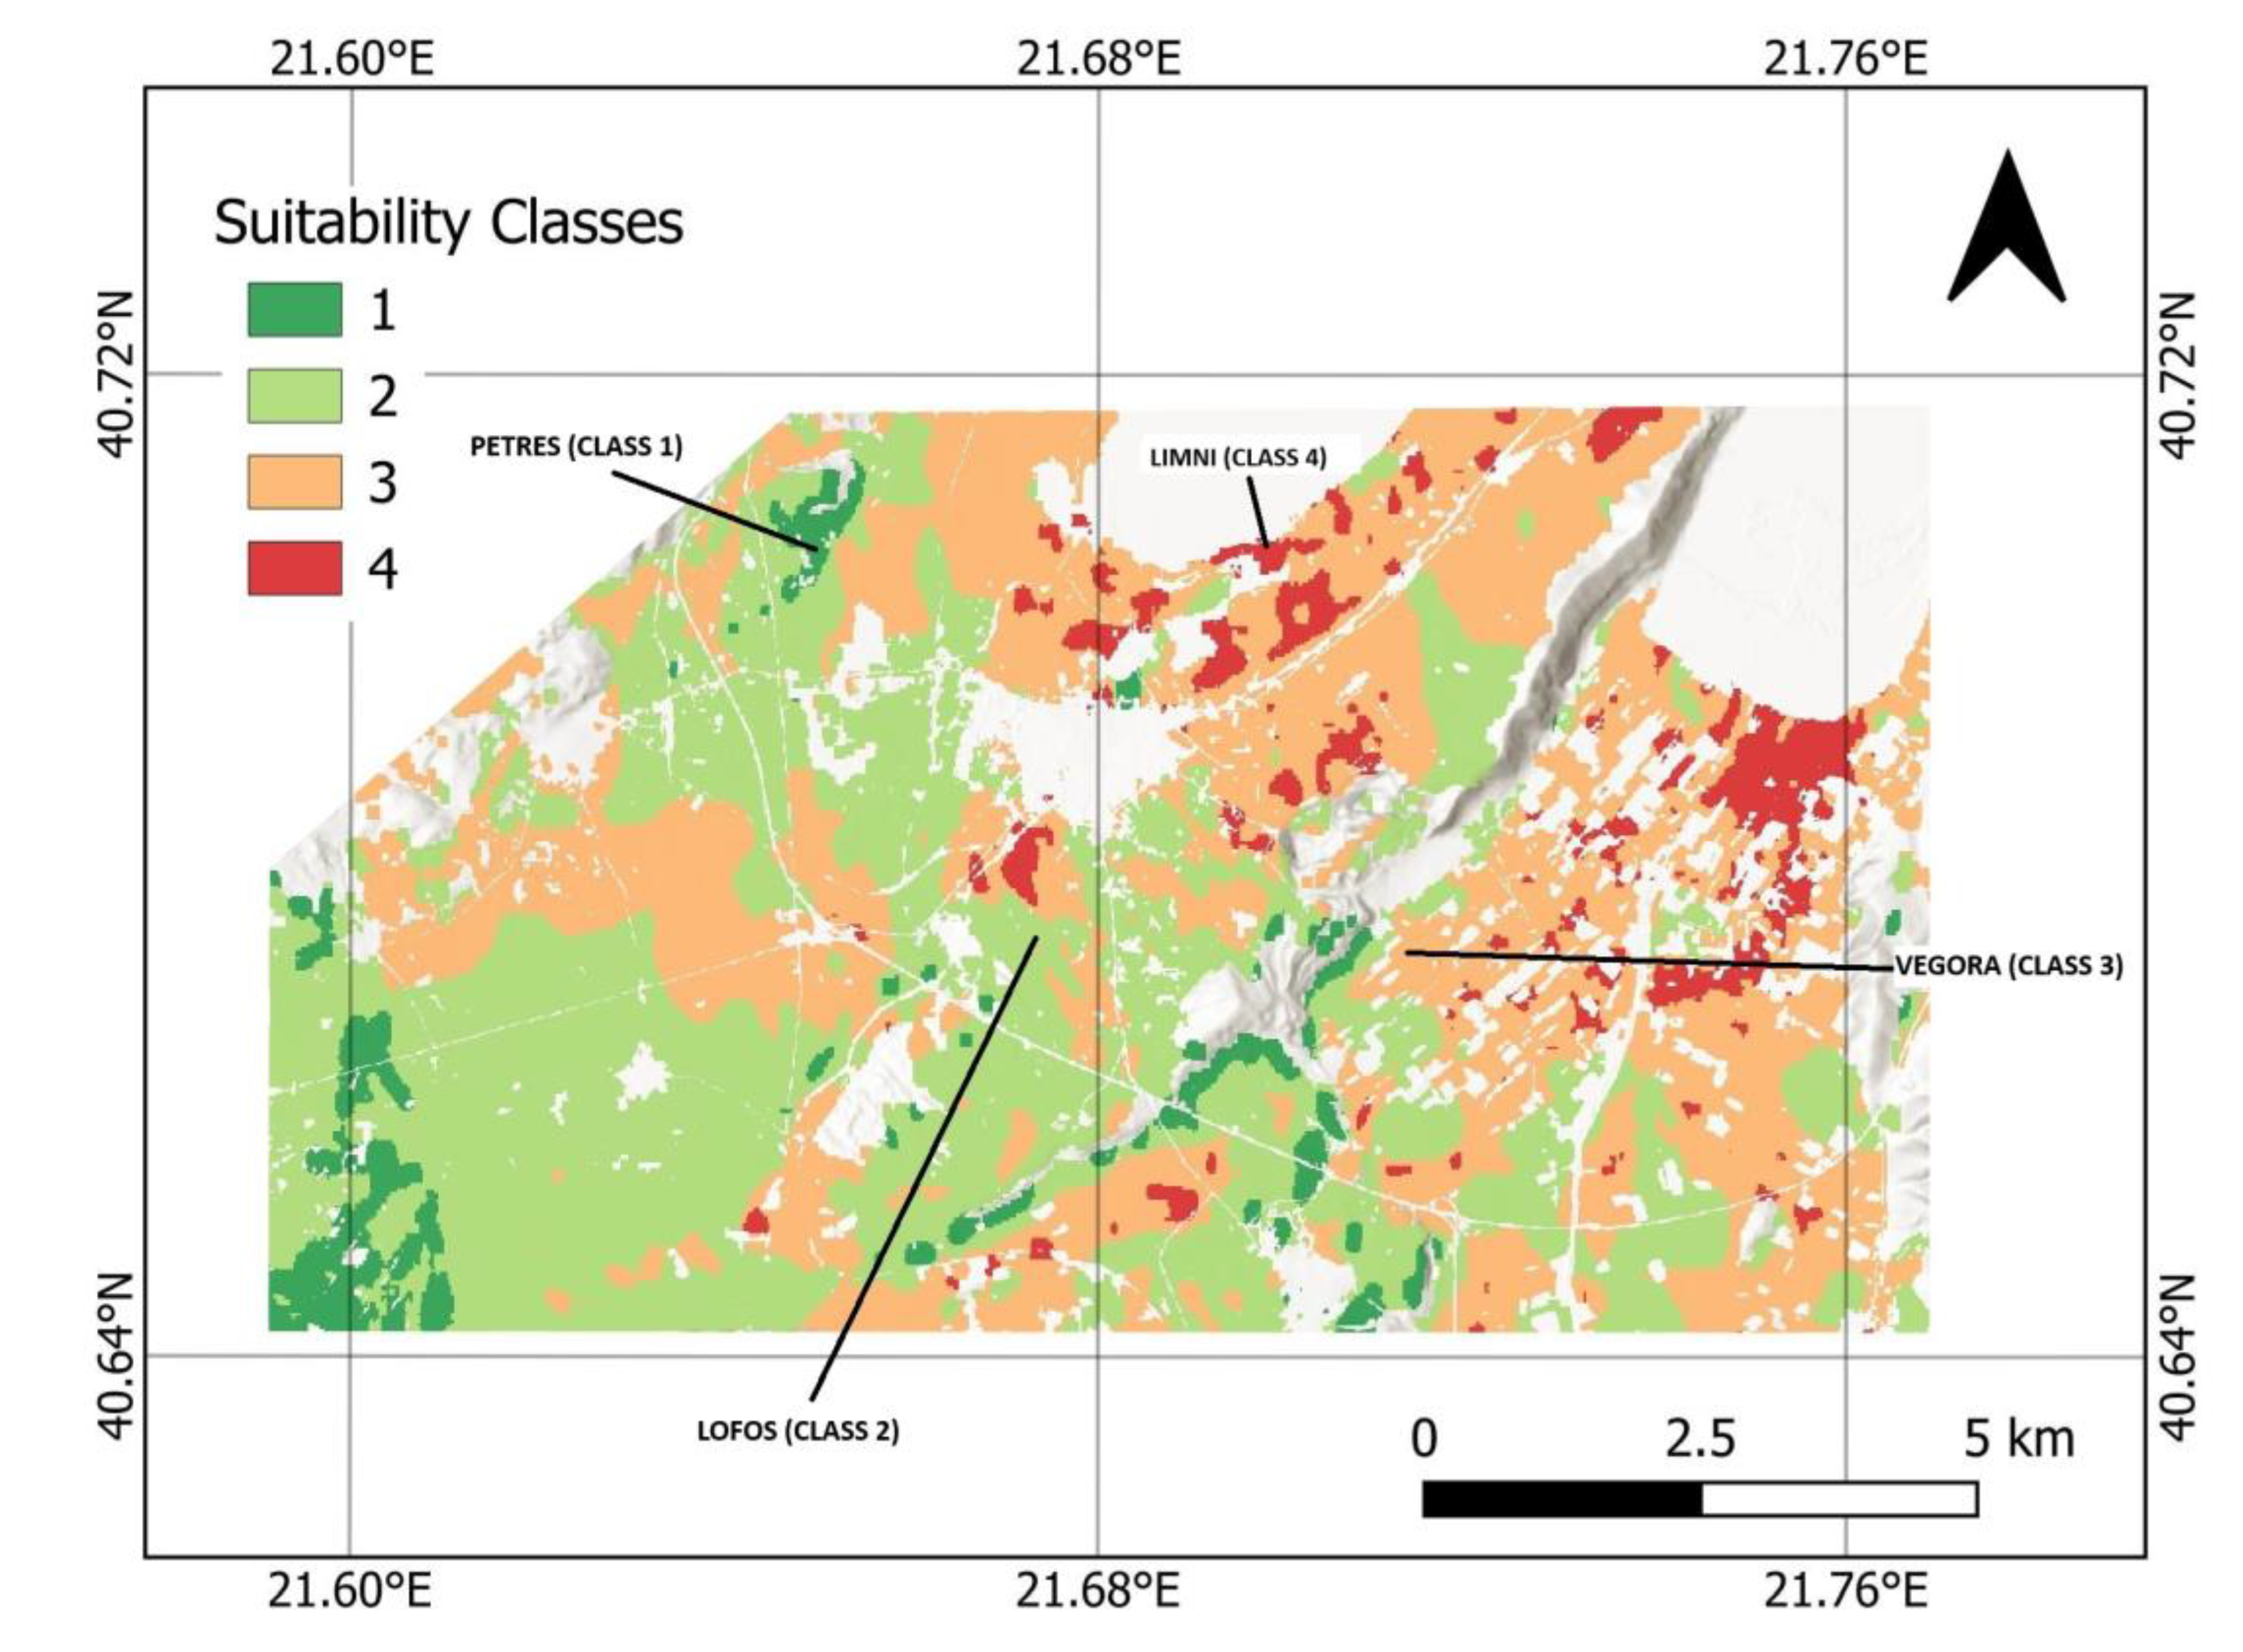
Figure 5.
Distribution of suitability classes in the study area of PGI Drama, based on pixel-based analysis.
Figure 5.
Distribution of suitability classes in the study area of PGI Drama, based on pixel-based analysis.
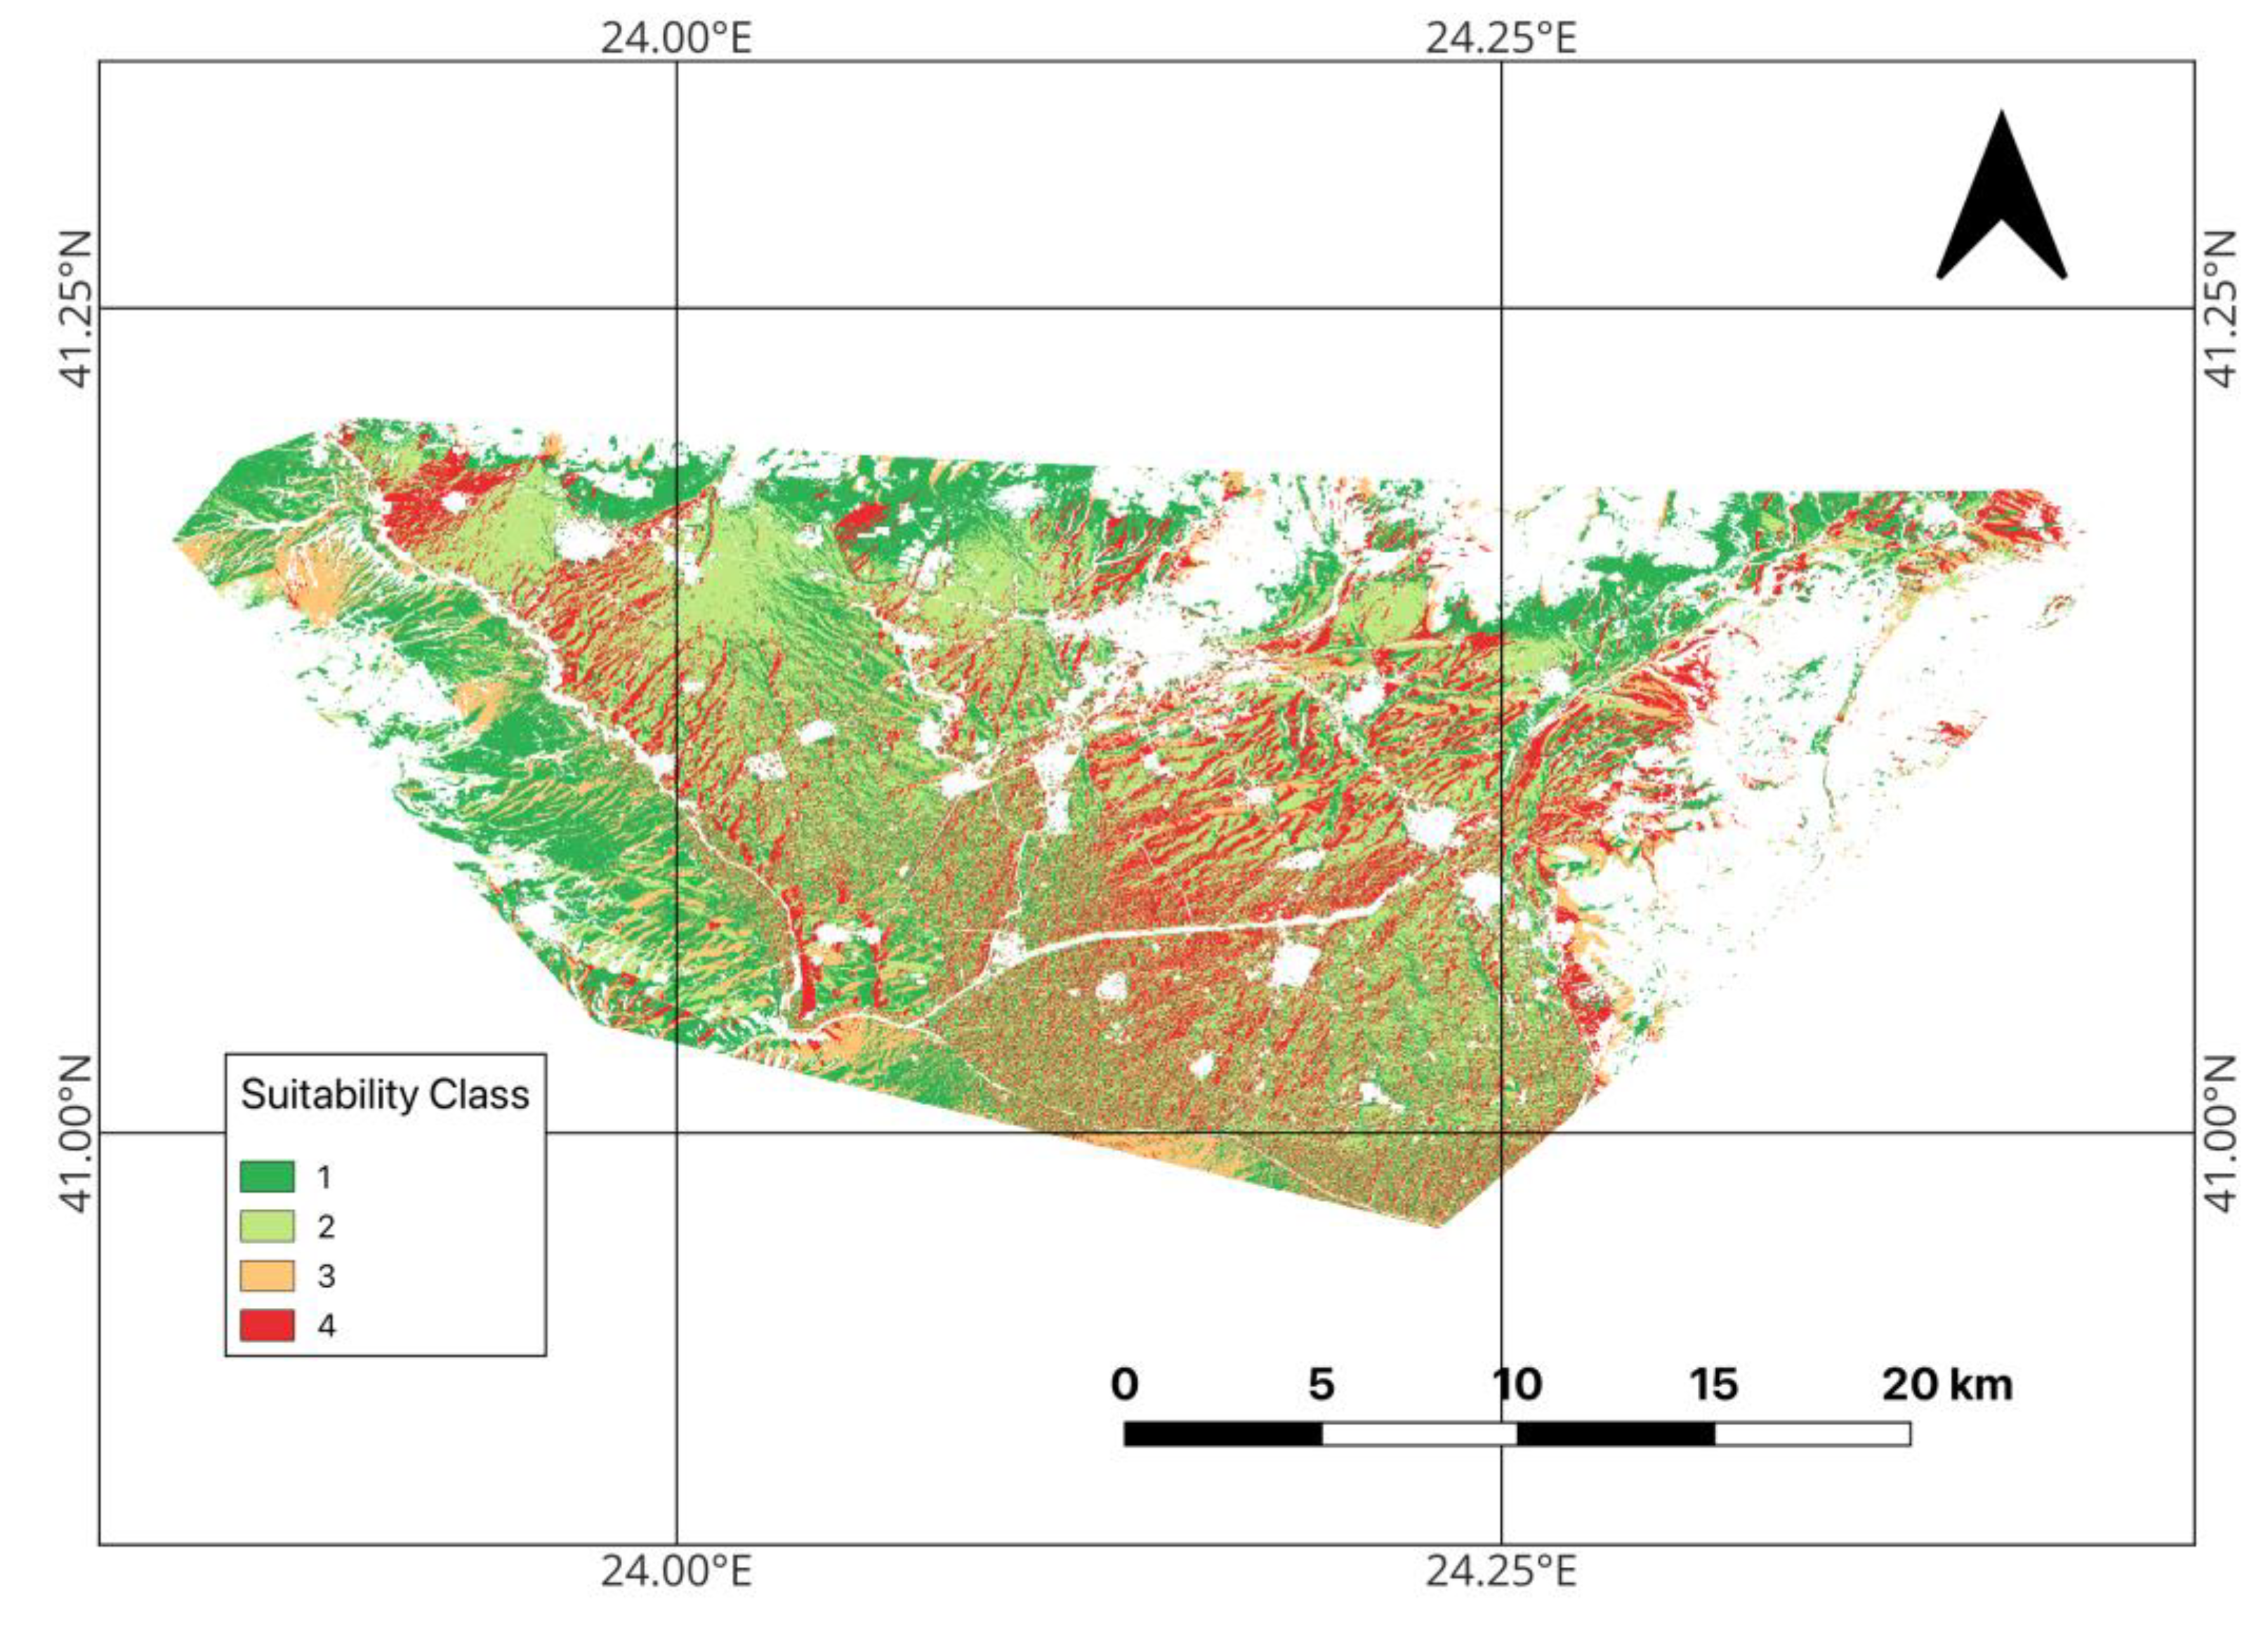
Figure 6.
Distribution of suitability classes in the study area of PGI Drama after the application of the majority filter and allocation of the four experimental plots (Agora Class 1, Kali Vrysi Class 2, Doxato Class 3, Mikrochori Class 4).
Figure 6.
Distribution of suitability classes in the study area of PGI Drama after the application of the majority filter and allocation of the four experimental plots (Agora Class 1, Kali Vrysi Class 2, Doxato Class 3, Mikrochori Class 4).
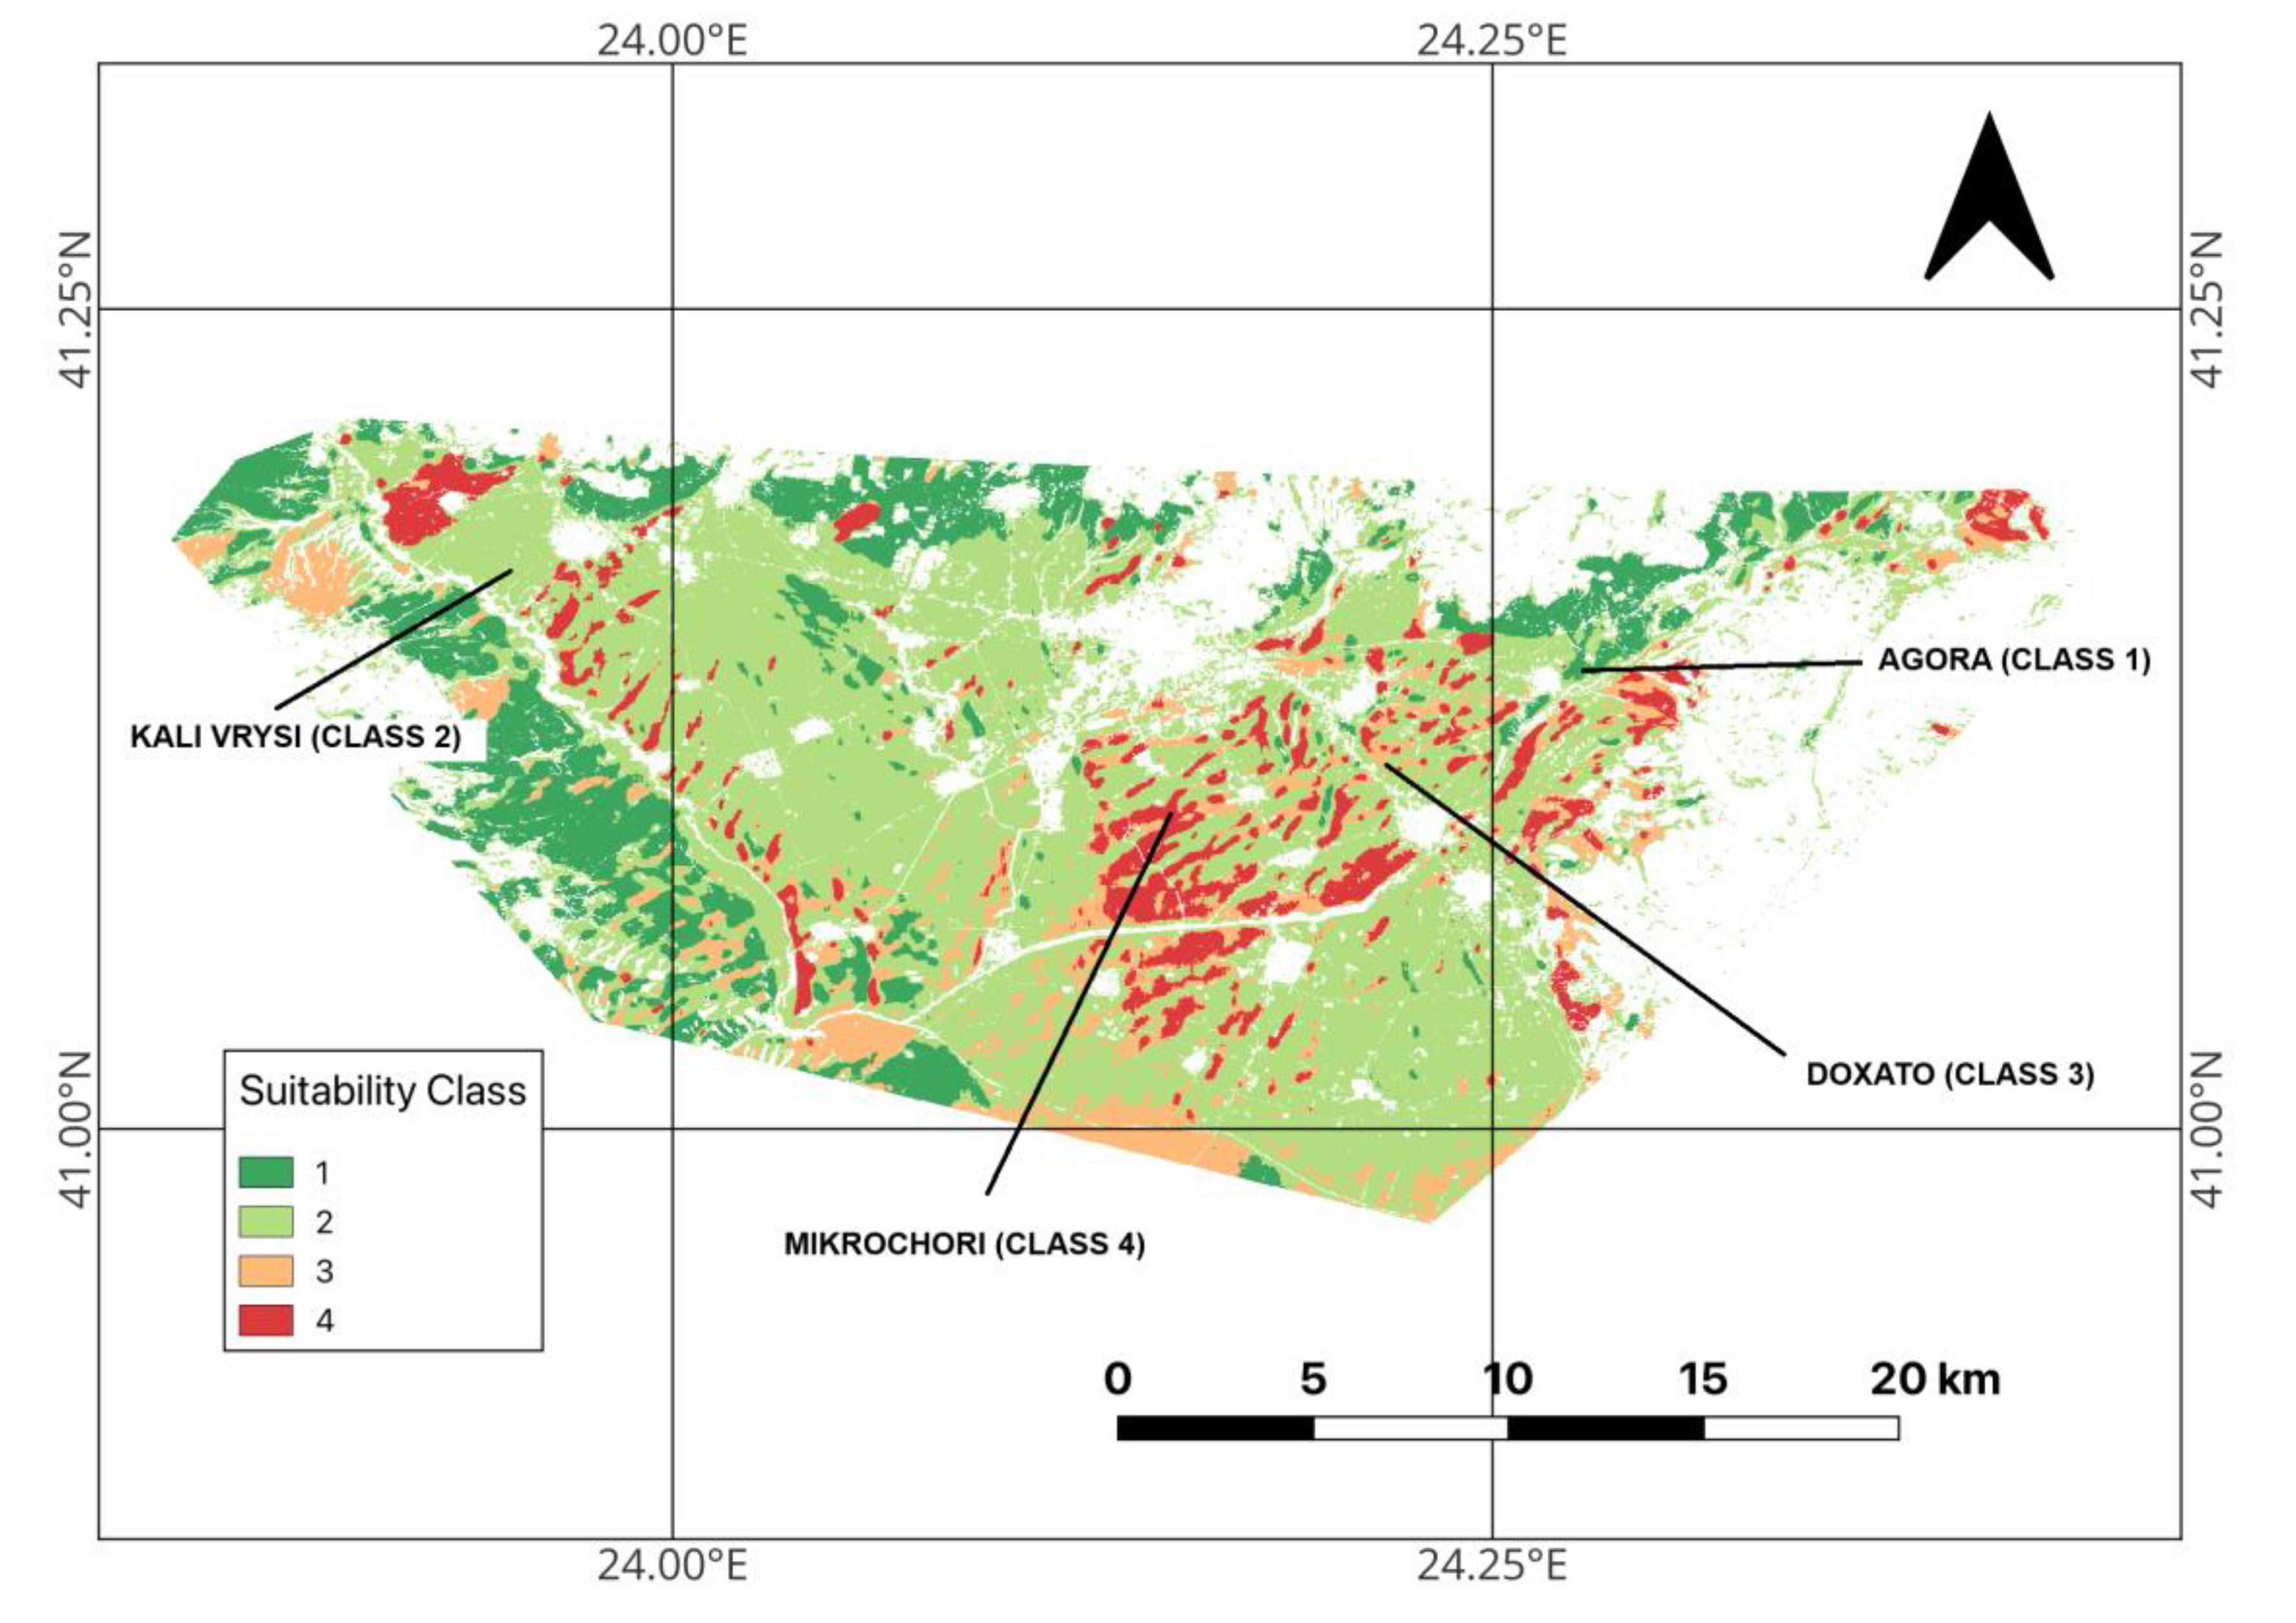
Figure 7.
Seasonal evolution of stem water potential in the years 2021–2022 for both wine growing regions. Significant differences (p < 0.05), according to Duncan’s test, among plots within the same area, per sampling day are indicated by different letters.
Figure 7.
Seasonal evolution of stem water potential in the years 2021–2022 for both wine growing regions. Significant differences (p < 0.05), according to Duncan’s test, among plots within the same area, per sampling day are indicated by different letters.
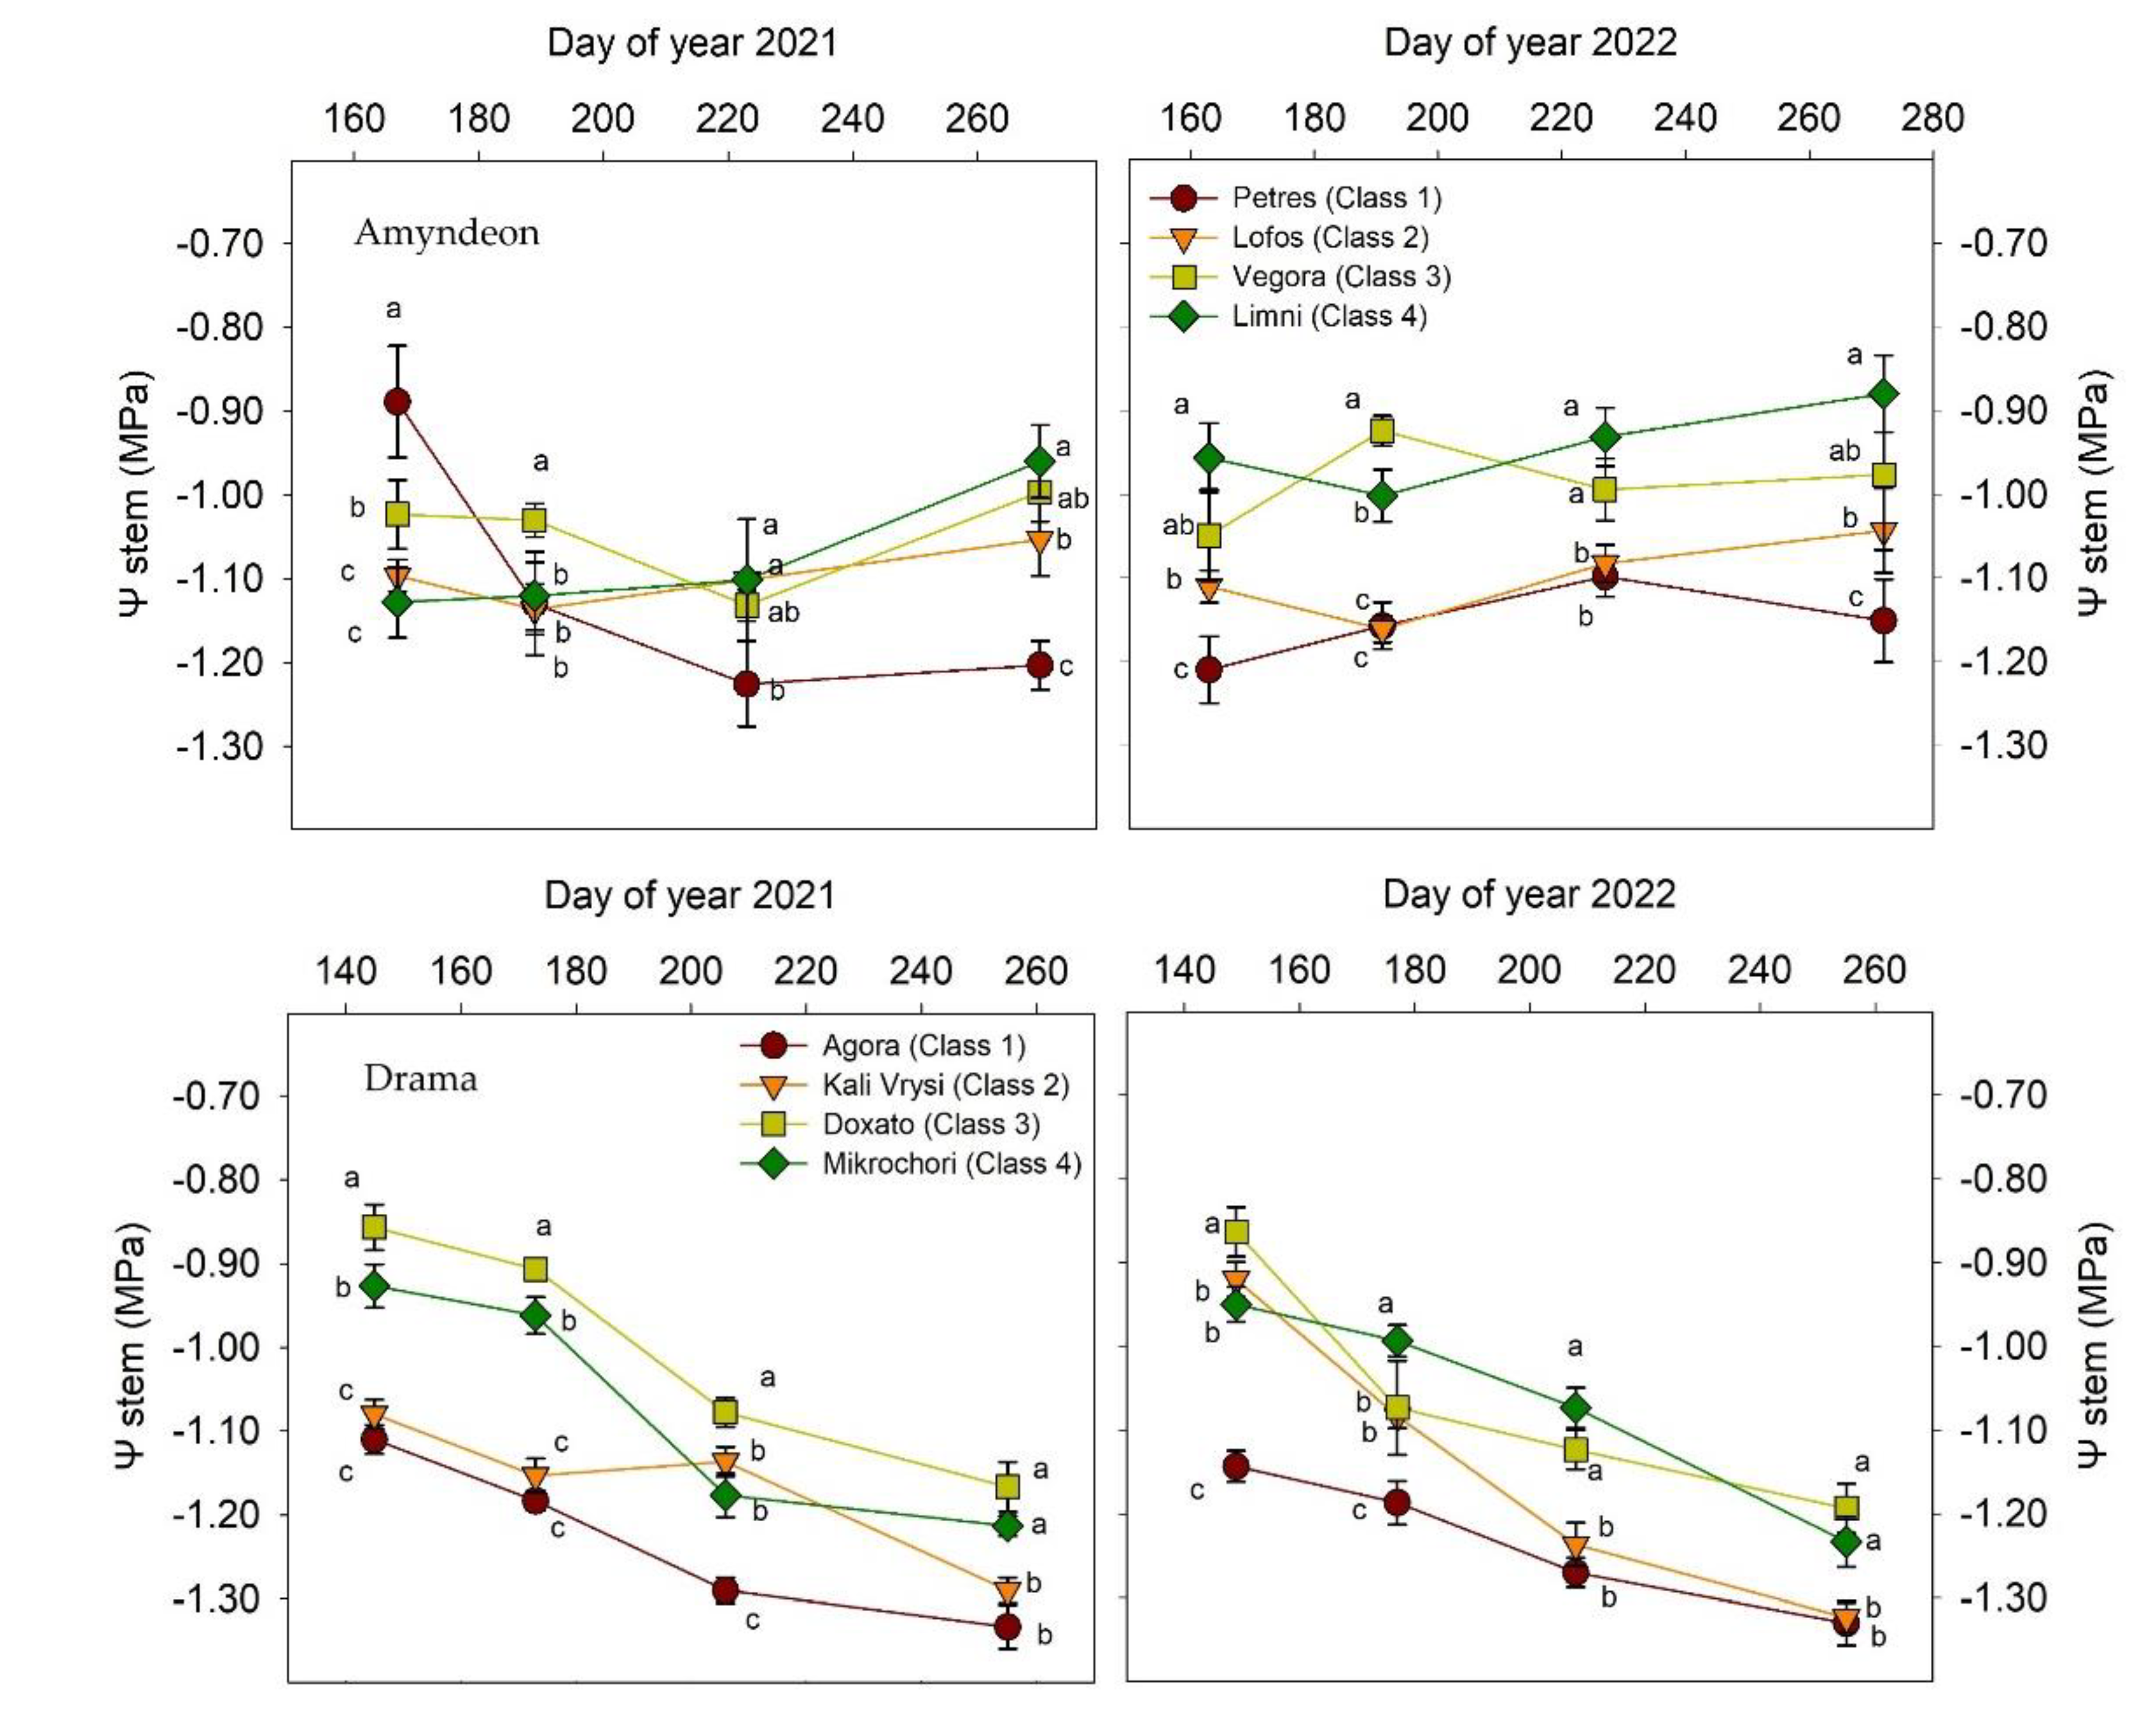

Table 1.
Climatic conditions of the two years of experimentation in PDO Amyndeon.
| Year | Month | Mean Temp (oC) |
Max Temp (oC) |
Min Temp (oC) |
GDD (number of days) | Rainfall (mm) |
|---|---|---|---|---|---|---|
| 2021 | April | 11.8 | 19.5 | 4.1 | 54 | 36.8 |
| May | 15.3 | 22.7 | 8.0 | 165 | 21.6 | |
| June | 20.9 | 28.3 | 13.5 | 327 | 44.7 | |
| July | 24.6 | 32.7 | 16.5 | 452 | 40.1 | |
| August | 22.9 | 31.1 | 14.8 | 401 | 64.3 | |
| September | 19.5 | 27.0 | 12.0 | 285 | 33.4 | |
| Sum/Avg | 19.1 | 26.8 | 11.4 | 1685 | 240.9 | |
| 2022 | April | 19.5 | 18.4 | 4.9 | 12 | 35.0 |
| May | 11.6 | 24.7 | 8.5 | 238 | 11.6 | |
| June | 16.6 | 27.9 | 14.1 | 348 | 52.2 | |
| July | 21.0 | 31.5 | 17.2 | 465 | 38.8 | |
| August | 24.3 | 30.4 | 13.7 | 474 | 10.8 | |
| September | 22.0 | 26.3 | 11.4 | 267 | 20.4 | |
| Sum/Avg | 19.0 | 26.5 | 11.6 | 1668 | 168.8 |
Table 2.
Climatic conditions of the two years of experimentation in PGI Drama.
| Year | Month | Mean Temp (oC) |
Max Temp (oC) |
Min Temp (oC) |
GDD (number of days) | Rainfall (mm) |
|---|---|---|---|---|---|---|
| 2021 | April | 13.3 | 19.1 | 7.6 | 100 | 45.3 |
| May | 16.5 | 22.9 | 10.2 | 203 | 34.8 | |
| June | 21.4 | 29.4 | 13.5 | 343 | 68.6 | |
| July | 24.5 | 33.2 | 15.8 | 449 | 77.1 | |
| August | 25.3 | 34.1 | 16.5 | 474 | 41.4 | |
| September | 20.5 | 27.5 | 13.5 | 315 | 40.3 | |
| Sum/Avg | 20.2 | 27.7 | 12.8 | 1886 | 307.5 | |
| 2022 | April | 14.3 | 20.4 | 8.3 | 130 | 65.7 |
| May | 17.1 | 23.5 | 10.7 | 220 | 88.4 | |
| June | 21.9 | 30.2 | 13.7 | 358 | 104.5 | |
| July | 24.3 | 34.4 | 14.3 | 444 | 77.3 | |
| August | 25.8 | 34.8 | 16.8 | 489 | 58.2 | |
| September | 22.1 | 28.9 | 15.2 | 361 | 41.1 | |
| Sum/Avg | 20.9 | 28.7 | 13.2 | 2005 | 435.2 |
Table 3.
Classification parameters for Amyndeon, suitability classes and their limitations and weight of their influence on the final classification.
Table 3.
Classification parameters for Amyndeon, suitability classes and their limitations and weight of their influence on the final classification.
| Category | Weight | Class 1 | Class 2 | Class 3 | Class 4 |
|---|---|---|---|---|---|
| Sand (%) | 1 | 85.0 –100.0 | 20.0 – 85.0 | 1.0 – 19.99 | 0.0 – 1.0 |
| C/N Ratio | 0.6 | 0.0 – 0.5 | 0.5 – 1.0 | 1.0 – 1.5 | 1.5 – 5.0 |
| Rainfall (Winter, Oct-Mar) (mm) | 0.3 | 300.0 – 1000.0 | 200.0 – 300.0 | 100.0 – 200.0 | 0.0 – 100.0 |
| Rainfall (Growing Season, Apr-Sep) (mm) | 0.8 | 0.0 – 100.0 | 100.0 – 200.0 | 200.0 – 300.0 | 300.0 – 1000.0 |
| Rainfall (Ripening, Sep) (mm) | 1 | 0.0 – 5.0 | 5.0 – 20.0 | 20.0 – 50.0 | 50.0 – 1000.0 |
| Temp Mean Min (Sep) (°C) | 1.5 | 14.0 – 18.0 | 12.0 – 14.0 | 18.0 – 30.0 | 0.0 – 12.0 |
| Temp Mean Max (Sep) (°C) | 0.3 | 0.0 – 24.0 | 24.0 – 26.0 | 26.0 – 28.0 | 28.0 – 100.0 |
| Aspect (°) | 0.5 | 45 – 135 | 135 – 225 | 224 – 315 | 315 – 360, 0 – 45 |
| Slope (°) | 1 | 8 – 90 | 5 – 8 | 3 – 5 | 0 – 3 |
| Final Performance (%) | - | 100 – 60 | 60 – 40 | 40 – 25 | 25 – 0 |
Table 4.
Classification parameters of Drama, suitability classes and their limitations and weight of their influence on the final classification.
Table 4.
Classification parameters of Drama, suitability classes and their limitations and weight of their influence on the final classification.
| Category | Weight | Class 1 | Class 2 | Class 3 | Class 4 |
|---|---|---|---|---|---|
| Sand (%) | 1 | 50.0 –70.0 | 50.0 – 35.0 | 35.0 – 25.0 | 25.0 – 1.0 |
| C/N Ratio | 0.6 | 0.0 – 0.5 | 0.5 – 1.0 | 1.0 – 1.5 | 1.5 – 5.0 |
| Rainfall (Winter, Oct-Mar) (mm) | 0.3 | 200.0 – 300.0 | 300.0 – 350.0 | 350.0 – 400.0 | 400.0 – 1000.0 |
| Rainfall (Growing Season, Apr-Sep) (mm) | 0.8 | 150.0 – 200.0 | 200.0 – 250.0 | 250.0 – 300.0 | 300.0 – 1000.0 |
| Rainfall (Ripening, Sep) (mm) | 1 | 0.0 – 1.0 | 1.0 – 20.0 | 20.0 – 50.0 | 50.0 – 1000.0 |
| Temp Mean Min (Sep) (°C) | 1.5 | 12.0 – 15.0 | 15.0 – 18.0 | 18.0 – 20.0 | 20.0 – 30.0 |
| Temp Mean Max (Sep) (°C) | 0.3 | 20.0 – 25.0 | 25.0 – 28.0 | 28.0 – 30.0 | 30.0 – 100.0 |
| Aspect (°) | 0.5 | 45 – 135 | 135 – 225 | 315 – 360, 0 – 45 | 224 –315 |
| Slope (°) | 1 | 8 – 90 | 5 – 8 | 3 – 5 | 0 – 3 |
| Final Performance (%) | - | 100 – 60 | 60 – 40 | 40 – 25 | 25 – 0 |
Table 5.
Growth of leaf area measured at harvest for 2021 and 2022 for both wine growing regions. Values followed by different letters within each plot are significantly different at p < 0.05, according to Duncan’s test.
Table 5.
Growth of leaf area measured at harvest for 2021 and 2022 for both wine growing regions. Values followed by different letters within each plot are significantly different at p < 0.05, according to Duncan’s test.
| Region | Year | Plot | Leaf Area (m2/vine) | Main Leaf Area (m2/vine) |
Sec. Leaf Area (m2/vine) | |
|---|---|---|---|---|---|---|
| Amyndeon | 2021 | Petres (Class 1) | 3.52 ± 0.19 b | 1.41 ± 0.17 b | 1.09 ± 0.18 b | |
| Lofos (Class 2) | 5.82 ± 0.23 a | 2.03 ± 0.21 a | 1.51 ± 0.15 a | |||
| Vegora (Class 3) | 5.74 ± 0.24 a | 2.09 ± 0.22 a | 1.33 ± 0.22 a | |||
| Limni (Class 4) | 3.96 ± 0.14 b | 2.18 ± 0.14 a | 1.29 ± 0.23 a | |||
| 2022 | Petres (Class 1) | 3.08 ± 0.19 c | 1.42 ± 0.15 c | 1.06 ± 0.21 ab | ||
| Lofos (Class 2) | 5.79 ± 0.26 a | 2.04 ± 0.13 b | 0.99 ± 0.19 b | |||
| Vegora (Class 3) | 5.77 ± 0.11 a | 2.1 ± 0.21 b | 1.25± 0.12 a | |||
| Limni (Class 4) | 3.76 ± 0.17 b | 2.44 ± 0.18 a | 0.95 ± 0.24 b | |||
| Drama | 2021 | Agora (Class 1) | 2.62 ± 0.10 b | 1.57 ± 0.13 b | 1.13 ± 0.19 a | |
| Kali Vrysi (Class 2) | 2.93 ± 0.12 a | 1.85 ± 0.11 a | 1.17 ± 0.14 a | |||
| Doxato (Class 3) | 2.49 ± 0.13 c | 1.48 ± 0.09 b | 1.11 ± 0.16 a | |||
| Mikrochori (Class 4) | 2.56 ± 0.21 b | 1.42 ± 0.15 b | 0.99 ± 0.11 b | |||
| 2022 | Agora (Class 1) | 2.15 ± 0.18 c | 1.30 ± 0.15 b | 1.19 ± 0.20 a | ||
| Kali Vrysi (Class 2) | 2.25 ± 0.15 c | 1.31 ± 0.14 b | 1.24 ± 0.12 a | |||
| Doxato (Class 3) | 2.94 ± 0.27 a | 1.52 ± 0.12 a | 1.15 ± 0.16 a | |||
| Mikrochori (Class 4) | 2.66 ± 0.13 b | 1.57 ± 0.08 a | 0.95 ± 0.13 b | |||
Table 6.
Grape characteristics measured at harvest in 2021–2022. Berry weight (W50) and skin weight (Wskin) were measured on a total of fifty berries from each plot. Values followed by different letters within each plot are significantly different at p < 0.05, according to Duncan’s test.
Table 6.
Grape characteristics measured at harvest in 2021–2022. Berry weight (W50) and skin weight (Wskin) were measured on a total of fifty berries from each plot. Values followed by different letters within each plot are significantly different at p < 0.05, according to Duncan’s test.
| Region | Year | Plot | W50 (g) | W50 skin (g) | Bunch weight (g) |
|---|---|---|---|---|---|
| Amyndeon | 2021 | Petres (Class 1) | 65.00 ± 0.63 c | 9.23 ± 0.24 a | 144.2 ± 11.2 c |
| Lofos (Class 2) | 88.85 ± 0.84 a | 8.66 ± 0.15 b | 174.7 ± 10.7 b | ||
| Vegora (Class 3) | 85.32 ± 0.71 a | 7.48 ± 0.33 c | 185.4 ± 9.6 ab | ||
| Limni (Class 4) | 67.21 ± 0.32 b | 8.77 ± 0.26 b | 192.6 ± 8.4 a | ||
| 2022 | Petres (Class 1) | 74.26 ± 0.65 c | 8.54 ± 0.57 a | 147.6 ± 10.6 c | |
| Lofos (Class 2) | 91.24 ± 0.92 a | 7.91 ± 0.24 b | 197.6 ± 7.3 a | ||
| Vegora (Class 3) | 75.37 ± 0.85 c | 7.65 ± 0.36 b | 168.1 ± 12.1 b | ||
| Limni (Class 4) | 76.48 ± 0.25 b | 8.18 ± 0.25 ab | 190.2 ± 12 a | ||
| Drama | 2021 | Agora (Class 1) | 84.38 ± 0.24 b | 11.32 ± 0.28 a | 281.1 ± 10.1 a |
| Kali Vrysi (Class 2) | 82.00 ± 0.16 c | 9.88 ± 0.25 c | 220.4 ± 4.5 c | ||
| Doxato (Class 3) | 80.12 ± 0.34 d | 9.45 ± 0.41 c | 246.8 ± 5.3 c | ||
| Mikrochori (Class 4) | 85.47 ± 0.54 a | 10.48 ± 0.39 b | 243.3 ± 8.4 b | ||
| 2022 | Agora (Class 1) | 83.48 ± 0.62 b | 11.28 ± 0.31 ab | 278.7 ± 8.6 a | |
| Kali Vrysi (Class 2) | 77.31 ± 0.28 d | 11.19 ± 0.24 b | 211.8 ± 11.2 c | ||
| Doxato (Class 3) | 82.35 ± 0.14 c | 11.91 ± 0.33 a | 234.8 ± 9.8 b | ||
| Mikrochori (Class 4) | 84.94 ± 0.56 a | 11.65 ± 0.42 a | 241.5 ± 5.4 b |
Table 7.
Relationships between vegetative and reproductive growth across plots; Yield was measured at harvest and pruning wood weight was measured during the following winter pruning in years 2021 and 2022 for both regions. Values followed by different letters within each plot are significantly different at p < 0.05, according to Duncan’s test.
| Region | Year | Plot | Yield/vine (kg) | Pruning weight/vine (kg) | Yield/Prun. Weight (Ravaz index) |
|---|---|---|---|---|---|
| Amyndeon | 2021 | Petres (Class 1) | 3.89 ± 0.53 b | 0.98 ± 0.16 b | 3.71 ± 0.4 c |
| Lofos (Class 2) | 5.51± 0.21 ab | 1.27 ± 0.14 a | 4.22 ± 0.2 b | ||
| Vegora (Class 3) | 5.64 ± 0.29 a | 1.24 ± 0.16 a | 4.49 ± 0.3 a | ||
| Limni (Class 4) | 5.47 ± 0.18 ab | 1.31 ± 0.11 a | 3.75 ± 0.3 c | ||
| 2022 | Petres (Class 1) | 3.69 ± 0.25 c | 1.13 ± 0.16 b | 3.78 ± 0.5 b | |
| Lofos (Class 2) | 5.61± 0.21 a | 1.16 ± 0.10 c | 4.72 ± 0.4 a | ||
| Vegora (Class 3) | 5.36 ± 0.31 ab | 1.18 ± 0.09 b | 4.65 ± 0.3 a | ||
| Limni (Class 4) | 5.00 ± 0.18 b | 1.42 ± 0.12 a | 3.60 ± 0.2 c | ||
| Drama | 2021 | Agora (Class 1) | 3.59 ± 0.36 ab | 1.20 ± 0.14 a | 2.99 ± 0.2 b |
| Kali Vrysi (Class 2) | 3.69 ± 0.15 a | 1.23 ± 0.12 a | 2.98 ± 0.5 b | ||
| Doxato (Class 3) | 3.82 ± 0.23 a | 1.17 ± 0.07 b | 3.27 ± 0.2 a | ||
| Mikrochori (Class 4) | 3.52 ± 0.16 b | 1.24 ± 0.11 a | 2.84 ± 0.3 b | ||
| 2022 | Agora (Class 1) | 3.67 ± 0.24 | 1.36 ± 0.15 a | 2.69 ± 0.1 b | |
| Kali Vrysi (Class 2) | 3.72 ± 0.52 | 1.15 ± 0.14 c | 3.24 ± 0.6 a | ||
| Doxato (Class 3) | 3.57 ± 0.24 | 1.25 ± 0.08 b | 2.86 ± 0.4 a | ||
| Mikrochori (Class 4) | 3.51 ± 0.37 | 1.40 ± 0.12 a | 2.51 ± 0.3 c |
Table 8.
Must chemical components measured at harvest across plots in years 2021 and 2022 for both regions. Values followed by different letters within each plot are significantly different at p < 0.05, according to Duncan’s test.
Table 8.
Must chemical components measured at harvest across plots in years 2021 and 2022 for both regions. Values followed by different letters within each plot are significantly different at p < 0.05, according to Duncan’s test.
| Region | Year | Plot | TSS (oBrix) | TA (g/L) | pH |
|---|---|---|---|---|---|
| Amyndeon | 2021 | Petres (Class 1) | 22.8 ± 0.5 a | 8.4 ± 0.2 a | 3.28 ± 0.04 a |
| Lofos (Class 2) | 21.9 ± 0.8 b | 8.26 ± 0.1 b | 3.28 ± 0.03 a | ||
| Vegora (Class 3) | 21.5 ± 1.3 c | 8.14 ± 0.3 b | 3.12 ± 0.01 b | ||
| Limni (Class 4) | 23.3 ± 0.2 a | 7.74 ± 0.3 c | 3.14 ± 0.05 b | ||
| 2022 | Petres (Class 1) | 22.1 ± 0.7 ab | 8.4 ± 0.2 a | 3.31 ± 0.01 b | |
| Lofos (Class 2) | 21.5 ± 0.2 b | 8.3 ± 0.1 b | 3.23 ± 0.02 b | ||
| Vegora (Class 3) | 21.4 ± 0.1 b | 8.2 ± 0.2 b | 3.13 ± 0.04 c | ||
| Limni (Class 4) | 22.4 ± 0.6 a | 7.9 ± 0.5 c | 3.37 ± 0.02 a | ||
| Drama | 2021 | Agora (Class 1) | 21.7 ± 0.2 b | 5.8 ± 0.2 c | 3.41 ± 0.02 c |
| Kali Vrysi (Class 2) | 22.4 ± 0.2 a | 6.1 ± 0.2 b | 3.63 ± 0.02 a | ||
| Doxato (Class 3) | 21 ± 0.1 c | 7.6 ± 0.4 a | 3.52 ± 0.04 b | ||
| Mikrochori (Class 4) | 22.1 ± 0.5 a | 5.3 ± 0.3 d | 3.56 ± 0.06 b | ||
| 2022 | Agora (Class 1) | 22.1 ± 0.2 c | 5.6 ± 0.1 c | 3.66 ± 0.06 c | |
| Kali Vrysi (Class 2) | 22.6 ± 0.2 b | 6.1 ± 0.1 b | 3.65 ± 0.09 b | ||
| Doxato (Class 3) | 21.4 ± 0.1 d | 7.3 ± 0.2 a | 3.73 ± 0.02 b | ||
| Mikrochori (Class 4) | 22.9 ± 0.4 a | 5.1 ± 0.3 d | 3.84 ± 0.04 a |
Table 9.
Berry phenolic compounds measured at harvest across plots in years 2021 and 2022 for both regions. Values followed by different letters within each plot are significantly different at p < 0.05, according to Duncan’s test.
Table 9.
Berry phenolic compounds measured at harvest across plots in years 2021 and 2022 for both regions. Values followed by different letters within each plot are significantly different at p < 0.05, according to Duncan’s test.
| Region | Year | Plot | Total Anthocyanins (mg berry −1) |
Total Phenolics (au berry −1) |
|---|---|---|---|---|
| Amyndeon | 2021 | Petres (Class 1) | 0.868 ± 0.03 a | 3.163 ± 0.05 b |
| Lofos (Class 2) | 0.563 ± 0.08 c | 2.581 ± 0.06 c | ||
| Vegora (Class 3) | 0.526 ± 0.07 c | 2.439 ± 0.03 d | ||
| Limni (Class 4) | 0.777 ± 0.06 b | 3.306 ± 0.02 a | ||
| 2022 | Petres (Class 1) | 0.928 ± 0.05 a | 3.547 ± 0.02 a | |
| Lofos (Class 2) | 0.691 ± 0.06 c | 2.536 ± 0.04 b | ||
| Vegora (Class 3) | 0.655 ± 0.03 d | 2.593 ± 0.06 b | ||
| Limni (Class 4) | 0.809 ± 0.02 b | 3.249 ± 0.07 a | ||
| Drama | 2021 | Agora (Class 1) | 1.354 ± 0.06 a | 2.227 ± 0.03 a |
| Kali Vrysi (Class 2) | 1.333 ± 0.05 b | 2.153 ± 0.05 b | ||
| Doxato (Class 3) | 1.185 ± 0.02 d | 1.872 ± 0.09 c | ||
| Mikrochori (Class 4) | 1.148 ± 0.08 c | 1.861 ± 0.09 c | ||
| 2022 | Agora (Class 1) | 1.269 ± 0.09 b | 2.113 ± 0.06 a | |
| Kali Vrysi (Class 2) | 1.281 ± 0.07 a | 1.701 ± 0.05 b | ||
| Doxato (Class 3) | 0.998 ± 0.09 d | 2.151 ± 0.09 a | ||
| Mikrochori (Class 4) | 1.082 ± 0.03 c | 1.765 ± 0.07 b |
Table 10.
Wine chemical analytical data across plots in years 2021 and 2022 for both regions. Values followed by different letters within each plot are significantly different at p < 0.05, according to Duncan’s test.
Table 10.
Wine chemical analytical data across plots in years 2021 and 2022 for both regions. Values followed by different letters within each plot are significantly different at p < 0.05, according to Duncan’s test.
| Region | Year | Plot | Vol (%) | TA (g/L) | pH |
|---|---|---|---|---|---|
| Amyndeon | 2021 | Petres (Class 1) | 13.8 ± 0.03 a | 7.30 ± 0.04 c | 3.41 ± 0.02 a |
| Lofos (Class 2) | 13.0 ± 0.02 b | 7.08 ± 0.02 d | 3.32 ± 0.01 a | ||
| Vegora (Class 3) | 13.2 ± 0.01 b | 7.64 ± 0.08 b | 3.14 ± 0.02 a | ||
| Limni (Class 4) | 12.8 ± 0.04 b | 7.87 ± 0.07 a | 3.13 ± 0.05 b | ||
| 2022 | Petres (Class 1) | 13.9 ± 0.04 a | 7.12 ± 0.03 b | 3.5 ± 0.02 ab | |
| Lofos (Class 2) | 13.2 ± 0.04 c | 6.84 ± 0.04 d | 3.61 ± 0.02 a | ||
| Vegora (Class 3) | 13.5 ± 0.01 b | 7.86 ± 0.05 a | 3.32 ± 0.01 b | ||
| Limni (Class 4) | 13.2 ± 0.02 c | 6.42 ± 0.06 c | 3.47 ± 0.01 ab | ||
| Drama | 2021 | Agora (Class 1) | 12.9 ± 0.08 a | 5.74 ± 0.02 b | 3.31 ± 0.04 a |
| Kali Vrysi (Class 2) | 12.3 ± 0.03 b | 6.28 ± 0.05 a | 3.18 ± 0.04 c | ||
| Doxato (Class 3) | 11.9 ± 0.05 c | 5.63 ± 0.08 b | 3.25 ± 0.04 b | ||
| Mikrochori (Class 4) | 11.5 ± 0.01 c | 5.49 ± 0.03 c | 3.22 ± 0.03 bc | ||
| 2022 | Agora (Class 1) | 13.1 ± 0.08 a | 5.43 ± 0.04 c | 3.32 ± 0.02 a | |
| Kali Vrysi (Class 2) | 12.6 ± 0.05 a | 6.15 ± 0.05 a | 3.17 ± 0.04 c | ||
| Doxato (Class 3) | 12.2 ± 0.03 b | 5.87 ± 0.02 b | 3.26 ± 0.02 b | ||
| Mikrochori (Class 4) | 12.3 ± 0.07 a | 5.86 ± 0.09 b | 3.20 ± 0.03 c |
Table 11.
Colour characteristics of wines produced from different plots in years 2021 and 2022 for both regions. Values followed by different letters within each plot are significantly different at p < 0.05, according to Duncan’s test.
Table 11.
Colour characteristics of wines produced from different plots in years 2021 and 2022 for both regions. Values followed by different letters within each plot are significantly different at p < 0.05, according to Duncan’s test.
| Region | Year | Plot | TP* | Intensity | Hue |
|---|---|---|---|---|---|
| Amyndeon | 2021 | Petres (Class 1) | 49.5 ± 0.5 a | 5.48 ± 0.2 b | 0.99 ± 0.2 a |
| Lofos (Class 2) | 44.4 ± 0.3 c | 6.69 ± 0.3 a | 0.85 ± 0.3 b | ||
| Vegora (Class 3) | 45.5 ± 0.2 b | 4.80 ± 0.1 c | 0.78 ± 0.3 c | ||
| Limni (Class 4) | 42.4 ± 0.2 d | 7.05 ± 0.2 a | 0.96 ± 0.4 a | ||
| 2022 | Petres (Class 1) | 52 ± 0.6 a | 5.01 ± 0.3 b | 0.79 ± 0.1 c | |
| Lofos (Class 2) | 46 ± 0.4 c | 6.38 ± 0.2 c | 1.03 ± 0.2 b | ||
| Vegora (Class 3) | 48.7 ± 0.2 b | 4.37 ± 0.4 d | 1.02 ± 0.2 b | ||
| Limni (Class 4) | 33.7 ± 0.2 d | 4.50 ± 0.1 a | 1.48 ± 0.4 a | ||
| Drama | 2021 | Agora (Class 1) | 41.8 ± 0.5 c | 7.88 ± 0.1 b | 0.72 ± 0.02 a |
| Kali Vrysi (Class 2) | 43.2 ± 0.2 a | 8.05 ± 0.2 a | 0.62 ± 0.02 c | ||
| Doxato (Class 3) | 42.4 ± 0.2 b | 6.13 ± 0.4 c | 0.66 ± 0.05 bc | ||
| Mikrochori (Class 4) | 42.6 ± 0.3 b | 6.47 ± 0.3 c | 0.59 ± 0.03 d | ||
| 2022 | Agora (Class 1) | 42.3 ± 0.2 c | 8.13 ± 0.1 b | 0.77 ± 0.03 a | |
| Kali Vrysi (Class 2) | 44.2 ± 0.3 a | 8.46 ± 0.3 a | 0.65 ± 0.01 c | ||
| Doxato (Class 3) | 42.9 ± 0.6 b | 6.35 ± 0.2 d | 0.68 ± 0.04 b | ||
| Mikrochori (Class 4) | 43.5 ± 0.4 b | 7.19 ± 0.2 c | 0.61 ± 0.02 d |
* Total phenolics measured with Folin-Ciocalteu as (mg GAE/L).
Disclaimer/Publisher’s Note: The statements, opinions and data contained in all publications are solely those of the individual author(s) and contributor(s) and not of MDPI and/or the editor(s). MDPI and/or the editor(s) disclaim responsibility for any injury to people or property resulting from any ideas, methods, instructions or products referred to in the content. |
© 2025 by the authors. Licensee MDPI, Basel, Switzerland. This article is an open access article distributed under the terms and conditions of the Creative Commons Attribution (CC BY) license (http://creativecommons.org/licenses/by/4.0/).
Copyright: This open access article is published under a Creative Commons CC BY 4.0 license, which permit the free download, distribution, and reuse, provided that the author and preprint are cited in any reuse.


