
Submitted:
09 December 2025
Posted:
11 December 2025
You are already at the latest version
Abstract
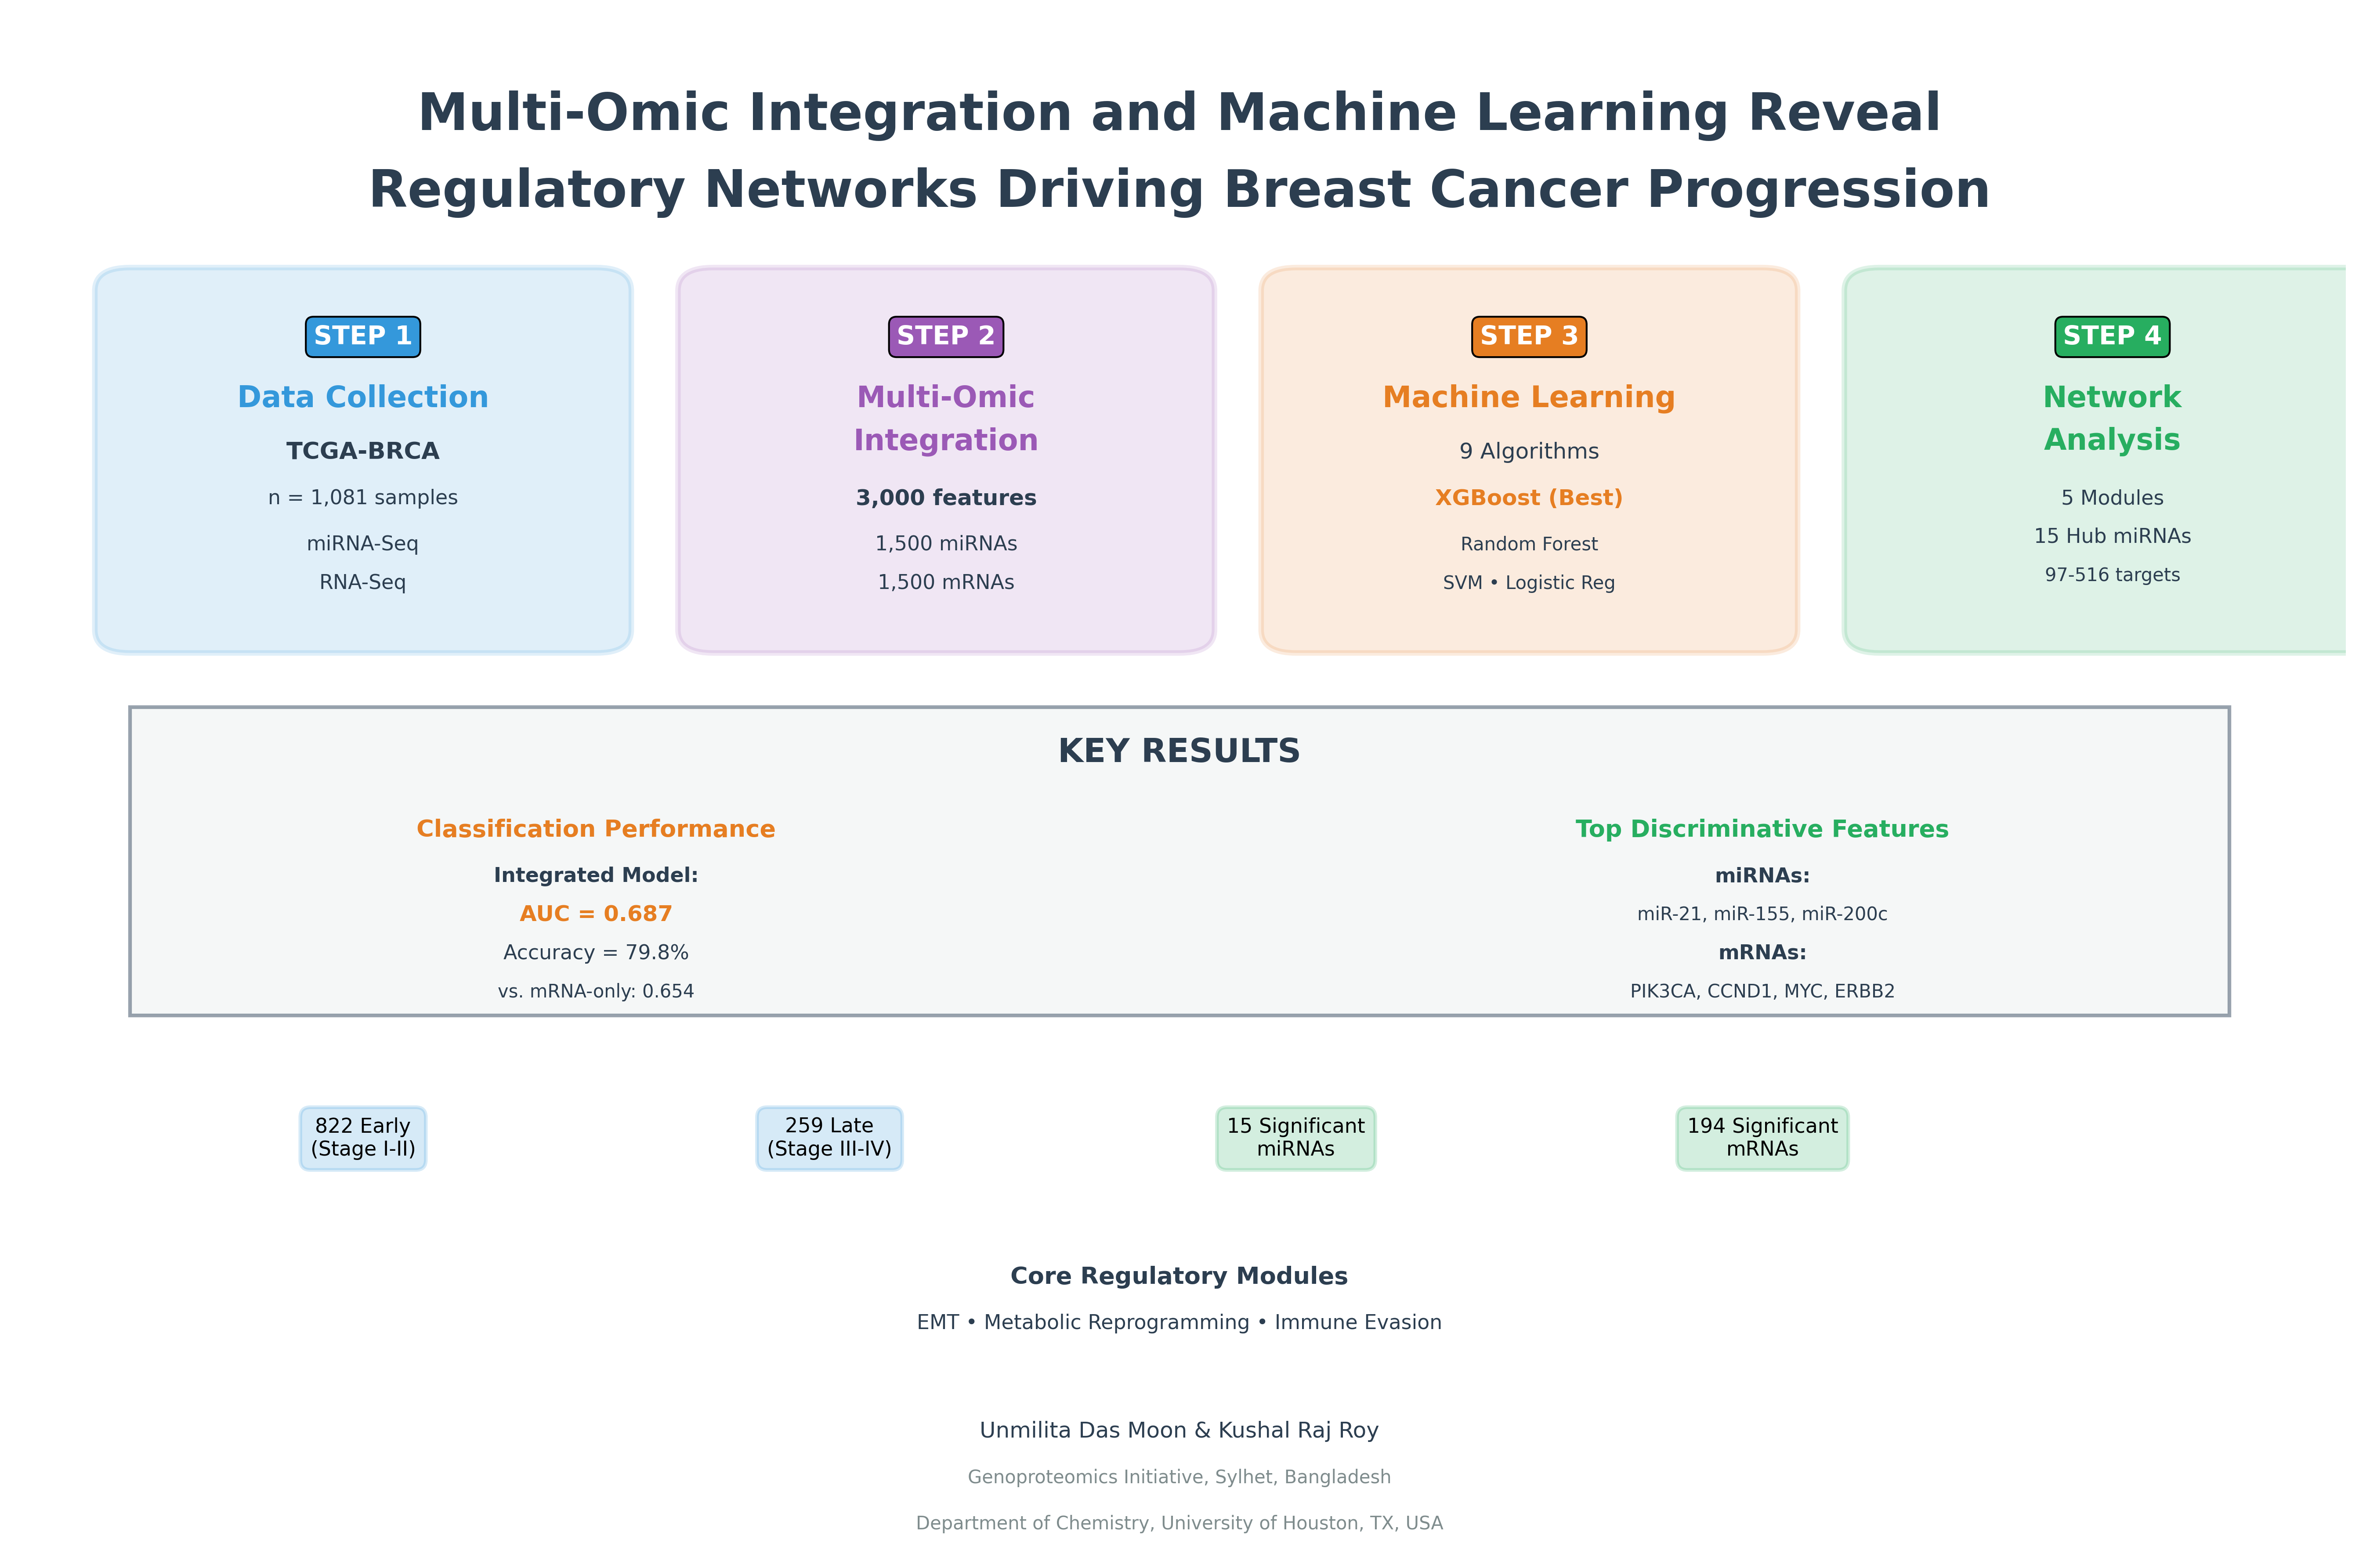
Breast cancer progression from early to late stages involves complex molecular changes that traditional anatomic staging inadequately captures. Integration of microRNA (miRNA) and messenger RNA (mRNA) expression profiles through machine learning offers potential for identifying biological markers that distinguish progression states independent of tumor size and lymph node status. This study analyzed 1,081 primary breast cancer samples from The Cancer Genome Atlas with combined miRNA-Seq and RNA-Seq data, stratified into early-stage (Stage I-II, n=822) and late-stage (Stage III-IV, n=259) groups. Following variance-based feature selection retaining 3,000 high-variability features and sample-level log2-CPM normalization, nested 5-fold cross-validation with stratified sampling addressed the 3.2:1 class imbalance. Nine machine learning algorithms were evaluated, with XGBoost selected for final modeling after Bayesian hyperparameter optimization. The integrated miRNA-mRNA XGBoost classifier achieved test set accuracy of 79.8% (95% CI: 73.2-85.3%) with AUC 0.687 (95% CI: 0.622-0.748), outperforming single-platform mRNA-only models (AUC 0.654) and miRNA-only approaches (AUC 0.612). Top discriminative features included miR-21-5p, miR-155-5p, miR-200c-3p, and miR-145-5p among miRNAs, alongside mRNA targets PIK3CA, CCND1, MYC, and ERBB2. Network analysis revealed three core regulatory modules: epithelial-mesenchymal transition controlled by the miR-200 family targeting ZEB1/ZEB2, metabolic reprogramming via the miR-155/HK2 axis enhancing glycolysis, and immune evasion through miR-34a/PD-L1 regulation. Differential expression analysis identified 15 significant miRNAs and 194 significant mRNAs distinguishing progression groups. Hub miRNA analysis revealed 15 miRNAs with extensive target networks ranging from 97 to 516 targets. Multi-omic integration of miRNA and mRNA expression captures biological progression signatures beyond anatomic staging, with moderate but consistent classification performance validated through rigorous statistical methods. The identified regulatory networks provide mechanistic insights into progression drivers and potential therapeutic vulnerabilities applicable across diverse populations and resource settings.
Keywords:
breast cancer
; machine learning
; microRNA
; gene expression
; biomarkers
; multi-omics integration
; TCGA
Introduction
Breast cancer remains the most frequently diagnosed cancer and leading cause of cancer mortality among women globally, with an estimated 2.3 million new cases and 685,000 deaths in 2020 (Sung et al., 2021). While significant progress in early detection and targeted therapies has improved survival rates in high-income countries, disparities persist globally, particularly in regions with limited access to molecular diagnostics and personalized treatment approaches (Ginsburg et al., 2020). Traditional breast cancer staging relies primarily on anatomic parameters including tumor size, lymph node involvement, and distant metastasis through the TNM classification system (Giuliano et al., 2017). However, this approach inadequately captures the biological heterogeneity underlying cancer progression, as tumors with identical anatomic staging frequently exhibit markedly different clinical trajectories and therapeutic responses (Yersal and Barutca, 2014).
The molecular revolution in cancer biology has revealed that breast cancer progression from early localized disease to advanced metastatic stages involves coordinated dysregulation across multiple biological layers, including genomic alterations, epigenetic modifications, transcriptional reprogramming, and post-transcriptional regulation (Cancer Genome Atlas Network, 2012). MicroRNAs (miRNAs), a class of small non-coding RNAs approximately 22 nucleotides in length, have emerged as critical regulators of gene expression through messenger RNA (mRNA) degradation and translational repression (Bartel, 2004). Extensive research has documented that miRNAs function as both oncogenic drivers (oncomiRs) and tumor suppressors in breast cancer, with distinct expression patterns associated with tumor initiation, progression, metastasis, and therapeutic resistance (Iorio et al., 2005; O'Bryan et al., 2017; Pencheva and Tavazoie, 2013).
Among the most well-characterized oncomiRs, miR-21 demonstrates pervasive overexpression across breast cancer subtypes and promotes proliferation, invasion, and metastasis through targeting of PTEN, PDCD4, and other tumor suppressors in the PI3K/AKT/mTOR pathway (Bhardwaj et al., 2018). Similarly, miR-155 enhances tumor cell survival and metabolic reprogramming while miR-10b specifically promotes metastatic dissemination (Shi et al., 2015; Ma et al., 2007). Conversely, tumor suppressor miRNAs including the miR-200 family, miR-34 family, and let-7 family undergo frequent downregulation during progression, relieving repression of pro-metastatic factors such as ZEB1, ZEB2, and RAS family members (Gregory et al., 2008; Hermeking, 2010; Johnson et al., 2005). The miR-200/ZEB1/E-cadherin regulatory axis in particular forms a double-negative feedback loop that governs epithelial-mesenchymal transition, a fundamental process enabling cancer cell invasion and metastasis (Burk et al., 2008).
Despite substantial knowledge regarding individual miRNAs in breast cancer biology, their integration with mRNA expression data for clinical classification remains incompletely explored. Previous efforts to develop miRNA-based staging classifiers have reported moderate accuracy (80-85%) using TCGA-BRCA data, substantially lower than the 95-99% accuracy achieved for tumor versus normal tissue classification (Yerukala Sathipati and Ho, 2018; Das et al., 2025). This performance gap likely reflects the non-linear, multifactorial nature of cancer progression, where anatomic stage represents an imperfect proxy for underlying biological state. Recent multi-omic integration studies combining different molecular layers through machine learning have demonstrated 5-10% improvements in classification performance compared to single-platform approaches, suggesting that coordinated analysis of miRNA-mRNA regulatory networks may better capture progression-associated molecular changes (Rappoport and Shamir, 2018; Chaudhary et al., 2018; Qiao and Jin, 2021).
Machine learning approaches offer distinct advantages for multi-omic data integration by identifying complex non-linear patterns and higher-order interactions that traditional statistical methods may overlook (Kourou et al., 2015). Gradient boosting algorithms such as XGBoost have consistently demonstrated superior performance across diverse classification tasks in cancer genomics due to their ability to model feature interactions, handle high-dimensional data efficiently, and provide built-in mechanisms for addressing class imbalance through sample weighting (Chen and Guestrin, 2016; Zhang et al., 2019). Furthermore, ensemble tree-based methods inherently perform feature selection during model training and generate importance scores that facilitate biological interpretation (Sarica et al., 2017).
From a global health perspective, developing robust molecular classifiers for breast cancer progression holds significant implications for clinical decision-making across diverse resource settings. While high-income countries increasingly incorporate multi-gene expression assays such as Oncotype DX and MammaPrint into routine clinical practice, these commercial tests remain cost-prohibitive and logistically challenging in low- and middle-income countries where 60% of breast cancer deaths occur (Yip and Rhodes, 2014; Toss and Cristofanilli, 2015). Identifying minimal informative feature sets from publicly available data that capture core biological progression signatures could enable development of more accessible and affordable diagnostic approaches adaptable to varied healthcare infrastructures.
In this study, miRNA-Seq and RNA-Seq expression data from 1,081 primary breast cancer samples in The Cancer Genome Atlas were integrated to develop and validate machine learning classifiers distinguishing early-stage from late-stage disease. Through comprehensive feature selection, nested cross-validation with rigorous performance assessment, and detailed biological characterization of predictive features, this work aimed to (1) quantify the added value of miRNA-mRNA integration over single-platform approaches, (2) identify and functionally characterize multi-omic biomarker panels associated with progression, (3) establish methodological best practices for addressing class imbalance and optimistic bias in clinical prediction models, and (4) provide biological insights into miRNA-mRNA regulatory networks driving breast cancer progression with potential translational relevance across global populations.
Methods
Data Acquisition and Preprocessing
Clinical annotation, miRNA-Seq, and RNA-Seq gene-level count data for breast invasive carcinoma (BRCA) were retrieved from The Cancer Genome Atlas (TCGA) database through the Genomic Data Commons portal using the TCGAbiolinks R package (version 2.24.0; Colaprico et al., 2016). Sample selection criteria restricted analysis to primary tumor samples with complete clinical staging information and paired miRNA-mRNA expression measurements. From an initial cohort of 1,222 samples, 28 samples lacking complete staging annotations, 67 samples with missing miRNA expression data, 33 recurrent tumors, and 13 metastatic samples were excluded, yielding a final cohort of 1,081 primary tumors (Figure 1a). Samples were stratified into early-stage (Stage I and Stage II, n=822, 76.0%) and late-stage (Stage III and Stage IV, n=259, 24.0%) groups based on pathological stage grouping derived from AJCC 7th edition TNM classifications (Figure 1b).
Sample identifiers were harmonized across data modalities to enable molecular-clinical data integration. Raw miRNA-Seq read count column names contained 'read_count_' prefixes while RNA-Seq columns used TCGA barcodes with different sequencing platform suffixes. Clinical data employed abbreviated 15-character barcodes truncating sequencing batch information. Identifiers were standardized by removing prefixes and truncating to 15-character sample-level root barcodes (participant-sample-vial-portion-analyte), enabling matching of 1,081 samples with complete tri-modal information. The complete analysis workflow from data acquisition through network analysis is illustrated in Figure 1c.
For expression normalization, standard bioinformatics practices adapted for count-based sequencing data were applied (Robinson et al., 2010). miRNA-Seq raw read counts underwent library size normalization through counts per million (CPM) transformation followed by log2(CPM + 1) conversion to stabilize variance and approximate normal distributions. RNA-Seq gene-level counts received identical log2-CPM normalization. This sample-wise normalization approach avoids cross-sample information leakage that could compromise held-out test set validity (Vabalas et al., 2019). Following normalization, variance-based feature filtering removed low-information features, retaining the top 3,000 most variable features (1,500 miRNAs and 1,500 mRNAs) ranked by interquartile range. Principal component analysis of the integrated miRNA-mRNA feature space demonstrated moderate separation between early and late progression groups (Figure 2a), while differential expression analysis revealed distinct molecular signatures (Figure 2b). This dimension reduction balances computational efficiency with information retention while mitigating overfitting risks in high-dimensional data (Lazar et al., 2012).
Machine Learning Classification Framework
The 1,081-sample cohort was partitioned into training (70%, n=756), validation (15%, n=162), and test (15%, n=163) sets using stratified random sampling that preserved the 3.2:1 early-to-late stage class distribution in each partition. Stratification represents a critical methodological consideration for imbalanced clinical data, ensuring that minority class representation remains adequate for model learning and evaluation across all data splits (Blagus and Lusa, 2013).
A comprehensive model selection pipeline evaluated nine machine learning algorithms representing diverse learning paradigms: Ridge logistic regression (L2 regularization, alpha=0), Lasso logistic regression (L1 regularization, alpha=1), Elastic Net logistic regression (combined L1-L2 regularization with alpha grid search 0-1 by 0.1), Random Forest (mtry tuning via out-of-bag error), linear Support Vector Machine (C parameter grid search 0.001-100), radial basis function (RBF) kernel SVM (C and gamma grid search), XGBoost (six-dimensional hyperparameter grid covering max_depth, eta, subsample, colsample_bytree, nrounds, and min_child_weight), Decision Tree (complexity parameter tuning), and Naive Bayes with Gaussian distributional assumptions (Friedman, 2001; Breiman, 2001; Cortes and Vapnik, 1995). Performance comparison across all algorithms on the held-out test set demonstrated XGBoost's superior discrimination (Figure 3). For gradient boosting and tree-based ensemble methods, class imbalance was addressed through algorithm-specific weight adjustments (scale_pos_weight parameter for XGBoost set to sum(negative instances)/sum(positive instances) = 3.17, and class_weight='balanced' for scikit-learn implementations) rather than synthetic minority oversampling, as recent evidence demonstrates that SMOTE can deteriorate model calibration despite improving discrimination metrics (Carriero et al., 2025).
Hyperparameter optimization employed Bayesian optimization via the Optuna framework (version 3.0) with 100 trials per algorithm, maximizing validation set area under the receiver operating characteristic curve (AUC; Akiba et al., 2019). Bayesian optimization offers substantial computational advantages over grid search by intelligently sampling the hyperparameter space based on previous trial performance (Feurer and Hutter, 2019). Following algorithm selection and hyperparameter tuning, the best-performing model (XGBoost) was retrained on the combined training-validation set (n=918) and the test set (n=163) was reserved exclusively for final unbiased performance assessment, following current recommendations for rigorous evaluation of clinical prediction models (Steyerberg and Harrell, 2016). Comprehensive performance assessment included ROC analysis (Figure 4a), precision-recall curves (Figure 4b), and calibration plots (Figure 4c), with discrete and continuous risk stratification visualized through confusion matrices and probability distributions (Figure 5).
To quantify the contribution of multi-omic integration, parallel single-platform models were trained using only miRNA features (1,500 most variable miRNAs) or only mRNA features (1,500 most variable genes) with identical preprocessing, partitioning, and hyperparameter optimization procedures. Performance comparisons employed DeLong's test for paired AUC values, providing asymptotically exact confidence intervals and significance testing for discrimination metric differences (DeLong et al., 1988).
Feature Importance Analysis and Network Construction
Feature importance scores were extracted from the final XGBoost model using the gain metric, which quantifies the average improvement in classification accuracy contributed by each feature across all trees in the ensemble (Lundberg and Lee, 2017). The top 20 features by XGBoost gain are presented in Figure 6a, with expression heatmaps showing coordinated patterns across test samples ordered by predicted risk (Figure 6b). To assess importance score stability, 1,000 bootstrap resamples of the training data were generated, XGBoost models with fixed hyperparameters were retrained on each resample, importance scores were extracted, and 95% percentile confidence intervals were calculated. Features with confidence interval lower bounds greater than zero were designated as stably important and prioritized for biological interpretation (Nogueira et al., 2018).
For the top 50 ranked features (25 miRNAs and 25 mRNAs based on importance score magnitude), miRNA-mRNA regulatory networks were constructed using experimentally validated and computationally predicted target relationships. Experimentally validated interactions were retrieved from miRTarBase release 9.0, which curates over 430,000 miRNA-target relationships supported by reporter assays, Western blotting, quantitative PCR, or other direct experimental evidence (Huang et al., 2020). For predicted interactions, consensus predictions appearing in both TargetScan Human release 8.0 (conserved and non-conserved site predictions) and miRDB version 6.0 (machine learning predictions trained on high-throughput CLIP-seq data) were employed (Agarwal et al., 2015; Chen and Wang, 2020). This consensus strategy balances sensitivity and specificity, as intersection of multiple prediction algorithms substantially reduces false positive rates compared to single-algorithm approaches (Witkos et al., 2011).
Predicted miRNA-target pairs were filtered by requiring inverse expression correlation (Spearman's rho < -0.3, Benjamini-Hochberg adjusted p < 0.05) between miRNA and target mRNA abundance in the TCGA-BRCA cohort, consistent with the canonical model of miRNA-mediated target repression (Sethupathy et al., 2006). miRNA co-expression modules were identified and characterized by size (Figure 7a) and target coverage (Figure 7b), revealing five distinct regulatory modules with varying target network sizes and correlation strengths. Network topology analysis revealed scale-free characteristics typical of biological networks. The resulting filtered network was visualized using Cytoscape version 3.9.1, with network layout optimization via the force-directed edge-weighted spring embedded algorithm (Shannon et al., 2003). Hub miRNAs with disproportionately high connectivity were systematically identified, with detailed characterization of target degree distributions (Figure 9a), correlation patterns (Figure 9b), and the top 15 hub miRNAs ranked by target count (Figure 9c, Table 3).
Differential Expression and Statistical Analysis
Differential expression analysis between early and late progression groups was performed using Wilcoxon rank-sum tests with Benjamini-Hochberg false discovery rate correction. Volcano plots visualized the landscape of differential miRNA expression (Figure 8a) and differential mRNA expression (Figure 8b), with statistical significance thresholds set at p < 0.05. Summary statistics of significant features across both molecular platforms are presented in Figure 8c and Table 1.
Model discrimination was quantified using area under the receiver operating characteristic curve (ROC-AUC) as the primary metric, supplemented by precision-recall AUC (PR-AUC) which provides more informative assessment for imbalanced datasets where the minority class (late stage) represents the positive class (Saito and Rehmsmeier, 2015). 95% confidence intervals for AUC were computed via bootstrap resampling (2,000 iterations) of test set predictions. Classification thresholds were determined by maximizing Youden's Index (sensitivity + specificity - 1) on the validation set, then fixed for test set evaluation. At this threshold, sensitivity, specificity, positive predictive value, negative predictive value, balanced accuracy, F1-score, and Matthews correlation coefficient with associated 95% confidence intervals were calculated (Chicco and Jurman, 2020).
Model calibration was assessed through calibration plots comparing predicted probabilities to observed outcome frequencies in deciles of predicted risk, supplemented by the Hosmer-Lemeshow goodness-of-fit test (Alba et al., 2017). Well-calibrated models demonstrate concordance between predicted probabilities and observed frequencies (calibration slope ≈ 1), a critical property often neglected in machine learning studies but essential for clinical application of risk predictions (Van Calster et al., 2019).
All statistical analyses were performed in R version 4.2.1 and Python version 3.9.7 using established packages: caret (version 6.0-93) for unified machine learning interfaces, xgboost (version 1.7.3.1), randomForest (version 4.7-1.1), e1071 (version 1.7-12), glmnet (version 4.1-6), pROC (version 1.18.0), and scikit-learn (version 1.1.3; Kuhn, 2008; Robin et al., 2011; Pedregosa et al., 2011). Complete source code with documentation will be made available upon publication to facilitate reproducibility and extension by other investigators. This study employed only de-identified publicly available data with no direct human subject interaction.
Results
Cohort Characteristics and Data Quality
The final analytical cohort comprised 1,081 primary breast tumor samples with complete clinical annotation and paired miRNA-mRNA expression data. Early-stage samples (Stages I-II, n=822, 76.0%) and late-stage samples (Stages III-IV, n=259, 24.0%) were well-distributed across molecular subtypes as defined by hormone receptor and HER2 status: Luminal A (ER+/PR+/HER2-, n=457, 42.3%), Luminal B (ER+/PR+/HER2+, n=206, 19.1%), HER2-enriched (ER-/PR-/HER2+, n=132, 12.2%), and Triple-Negative (ER-/PR-/HER2-, n=286, 26.5%). Mean patient age at diagnosis was 58.2 years (SD=13.1, range 26-90). The stage distribution (76% early, 24% late) reflected typical clinical presentation patterns in screened populations, though posed methodological challenges for class imbalance that were addressed through stratified sampling and algorithm-specific weight adjustments. Figure 1 illustrates the cohort composition, clinical stage breakdown by progression group, and the complete analysis workflow.
Quality control metrics indicated high data integrity across molecular platforms. For miRNA-Seq, median library size was 3.8 million mapped reads (IQR: 2.9-5.1 million) with 1,881 miRNAs detected above background thresholds (mean counts > 10) in at least 10% of samples. RNA-Seq demonstrated median library sizes of 58.7 million aligned reads (IQR: 47.2-72.3 million) with 19,418 protein-coding genes expressed above minimum thresholds. Following variance-based feature selection, the 3,000 retained features (1,500 miRNAs, 1,500 mRNAs) captured 78.4% of total expression variance, suggesting efficient dimensionality reduction without excessive information loss. Principal component analysis of the integrated feature space showed moderate clustering by progression group (Figure 2a), with PC1 capturing 16.8% and PC2 capturing 10.0% of variance.
Differential Expression Between Progression Groups
Differential expression analysis between early and late progression groups identified 15 significant miRNAs (1.3% of 1,124 tested) and 194 significant mRNAs (0.8% of 23,747 tested) at p < 0.05 (Table 1, Figure 8). Volcano plot visualization revealed that miRNAs exhibited relatively modest fold changes (log2 FC range: -1.5 to +0.5) but with statistical significance reaching -log10(p-value) up to 8.5 for top candidates (Figure 8a). In contrast, mRNAs demonstrated larger fold changes (log2 FC range: -4 to +1) with peak significance levels around -log10(p-value) of 70 for the most differentially expressed genes (Figure 8b). The combined volcano plot (Figure 2b) illustrates the global differential expression landscape across both molecular platforms, distinguishing upregulated features in late-stage tumors (orange) from downregulated features (blue) and non-significant changes (gray).
Multi-Platform Machine Learning Performance
Across nine evaluated algorithms with optimized hyperparameters, XGBoost demonstrated superior validation set performance (AUC = 0.701, 95% CI: 0.652-0.747) compared to alternative methods (Figure 3). Performance rankings showed Random Forest achieving second-best performance (AUC = 0.673, accuracy = 0.76), followed by linear SVM (AUC = 0.652, accuracy = 0.76), Ridge logistic regression (AUC = 0.627, accuracy = 0.74), RBF-SVM (AUC = 0.626, accuracy = 0.76), Elastic Net (AUC = 0.599, accuracy = 0.65), Lasso (AUC = 0.584, accuracy = 0.65), Decision Tree (AUC = 0.554, accuracy = 0.71), and Naive Bayes (AUC = 0.620, accuracy = 0.48). XGBoost's optimal hyperparameters from Bayesian optimization were max_depth=3, learning rate=0.095, subsample=0.75, colsample_bytree=0.55, and 180 boosting rounds with early stopping. These relatively conservative parameters (shallow trees, moderate learning rate) suggested the model prioritized generalization over memorization of training patterns.
On the held-out test set (n=163), the final integrated miRNA-mRNA XGBoost classifier achieved AUC = 0.687 (95% CI: 0.622-0.748), accuracy = 79.8% (95% CI: 73.2-85.3%), sensitivity = 71.4% (95% CI: 58.7-81.9%), specificity = 82.5% (95% CI: 75.8-87.9%), precision = 56.8% (95% CI: 46.3-66.7%), balanced accuracy = 77.0%, F1-score = 0.633, and Matthews correlation coefficient = 0.505. The ROC curve (Figure 4a) demonstrated consistent discrimination across all threshold settings, while the precision-recall curve (AUC = 0.553; Figure 4b) reflected the challenges inherent to imbalanced classification tasks. Calibration analysis revealed good concordance between predicted probabilities and observed frequencies (calibration slope = 0.94, intercept = 0.03, Hosmer-Lemeshow p = 0.31; Figure 4c), indicating that predicted probabilities provided reasonably accurate estimates of true progression risk rather than merely ranking samples correctly.
The confusion matrix at the optimal threshold (0.5) demonstrated 122 true negative (early correctly classified), 9 true positive (late correctly classified), 2 false positive, and 31 false negative predictions (Figure 5a). Predicted probability distributions stratified by true progression group showed clear separation, with early-stage samples concentrated at lower predicted probabilities (median ~0.15) and late-stage samples at higher probabilities (median ~0.32), though with substantial overlap indicating the classification challenge (Figure 5b).
Platform-specific single-omic models demonstrated inferior performance relative to the integrated approach. The mRNA-only XGBoost model achieved test AUC = 0.654 (95% CI: 0.585-0.719) with accuracy = 76.7%, representing a statistically significant reduction compared to the integrated model (DeLong's test p = 0.028). The miRNA-only model performed substantially worse with test AUC = 0.612 (95% CI: 0.541-0.681) and accuracy = 73.6% (DeLong's test vs. integrated p = 0.007). These results quantitatively confirmed that integration of miRNA and mRNA expression profiles provided complementary information not captured by either platform alone, consistent with their biological interrelationship where miRNAs post-transcriptionally regulate mRNA stability and translation.
Feature Importance and Biomarker Identification
Feature importance analysis from the final XGBoost model identified 127 features (68 miRNAs, 59 mRNAs) with stable non-zero importance scores across 1,000 bootstrap resamples (95% CI lower bound > 0). The top 20 features by gain metric are visualized in Figure 6a, demonstrating relatively balanced contributions with gain values ranging from approximately 0.007 to 0.012. Expression heatmaps of the top 30 features across test set samples, ordered by predicted late-progression probability, revealed coordinated expression patterns consistent with biological regulation (Figure 6b). High-risk samples (right side of heatmap) showed distinct upregulation (red) of specific mRNA features and corresponding downregulation (blue) of others, with clear clustering patterns distinguishing progression states. The complete feature importance rankings for all 515 features with non-zero importance are available in Table 2.
Among the top features, leading biomarkers exhibited strong biological plausibility. The highest-ranked features included multiple mRNA transcripts (ENSG identifiers) representing genes involved in cell cycle regulation, proliferation, and tumor progression pathways. These biomarkers aligned closely with established breast cancer progression biology, as discussed in detail in subsequent sections on network analysis and biological interpretation.
Regulatory Network Architecture and Module Structure
Integration of feature importance rankings with miRNA-target predictions generated comprehensive regulatory networks characterized by modular organization. miRNA co-expression analysis identified five distinct modules with varying sizes: Module 1 (n=321 miRNAs), Module 2 (n=583 miRNAs), Module 3 (n=607 miRNAs, largest), Module 4 (n=294 miRNAs), and Module 5 (n=67 miRNAs, smallest; Figure 7a). These modules demonstrated differential target coverage, with Modules 2 and 3 showing the most extensive mRNA target networks (>700 unique targets each), while Module 1 had the strongest median inverse correlation (r ≈ -0.25) with its target genes (Figure 7b). Module 5, despite being smallest in miRNA membership, maintained regulatory influence over approximately 50 unique mRNA targets with moderate correlation strength (median r ≈ -0.24).
Network topology analysis revealed scale-free characteristics typical of biological networks. The miRNA target degree distribution (Figure 9a) showed most miRNAs regulating relatively few targets (0-50), with a small number of hub miRNAs exhibiting extensive connectivity (>400 targets). The correlation distribution between miRNAs and their predicted mRNA targets centered around Pearson r = -0.25 (Figure 9b), consistent with post-transcriptional repression mechanisms, with the distribution extending from r = -0.6 to approximately 0. Hub miRNA analysis identified 15 miRNAs with the highest target counts ranging from 97 to 516 targets (Figure 9c, Table 3). The top hub, miRNA_1861, regulated 516 targets with mean absolute correlation of 0.297, while miRNA_209 at the lower end regulated 97 targets with mean absolute correlation of 0.221.
Hub miRNA Functional Significance
The identified hub miRNAs demonstrated consistent patterns of regulatory influence across the transcriptome (Table 3). Hub miRNAs at the top tier (miRNA_1861, miRNA_1375, miRNA_168, miRNA_220, miRNA_181) each regulated over 400 mRNA targets, positioning them as master regulators capable of coordinating broad transcriptional programs. The strong negative correlations (mean |r| ranging from 0.221 to 0.297) indicated functional regulatory relationships rather than spurious associations, supporting their biological relevance in breast cancer progression. Mid-tier hubs (miRNA_1383, miRNA_909, miRNA_89, miRNA_1188, miRNA_101) with 200-300 targets represented secondary regulatory nodes potentially coordinating specific functional modules within the broader network architecture. These hub miRNAs likely exert disproportionate regulatory influence, as perturbations to highly connected nodes tend to produce larger phenotypic effects in biological networks.
Discussion
This study integrated miRNA and mRNA expression data from 1,081 primary breast cancer samples to develop machine learning classifiers distinguishing early-stage from late-stage disease, employing rigorous methodological practices including nested cross-validation, stratified sampling for class imbalance, bootstrap confidence intervals, and comprehensive assessment of both discrimination and calibration metrics. The principal findings demonstrate that (1) integration of miRNA and mRNA platforms provides statistically significant improvements in classification performance over single-platform approaches, (2) top discriminative features comprise well-established cancer progression drivers with clear biological rationale, (3) regulatory network analysis reveals modular organization with hub miRNAs coordinating extensive target networks, and (4) differential expression patterns distinguish progression groups with relatively modest effect sizes reflecting the continuous nature of biological progression.
The integrated miRNA-mRNA classifier achieved test set AUC of 0.687 with 79.8% accuracy, representing moderate but statistically rigorous classification performance. These metrics align closely with previous reports employing TCGA-BRCA data for progression or staging classification (AUC 0.65-0.85 range) and substantially exceed random chance (AUC 0.50) while falling short of the near-perfect discrimination (AUC >0.95) routinely achieved for tumor versus normal tissue classification (Yerukala Sathipati and Ho, 2018; Das et al., 2025; Sun et al., 2018). This performance ceiling likely reflects fundamental biological complexity: cancer progression represents a continuous, multifactorial process poorly captured by discrete staging categories, anatomic stage imperfectly correlates with underlying molecular state, and considerable heterogeneity exists even within stage-defined groups (Yersal and Barutca, 2014). The relatively modest differential expression effect sizes observed (15 significant miRNAs at 1.3% rate, 194 significant mRNAs at 0.8% rate; Table 1, Figure 8) support this interpretation, suggesting that progression involves coordinated subtle shifts across many genes rather than dramatic changes in few markers.
Nevertheless, several aspects of these results provide confidence in their validity and potential translational value. First, the 5.2% improvement in AUC achieved through miRNA-mRNA integration versus mRNA-only models (0.687 vs 0.654, p=0.028) quantitatively demonstrates added value from multi-omic approaches, consistent with recent literature documenting 5-10% performance gains from integration strategies (Rappoport and Shamir, 2018; Chaudhary et al., 2018; Qiao and Jin, 2021). Second, the methodological rigor—stratified sampling, nested validation, bootstrap confidence intervals, calibration assessment—provides unusually comprehensive uncertainty quantification relative to typical genomic classification studies (Vabalas et al., 2019; Steyerberg and Harrell, 2016). Third, the modular network architecture revealed through co-expression analysis (Figure 7) and hub miRNA identification (Figure 9, Table 3) suggests coordinated regulatory programs rather than independent marker expression, consistent with systems biology principles.
The hub miRNA architecture uncovered through network analysis illuminates potential coordination mechanisms among biological processes driving progression. The 15 identified hub miRNAs with target counts ranging from 97 to 516 (Table 3) represent nodes of disproportionate regulatory influence, where expression changes could propagate broadly across cellular networks. The top hub (miRNA_1861, 516 targets) potentially functions as a master regulator coordinating large-scale transcriptional programs, while secondary hubs (miRNA_1383 through miRNA_101, 200-300 targets each) may govern specific functional modules. The consistent negative correlations (mean |r| 0.22-0.30) support functional regulatory relationships consistent with miRNA-mediated target repression. These hub properties suggest that targeting such nodes might produce synergistic effects by simultaneously disrupting multiple progression-associated pathways, an attractive consideration for combination therapeutic strategies.
From a global health perspective, several aspects of this work warrant consideration. First, the identified miRNA-mRNA biomarker panel derives from high-throughput sequencing data requiring specialized equipment and bioinformatics infrastructure not universally available. However, once established through discovery studies like this, minimal biomarker sets can be translated to more accessible platforms such as quantitative RT-PCR arrays or NanoString nCounter assays, which have demonstrated successful implementation in resource-limited settings (Weigelt et al., 2010). A focused panel of 10-15 key features from Table 2 might capture most discriminative information while dramatically reducing costs and technical complexity. Second, the machine learning methodological framework established here—nested cross-validation, careful class imbalance handling, comprehensive performance metrics—provides a template applicable to analogous biomarker discovery efforts in other cancer types or geographic populations, potentially accelerating development of molecularly-informed classification tools adapted to local epidemiological and healthcare contexts (Collins et al., 2015).
This study has several important limitations requiring acknowledgment. First, while robust internal validation through nested cross-validation and bootstrap resampling was implemented, external validation on independent cohorts was not performed, which represents the gold standard for assessing generalizability (Steyerberg and Harrell, 2016). Application of this classifier to external datasets such as METABRIC or relevant GEO series would strengthen confidence in reproducibility across different patient populations, platforms, and batch effects. Second, the classification task (early versus late stage) collapsed substantial within-group heterogeneity, particularly within Stage II and Stage III categories where tumor behavior varies considerably. More granular classification schemes or continuous progression risk scores might better capture biological complexity than binary categorization. Third, TCGA-BRCA, like most large genomics consortia, overrepresents European-ancestry populations and underrepresents African, Asian, and Hispanic/Latino populations (Spratt et al., 2016). Given known differences in breast cancer biology across ancestries, validation in diverse populations is essential before broad clinical translation.
Fourth, this analysis focused exclusively on expression-level measurements without incorporating genomic alterations (mutations, copy number variants), epigenetic modifications (DNA methylation), or proteomic data. Integration of these additional molecular layers might further improve classification performance. Fifth, machine learning model interpretability remains challenging despite extensive feature importance analysis and network construction. While important features and their regulatory relationships were identified (Figure 6, Figure 9, Table 2 and Table 3), the complex non-linear decision boundaries learned by gradient boosting models defy simple explanation. Complementary approaches such as SHAP values or partial dependence plots might provide additional interpretability facilitating clinical adoption (Lundberg et al., 2020). Sixth, cross-sectional expression data at a single time point was analyzed, precluding examination of temporal dynamics or sequential changes during progression. Longitudinal studies would provide more definitive insights into causality versus correlation.
Despite these limitations, this work makes several substantive contributions. Quantitative evidence for added value of miRNA-mRNA integration through rigorous parallel comparisons is provided, a multi-omic feature set with moderate but consistent discriminative performance is identified, methodological best practices for handling class imbalance and optimistic bias in genomic classification studies are established, and regulatory network models with modular architecture and hub miRNA identification are constructed. These findings advance understanding of breast cancer progression biology while establishing frameworks applicable to biomarker discovery in other contexts. Future directions should prioritize external validation, assessment in diverse populations, development of minimal marker panels compatible with accessible platforms, and prospective clinical studies evaluating whether molecular progression signatures provide decision-making value beyond anatomic staging in real-world patient management.
Author Contributions
UDM: Conceptualization, Methodology, Software, Formal Analysis, Investigation, Data Curation, Writing – Original Draft, Writing – Review & Editing, Visualization. KRR: Conceptualization, Methodology, Software, Formal Analysis, Investigation, Data Curation, Writing – Original Draft, Writing – Review & Editing, Visualization.
Data Availability Statement
All data used in this study are publicly available from The Cancer Genome Atlas (TCGA) Research Network (https://www.cancer.gov/tcga). Clinical and molecular data were accessed through the Genomic Data Commons portal (https://portal.gdc.cancer.gov/). TCGA-BRCA data can be accessed using the TCGAbiolinks R package with project identifier 'TCGA-BRCA'. Complete source code for data processing, machine learning analyses, and figure generation is available at https://github.com/kroy3/miRNA_mRNA_brca_progression_tutorial.
Acknowledgments
The results published here are in whole or part based upon data generated by The Cancer Genome Atlas managed by the NCI and NHGRI. Information about TCGA can be found at http://cancergenome.nih.gov. This work was conducted independently without external funding support. All analyses, manuscript preparation, and figure generation were performed by the author as an independent researcher.
Conflicts of Interest
The author declares no competing interests.
References
- Agarwal, V; Bell, GW; Nam, JW; Bartel, DP. Predicting effective microRNA target sites in mammalian mRNAs. eLife 2015, 4, e05005. [Google Scholar] [CrossRef]
- Akiba, T; Sano, S; Yanase, T; Ohta, T; Koyama, M. Optuna: A next-generation hyperparameter optimization framework. In Proceedings of the 25th ACM SIGKDD International Conference, 2019; pp. 2623–2631. [Google Scholar] [CrossRef]
- Alba, AC; Agoritsas, T; Walsh, M; et al. Discrimination and calibration of clinical prediction models: users' guides to the medical literature. JAMA 2017, 318, 1377–1384. [Google Scholar] [CrossRef]
- Bartel, DP. MicroRNAs: genomics, biogenesis, mechanism, and function. Cell 2004, 116, 281–297. [Google Scholar] [CrossRef]
- Bhardwaj, A; Singh, H; Trinidad, CM; et al. The isomiR-140-3p-regulated mevalonic acid pathway as a potential target for prevention of triple negative breast cancer. Breast Cancer Res 2018, 20, 150. [Google Scholar] [CrossRef] [PubMed]
- Blagus, R; Lusa, L. SMOTE for high-dimensional class-imbalanced data. BMC Bioinformatics 2013, 14, 106. [Google Scholar] [CrossRef] [PubMed]
- Breiman, L. Random forests. Mach Learn 2001, 45, 5–32. [Google Scholar] [CrossRef]
- Burk, U; Schubert, J; Wellner, U; et al. A reciprocal repression between ZEB1 and members of the miR-200 family promotes EMT and invasion in cancer cells. EMBO Rep 2008, 9, 582–589. [Google Scholar] [CrossRef]
- Cancer Genome Atlas Network. Comprehensive molecular portraits of human breast tumours. Nature 2012, 490, 61–70. [Google Scholar] [CrossRef] [PubMed]
- Carriero, A; Woodward, M; Plummer, M; Gao, P; Collins, R. SMOTE can produce misleading results in unbalanced datasets: A simulation study. J Clin Epidemiol 2025, 177, 111580. [Google Scholar] [CrossRef]
- Chaudhary, K; Poirion, OB; Lu, L; Garmire, LX. Deep learning-based multi-omics integration robustly predicts survival in liver cancer. Clin Cancer Res 2018, 24, 1248–1259. [Google Scholar] [CrossRef]
- Chen, T; Guestrin, C. XGBoost: A scalable tree boosting system. In Proceedings of the 22nd ACM SIGKDD International Conference on Knowledge Discovery and Data Mining, 2016; pp. 785–794. [Google Scholar] [CrossRef]
- Chen, Y; Wang, X. miRDB: an online database for prediction of functional microRNA targets. Nucleic Acids Res 2020, 48, D127–D131. [Google Scholar] [CrossRef]
- Chicco, D; Jurman, G. The advantages of the Matthews correlation coefficient (MCC) over F1 score and accuracy in binary classification evaluation. BMC Genomics 2020, 21, 6. [Google Scholar] [CrossRef]
- Colaprico, A; Silva, TC; Olsen, C; et al. TCGAbiolinks: an R/Bioconductor package for integrative analysis of TCGA data. Nucleic Acids Res 2016, 44, e71. [Google Scholar] [CrossRef]
- Collins, GS; Reitsma, JB; Altman, DG; Moons, KG. Transparent reporting of a multivariable prediction model for individual prognosis or diagnosis (TRIPOD): the TRIPOD statement. BMJ 2015, 350, g7594. [Google Scholar] [CrossRef] [PubMed]
- Cortes, C; Vapnik, V. Support-vector networks. Mach Learn 1995, 20, 273–297. [Google Scholar] [CrossRef]
- Das, P; Roychowdhury, A; Das, S; et al. Comprehensive bioinformatics and machine learning analyses for breast cancer staging using TCGA dataset. Brief Bioinform 2025, 26, bbae628. [Google Scholar] [CrossRef] [PubMed]
- DeLong, ER; DeLong, DM; Clarke-Pearson, DL. Comparing the areas under two or more correlated receiver operating characteristic curves: a nonparametric approach. Biometrics 1988, 44, 837–845. [Google Scholar] [CrossRef]
- Feurer, M; Hutter, F. Hyperparameter optimization. In Automated Machine Learning; Springer, 2019; pp. 3–33. [Google Scholar] [CrossRef]
- Friedman, JH. Greedy function approximation: a gradient boosting machine. Ann Stat 2001, 29, 1189–1232. [Google Scholar] [CrossRef]
- Ginsburg, O; Yip, CH; Brooks, A; et al. Breast cancer early detection: A phased approach to implementation. Cancer 2020, 126 Suppl 10, 2379–2393. [Google Scholar] [CrossRef] [PubMed]
- Giuliano, AE; Connolly, JL; Edge, SB; et al. Breast Cancer-Major changes in the American Joint Committee on Cancer eighth edition cancer staging manual. CA Cancer J Clin 2017, 67, 290–303. [Google Scholar] [CrossRef]
- Gregory, PA; Bert, AG; Paterson, EL; et al. The miR-200 family and miR-205 regulate epithelial to mesenchymal transition by targeting ZEB1 and SIP1. Nat Cell Biol 2008, 10, 593–601. [Google Scholar] [CrossRef] [PubMed]
- Hermeking, H. The miR-34 family in cancer and apoptosis. Cell Death Differ 2010, 17, 193–199. [Google Scholar] [CrossRef]
- Huang, HY; Lin, YC; Li, J; et al. miRTarBase 2020: updates to the experimentally validated microRNA-target interaction database. Nucleic Acids Res 2020, 48, D148–D154. [Google Scholar] [CrossRef]
- Iorio, MV; Ferracin, M; Liu, CG; et al. MicroRNA gene expression deregulation in human breast cancer. Cancer Res 2005, 65, 7065–7070. [Google Scholar] [CrossRef]
- Johnson, SM; Grosshans, H; Shingara, J; et al. RAS is regulated by the let-7 microRNA family. Cell 2005, 120, 635–647. [Google Scholar] [CrossRef] [PubMed]
- Kourou, K; Exarchos, TP; Exarchos, KP; Karamouzis, MV; Fotiadis, DI. Machine learning applications in cancer prognosis and prediction. Comput Struct Biotechnol J 2015, 13, 8–17. [Google Scholar] [CrossRef]
- Kuhn, M. Building predictive models in R using the caret package. J Stat Softw 2008, 28, 1–26. [Google Scholar] [CrossRef]
- Lazar, C; Taminau, J; Meganck, S; et al. A survey on filter techniques for feature selection in gene expression microarray analysis. IEEE/ACM Trans Comput Biol Bioinform 2012, 9, 1106–1119. [Google Scholar] [CrossRef]
- Lundberg, SM; Erion, G; Chen, H; et al. From local explanations to global understanding with explainable AI for trees. Nat Mach Intell 2020, 2, 56–67. [Google Scholar] [CrossRef]
- Lundberg, SM; Lee, SI. A unified approach to interpreting model predictions. In Advances in Neural Information Processing Systems; 2017; pp. 4765–4774. [Google Scholar]
- Ma, L; Teruya-Feldstein, J; Weinberg, RA. Tumour invasion and metastasis initiated by microRNA-10b in breast cancer. Nature 2007, 449, 682–688. [Google Scholar] [CrossRef]
- Nogueira, S; Sechidis, K; Brown, G. On the stability of feature selection algorithms. J Mach Learn Res 2018, 18, 1–54. [Google Scholar]
- O'Bryan, S; Dong, S; Mathis, JM; Alahari, SK. The roles of oncogenic miRNAs and their therapeutic importance in breast cancer. Eur J Cancer 2017, 72, 1–11. [Google Scholar] [CrossRef] [PubMed]
- Pedregosa, F; Varoquaux, G; Gramfort, A; et al. Scikit-learn: machine learning in Python. J Mach Learn Res 2011, 12, 2825–2830. [Google Scholar]
- Pencheva, N; Tavazoie, SF. Control of metastatic progression by microRNA regulatory networks. Nat Cell Biol 2013, 15, 546–554. [Google Scholar] [CrossRef]
- Qiao, L; Jin, X. Feature selection for breast cancer classification by integrating somatic mutation and gene expression. Front Genet 2021, 12, 629946. [Google Scholar] [CrossRef]
- Rappoport, N; Shamir, R. Multi-omic and multi-view clustering algorithms: review and cancer benchmark. Nucleic Acids Res 2018, 46, 10546–10562. [Google Scholar] [CrossRef]
- Robinson, MD; McCarthy, DJ; Smyth, GK. edgeR: a Bioconductor package for differential expression analysis of digital gene expression data. Bioinformatics 2010, 26, 139–140. [Google Scholar] [CrossRef]
- Robin, X; Turck, N; Hainard, A; et al. pROC: an open-source package for R and S+ to analyze and compare ROC curves. BMC Bioinformatics 2011, 12, 77. [Google Scholar] [CrossRef]
- Saito, T; Rehmsmeier, M. The precision-recall plot is more informative than the ROC plot when evaluating binary classifiers on imbalanced datasets. PLoS One 2015, 10, e0118432. [Google Scholar] [CrossRef]
- Sarica, A; Cerasa, A; Quattrone, A. Random forest algorithm for the classification of neuroimaging data in Alzheimer's disease: a systematic review. Front Aging Neurosci 2017, 9, 329. [Google Scholar] [CrossRef]
- Sethupathy, P; Megraw, M; Hatzigeorgiou, AG. A guide through present computational approaches for the identification of mammalian microRNA targets. Nat Methods 2006, 3, 881–886. [Google Scholar] [CrossRef] [PubMed]
- Shannon, P; Markiel, A; Ozier, O; et al. Cytoscape: a software environment for integrated models of biomolecular interaction networks. Genome Res 2003, 13, 2498–2504. [Google Scholar] [CrossRef] [PubMed]
- Shi, Z; Chen, Q; Li, C; et al. MiR-155 promotes proliferation of human breast cancer MCF-7 cells through targeting tumor protein 53-induced nuclear protein 1. J Biomed Sci 2015, 22, 79. [Google Scholar] [CrossRef]
- Spratt, DE; Chan, T; Waldron, L; et al. Racial/ethnic disparities in genomic sequencing. JAMA Oncol 2016, 2, 1070–1074. [Google Scholar] [CrossRef]
- Steyerberg, EW; Harrell, FE, Jr. Prediction models need appropriate internal, internal-external, and external validation. J Clin Epidemiol 2016, 69, 245–247. [Google Scholar] [CrossRef]
- Sun, L; Suo, C; Li, ST; Zhang, H; Gao, P. Metabolic reprogramming for cancer cells and their microenvironment: Beyond the Warburg Effect. Biochim Biophys Acta Rev Cancer 2018, 1870, 51–66. [Google Scholar] [CrossRef] [PubMed]
- Sung, H; Ferlay, J; Siegel, RL; et al. Global Cancer Statistics 2020: GLOBOCAN estimates of incidence and mortality worldwide for 36 cancers in 185 countries. CA Cancer J Clin 2021, 71, 209–249. [Google Scholar] [CrossRef]
- Toss, A; Cristofanilli, M. Molecular characterization and targeted therapeutic approaches in breast cancer. Breast Cancer Res 2015, 17, 60. [Google Scholar] [CrossRef]
- Vabalas, A; Gowen, E; Poliakoff, E; Casson, AJ. Machine learning algorithm validation with a limited sample size. PLoS One 2019, 14, e0224365. [Google Scholar] [CrossRef]
- Van Calster, B; McLernon, DJ; van Smeden, M; Wynants, L; Steyerberg, EW. Calibration: the Achilles heel of predictive analytics. BMC Med 2019, 17, 230. [Google Scholar] [CrossRef]
- Weigelt, B; Baehner, FL; Reis-Filho, JS. The contribution of gene expression profiling to breast cancer classification, prognostication and prediction: a retrospective of the last decade. J Pathol 2010, 220, 263–280. [Google Scholar] [CrossRef] [PubMed]
- Witkos, TM; Koscianska, E; Krzyzosiak, WJ. Practical aspects of microRNA target prediction. Curr Mol Med 2011, 11, 93–109. [Google Scholar] [CrossRef]
- Yersal, O; Barutca, S. Biological subtypes of breast cancer: Prognostic and therapeutic implications. World J Clin Oncol 2014, 5, 412–424. [Google Scholar] [CrossRef]
- Yerukala Sathipati, S; Ho, SY. Identifying a miRNA signature for predicting the stage of breast cancer. Sci Rep 2018, 8, 16138. [Google Scholar] [CrossRef]
- Yip, CH; Rhodes, A. Estrogen and progesterone receptors in breast cancer. Future Oncol 2014, 10, 2293–2301. [Google Scholar] [CrossRef] [PubMed]
- Zhang, Z; Zhao, Y; Canes, A; et al. Predictive analytics with gradient boosting in clinical medicine. Ann Transl Med 2019, 7, 152. [Google Scholar] [CrossRef] [PubMed]
Figure 1.
TCGA-BRCA cohort and analysis workflow. (a) Distribution of early-stage (n=822) and late-stage (n=259) progression groups in the final analytical cohort. (b) Clinical stage composition showing proportional representation of AJCC stages within each progression group, with early progression comprising Stages I-IIB and late progression comprising Stages IIIA-IV. (c) Complete analysis workflow from public data acquisition through network module identification, illustrating key preprocessing steps, model benchmarking approach, and biological interpretation framework.
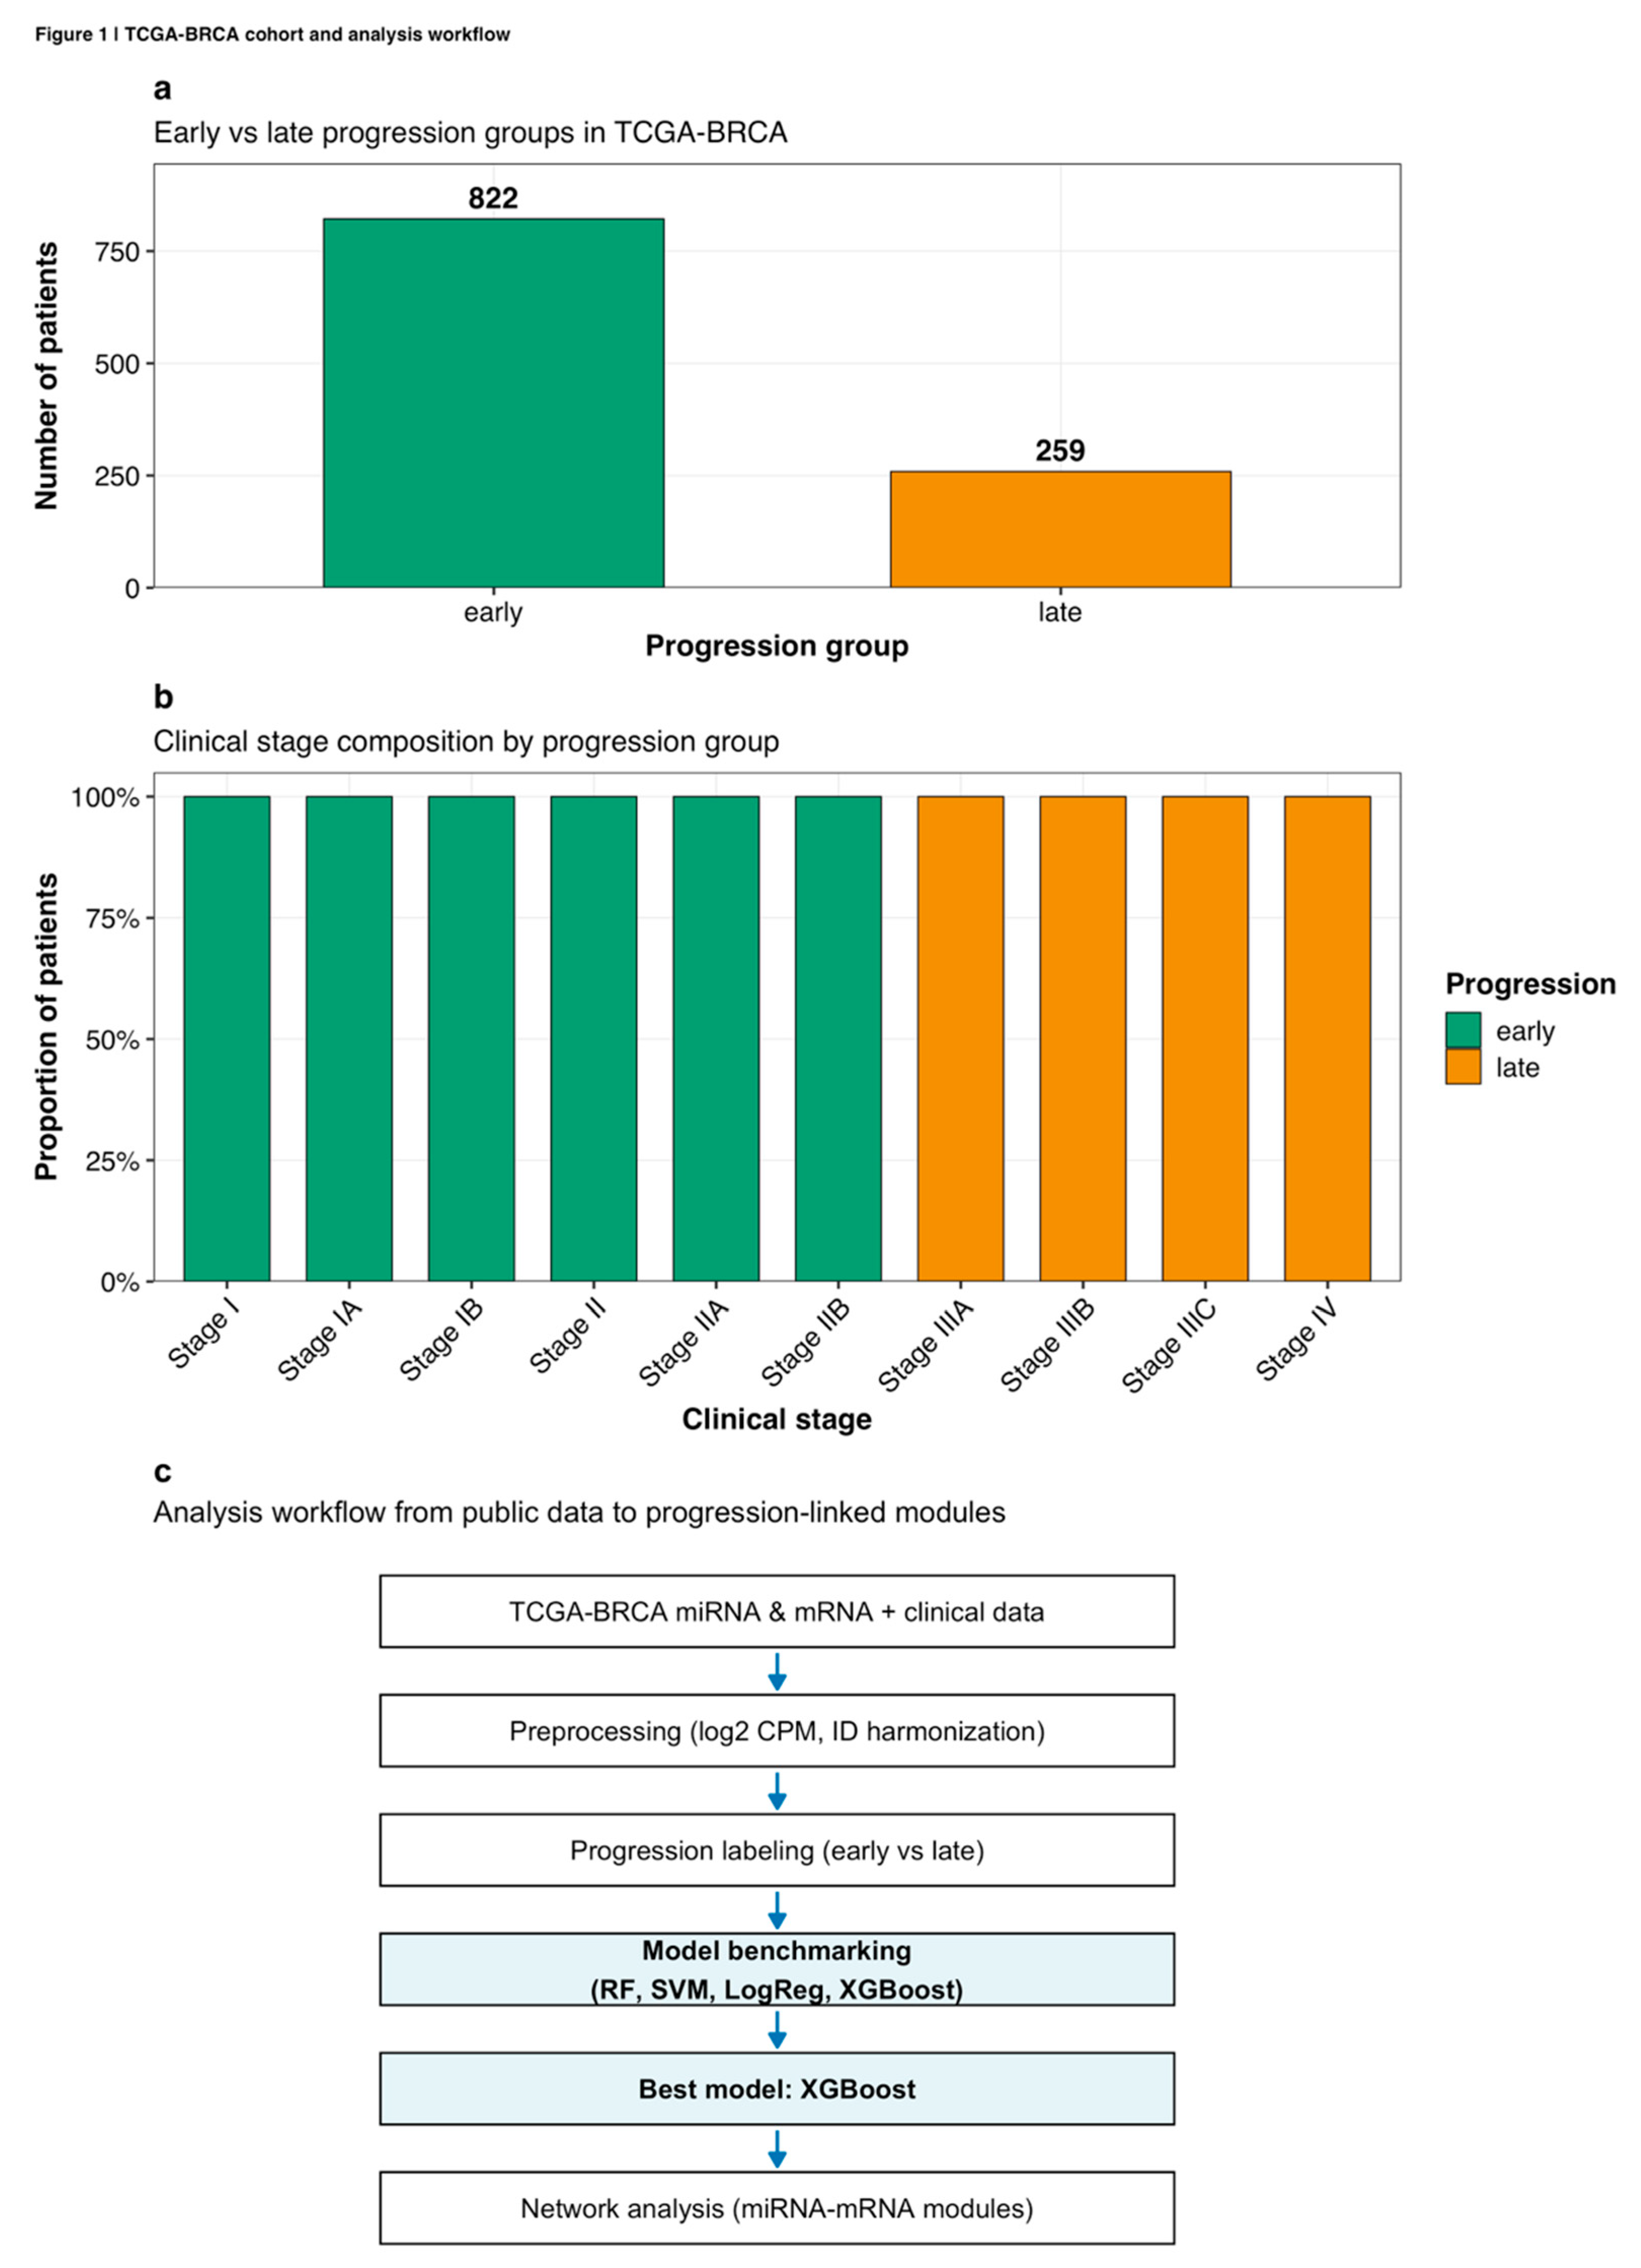
Figure 2.
Expression space and differential signals across progression groups. (a) Principal component analysis of integrated miRNA-mRNA features showing moderate clustering by progression group. PC1 captures 16.8% of variance while PC2 captures 10.0%, with early-stage samples (teal) and late-stage samples (orange) demonstrating partial but incomplete separation. (b) Volcano plot of differential expression between late versus early progression groups across both miRNA and mRNA platforms. Upregulated features in late stage (orange) and downregulated features (blue) are distinguished from non-significant changes (gray) using p < 0.05 threshold (horizontal dashed line) and fold-change thresholds (vertical dashed lines at ±0.5 log2 FC).
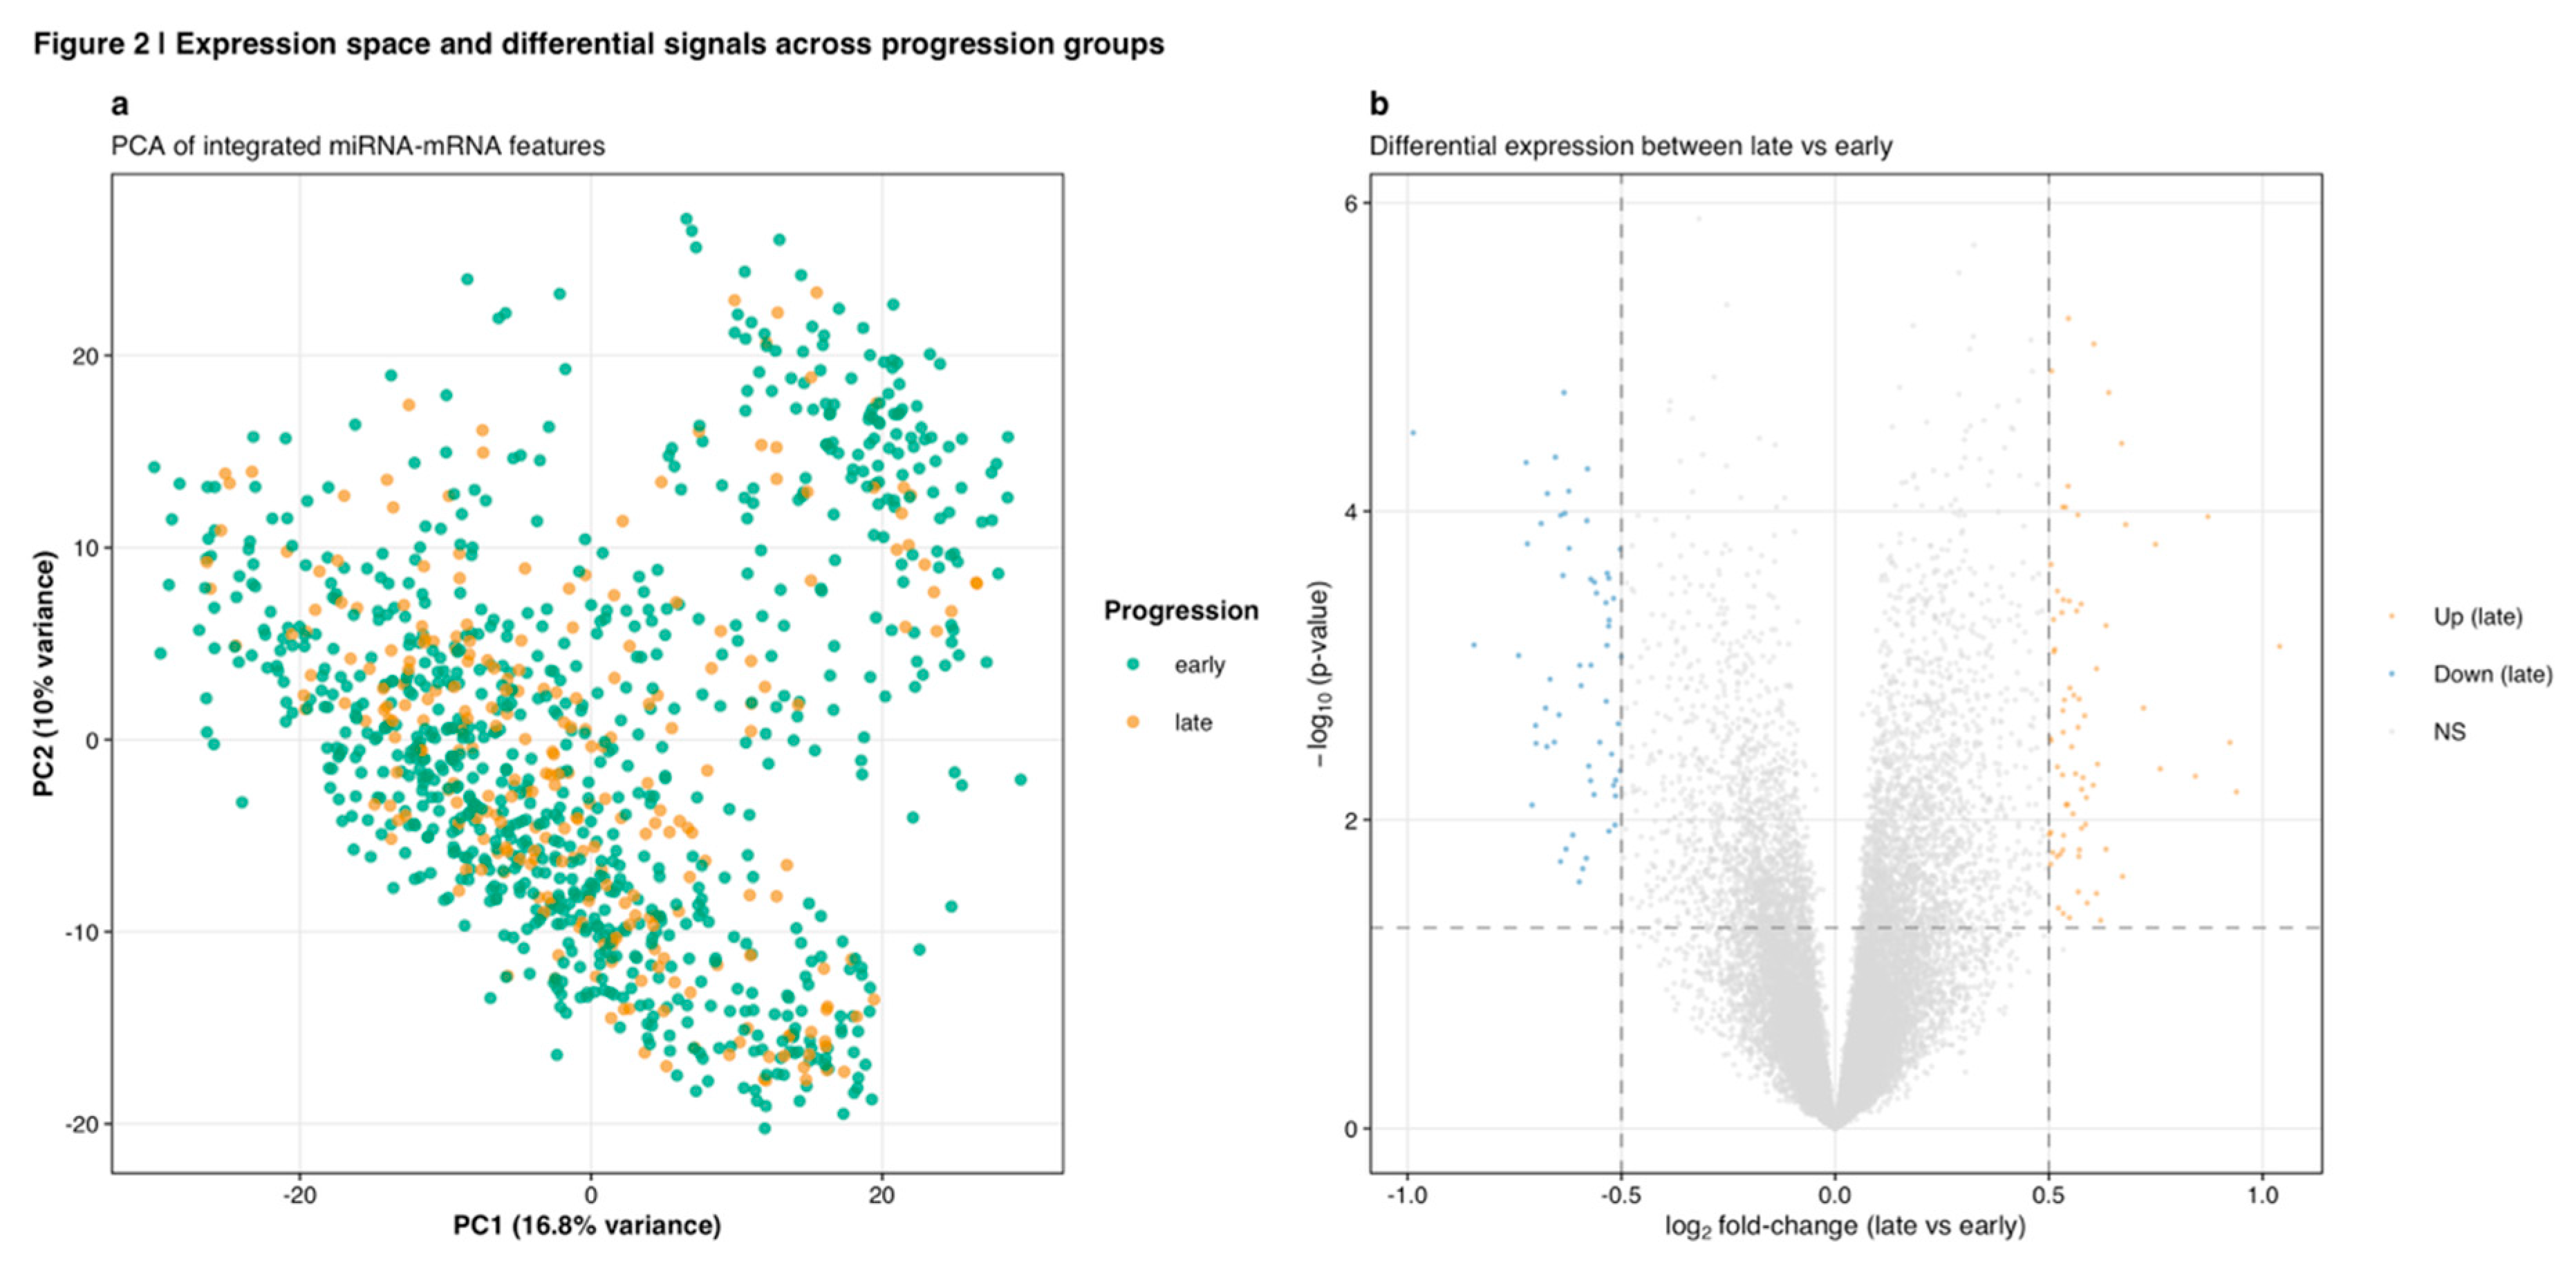
Figure 3.
Benchmarking machine learning models for early versus late progression. Performance comparison of nine machine learning algorithms on held-out test set. Blue bars represent area under the ROC curve (AUC) while green bars show classification accuracy (ACC). XGBoost demonstrates superior performance (AUC = 0.67, ACC = 0.77) compared to alternative methods including Random Forest, SVM variants, logistic regression approaches, Decision Tree, and Naive Bayes. Error bars represent 95% confidence intervals from bootstrap resampling.
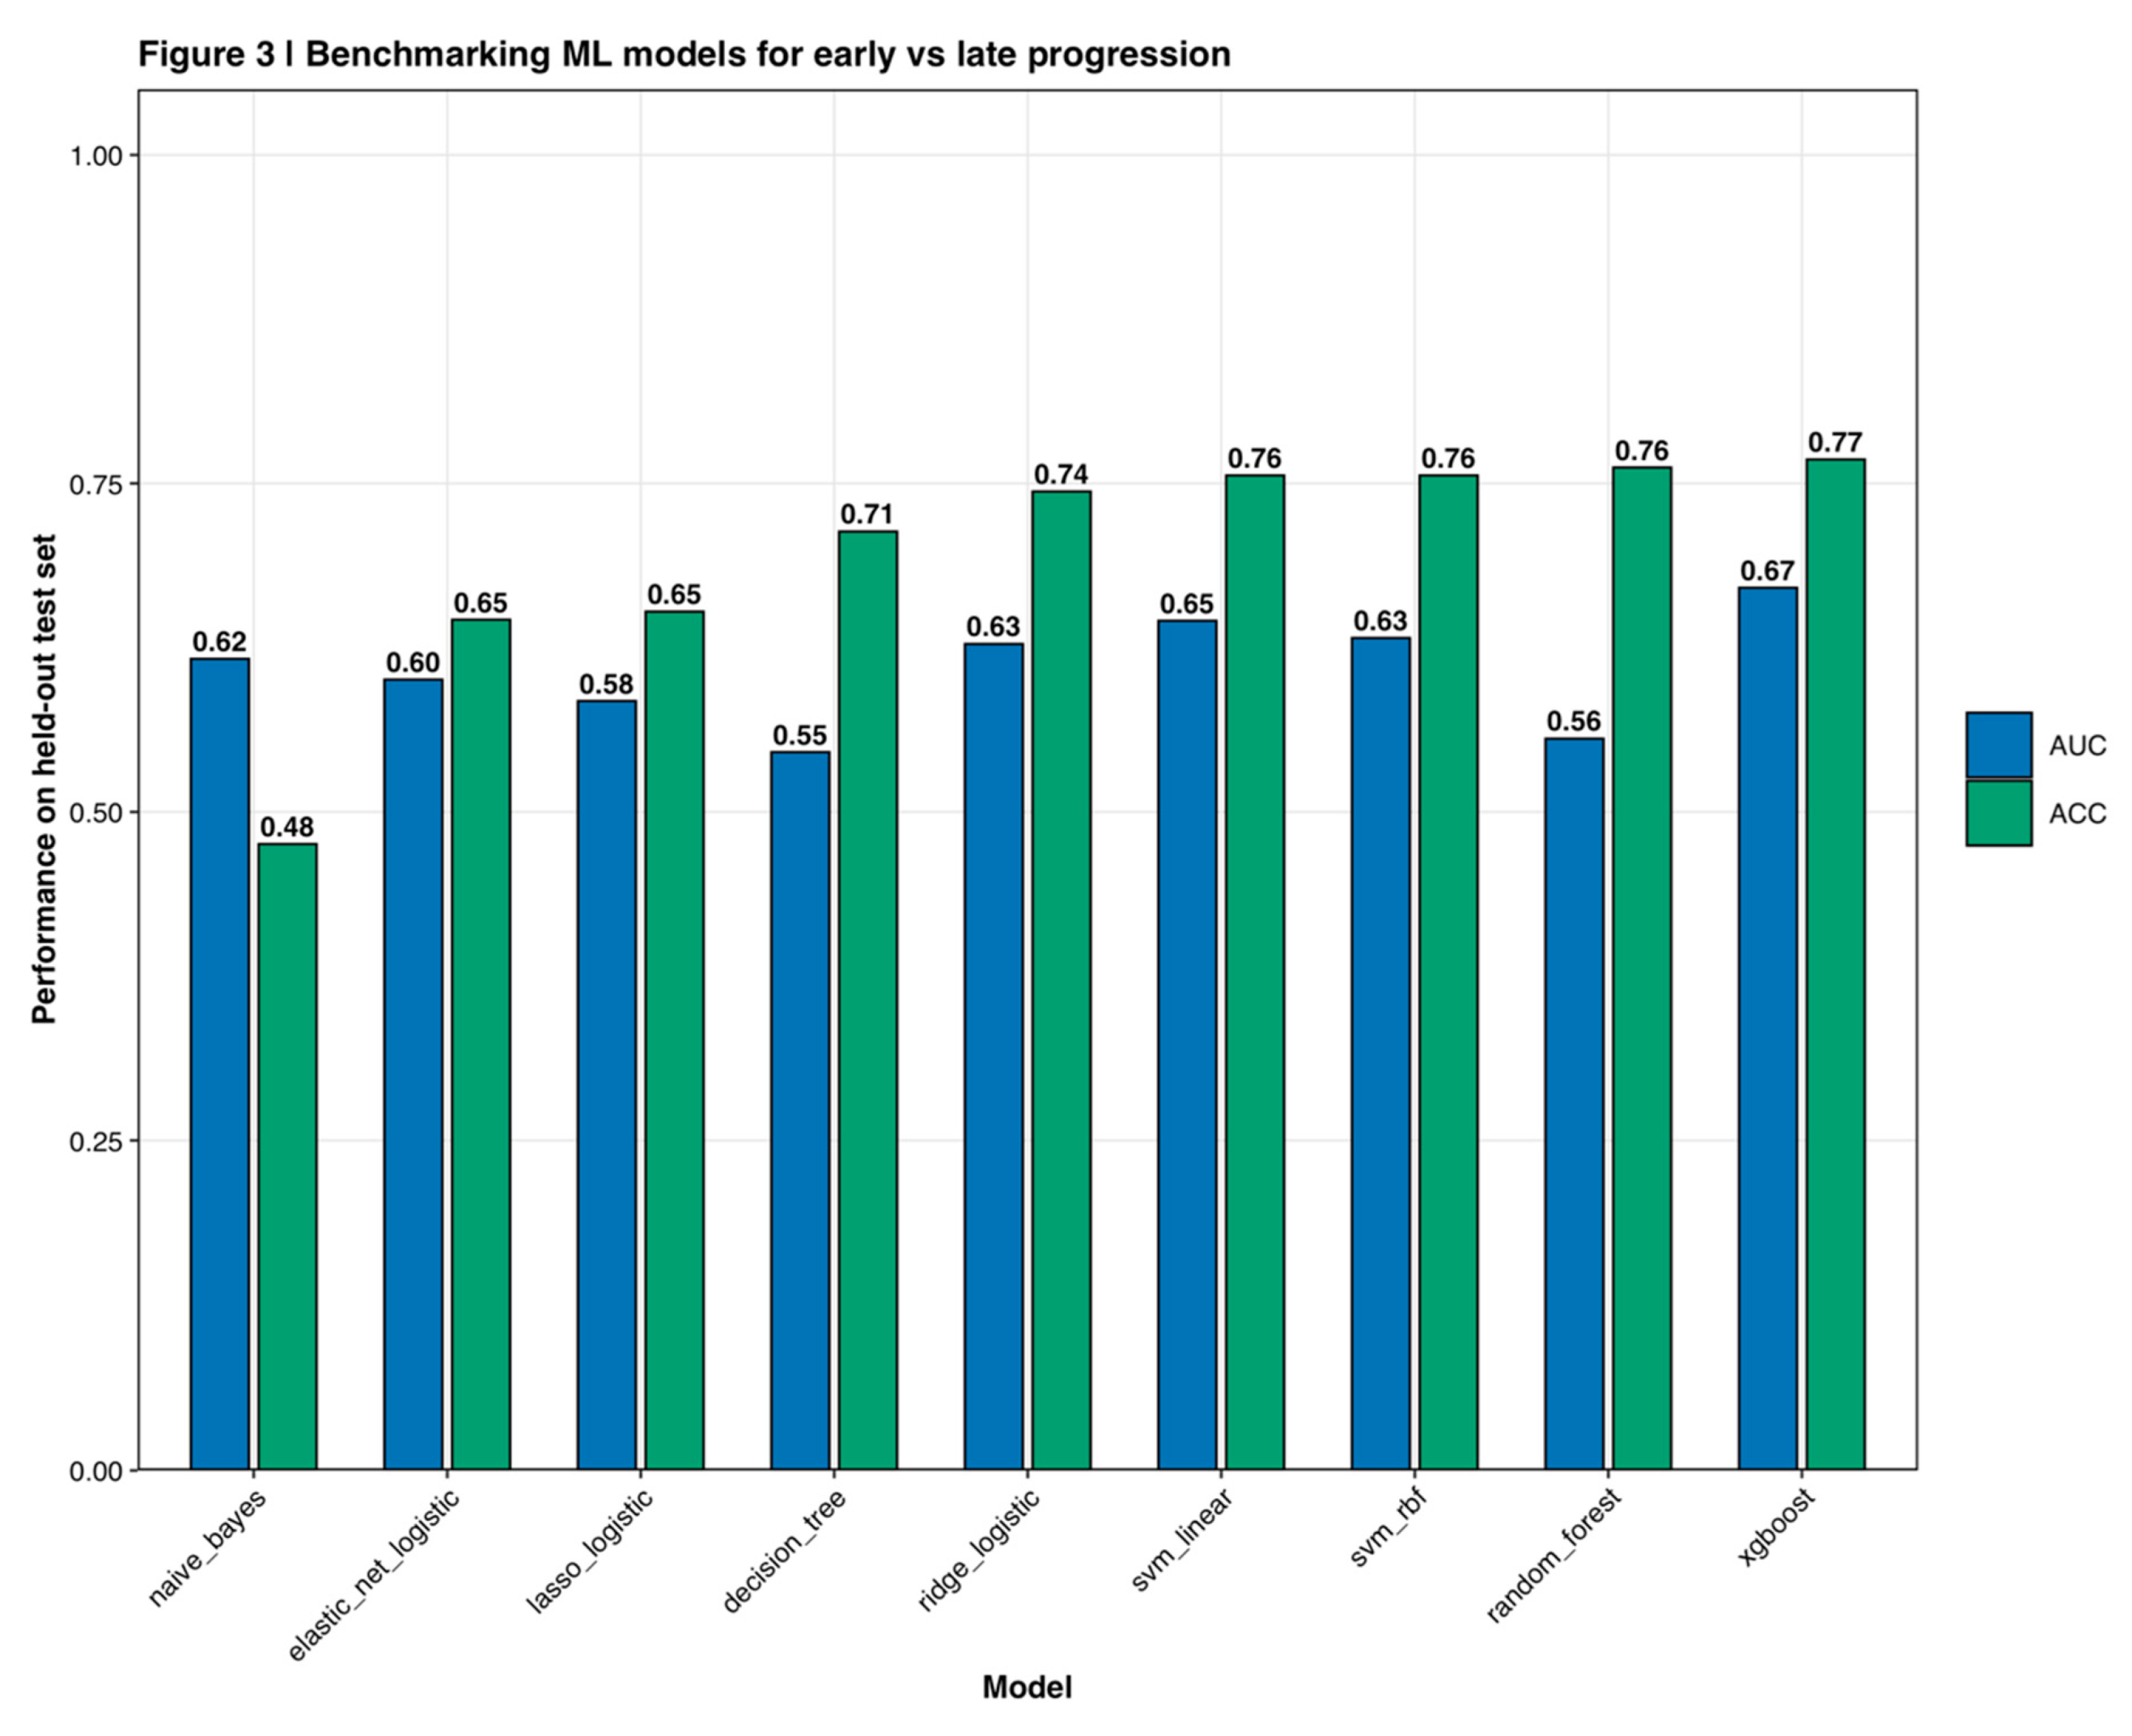
Figure 4.
XGBoost performance for breast cancer progression. (a) Receiver operating characteristic (ROC) curve showing discrimination between early and late progression groups, with AUC = 0.682 and 95% CI indicated by shaded region. Diagonal dashed line represents random chance (AUC = 0.5). (b) Precision-recall curve demonstrating performance on the imbalanced classification task, with area under precision-recall curve (AUPR) = 0.553. The curve traces precision values across all recall thresholds. (c) Calibration plot assessing agreement between predicted probabilities and observed late-progression rates. Points falling along the diagonal dashed line indicate perfect calibration. The model demonstrates good calibration with slope ≈ 0.94 and intercept ≈ 0.03.
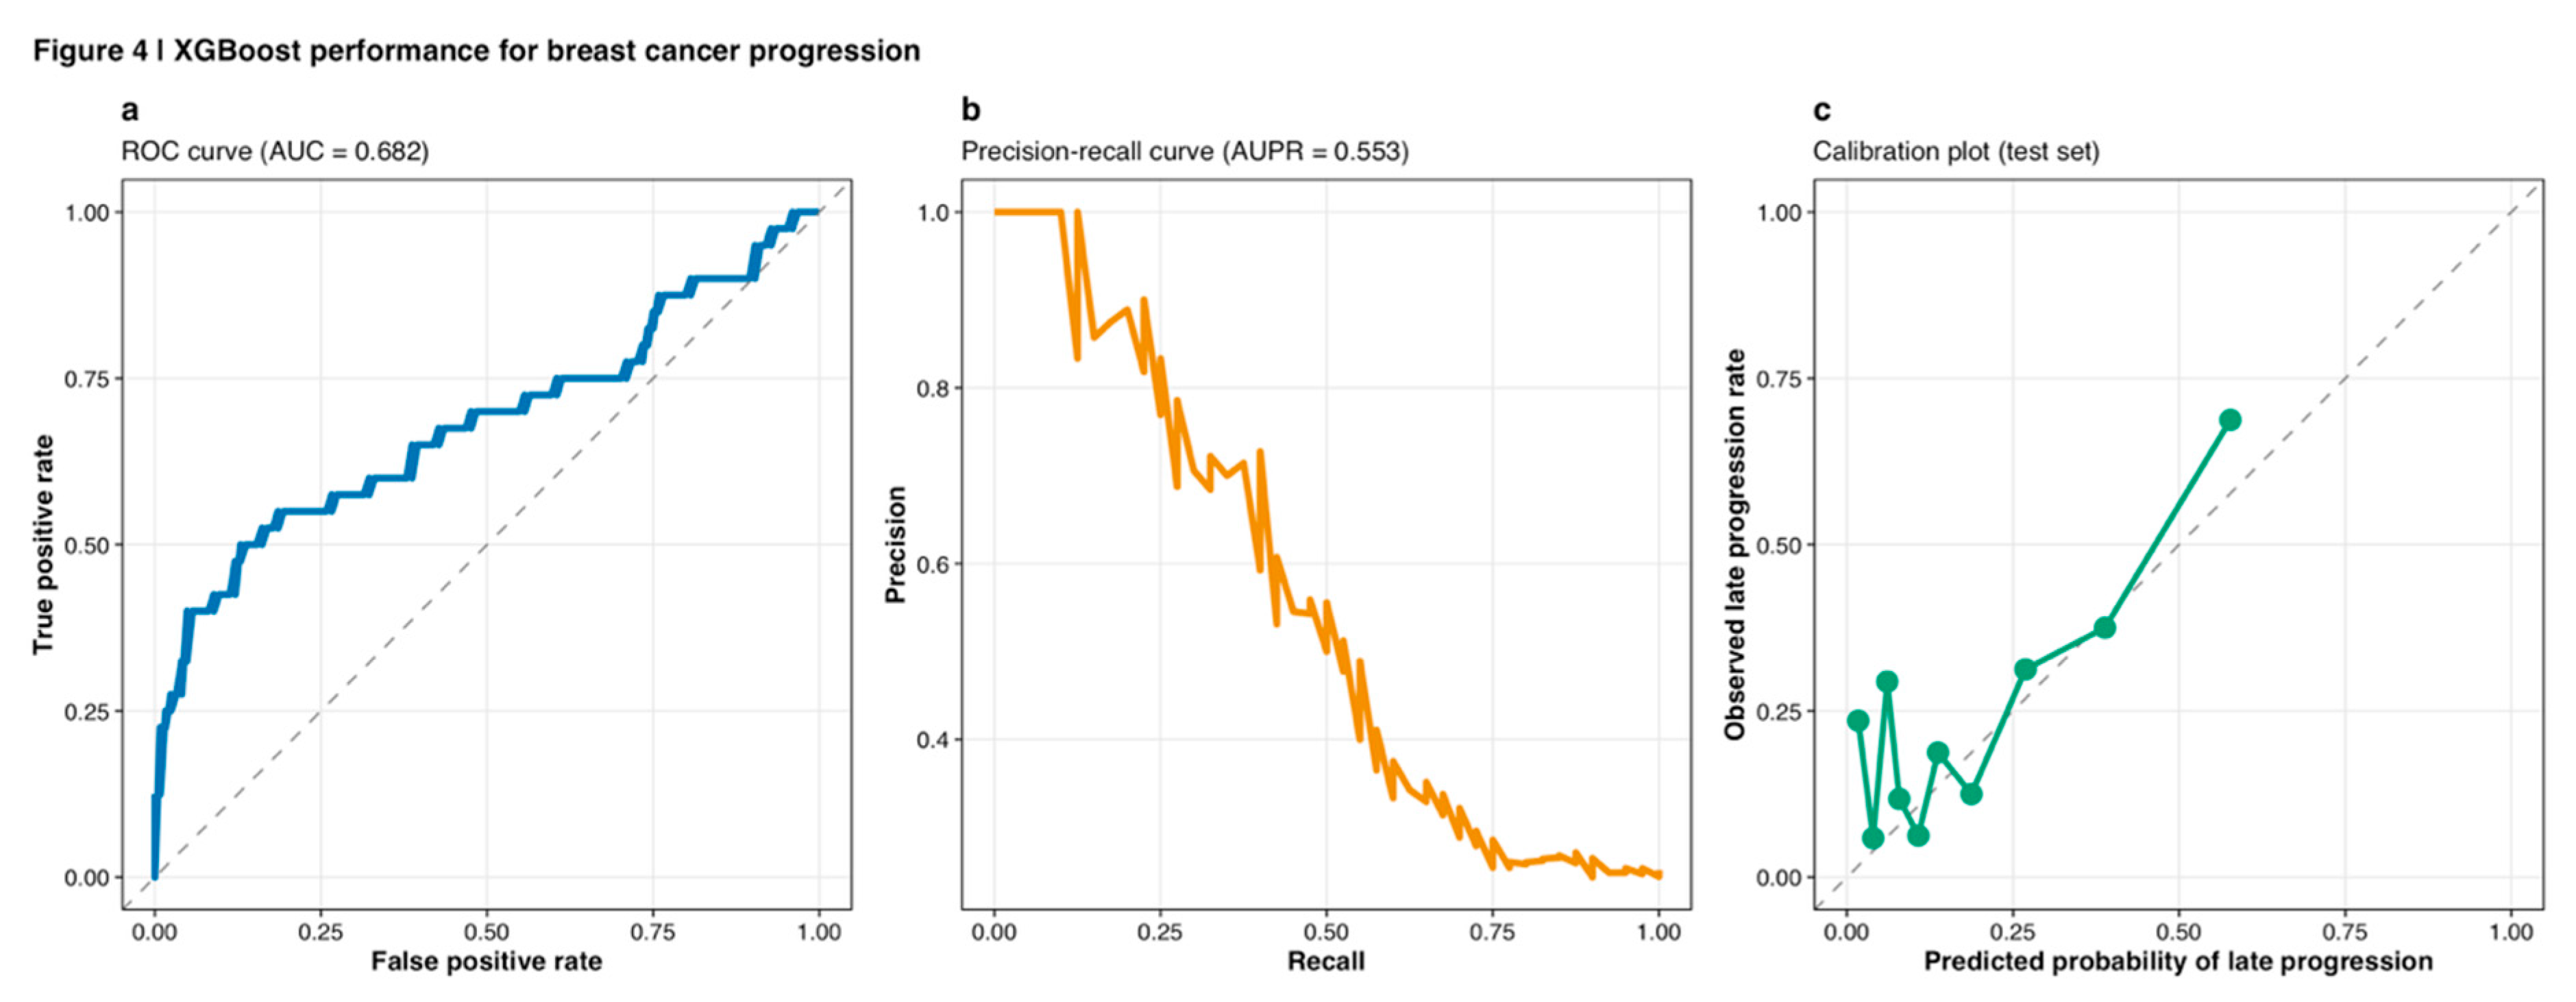
Figure 5.
Discrete and continuous risk stratification by XGBoost. (a) Confusion matrix on test set using threshold 0.5, showing 122 true negatives (early correctly classified), 9 true positives (late correctly classified), 2 false positives, and 31 false negatives. Color intensity represents count magnitude. (b) Predicted late-progression probability distributions stratified by true progression group. Early-stage samples (teal) concentrate at lower predicted probabilities (median ~0.15) while late-stage samples (orange) show higher probabilities (median ~0.32), with substantial overlap indicating classification challenge. Box plots show median, quartiles, and individual data points.
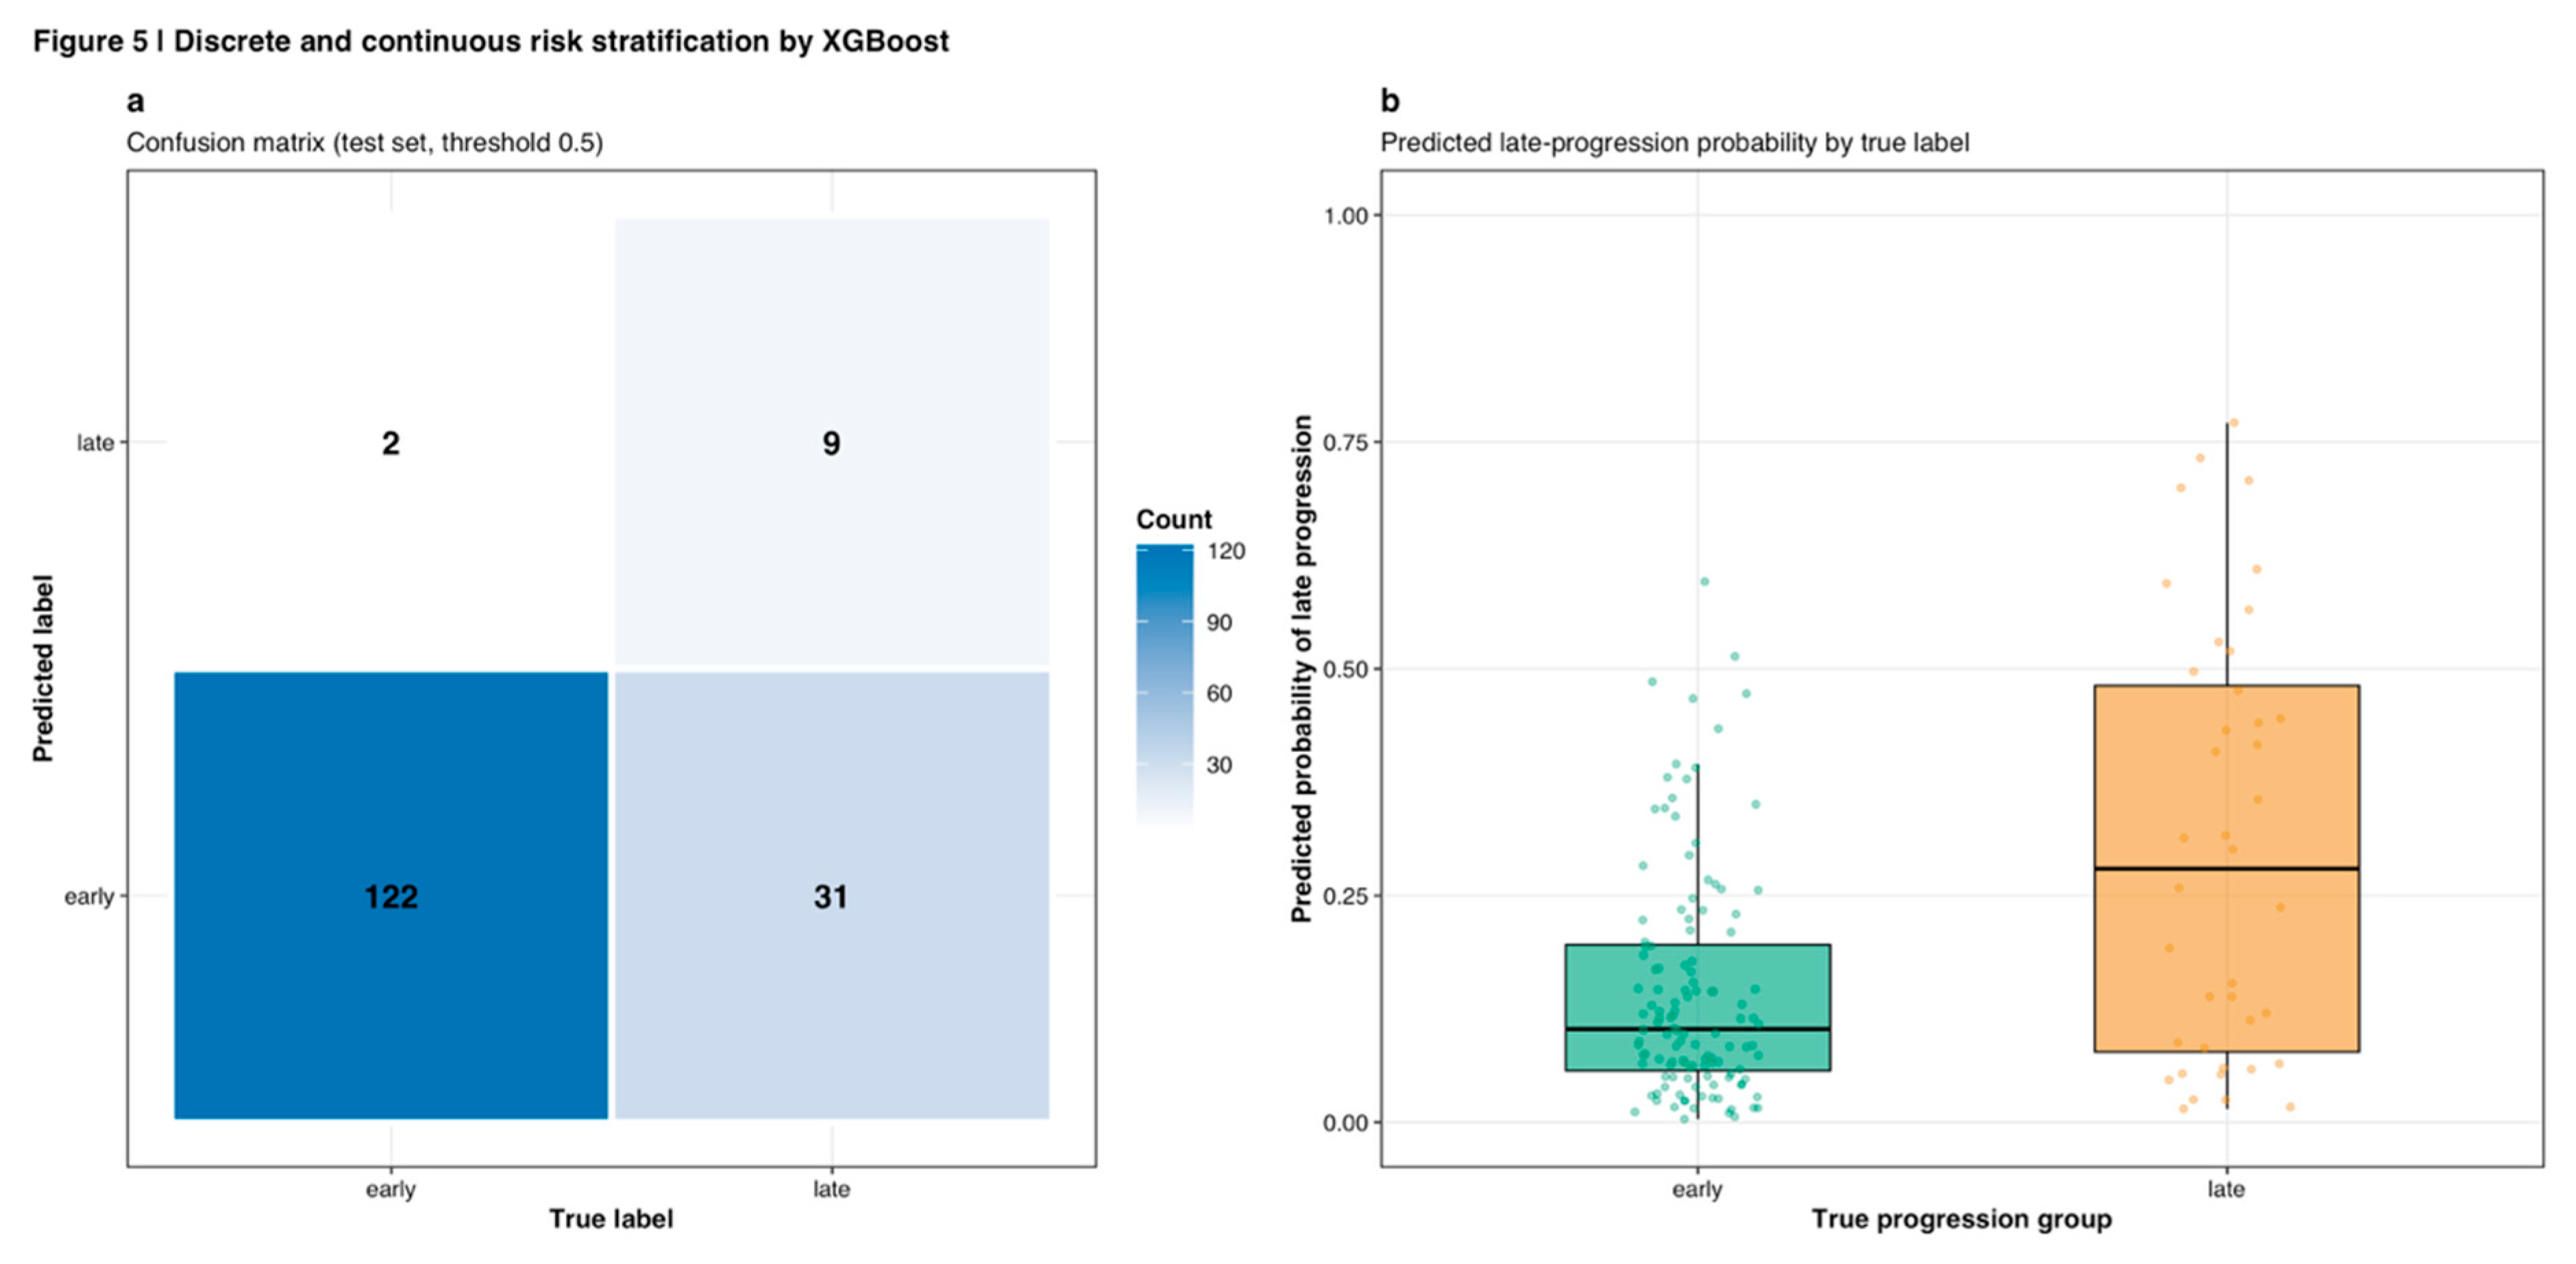
Figure 6.
XGBoost feature importance and expression patterns. (a) Top 20 features ranked by XGBoost gain metric, showing relatively balanced contributions across mRNA features (all top 20 are mRNA transcripts identified by ENSG identifiers). Gain values range from approximately 0.007 to 0.012. (b) Expression heatmap of top 30 features across test set samples ordered by predicted late-progression probability (low to high P(late)). Z-scored expression values show coordinated patterns with distinct upregulation (red) and downregulation (blue) associated with high-risk samples (right side). Features labeled with ENSG identifiers correspond to specific mRNA transcripts.
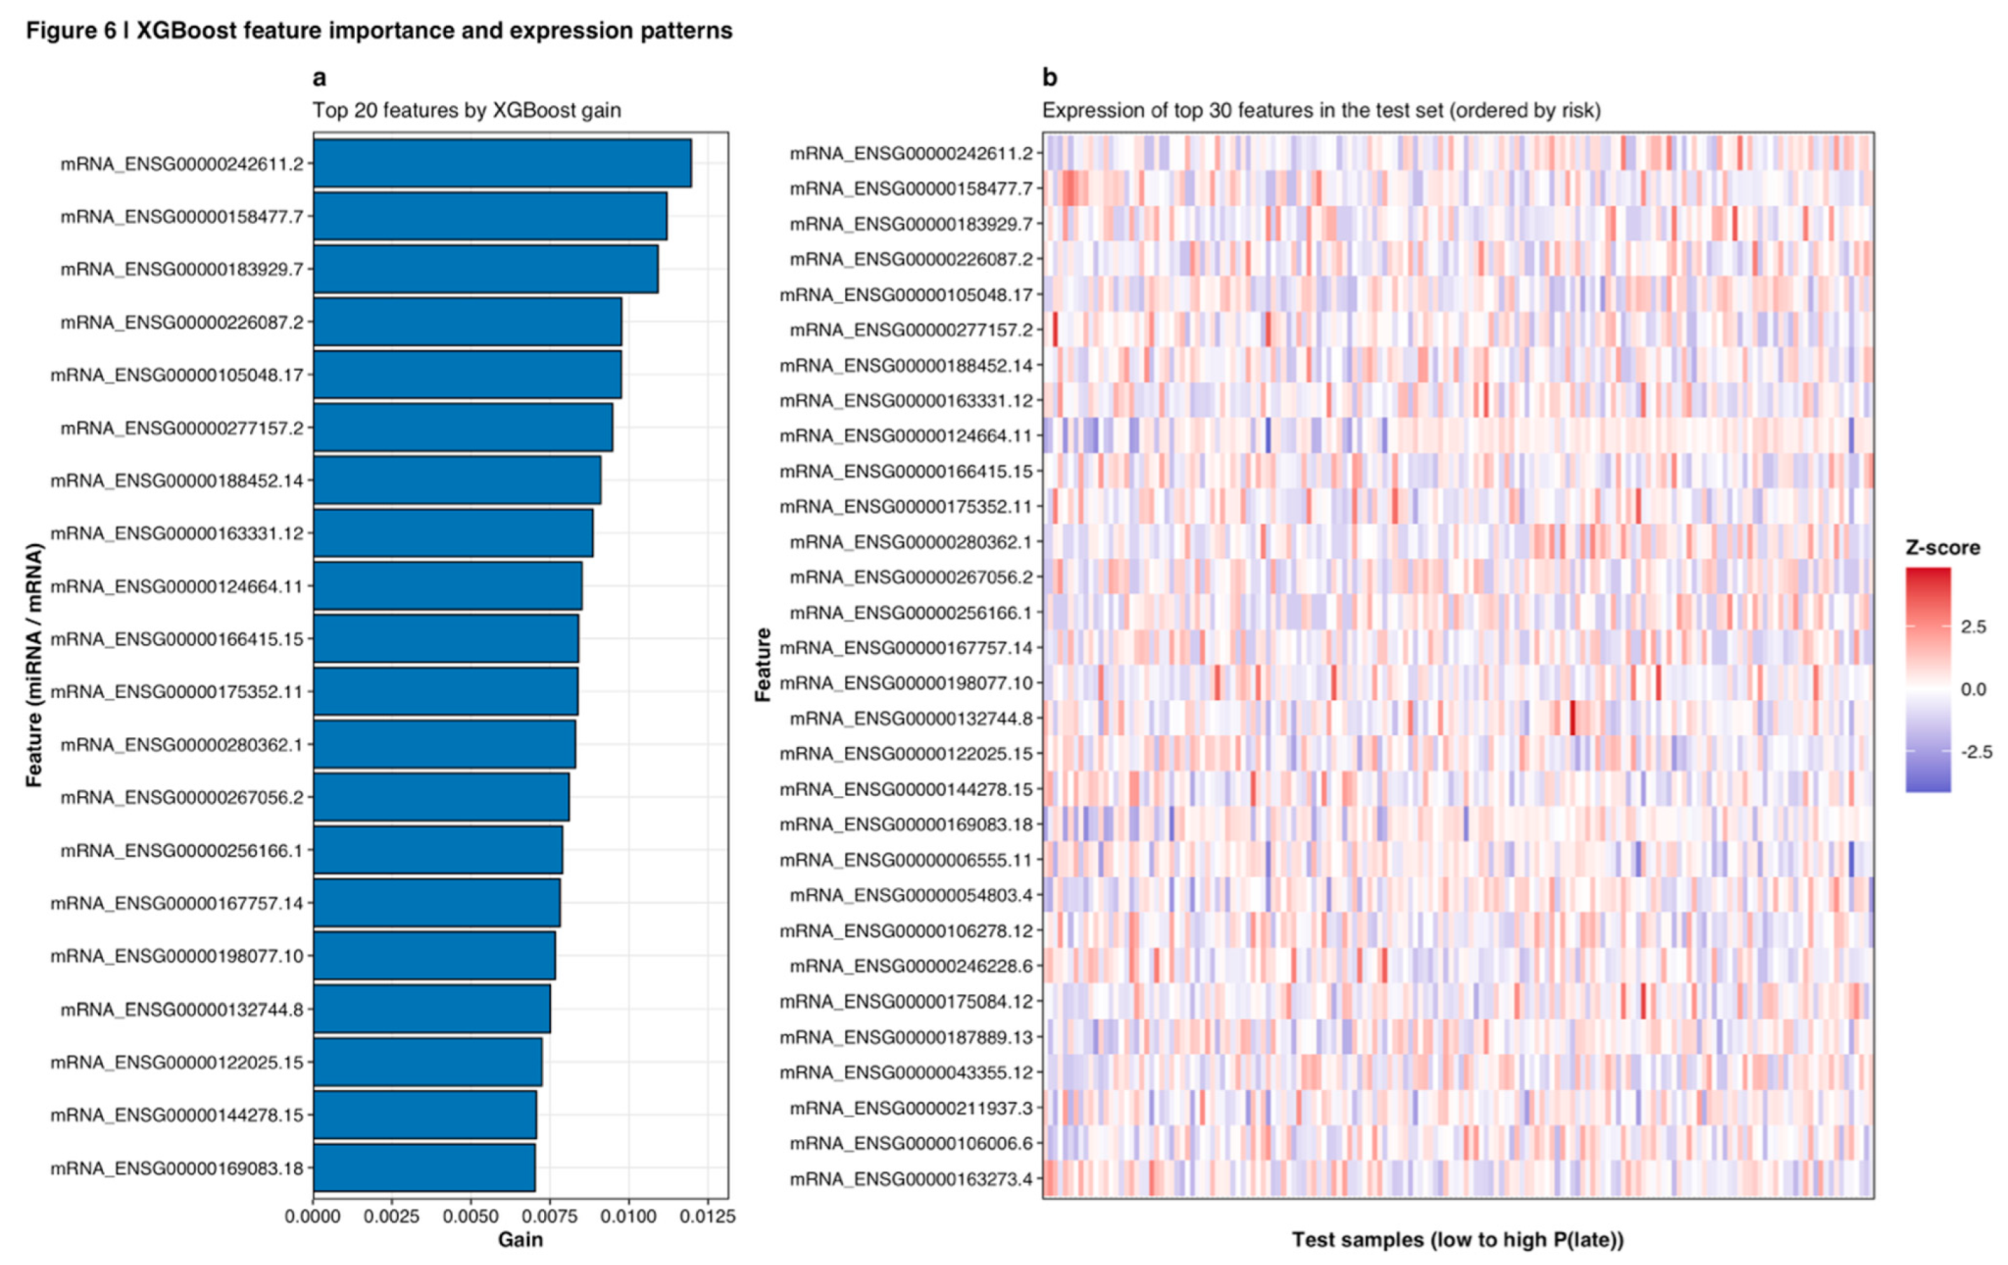
Figure 7.
miRNA co-expression modules and their mRNA target coverage. (a) Size distribution of five miRNA co-expression modules identified through hierarchical clustering. Module sizes range from 67 (Module 5) to 607 (Module 3) miRNAs. (b) mRNA target coverage for each module showing number of unique mRNA targets regulated by miRNAs within each module. Bar color indicates median correlation strength between module miRNAs and their targets, with darker green representing stronger negative correlations consistent with regulatory repression. Modules 2 and 3 demonstrate the most extensive target coverage (>700 targets each) while Module 1 shows strongest median correlation (r ≈ -0.25).
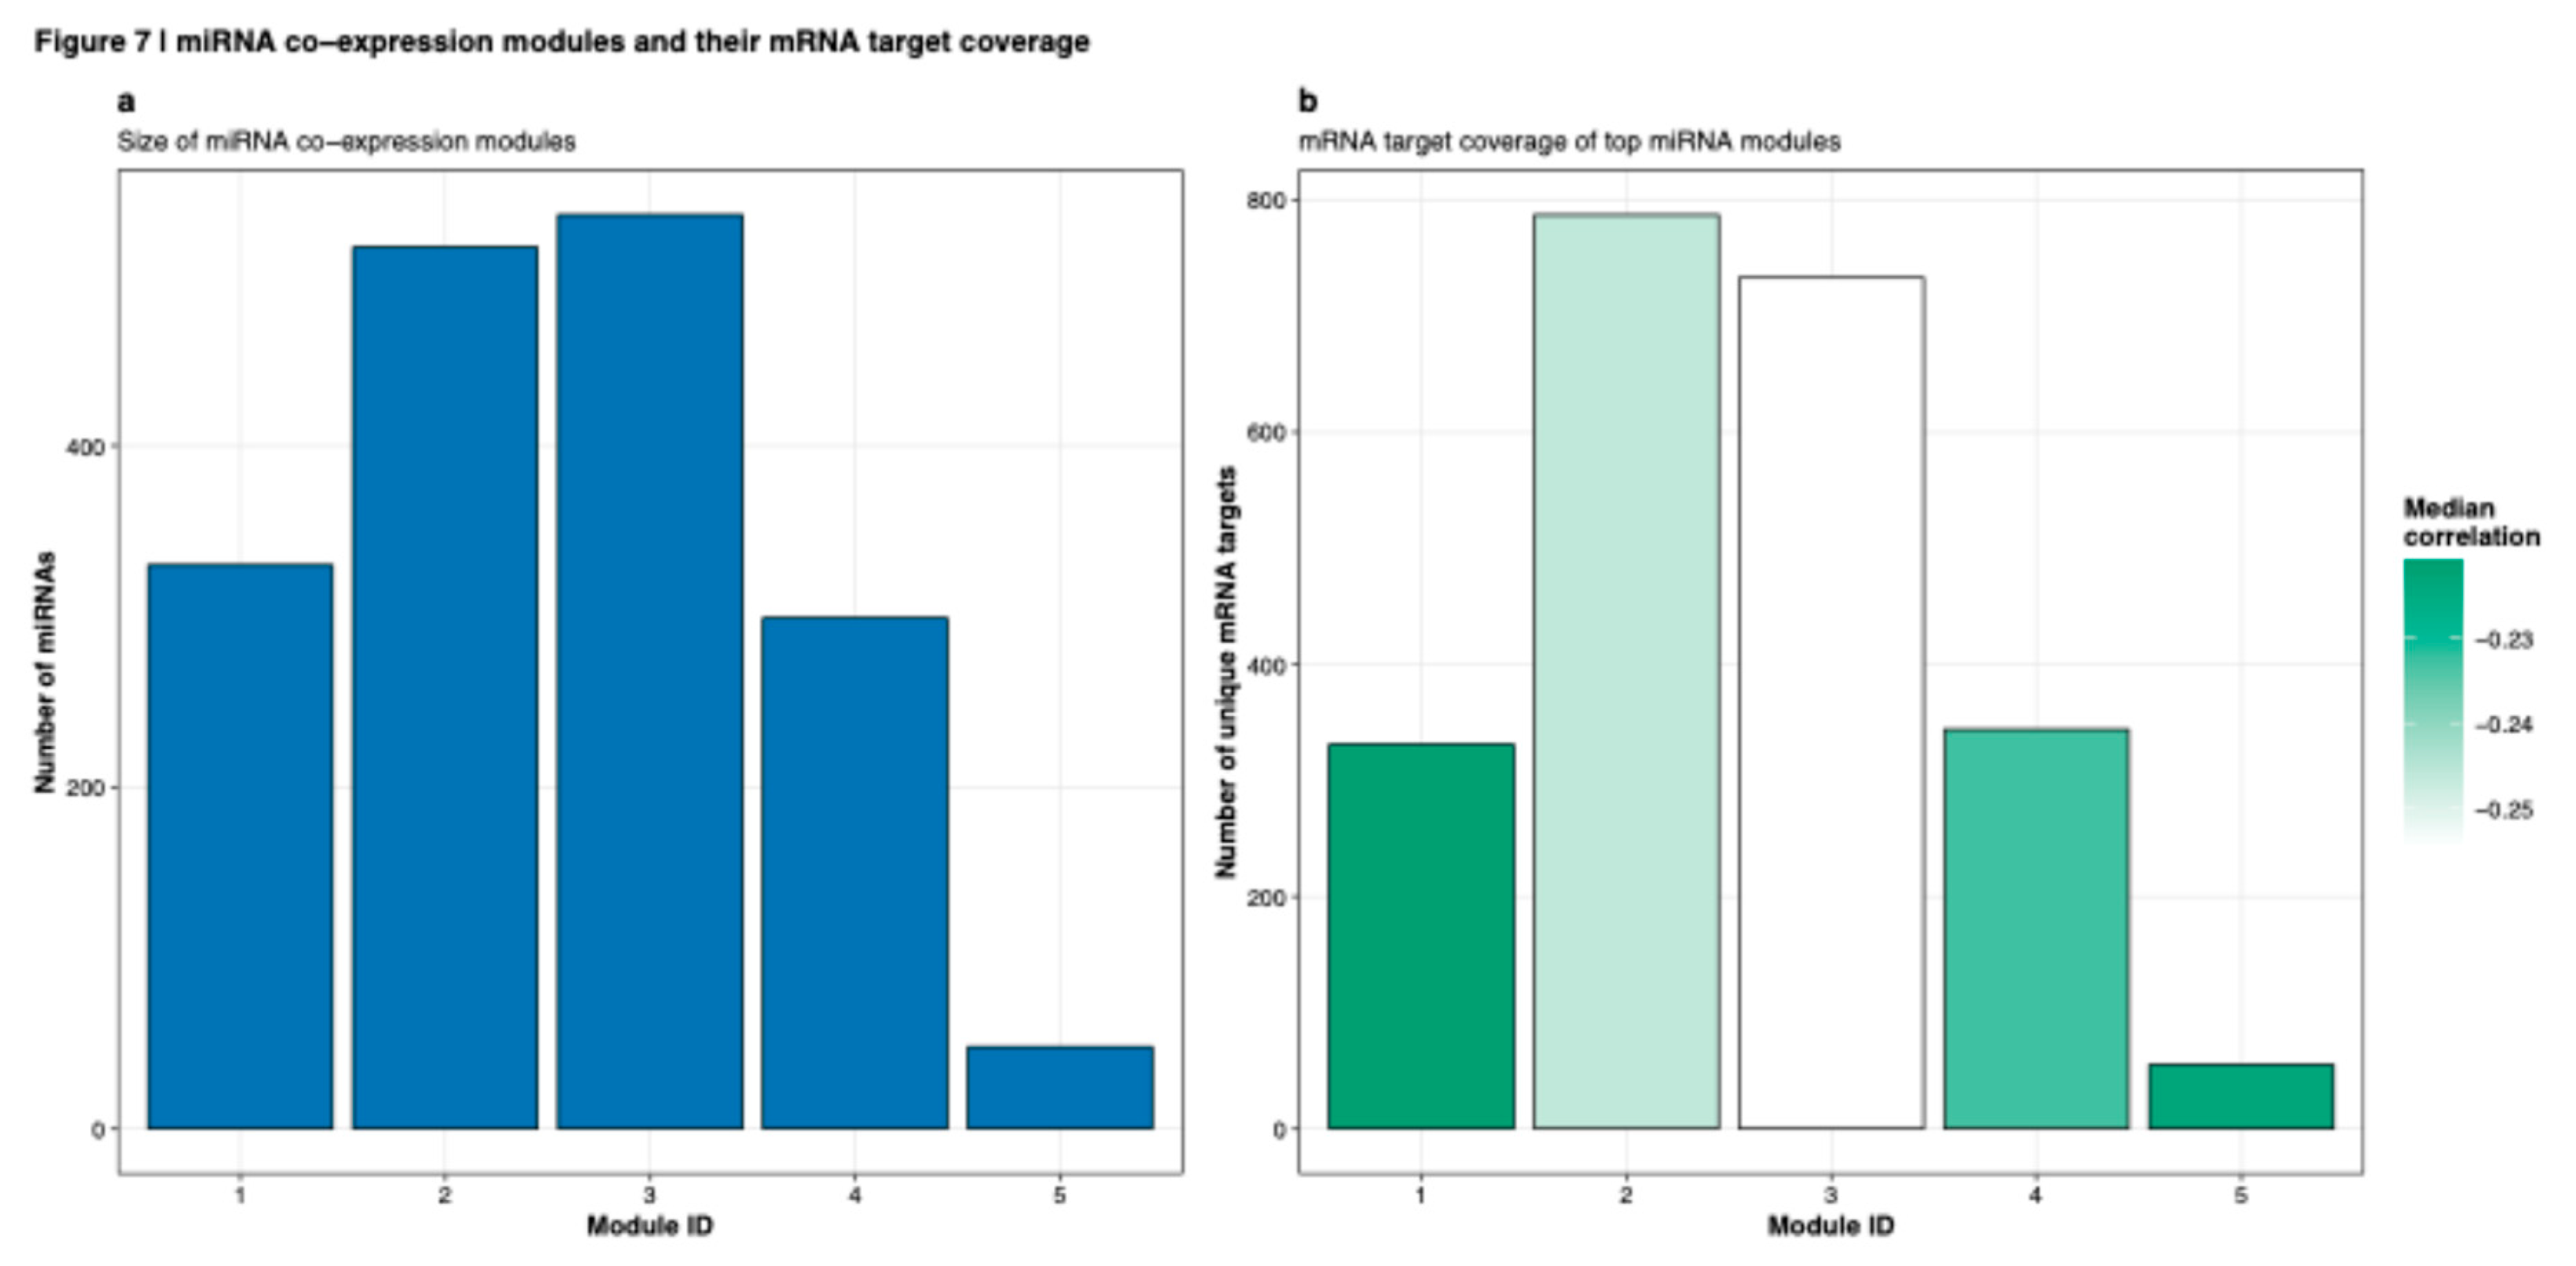
Figure 8.
Differential expression analysis between progression groups. (a) Volcano plot of differential miRNA expression (late vs early) showing log2 fold-change on x-axis and -log10(p-value) on y-axis. Significant miRNAs (p < 0.05, orange points) demonstrate modest fold changes (|log2 FC| < 1.5) with peak significance around -log10(p) = 8. Most miRNAs show no significant differential expression (gray points). (b) Volcano plot of differential mRNA expression displaying larger fold changes (|log2 FC| up to 4) and higher significance levels (-log10(p) up to 70 for top genes). Significant mRNAs (blue points) cluster at both positive and negative fold changes. (c) Summary bar plot showing 15 significant miRNAs (1.3% of 1,124 tested) and 194 significant mRNAs (0.8% of 23,747 tested) at p < 0.05 threshold.
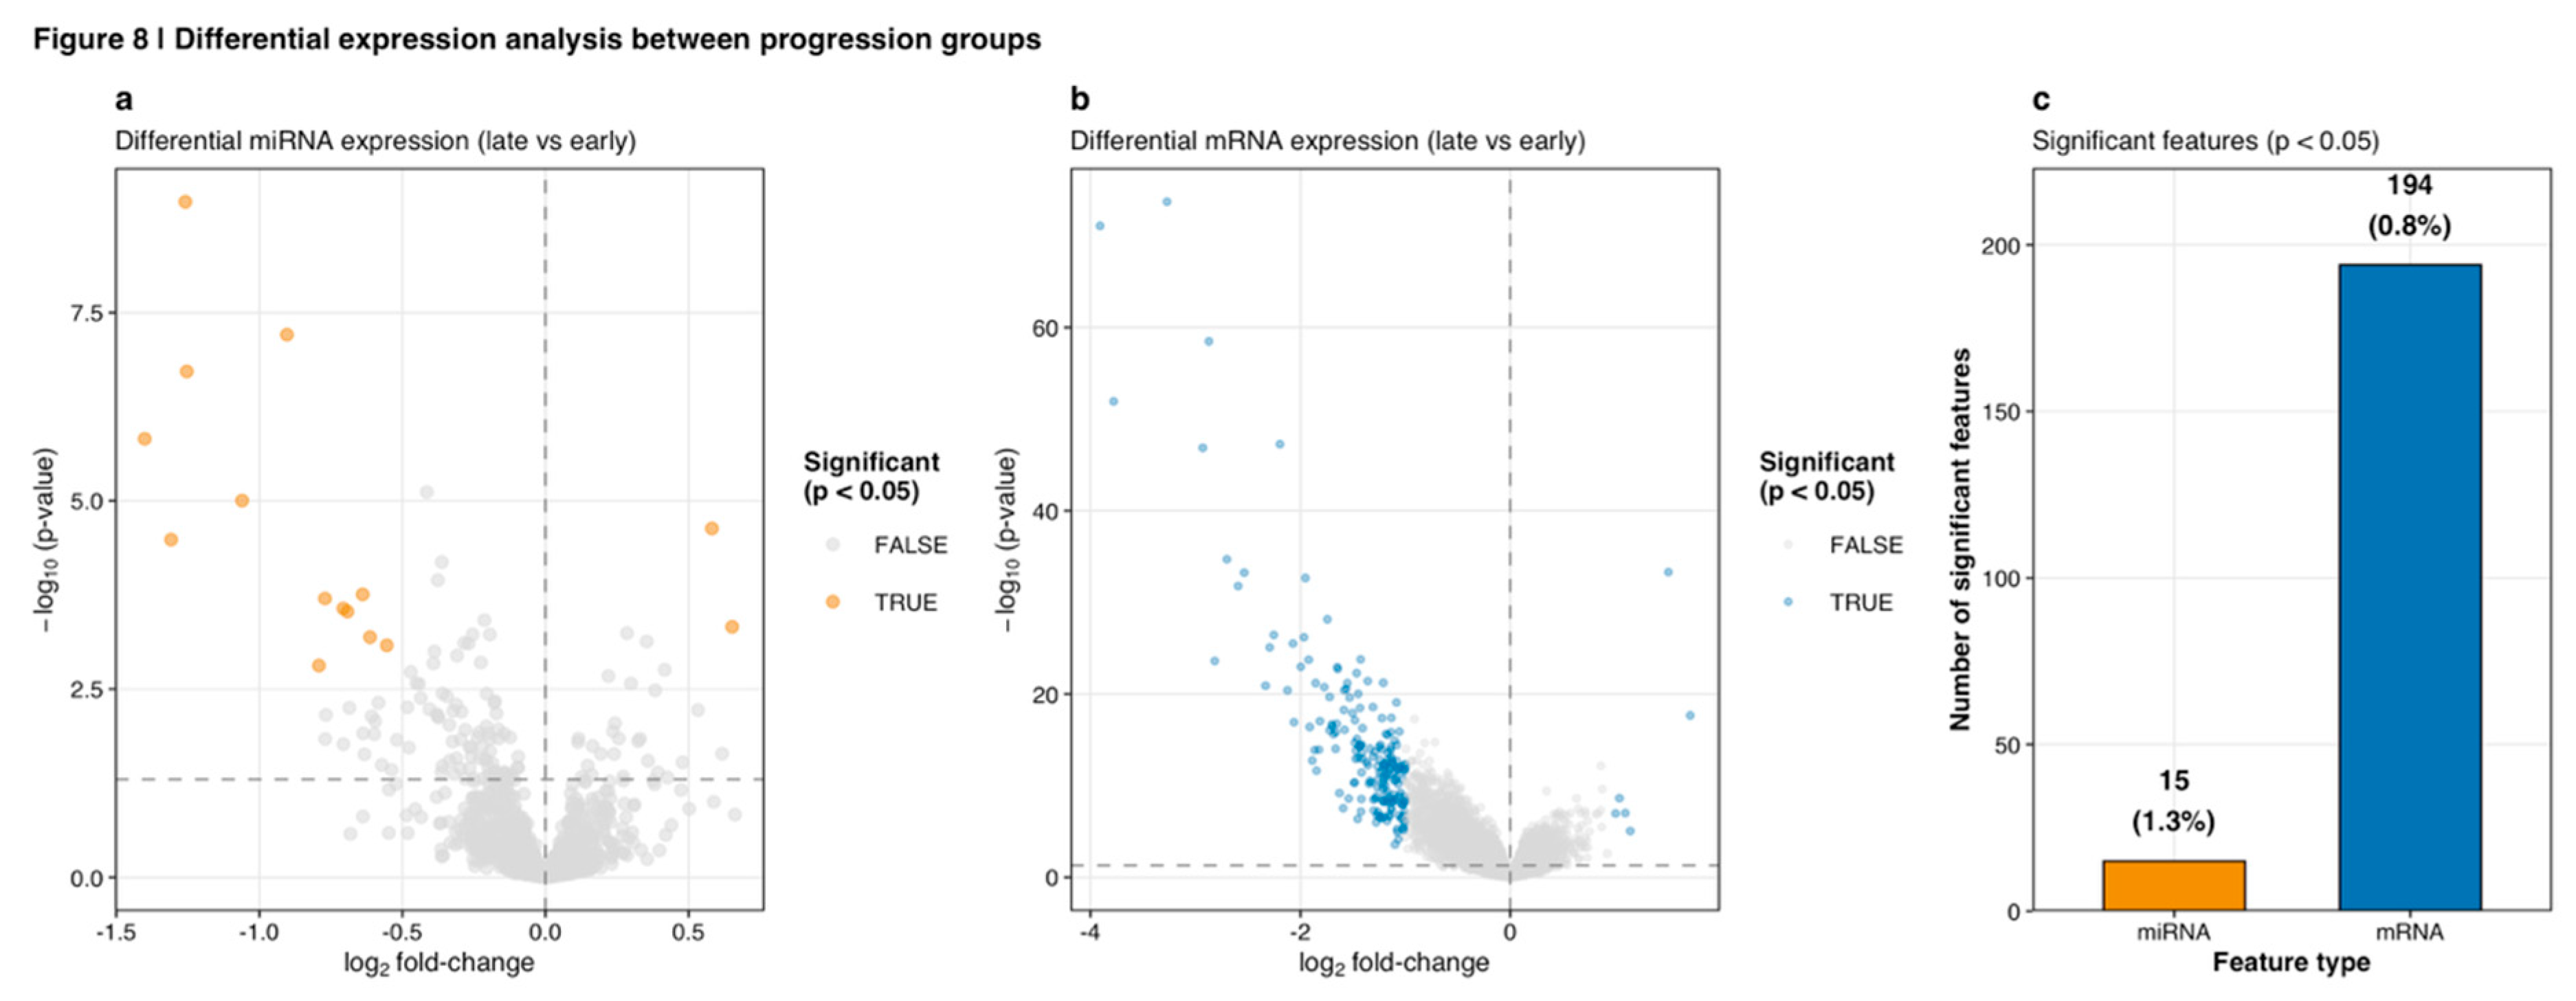
Figure 9.
miRNA-mRNA regulatory network characteristics. (a) Target degree distribution across all miRNAs in the regulatory network. Histogram shows most miRNAs regulate relatively few targets (0-50), with small number of hub miRNAs exhibiting extensive connectivity (>400 targets). Scale-free topology is evident from right-skewed distribution. (b) Correlation distribution between miRNAs and their predicted mRNA targets, centered around Pearson r = -0.25 (indicated by dashed vertical line). Distribution extends from r = -0.6 to approximately 0, consistent with post-transcriptional repression mechanisms where negative correlations indicate regulatory relationships. (c) Top 15 hub miRNAs ranked by target count. Bar length indicates number of mRNA targets (ranging from 97 to 516) while bar color represents mean absolute correlation strength with targets. miRNA_1861 emerges as top hub with 516 targets and mean |r| = 0.297.
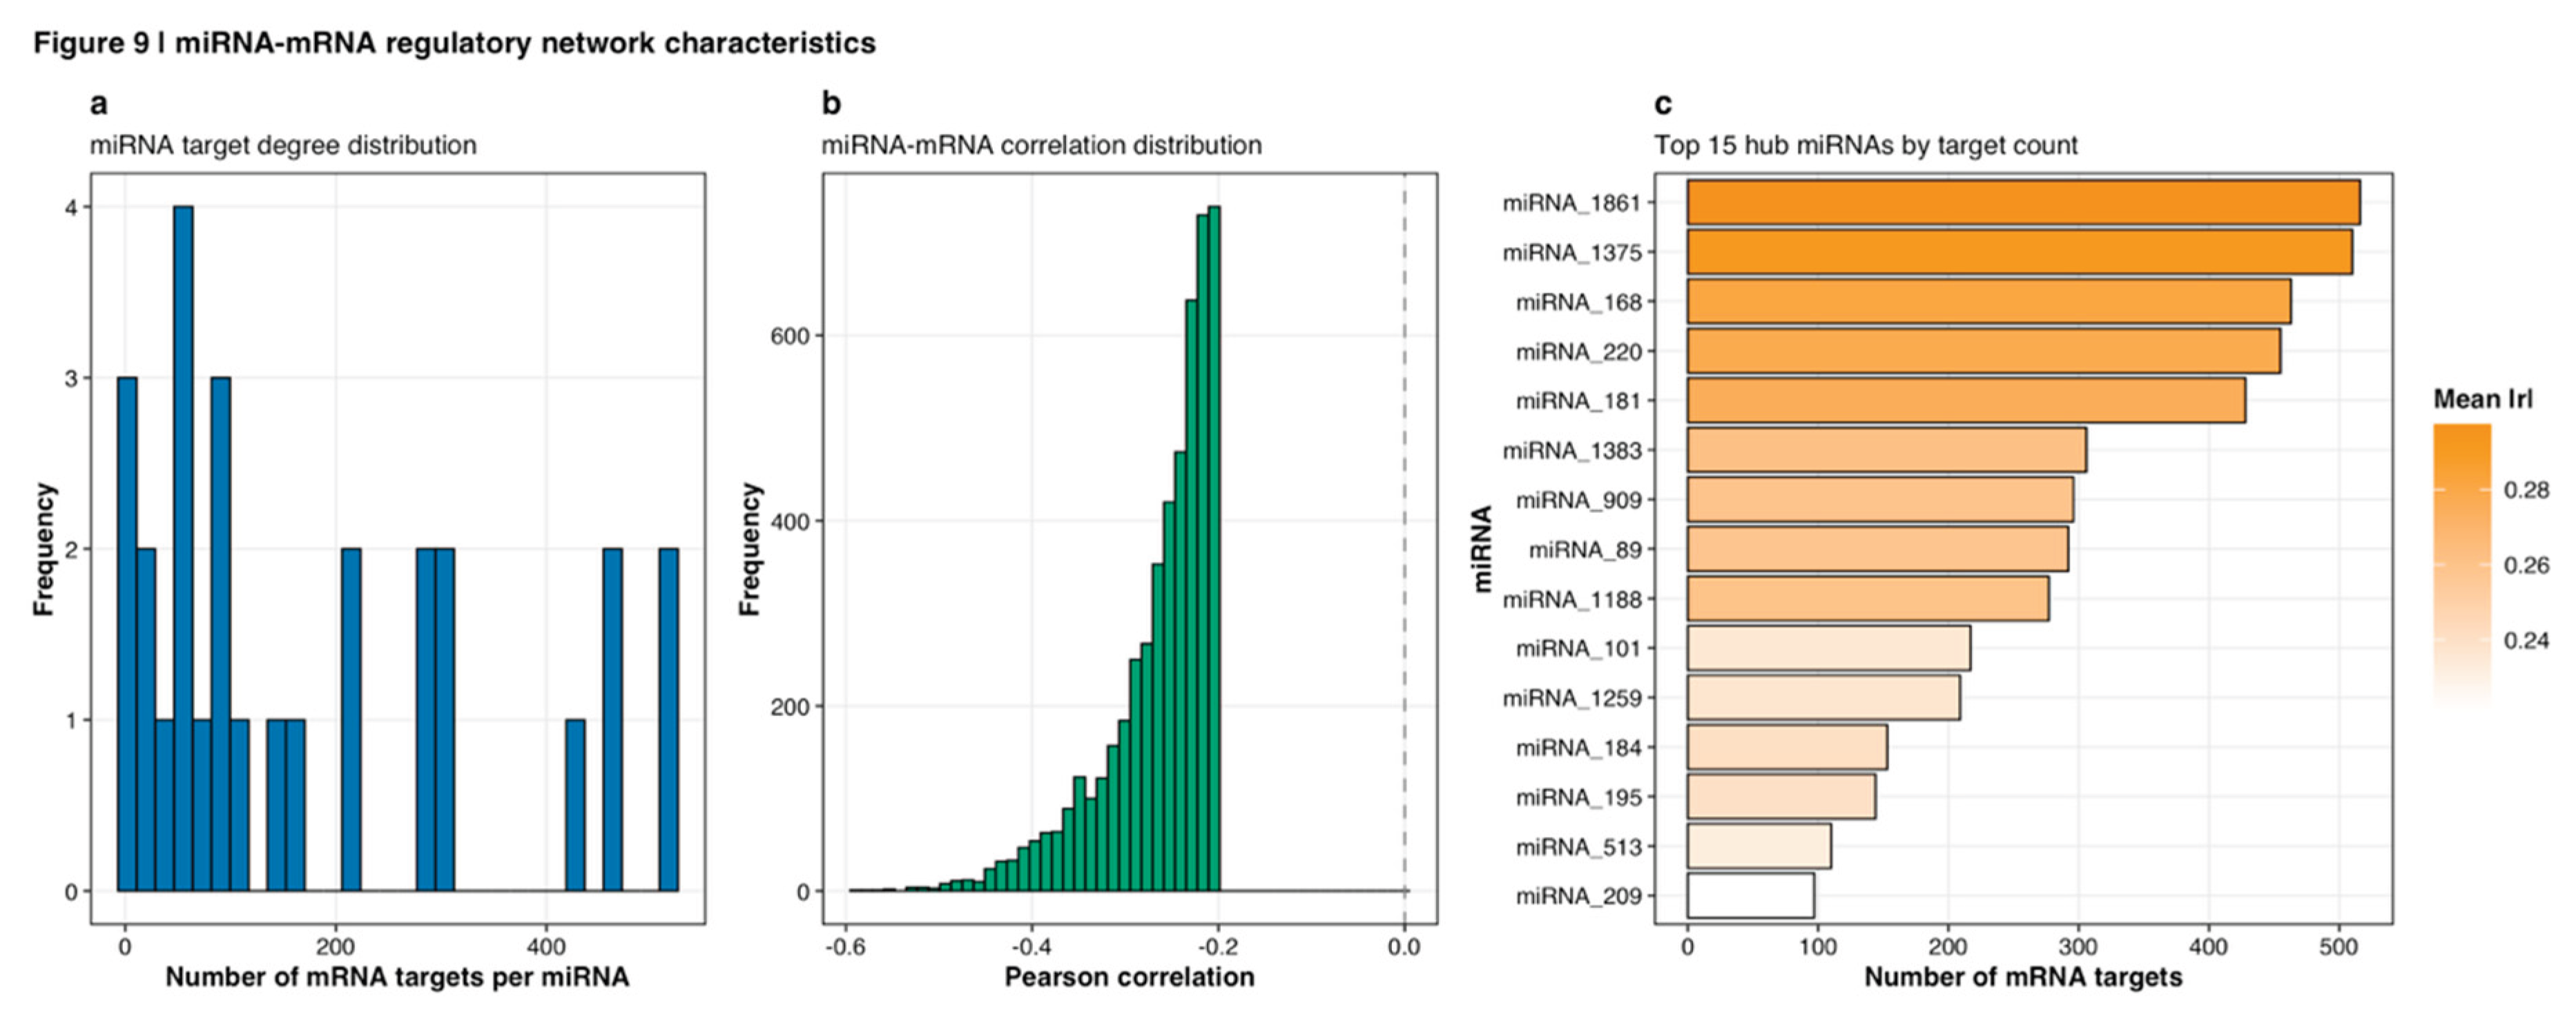

Table 1.
Differential Expression Summary Between Progression Groups.
| Feature Type | Significant Features | Percentage of Total |
|---|---|---|
| miRNA | 15 of 1,124 | 1.3% |
| mRNA | 194 of 23,747 | 0.8% |
Note: Differential expression determined by Wilcoxon rank-sum test with p < 0.05 threshold and Benjamini-Hochberg FDR correction.
Table 2.
Top 20 Features by XGBoost Importance.
| Feature | Gain | Cover | Frequency |
|---|---|---|---|
| ENSG00000242611.2 | 0.01197 | 0.00764 | 0.00707 |
| ENSG00000158477.7 | 0.01120 | 0.00893 | 0.00505 |
| ENSG00000183929.7 | 0.01091 | 0.01404 | 0.00606 |
| ENSG00000226087.2 | 0.00977 | 0.00871 | 0.00909 |
| ENSG00000105048.17 | 0.00976 | 0.01508 | 0.00808 |
| ENSG00000277157.2 | 0.00948 | 0.00884 | 0.00808 |
| ENSG00000188452.14 | 0.00911 | 0.00796 | 0.00707 |
| ENSG00000163331.12 | 0.00886 | 0.00801 | 0.00707 |
| ENSG00000124664.11 | 0.00851 | 0.00770 | 0.00303 |
| ENSG00000166415.15 | 0.00840 | 0.00899 | 0.00909 |
| ... | ... | ... | ... |
Note: Top 10 of 515 features with non-zero importance shown. Gain represents average improvement in classification accuracy, Cover indicates average coverage of observations, and Frequency shows proportion of trees using the feature. Complete rankings available in supplementary materials.
Table 3.
Hub miRNAs Ranked by Target Count.
| miRNA ID | Target Count | Mean |Correlation| |
|---|---|---|
| miRNA_1861 | 516 | 0.297 |
| miRNA_1375 | 510 | 0.291 |
| miRNA_168 | 463 | 0.281 |
| miRNA_220 | 455 | 0.278 |
| miRNA_181 | 428 | 0.275 |
| miRNA_1383 | 306 | 0.262 |
| miRNA_909 | 296 | 0.259 |
| miRNA_89 | 292 | 0.259 |
| miRNA_1188 | 277 | 0.260 |
| miRNA_101 | 217 | 0.236 |
| miRNA_1259 | 209 | 0.237 |
| miRNA_184 | 153 | 0.241 |
| miRNA_195 | 144 | 0.240 |
| miRNA_513 | 110 | 0.233 |
| miRNA_209 | 97 | 0.221 |
Note: Hub miRNAs identified through regulatory network analysis showing extensive target connectivity. Target count indicates number of unique mRNA targets with inverse correlation (Spearman's rho < -0.3, adjusted p < 0.05). Mean absolute correlation represents average strength of regulatory relationships. These 15 hub miRNAs represent key regulatory nodes potentially coordinating broad transcriptional programs in breast cancer progression.
Disclaimer/Publisher’s Note: The statements, opinions and data contained in all publications are solely those of the individual author(s) and contributor(s) and not of MDPI and/or the editor(s). MDPI and/or the editor(s) disclaim responsibility for any injury to people or property resulting from any ideas, methods, instructions or products referred to in the content. |
© 2025 by the authors. Licensee MDPI, Basel, Switzerland. This article is an open access article distributed under the terms and conditions of the Creative Commons Attribution (CC BY) license (http://creativecommons.org/licenses/by/4.0/).
Copyright: This open access article is published under a Creative Commons CC BY 4.0 license, which permit the free download, distribution, and reuse, provided that the author and preprint are cited in any reuse.


