Submitted:
09 December 2025
Posted:
10 December 2025
You are already at the latest version
Abstract
This study experimentally investigates the cooling performance of a single-opening wind catcher model under varying orientations and wind speeds. The wind catcher was connected to a horizontal cavity representing an indoor space, with a rear outlet simulating a window opening. Electric resistors were installed at the catcher shaft and in the middle of the cavity length to simulate the building’s heat loads. Experiments were conducted in a wind tunnel, where K-type thermocouples were employed to record temperature variations for both closed and open cavity end. Five wind speeds (4–9 m/s) and five orientations (0°–180°) were examined. Under the closed-cavity configuration, the maximum temperature reduction (cooling) of 4 °C occurred at an orientation of 180°, at which the catcher opening was positioned on the leeward side. This orientation created a low-pressure region at the catcher’s inlet, located within the wake of the model, which combined with a favorable vertical temperature gradient enhanced suction-driven cooling. In the open-cavity configuration, cooling was observed for all orientations and wind speeds. The greatest temperature reduction of 9 °C occurred at the 135° orientation, whereas other orientations produced temperature drops from 2 °C to 6 °C.
Keywords:
wind catchers
; natural convection
; forced convection
; cooling performance
; heat loads
; thermocouples
; wind tunnel
1. Introduction
Efficient heating and cooling of buildings is of paramount importance for contemporary societies, as it directly impacts energy consumption, environmental sustainability, and economic costs. With buildings accounting for a significant portion of global energy use, optimizing thermal performance has become a central focus in both engineering and architectural design. In an extensive review by Chenari et al. [1] various energy efficient methods are reported. In an effort to reduce energy consumption, traditional methods are being revisited, such as the so-called Arabic wind catchers, which have been used for centuries in Middle East to passively cool building interiors. Arabic wind catchers consist of a vertical shaft with openings at the top, designed to capture prevailing winds. These openings allow air to flow into the building, providing both ventilation and cooling. The air circulates in the interior, lowering temperatures without the need for mechanical cooling systems. Passive cooling in wind catchers is achieved through a combination of a vertical temperature gradient, created mainly by solar heat, and the pressure spatial differences generated by the blowing winds. The temperature variation causes air movement, with hot air masses rising and cooler air being directed downward. Meanwhile, wind pressure helps draw cooler air into the building or expelling interior air when suction pressures prevail at the openings, promoting natural ventilation. This combination of forces significantly reduces the need for mechanical cooling, providing an energy-efficient solution. The Egyptian architect Hassan Fathy revitalized the traditional wind catcher, integrating it into modern architectural practice as an effective passive cooling strategy for hot arid climates ([2]). Comprehensive reviews of wind catcher applications are found in Saadatian et al. [3] and Hughes et al. [4], whereas the review by Jomehzadeh et al. [5] focuses on the performance of wind catchers with regard to indoor air quality.
The cooling performance of a wind catcher is influenced by multiple parameters, including the shaft height, the size, number, and orientation of its openings, and its alignment with respect to the prevailing wind direction. As highlighted in the review work by Khan et al. [6], the ventilation effectiveness of a building is governed not solely by the wind catcher, but by the combined influence of the wind catcher and the building’s window openings. Additionally, the temperature distribution of the building walls due to solar heat, the thermal properties of the building materials, and the temperature and pressure differences between the interior and exterior of the building all play crucial roles in determining the effectiveness of the wind catcher. In the numerical work of Cook [7], it is shown how the buoyancy forces due to vertical temperature gradients, is opposed by the wind forces, influencing accordingly the indoor air motion.
Many publications appear in open literature either experimental or computational exploring various parameters related to the performance of wind catchers. For example, based on wind tunnel experiments, it was found (Montazeri & Azizian [8]), that the internal airflow rate of a one-sided wind catcher attached to a building with an opening at its back side, is maximized for a zero-degree angle relative to the prevailing wind direction. Increasing the wind angle, the flow rate is reduced up to an angle of 68° at which the flow is minimized, while it changes direction for higher angles. In the latter case, the opening of the catcher becomes flow outlet, due to the prevailing low pressures in the wake of the wind catcher. The same authors in another publication (Montazeri & Azizian [9]), examining a model of a two-sided wind catcher model, found the internal flow rate to maximize at an angle of 90°, being 20% higher than for the zero-angle orientation angle. In Montazeri [10], the internal flow rate of multi-opening wind catchers was investigated both numerically and experimentally. The study found that increasing the number of openings reduces the sensitivity of the flow rate to wind direction. Based on the climatic conditions in Jordan, Badran [11] proposed a shorter wind catcher compared to traditional designs, suggesting that a 4 m-tall tower with a square cross-section of 0.57 m per side can lower the indoor temperature from 36 °C to 25 °C. In Dehghani-Sanij et al. [12], a wind catcher is proposed with a rotating top in order to be aligned with the prevailing wind direction as well as a solar chimney at low wind speed sites. In Alsailani et al. [13], the focus is on the maximization of the internal flow of a wind catcher, proposing several shapes and guide vanes of the catcher’s inlets for the reduction of the flow recirculation zone at the catcher bend duct. In Chohan et al. [14], a traditional UAE (United Arab Emirates) two-floor house (Al Zarouni House) was computationally examined, including two X-blade wind catchers, concluding that their best performance is from October to March, causing a maximum reduction in the interior temperature of 7°C. Recently, the influence of the wind catchers in the natural ventilation of a two- story house was computationally examined, including various openings (Tantasavasdi et al. [15]). In a computational work by Foroozesh et al. [16], a one-sided wind catcher is examined, in which water droplets are sprayed in order to enhance the cooling performance, achieving a maximum interior temperature reduction of 17.4°C. The same work includes an extensive list of relevant studies, providing a valuable source of information on wind catchers including water evaporation as an effective means for internal temperature reduction.
In Bahadori’s work [17], a system comprising several wind towers, a domed roof, and a basement water tank was examined. In this configuration, incoming air is cooled as it passes over the free surface of the water tank and then exits near the top of the domed roof, where a local pressure minimum exists, generated by the accelerated flow of the external air over the curved surface. In a subsequent study (Bahadori [18]), the same author proposed an alternative wind-catcher design in which evaporative cooling is achieved by spraying water into the catcher’s shaft through a series of clay conduits. Later, in an experimental investigation (Bahadori et al. [19]), the cooling performance of traditional wind catchers was found to be inferior to two modified configurations: one employing wetted cloth curtains suspended along the entire height of the tower, and another incorporating wetted pads placed directly at the air inlets.
Recent research has increasingly focused on hybrid passive ventilation systems, which integrate wind-driven airflow with components such as solar chimneys, wind catchers, and evaporative cooling units. Purely wind-driven systems fail on calm days, and purely buoyancy-driven systems are weak at night or on overcast days that solar heating is significantly reduced, as the temperature difference between indoor and outdoor air is minimized. A hybrid system ensures continuous and stable ventilation by having one force (buoyancy force) available to compensate when the other is weak (pressure force). For instance, when wind is low, solar chimney maintains the airflow rate as it is shown in the numerical work of Yue et al. [20].
In a recent comprehensive review by Li et al. [21], wind catchers are combined with earth-air heat exchangers, heat pipes and phase-change materials. For example, in Egypt (Mourad et al. [22]), a wind catcher is combined with a geothermal heat exchanger, allowing the air from the wind catcher shaft to flow through an underground channel, before flowing inside the building, being cooled off. In another application, in Sakhri et al. [23], the air is supplied from the wind catcher to the interior, whereas from another side of the building, outdoor air flows to the building’s interior through a 60 m long horizontal tube, buried in the earth at a depth of 1.5 m. The result was the comfort level to be increased up to 50%, especially when a window was open.
The influence of a phase change material (PCM) on the performance of a two-sided wind catcher was experimentally examined by Abdo et al. [24], being installed at the walls of an acrylic chamber as well as at the inlet duct of the wind catcher. The result was a reduction of the chamber’s temperature of about 3 degrees. Although more research has to be conducted in this area, it seems that the use of PCM is quite promising in this application.
Horizontal heat pipes installed in the vertical shaft of a wind catcher enhance heat exchange between the incoming and outgoing air streams. In summer, they help cool the incoming air before it enters the building, whereas in winter, they transfer heat from the exhaust air to the fresh air, warming it prior to entry. This idea was examined by Mahon et al. [25] both experimentally and numerically proving that this passive system can reduce the building’s heating and cooling demand.
Although a large body of research exists on this topic, a gap remains in the current literature regarding the cooling performance of wind catchers, particularly in relation to building’s heat-load simulation. Most previous studies have focused primarily on ventilation performance and geometric design, leaving the impact on cooling load insufficiently explored. The present work addresses this gap by installing electrical resistors inside a one-sided wind catcher model, which to the best of our knowledge has not been presented before. The model was placed within the test section of an open-circuit wind tunnel, and its cooling performance was evaluated through temperature measurements taken by thermocouples. The study examined five different wind speeds, five orientations, and two configurations for the back-end of the wind catcher cavity, namely open and closed, simulating fifty cases in total. It was found that the catcher’s cooling performance depends on the vertical temperature gradient within its shaft as well as on the pressure distribution at the openings, which varies with wind direction. Notably, the cooling performance increased when the wind catcher’s opening was positioned on the leeward side of the catcher’s shaft, due to both a suction-driven flow mechanism and a favorable vertical temperature gradient. To the best of our knowledge, this behavior has not been reported previously, most likely because existing experimental studies do not incorporate internal heat loads and therefore do not capture the coupled wind–buoyancy mechanism observed here.
2. Materials and Methods
A model of a wind catcher was constructed from wood due to its favorable thermal insulation properties. The model consisted of a vertical shaft 114 mm in height with an internal cross-section of 38 mm × 38 mm. One of the four vertical faces of the shaft had an opening, measuring 30 mm (horizontal) × 35 mm (vertical). The shaft was connected to a horizontal cavity, also made of wood, representing an interior space. The cavity was 200 mm in length, with a cross-section of 88 mm (horizontal) × 68 mm (vertical), including an opening at its end, simulating a window, measuring 70 mm (horizontal) × 56 mm (vertical). The walls of the model were 6 mm thick. Figure 1 illustrates the geometric details of the model. The chosen dimensions of the model are related to a real building through a scale factor. Namely, if the typical height of a residential building is considered to be 4 m ([26] (p.17), this size is 58.8 times larger compared to the 68 mm height of the model cavity. Therefore, assuming a scale factor of 58.8, the corresponding height of a real wind catcher would be 58.8 x 0.12 = 7.05 m, the side of its square cross-section 58.8 x 0.038 = 2.23 m, and its opening 1.76 m (horizontal) by 2.05 m (vertical). By comparison, in Bahadori et al. [19], a full scale wind catcher is examined with a net catcher height of 8 m, a cross- section of 1 m by 1 m, and an opening of 1.5 m, whereas in Ghadiri & Ibrahim [27], a 5 m tall catcher is studied with a 1.5 m side square cross-section and top openings of 1.5 m by 1.5 m.
Six polyamide flexible resistors (50 mm by 25 mm, R = 22 Ω each) were used to simulate the building's heat load, with their placement distributed between the vertical shaft and the horizontal cavity. For the vertical shaft (see Figure 2a), three resistors were attached just below its opening, with their longer dimension (50 mm) oriented vertically. One resistor was placed on the wall containing the catcher's opening, and the other two to the two adjacent walls. The fourth wall was left without a resistor, assuming it was thermally shadowed by the building. The remaining three resistors were installed in the horizontal cavity, specifically on the two vertical walls and the top (ceiling) wall. This arrangement assumed these three walls were exposed to solar radiation, while the floor was considered thermally insulated. The resistors were placed with their longer dimension being parallel to the longitudinal axis of the cavity, and their geometric center was positioned at the center of each respective wall (Figure 2b).
The resistors were connected to an adjustable AC voltage source (Variac) and the voltage was kept constant at V = 10.5 V. Therefore, the total applied heat load in the interior of the structure, Q, was:
Q = 6V2/R =6*10.52/22= 30.06 W
The applied voltage was chosen to ensure that the resistors’ temperature did not exceed 90 °C, thereby preventing any damage to the model, while allowing spatial temperature variations being detected by the temperature sensors. Based on the model’s total internal surface area of 792 cm², the heat load per unit internal wall area is calculated as 30.06/0.0792≈ 380 W/m². This value is higher than the typical heat loads reported for residential buildings in Bahrain. For example, Salem et al. [28] analyzed a two-story building with a floor area of 127 m² and windows covering 3.2% of the wall surface, in six Middle Eastern cities, including the capital of Bahrain. Their results indicate a mean heat load in the hottest month of July of approximately 100 W/m² for an indoor temperature of 22 °C (based on Figure 4 and Figure 5 of [28]). Nevertheless, although the heat load in the model is higher than the real building, this discrepancy does not affect the study’s conclusions, as the analysis is comparative in nature.
The temperature of the resistors surface was measured with a digital Infrared thermometer (MESTEK, IR02C), whereas the temperature in the model was measured using two K-type thermocouples positioned: one at the entrance of the vertical shaft (denoted as T1), on the vertical wall opposite to the catcher’s opening, and the other denoted as T2, in the middle of the cavity length at the bottom (floor) side. Both thermocouples were connected to a portable digital thermometer (Perfect Prime TC9815), which provided temperature readings with a resolution of 0.1°C.
The wind catcher model was placed in the test section of a subsonic, open-circuit wind tunnel at Bahrain Polytechnic, with a cross-sectional area of 305 mm × 305 mm. The velocity boundary layer over the floor of the wind tunnel, in the middle of the test-section where the model was placed, is shown in Figure 3, measured with a Pitot-Static tube of a 2 mm external diameter for a free stream speed of 9.04 m/s. Excluding a region up to 10 mm from the wall, in which the air speed increases with a high rate, in the rest the velocity spatial variation is much smaller, tending to a uniform distribution approaching the edge of the boundary layer, 40 mm far from the wall.
Five different orientations of the model relative to the incoming free stream were investigated: 0° (head-on wind, normal to the catcher’s opening), 45°, 90°, 135°, and 180° (opening in the lee side of the catcher’s shaft) and five free-stream velocities: 4.04 m/s, 5.71 m/s, 8.08 m/s, and 9.04 m/s. The airflow was regulated by adjusting the rotational speed of the wind tunnel’s fan motor and was measured using a Pitot-Static tube located at the entrance of the test section. The dynamic pressure fluctuations of the free-stream were within ±1% of the mean and the free stream temperature during testing was 19°C, with a maximum variation of 0.5°C.
The blockage ratio (projected model area to the cross sectional area of the wind tunnel) took a maximum value of 23.66% (at 90° model orientation), causing an increase of the free stream velocity of 0.25*0.2366 = 5.9% according to Barlow et al. [29] (page 374, equation 10.22).
For each combination of model orientation and free-stream velocity, two configurations were tested: one with the cavity at its back side open and the other being closed, simulating the case of a window at the back side of a building being open and closed, respectively. In total, 50 test cases were conducted. For each case, the resistors were connected to the power source, and once the two temperatures, T1 (at the catcher’s opening) and T2 (at the middle of the cavity), were at 42°C and 26°C, respectively, with a deviation of 0.5°C, the wind tunnel was turned on. After two minutes of airflow, the two temperatures were recorded. This approach enabled the assessment of the wind catcher’s cooling performance by evaluating the temperature change at the floor level (final T2 temperature minus initial T2 temperature), so that essentially cooling referred to a negative T2 temperature change. An estimate of the vertical temperature gradient was also found based on the temperature difference T1 –T2 at the end of the 2 min interval. The experiments for each configuration were repeated to verify the consistency of the results. The repeated measurements showed temperature variations of no more than 0.5 °C, indicating good repeatability.
3. Results
The results are summarized in Figure 4 and Figure 5, for the closed and open cavity cases, respectively.
3.1. Closed Cavity
The results presented in Figure 4a show that, regardless of the wind speed magnitude, the greatest cooling effect when the cavity is closed at its back appears for a wind direction of 180° (α = 180°), measuring a 4°C temperature drop in T2. For this orientation, the temperature at the catcher inlet (T1) is more than 5°C higher than at the floor (as shown in Figure 4b), creating a thermal gradient that drives upward airflow. Additionally, because the catcher's opening at α = 180° lies in the wake of the structure, it is exposed to lower static pressures (suction), which further enhances the internal airflow. These two mechanisms, namely the temperature-induced buoyant flow and the wind-induced suction, work together to maximize the cooling effect.
In contrast, the 0° orientation exhibits an inverse (negative) vertical temperature gradient, with the temperature at the top being more than 7.5°C lower than at the floor level. Additionally, the pressure at the catcher's opening is highest due to the formation of a stagnation point at the inlet. As a result, neither the thermal gradient nor the wind-induced pressure spatial difference contributes positively to internal airflow. Consequently, the cooling effect is reduced, with a maximum temperature drop in T2 by only 1.7°C at the highest tested wind speed (9.04 m/s). In fact, for wind speeds below 5.7 m/s, the floor-level temperature T2 actually increases (positive temperature change, Figure 4a), indicating that the catcher heats the air rather than cooling it under this condition.
The worst performance is observed for the 90° orientation (α = 90°), where the system heats the air instead of cooling. As shown in Figure 4a, the ground-level temperature increases with wind speed for this orientation. The vertical temperature gradient is positive up to a wind speed of 6.5 m/s, but reverses at higher speeds (Figure 4b). Overall, for the closed cavity configuration, the best cooling performance is achieved at α = 180°, and it progressively deteriorates as the orientation shifts through α = 135°, α = 0°, α = 45°, reaching its lowest efficiency at α = 90°.
3.2. Open Cavity
In contrast to the closed cavity configuration, where in some cases the air is heated rather than cooled, the open back-side case consistently results in cooling (negative change in T2), regardless of wind speed or orientation angle.
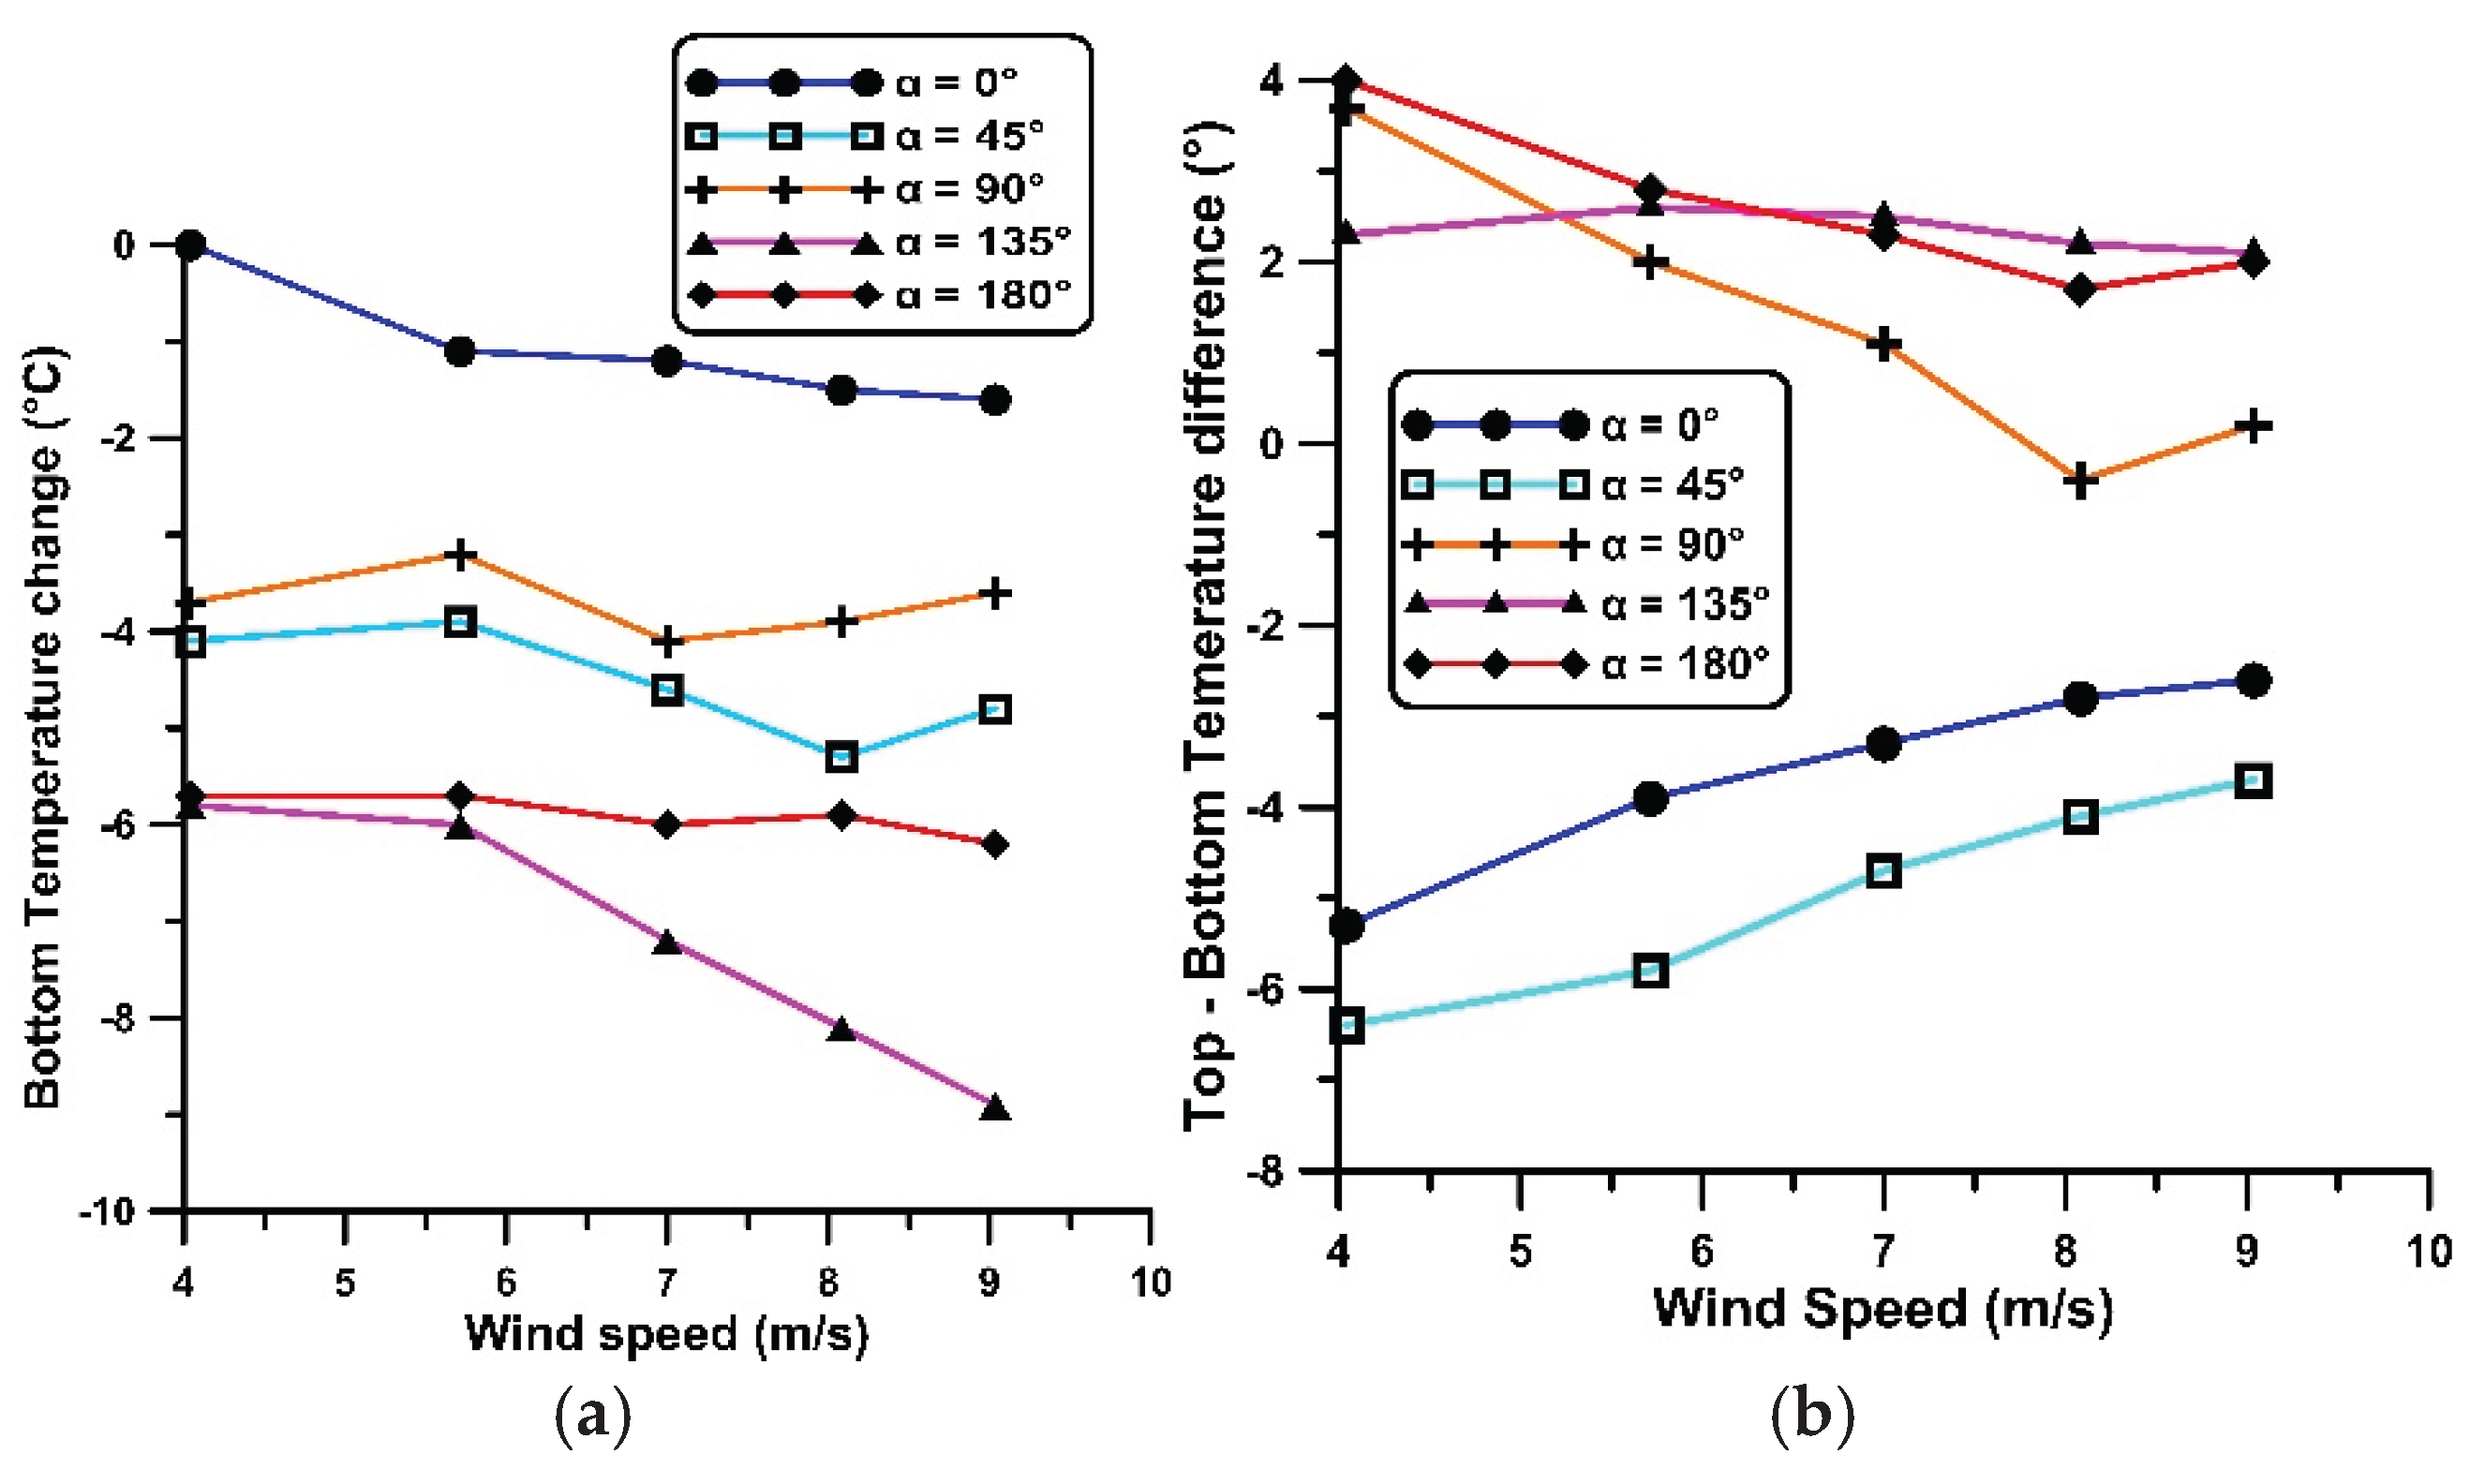
As shown in Figure 5a, the maximum reduction in the floor-level temperature T2 occurs at an orientation of α = 135°, reaching 9°C. At the same time, the temperature at the upper level is 2°C higher than at the floor level (Figure 5b). A plausible explanation for this significant temperature drop, compared to the closed cavity case, is that at this particular orientation, air enters the cavity from the rear and exits through the top opening of the wind catcher, effectively cooling the ground floor. Additionally, the temperature gradient assists air movement, as temperature increases with elevation along the catcher shaft, enhancing natural convection in the direction of the airflow (from lower to higher level).
In contrast, under a 0° wind orientation, the cooling effect is limited, with floor-level temperature reduced by almost 2°C. In this configuration, air enters directly through the catcher opening and removes the heat from the electric resistors located both near the catcher inlet and at the floor level. As a result, the heated air flows over the area where the temperature is measured close to the floor, diminishing the overall cooling effect. Regarding the vertical temperature gradient, in this case, it is favorable in the sense that the temperature increases along the direction of airflow, from 3°C to 5°C, dependent on the wind speed. The cooling performance deteriorates as the angle changes from α = 135° to α = 180° for which the temperature drop is close to 6°C, then to α = 45° for which the temperature drop is between 4°C to 5°C, then to α = 90° (temperature drop 3°C to 4°C) and finally to α = 0° (temperature drop of 2°C). The better cooling performance at α = 135° compared to α = 180°, might be attributed to the higher suction pressures at the catcher’s opening, due to its close proximity to the wind tunnel’s vertical walls, causing a local acceleration of the flow outside the model. Nevertheless, again the cooling performance of the wind catcher is superior when its opening is located at the lee side of its shaft.
It is also interesting to note that for the open cavity case, besides the α = 135° orientation, the wind speed’s change influence on T2 is minor, in contrast to the closed cavity case.
4. Discussion
The model examined in this study represents the simplest form of a wind catcher, featuring only a single opening and lacking internal partitions within the vertical shaft. However, wind catchers typically include multiple openings and various internal partitions, which facilitate airflow by allowing fresh air to enter through one port and exit through another. This detail plays a significant role in their thermal performance. Of course, one-sided wind catchers do exist, although this is not a rule (Montazeri [10]). In the current study, for the closed cavity configuration, the optimal cooling effect was observed when the wind catcher opening was positioned in the wake of the structure. In this scenario, the lower local external pressure effectively drew out the interior air, enhancing ventilation mainly through a suction mechanism. Similar observation was done in Montazeri & Azizian [8], in which the orientation of α = 180° was found to be working effectively, when the catcher operates as a suction device. Natural convection, in this case, plays a smaller role. In fact, for α = 180°, the removed heat was estimated to be about 15% of the total heat load in the present study. More particularly, the removed heat from the vertical walls of the wind catcher shaft, is given by:
where the exposed area A = 0.038*3*0.08 = 0.009 m2, considering that the three heated walls of 0.038 m width are 0.08 m long (as the part of the catcher’s opening is excluded). The average temperature of the wall where the heaters were installed was = 90°C and the mean temperature of the air = 27.35°C (based on the top and bottom air temperatures), for α = 180°. The heat transfer coefficient was calculated using the formula for vertical plates for natural convection (Table 9.1, equation 9-19, Cengel and Ghajar [30]), assuming a minimal interaction between the boundary layers of the three walls:
where the Rayleigh number and the Grashof number is β, where = 0.08 m (the length of each of the four sides of the shaft) and the air kinematic viscosity at the average temperature ( Based on the above, and the heat transfer coefficient, . Therefore, based on (2), the removed heat by natural convection is 4.38 W or 14.60 % of the total heat load. In a computational and experimental work by Carreto-Hernandez et al. [31], where in a wind tower 3.85 m high a spray humidification system was applied, the Grashof number varied from 109 to 1010 and the Nusselt number took values up to 200 (Figure 12 in [31]). The latter much higher values compared to this work, are mainly due to the small scale of the model. However, the heat transfer coefficient values are comparable with the present, since they did not exceed (Figure 15, in [31]).
It is also important to highlight that the incoming air stream used in the experiments had a temperature of 19°C. As reported in Chohan et al. [14], the optimal performance of wind catchers in the UAE occurs when ambient nighttime temperatures range between 16°C and 24°C, causing a maximum interior temperature reduction of 7°C. In comparison, the current study demonstrated a maximum temperature reduction of 4°C in the closed cavity configuration and up to 9°C in the open cavity case.
It should be noted that in all fifty cases examined, the temperatures at the moment the wind tunnel was activated were T1 = 42 °C and T2 = 26 °C, with a maximum deviation of 0.5 °C. The higher value of T1 compared to T2 was due to the closer proximity of the thermocouple to the three resistors, in the catcher’s shaft. The initial value of T2 was selected to be higher than the temperature of the free stream. Although these initial temperatures were selected arbitrarily, they were kept constant across all tests to ensure meaningful comparisons. The conclusions in this study are drawn based on temperature measurements taken after a 2-minute operation period of the wind tunnel. Increasing this period to 4 minutes the trends remained the same. Furthermore, changing the location of temperature measurement at the middle of the cavity, from the bottom wall to the mid-height, for the highest wind speed of 9.04 m/s case, again the trends were the same. As it is shown in the computational work of Foroozesh et al. [16] (Figure 3), the temperature field is quite uniform from the middle of the cavity till its exit, giving an explanation why the change of the location did not alter the results. Nevertheless, based on numerical predictions (Nejat et al. [32]; Sangdeh & Nasrollahi [33]; Shayegani et al. [34]), the flow and temperature field in the cavity is three dimensional, and future work aims to expand the number of temperature measurement points, enabling a more accurate assessment of the wind catcher’s thermal performance.
5. Conclusions
The cooling performance of a one-opening wind catcher was experimentally investigated in a wind tunnel using a wooden model. Electric resistors were employed to simulate heat loads at both the catcher shaft and a horizontal cavity connected to the catcher. The study focused on assessing the influence on cooling performance of wind speed and wind direction relative to the catcher opening. Wind speeds ranging from 4 m/s to 9 m/s were tested, along with five wind orientation angles with respect to the catcher’s opening: 0°, 45°, 90°, 135°, and 180°. Two cases were examined, namely considering the back end of the cavity closed and open, respectively.
Closed cavity
The greatest cooling effect within the cavity (maximum temperature drop of 4°C) was observed when the wind direction was at 180°. In this case, the wind catcher opening was located in the wake of the vertical shaft, resulting in a low-pressure zone that, combined with a favorable vertical temperature gradient, enhanced the induced air-flow and cooling performance. The poorest cooling performance was observed at the 90° wind orientation, at which the air within the cavity was heated rather than cooled for all tested wind speeds. For the remaining wind directions, the performance was intermediate, improving with increasing wind speed.
Open cavity
When the cavity was open, the interior temperature consistently decreased, regardless of the wind speed or orientation angle. The maximum temperature reduction of 9°C, was observed at a 135° wind direction, namely more than twice the cooling achieved in the closed cavity case. This significantly enhanced performance is attributed to forced convection, as air entered from the rear of the cavity. Additionally, a favorable vertical temperature gradient, with higher temperatures at the top of the catcher, contributed to the improved cooling effect. Regarding the other orientations, the temperature reduction was from 2°C to 6°C.
Limitations
The wind catcher is assumed to operate in isolation, exposed to winds over flat terrain. As a result, the effects of neighboring buildings are not included in the analysis, an important limitation when considering use in urban environments. However, for densely populated areas, the operation of the wind catcher would be simulated with the closed cavity case, as the worst case scenario.
Author Contributions
Conceptualization, D.S.; methodology, D.S.; software, D.S., M.Y. and N.V.; validation, D.S., M.Y. and N.V.; investigation, D.S. and C.G.; data curation, D.S., M.Y. and N.V.; writing—original draft preparation, D.S. and C.G.; writing—review and editing, D.S. and C.G; visualization, D.S. and M.Y. All authors have read and agreed to the published version of the manuscript.
Funding
This research received no external funding.
Data Availability Statement
Data are available at reasonable request.
Conflicts of Interest
The authors declare no conflicts of interest.
References
- Chenari, B.; Carrilho, J.D.; Gameiro da Silva, M. Towards sustainable, energy-efficient and healthy ventilation strategies in buildings: A review. Renewable and Sustainable Energy Reviews 2016, 59, 1426–1447. [Google Scholar] [CrossRef]
- Reynolds, N. Architectural Design for Procuring Thermal Comfort: Hassan Fathy, Nubia, and Desert Building. International Journal of Islamic Architecture 2024, 13(2), 361–391. [Google Scholar] [CrossRef]
- Saadatian, O.; Haw, L.C.; Sopian, K.; Sulaiman, L.Y. Review of wind catcher technologies. Renewable and Sustainable Energy Reviews 2012, 16, 1477–1495. [Google Scholar] [CrossRef]
- Hughes, B.R.; Calautit, J.K.; Ghani, S.A. The development of commercial wind towers for natural ventilation: A review. Applied Energy 2012, 92, 606–627. [Google Scholar] [CrossRef]
- Jomehzadeh, F.; Nejat, P.; Calautit, J.K.; Yusof, M.B.M.; Zaki, S.A.; Hughes, B.R.; Yazid, M.N.A.W.M. A review on windcatcher for passive cooling and natural ventilation in buildings, Part 1: Indoor air quality and thermal comfort assessment. Renewable and Sustainable Energy Reviews 2017, 70, 736–756. [Google Scholar] [CrossRef]
- Khan, N.; Su, Y.; Riffat, S.B. A review on wind driven ventilation techniques. Energy and Buildings 2008, 40, 1586–1604. [Google Scholar] [CrossRef]
- Cook, M.; Ji, Y.; Hunt, G. CFD modelling of buoyancy driven natural ventilation opposed by wind. Ninth International IBPSA Conference 2005, Montréal, Canada, August 15-18; pp. 207–214.
- Montazeri, H.; Azizian, R. Experimental study on natural ventilation performance of one-sided wind catcher. Building and Environment 2008, 43, 2193–2202. [Google Scholar] [CrossRef]
- Montazeri, H.; Azizian, R. Experimental study on natural ventilation performance of a two-sided wind catcher. Proc. IMechE Part A: J. Power and Energy 2009, 223, 387–400. [Google Scholar] [CrossRef]
- Montazeri, H. Experimental and numerical study on natural ventilation performance of various multi-opening wind catchers. Building and Environment 2011, 46, 370–378. [Google Scholar] [CrossRef]
- Badran, A.A. Performance of cool towers under various climates in Jordan. Energy and Buildings 2003, 35, 1031–1035. [Google Scholar] [CrossRef]
- Dehghani-Sanij, A.R.; Soltani, M.; Raahemifar, K. A new design of wind tower for passive ventilation in buildings to reduce energy consumption in windy regions. Renewable and Sustainable Energy Reviews 2015, 42, 182–195. [Google Scholar] [CrossRef]
- Alsailani, M.; Montazeri, H.; Rezaeiha, A. Towards optimal aerodynamic design of wind catchers: Impact of geometrical characteristics. Renewable Energy 2021, 168, 1344–1363. [Google Scholar] [CrossRef]
- Chohan, A.H.; Awad, J.; Elkahlout, Y.; Abuarkub, M. Evaluating wind catchers in UAE heritage architecture: A pathway to zero-energy cooling solutions. Ain Shams Engineering Journal 2024, 15, 102936. [Google Scholar] [CrossRef]
- Tantasavasdi, C.; Arttamart, S.; Inprom, N. Combined wind catchers and side windows for cross ventilation in row houses. Journal of Engineering, Design and Technology 2025, 23(3), 1039–1056. [Google Scholar] [CrossRef]
- Foroozesh, J.; Hosseini, S.H.; Hosseini, A.J.A.; Parvaz, F.; Elsayed, K.; Babaoglu, N.U.; Hooman, K.; Ahmadi, G. CFD modeling of the building integrated with a novel design of a one-sided wind-catcher with water spray: Focus on thermal comfort. Sustainable Energy Technologies and Assessments 2022, 53, 102736. [Google Scholar] [CrossRef]
- Bahadori, M.N. Passive Cooling Systems in Iranian Architecture. Scientific American 1978, 238(2), 144–154. [Google Scholar] [CrossRef]
- Bahadori, M.N. An improved design of wind towers for natural ventilation and passive cooling. Solar Energy 1985, 35(2), 119–129. [Google Scholar] [CrossRef]
- Bahadori, M.N.; Mazidib, M.; Dehghani, A.R. Experimental investigation of new designs of wind towers. Renewable Energy 2008, 33, 2273–2281. [Google Scholar] [CrossRef]
- Yue, S.; Ge, Z.; Xu, J.; Xie, J.; Xie, J.; Zhang, S.; Li, J. Analysis of the ventilation performance of a solar chimney coupled to an outdoor wind and indoor heat source. Applied Sciences 2023, 13, 2585. [Google Scholar] [CrossRef]
- Li, J.; Calautit, J.; Jimenez-Bescos, C.; Song, W.; Riffat, S.; Chen, Q. Climate-adaptive windcatcher natural ventilation integrated with passive and low-energy technologies: A review of current and future developments. Building and Environment 2025, 284, 113436. [Google Scholar] [CrossRef]
- Mourad, M.; Ali, H.H.; Ookawara, S.; Abdel-Rahman, A.K. Wind catcher earth air tunnel for passive cooling: Annual energy performance of residential home in new cites of Egypt. The Asian Conference on Sustainability, Energy and the Environment 2014. Official Conference Proceedings, 0748.
- Sakhri, N.; Osra, O.A.; Alsaygh, F.S.; Almutery, S.B.; Menni, Y. Optimizing indoor thermal comfort with wind towers and earth to air heat exchangers: a sustainable solution for energy-efficient housing. International Journal of Low-Carbon Technologies 2023, 18, 915–928. [Google Scholar] [CrossRef]
- Abdo, P.; Huynh, B.P.; Braytee, A.; Taghipour, R. An experimental investigation of the thermal effect due to discharging of phase change material in a room fitted with a windcatcher. Sustainable Cities and Society 2020, 61, 102277. [Google Scholar] [CrossRef]
- Mahon, H.; Friedrich, D.; Hughes, B. Wind tunnel test and numerical study of a multi-sided wind tower with horizontal heat pipes. Energy 2022, 260, 125118. [Google Scholar] [CrossRef]
- Royal Commission for AlUla. Urban design general guidelines AlUla central & south. 10 May 2024. Available online: https://www.rcu.gov.sa/getmedia/3f64789e-a956-48d8-969c-44a81c685474/6-urban-design-general-guidelines.pdf.
- Ghadiri, M.; Ibrahim, N. The Effect of Wind catcher geometry on the indoor thermal behavior. 45th Annual Conference of the Australian and New Zealand Architectural Science Association (ANZAScA 2011), 16-18 November, 2011.
- Salem, H.; Khanafer, K.; Alshammari, M.; Sedaghat, A.; Mahdi, S. Cooling degree days for quick energy consumption estimation in the GCC countries. Sustainability 2022, 14, 13885. [Google Scholar] [CrossRef]
- Barlow, J.B.; Rae, W.H.; Pope, A. Low Speed Wind Tunnel Testing, 3rd ed.; John Wiley & Sons, Inc: New York, NY, USA, 1999; ISBN 978-0-471-55774-6. [Google Scholar]
- Cengel, Y.A.; Ghajar, A.J. Heat and Mass Transfer, 5th ed.; McGraw-Hill, 2015; ISBN 978-0-07-339818-1. [Google Scholar]
- Carreto-Hernandez, L.G.; Moya, S.L.; Baez-Garcia, W.G.; Herazo, L.C.S.; Hernandez, A.F.; Jeronimo, J.C.H; Velazquez, E.T. Numerical-experimental investigation of a wind tower-room sustainable system: A parametric analysis of the mixed convection with humidification. Journal of Building Engineering 2024, 91, 109624. [Google Scholar] [CrossRef]
- Nejat, P.; Fekri, Y.; Sheikhshahrokhdehkordi, M.; Jomehzadeh, F.; Alsaad, H.; Voelker, C. The Windcatcher: A Renewable-Energy-Powered Device for Natural Ventilation—The Impact of Upper Wing Walls. Energies 2024, 17, 611. [Google Scholar] [CrossRef]
- Sangdeh, P.K.; Nasrollahi, N. Wind catchers and their applications in contemporary architecture. Energy and Built Environment 2022, 3, 56–72. [Google Scholar] [CrossRef]
- Shayegani, A.; Joklova, V.; Illes, J. Optimizing wind catcher designs for effective passive cooling strategies in Vienna’s urban environment. Buildings 2024, 14, 765. [Google Scholar] [CrossRef]
Figure 1.
Basic dimensions of the wind catcher model.
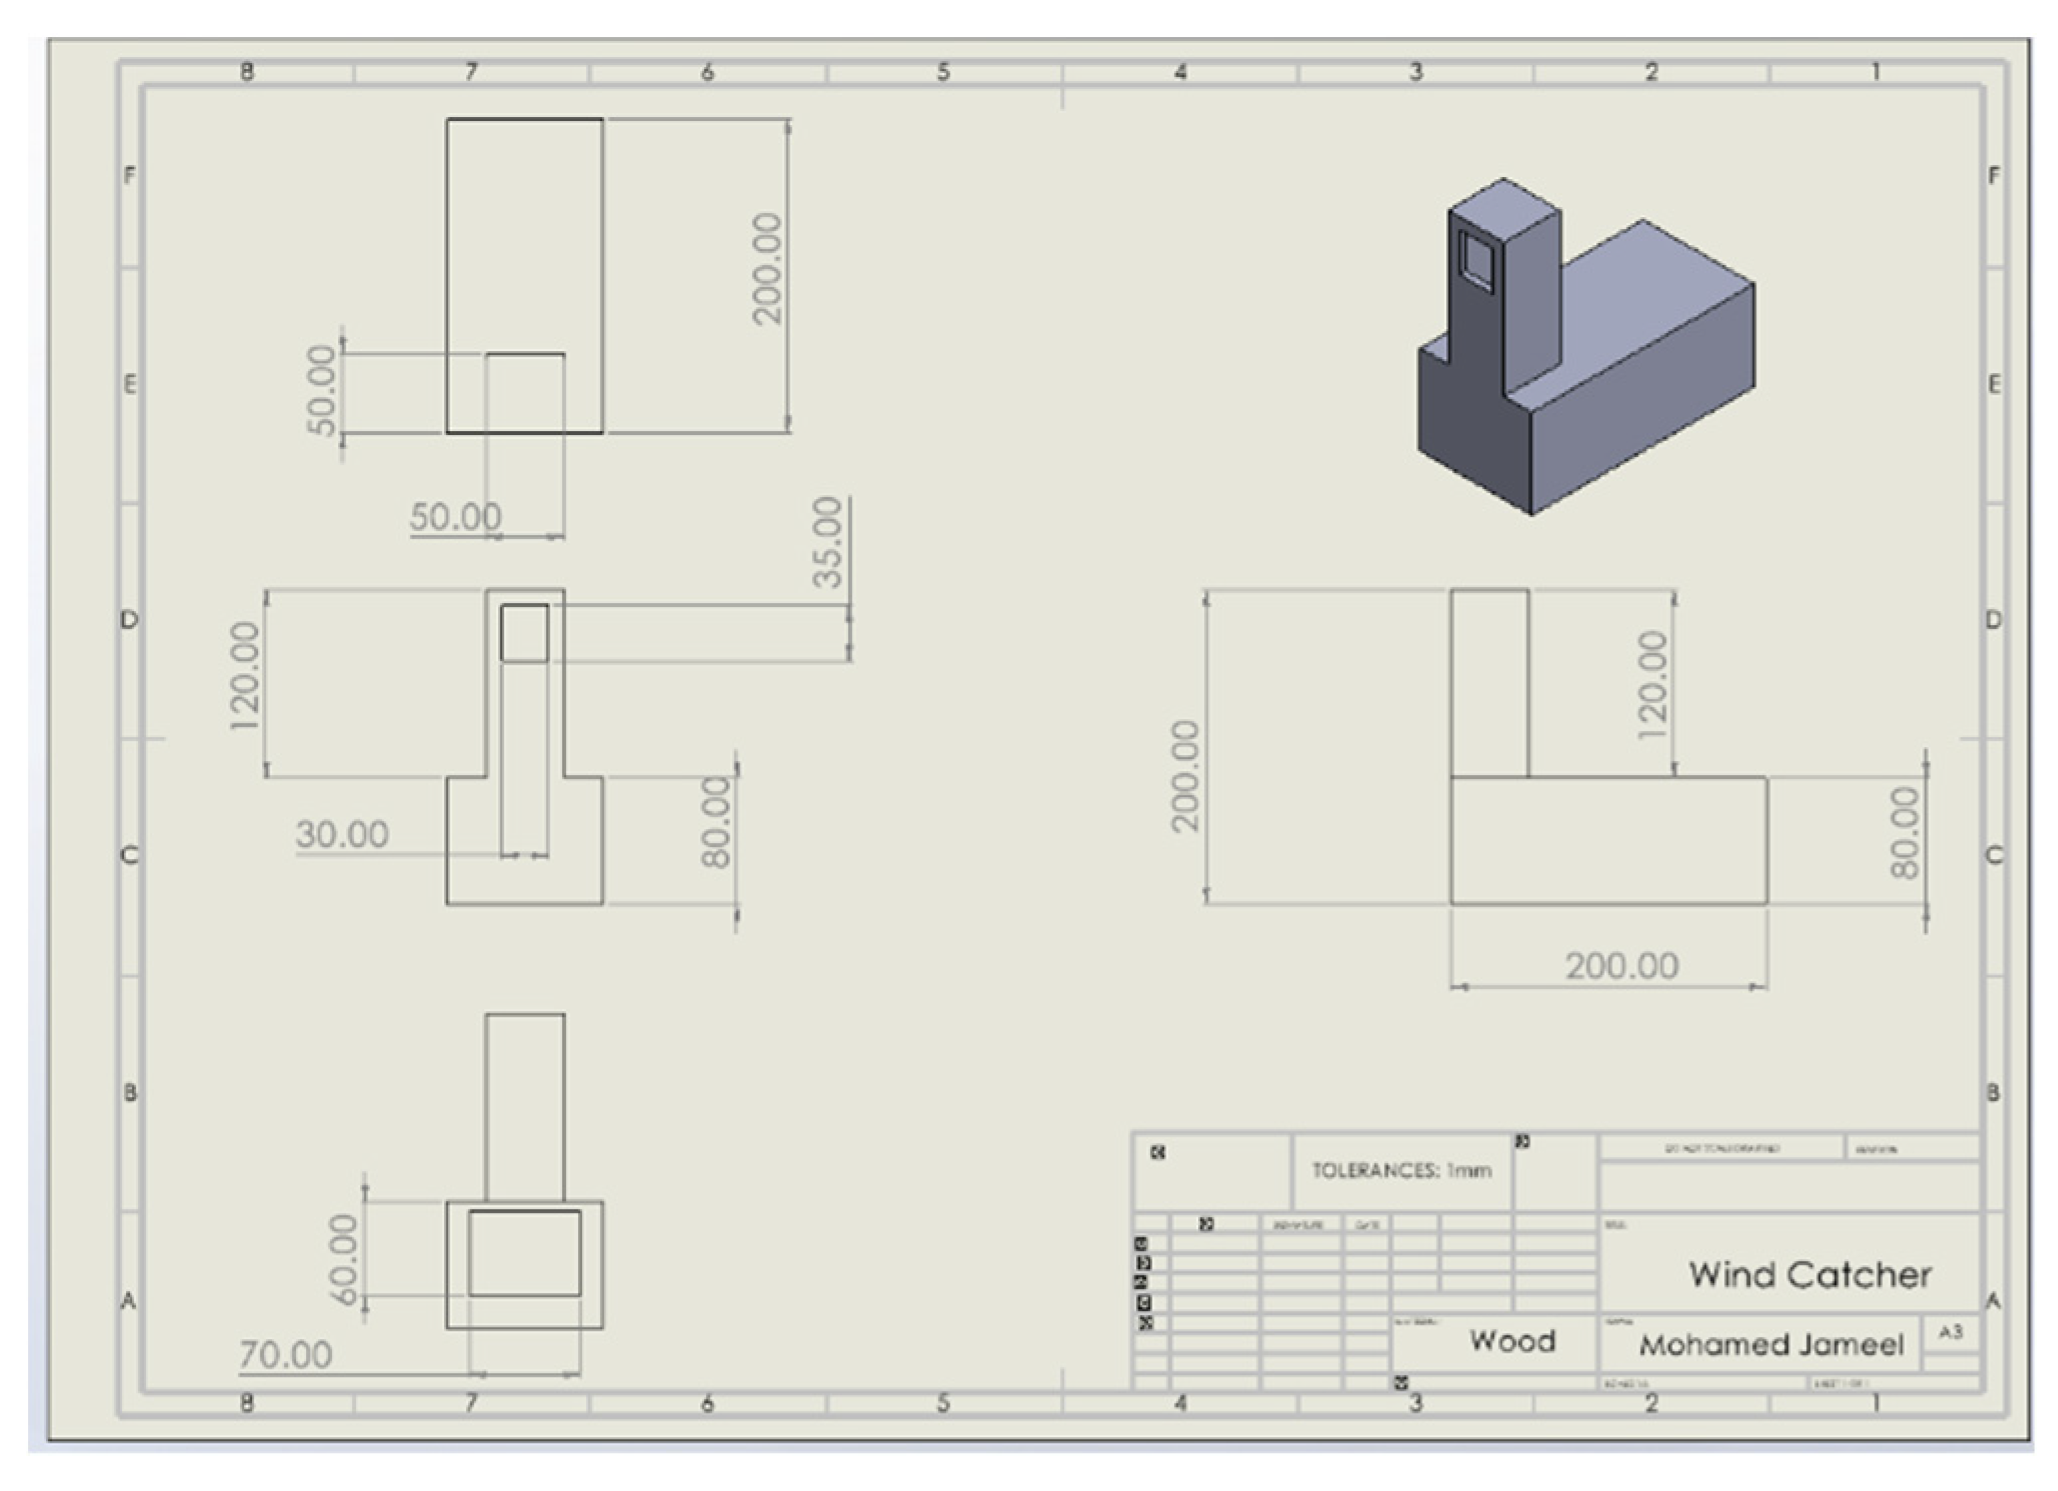
Figure 2.
Six electric resistors installed in the interior of the model: a) three resistors in the vertical shaft, b) three resistors in the horizontal cavity, c) resistor.
Figure 2.
Six electric resistors installed in the interior of the model: a) three resistors in the vertical shaft, b) three resistors in the horizontal cavity, c) resistor.
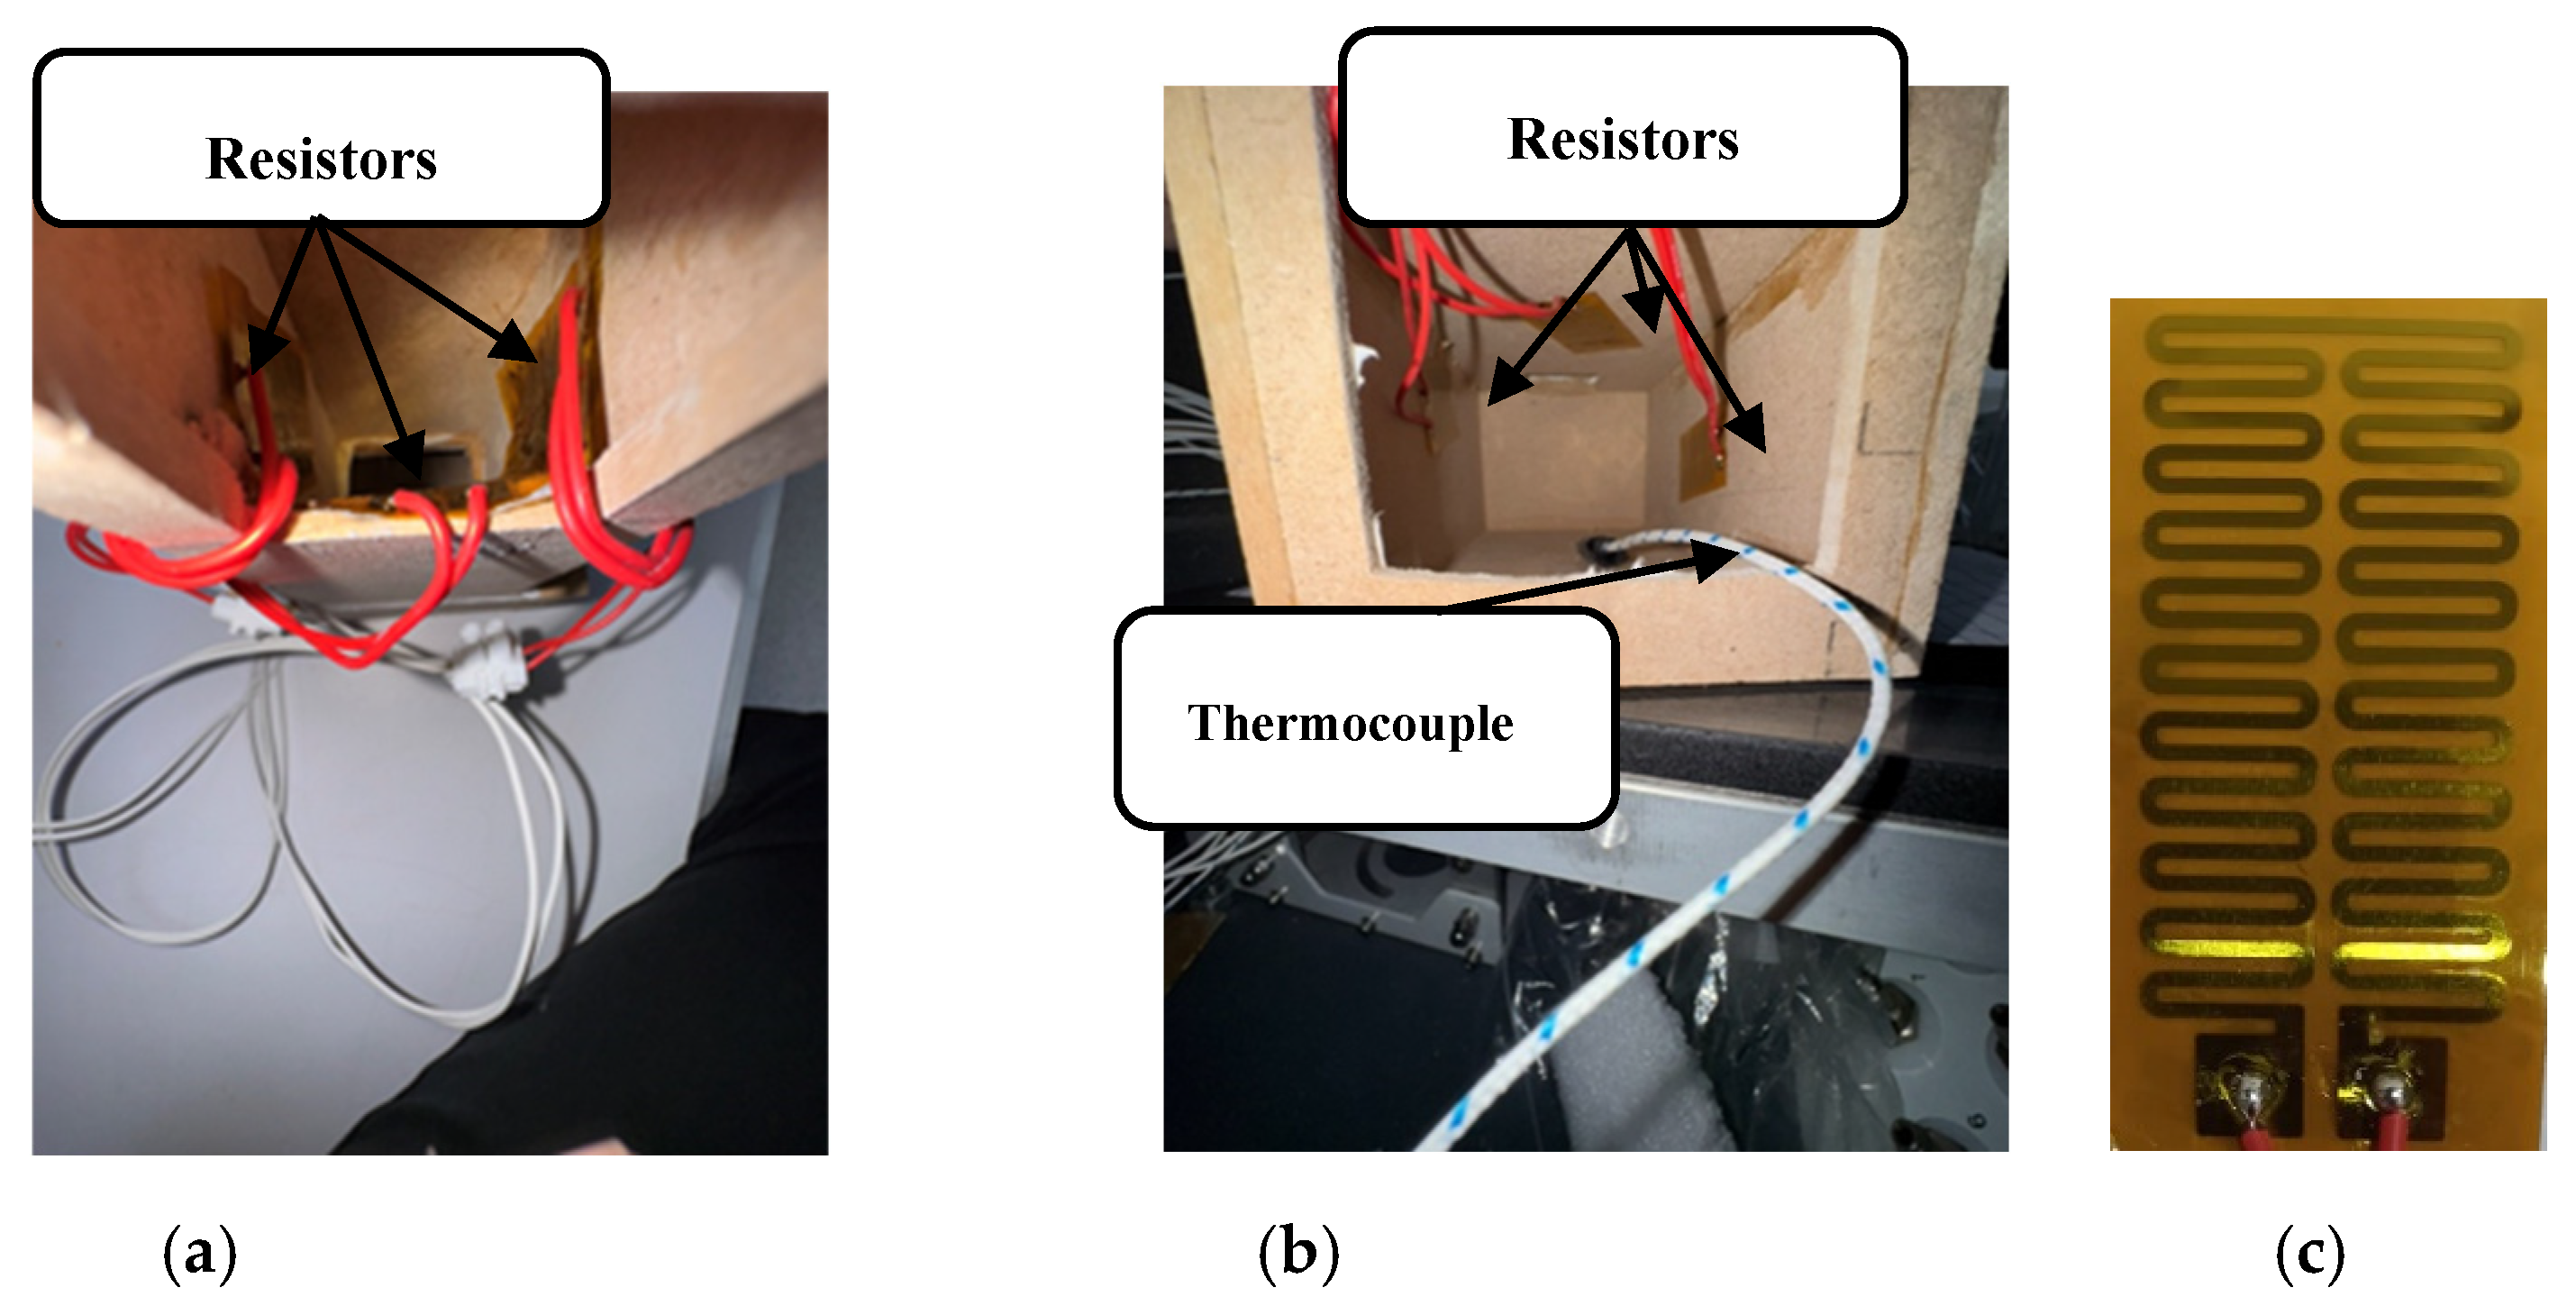
Figure 3.
Wind tunnel boundary layer.
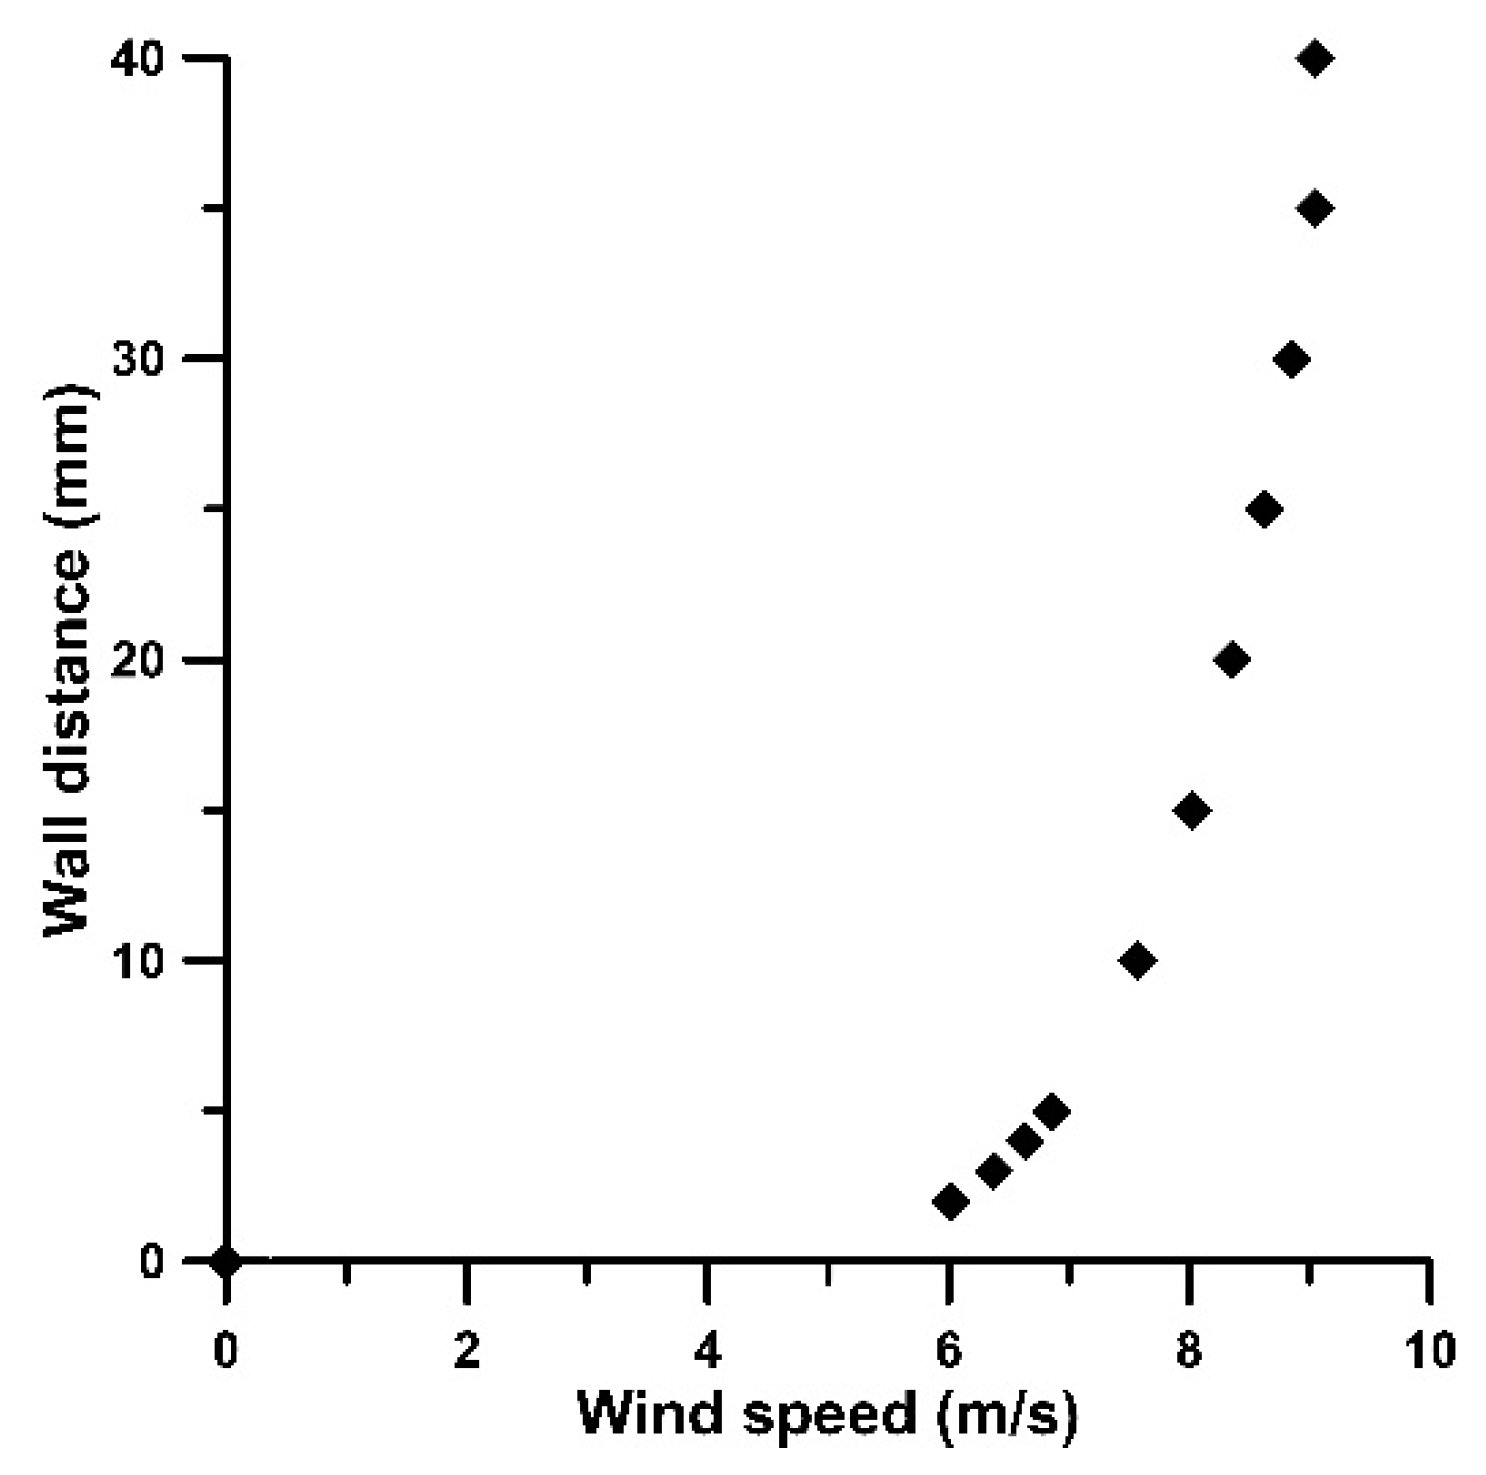
Figure 4.
Closed cavity cooling performance for various wind speeds and wind catcher orientations. (a) Change of floor temperature T2, (b) Vertical temperature difference (T1 –T2).
Figure 4.
Closed cavity cooling performance for various wind speeds and wind catcher orientations. (a) Change of floor temperature T2, (b) Vertical temperature difference (T1 –T2).
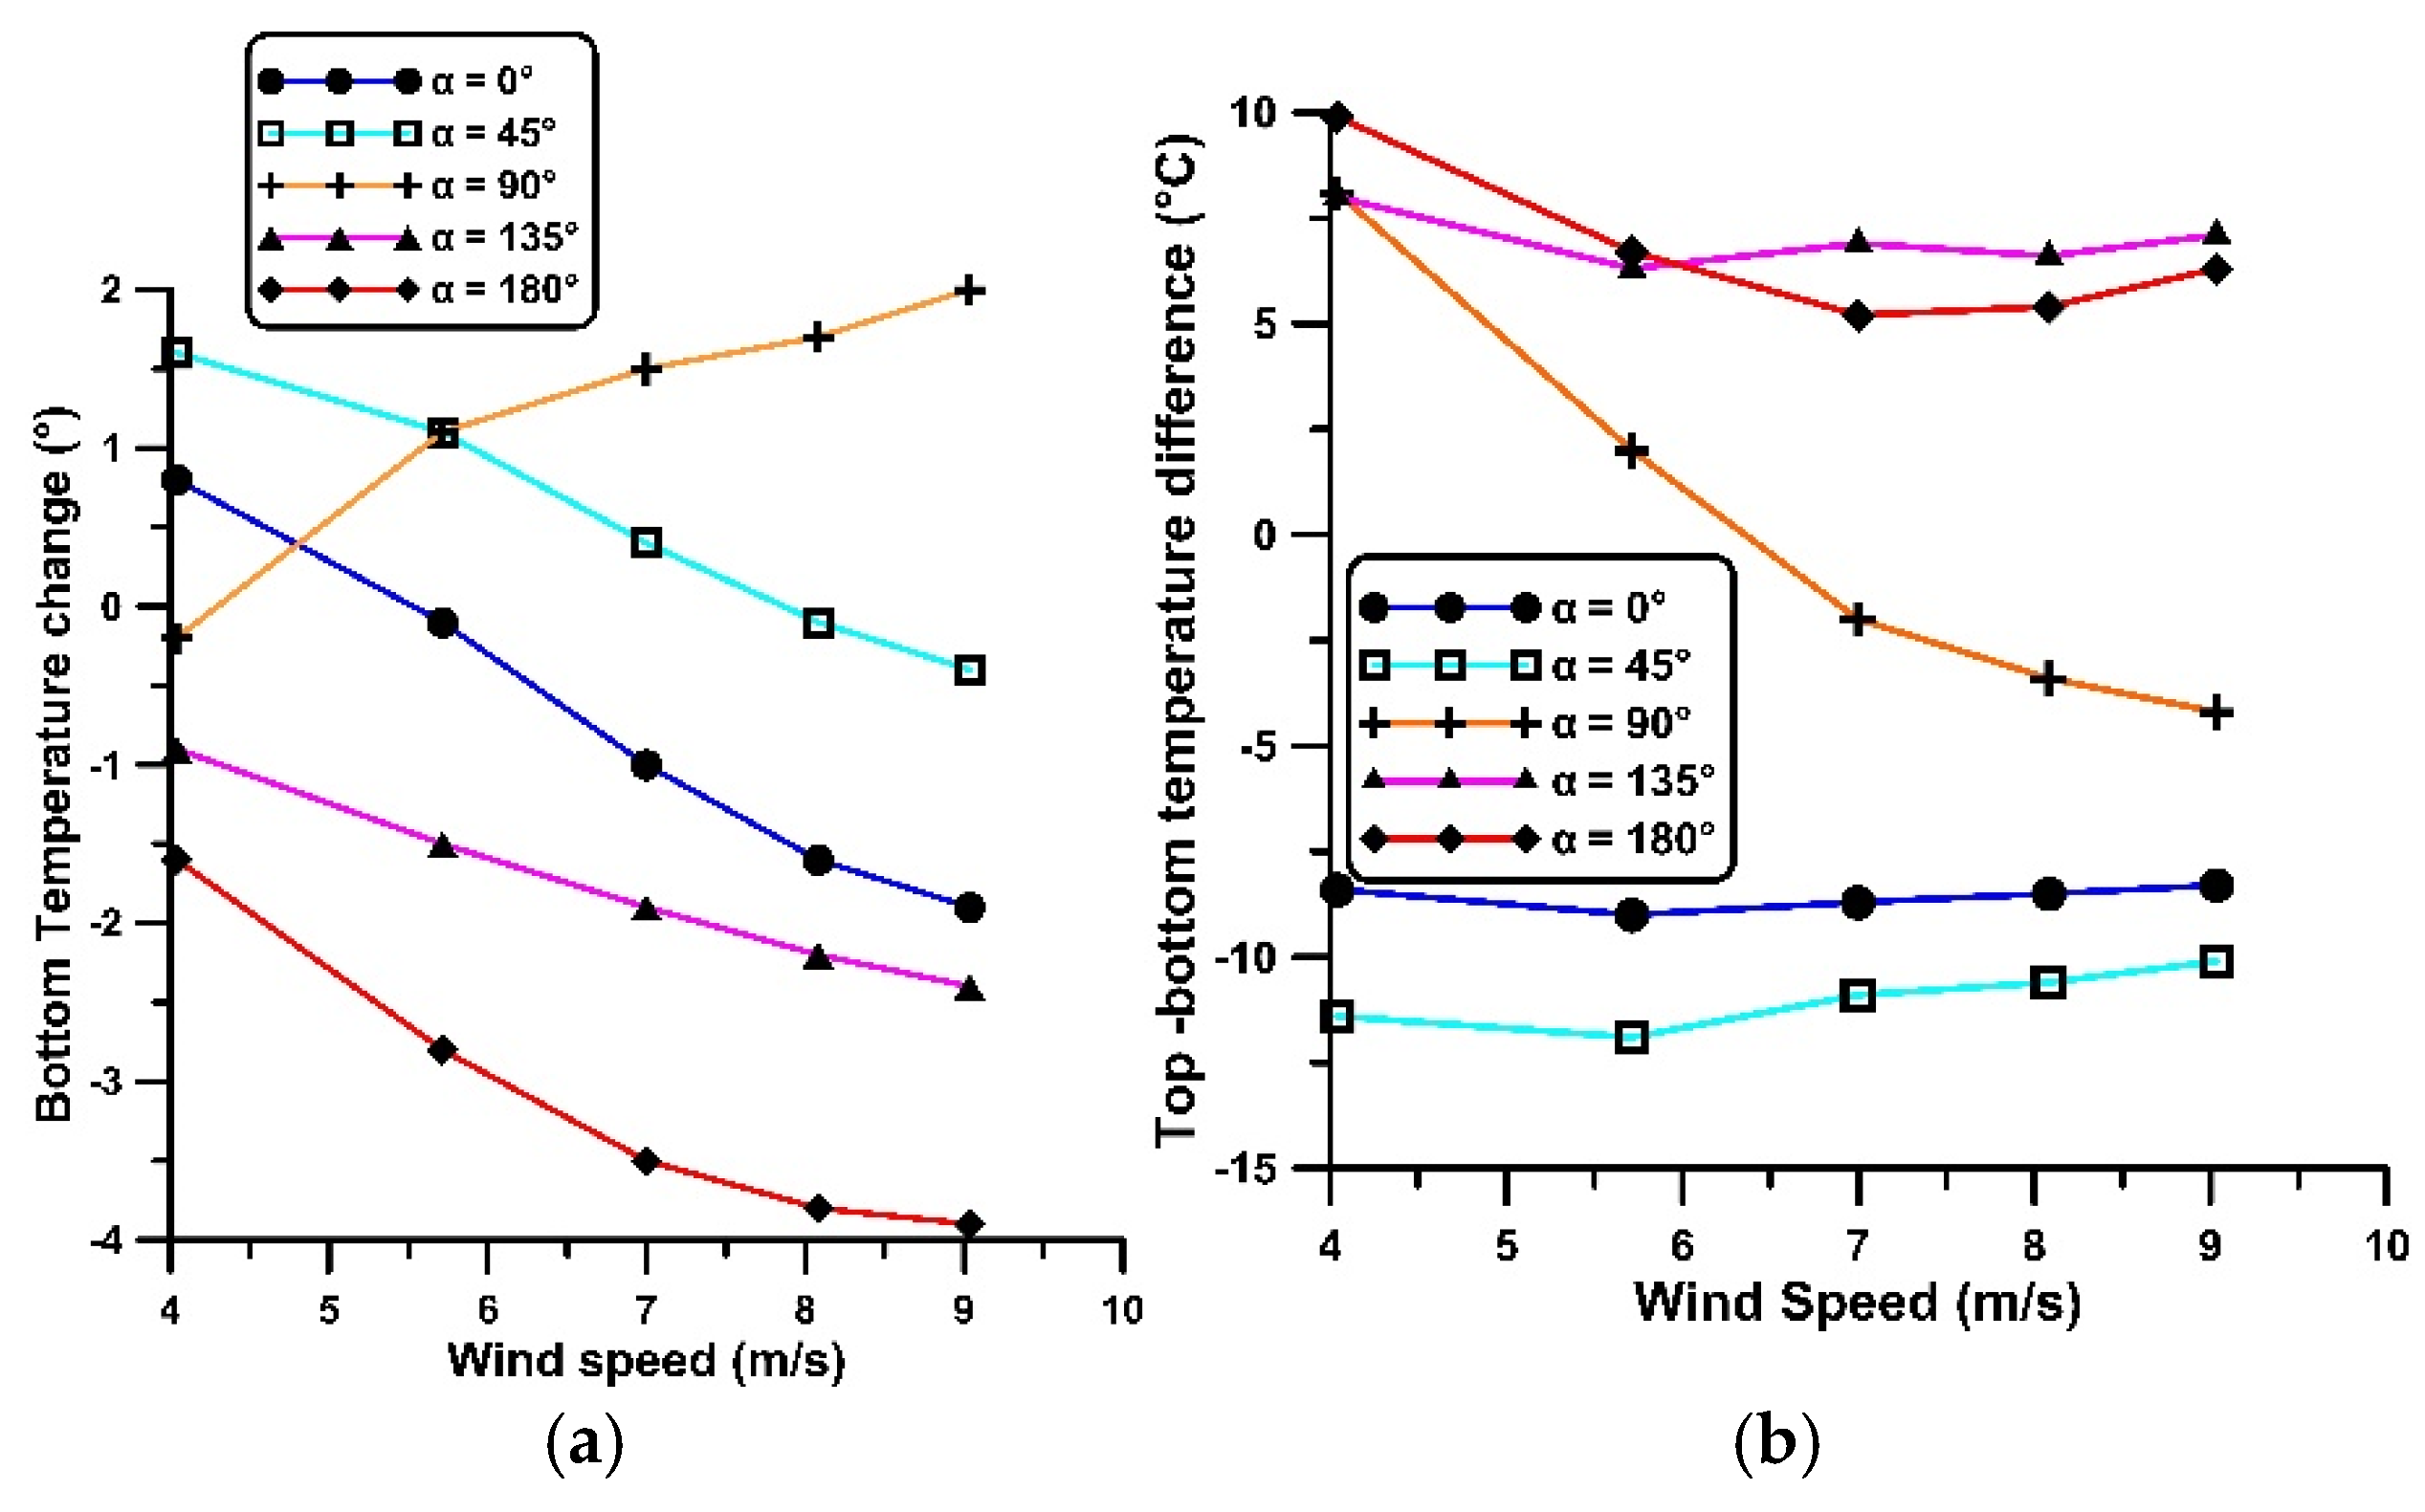
Figure 5.
Open cavity cooling performance for various wind speeds and wind catcher orientations. (a) Change of floor temperature T2, (b) Vertical temperature difference (T1-T2).
Figure 5.
Open cavity cooling performance for various wind speeds and wind catcher orientations. (a) Change of floor temperature T2, (b) Vertical temperature difference (T1-T2).
Disclaimer/Publisher’s Note: The statements, opinions and data contained in all publications are solely those of the individual author(s) and contributor(s) and not of MDPI and/or the editor(s). MDPI and/or the editor(s) disclaim responsibility for any injury to people or property resulting from any ideas, methods, instructions or products referred to in the content. |
© 2025 by the authors. Licensee MDPI, Basel, Switzerland. This article is an open access article distributed under the terms and conditions of the Creative Commons Attribution (CC BY) license (http://creativecommons.org/licenses/by/4.0/).
Copyright: This open access article is published under a Creative Commons CC BY 4.0 license, which permit the free download, distribution, and reuse, provided that the author and preprint are cited in any reuse.


