Submitted:
09 December 2025
Posted:
10 December 2025
You are already at the latest version
Abstract
The main objective of this study is to investigate the influence of cognitive stress (mental workload) on some physiological parameters and reactions of a set of experimental subjects. The aim is to check whether these indicators, observed simultaneously, can distinguish the state of rest from the state of mental tension and whether they can distinguish tasks of different difficulty. An assessment of the state of rest in the study protocol is also performed. The experiments implemented a multimodal, non-invasive BCI for tracking physiological responses during cognitive task performance. Five parallel measured parameters are used: electroencephalography (EEG), heart rate (HR), galvanic skin response (GSR), facial surface temperature, and oxygen saturation (SpO₂). The results show that HR is a fast and reliable marker for detecting psychological load, the normalized phase GSR is good for detecting higher loads, EEG α/θ can be used for central validation, facial temperature is shown to be a slowly changing but reliable context indicator and SpO₂ preservation can be used as a measure of stability.
Keywords:
1. Introduction
2. Subjects, Materials and Methods
2.1. Subjects
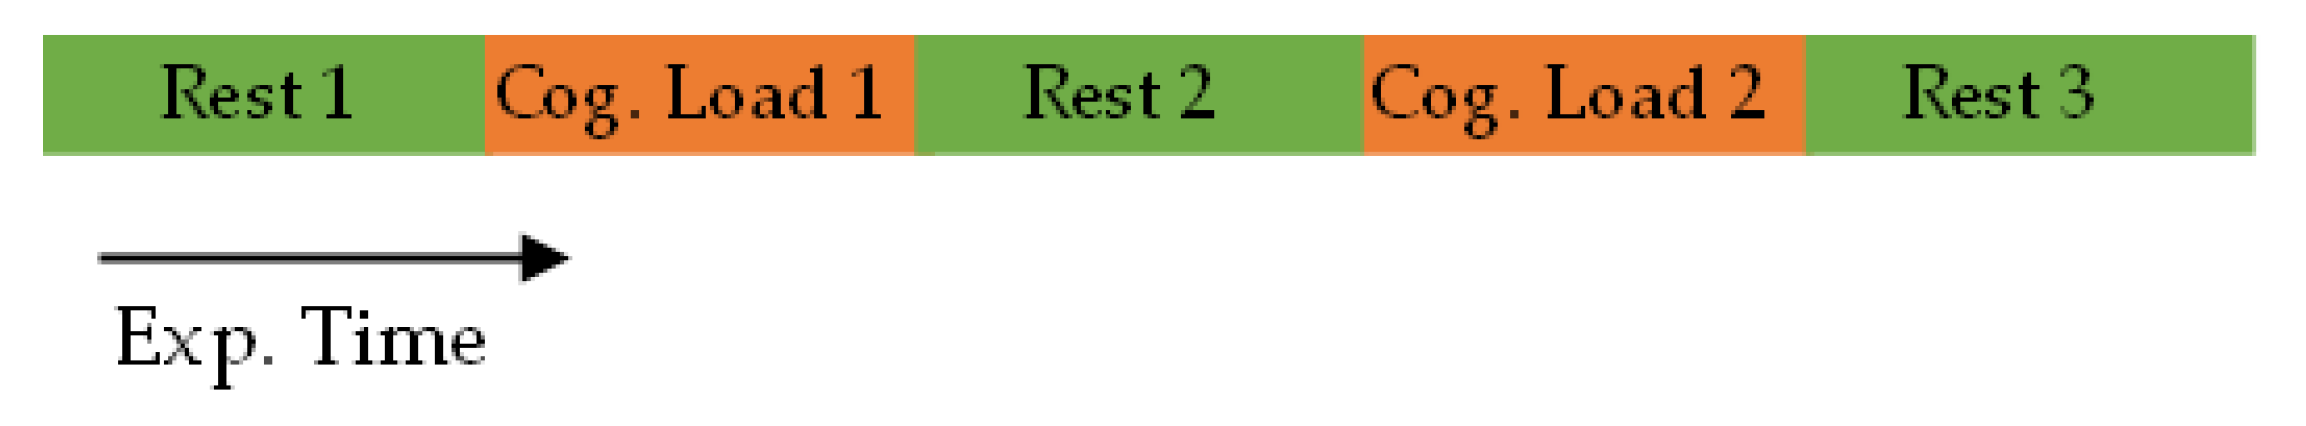
2.2. Study Protocol
2.2.1. The first part is an initial entrance rest Rest 1 lasting three minutes.
2.2.2. This is followed by the first cognitive task – the Stroop test, which also lasts three minutes.
2.2.3. Then there is a two-minute break.
2.2.4. The next part is Subtraction – an arithmetic task with a higher cognitive workload.
2.2.5. The last part is again a rest Rest 3 lasting three minutes.
2.3. Stroop Test
2.4. Arithmetical Test
2.5. Calculations and Data Processing
2.6. EEG
2.7. Galvanic Skin Response (GSR)
2.8. Infrared Thermography
2.9. Pulse Oximetry
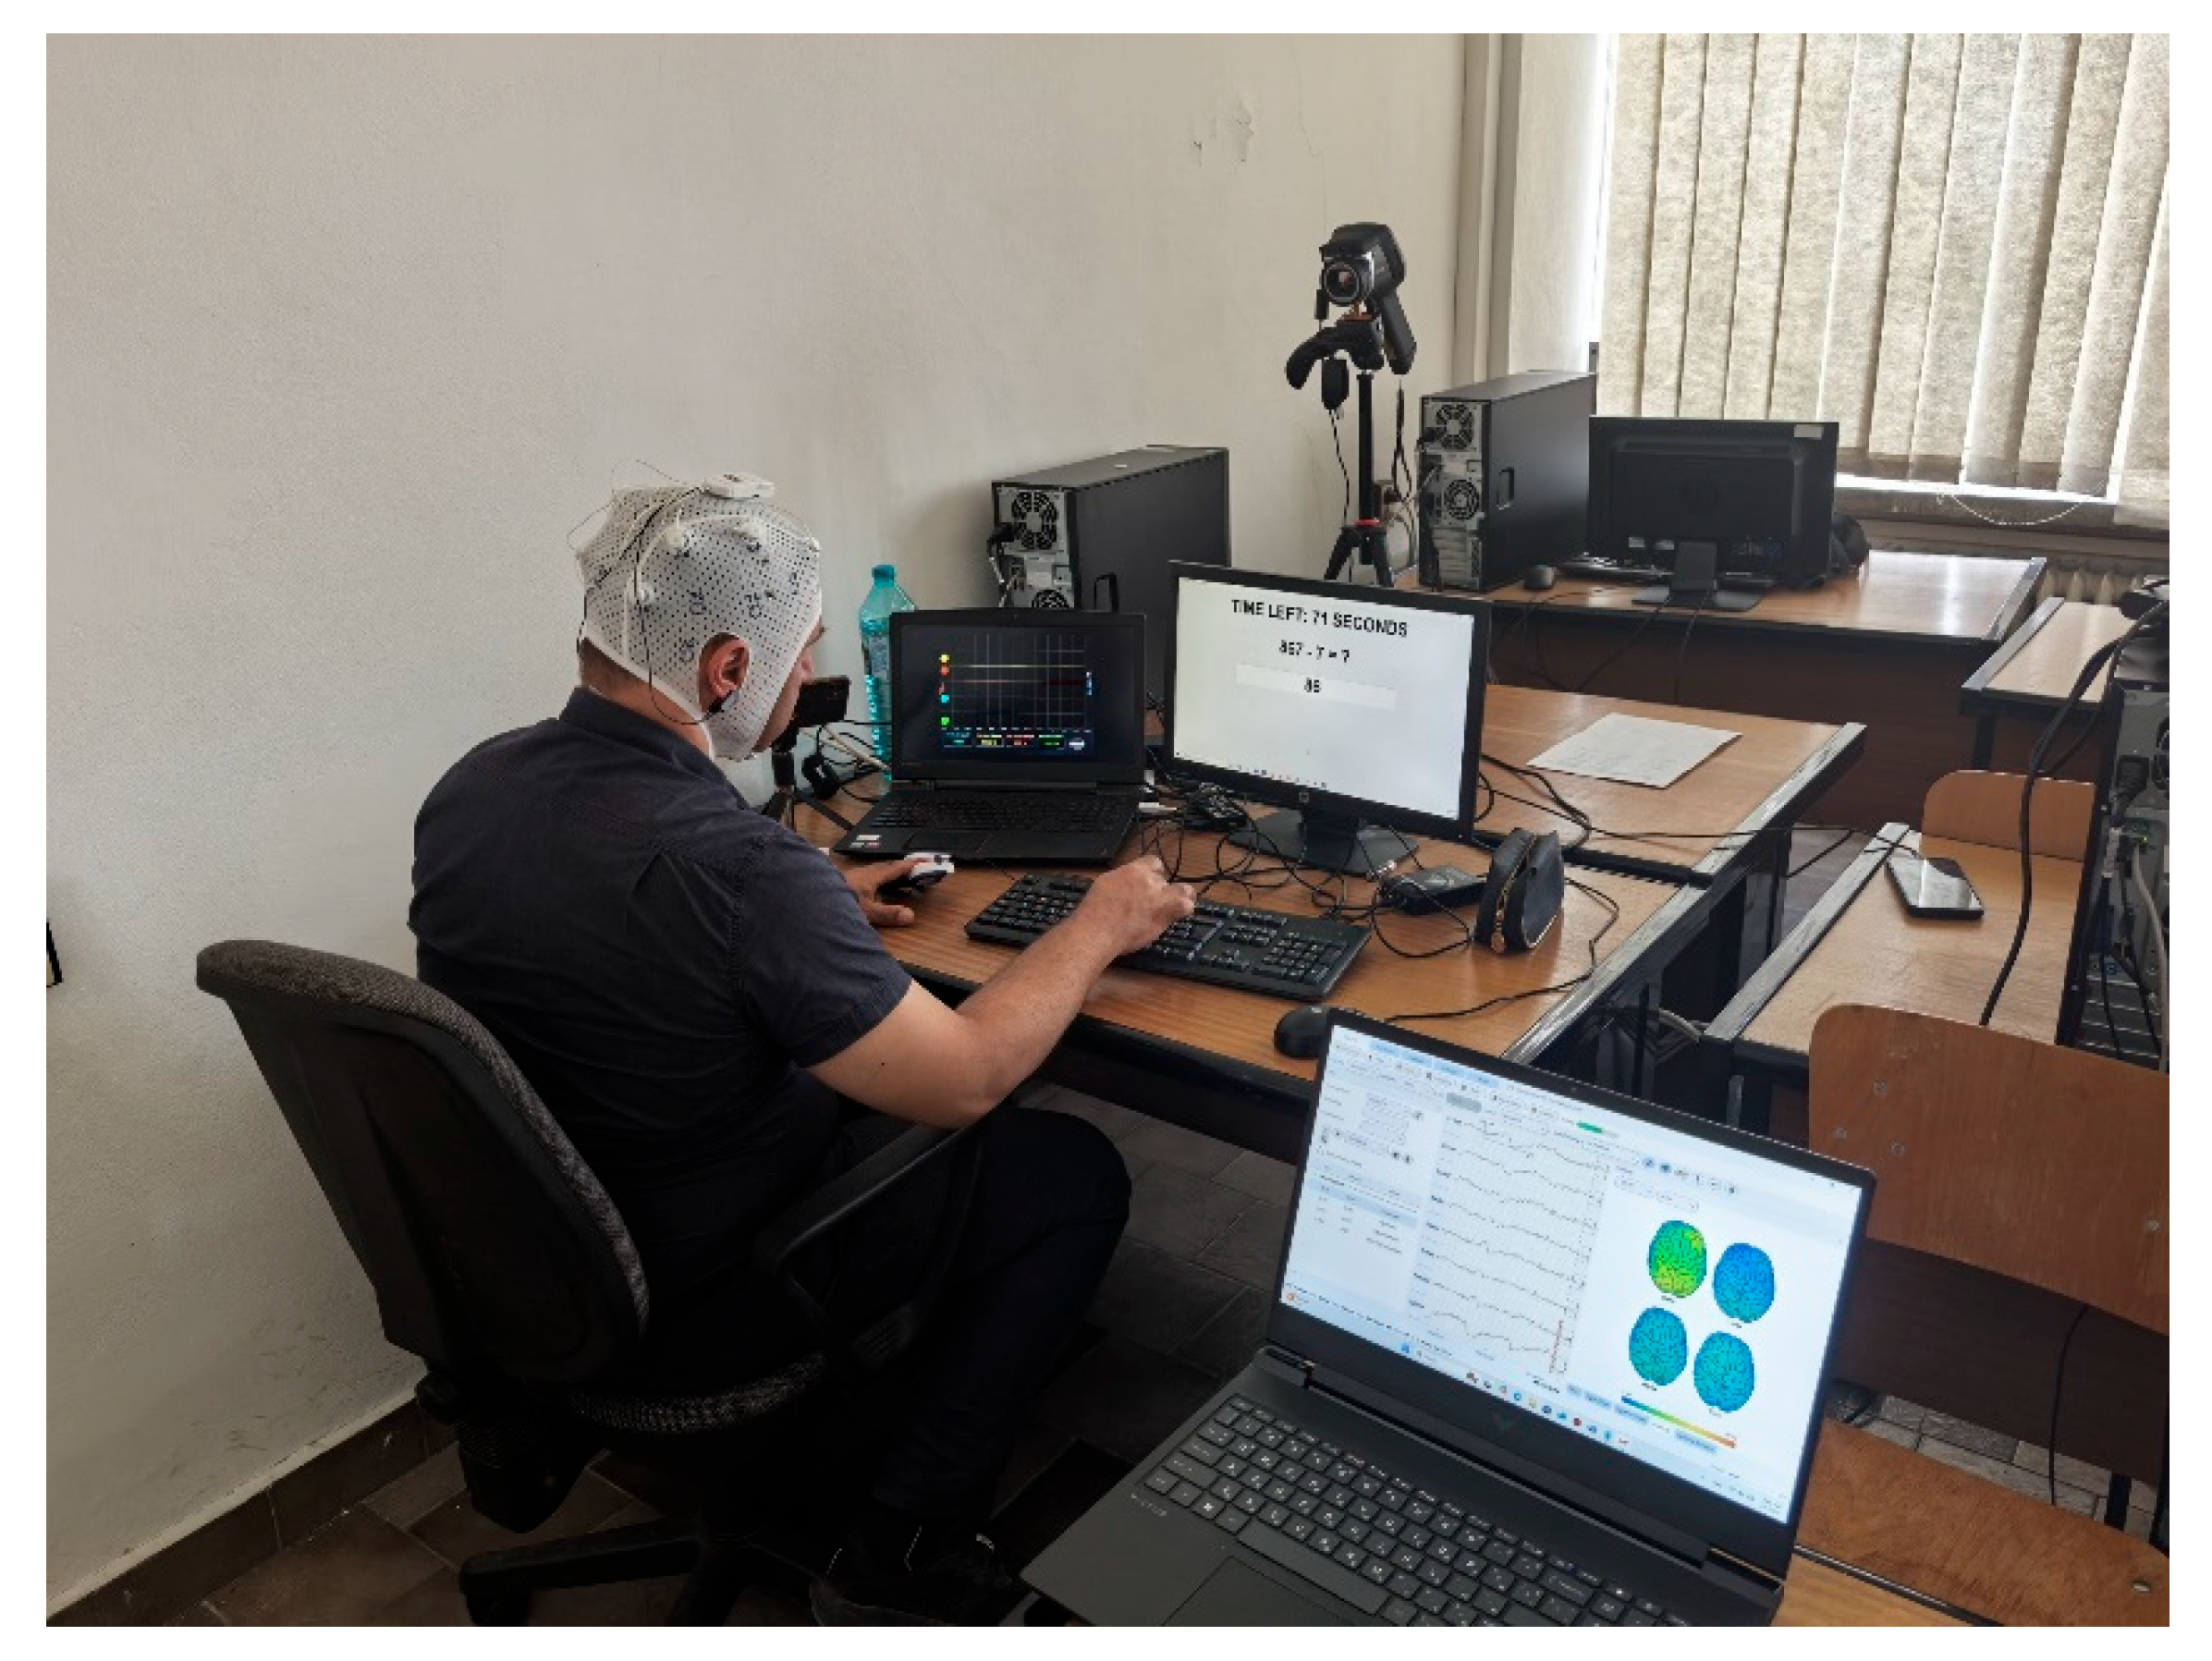
2.10. Setup
3. Results
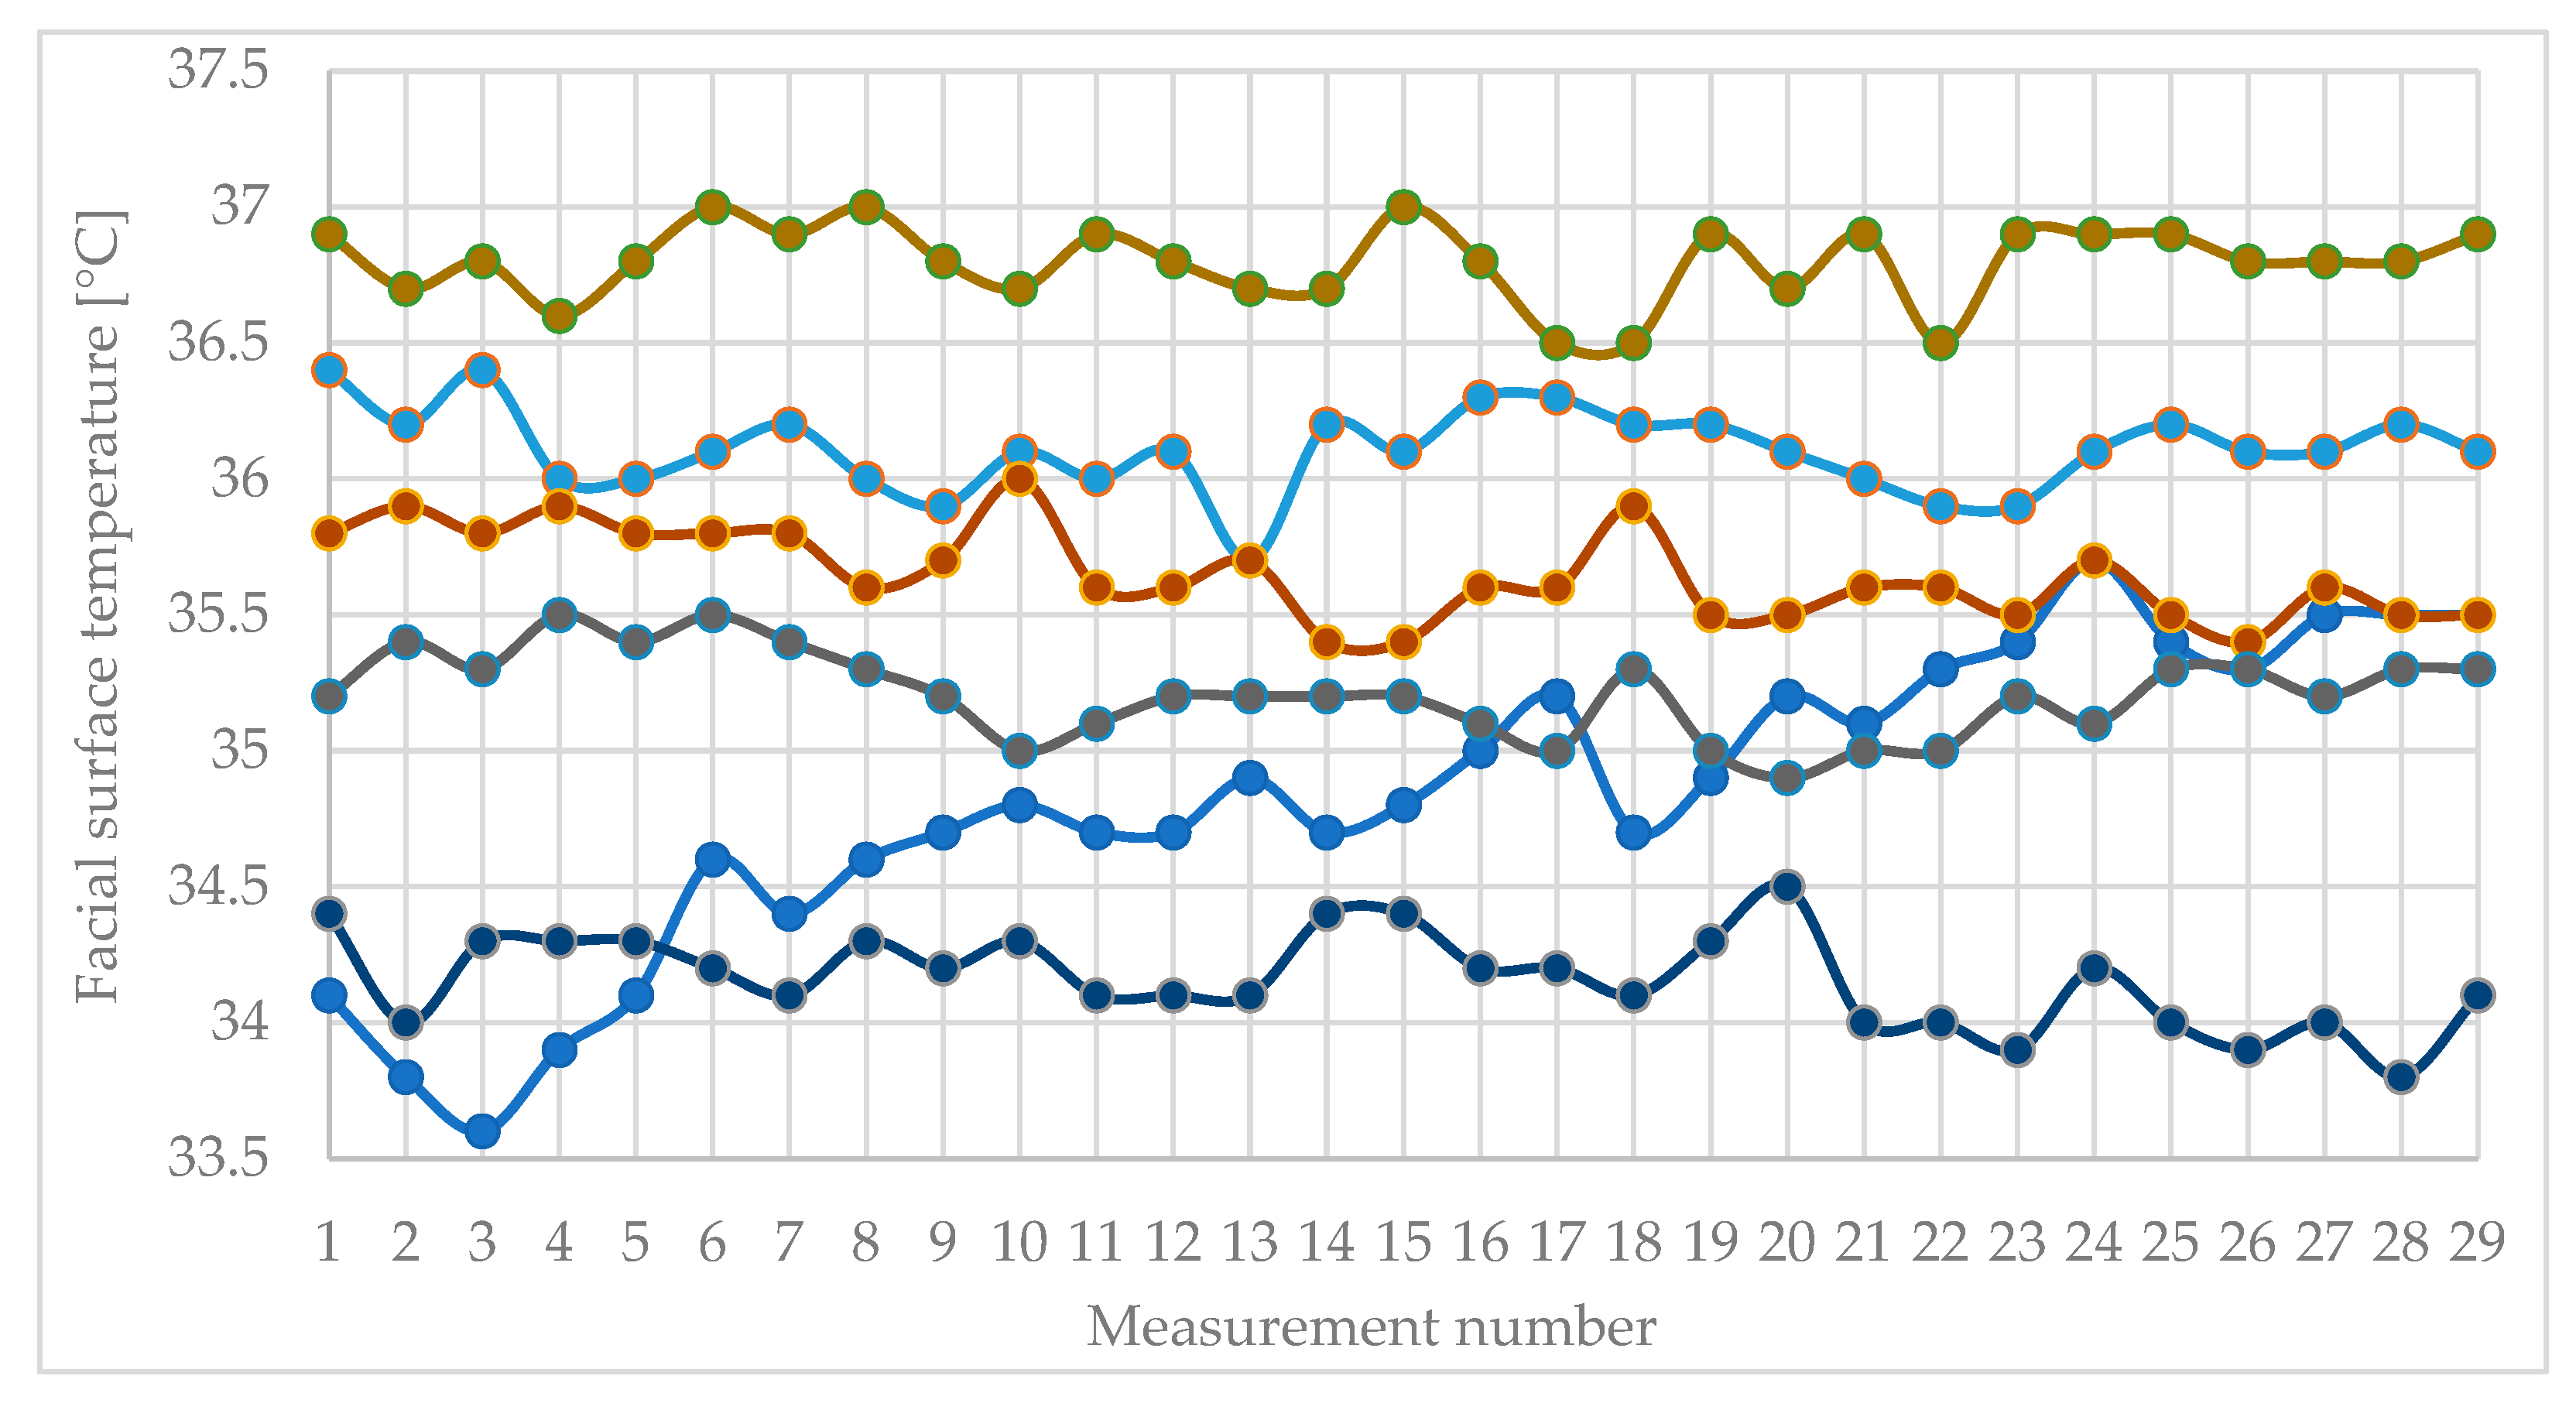
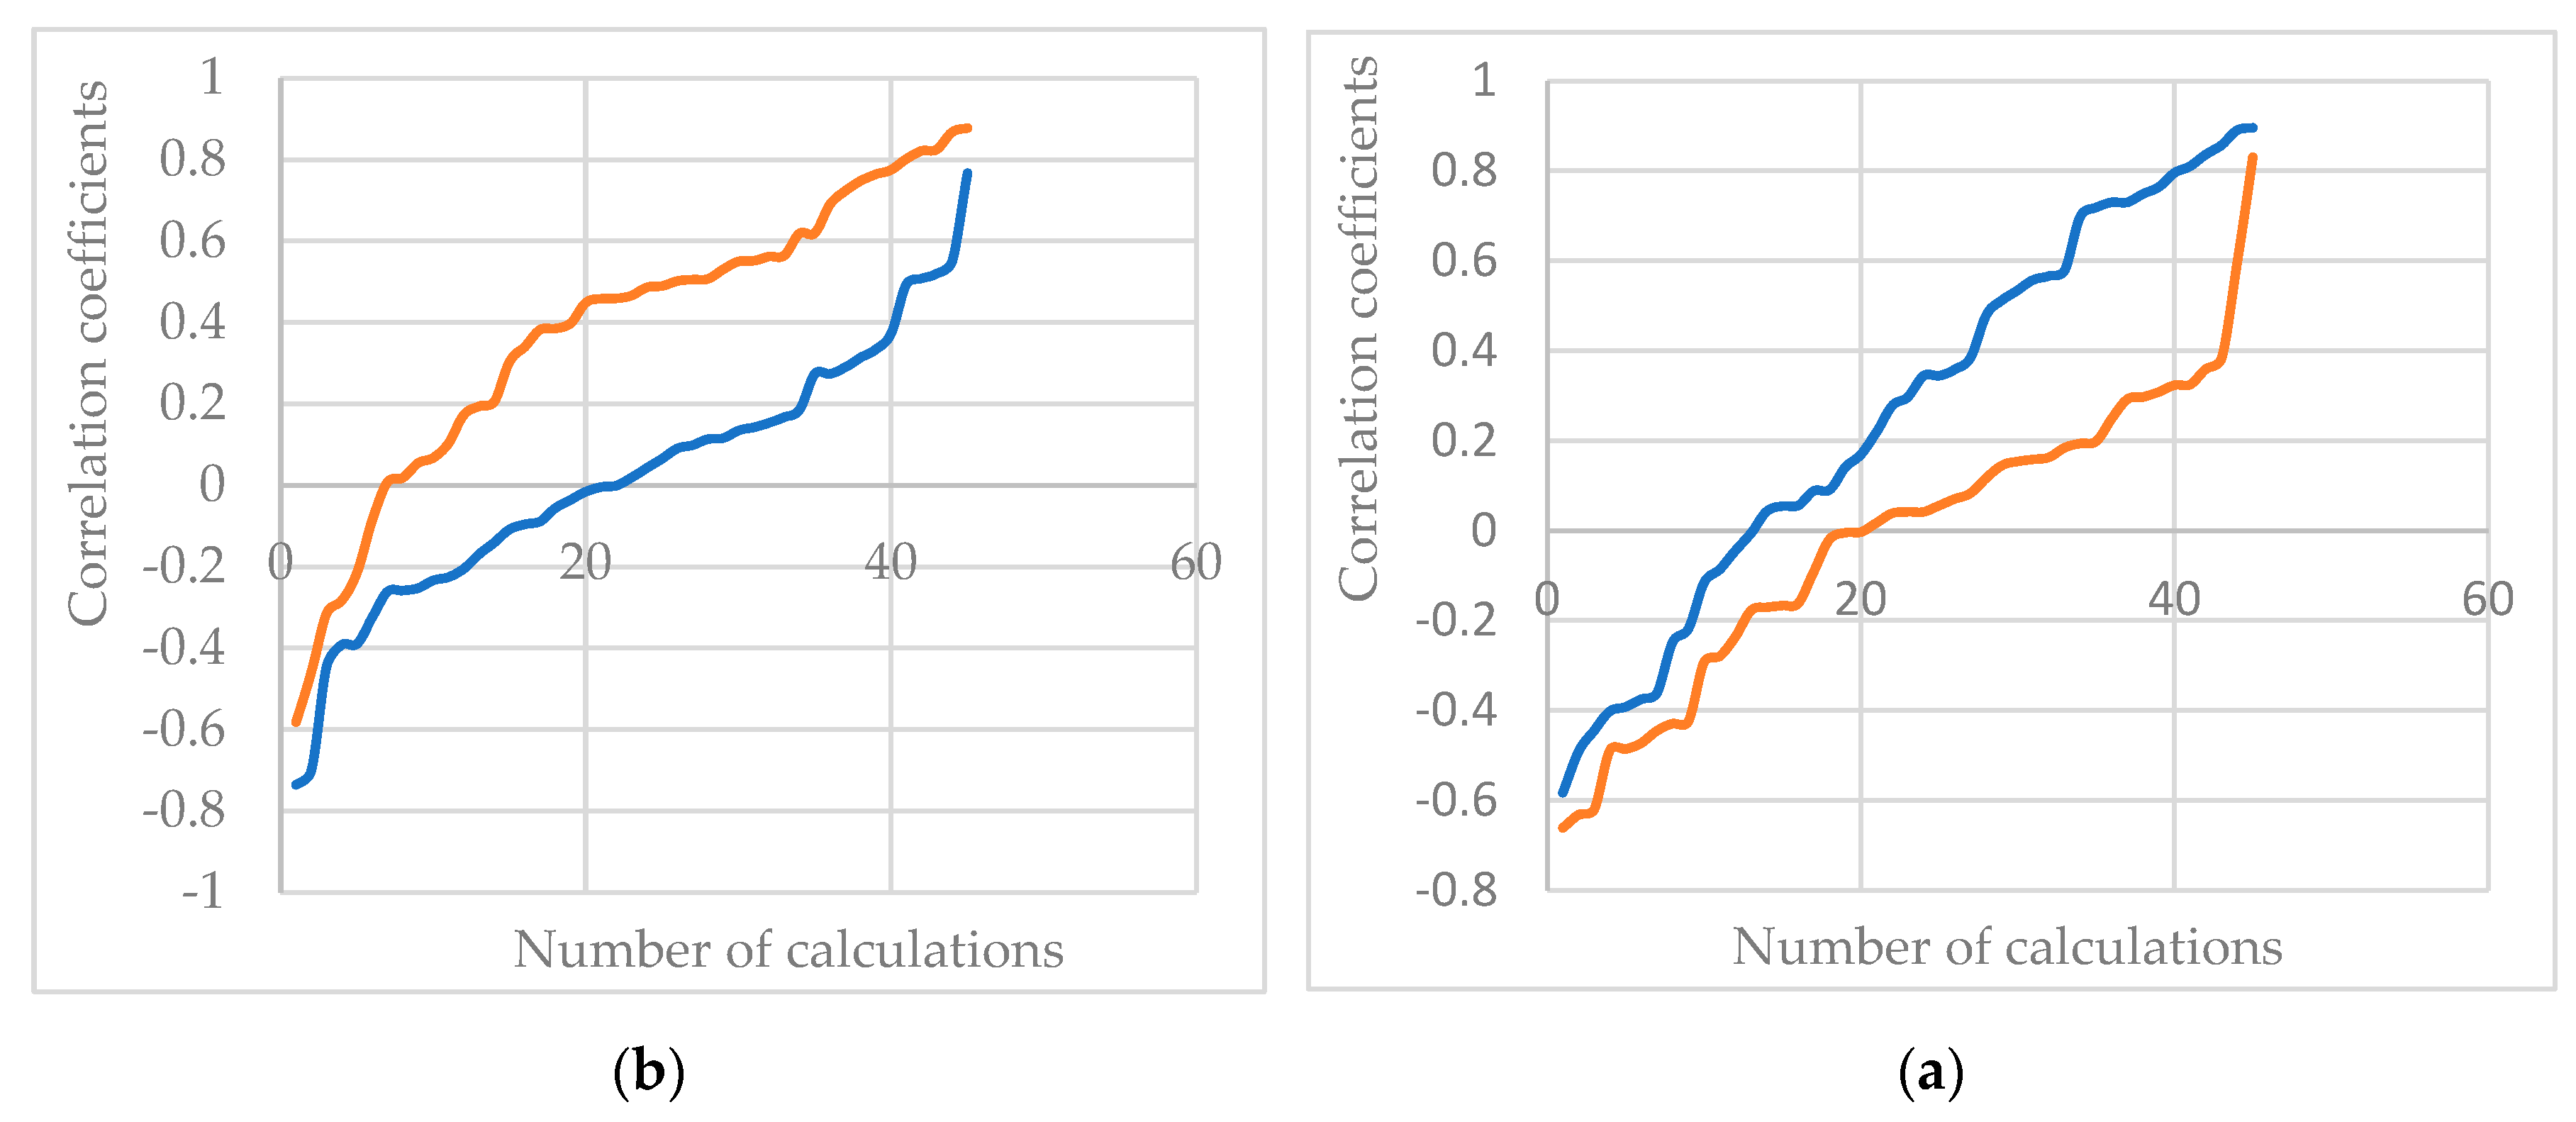
3.1. Facial Surface Temperature
3.1.1. The minimum correlation coefficient between the measured values of the surface temperature of the face of all participants for the entire study period is – 0,63.
3.1.2. The average correlation coefficient between the measured values of the surface temperature of the face of all participants for the entire study period is - 0,01.
3.1.3. The maximum correlation coefficient between the measured values of the surface temperature of the face of all participants for the entire study period is 0,83.
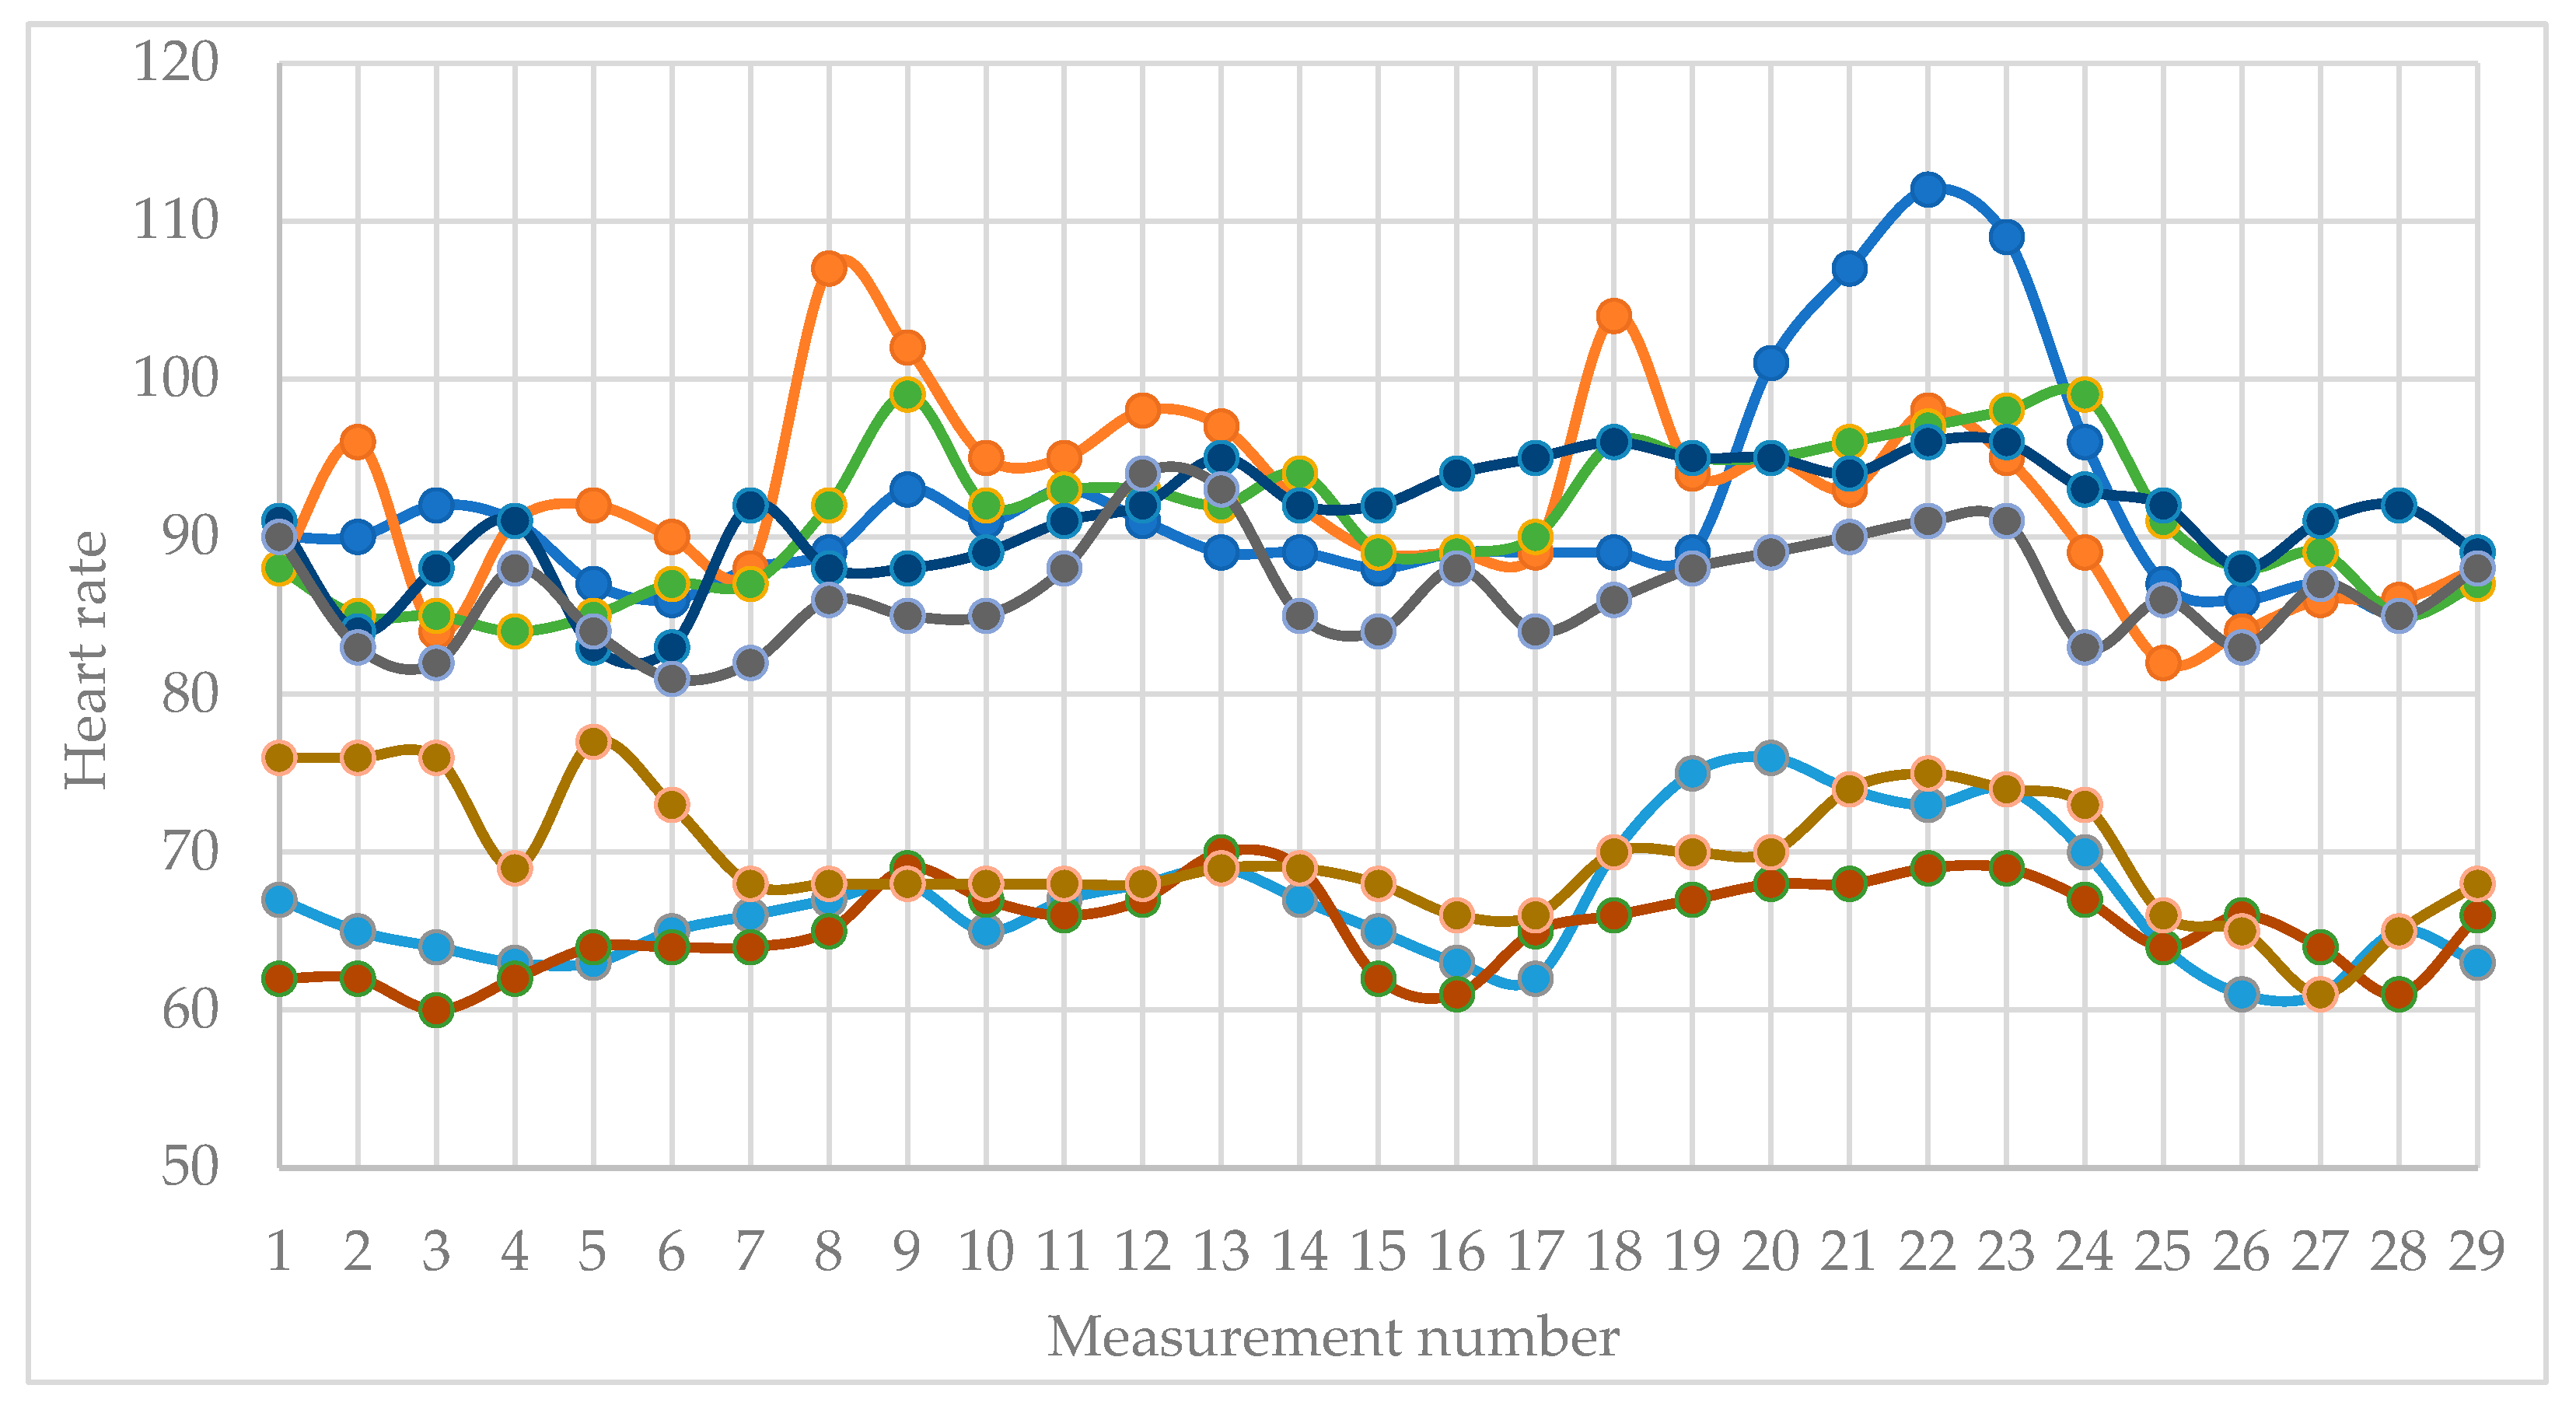
3.2. Heart Rate
3.2.1. The minimum correlation coefficient between the measured values of the heart rate of all participants for the entire study period is - 0,58.
3.2.2. The average correlation coefficient between the measured values of the heart rate of all participants for the entire study period is 0,38.
3.2.3. The maximum correlation coefficient between the measured values of the heart rate of all participants for the entire study period is 0,88.
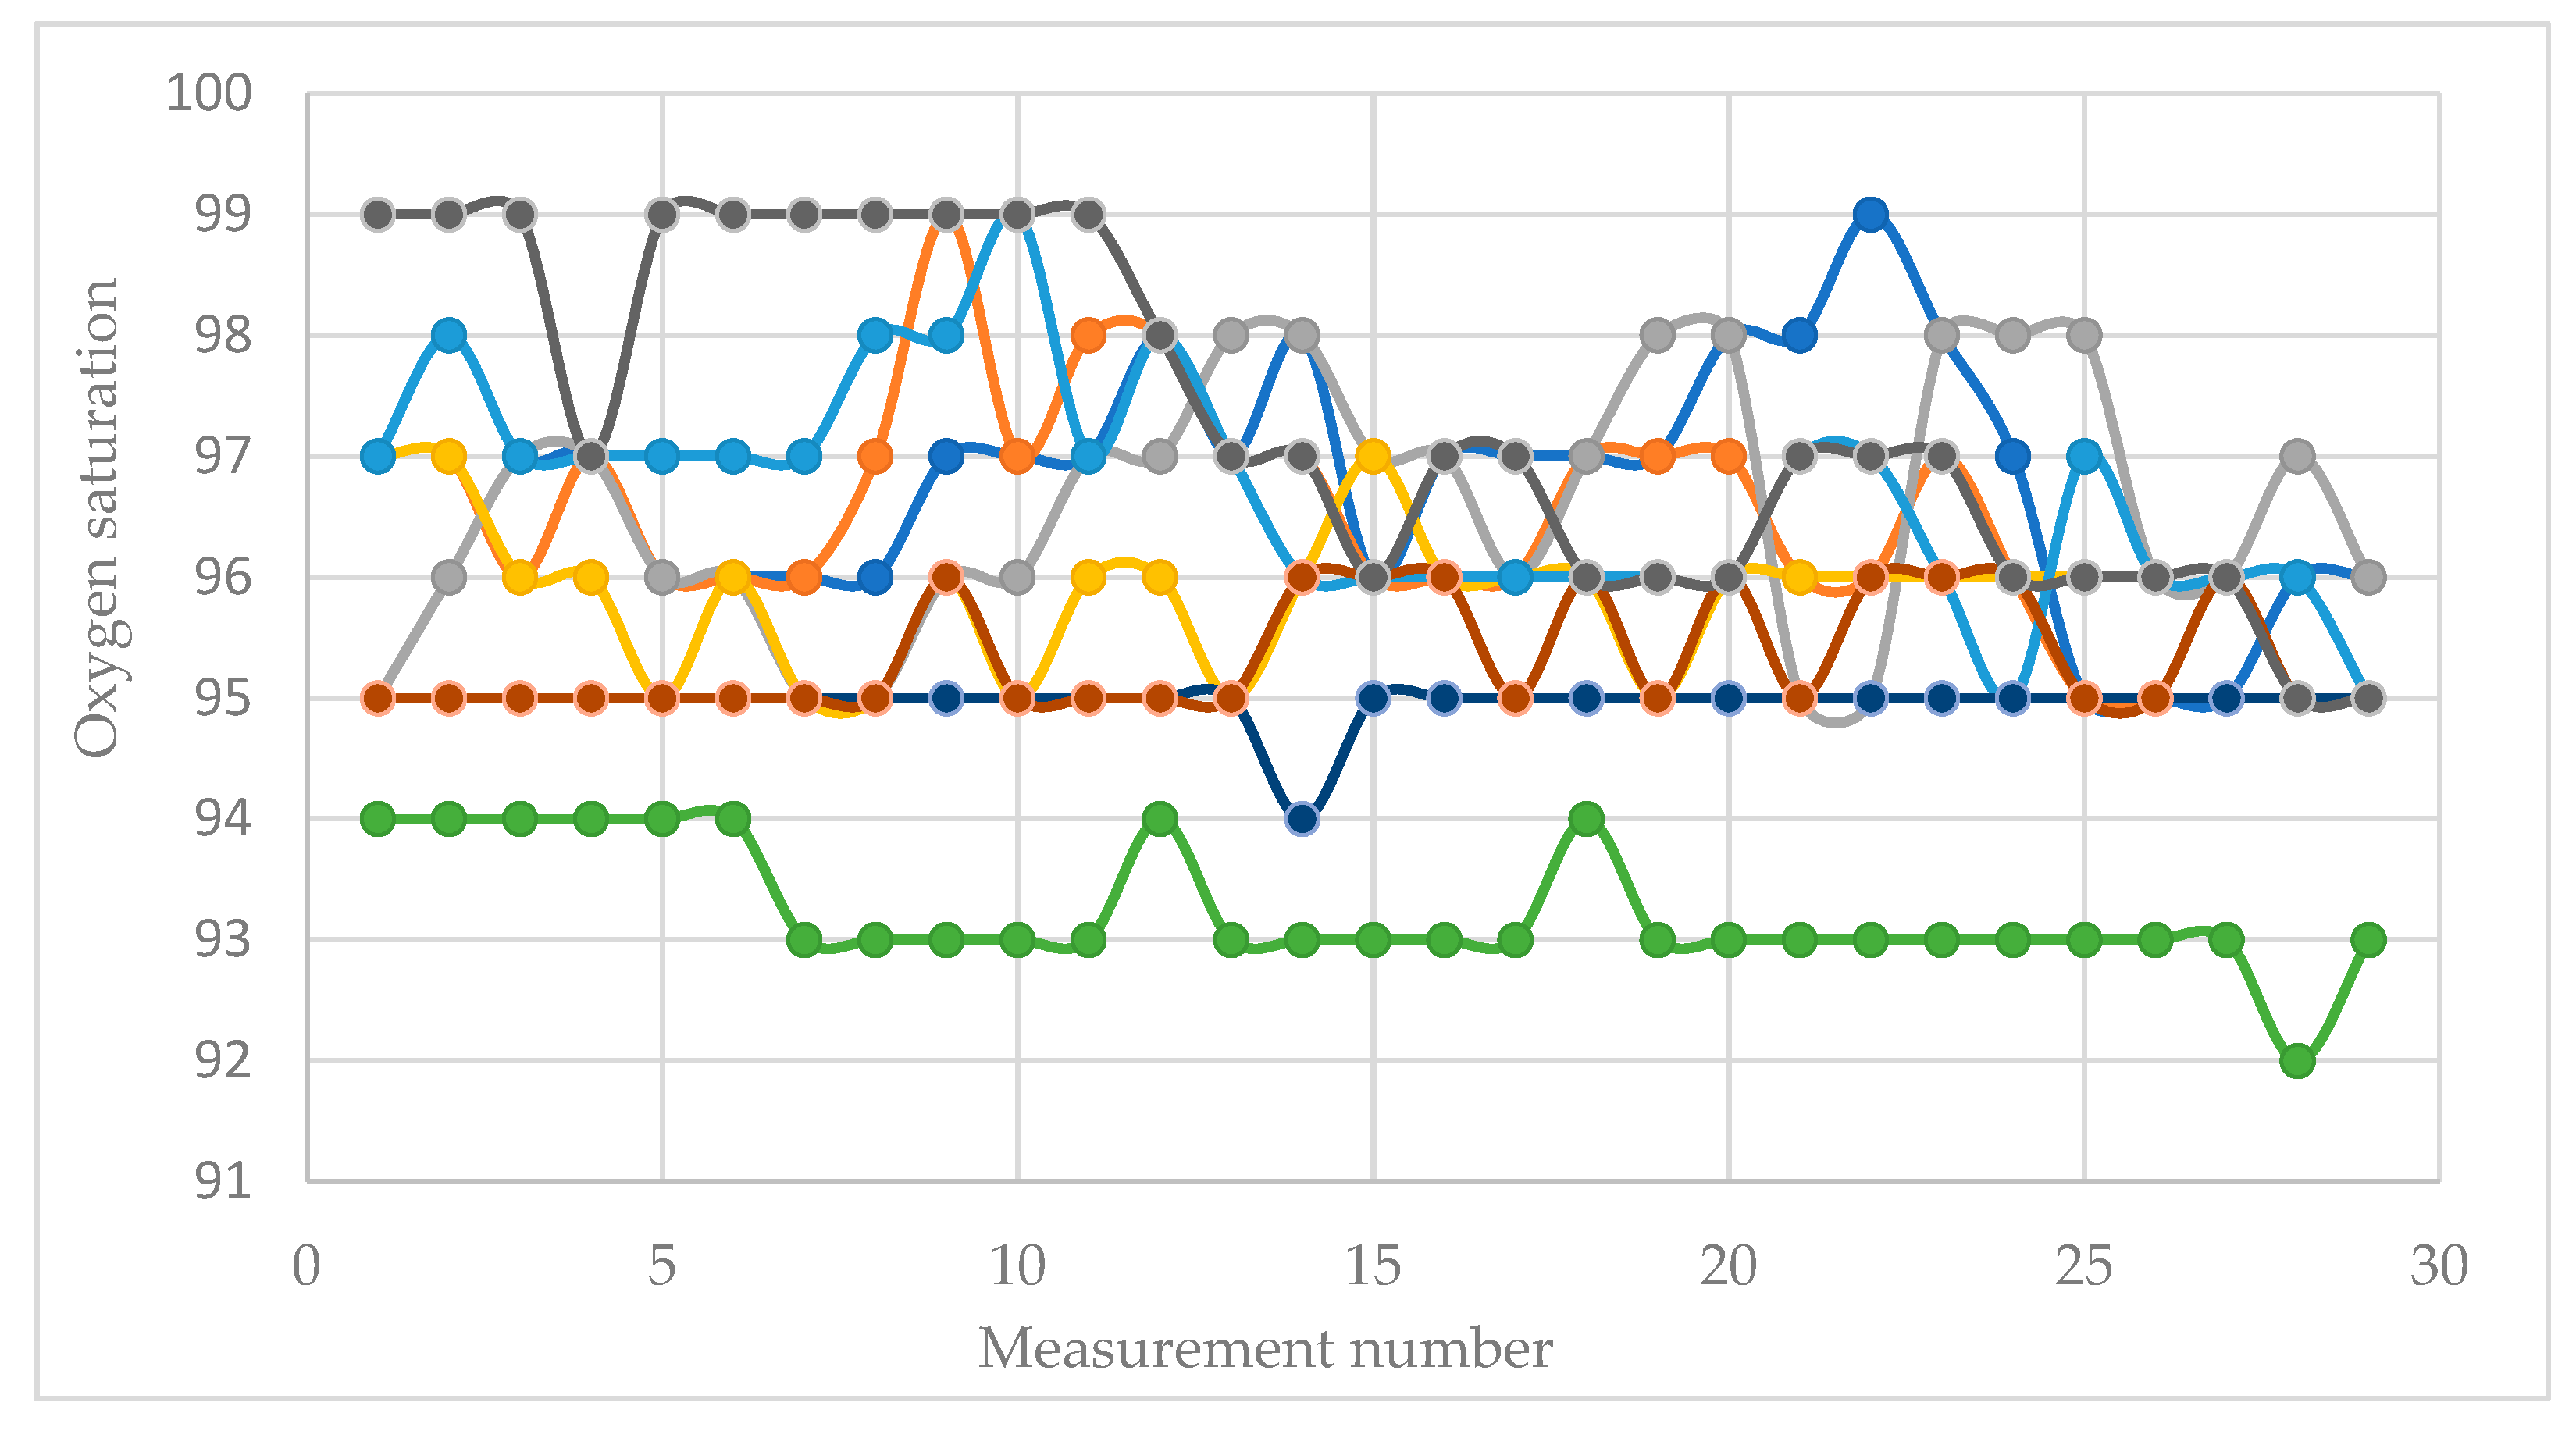
3.3. Oxygen Saturation
3.3.1. The minimum correlation coefficient between the measured values of oxygen saturation of all participants for the entire study period is - 0,74
3.3.2. The average correlation coefficient between the measured values of oxygen saturation of all participants for the entire study period is 0,02
3.3.3 The maximum correlation coefficient between the measured values of oxygen saturation of all participants for the entire study period is 0,77.
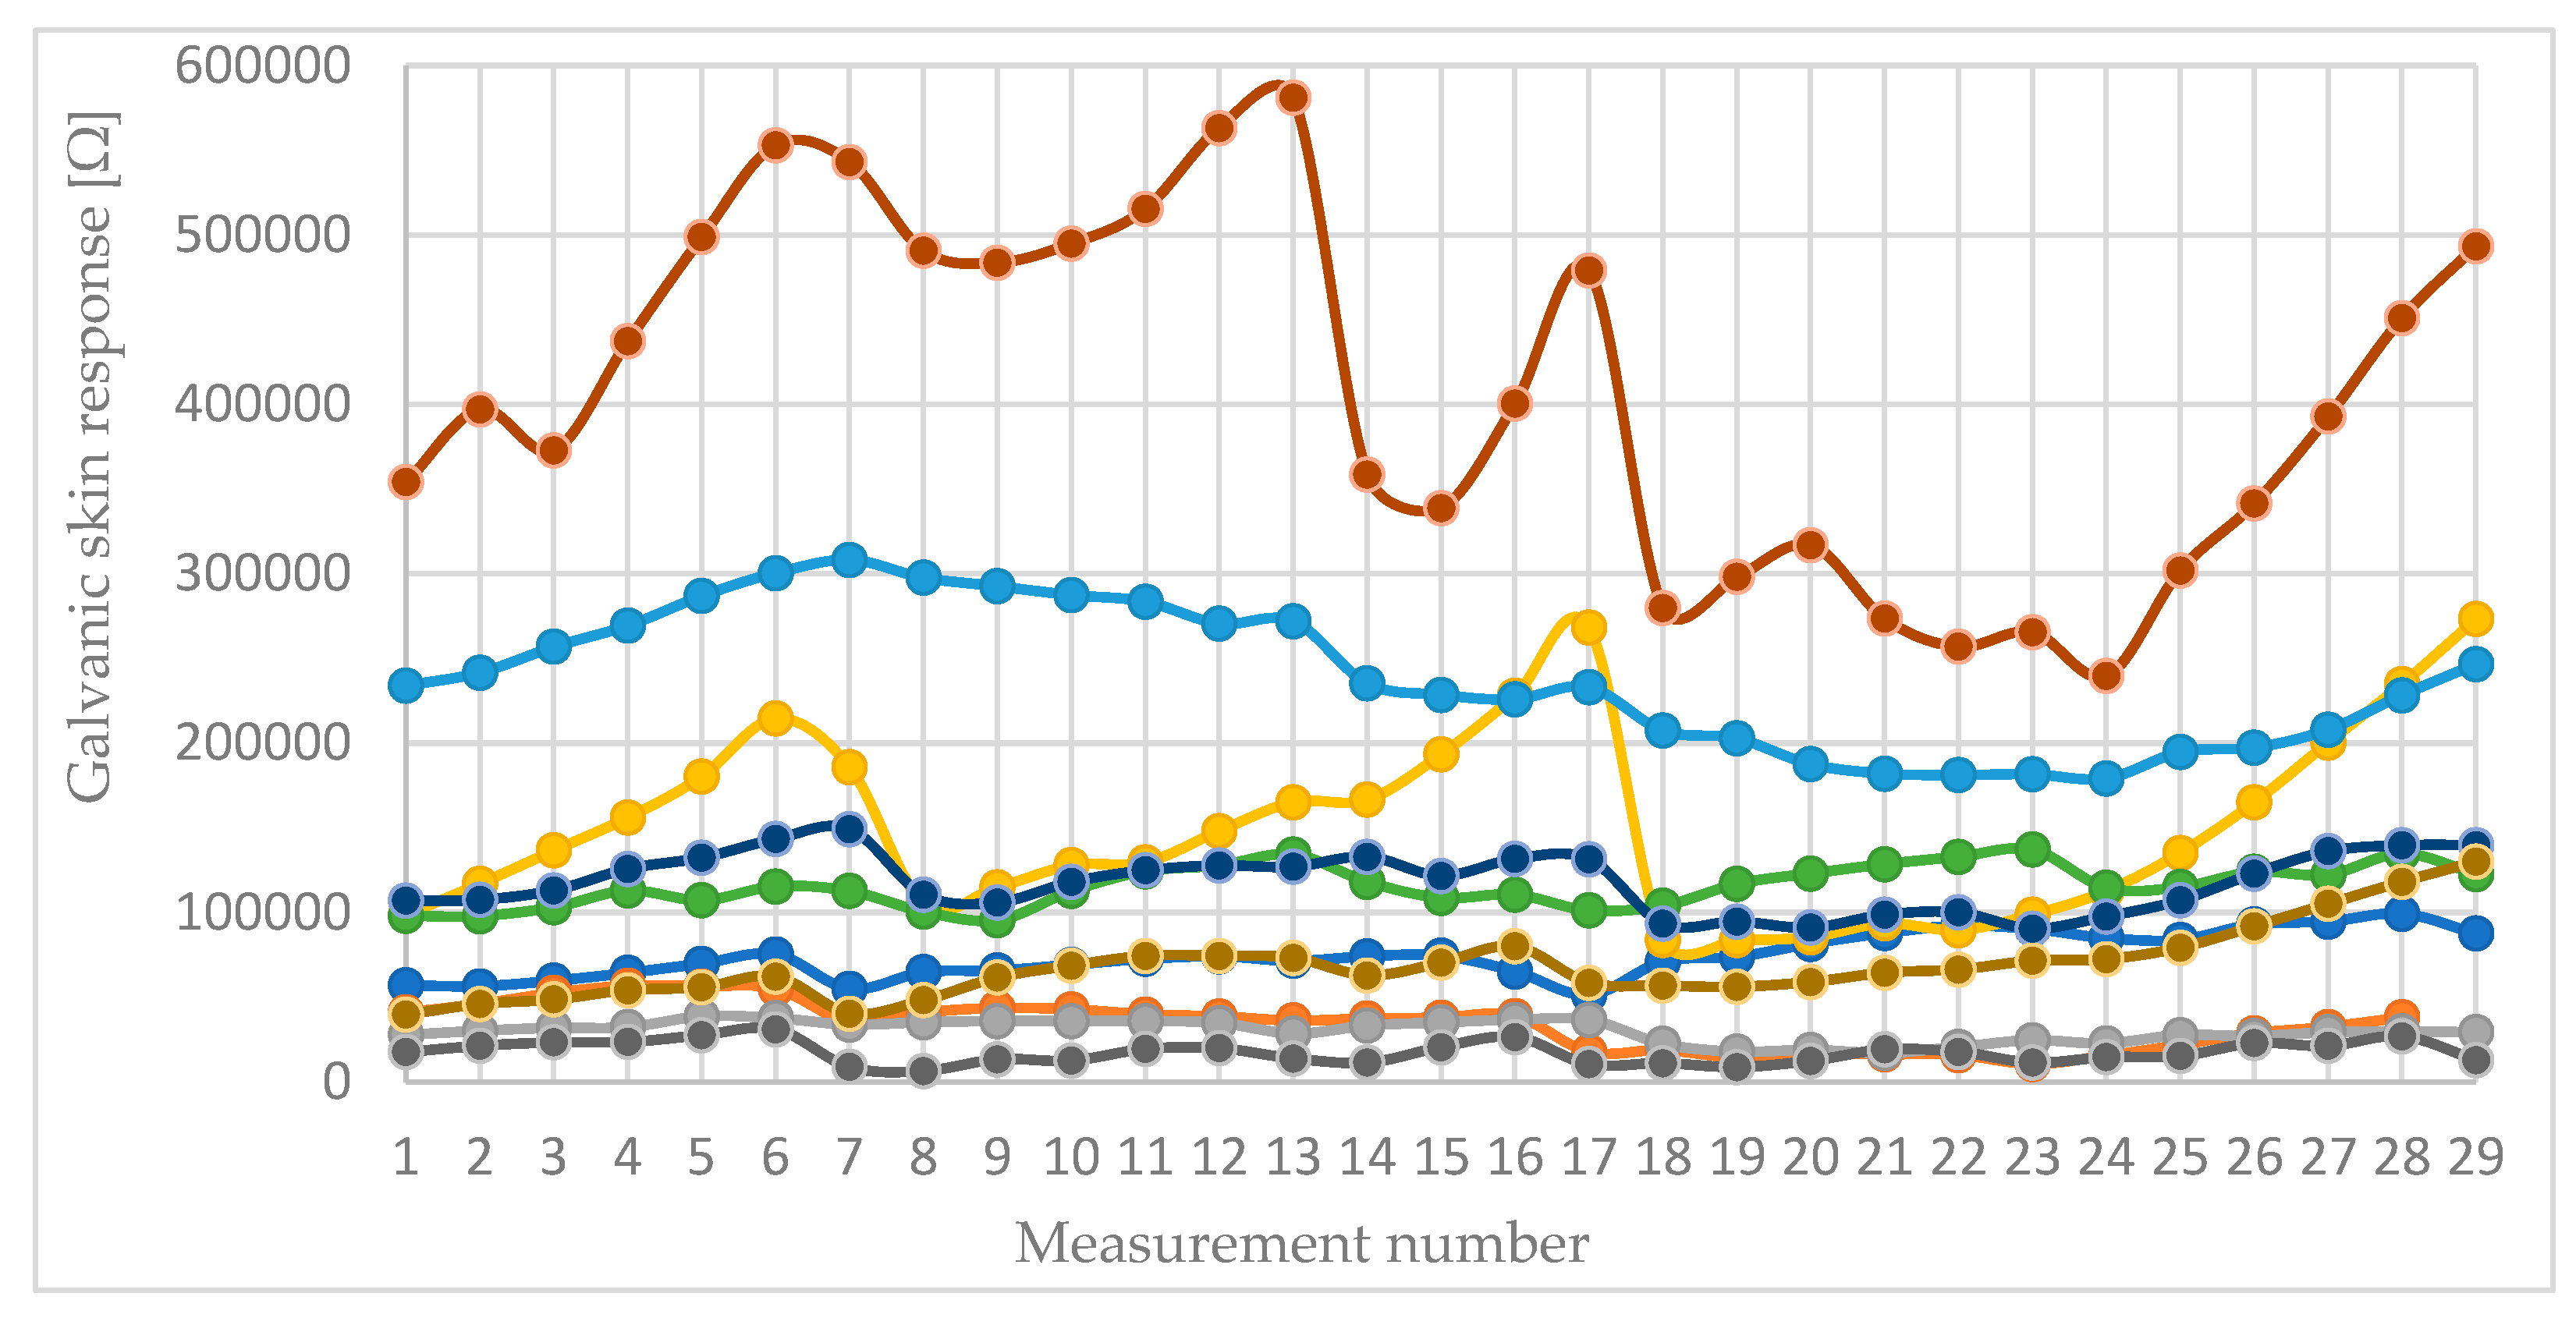
3.4. Galvanic Skin Response
3.4.1. The minimum correlation coefficient between the measured values of the galvanic skin response of all participants for the entire study period is – 0,58.
3.4.2. The average correlation coefficient between the measured values of the galvanic skin response of all participants for the entire study period is 0,26.
3.4.3. The maximum correlation coefficient between the measured values of the galvanic skin response of all participants for the entire study period is 0,90.
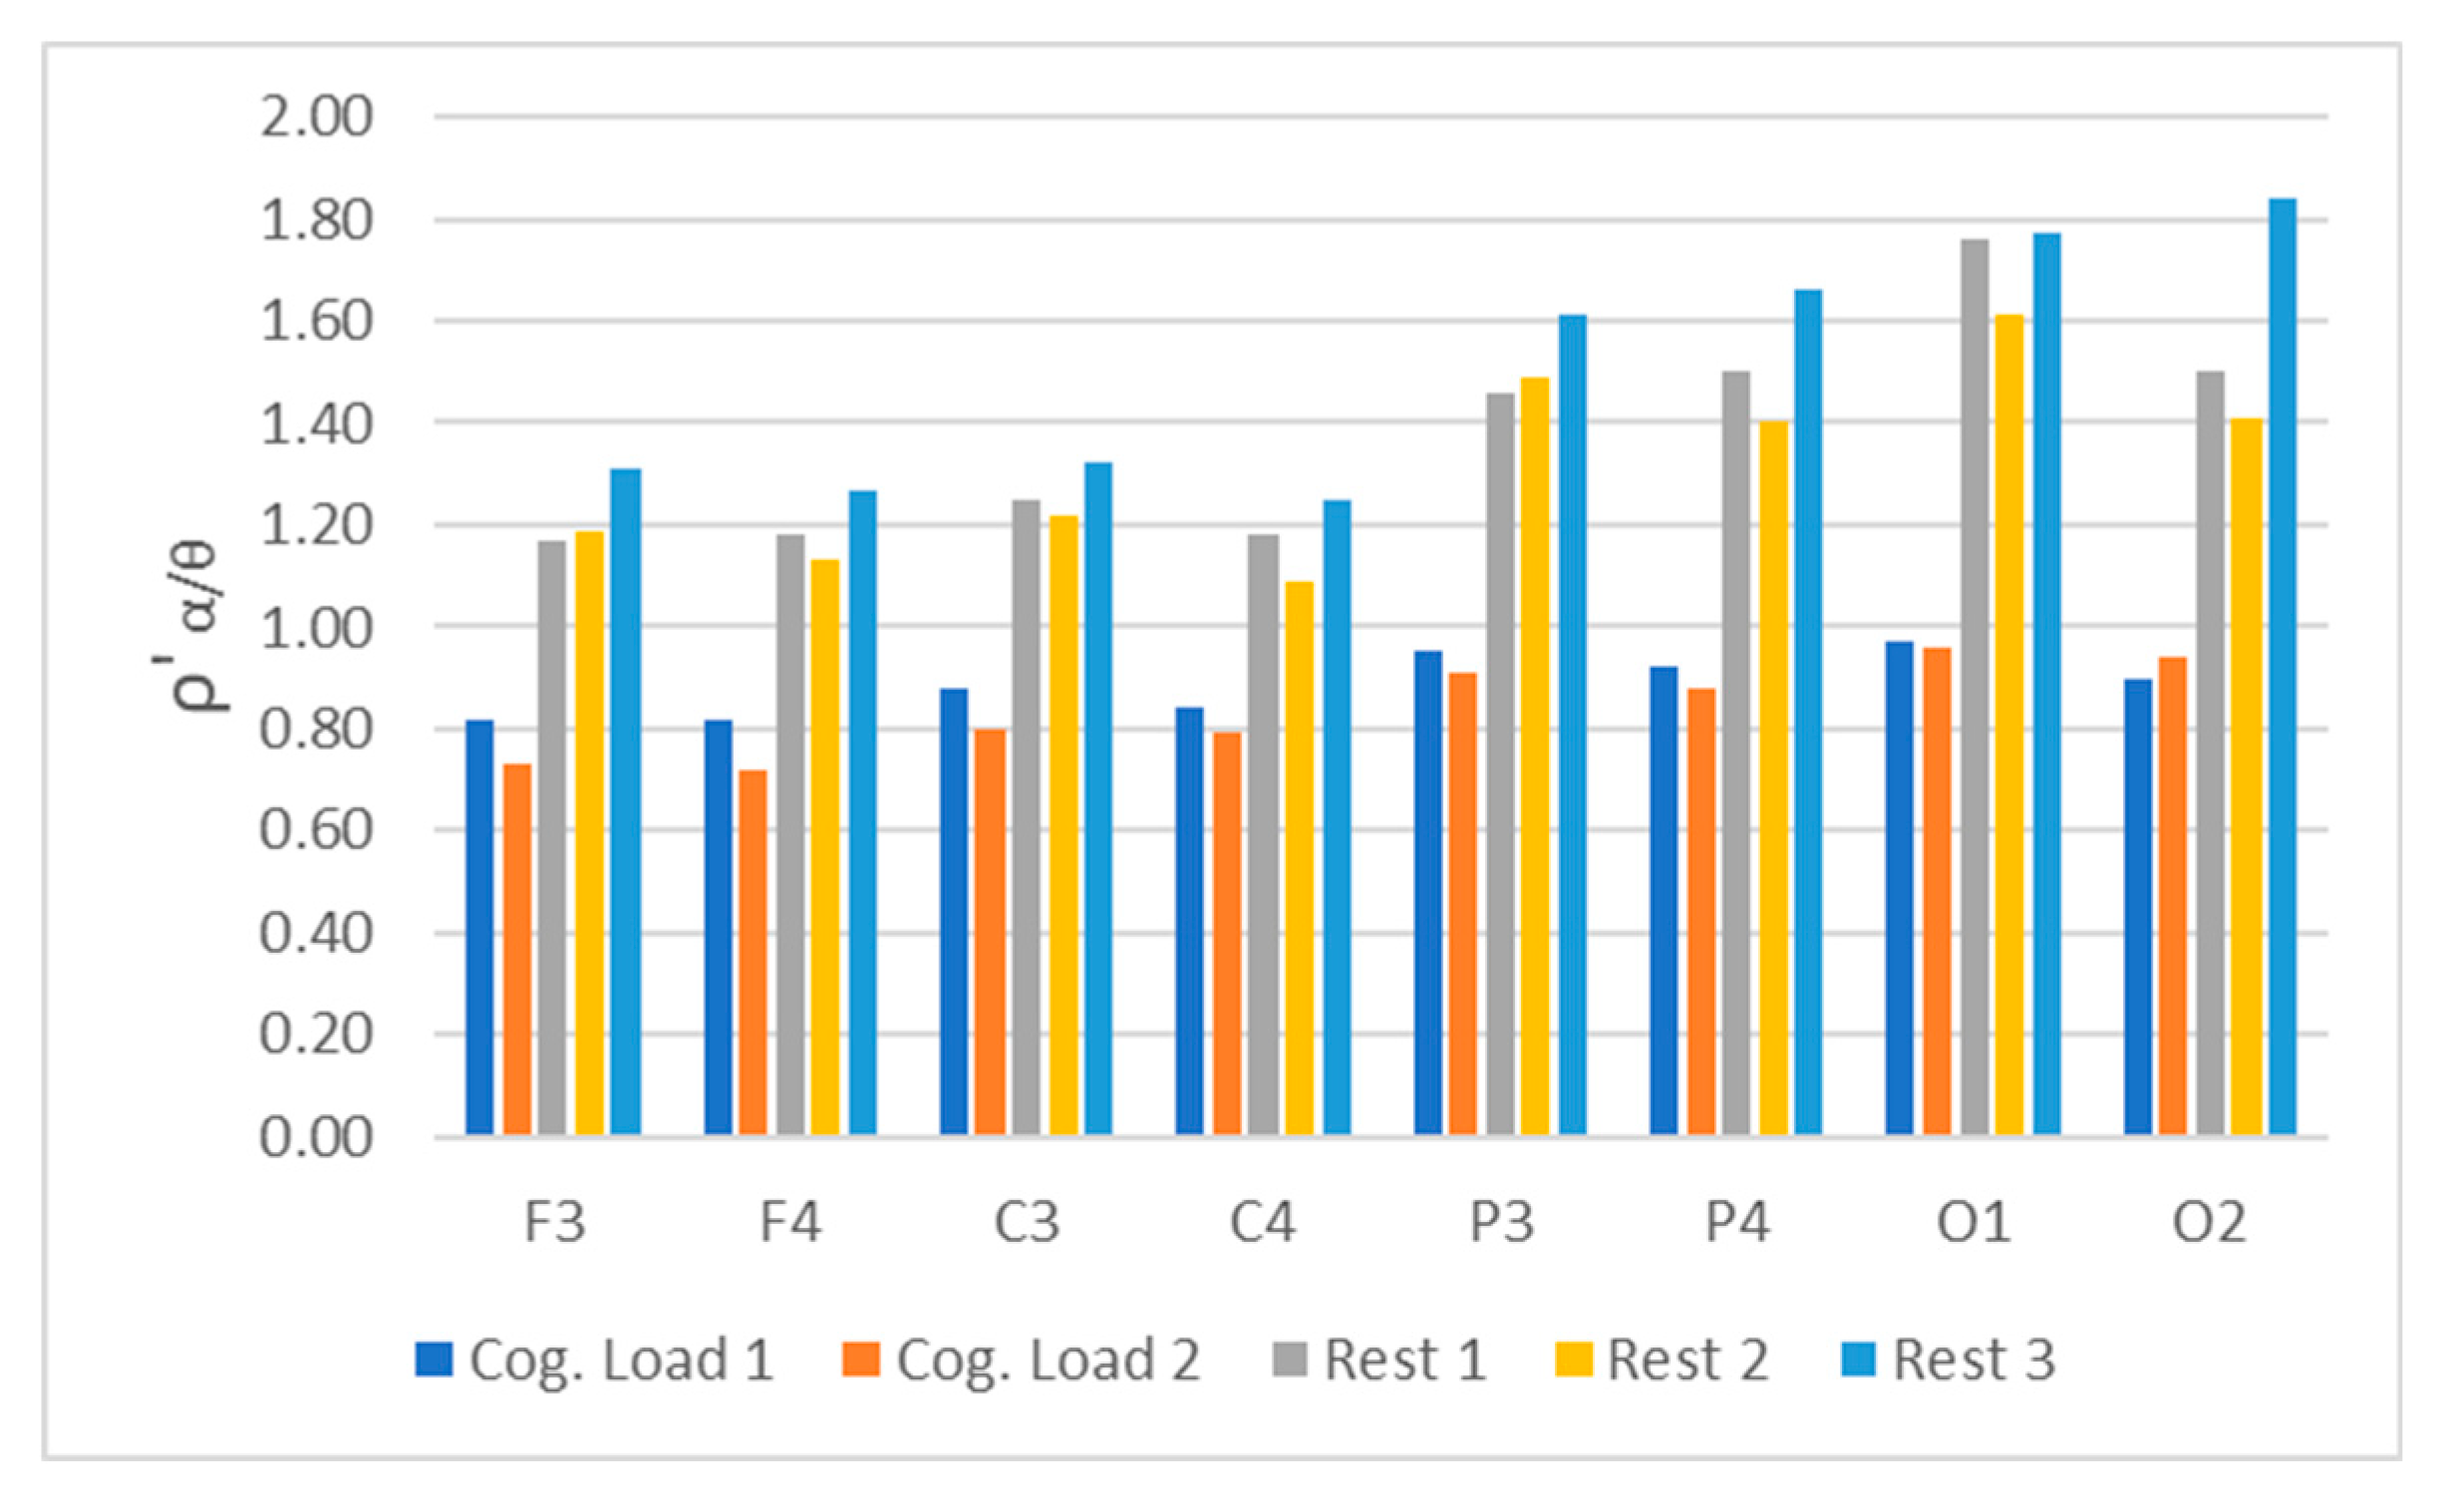
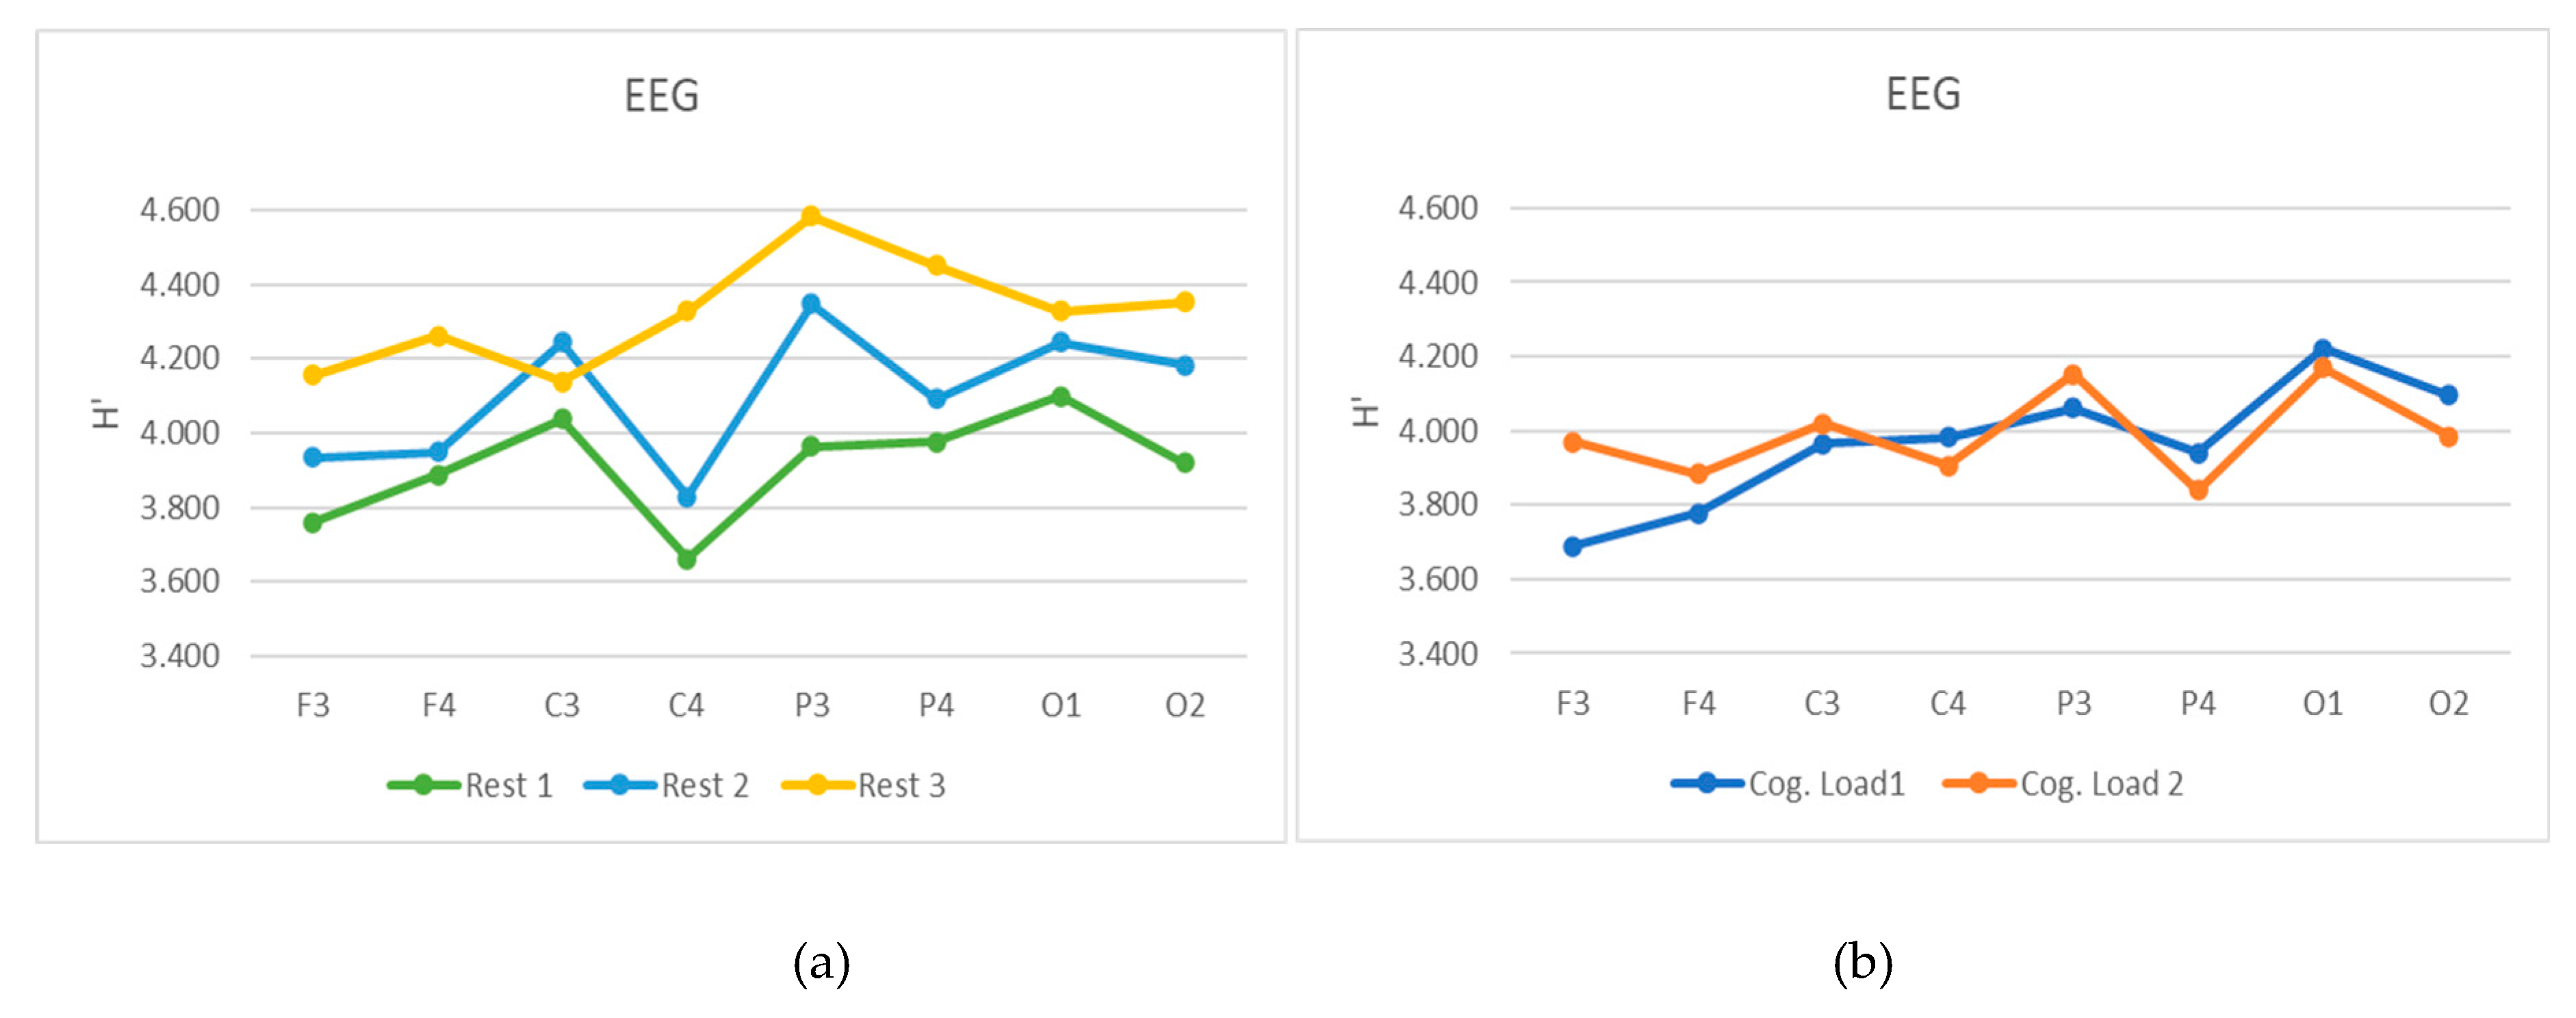
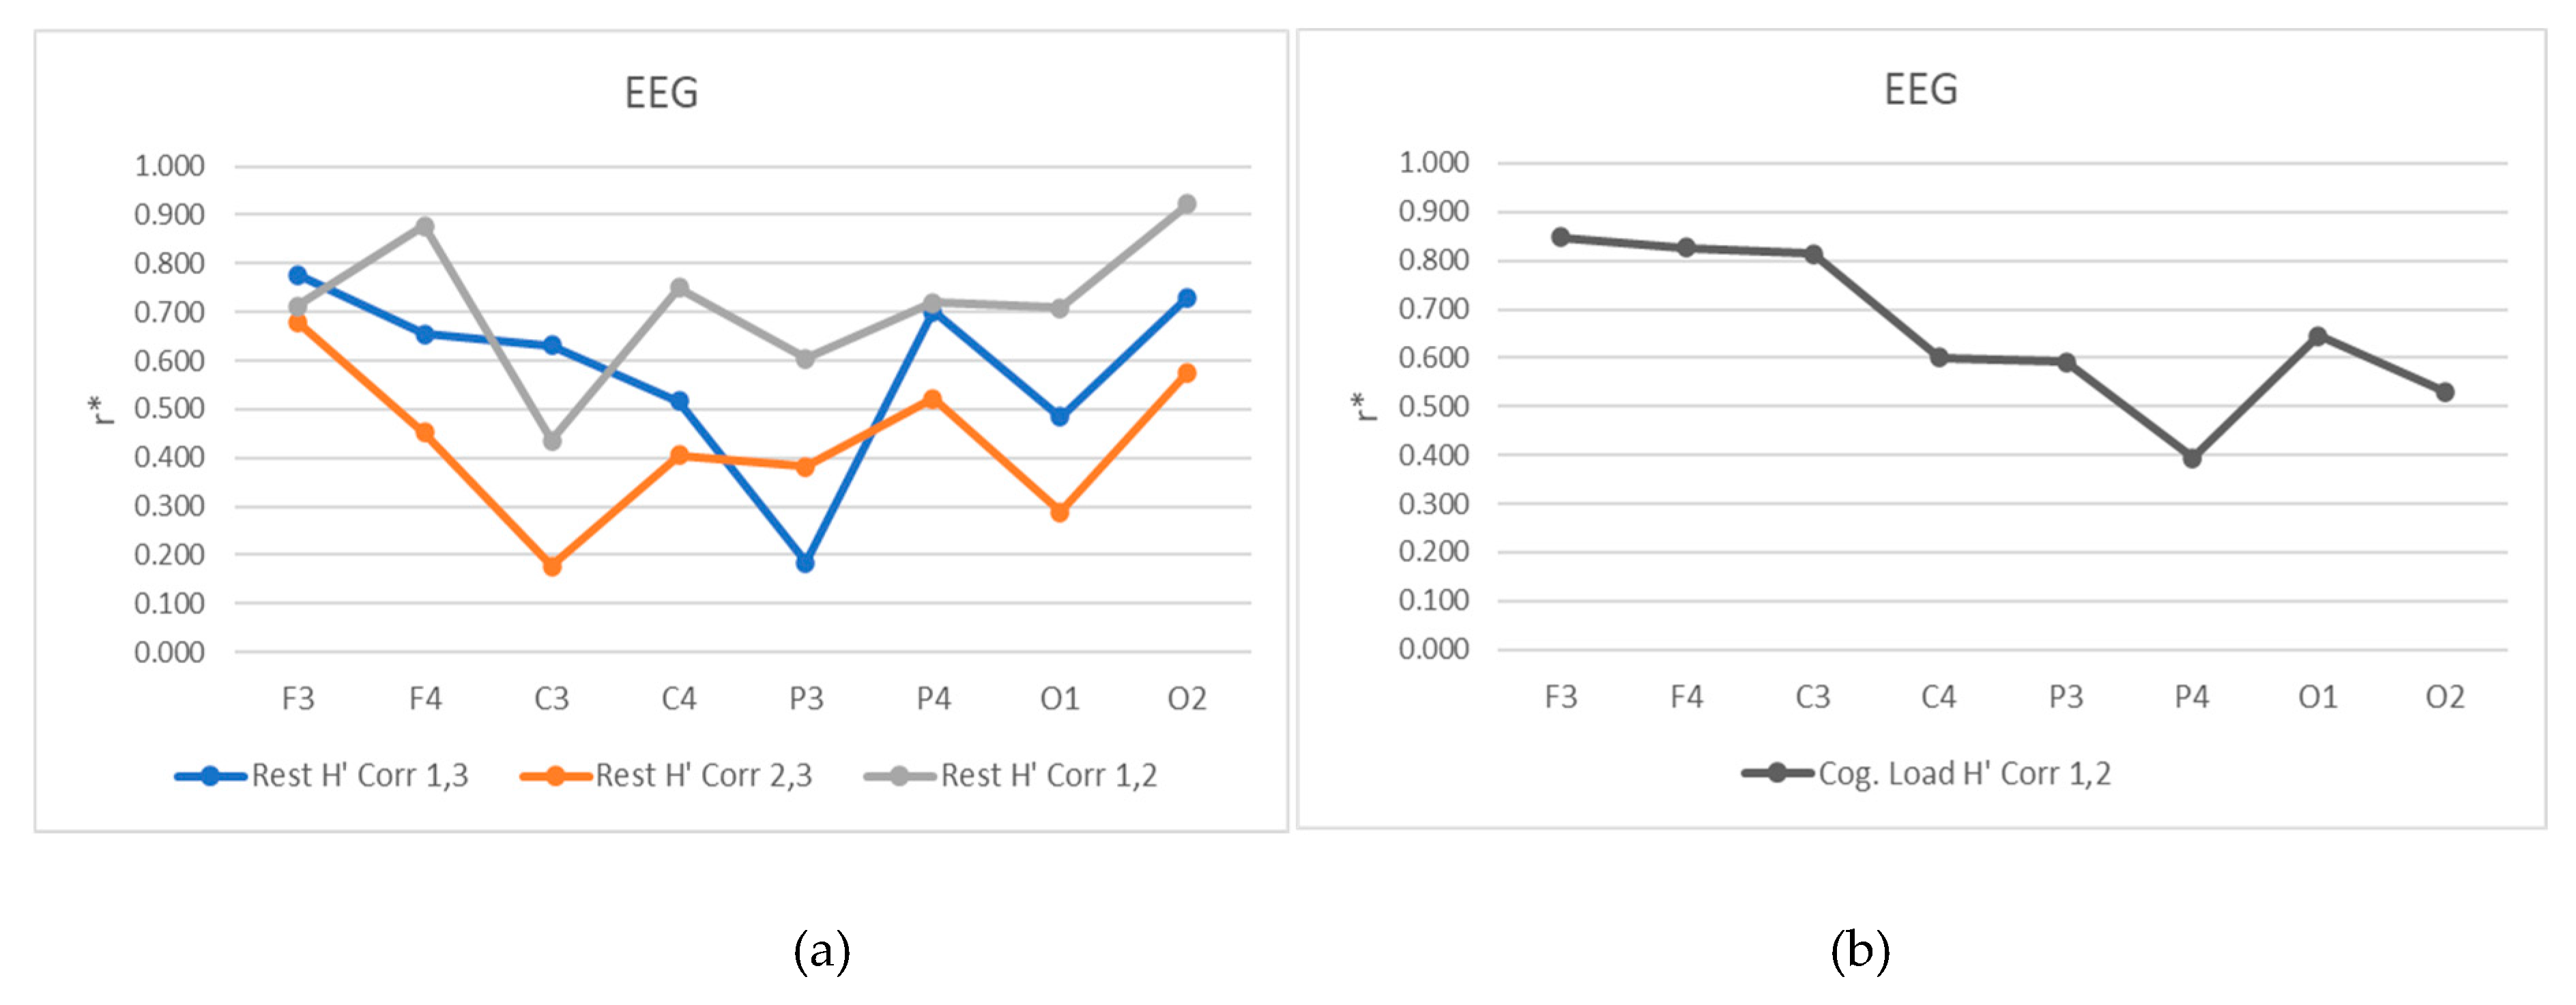
3.5. Electroencephalography (EEG)
4. Discussion
5. Conclusions
Author Contributions
Funding
Institutional Review Board Statement
Informed Consent Statement
Conflicts of Interest
Abbreviations
| HR | Heart rate |
| GSR | Galvanic skin response |
| SpO₂ | Peripheral oxygen saturation |
| EEG | Electroencephalography |
| fNIRS | Functional near-infrared spectroscopy |
| ECG | Electrocardiography |
| BCI | Brain-computer interfaces |
| EDA | Electrodermal activity |
References
- Meshkati, N., Hancock, P. A., Rahimi, M., and Dawes, S. M. Techniques in mental workload assessment. In J. R. Wilson E. N. Corlett (Eds.). Evaluation of human work: A practical ergonomics methodology 1995, Taylor Francis, 2nd ed., pp. 749–782.
- Diarra, M.; Theurel, J.; Paty, B. Systematic review of neurophysiological assessment techniques and metrics for mental workload evaluation in real-world settings. Front: Neuroergonomics 2025, 6. [Google Scholar] [CrossRef]
- Hitesh, Y.; Surita, M. Decoding brain signals: A comprehensive review of EEG-Based BCI paradigms, signal processing and applications. Computers in Biology and Medicine 2025, 196, 110937. [Google Scholar] [CrossRef]
- Dybvik, H.; Erichsen, C.; Snider, C.; Steinert, M. fNIRS, EEG, ECG, and GSR reveal an effect of complex, dynamically changing environments on cognitive load, affective state, and performance, but not physiological stress. Front. Hum. Neurosci., Sec. Cognitive Neuroscience 2025, 19. [Google Scholar] [CrossRef]
- McFarland, D.; Wolpaw, J; Brain. Computer Interfaces for Communication and Control. Commun ACM 2011, 54, 60–66. [Google Scholar] [CrossRef] [PubMed] [PubMed Central]
- Blankertz, B.; Muller, K-R.; Krusienski, D. J.; Schalk, G.; Wolpaw, J. R.; Schlogl, A.; Pfurtscheller, G.; Millan, J.; Schroder, M.; Birbaumer, N. The BCI competition III: Validating alternative approaches to actual BCI problems. IEEE Transactions on Neural Systems and Rehabilitation Engineering 2006, 14, 153–159. [Google Scholar] [CrossRef]
- Wolpaw, J.; McFarland, D. Control of a two-dimensional movement signal by a non-invasive brain-computer interface. Proceedings of the National Academy of Science 2004, 51, 17849–17854. [Google Scholar] [CrossRef]
- Muller, K.; Tangermann, M.; Dornhege, G.; Krauledat, M.; Curio, G.; Blankertz, B. Machine learning for real-time single-trial EEG-analysis: From brain-computer interfacing to mental state monitoring. Journal of Neuroscience Methods 2008, 167, 82–90. [Google Scholar] [CrossRef]
- Scherer, R.; Muller, G.; Neuper, C.; Graimann, B.; Pfurtschheller, G. An asynchronously controlled EEG-based virtual keyboard: Improvement of the spelling rate. IEEE Transactions on Biomedical Engineering 2004, 51, 979–984. [Google Scholar] [CrossRef]
- Galan, F.; Nuttin, M.; Lew, E.; Ferrez, P.; Vanacker, G.; Philips, J.; Millan, J. A brain-actuated wheelchair: Asynchronous and non-invasive Brain-computer interfaces for continuous control of robots. Clinical Neurophysiology 2008, 119, 2159–2169. [Google Scholar] [CrossRef] [PubMed]
- Leeb, R.; Friedman, D.; Muller-Putz, G.; Scherer, R.; Slater, M.; Pfurtscheller, G. Self-paced (Asynchronous) BCI control of a Wheelchair in virtual environments: A case study with a tetraplegic. Computational Intelligence and Neuroscience 2007, 79642. [Google Scholar] [CrossRef] [PubMed]
- McFarland, D.; Wolpaw, J. Brain-computer interface operation of robotic and prosthetic devices. Computer 2008, 41, 48–52. [Google Scholar] [CrossRef]
- Scarpina, F; Tagini, S. The Stroop Color and Word Test. Front Psychol 2017, 12, 557. [Google Scholar] [CrossRef] [PubMed] [PubMed Central]
- Stroop, J. Studies of interference in serial verbal reactions. J Exp Psychol 1935, 18, 643–62. [Google Scholar] [CrossRef]
- Liu, D; Tan, X; Yan, H; Li, W. Improving mental arithmetic ability of primary school students with schema teaching method: An experimental study. PLoS One 2024, 16, e0297013. [Google Scholar] [CrossRef] [PubMed] [PubMed Central]
- Flores Vega, C.; Noel, J.; Fernández, J. Cognitive task discrimination using approximate entropy on EEG signals. ISSNIP Biosignals and Biorobotics Conference: Biosignals and Robotics for Better and Safer Living (BRC), Rio de Janeiro, Brazil, 2013; pp. 1–4. [CrossRef]
- Minchev, Z. Cyber Threats Analysis In On-Line Social Networks with a Study on User Response. Institute of ICT, Bulgarian Academy of Sciences;IT4SEC Reports 2012, No.115. [Google Scholar] [CrossRef]
- Niedermeyer’s Electroencephalography Basic Principals, Clinical Applications, and related fields. In Lippincott Williams and Wilkins, 6th Edition; Schomer, D., Lopes da Silva, F., Eds.; Hagerstown, 2011. [Google Scholar]
- Davis, J.; Schübeler, F.; Ji, S.; Kozma, R. Discrimination Between Brain Cognitive States Using Shannon Entropy and Skewness Information Measure. IEEE International Conference on Systems 2020, Man, and Cybernetics SMC, Toronto, ON, Canada, 2020; pp. 4026–4031. [Google Scholar] [CrossRef]
- Zhang, L-Yi. Kolmogorov entropy changes and cortical lateralization during complex problem solving task measured with EEG. J. Biomedical Science and Engineering 2009, 2, 661–664. [Google Scholar] [CrossRef]
- Liu, X.; Wang, W.; Liu, M.; et al. Recent applications of EEG-based brain-computer-interface in the medical field. Military Med Res 2025, 12, 14. [Google Scholar] [CrossRef]
- Handbook of Psychophysiology, 4th ed.; Cacioppo, J., Tassinary, L., Berntson, G., Eds.; Cambridge University Press, 2017. [Google Scholar]
- VERIM Web Page. Available online: https://www.verim.eu/verim-lab/.
- Stewart, S.; Johnson, R. Blackbody Radiation: A History of Thermal Radiation Computational Aids and Numerical Methods; CRC Press, 2016; ISBN 9781315372082. [Google Scholar] [CrossRef]
- Torp, K.; Modi, P.; Pollard, E.; et al. Pulse Oximetry. In StatPearls Publishing; 2025; Available online: https://www.ncbi.nlm.nih.gov/books/NBK470348/.
- Davies, H.; Williams, I.; Hammour, G.; Yarici, M.; Seemungal, B.; Mandic, D. In-Ear SpO2 for Classification of Cognitive Workload. IEEE Transactions on Cognitive and Developmental Systems 2023, 15. [Google Scholar] [CrossRef]
- Ayres, P.; Lee, J.; Paas, F.; van Merriënboer, G.J. The Validity of Physiological Measures to Identify Differences in Intrinsic Cognitive Load. Frontiers in Psychology 2021, 12, 702538. [Google Scholar] [CrossRef]
- Seraganian, P.; Szabo, A. The Effect of Vocalization on the Heart Rate Response to Mental Arithmetic. Physiology & Behavior 1997, 62, 221–224. [Google Scholar] [CrossRef] [PubMed]
- Thermal imaging cameras. FLIR Systems. Available online: https://www.flir.com.
- Minchev, Z.; Gatev, P. Psychophysiological Evaluation of Emotions due to the Communication in Social Networks. Scripta Scientifica Medica 2012, 44, 125–128. [Google Scholar]
- Karmakar, S.; Nikhil, K.; Basu, A.; Koley, C.; Pal, T. Analysis of the Entropy of Different EEG Bands to Measure the Cognitive Load During Mental Tasks. In Intelligent Computing. CompCom 2025. Lecture Notes in Networks and Systems; Arai, K., Ed.; Springer: Cham; vol 1423. [CrossRef]
Disclaimer/Publisher’s Note: The statements, opinions and data contained in all publications are solely those of the individual author(s) and contributor(s) and not of MDPI and/or the editor(s). MDPI and/or the editor(s) disclaim responsibility for any injury to people or property resulting from any ideas, methods, instructions or products referred to in the content. |
© 2025 by the authors. Licensee MDPI, Basel, Switzerland. This article is an open access article distributed under the terms and conditions of the Creative Commons Attribution (CC BY) license (http://creativecommons.org/licenses/by/4.0/).


