1. Introduction
Mangrove ecosystems are tidal flat wetland woody plant communities comprising mainly tree and shrub plants in the tropical and subtropical regions[
1]. Mangroves are critical ecosystems, bridging land, freshwater and sea, and play a pivotal role in the coastal social, ecological, economic, and other ecosystem services[
2,
3]. There were 147,359 km
2 of mangrove forests distributed worldwide in 2020, with an area loss of 3.4% during 1996-2020[
3]. During 2000-2016, over 62% of global mangrove forests were lost primarily due to direct and indirect human impacts[
4]. Similarly, approximately 62% of China’s mangrove forests were lost between 1973 and 2000[
5,
6]. The continued decline of mangrove forests is generally caused by conversion to agriculture, aquaculture, tourism, urban development and overexploitation[
1]. However, invasive species can also threaten the persistence of mangrove forests[
7]. Smooth cordgrass (
Spartina alterniflora) is one of the most successful invasive species in mangrove wetlands and has dispersed coast-wide to all mangrove sites in China[
8], underscoring the need for the integration of invasive plant management strategy into mangrove forest management[
9]. Smooth cordgrass was first introduced to China in 1979. Since then, this species has proliferated along the coast of China, spreading from the southern tropical (i.e., Hainan Province) to the northeastern temperate (i.e., Liaoning Province) coastlines[
10]. In 2003, the smooth cordgrass was recognized as an invasive species in China by the Ministry of Ecology and Environment. Characterized by high adaptability and rapid reproduction, smooth cordgrass can proliferate over large areas after invasion, thereby encroaching on the habitats of mangroves and affect the ecosystem stability[
11,
12]. However, the role of the invasion of smooth cordgrass to the degradation of mangrove forests has received little attention[
9,
13].
Zhejiang Province is the most northern boundary suitable for mangrove forests in China[
14]. Due to the limitation of air temperature, the main mangrove species of
Kandelia obovata is artificially cultivated and planted in this province. This tree species can grow up to 6 m in the tropical region of China, but in Zhejiang Province, the tree height of mature
K. obovata forests is declined from about 3 m in the southern coast to lower than 1 m in the northern coast[
15]. All mangrove forests in this province were artificially planted. The suitable habitats of mangrove trees are overlapped with smooth cordgrass, and most mangrove trees were planted after the smooth cordgrass was mechanically removed[
16,
17]. Due to the lower height and slow growth rates and less competitive for
K. obovata, the smooth cordgrass can easily reinvade into the mangrove forests. The invasion of smooth cordgrass can either cause the death of mangrove trees or poor growth due to resource competition or overshadow. In addition, the high density and extensive root system of smooth cordgrass create a “green desert” in its distribution areas, which poses a significant threat to intertidal biodiversity[
8,
18]. The local government is striving to recover the mangrove forests and remove the invasive smooth cordgrass. The Special Action Plan for Mangrove Conservation and Restoration (2020–2025) was issued in 2020 and under this plan, Zhejiang Province plans to afforest 690 ha mangrove forests, accounting for 182% of current area (385 ha)[
15]. To help identify the suitable planting area and mitigate the impacts from smooth cordgrass, accurate monitoring of present mangrove and smooth cordgrass distribution area and landscape patterns is urgently needed.
Due to the advantages with larger spatial coverage, less cost, and various scales and resolution, remote sensing tools have been widely applied to detect the invasion of smooth cordgrass into mangrove forests in the past decades[
7,
12,
13,
19]. Based on the Landsat imagery, Wu et al. [
17] monitored the dynamic changes of smooth cordgrass and mangrove area and landscape patterns from 2005 to 2021 in the Zhangjiang Estuary, Zhejiang Province. Based on Gaofen-1 multispectral imagery, Li et al.[
16] monitored and assessed the spreading of smooth cordgrass in the mangrove forests at Shankou Mangrove Reserve, Guangxi Province. These satellite platforms were successfully applied to monitor the spatiotemporal change patterns of smooth cordgrass and mangrove forests at regional, national or global scales; however, these platforms are not suitable and accurate enough for detecting the dynamic changes of these two vegetation types in the area with scattered distribution and short plants. For example, the detected area of mangrove forests in Zhejiang varied from 6.12 ha to 386.77 ha based on the classifications from different satellite platforms such as Landsat, SPOT, Sentinel-2, ALOS, WorldView and Gaofen-1[
3,
5,
14,
20,
21], implying a large uncertainty in the estimated mangrove forest area in Zhejiang Province, mainly due to the compounding effects from the smooth cordgrass[
20,
21]. A few satellite-based studies have also reported the smooth cordgrass invasion into mangrove forests[
12,
22,
23]. Liu et al.[
24] applied multi-sources of high-resolution satellite images to monitor the invasion of smooth cordgrass into the mangrove forests. In recent years, a few studies begun to apply UAV imagery to detect the invasion of smooth cordgrass into mangrove forests[
12,
13,
23]. For example, Kan et al. [
13] applied the UAV images and machine learning methods detected the coverage for both smooth cordgrass and mangrove trees in an estuary of Fujian Province and achieved excellent performance, suggesting the UAV method can be more accurate applied especially at plot and ecosystem scales. However, few studies have been conducted to detect coverage of both mangrove trees and smooth cordgrass at provincial scale.
Based on the single-date provincial level UAV imagery, our study aims to detect the coverage of both mangrove trees and smooth cordgrass and assess the invasion status of smooth cordgrass into mangrove forests. More specifically, our study seeks to address three research questions: (1) Which classification method is the most suitable for detection of both mangrove trees and smooth cordgrass based on the UAV imagery? (2) How much mangrove trees are actually survived and where they are located? (3) What is the invasive status of smooth cordgrass and the implications for management in Zhejiang Province? The findings will help guide the conservation and planting planning of mangrove trees, and the scientific control of smooth cordgrass invasions in Zhejiang Province.
2. Materials and Methods
2.1. Study Area
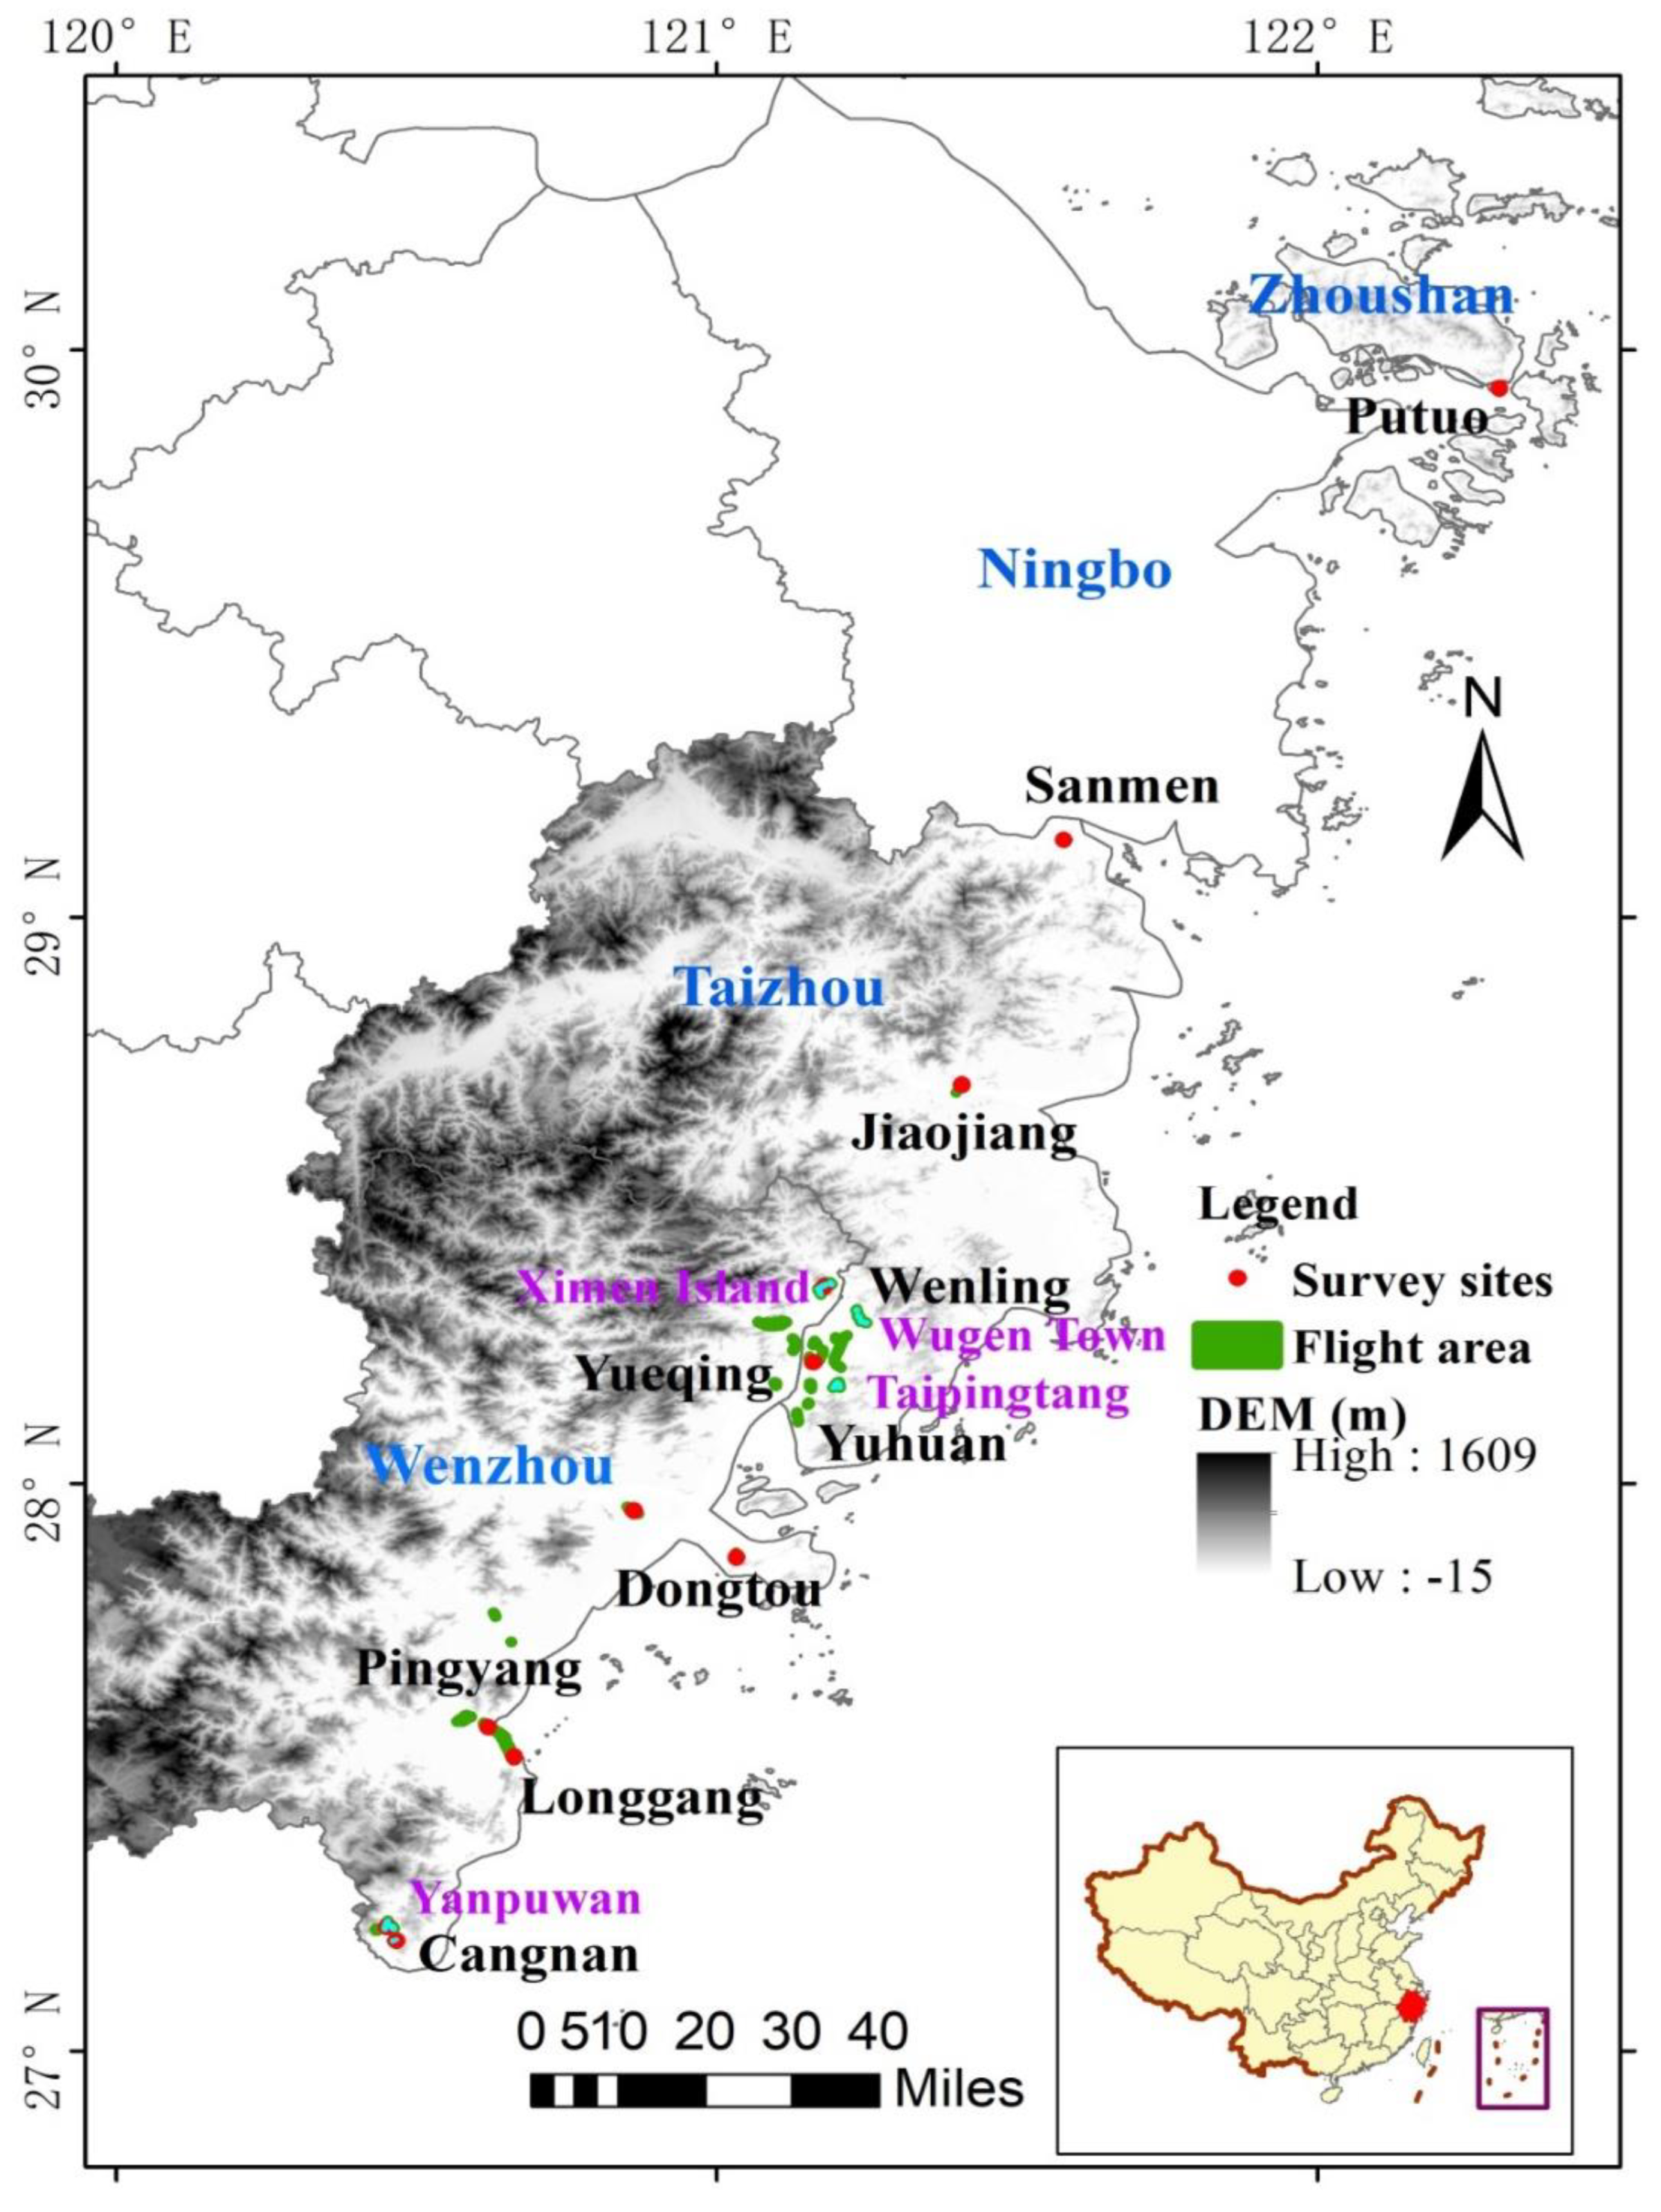
The study area is located at the coastline of Zhejiang Province (27°03′–31°04′N, 119°37′–123°25′E) (
Figure 1). The study region is characterized by a middle-to-northern subtropical maritime monsoon climate. The annual average temperature is 17.7 °C, the annual average rainfall is 1507 mm, and the frost-free period is 258 days. All mangrove forests in this province are artificially planted. Based on the previous inventory and the governmental statistical documents, only several cities or districts have planted mangrove trees, including the cities of Zhoushan, Taizhou, and Wenzhou. The mangrove forests are often threatened by the extreme low temperature in this region. The field experiments indicated that the lower limit temperature for mangrove forests is -5
oC, so the most northern distribution area is the Zhoushan City[
15,
25]. The majority (>95%) of the mangrove species is K. obovata.
K. obovata is an evergreen mangrove tree species belonging to the
Rhizophoraceae family and
Kandelia genus. The highest height of this species is about 6 m in China. This species is first introduced from Fujian Province, China and was cultivated using the tissue culture method to make them suitable for growth in Zhejiang Province[
25]. Except for the mudflat area at the leeward bay, all distribution area of smooth cordgrass is also suitable for
K. obovata too[
24].
Most of the mangrove trees were planted in the smooth cordgrass distribution area after the smooth cordgrass is mechanically removed. The smooth cordgrass was first introduced to Zhejiang in 1983 and expanded thereafter to 5,092 ha based on inventory data[
11]. This invasive species poses a serious threat to mangroves through stronger competition due to its ecological niche overlap with mangrove species especially in the northern limits of mangrove distribution in Zhejiang Province, where the mangrove trees grow slower than smooth cordgrass. In addition, the height of smooth cordgrass is often higher than that of mangrove trees in Zhejiang Province, also causing overshadow condition and tree mortality.
Due to the mangrove area is relatively small and scattered widely, we divided the distribution areas into 11 districts for analysis and mapping convenience, including Putuo, Sanmen, Jiaojiang, Wenling, Yueqing, Yuhuan, Dongtou, Rui’an, Pingyang, Longgang and Cangnan districts (
Figure 1).
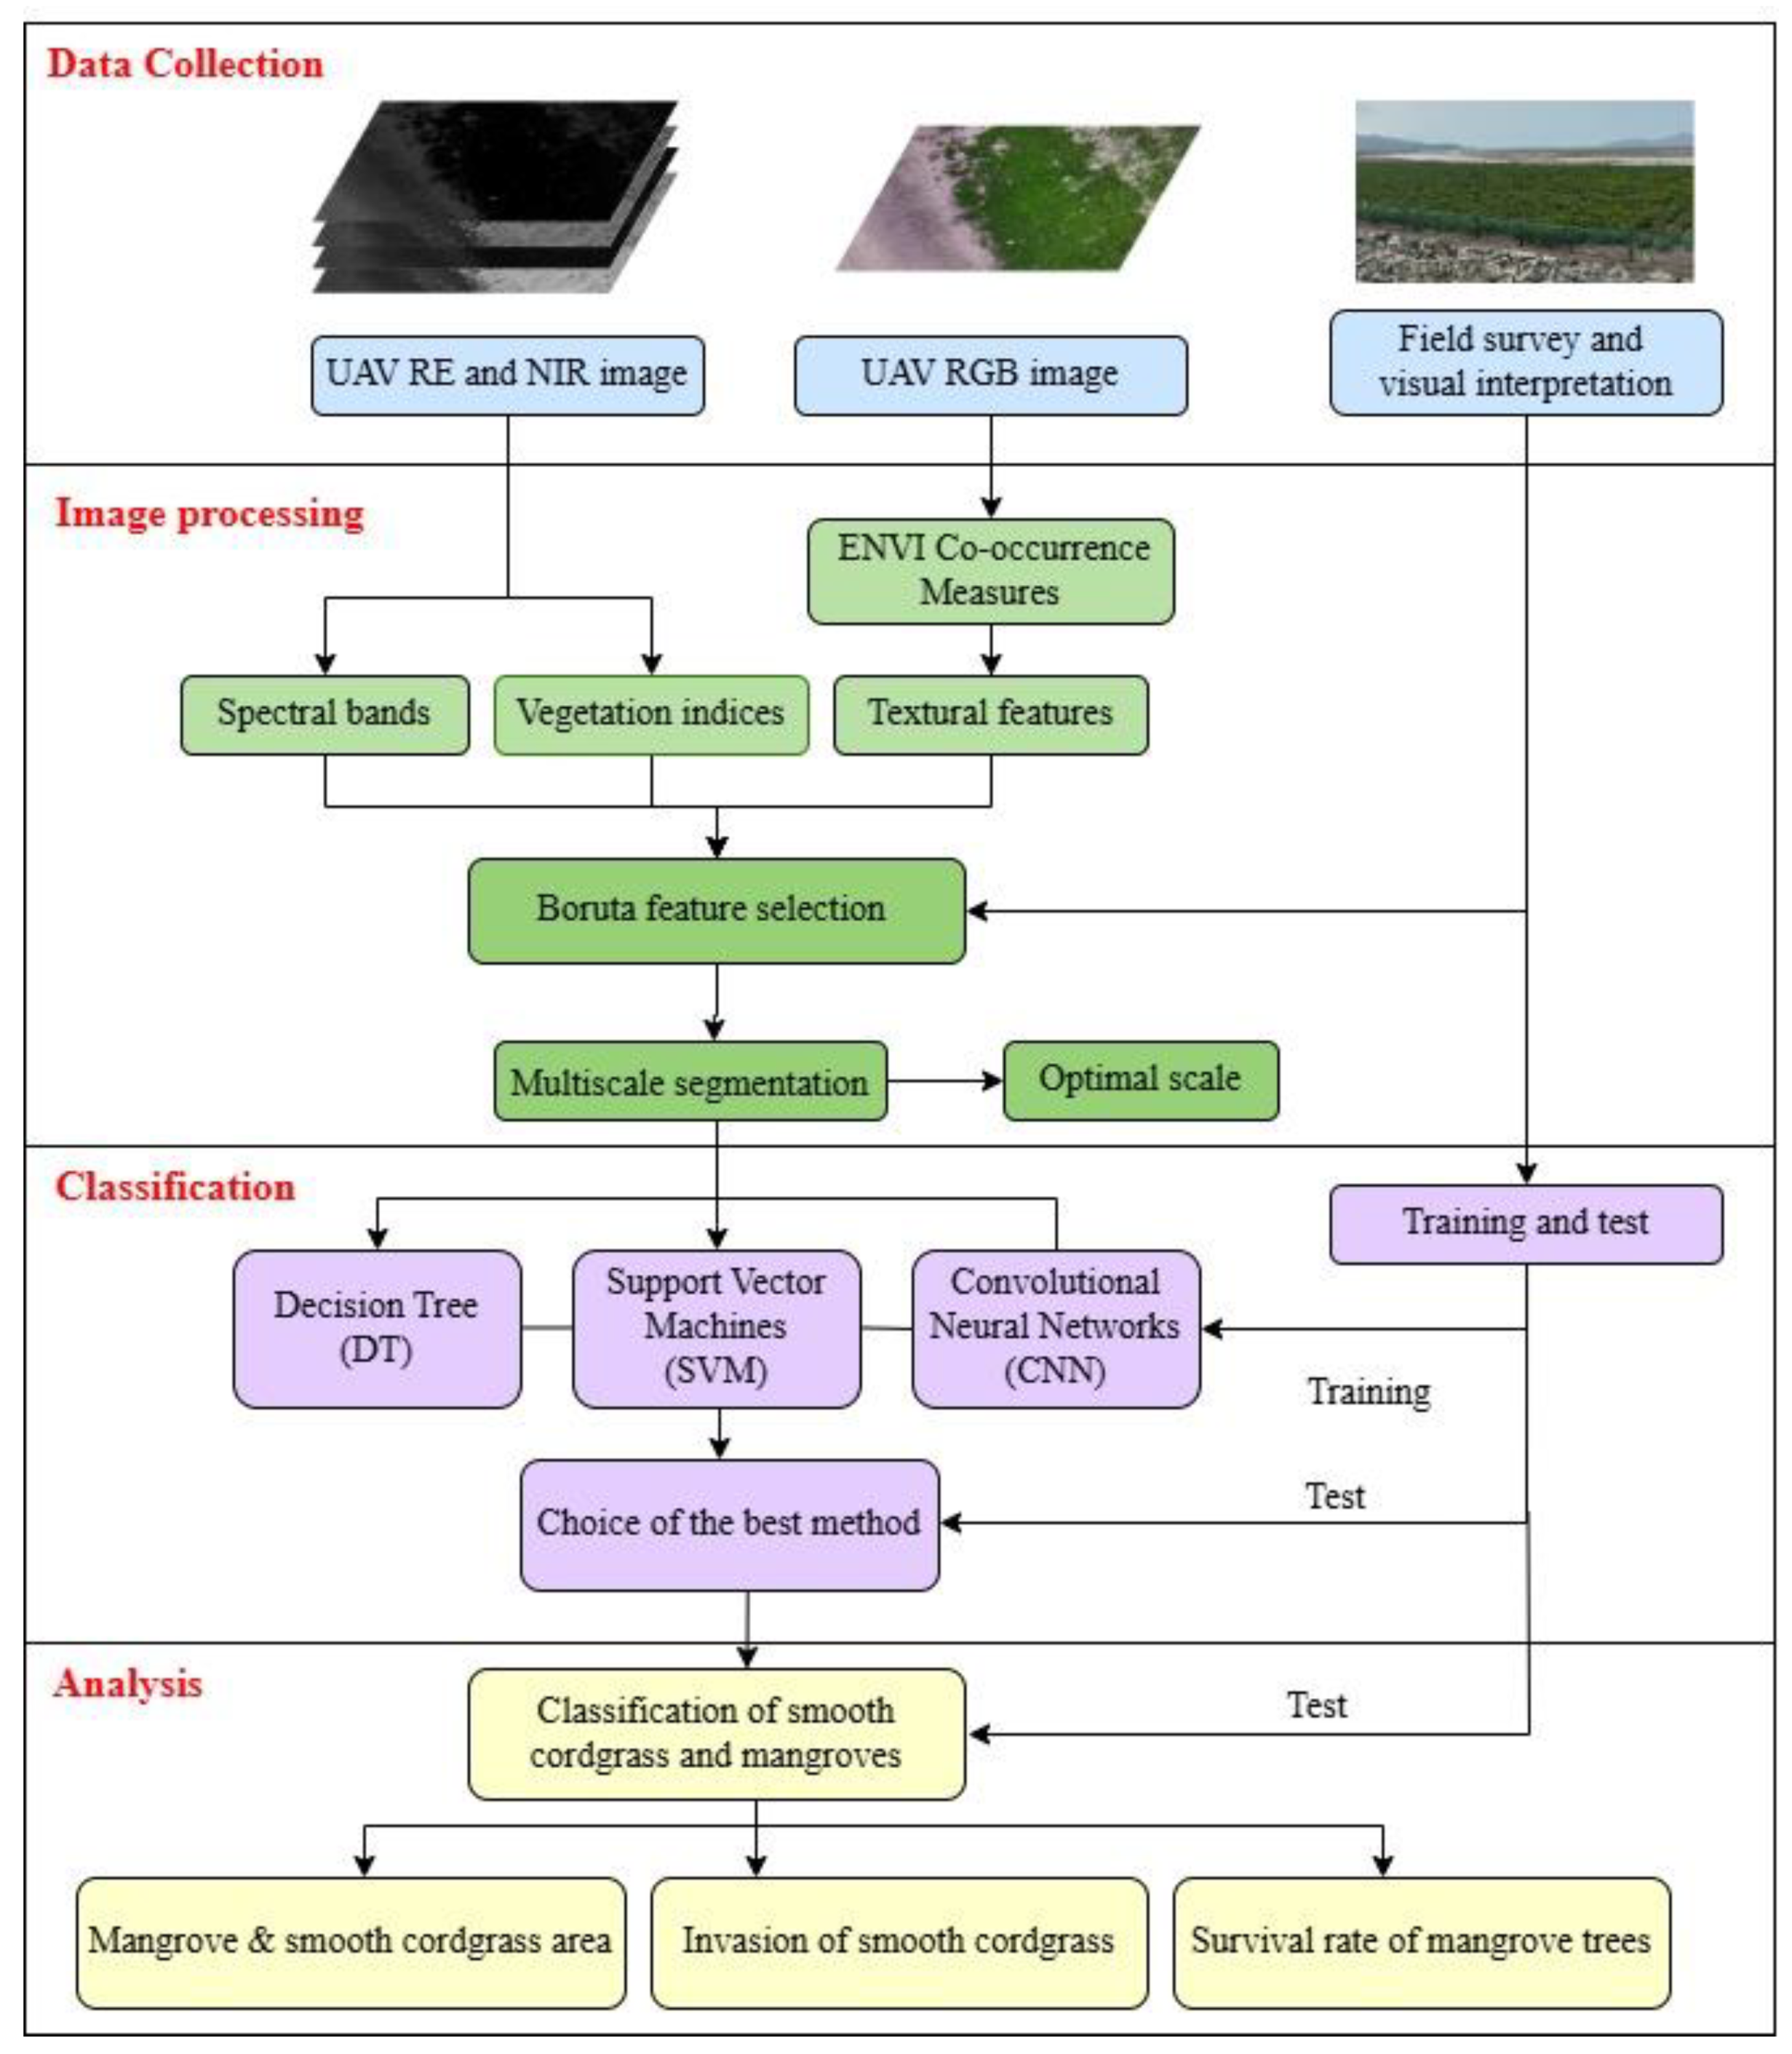
2.2. The Work Flow
The work flow of our study method consisted of various phases, as shown in
Figure 2. More detailed descriptions for the work flow were shown below.
2.3. UAV Image Collection
The multispectral airborne images were collected during the low tide period on August 8-15, 2023, using a DJI MAVIC 3 PRO UAV. The regions of interest for flights were first determined based on the inventory planting area boundary (
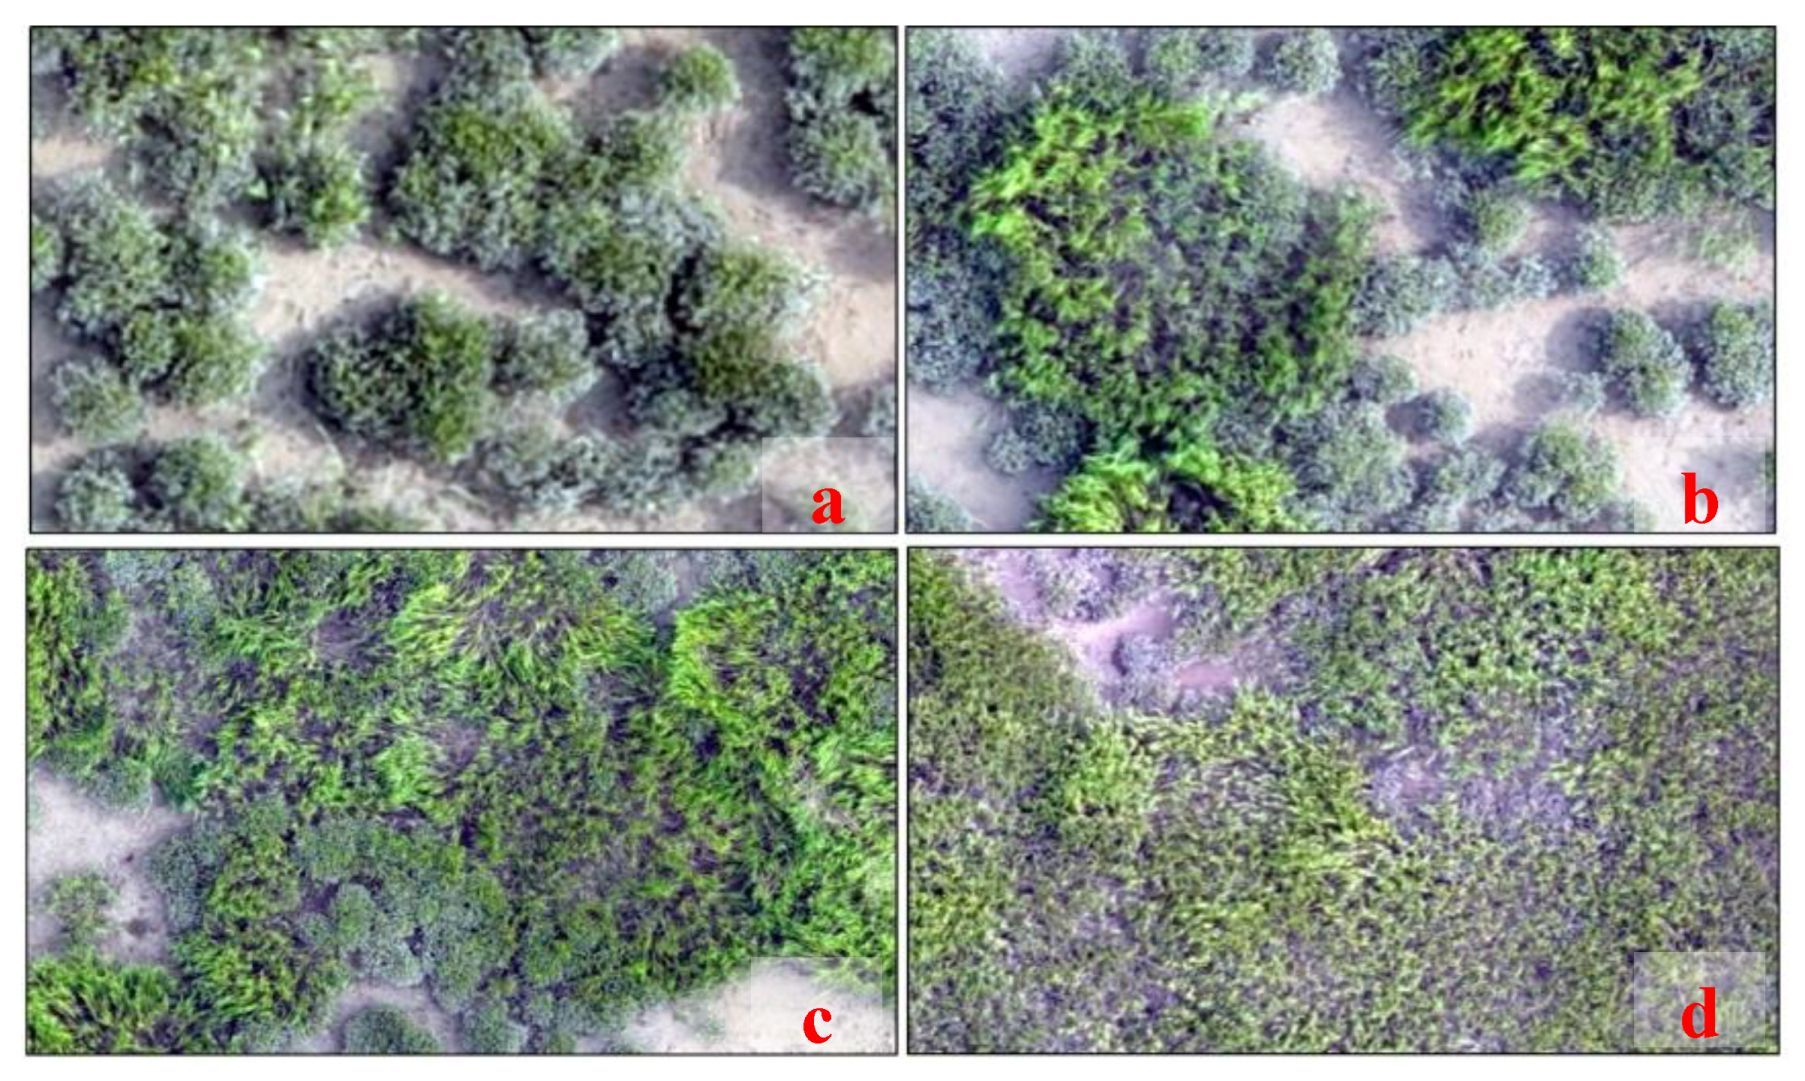
Figure 1). The flight route was designed and planned by DJI Fly, with an 80% flight overlap and 75% lateral overlap. The exposure time was 1/640s, the ISO speed was 100, and the flight altitude was 100 meters. The UAV is equipped with a multispectral camera, a global navigation satellite system (GNSS), and real-time kinematic (RTK) instrument. The multispectral sensor has five bands: green (G), red (R), Blue (B), red edge (RE), and Near-Infrared (NIR). The UAV is equipped with a light intensity sensor that is capable of automatically adapting to ambient light conditions, thereby facilitating the acquisition of enhanced NDVI data during reconstruction. The weather conditions during the data collection were very suitable for flight, with low wind velocity. The UAV images for different levels of evasion were shown in
Figure 3.
2.4. Ground-Truth Survey and Sampling Data Collection
A full field inventory was conducted during August 23-29, 2023 along the coastal line of Zhejiang Province from the south (Wenzhou City) to the north (Zhousan City). The plot coordinates and sampling point locations were recorded using the survey-grade GPS receivers of Huace RTK (Everest Edition), with 8 mm horizontal accuracy and 15 mm elevation accuracy. Due to the difficulty to separate individual mangrove tree canopy and lower height, we set up each 5×5 m plot to represent the plot-scale average conditions. For mangrove trees, the investigated variables include average and maximum tree height, mean canopy coverage (percent of land area), mean basal diameter, and tree numbers within each a plot. For smooth cordgrass, the mean height and coverage within a plot was investigated. The fraction of canopy coverage by mangrove trees and smooth cordgrass in each plot was then manually calculated. In addition, to increase sampling size, we also conducted visual interpretation to calculate the canopy coverage for all land cover types. Totally, 1534 sampling plots were collected, including 251 plots for mudflat, 149 plots for water body, 139 plots for built-up land, 479 plots for mangrove trees, 362 plots for smooth cordgrass, and 154 plots for others (
Figure 1).
2.5. Image Processing
The image preprocessing was conducted using the DJI Terra software (DJI, Shenzhen, China), which provides comprehensive image preprocessing steps for DJI UAVs, facilitating the acquisition of data. The flight route was processed and stitched to generate an orthophoto map. The atmospheric correction, radiometric calibration, and reflectance correction were performed to remove the distortion. Finally, the image is cropped as study area according to the reported planted area for mangrove trees.
Previous research has proved that texture features, vegetation indices, and spectral bands can be applied to differentiate mangrove trees and other vegetation types. Therefore, we selected the reflectance values of four bands (R, G, NIR, and Red Edge), four vegetation indices (Normalized Difference Vegetation Index, NDVI; Normalized Difference Red Edge Vegetation Index, NDRE; Green NDVI, GNDVI; and Leaf Area Index, LAI), and texture variables (the mean, variance, homogeneity, contrast, dissimilarity, entropy, second moment, and correlation). The eight texture variables were calculated for each band using the Gray-Level Co-occurrence Matrix (GLCM). The chosen moving window was 7 × 7 pixels.
Table 1.
The extract features for classification.
Table 1.
The extract features for classification.
| Object Features |
Description |
| Spectral bands |
Red (R); Green (G); Red Edge (RE); Near-infrared (NIR) |
| Vegetation indices |
Normalized Difference Red Edge Vegetation Index (NDRE), Normalized Difference Green Vegetation Index (GNDVI), Leaf Area Vegetation Index (LAI), Normalized Difference Vegetation Index (NDVI) |
| Textural variables |
Mean, variance, homogeneity, contrast, dissimilarity, entropy, second moment, correlation |
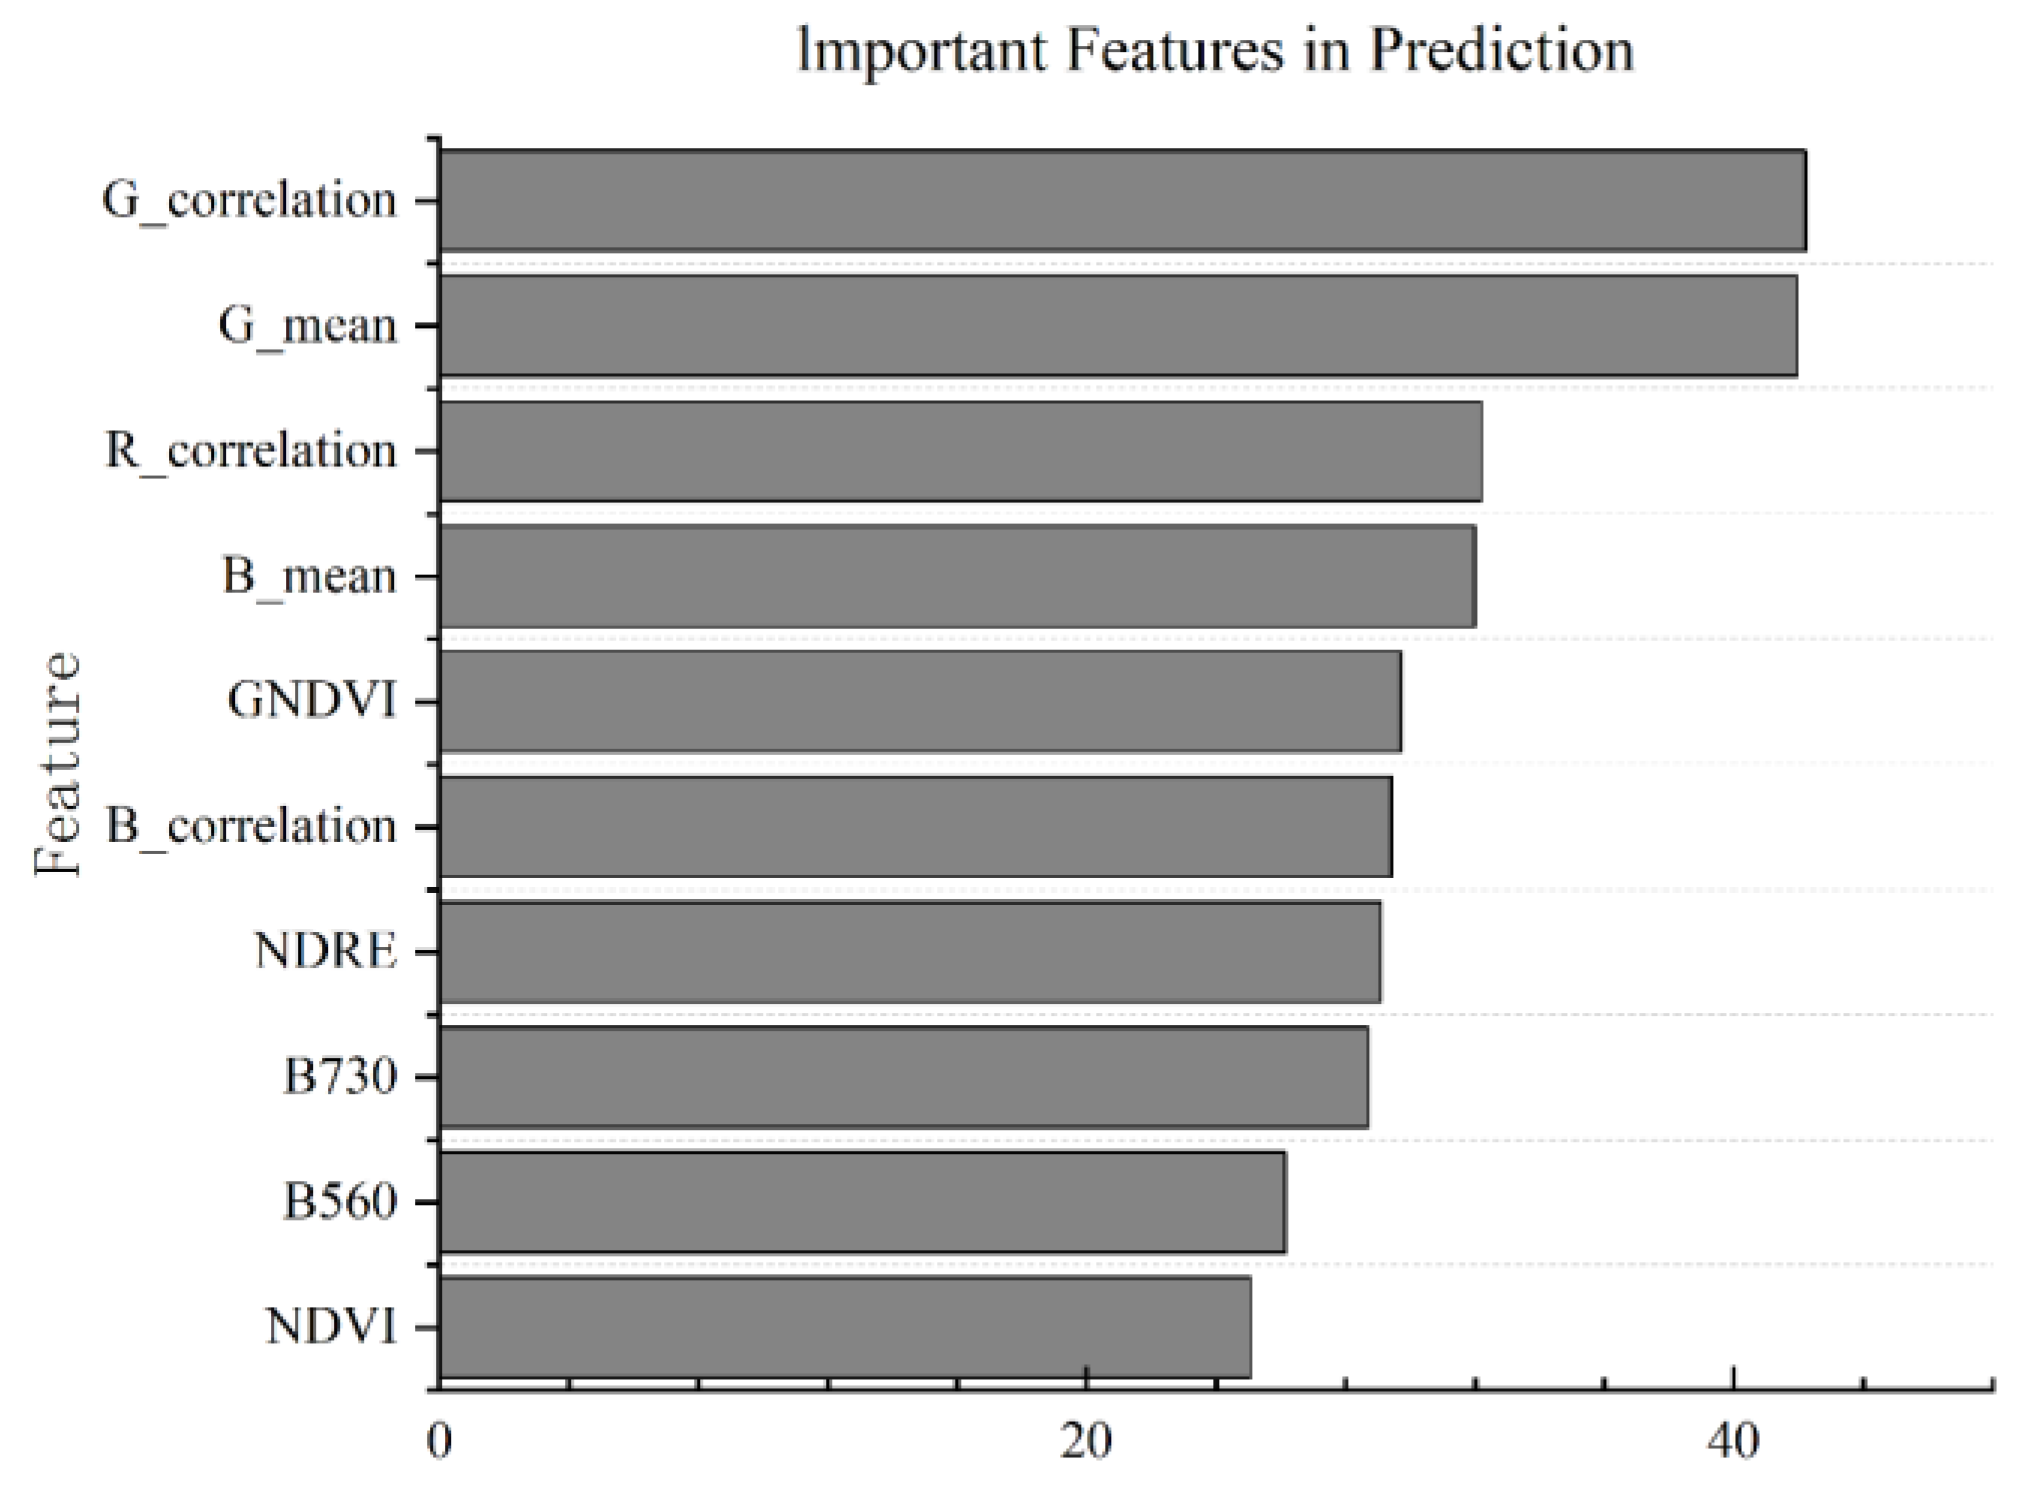
The Boruta algorithm was employed in the screening of the key and most important classification features. The Boruta algorithm is capable of identifying all quantities that exert a significant influence on the classification outcome[
26]. The fundamental premise is to statistically ascertain the significance of actual variables and those that have been randomly introduced. Furthermore, it is capable of considering the relationship between multiple variables. The importance of all 33 input variables for the machine-leaning classification of land cover types was ranked. The 10 variables with the highest classification capability were identified based on the feature importance index. As shown in
Figure 4, the five most important features were G_correlation, G_mean, R_correlation, B_mean, and GNDVI, indicating the texture features are more important than vegetation indices and spectral bands, especially to differentiate the mangrove trees and smooth cordgrass.
The land cover types were subdivided into five primary categories including nuilt-up land (BU), mangroves (MA), mudflats (MU), smooth cordgrass (SC) and water body (WA).
2.6. Multi-Scale Segmentation
Due to the high spatial resolution and different sizes of varied objects, multi-scale segmentation rather than pixel-based classification method is applied to remove the “salt-and-pepper noise” and increase the feature extraction accuracy[
27]. Multi-scale segmentation is a step in the object-oriented classification that divides pixels into discrete units, thereby facilitating the formation of objects comprising pixels with similar characteristics at a given scale. The FbSP (Fuzzy-based Segmentation Parameter) optimizer in eCognition 10.3 software was selected to determine the optimal segmentation parameters including scale, shape/color, and smoothness/compactness. The scale parameter represents the size of the segmentation (the maximum heterogeneity degree of objects), while the shape parameter represents the weight assigned to the segmentation criterion. An elevated compactness index indicates a more compact image [
28].
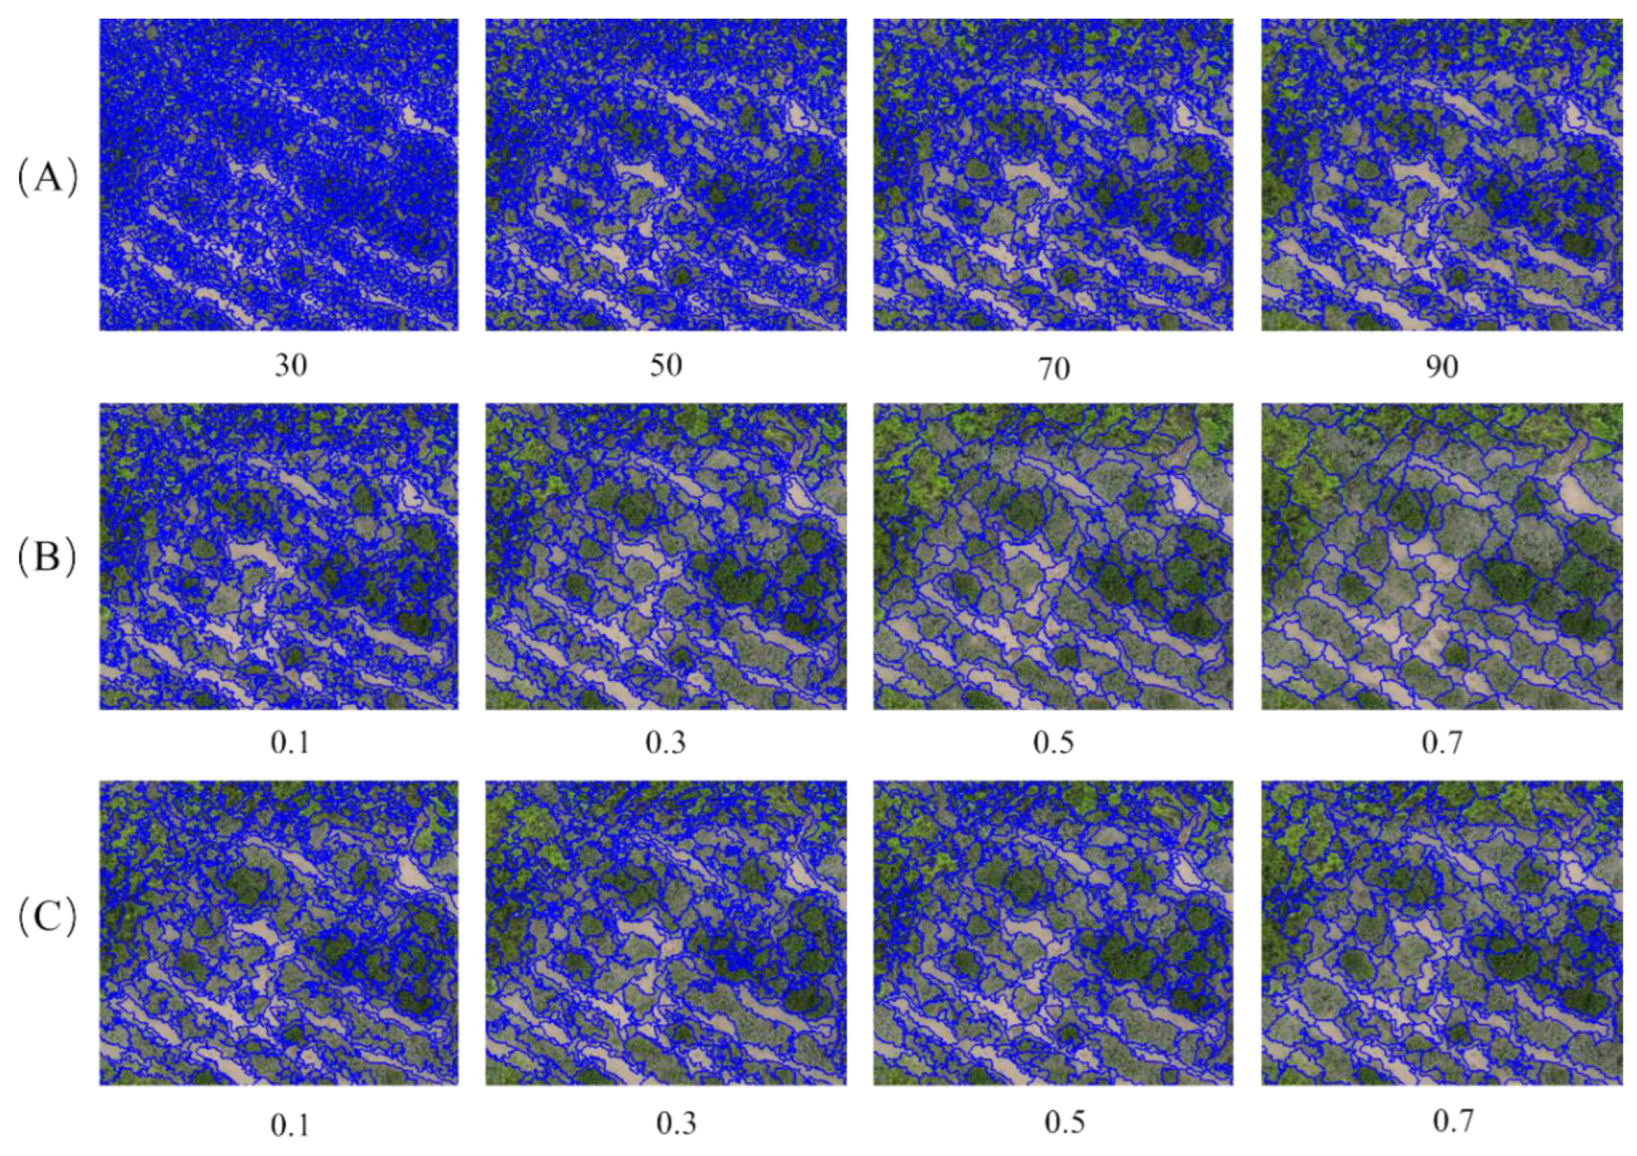
The shape index, compactness and scale parameters were adjusted to perform a series of tests. The ranges for shape index and compactness parameters were set from 0.1 to 0.9, while the scale parameters are set from 10 to 100. The results showed when the scale is set to 70, the neighboring objects with similar features are often misclassified. When the scale was set to 50 or 30, the segmentation results were too fragile, which affected the efficiency of subsequent image processing (
Figure 5A). When the shape index was set as 0.1, 0.3, and 0.7, adjacent objects with some shape similarities were grouped into one category. This included cases such as mangroves and smooth cordgrass (
Figure 5B). Visual inspection of the segmentation results showed that when the compactness was 0.5, the objects of each land cover type were more compact and the overall segmentation result was visually most satisfactory (
Figure 5C). Accordingly, when evaluating the clustering characteristics of the distribution of mangrove communities in the study area, the optimal scale, shape, and compactness parameters were determined as 70, 0.3, and 0.5, respectively, based on multiple interactive segmentation trials.
2.7. Classification Methods
We applied the object-oriented classification methods to detect land cover types in the study area, which is based on optimal segmentation parameters and the selected features. The most commonly support vector machine (SVM), CART decision tree (DT), and convolutional neural networks (CNN) algorithms are chosen to evaluate their performance. These methods have all been previously applied to detect mangrove and smooth cordgrass[
13,
29,
30].
The SVM is an advanced supervised learning algorithm that can be used as a non-parametric classifier for land cover classification based on multispectral imagery, including the classification of mangrove species. SVM is based on statistical learning theory and aims to identify the optimal decision hyperplane in high-dimensional space, thereby achieving the best possible category separation. In the context of uncertain classification problems with high-dimensional features, SVM has demonstrated consistent performance, even with a limited number of training samples[
30].
The decision tree algorithm partitions data into numerous subsets and represents decision rules and classification outcomes in a tree-like data structure, frequently a multi-node tree[
31]. CART is a decision tree regression model that can be employed for both classification and regression analysis. CART is mainly applied to land-cover mapping, disaster monitoring, and crop identification. This algorithm offers several advantages: the rules are transparent and easy to interpret, the tree can be adjusted effortlessly afterwards, and it supports refined multi-class discrimination. Decision trees are split into classification trees and regression trees on the basis of the predictor variables: when the response is discrete the tree performs classification; when the response is continuous it performs regression. Starting from the root, samples are routed through successive nodes until a final class label or value is returned
Convolutional neural networks (CNNs) represent a class of artificial neural networks that are designed to process information in a manner similar to that of the human brain[
32]. A distinctive feature of CNNs is their network structure, comprising multiple hidden layers, each of which contains both a convolutional layer and a pooling layer. In this study, the pre-trained convolutional neural network takes 64 × 64-pixel image patches as input. The architecture consists of 8 image-processing stages and 4 hidden layers whose neuron configurations are 9, 7, 5 and 3 units, respectively. For feature extraction, the model applies 12 feature maps to learn multi-level representations of the data. This hierarchical design captures spatially local patterns and, through successive abstraction, extracts high-level semantic features.
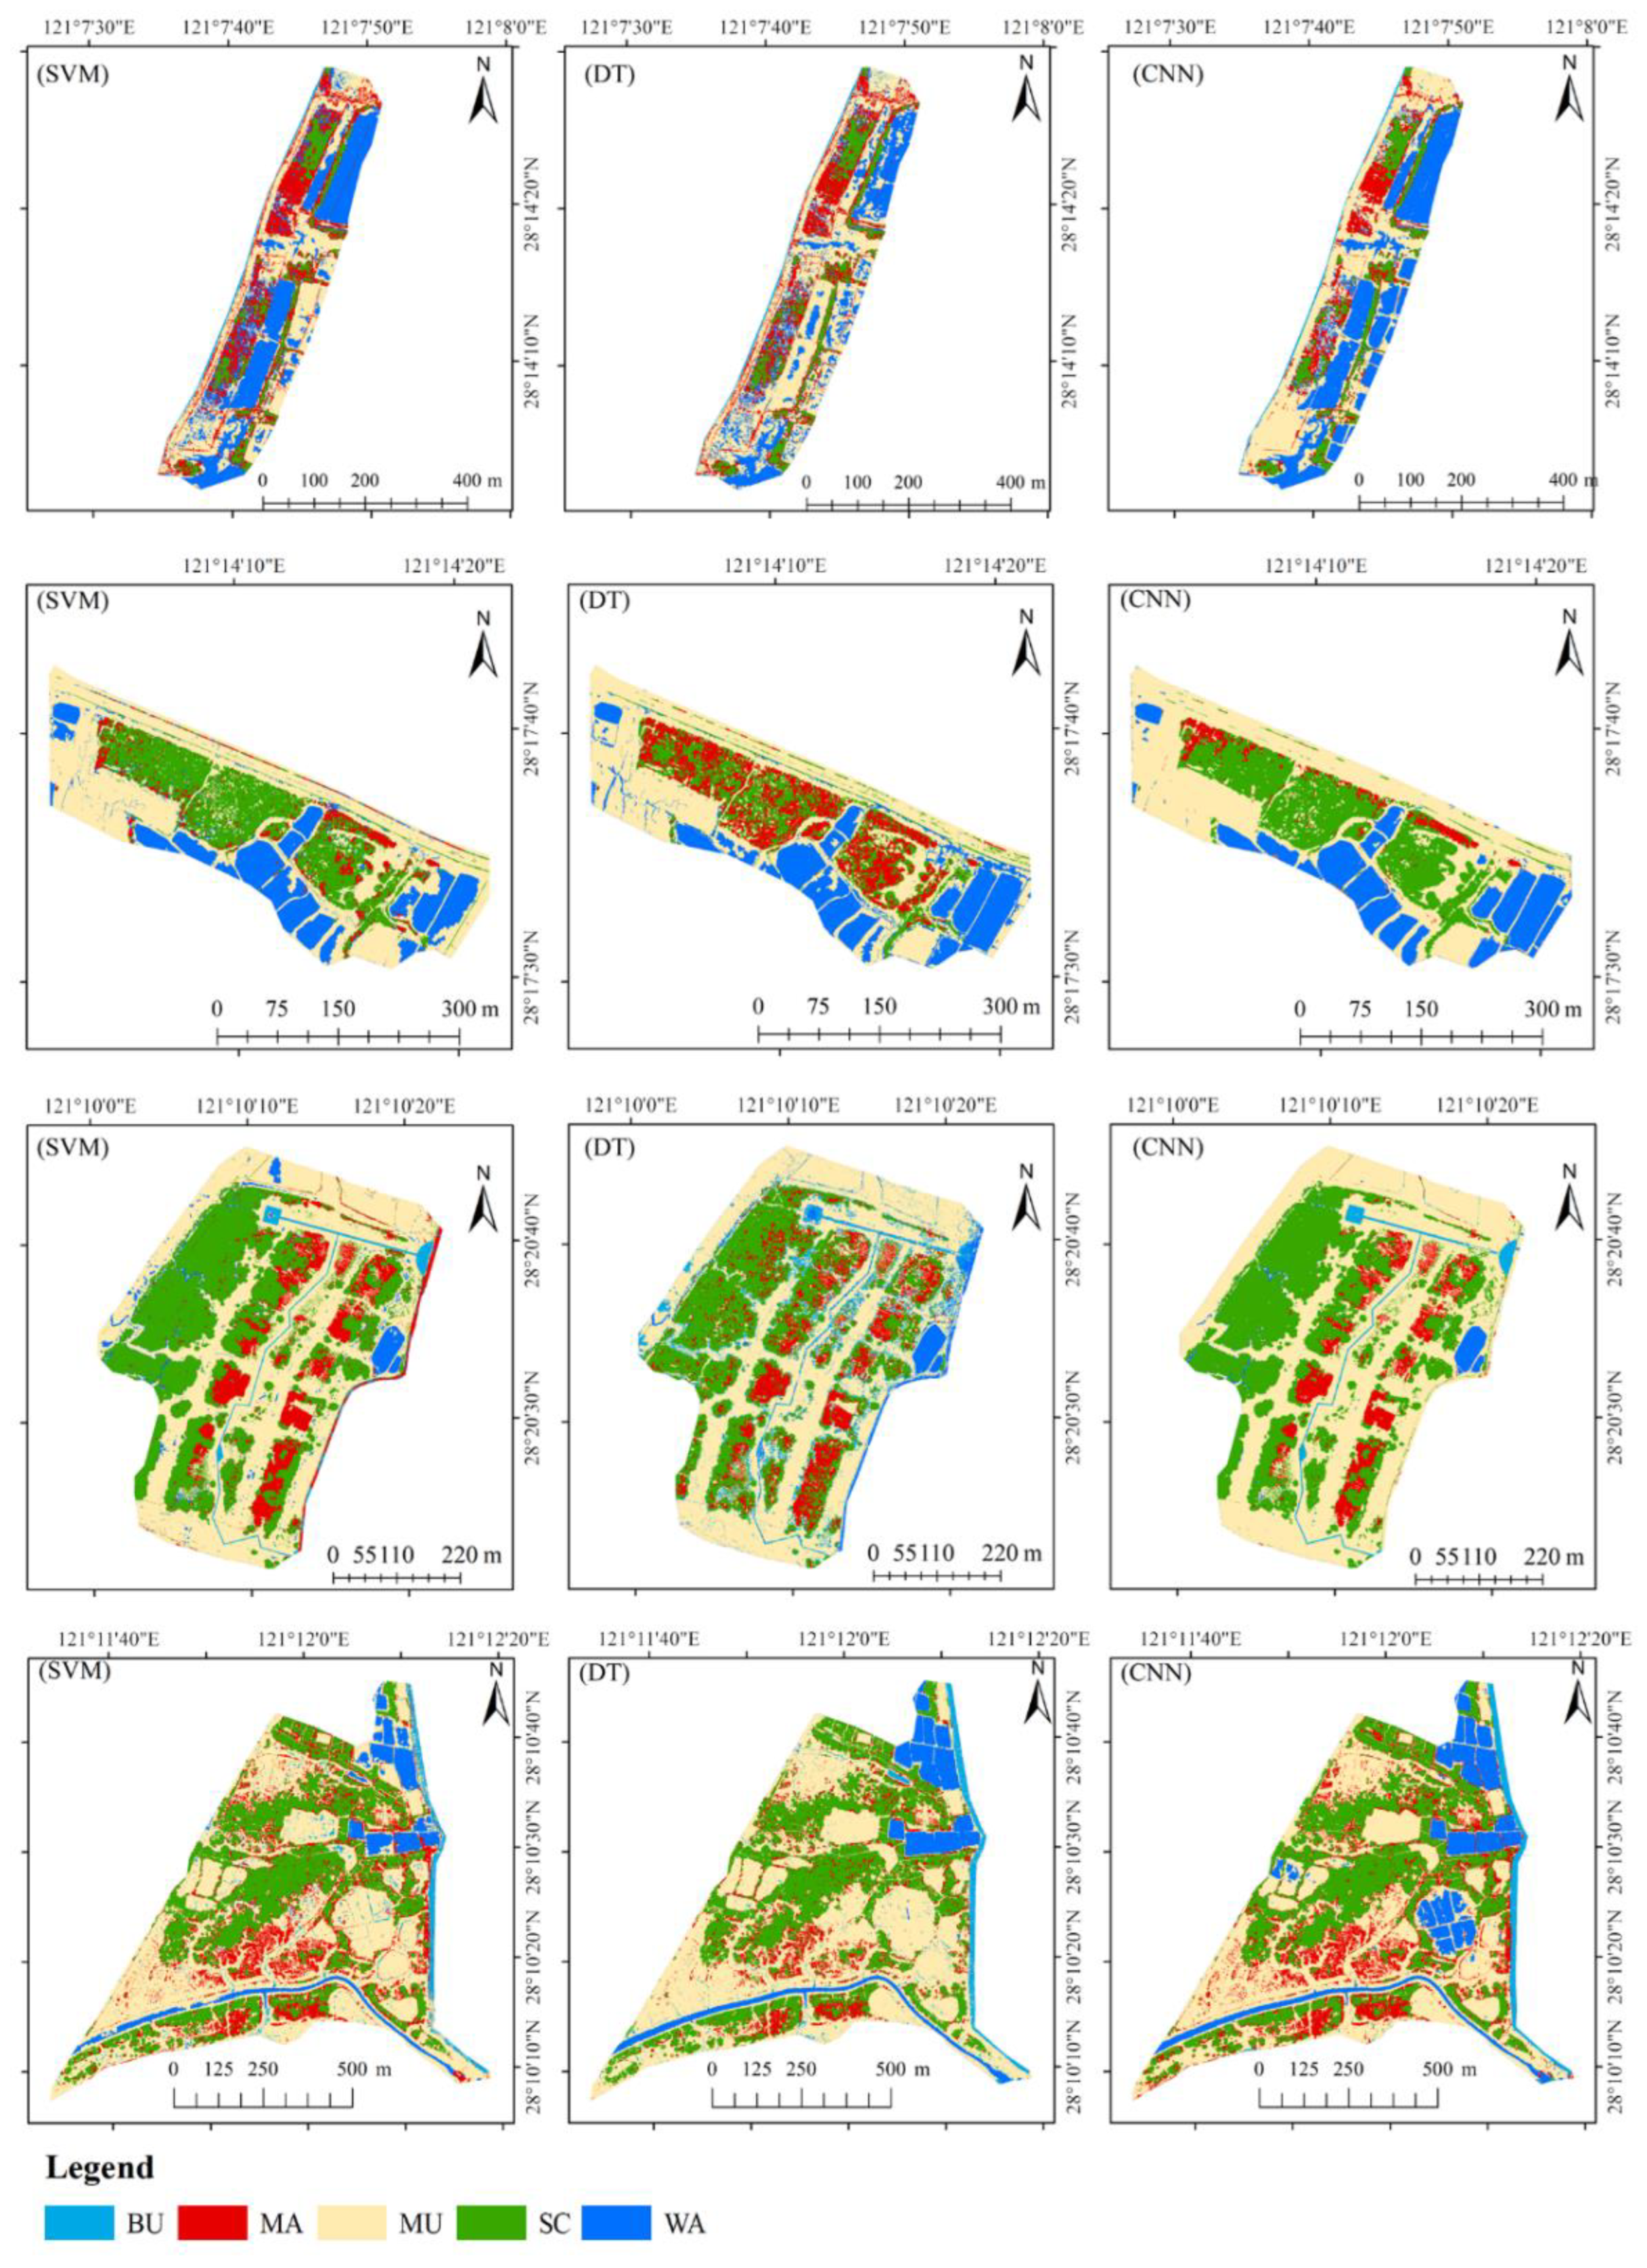
To test the best classification accuracy, we further design two classification experiments including Experiment A: only multi-spectral bands are used as input features and Experiment B: both multi-spectral bands and the identified 10 most important features. Due to the big UAV image size and huge work load for the entire study region, we only selected four mangrove distribution sites with intensive training and validation plots to test the effectiveness of these classification methods. The test regions include Ximen Island (Within Wenling), Wugen Town (Wenling), Taipingtang (Yuhuan) and Yanpuwan (Cangnan) (
Figure 1).
2.8. Accuracy Assessment Metrics
To assess the precision of classification methods, confusion matrices were constructed based on training sample plots. The Overall Accuracy (OA), Kappa Coefficient, User’s Accuracy (UA), and Producer’s Accuracy (PA) were calculated based on the confusion matrices and applied to evaluate the performance of the classified land cover types. The calculation equations for OA, UA, PA and Kappa were shown below:
where,
is the number of samples correctly classified as class
i,
k is the total number of classes,
N is the total number of samples, and
Pi is the number of true samples of class
i;
Cᵢ is the number of predicted samples of class
i;
Cii denotes the number of samples correctly assigned to class
i in the confusion matrix (the diagonal element for class
i);
Cji is the number of samples for predicted class
i;
Cij is the number of samples for true class
i.
2.9. Analysis Methods
The classified mangrove and smooth cordgrass were isolated from the land cover maps. Due to the scattered distribution patterns land large size of the UAV images and classified results, we divided 11 districts and three cities (Taizhou, Wenzhou and Zhoushan;
Figure 1) for mapping and statistical analysis. The direct classified results were for canopy coverage of all land cover types (Canopy area) and then they were aggregated to 30m spatial resolution for calculating area of each land cover types. Due to the lower height of mangrove trees in Zhejiang Province, mangrove forest area was calculated as the area with canopy coverage equal to or greater than 30%[
33]. The survival rate of mangrove trees was calculated as the ratio of existing mangrove area to the total planting area. The planting area and boundary of mangroves was obtained from[
33]. The invasion rate of smooth cordgrass was calculated as the ratio of existing smooth cordgrass area to the planting area of mangrove trees. The area of mangrove from previous studies was calculated after clipping the Zhejiang Province out of the national or global datasets of mangrove distribution.
Author Contributions
Conceptualization, G.C.; methodology, Q.L.; software, Q.L.; validation, Q.L. and S.Y.; formal analysis, Q.L., P.Z. and J.Y.; investigation, Q.L., P.Z. and Y.S.; resources, X.X.; data curation, Q.L., P.Z., S.Y., Y.S. and J.Y.; writing—original draft preparation, Q.L.; writing—review and editing, Y.S., J.M. and G.C.; visualization, Q.L., P.Z., J.Y. and G.C.; supervision, G.C.; project administration, S.Y. and Y.S.; funding acquisition, J.M. and G.C. All authors have read and agreed to the published version of the manuscript.
Figure 1.
The study area with mangrove forest distribution (Blue city names), 11 field survey sites (Red points), UAV flight areas (Green polygons), test regions (Pink polygons and names) and the divisions of 11 analysis areas (Black names).
Figure 1.
The study area with mangrove forest distribution (Blue city names), 11 field survey sites (Red points), UAV flight areas (Green polygons), test regions (Pink polygons and names) and the divisions of 11 analysis areas (Black names).
Figure 2.
The work flow of this study.
Figure 2.
The work flow of this study.
Figure 3.
The UAV images for different invasive rates of mangrove forests (a: 100% mangrove trees; b: 60% mangrove trees; c: 30% mangrove trees; d: 100% cordgrass).
Figure 3.
The UAV images for different invasive rates of mangrove forests (a: 100% mangrove trees; b: 60% mangrove trees; c: 30% mangrove trees; d: 100% cordgrass).
Figure 4.
The selected top 10 features and their relative importance.
Figure 4.
The selected top 10 features and their relative importance.
Figure 5.
Local representation of the image segmentation for different scale factors, shape indices and compactness parameters. (A) image segmentation results with different scales (shape index = 0.1, compactness = 0.5), (B) image segmentation results with different shape indices (scale = 70, compactness = 0.5), (C) image segmentation results with different compactness values (scale = 70, shape index = 0.3).
Figure 6.
Classified land cover types based on different classification methods in conjunction with feature selection in four test regions. Note: Built-up land (BU), Mangroves (MA), Mudflats (MU), Smooth cordgrass (SC) and Water body (WA).
Figure 6.
Classified land cover types based on different classification methods in conjunction with feature selection in four test regions. Note: Built-up land (BU), Mangroves (MA), Mudflats (MU), Smooth cordgrass (SC) and Water body (WA).
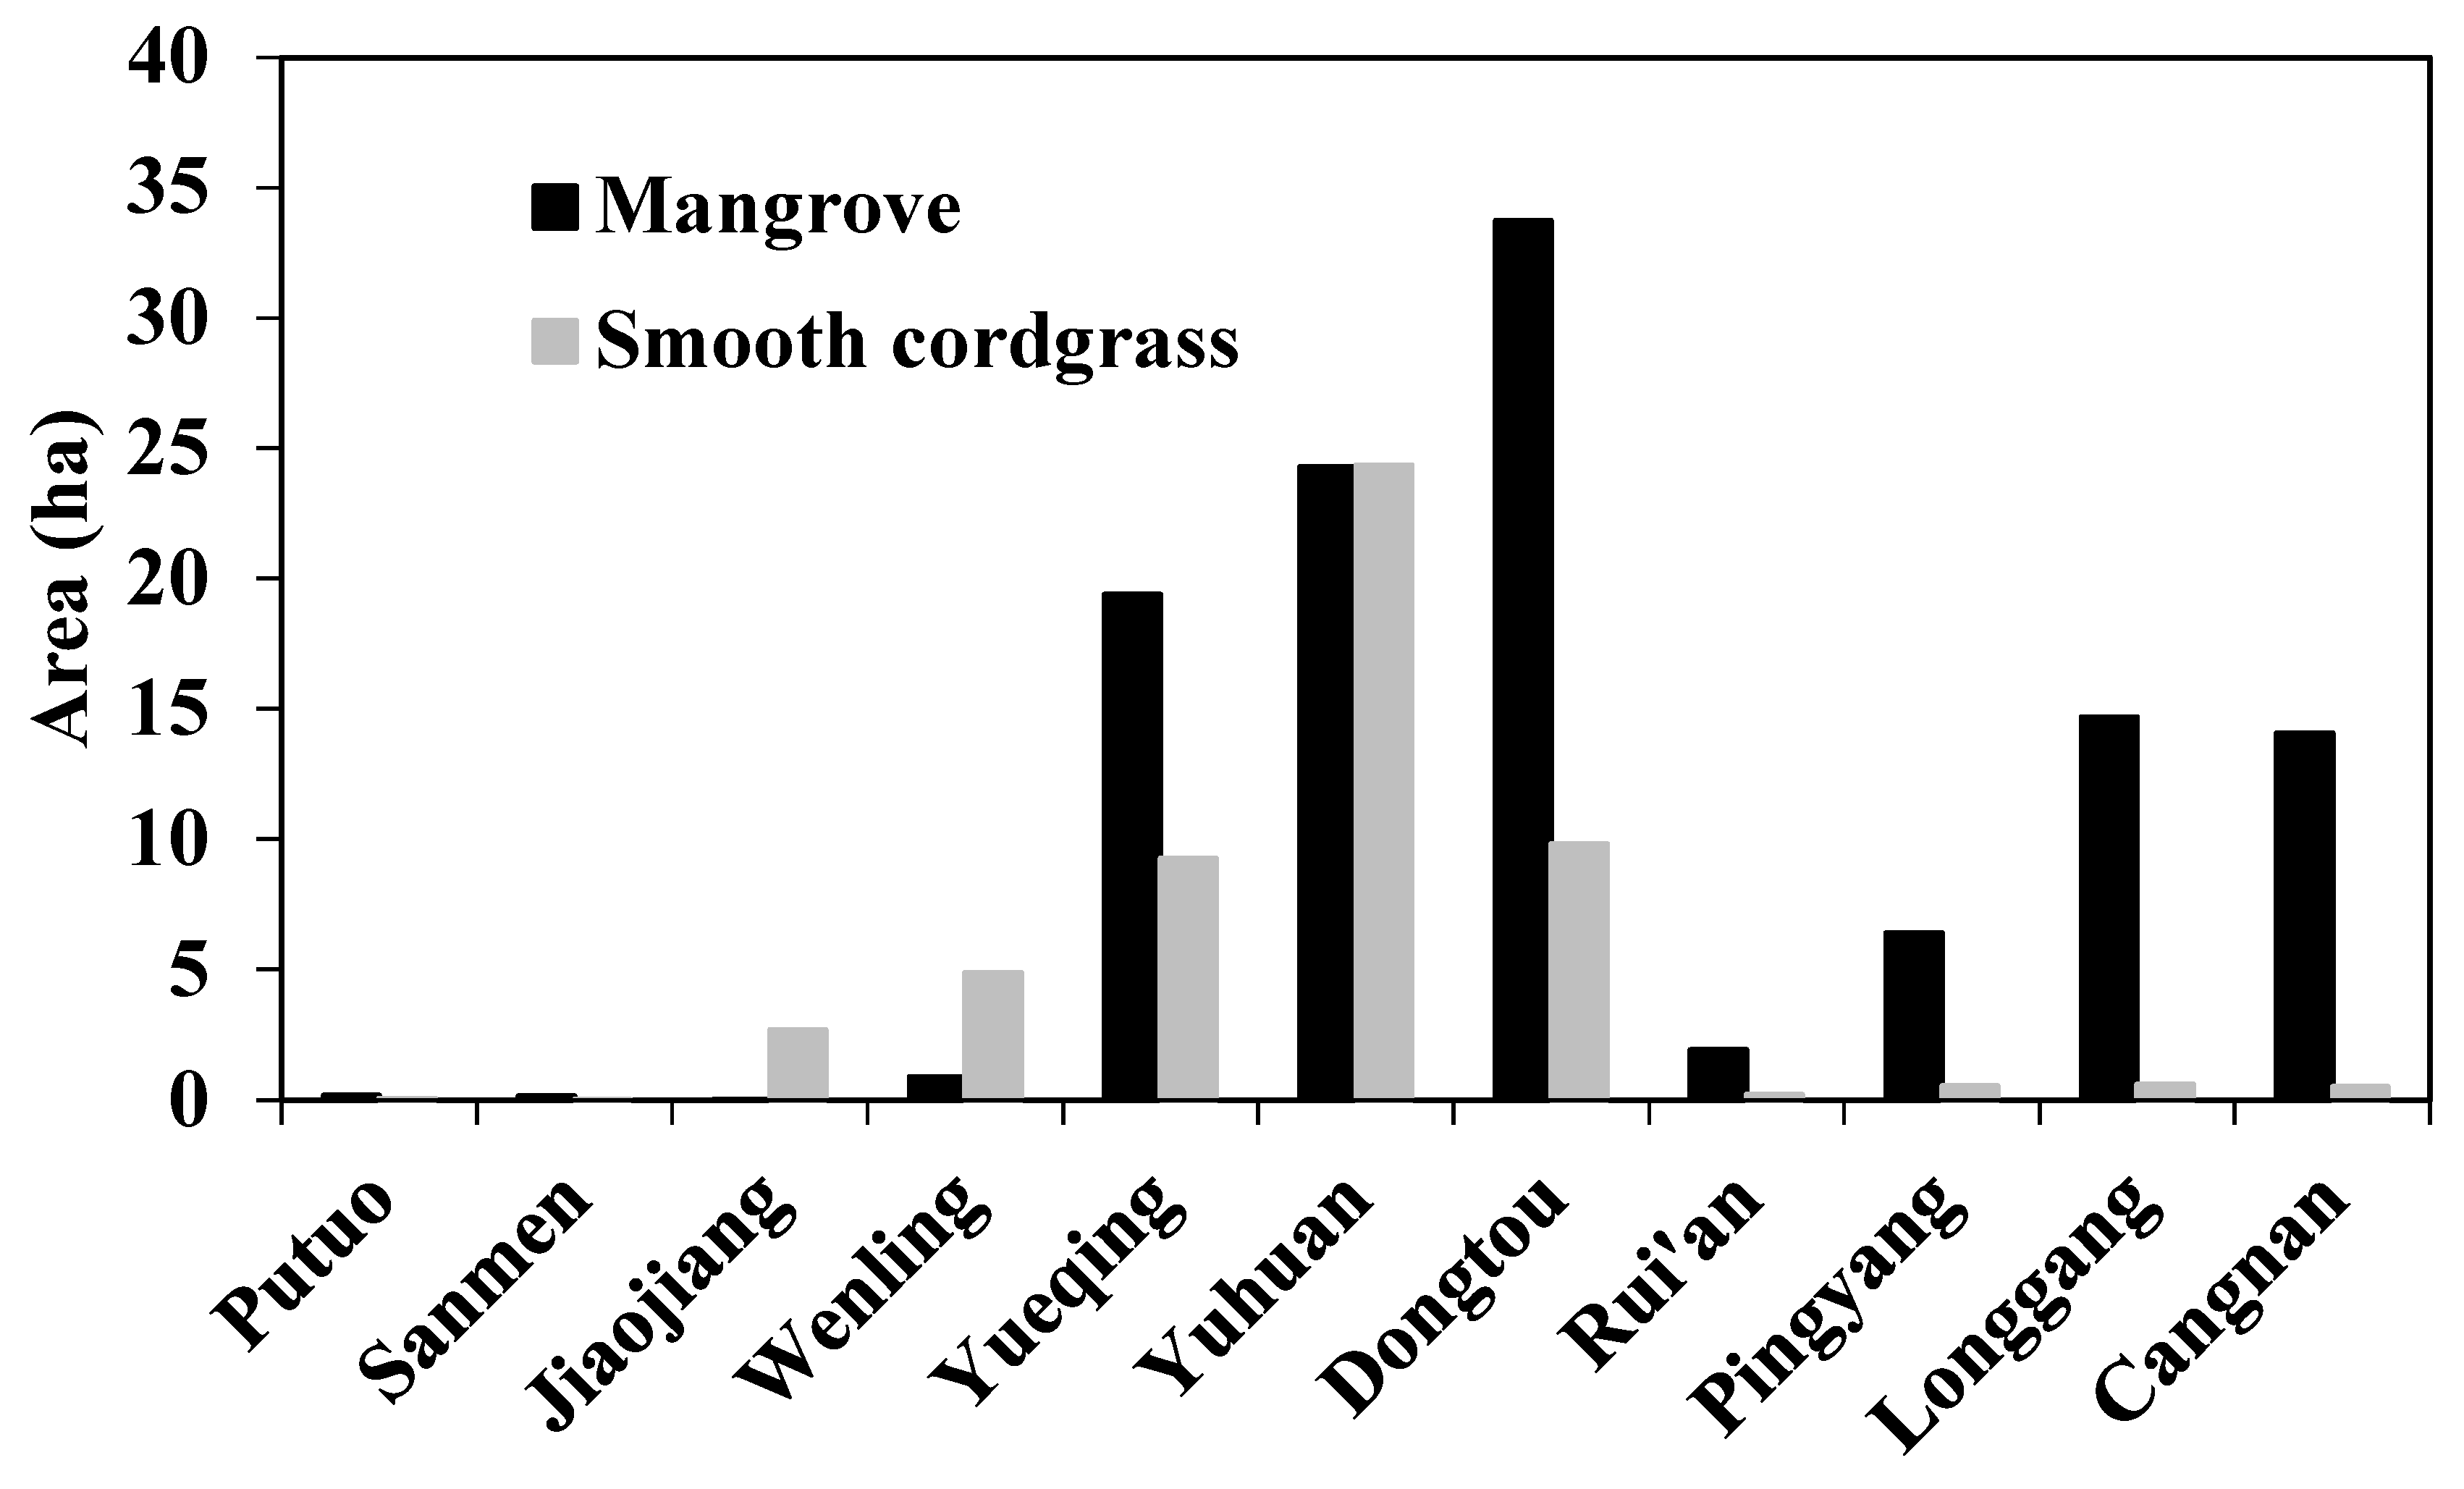
Figure 7.
The area of smooth cordgrass and mangroves in the 11 districts.
Figure 7.
The area of smooth cordgrass and mangroves in the 11 districts.
Figure 8.
The canopy distribution (%) of mangroves aggregated at 30m spatial resolution in Zhejiang Province.
Figure 8.
The canopy distribution (%) of mangroves aggregated at 30m spatial resolution in Zhejiang Province.
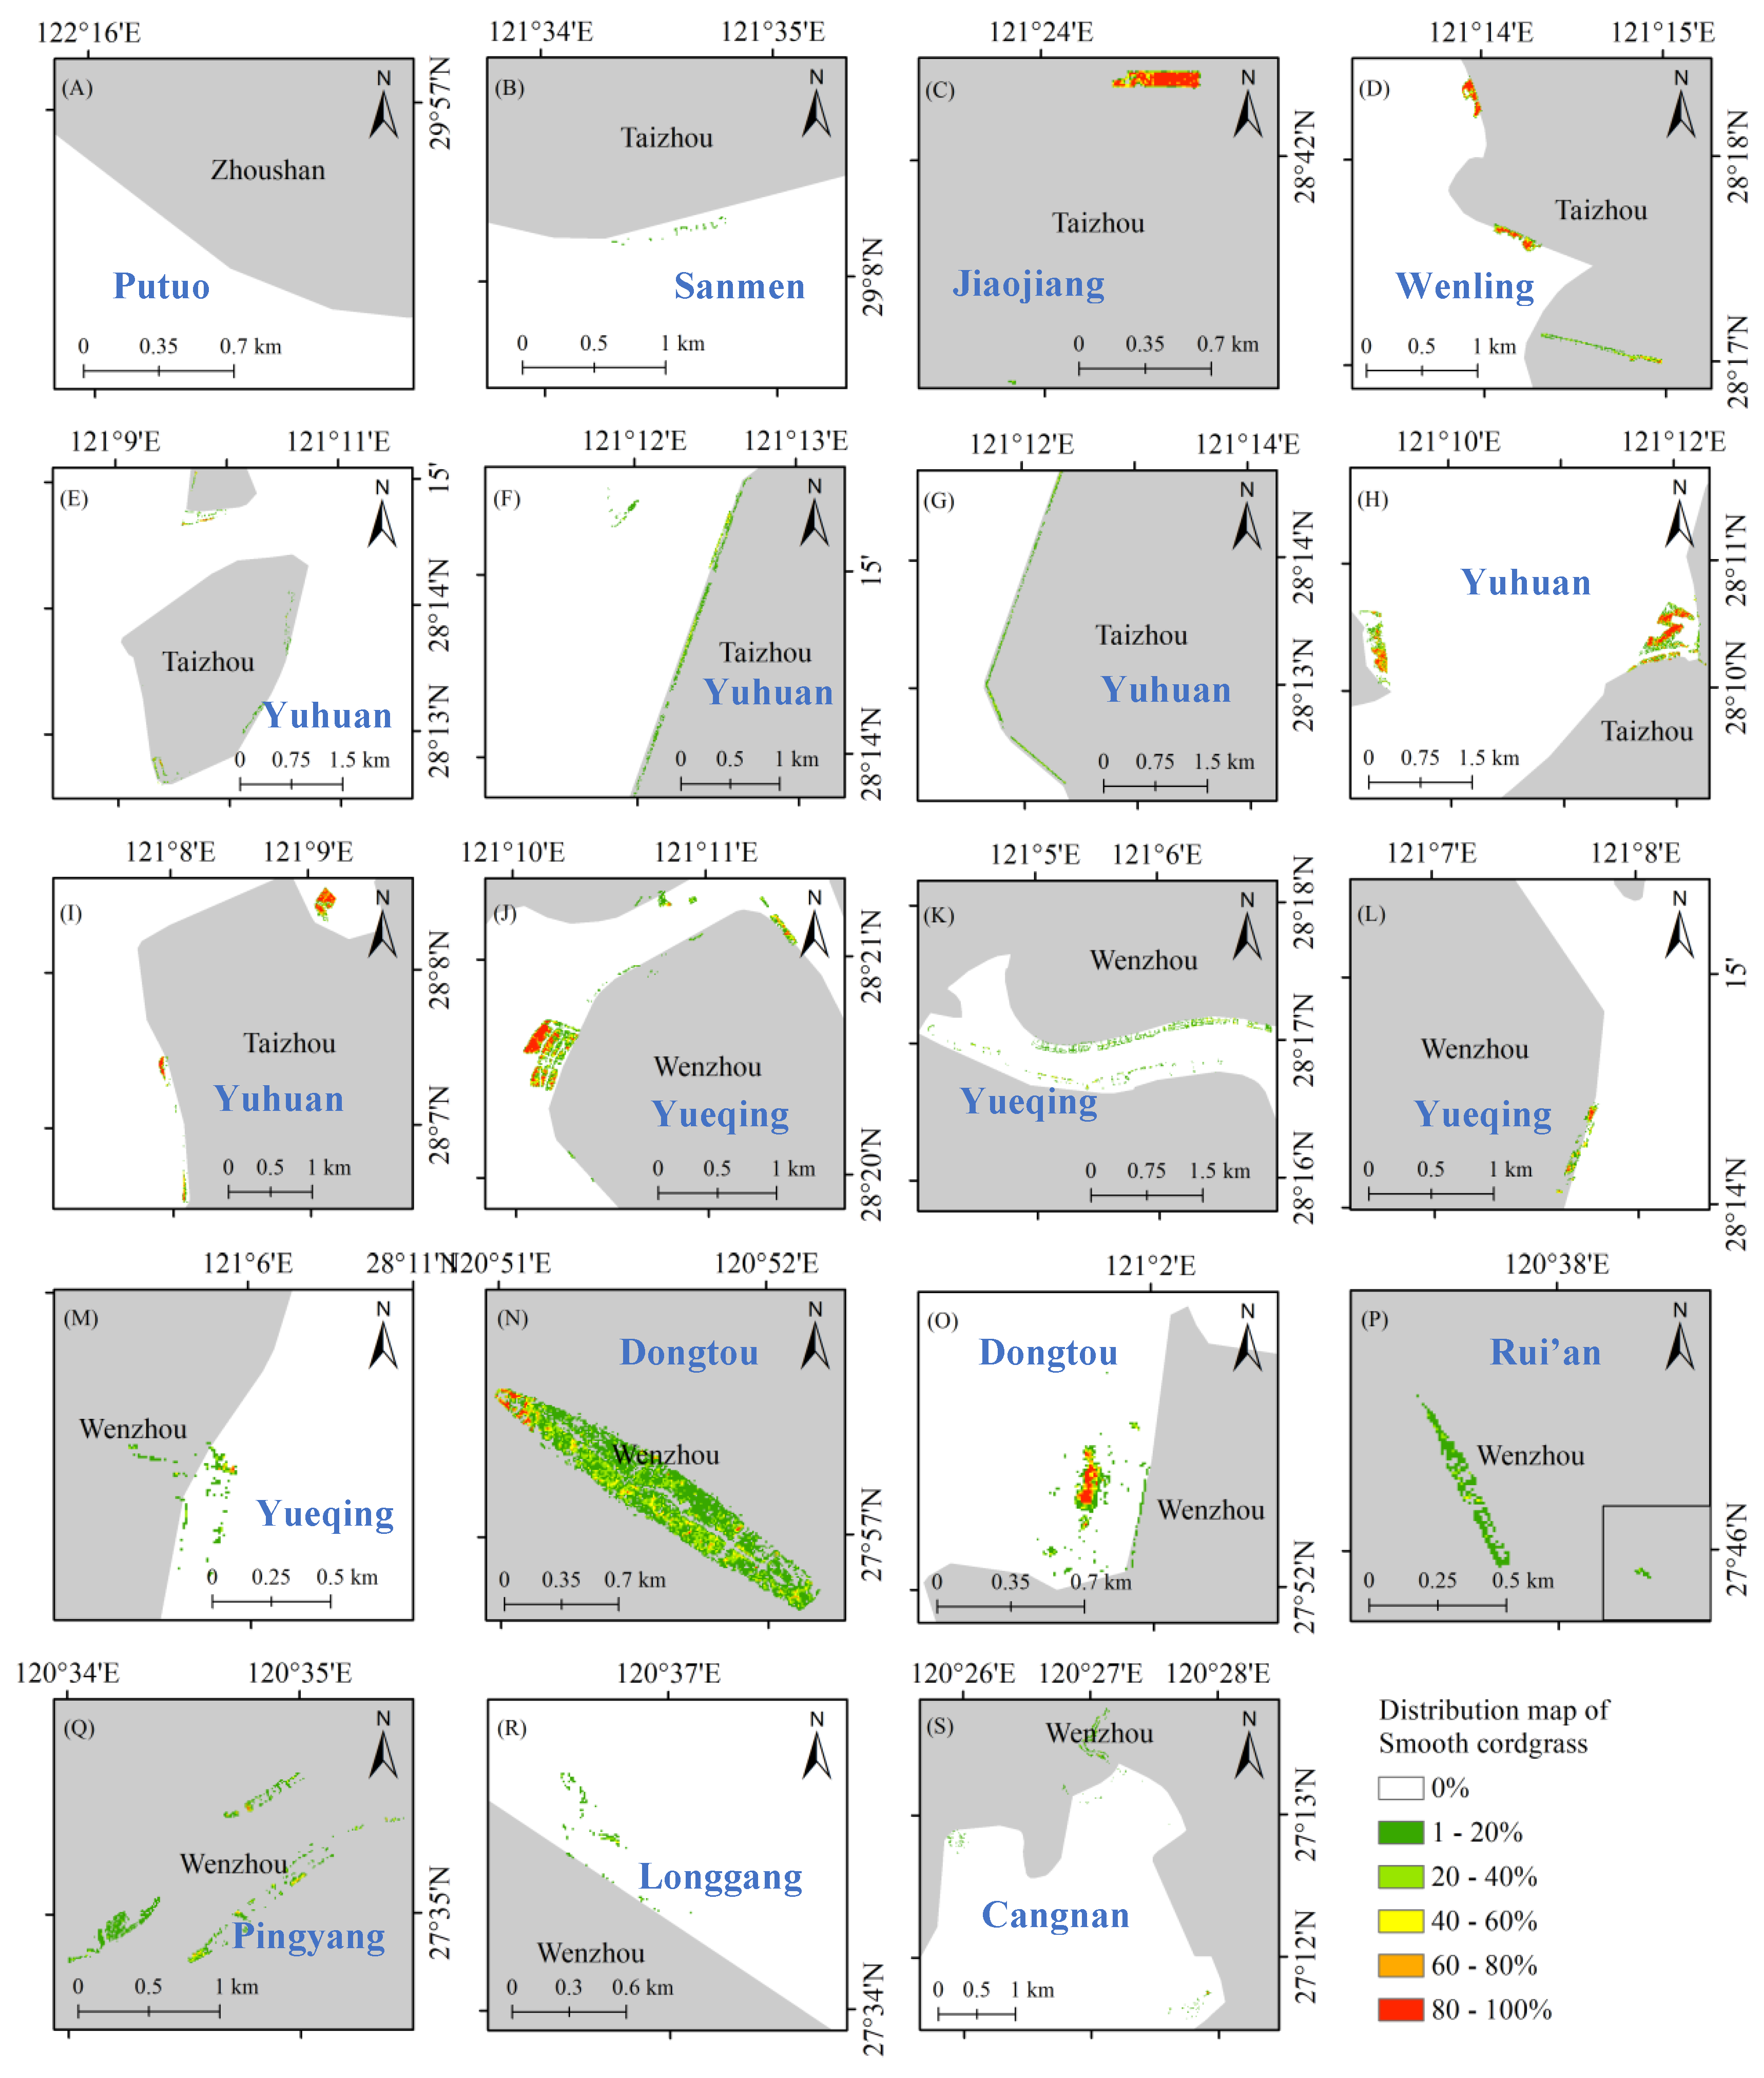
Figure 9.
The distribution (%) of smooth cordgrass aggregated at 30m spatial resolution in Zhejiang Province.
Figure 9.
The distribution (%) of smooth cordgrass aggregated at 30m spatial resolution in Zhejiang Province.
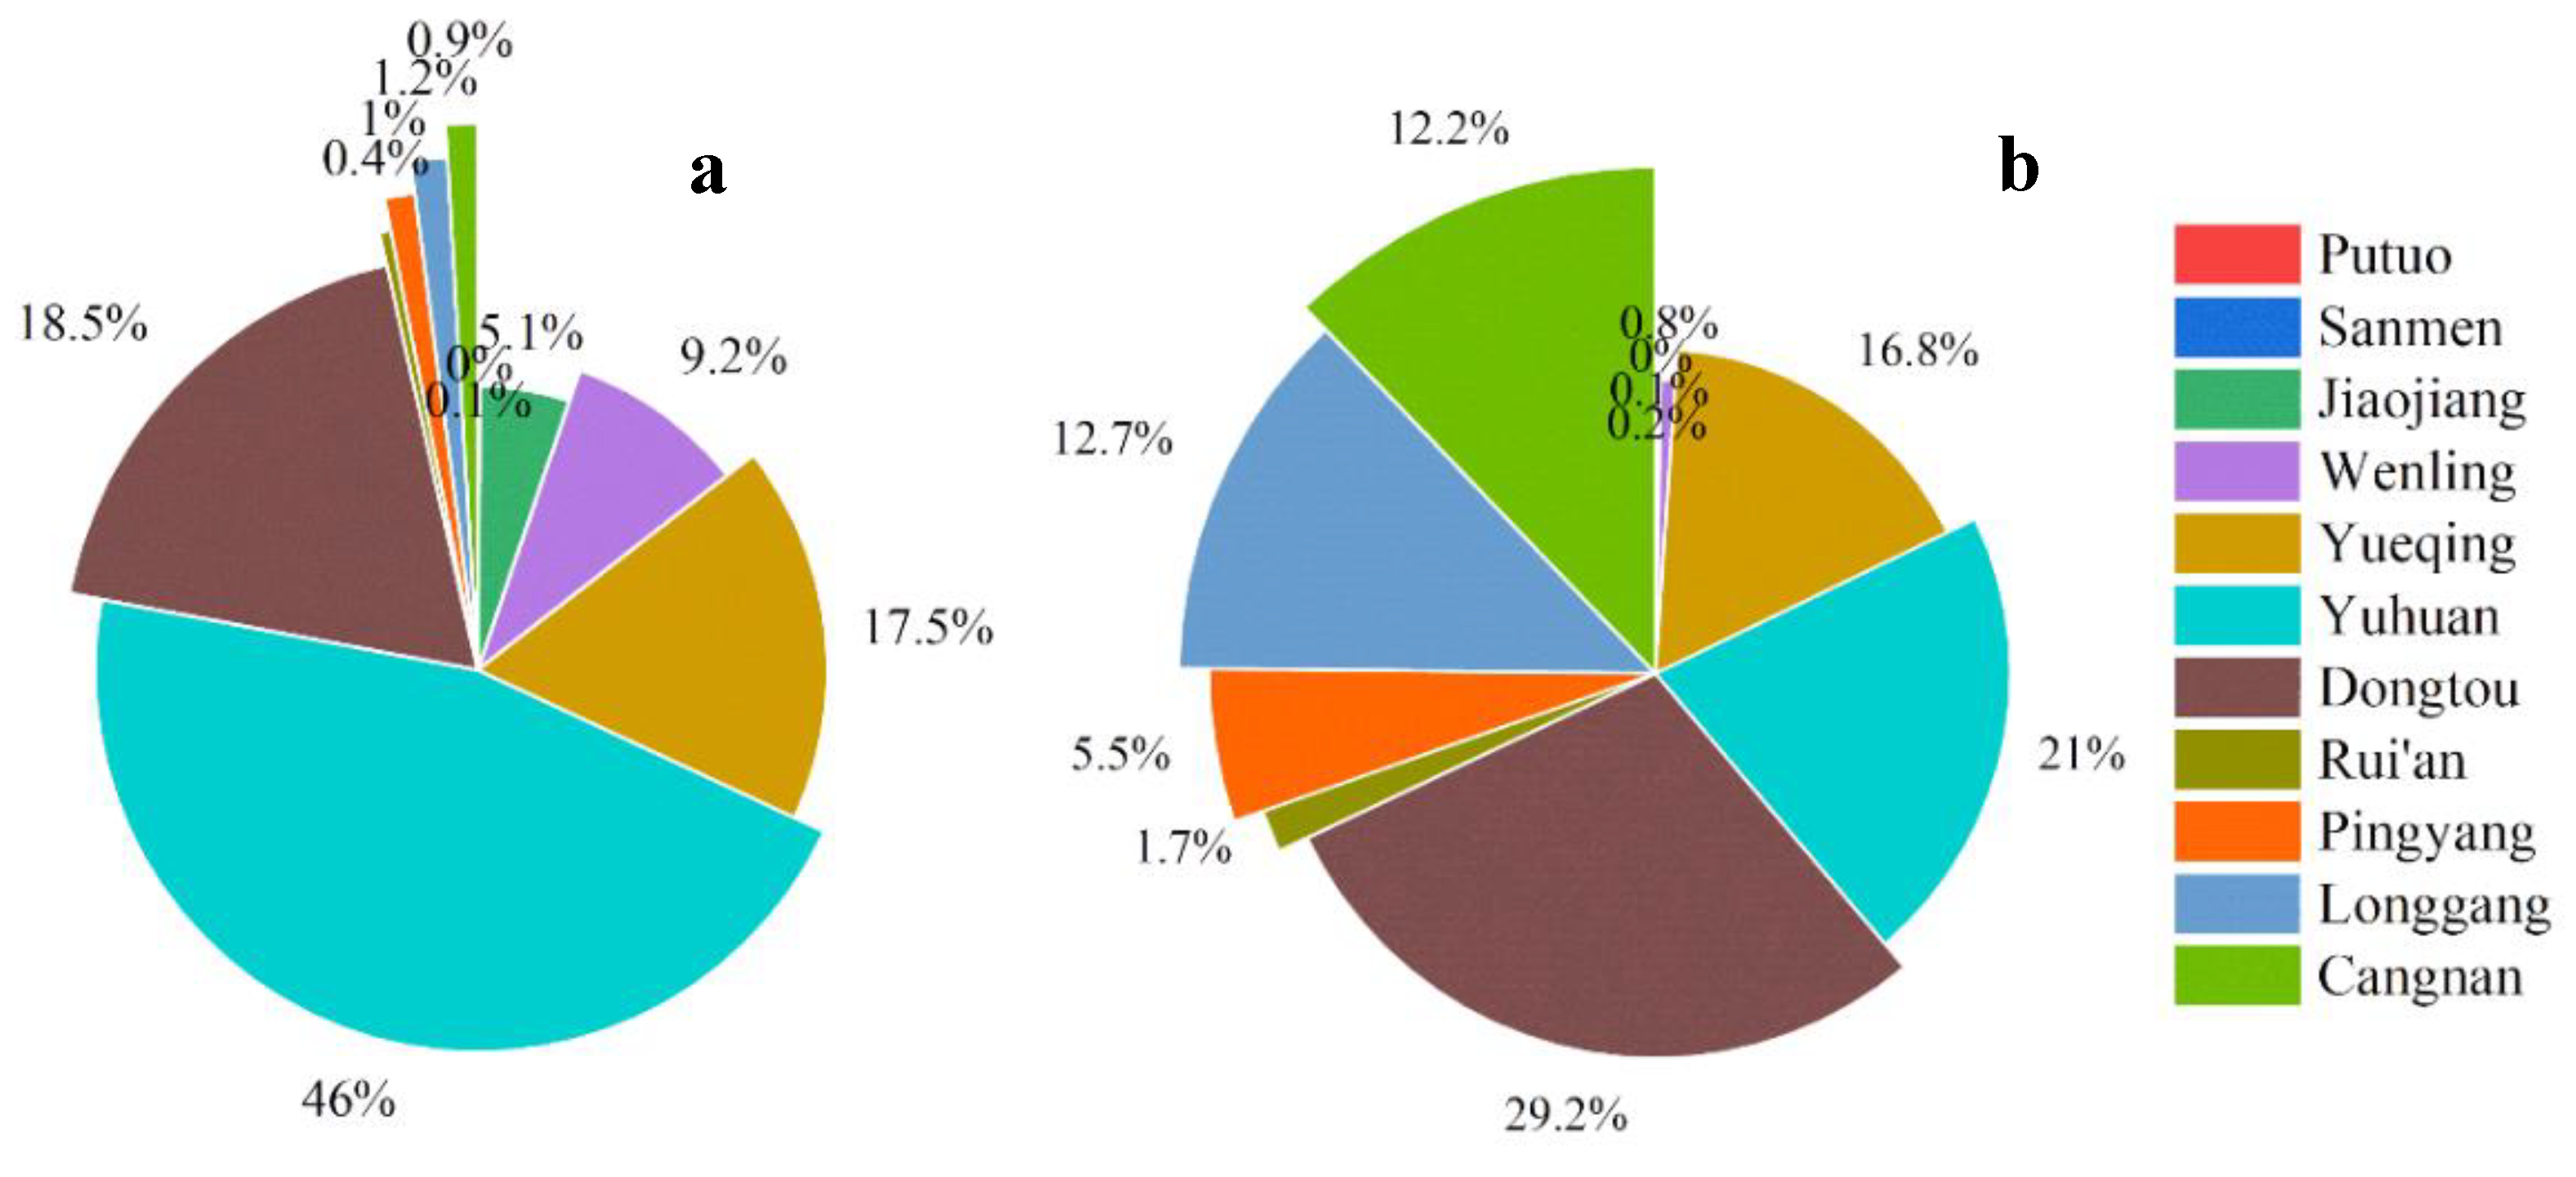
Figure 10.
Percentage of smooth cordgrass (A) and mangroves (B) in each district.
Figure 10.
Percentage of smooth cordgrass (A) and mangroves (B) in each district.
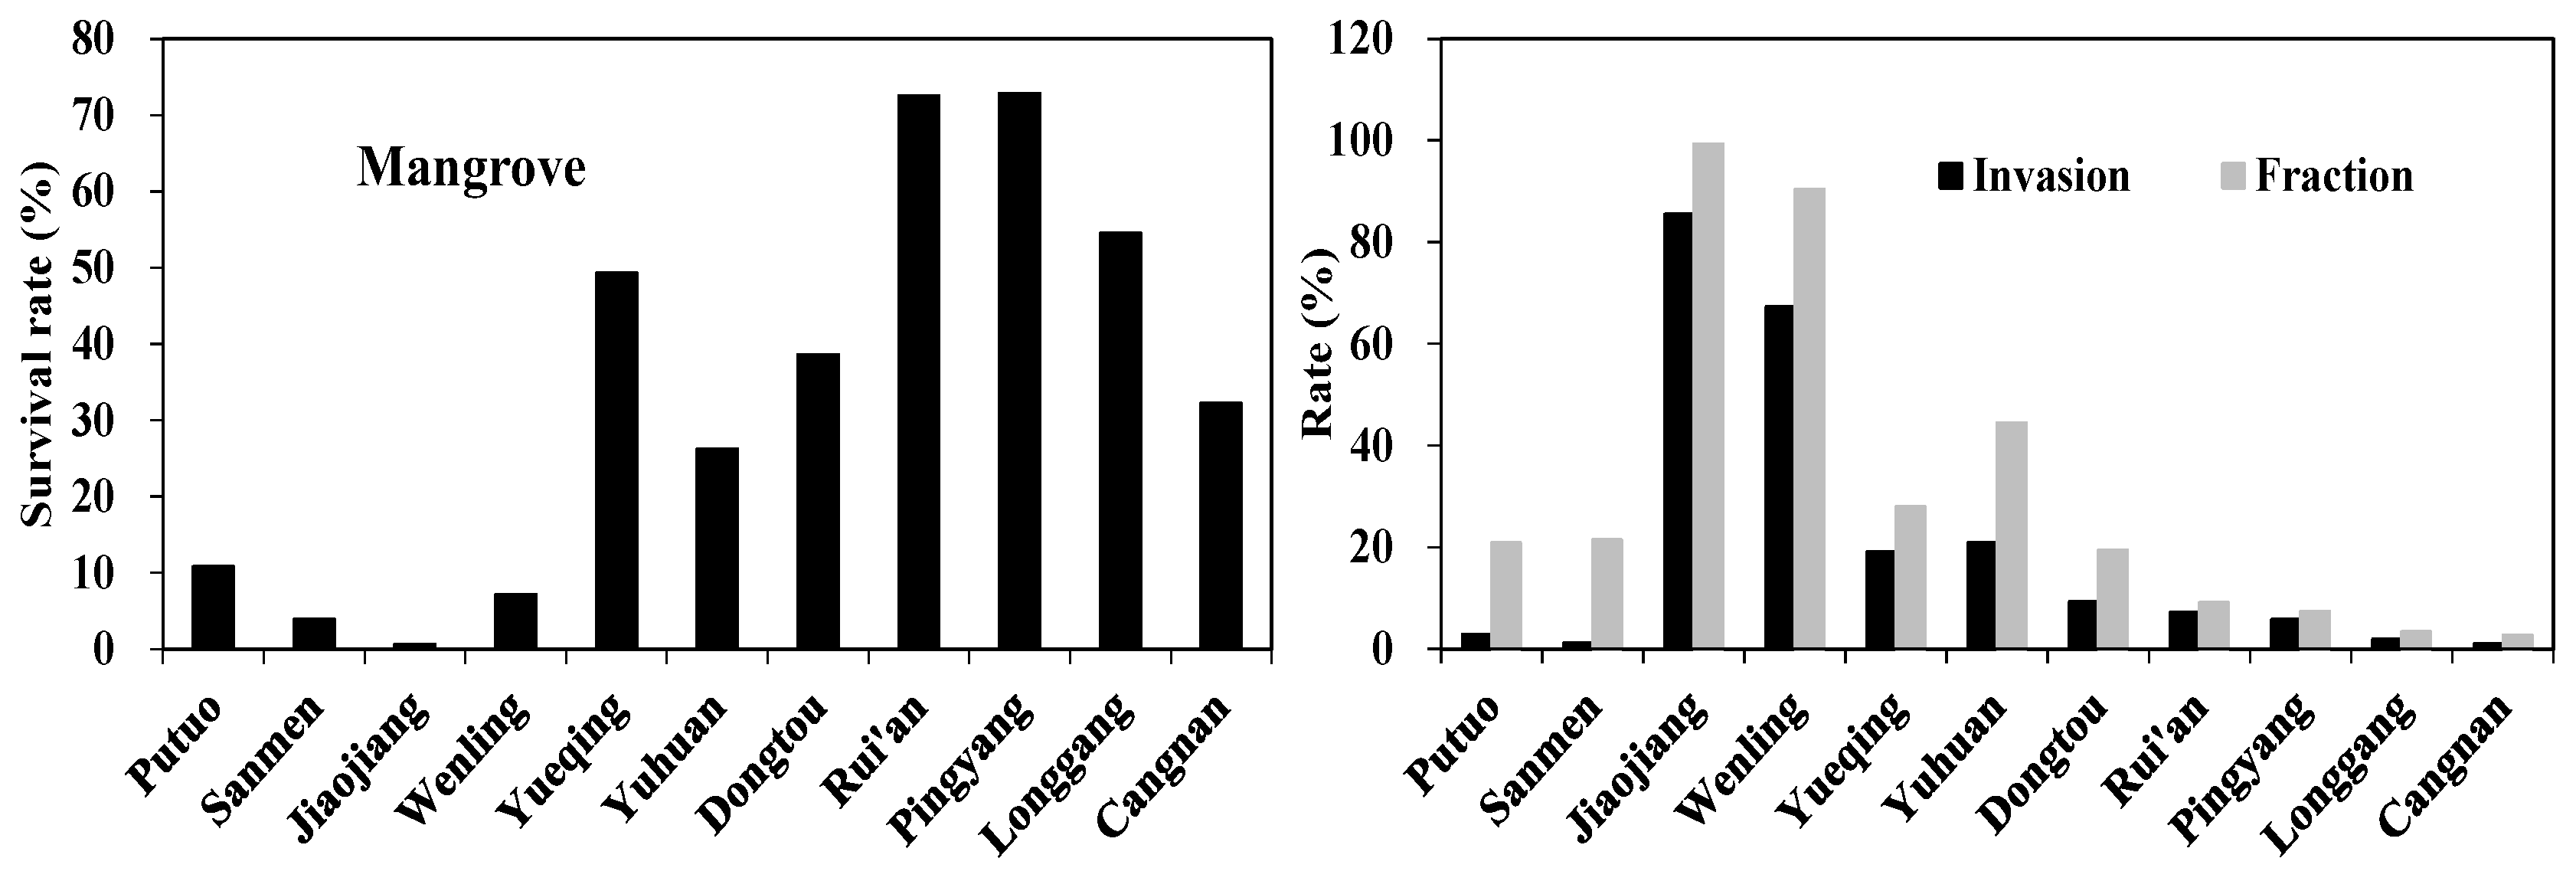
Figure 11.
The survival rates of mangrove trees relative to the planting area and the invasion rates and relative fraction of smooth cordgrass. Note: the relative fraction is calculated as the ratio of smooth cordgrass to the total area of smooth cordgrass and mangrove trees.
Figure 11.
The survival rates of mangrove trees relative to the planting area and the invasion rates and relative fraction of smooth cordgrass. Note: the relative fraction is calculated as the ratio of smooth cordgrass to the total area of smooth cordgrass and mangrove trees.
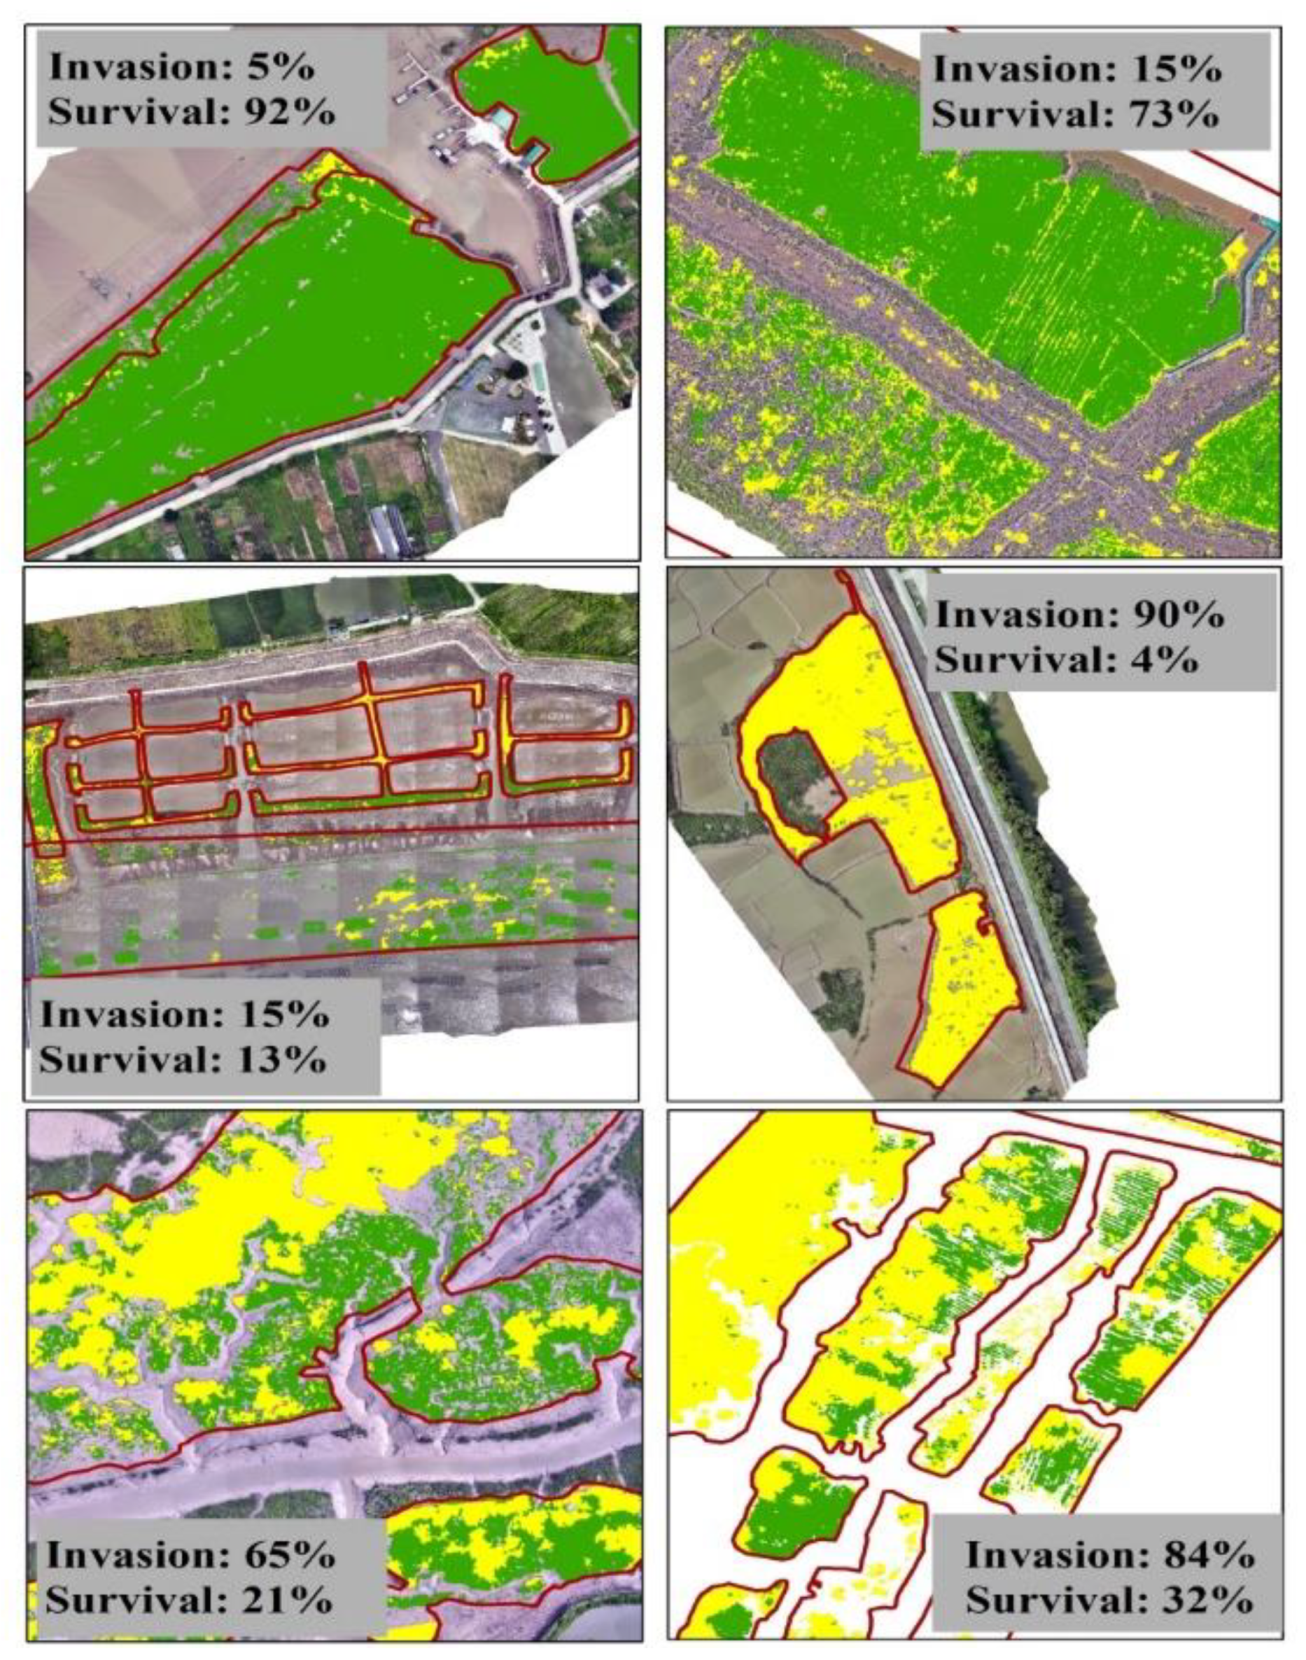
Figure 12.
The illustration of invasion rate of smooth cordgrass and survival rate of mangrove trees in six selected areas. Note: The background map is the UAV RGB images. The map scale is at 1:4,000.
Figure 12.
The illustration of invasion rate of smooth cordgrass and survival rate of mangrove trees in six selected areas. Note: The background map is the UAV RGB images. The map scale is at 1:4,000.
Table 4.
The comparison of our estimated mangrove forest area with previous studies for Zhejiang Province.
Table 4.
The comparison of our estimated mangrove forest area with previous studies for Zhejiang Province.
| Platforms |
Time |
Area (ha) |
Resolution |
References |
| ALOS SAR image |
2020 |
47 |
23.5m |
[3] |
| Landsat and Sentinel-1 |
2015 |
8.0 |
30m |
[36] |
| Landsat image |
2015 |
56 |
30m |
[5] |
| Landsat image |
2015 |
6.12 |
30m |
[35] |
| Gaofen-1 and Ziyuan-3 |
2018 |
48.68 |
2m |
[20] |
| Sentinel-1 & 2 |
2019 |
39 |
20m |
[21] |
| Statistical and inventory |
2020 |
386.77 |
/ |
[33] |
| UAV multispectral image |
2023 |
140.83 |
4 & 6 cm |
This study |