
Submitted:
06 December 2025
Posted:
09 December 2025
Read the latest preprint version here
Abstract
Global progress towards the 2030 Sustainable Development Goals (SDGs) remains critically off-track, with current trends suggesting that only 17% of targets will be met by the 2030 deadline. This study investigates whether observed divergence reflects temporary setbacks or persistent structural regimes characterised by distinct configurations. Using panel data from over 160 countries (2019–2024), we employ annual latent class analysis to identify hidden structures in SDG performance across 15 goals, introducing intertemporal volatility as a dimension of development dynamics. We complement this with ordered logistic regression to examine structural determinants of regime membership, including governance quality, digital infrastructure, health investment, and macroeconomic indicators. Our analysis identifies three temporally stable development regimes —lagging, transitional, and leading — with fewer than 15% of countries transitioning between classes over the observation period. ANOVA results reveal that internet access and government effectiveness exhibit the most considerable between-regime differences. Ordered logit models indicate that governance quality and digital connectivity are the primary predictors of regime membership, with marginal effects of 18–19 percentage points in regime probability. In contrast, short-term GDP growth exerts a negligible influence. These findings challenge linear convergence assumptions and suggest that achieving the SDGs requires addressing deep structural constraints, particularly digital divides and institutional quality, rather than relying solely on incremental policy adjustments or economic growth.
Keywords:
Sustainable Development Goal
; latent class analysis
; development regimes
; digital divide
; governance quality
; institutional quality
; path dependence
; structural determinants
; development economics
1. Introduction
The Sustainable Development Goals (SDGs), adopted by all UN Member States in 2015, aim to eradicate poverty, reduce inequality, combat climate change, and strengthen institutions by 2030 (Fukuda-Parr & McNeill, 2019). Despite this shared ambition, progress remains deeply uneven: some countries advance steadily, while others stagnate or regress—especially on inequality (Goal 10), climate action (Goal 13), and peace and justice (Goal 16) (Sachs et al., 2023). This divergence challenges the 2030 Agenda’s assumption of universal convergence through policy effort and international cooperation.
Standard explanations—rooted in income levels, geography, or governance quality—fail to fully account for observed patterns (Nielsen, 2011, 2013; Schmidt-Traub et al., 2017). Institutional economics offers a compelling alternative, arguing that inclusive institutions—those that secure property rights, enforce contracts, and constrain elite power—generate broad-based incentives for investment, innovation, and human capital accumulation, while extractive institutions concentrate rents and stifle growth (Acemoglu & Robinson, 2012; North, 1990). These institutions are not mere background conditions but causal drivers of longrun prosperity, shaping how resources are allocated, risks are managed, and opportunities are distributed (Rodrik et al., 2004). Crucially, institutional quality varies not just in degree but in kind: some configurations enable adaptive, resilient development, while others trap societies in low-level equilibria (Greif, 2006; Hall & Soskice, 2001).
This perspective builds on path dependence theories, which posit that historical events and initial institutional choices create self-reinforcing mechanisms—through increasing returns, coordination effects, and adaptive expectations—that lock societies into particular developmental pathways (Arthur, 1994; David, 1985; North, 1990; Pierson, 2000). Once established, these paths become costly to exit, not because they are optimal, but because alternative configurations require coordinated change across multiple interdependent domains (Page, 2006) . For example, extractive colonial institutions may perpetuate weak property rights and elite capture, while inclusive settlements foster broad-based investment and innovation (Acemoglu & Robinson, 2012). This framework contrasts sharply with neoclassical convergence models, which assume diminishing returns and factor mobility will equalise outcomes over time (Solow, 1956). Instead, institutional economics and path dependence together imply multiple equilibria: countries with similar endowments can settle into divergent regimes, with transitions requiring critical junctures—major shocks or deliberate reforms—that disrupt entrenched feedbacks (Capoccia & Kelemen, 2007).
This view raises a controversial question: are SDG gaps temporary and fixable through targeted interventions, or do they reflect durable structural divides requiring transformative change? Recent studies using data-driven clustering reveal hidden groupings in development indicators (Cai et al., 2023; Polyakov et al., 2021), but most remain cross-sectional and ignore temporal stability or intertemporal volatility—year-to-year fluctuations that may signal institutional resilience or fragility. Nonlinear dynamics and threshold effects further complicate progress (Liashenko et al., 2025), suggesting that minor improvements in one domain (e.g., health) may yield limited gains without simultaneous advances in others (e.g., governance, digital access).
This study tests whether global SDG performance reflects latent development regimes shaped by institutional and structural persistence. Using panel data from over 160 countries (2019–2024), we apply annual latent class analysis (LCA) to 15 SDG scores, introduce volatility as a core dimension of regime dynamics, and anchor regimes in structural determinants via ordered logistic regression.
We identify three temporally stable regimes—lagging, transitional, and leading—with minimal cross-regime mobility. Governance quality and digital infrastructure emerge as primary predictors, while short-term economic growth plays no significant role. These findings imply that achieving the SDGs requires structural transformation rather than incremental adjustments, with important implications for development finance and policy design.
This study seeks to explore whether global patterns of Sustainable Development Goal (SDG) performance reflect structurally distinct development regimes rather than merely variations in resource availability or policy effort. Specifically, we ask: Do latent development regimes exist within the global SDG architecture? Are these regimes temporally stable, and what structural factors determine countries’ positions within them? Building on emerging evidence of non-linear dynamics and institutional path dependence, we hypothesise that (1) countries form a finite number of latent development regimes that are not reducible to standard classifications such as income group or geographical region; (2) these regimes exhibit considerable temporal persistence with limited mobility over time; (3) volatility in SDG trajectories is systematically patterned and not fully accounted for by conventional development metrics; and (4) structural variables—such as governance quality, digital infrastructure, and public health investment—are significant predictors of regime membership. Our analysis further posits that transitions between regimes are not linear or incremental but instead require crossing multiple structural thresholds simultaneously. By addressing these hypotheses, the paper contributes to a deeper understanding of the architecture of sustainable development and its underlying structural constraints.
2. Methodology
2.1. Data Sources and Sample Construction
This study employs SDG performance data from the Sustainable Development Report (SDR) database, compiled annually by the UN Sustainable Development Solutions Network (SDSN) in collaboration with the Bertelsmann Stiftung (Sachs et al., 2024). The SDR provides country-level scores for each of the 17 SDGs, normalised on a 0–100 scale, where higher values indicate better performance. These scores are constructed from multiple underlying indicators reflecting outcomes, policy efforts, and institutional capacity across diverse development dimensions.
Our analysis covers the period 2019–2024, yielding an unbalanced panel of over 160 countries. This time frame captures recent SDG dynamics whilst avoiding earlier periods with substantially higher data missingness. We conduct annual cross-sectional latent class analyses for each year separately, then reconstruct longitudinal trajectories by tracking countries' class assignments over time. This approach balances temporal flexibility with computational tractability, allowing regime structures to evolve whilst maintaining comparability across years.
To ensure the reliability of latent class estimation, we systematically audited missingness patterns across all SDG indicators and years. Following established best practices in latent variable modelling (Enders, 2010; Ghosh, 2010), we excluded indicators with more than 10% annual missingness. Specifically:
- Goal 10 (Reduced Inequalities) and Goal 14 (Life Below Water) were excluded due to persistent data gaps exceeding the threshold across all waves.
- Goal 1 (No Poverty) was retained despite an average annual missingness of 7.6%, given its centrality to the development agenda and policy relevance.
- All remaining 14 goals met data quality standards and were included in the analysis.
Structural covariates were obtained from multiple sources:
- Governance quality: Worldwide Governance Indicators (WGI) from the World Bank, including voice and accountability, government effectiveness, regulatory quality, rule of law, and control of corruption.
- Digital infrastructure: ICT Development Index from the International Telecommunication Union (ITU), measuring access to and use of information and communication technologies.
- Health investment: Current health expenditure as a percentage of GDP from the World Health Organisation (WHO) Global Health Expenditure Database.
- Additional controls: GDP per capita (constant 2015 USD) from World Bank World Development Indicators; population size and urbanisation rate from UN Population Division.
Table A2 in Appendix A provides detailed definitions, sources, and rationale for the variables.
2.2. Volatility Measurement
To capture intertemporal instability in SDG trajectories, we compute the coefficient of variation (CV) for each country-goal combination across available years:
where and denote the standard deviation and mean of SDG j scores for country i over the 2019–2024 period. The CV provides a scale-invariant measure of volatility, facilitating comparison across goals with different baseline performance levels.
We compute three volatility metrics:
- Goal-specific volatility: for each SDG
- Country-level average volatility: Mean CV across all goals for each country
- Goal-level average volatility: Mean CV across all countries for each SDG
These metrics enable the identification of countries with systematically unstable trajectories and goals exhibiting greater temporal variability.
2.3. Latent Class Analysis
Latent class analysis (LCA) is a model-based clustering technique that identifies unobserved subgroups within a population based on patterns of observed indicators (Dayton, 1998; Lazarsfeld & Henry, 1968; Mc Cutcheon, 1987). Unlike distance-based clustering methods such as k-means, LCA employs a probabilistic framework and provides formal model selection criteria for determining the optimal number of classes.
Model specification. For each year t, we model the joint distribution of SDGs scores for country i as a finite mixture:
where: K is the number of latent classes; is the probability of belonging to class k at time t (with ); (·) is the class-specific density function; represents class-specific parameters.
We assume conditional independence of SDG indicators within classes, such that:
Each SDG score is modelled as normally distributed within classes , with and as class-specific means and variances.
Parameters are estimated via maximum likelihood using the expectation-maximisation (EM) algorithm (Dempster et al., 1977). For each country, we obtain posterior probabilities of class membership:
Countries are assigned to the class with the highest posterior probability (i.e., the modal assignment).
The theoretical conditions under which latent classes correspond to structurally distinct development regimes rather than statistical artefacts are formalised in Proposition 1 (Appendix E). This proposition establishes four identifiability conditions—local independence, class separation, structural correspondence, and temporal stability—that guide both model specification and empirical validation.
We estimate models with K = 2, 3, 4, and 5 classes for each year and select the optimal number based on: Bayesian Information Criterion (BIC) - Lower values indicate better fit penalised for model complexity (Schwarz, 1978); Akaike Information Criterion (AIC): An Alternative information criterion with a less stringent penalty; Entropy: Measure of classification certainty, ranging from 0 (complete uncertainty) to 1 (perfect classification); Interpretability: Classes should be substantively meaningful and align with theoretical expectations. Following best practices (Nylund et al., 2007), we prioritise BIC whilst considering entropy and theoretical coherence. All LCA models were estimated using STATA 18 with robust maximum likelihood estimation.
The theoretical conditions under which latent classes correspond to structurally distinct development regimes rather than statistical artefacts are formalised in Proposition 1 (Appendix E). This proposition establishes four identifiability conditions—local independence, class separation, structural correspondence, and temporal stability—that guide both model specification and empirical validation. These conditions draw on established principles from mixture modelling (Collins & Lanza, 2009) and institutional economics (North, 1990), ensuring that the latent classes we identify represent meaningful structural equilibria rather than arbitrary partitions of the SDG performance distribution. Empirical verification of these conditions is presented alongside the main results.
2.4. Ordered Logistic Regression
To examine structural determinants of regime membership, we estimate ordered logistic regression models. Classes identified through LCA are ordered by average SDG performance, creating an ordinal outcome variable where higher values denote better-performing regimes.
The ordered logit model assumes a latent continuous variable , where contains structural covariates and follows a logistic distribution. Threshold parameters determine observed class membership :
The probability of belonging to class k or lower is:
We specify two complementary approaches:
1. Year-specific models (2019–2024): separate regressions per year to assess temporal variation in predictor effects;
2. Pooled model with year fixed effects: combines all observations (N ≈ 1,002) with year dummies to identify robust, time-averaged associations. Missing data in structural covariates were handled via multiple imputation by chained equations (20 datasets), with results combined using Rubin's rules (see Appendix A.4 for details).
Core predictors include: Governance quality (WGI: government effectiveness); Digital infrastructure (ITU: internet penetration, % of population); Health investment (WHO: health expenditure, % of GDP. Controls: GDP growth, population growth, FDI inflows, political stability, energy and water stress indicators (complete list in Table A2, Appendix A).
Standard errors are clustered at the country level. Average marginal effects (AMEs) are computed to interpret substantive impact on class probabilities. All models are estimated in Stata 18 using `ologit` with robust standard errors.
All models include year fixed effects to account for temporal trends. Standard errors are clustered at the country level to address within-country correlation over time. For interpretation, we compute average marginal effects (AMEs), which show the change in the probability of belonging to each class associated with a one-standard-deviation increase in each predictor. These are calculated by averaging individual-level marginal effects across the sample (Williams, 2012). Models were estimated in Stata 18 using the ologit command with robust standard errors.
3. Results
3.1. Empirical Evidence of Volatility in SDG Performance
Progress towards the SDGs remains highly uneven across countries. Despite their universal framing, SDGs trajectories exhibit persistent stratification. Many countries stagnate or regress on key goals, particularly those related to inequality, institutional performance, and climate action, whilst others advance more consistently. This heterogeneity suggests that development processes may follow different structural pathways, rather than converging linearly towards uniform outcomes.
In addition to variation in levels of SDG achievement, we document substantial differences in intertemporal volatility. To capture this, we compute the coefficient of variation (CV) for each country across the 17 SDGs over the 2000–2024 period. The distribution of average volatility is wide: some countries display consistently stable trajectories, whilst others experience substantial year-on-year fluctuations. Crucially, these volatility patterns are not well explained by standard development classifications, such as income group or geographic region.
Figure 1 illustrates this heterogeneity by presenting the 30 most volatile and the 30 most stable countries, based on their average coefficient of variation. High-income and low-income countries are present in both groups, indicating that volatility is not monotonically related to income or institutional capacity. The presence of economically diverse nations in both extremes challenges conventional assumptions about the relationship between development level and policy stability.
Figure 2 maps the global distribution of volatility. Geographic clustering is visible but does not align cleanly with income levels or institutional classifications, reinforcing the notion that more complex or latent structures drive volatility patterns. Notably, regions traditionally considered developmentally similar exhibit substantial internal variation, suggesting that country-specific structural features may play a more decisive role than regional or income-based groupings.
We also observe substantial heterogeneity across goals, some SDGs are systematically more volatile across countries, particularly those related to governance, climate action, and inequality. By contrast, goals related to health and education tend to be more stable. This pattern suggests that certain policy domains are inherently more volatile, potentially reflecting their sensitivity to external shocks, political cycles, or institutional fragility.
Figure 3 presents average CVs by goal. Climate action (Goal 13), peace, justice and strong institutions (Goal 16), and reduced inequalities (Goal 10) are amongst the most volatile, whilst good health and well-being (Goal 3) and quality education (Goal 4) are the most stable. These findings align with theoretical expectations that governance-related and climate-sensitive goals are subject to greater temporal instability.
Perhaps most striking is the presence of country pairs that, despite apparent differences in income and institutional development, exhibit nearly identical volatility patterns. For example, Australia and Ukraine, India and Uganda, and Morocco and Haiti all display comparable average CV levels across SDGs, despite being situated in different regions and development tiers. This convergence in volatility profiles across structurally dissimilar countries provides further evidence that volatility reflects latent structural features of national development processes that are not captured by conventional classifications.
Figure 4 shows SDG volatility profiles for these illustrative country pairs. The similarity of patterns—despite differences in income levels, regional context, and governance structures—supports the hypothesis that volatility is shaped by deeper structural configurations that transcend surface-level economic or institutional indicators. These findings motivate the use of data-driven methods to identify latent development regimes based on actual goal-level dynamics.
Beyond variation at the country level, we observe systematic differences in volatility across both goals and structural groupings. To examine this, we calculate the average coefficient of variation for each SDG goal, disaggregated by region and income group. Figure 5 and Figure 6 summarise these results, revealing both expected and surprising patterns in the distribution of development volatility.
Figure 5 displays regional volatility profiles. Sub-Saharan Africa exhibits consistently high volatility across most goals, particularly in the goals of no poverty (Goal 1), quality education (Goal 4), and climate action (Goal 13). Asia and Latin America also exhibit elevated CVs in several key goals, reflecting ongoing structural transitions and exposure to external shocks. By contrast, Europe and North America demonstrate more stable goal-level dynamics, with only isolated peaks in specific domains. These patterns suggest that regional context conditions not only average SDG achievement, but also the stability of progress over time.
Figure 6 reports the decomposition by World Bank income groups. As expected, low-income countries tend to experience greater volatility across goals, reflecting institutional and financial constraints. However, the relationship is non-monotonic. Some lower-middle-income countries exhibit greater volatility than their low-income peers, particularly in industrial and environmental goals (e.g., Goals 9 and 13). Similarly, the high-income group shows substantial volatility in select goals, suggesting that income alone does not determine stability. This non-linearity underscores the limitations of income-based classifications in capturing the full complexity of development dynamics.
Together, these results reinforce the central argument: development volatility is not random noise, but reflects persistent structural asymmetries that are not reducible to income group or region. This motivates a more flexible empirical framework in which latent developmental regimes are derived from actual goal-level dynamics rather than imposed exogenously. The heterogeneity documented here points to the need for typologies that accommodate both average performance and volatility as defining features of sustainable development trajectories. The following sections employ latent class analysis to identify such regimes and examine their structural determinants. Detailed volatility statistics disaggregated by income group and geographic region are provided in Tables B1–B2 (Appendix B).
3.2. Identifying Latent Development Regimes
To identify latent structures in SDG performance, we employed Latent Class Analysis (LCA), a model-based clustering technique that probabilistically assigns countries to unobserved groups based on their SDG profiles. We estimated competing specifications with two to five classes using 2019 data and evaluated model fit using log-likelihood, information criteria (AIC, BIC), entropy, and substantive interpretability. Table 1 presents the fit statistics for all candidate models.
Whilst the five-class solution yielded the lowest AIC and BIC values, we retained the three-class specification for substantive and methodological reasons. First, a three-class typology aligns with established conceptual frameworks in development studies, which often distinguish between leading, transitional, and lagging country groups, thereby enhancing interpretability and policy relevance. Second, although models with more classes may improve statistical fit, they risk overfitting, reducing generalisability and obscuring substantive meaning. Third, increasing class numbers in panel settings introduces considerable estimation complexity, amplifying convergence problems and uncertainty in class assignment. Finally, our preliminary empirical review indicated that the three-class solution effectively captured essential cross-country differences, whilst adding more classes fragmented the patterns without yielding meaningful distinctions.
This three-class structure was applied annually to the full panel (2019–2024), assuming temporal consistency in the underlying grouping logic. Notably, the classes naturally aligned with meaningful differences in SDG achievement levels across countries: Class 1 comprised countries with the lowest overall SDG performance (lagging regime), Class 2 represented countries with moderate SDG performance (transitional regime), and Class 3 comprised countries with the highest SDG performance (leading regime).
To evaluate the stability and coherence of the latent class structure, we visualised the mean values of each SDG score across the 15 goals by latent class and year. Figure 7 presents radar plots illustrating the multidimensional SDG profiles for each class across the 2019–2024 period. These plots reveal a stable and internally coherent structure of latent classes, each representing a distinct development regime.
Class 3 consistently demonstrates the highest levels of SDG achievement, forming a broad and symmetrical profile across years, indicative of balanced performance across economic, social, and environmental dimensions. Class 2 exhibits moderate outcomes, with systematic underperformance across inequality and institutional indicators. Class 1 lags on most SDGs, particularly in ecological and governance domains. The preservation of relative positioning and the parallelism in class-specific profiles over time suggest that these latent classes capture durable, structurally differentiated development regimes. The absence of convergence or substantive overlap across classes supports the interpretation of these groups as persistent and internally consistent. This empirical regularity justifies using class labels as stable identifiers in analysing regime-based differentiation in global development.
The three latent regimes identified through SDGs performance clustering exhibit marked heterogeneity along both geographical and developmental lines. Class 1 (lagging regime) includes 46 countries, predominantly low-income or lower-middle-income economies. This group spans Sub-Saharan Africa (e.g., Angola, Benin, Burkina Faso), parts of South Asia (e.g., Afghanistan), and several fragile or post-conflict states. These countries generally display low and volatile SDG scores, consistent with systemic development constraints.
Class 2 (transitional regime) is the largest, comprising 81 countries. It contains a highly diverse mix of upper-middle-income and some lower-middle-income countries, drawn from nearly all world regions. Examples include Algeria, Argentina, Albania, Armenia, and Azerbaijan. The heterogeneity of this class suggests that transitional SDG performance does not neatly align with geography or income group, but may reflect intermediate structural configurations that transcend conventional classifications.
Class 3 (leading regime) comprises 47 countries, primarily high-income and institutionally advanced economies, including Australia, Austria, Belgium, and Bahrain. Whilst the majority of these countries belong to the OECD or have advanced service-based economies, the presence of a few non-Western high performers (e.g., Brunei Darussalam, Chile) highlights the global diffusion of sustainability leadership beyond traditional Western blocs. Taken together, these class compositions underscore that latent SDG regimes cut across standard classifications. Countries with comparable economic output or geographic proximity often diverge in regime placement, reinforcing the need for empirical typologies over exogenous groupings.
To assess the dynamics of countries' movement across sustainability trajectories, we examine class transition patterns over time. Figure 8 displays annual transition matrices that highlight how countries remained in or shifted between latent classes based on their SDG performance from 2019 to 2024. These matrices reveal the temporal stability of regime membership and the extent of cross-class mobility.
The transition matrices exhibit remarkable temporal stability in classifying countries based on their SDG performance. Most countries remained in their initial class over the six years, with particularly high persistence observed for Class 3, the highest-performing group. These countries experienced virtually no downward movement, reinforcing the notion of entrenched leadership in sustainable development. By contrast, limited mobility was observed between Classes 1 and 2, and occasionally from Class 3 to Class 2 between 2019 and 2022, possibly reflecting temporary regressions due to shocks or measurement fluctuations in specific goal domains. The overall persistence of the class structure confirms the structural robustness of the latent classification and highlights long-standing disparities in global progress towards the Sustainable Development Goals.
To further visualise the temporal stability and limited mobility across regimes, Figure 9 presents an alluvial diagram tracking country movements between classes from 2019 to 2024. The width of each stream represents the number of countries moving between (or remaining within) Classes 1 (low), 2 (moderate), and 3 (high). The stability of most streams reflects strong temporal consistency in country groupings, with limited upward or downward transitions.
These findings suggest that most countries appear locked into lower-performance trajectories. To deepen the understanding of longitudinal mobility within the latent class structure, we document discrete country-level transitions across sustainability performance classes. Table 2 provides a detailed account of all observed class shifts between 2019 and 2024, offering granular insight into the dynamics of SDG trajectory reclassification and highlighting critical cases of advancement, regression, and volatility.
The classification results reveal that most countries maintain stable regime membership over the observation period. However, a rare subset of transitions, although rare, suggests non-trivial mobility across latent SDG performance regimes. Bulgaria and Romania transitioned to higher-performing regimes during the latter part of the sample. These cases align with gradual structural adjustment, possibly linked to institutional consolidation or improvements in selected SDG domains. Although our model does not formally identify causal drivers, the persistence of the reclassification over consecutive years diminishes the likelihood of purely statistical noise.
Kuwait and Bahrain exhibit recurrent transitions between adjacent regimes (Class 2 and Class 3). This pattern may reflect proximity to the class boundary combined with indicator-level volatility, but it could also signal structural instability in underlying development factors. The absence of sustained directional movement suggests low regime inertia and warrants further investigation. Myanmar and the Syrian Arab Republic were reclassified into lower-performing regimes, temporally coinciding with episodes of political and institutional breakdown. Whilst the model abstracts from conflict and governance shocks, the timing of these downward shifts is consistent with broader macro-institutional disruption. These cases illustrate that latent regime structures are sensitive to exogenous structural shocks.
Overall, the presence of regime transitions, both upward and downward, supports the interpretation of regime membership as a dynamic rather than fixed classification. The remarkable stability of most countries within their initial classes, combined with isolated yet meaningful transitions, suggests that latent developmental regimes are persistent structural configurations that significant institutional or economic shocks can disrupt. These findings provide empirical support for treating SDG performance as governed by latent regime structures that are both durable and responsive to fundamental structural change.
3.3. Structural Anchoring of Development Regimes
To validate the substantive relevance of the latent classification, we examine whether countries assigned to different SDG performance clusters also differ systematically on a set of structural indicators not included in the latent class model. This external validation serves a dual purpose: it provides empirical justification for treating latent classes as meaningful development regimes, and it identifies which structural factors most strongly differentiate these regimes. We employ one-way analysis of variance (ANOVA) to test whether key demographic, technological, economic, and institutional indicators differ significantly across latent classes.
The analysis treats class membership as a grouping variable and each structural indicator as the outcome. Whilst this descriptive approach does not imply causality, it highlights whether the empirically derived classes correspond to observable structural differences. To ensure the reliability of results, we focus on variables with sufficient data coverage; those with more than 5% annual missingness were excluded to ensure comparability and statistical validity. For each variable-year combination, we report F-statistics, p-values, and Bonferroni-adjusted post-hoc comparisons to identify which specific class pairs differ significantly.
Table 3 presents the ANOVA results for selected structural variables across the 2019–2024 period. The analysis reveals consistent, statistically significant differences across latent classes for most indicators, with F-statistics ranging from moderate to exceptionally large. These findings confirm that the latent typology captures meaningful structural differentiation, rather than arbitrary or ephemeral groupings.
The results reveal striking and consistent structural differentiation across latent development regimes. Internet penetration emerges as one of the most powerful discriminators between classes, with exceptionally large F-statistics exceeding 1,500 across all years. The hierarchical ordering is unambiguous: Class 3 (leading regime) exhibits significantly higher internet access than Class 2 (transitional regime), which in turn surpasses Class 1 (lagging regime). This pattern persists across the entire observation period, with F-values actually increasing over time—from 1,512.6 in 2019 to 2,014.3 in 2023—suggesting that digital divides between development regimes are widening rather than converging. The consistency of this finding underscores the centrality of digital infrastructure and connectivity in contemporary development trajectories.
Government effectiveness displays an equally robust pattern of differentiation, with F-statistics ranging from 948.8 to 1,194.8 across years. As with digital access, the ordering is strictly monotonic: leading countries consistently outperform transitional countries, who in turn surpass lagging countries. The magnitude of these differences—reflected in effect sizes well above 0.8 standard deviations between classes—indicates that governance quality is not merely statistically significant but substantively profound. Bartlett tests for equal variances consistently fail to reject the null hypothesis (p > 0.05 for most years), suggesting that whilst mean governance levels differ dramatically across classes, the within-class variance remains relatively homogeneous. This implies that countries within the same latent regime share not only similar levels of institutional effectiveness but also comparable degrees of intra-regime heterogeneity.
Population growth exhibits more complex patterns. Whilst F-statistics remain highly significant (ranging from 115.5 to 299.1), the pairwise comparisons reveal non-monotonic relationships in some years. For instance, in 2019 and 2022, Classes 2 and 3 do not differ significantly from one another (p > 0.05), yet both differ substantially from Class 1. This suggests that demographic dynamics may follow a threshold pattern: once countries surpass a certain development threshold (i.e., transition from Class 1 to Class 2), population growth rates stabilise, and further advancement to Class 3 does not entail additional demographic shifts. The presence of significant Bartlett statistics (all p < 0.001) indicates substantial heterogeneity in variance, likely reflecting the diverse fertility transitions and migration patterns within latent classes.
Economic indicators display more modest, though still significant, differentiation. GDP growth rates in 2019 show a clear hierarchical pattern (F = 10.5, p < 0.001), with leading countries outperforming transitional and lagging countries. However, the relatively small F-statistic compared to governance or digital indicators suggests that short-term economic growth is less central to regime differentiation than structural institutional factors. Foreign direct investment (FDI) inflows display similar patterns, with Class 3 countries attracting significantly more investment than Classes 1 and 2, though Classes 1 and 2 themselves do not differ significantly. This reinforces the interpretation that certain structural advantages—such as institutional quality and digital infrastructure—act as magnets for capital, further entrenching developmental stratification.
Taken together, the ANOVA results provide compelling external validation for the latent class typology. The three empirically derived classes correspond to meaningful and persistent differences in structural conditions, with governance quality and digital access emerging as the most powerful discriminators. The stability of these patterns across years supports the interpretation that latent classes reflect durable developmental regimes, shaped by deep-seated institutional and technological configurations, rather than transient economic fluctuations. These findings set the stage for the subsequent regression analysis, which models class membership as a function of these structural predictors and quantifies the conditional probabilities of regime transitions.
3.3.1. Predictors of Regime Membership: Ordered Logistic Regression
Having established that latent development regimes exhibit systematic structural differentiation, we now model class membership as a function of these structural predictors. We employ ordered logistic regression, which appropriately captures the ordinal nature of class membership—from Class 1 (lagging regime) through Class 2 (transitional regime) to Class 3 (leading regime). This specification assumes proportional odds: the effect of each predictor on the log-odds of being in a higher class is constant across the class thresholds. We estimate two sets of models: year-specific models (2019–2024) to capture temporal variation in predictor effects, and a pooled model with year-fixed effects to identify robust, time-averaged associations.
Table 4 presents the year-specific ordered logit results. Each column represents a separate model estimated for a single year, allowing us to assess the temporal stability of structural effects. Coefficients are reported in log-odds units, with standard errors in parentheses. Positive coefficients indicate that higher values of the predictor increase the probability of belonging to a higher-performing class.
The year-specific models reveal striking consistency in the role of digital access. Internet penetration exhibits positive, highly significant coefficients across all years from 2019 to 2023, with magnitudes ranging from 0.111 (p < 0.001) in 2019 to 0.178 (p < 0.001) in 2023. This upward trend in coefficient size suggests that the marginal effect of internet access on regime membership has intensified over time, possibly reflecting the growing centrality of digital infrastructure in contemporary development processes. The absence of significance in 2024 likely reflects limited data availability for that year, as evidenced by the substantially reduced sample size. These findings underscore that digital connectivity is not merely a correlate of development but an increasingly decisive structural factor shaping countries' positions within the global SDG hierarchy.
Government effectiveness displays similarly robust associations with regime membership. Coefficients remain large and highly significant across all years (ranging from 2.108 to 2.964, all p < 0.001), indicating that institutional quality exerts a profound and stable influence on SDG performance trajectories. The magnitude of these effects is substantively striking: a one-unit increase in government effectiveness—corresponding approximately to the difference between the 25th and 75th percentiles of the global distribution—is associated with a two- to threefold increase in the log-odds of belonging to a higher class. This persistence of institutional effects across years supports the hypothesis that governance quality represents a deep structural determinant of development regimes, rather than a transient or cyclical factor.
Public health investment shows consistent positive effects from 2019 to 2022, with coefficients ranging from 0.423 to 0.500 (all p < 0.05). However, the effect becomes statistically insignificant in 2023 and 2024. This temporal pattern may reflect saturation dynamics: once health systems reach a threshold of investment, additional marginal spending may yield diminishing returns on overall SDG performance. Alternatively, the weakening effect in later years could signal structural disruptions associated with the COVID-19 pandemic and its aftermath, which may have complicated the relationship between health expenditure and broader development outcomes. These findings suggest that health investment plays a crucial role in regime differentiation during periods of relative stability but may exhibit threshold effects or contextual sensitivity during systemic shocks.
Population growth displays negative coefficients in most years, though statistical significance is intermittent. The negative association suggests that high demographic pressure may constrain countries' ability to advance to higher-performing regimes, consistent with theories emphasising resource scarcity and infrastructure strain in high-growth contexts. GDP growth, by contrast, shows inconsistent effects across years. The significant negative coefficient in 2023 (−0.188, p < 0.05) is counterintuitive. It may reflect short-term volatility or measurement issues, as growth rates in that year were influenced by post-pandemic recovery dynamics that varied widely across countries. The general lack of consistent significance for GDP growth aligns with the ANOVA findings, reinforcing the interpretation that structural and institutional factors—rather than short-term economic fluctuations—are the primary drivers of regime membership.
To identify robust, time-averaged effects, we estimate a pooled ordered logit model with year-fixed effects. This specification pools observations across the 2019–2024 period (N = 1,002) and includes dummy variables for each year to control for temporal variation. The model was estimated using multiple imputation to address missing data, with 20 imputed datasets combined via Rubin's rules. Table 5 presents the pooled results.
The pooled model confirms the primacy of digital access and governance quality as drivers of regime membership. Internet penetration (β = 0.049, p < 0.001) and government effectiveness (β = 0.943, p < 0.001) remain highly significant, whilst health expenditure also achieves significance (β = 0.153, p = 0.004). These three variables emerge as the consistent, robust predictors of SDG regime placement. By contrast, political stability, GDP growth, FDI inflows, and energy-related indicators fail to reach statistical significance in the pooled specification, suggesting that their effects are either context-specific or overshadowed by the dominant influence of institutions and digital infrastructure.
The year-fixed effects reveal a notable temporal pattern: coefficients for 2021, 2022, and 2023 are negative and significant relative to the 2019 baseline, whilst the 2024 coefficient is sharply negative (β = −2.99, p = 0.003). This pattern suggests that, holding structural conditions constant, the probability of belonging to higher-performing classes declined over the observation period. This temporal drift may reflect global disruptions associated with the COVID-19 pandemic and subsequent economic instability, which disproportionately affected countries' ability to sustain SDG progress. The strong negative effect in 2024, however, should be interpreted cautiously given the limited data availability for that year.
Taken together, the regression results provide compelling evidence that internet access, governance quality, and health investment are the primary structural determinants of SDG regime membership. These findings align closely with the ANOVA results and reinforce the interpretation that development regimes are anchored in deep institutional and technological configurations, rather than short-term economic performance or resource endowments. The consistency of these effects across both year-specific and pooled models underscores their robustness and substantive importance. The following section examines marginal effects to quantify the practical significance of these predictors and their implications for regime transitions.
3.3.2. Marginal Effects and Policy Implications
Whilst ordered logit coefficients indicate the direction and statistical significance of predictor effects, they do not directly convey the magnitude of impact on class membership probabilities. To enhance interpretability, we compute average marginal effects (AMEs) for each predictor, which quantify the expected change in the probability of belonging to each class associated with a one-unit increase in the predictor, holding all other variables at their means. Marginal effects provide a more intuitive and policy-relevant interpretation of structural influences on development regime membership.
Marginal effects were computed based on the pooled ordered logit model (2019–2024) using the first imputed dataset (m=1). Whilst outcome-specific margins are not supported under multiple imputation pooling in Stata, the single-imputation approach yields results that are consistent with pooled coefficient estimates and provides valid approximations for substantive interpretation. We calculate marginal effects separately for each class (Classes 1, 2, and 3) to understand how structural predictors differentially influence the probability of belonging to lagging, transitional, and leading regimes.
Figure 10 visualises the average marginal effects of key predictors on the probability of class membership across the 2019–2023 period. Each panel presents yearly marginal effects with 95% confidence intervals, illustrating both the direction and temporal stability of these relationships. Table 6 summarises the pooled marginal effects, providing point estimates and standard errors for the primary structural predictors.
The marginal effects reveal substantively essential differences in how structural predictors influence regime membership. Internet penetration exhibits the expected pattern: a one-percentage-point increase in internet users decreases the probability of belonging to the lagging regime (Class 1) by approximately 1.0 percentage points (p < 0.001) whilst simultaneously increasing the probability of belonging to the leading regime (Class 3) by 1.1 percentage points (p < 0.001). The effect on the transitional regime (Class 2) is negligible and statistically insignificant, indicating that internet access primarily differentiates the extremes of the development distribution rather than the middle. Given that internet penetration varies from near zero in some countries to nearly 100% in others, the cumulative impact of digital connectivity on regime placement is profound. A country moving from 20% to 80% internet penetration—a realistic policy trajectory over a decade—would experience a predicted 6–7 percentage point shift in the probability of attaining leading regime status, all else equal.
Government effectiveness displays even larger marginal effects. A one-unit increase in governance quality—corresponding roughly to the difference between countries at the 25th and 75th percentiles of the World Governance Indicators distribution—reduces the probability of lagging regime membership by 18.3 percentage points (p < 0.001) and increases the probability of leading regime membership by 19.1 percentage points (p < 0.001). These magnitudes are striking: they imply that institutional quality is not merely a correlate of development regime but a decisive structural determinant. Countries with weak governance face substantial barriers to advancing beyond the lagging regime, whilst those with strong institutions enjoy markedly higher probabilities of sustainable development leadership. The near-zero effect on Class 2 membership again suggests that governance primarily differentiates the tails of the distribution, rather than influencing transitions within the middle.
Public health investment exhibits more modest but still significant marginal effects. A one-percentage-point increase in health expenditure as a share of GDP reduces the probability of lagging regime membership by 3.0 percentage points (p < 0.001). It increases the probability of leading regime membership by 3.1 percentage points (p < 0.001). Whilst smaller in magnitude than governance or digital access, these effects remain substantively meaningful. A country increasing health spending from 3% to 6% of GDP—a feasible policy shift—would see approximately a 9 percentage-point increase in the probability of joining the leading regime. This underscores the importance of human capital investment in shaping long-term development trajectories, even if its impact is less dramatic than that of institutional or technological factors.
Population growth displays a negative association with leading regime membership, though the marginal effects are relatively small. A one-percentage-point increase in annual population growth increases the probability of lagging regime membership by 2.0 percentage points (p < 0.05). It decreases the probability of leading regime membership by 2.1 percentage points (p < 0.05). This pattern is consistent with demographic stress theories, which emphasise that rapid population growth strains infrastructure, depletes natural resources, and complicates the provision of public services. However, the modest magnitude of these effects suggests that demographic pressures, whilst constraining, are not insurmountable: countries with higher population growth can still achieve higher development regimes if they possess strong institutions and digital infrastructure.
GDP growth exhibits negligible and statistically insignificant marginal effects across all classes. This null finding reinforces the interpretation that short-term economic fluctuations do not meaningfully alter countries' structural positioning within development regimes. Instead, regime membership is determined by deep institutional and technological configurations that evolve gradually over longer time horizons. This does not imply that economic growth is irrelevant to sustainable development—clearly, it is not—but rather that its effects are mediated through the accumulation of institutions, infrastructure, and human capital, rather than exerting direct influence on regime placement in any given year.
The marginal effects carry important policy implications. First, they identify digital access and governance quality as the primary levers for advancing the regime. Countries seeking to transition from lagging to transitional or from transitional to leading regimes should prioritise investments in digital infrastructure and institutional strengthening. Second, the significant marginal effects of governance suggest that institutional reforms yield substantial dividends in terms of sustainable development positioning. Third, the modest effects of health expenditure imply that human capital investment, whilst significant, is insufficient on its own to drive regime transitions without complementary improvements in governance and connectivity. Finally, the negligible effects of short-term GDP growth underscore the limitations of purely economic approaches to development: sustainable progress requires structural transformation, not merely output expansion.
Taken together, the marginal effects analysis confirms that internet access, governance quality, and health investment are the primary structural determinants of SDG regime membership, with governance and digital access emerging as mighty drivers. These findings align with the coefficient estimates from the ordered logit models and reinforce the interpretation that deep institutional and technological configurations shape development regimes. The practical significance of these effects is substantial: countries that strengthen governance and expand digital access can realistically expect meaningful improvements in their probability of attaining higher-performing development regimes, with corresponding gains in SDG outcomes across economic, social, and environmental dimensions.
4. Discussion
This study set out to investigate whether global patterns of Sustainable Development Goal performance reflect structurally distinct development regimes rather than merely variations in resource availability or policy effort. Our findings provide compelling empirical evidence for the existence of three persistent latent regimes—lagging, transitional, and leading—that exhibit substantial temporal stability and systematic structural differentiation. These regimes are not reducible to conventional classifications such as income group or geographic region, and transitions between them remain remarkably limited despite nearly a decade of SDG implementation. The analysis reveals that digital infrastructure, governance quality, and health investment emerge as the primary structural determinants of regime membership, whilst short-term economic growth exerts negligible direct influence. These findings challenge prevailing assumptions of linear convergence in sustainable development and underscore the importance of structural transformation over incremental policy adjustments.
4.1. Latent Development Regimes and the Limits of Convergence
Our identification of three persistent latent development regimes fundamentally challenges the linear convergence narrative that has dominated international development discourse since the adoption of the 2030 Agenda. The Sustainable Development Report 2024 acknowledges that global SDG progress has stagnated since 2020, with only 17% of targets on track (Sachs et al., 2024), yet this stagnation is typically attributed to external shocks—namely the COVID-19 pandemic, geopolitical tensions, and climate disruptions—rather than to structural constraints inherent in the global development architecture. Our findings suggest a more sobering interpretation: the observed divergence in SDG trajectories reflects not temporary setbacks but rather the persistence of distinct development regimes characterised by fundamentally different structural configurations.
This interpretation aligns closely with recent empirical work documenting systematic heterogeneity in development pathways. A study published in Nature Communications employing economic complexity methods to map SDG progress across 166 countries similarly identified "a polarised global landscape, characterised by distinct groups of nations, each specialising in specific development indicators" (Wu et al., 2025). Crucially, that study found that as countries improve their overall SDG scores, they tend to modify their sustainable development trajectories, pursuing different development objectives—a pattern entirely consistent with our regime-based framework. The persistence we document resonates with path dependence theory in institutional economics (Acemoglu & Robinson, 2012), which emphasises that historical legacies and critical junctures create self-reinforcing institutional configurations that constrain future trajectories. As Acemoglu and Robinson (2012) argue, once societies embark on particular institutional paths, they tend to continue along them due to increasing returns, vested interests, and complementarities between institutions.
The minimal cross-regime mobility we observe—with fewer than 15% of countries transitioning between classes over the six-year observation period—provides empirical validation of the concept of "institutional lock-in" (Arthur, 1994; North, 1990). This lock-in operates through multiple channels. First, existing institutional arrangements create constituencies with vested interests in preserving the status quo, even when alternative configurations might yield superior collective outcomes. Second, complementarities between different institutional domains mean that reforms in one area (e.g., digital infrastructure) may yield limited returns without simultaneous improvements in others (e.g., governance capacity). Third, learning-by-doing effects and network externalities reinforce existing technological and organisational trajectories, creating barriers to the adoption of alternative approaches. Our finding that internet access and government effectiveness are the strongest predictors of regime membership—with marginal effects indicating 18-19 percentage-point shifts in the probability of governance and 6-7 percentage-point shifts in the probability of digital access—underscores that these are not merely correlates but constitutive elements of development regimes.
4.2. Digital Infrastructure as Foundational Development Capital
The preeminence of internet access as a predictor of membership in the development regime reflects the transformative role of digital technologies in contemporary development processes. Our finding that internet penetration consistently exhibits highly significant positive effects across all years (coefficients ranging from 0.111 to 0.178, p < 0.001), with marginal effects indicating a 1.1 percentage-point increase in the probability of the leading regime for each percentage-point increase in internet users, aligns with emerging consensus in the development community. The International Telecommunication Union's Digital Infrastructure Investment Initiative (ITU, 2023, 2024b, 2024a) reports that expanding meaningful and affordable connectivity contributes directly or indirectly to accelerating progress towards 70% of SDG targets, with digital technologies identified as essential for galvanising a turnaround in global SDG achievement.
The World Bank's 2024 assessment emphasises that reliable and affordable internet access serves as a fundamental driver of economic growth, provides access to essential services, and enables participation in modern society (World Bank, 2024a). Despite progress, nearly 3 billion people remained unconnected to the internet in 2024, with stark disparities persisting: 93% of high-income country populations are online compared to only 27% in low-income countries (Portulans Institute, 2024). Our ANOVA results, which reveal F-statistics exceeding 1,500 for internet access across all years—substantially larger than for any other predictor—provide statistical validation for treating digital divides not merely as symptoms of underdevelopment but as constitutive barriers to regime advancement.
Importantly, our finding that internet access effects strengthen over time (coefficients increasing from 0.111 in 2019 to 0.178 in 2023) suggests accelerating divergence in digital capabilities. This pattern is consistent with network effects and increasing returns to digital adoption: as more services, markets, and opportunities migrate online, the marginal value of connectivity rises, and the disadvantage of exclusion compounds. The digital divide thus operates not as a static gap but as a dynamic force amplifying developmental stratification. This finding carries profound implications for international development strategy. Conventional approaches treat digital infrastructure as one element amongst many in a diversified portfolio of interventions. Our results suggest instead that digital connectivity should be conceptualised as foundational development capital—a prerequisite for effective participation in the contemporary global economy rather than a complement to other forms of capital accumulation.
4.3. Governance Quality and Institutional Foundations of Development
The extraordinary magnitude of governance effects documented in our analysis—with government effectiveness coefficients ranging from 2.1 to 3.0 (p < 0.001) and marginal effects indicating 18-19 percentage point shifts in regime probabilities—provides robust empirical support for institutional theories of development. These findings resonate powerfully with Acemoglu and Robinson's (2012) central thesis in Why Nations Fail that inclusive institutions, rather than geography, culture, or ignorance, constitute the fundamental cause of long-run prosperity. Our ANOVA results, revealing F-statistics ranging from 949 to 1,195 for government effectiveness across years, demonstrate that governance quality differentiates development regimes more powerfully than does internet access, despite the latter's growing importance.
Recent empirical work corroborates the centrality of institutional quality. A 2024 study of Sub-Saharan African countries found that government institutions have significant positive effects on economic growth, with thresholds in institutional quality that must be reached to accelerate development meaningfully (Şit et al., 2024). Research across 70 developing countries similarly documented that institutional quality accounts for approximately 38% of variation in human development, with transparency and anti-corruption measures identified as foundational to institutional improvement (Rehman et al., 2023). The World Bank's Worldwide Governance Indicators project (2024) emphasises that good governance is essential for development, helping countries increase economic growth, build human capital, and strengthen social cohesion—precisely the multidimensional outcomes captured by the SDG framework.
The persistence of governance effects across our entire observation period, with no evidence of diminution despite global disruptions, underscores that institutional quality represents deep structural capital rather than transient policy commitment. This interpretation challenges instrumentalist views that treat governance improvements as technical fixes achievable through capacity-building programmes and best-practice transfers. Instead, our findings support historical institutionalist perspectives, emphasising that governance quality reflects the equilibrium outcomes of domestic political settlements, power distributions, and social contracts that evolve slowly and resist external intervention (Acemoglu et al., 2005; North, 1990). The near-zero marginal effects of governance on transitional regime membership, contrasted with significant impact on the probability of belonging to lagging versus leading regimes, further suggest threshold dynamics: governance improvements matter most at the extremes of the development distribution, where they determine whether countries escape the lagging regime or consolidate leadership status.
4.4. The Limited Role of Economic Growth and Demographic Pressures
The negligible and statistically insignificant marginal effects of GDP growth on regime membership documented in our analysis constitute one of our most theoretically consequential findings. This null result contradicts conventional development economics' emphasis on output expansion as the primary metric of progress. It challenges the implicit assumption underlying much SDG monitoring that faster economic growth translates directly into improved sustainable development performance. Our finding that short-term GDP fluctuations do not meaningfully alter countries' structural positioning within development regimes suggests instead that regime membership is determined by deep institutional and technological configurations that evolve gradually over longer time horizons.
This interpretation aligns with recent critiques of GDP-centric development paradigms. The UN's 2024 SDG report acknowledges that per-capita GDP growth in half of the world's most vulnerable nations has slowed relative to that of advanced economies. Yet, this divergence manifests primarily through differences in capacity to deliver sustainable development outcomes rather than through income levels per se (UN, 2024). Our results suggest that economic growth matters for sustainable development not through direct mechanical effects but rather through its contribution to the accumulation of institutions, infrastructure, and human capital—the very structural factors we identify as primary determinants of regime membership. This interpretation is consistent with endogenous growth theory's emphasis on institutions, human capital, and technology as fundamental determinants of long-run prosperity (Aghion & Howitt, 1992; Romer, 1990).
Population growth exhibits a modest negative association with leading regime membership (marginal effect of −2.1 percentage points, p < 0.05), consistent with demographic stress theories that emphasise that rapid population expansion strains infrastructure, depletes natural resources, and complicates public service provision (Ehrlich & Holdren, 1971). However, the relatively small magnitude of these effects—particularly when contrasted with the 18-19 percentage point effects of governance—suggests that demographic pressures, whilst constraining, are not determinative. Countries with higher population growth can still achieve higher development regimes if they possess strong institutions and digital infrastructure. This finding challenges neo-Malthusian perspectives that treat demographic pressures as insurmountable barriers to development, suggesting instead that institutional and technological investments can substantially mitigate demographic constraints.
4.5. Volatility as an Indicator of Institutional Resilience
Our documentation of substantial cross-country variation in SDG volatility—operationalised as year-to-year fluctuation in goal-level scores—that is not explained by income or institutional measures represents a novel contribution to the SDG monitoring literature. The observation that countries such as Australia and Ukraine, or India and Uganda, exhibit remarkably similar volatility profiles despite vast differences in development status challenges conventional assumptions that volatility primarily reflects resource constraints or institutional weakness. Instead, our findings suggest that volatility may capture dimensions of institutional resilience, policy coherence, and adaptive capacity that are orthogonal to absolute performance levels.
This interpretation aligns with recent work on sustainability transitions, highlighting nonlinear dynamics and threshold effects. Recently, researchers (Liashenko et al., 2025) employed multivariate adaptive regression splines to analyse European sustainability performance and identified critical tipping points and inflexion points in sustainability trajectories, demonstrating that progress does not unfold smoothly but shows regime-specific patterns and structural discontinuities. Our volatility measures may detect countries' proximity to such tipping points: high volatility potentially signals vulnerability to shocks (in poorly institutionalised contexts) or dynamic adaptation (in contexts with strong but flexible institutions). The fact that volatility patterns do not neatly correspond to regime membership suggests that temporal stability and absolute performance are partially independent dimensions of development capacity.
The policy implications of recognising volatility as a distinct dimension of development dynamics are substantial. Current SDG monitoring frameworks emphasise absolute scores and rankings, implicitly treating higher scores as uniformly superior. Our findings suggest that volatility—often dismissed as measurement noise—actually contains valuable information about countries' institutional resilience and vulnerability to shocks. Countries exhibiting high volatility may require different forms of international support than those with stable but low performance: the former need shock-absorbing mechanisms and adaptive governance capacity, whilst the latter require fundamental structural transformation. The 2024 SDG report's documentation (UN, 2024) states that over a third of SDG targets show stalled or regressing progress, which may reflect not merely inadequate policy effort but rather underlying volatility in countries' development trajectories that existing support mechanisms fail to address.
4.6. Policy Implications: From Goal-Specific Programming to Structural Transformation
Our findings carry profound implications for international development policy and resource allocation. The identification of persistent development regimes with limited cross-regime mobility suggests that achieving the SDGs requires addressing structural constraints through investments in foundational capabilities—governance capacity, digital infrastructure, and health systems—rather than focusing exclusively on goal-specific programming. The current architecture of international development assistance remains largely organised around vertical programmes targeting individual goals or sectors (e.g., global health initiatives, climate finance mechanisms, education programmes). Whilst such programmes deliver important short-term outcomes, our results suggest they may prove insufficient to catalyse the structural transformations required for countries to advance from lagging to transitional, or from transitional to leading, regimes.
The marginal effects analysis provides concrete guidance for prioritisation. With governance quality exhibiting marginal effects of 18-19 percentage points and internet access 6-7 percentage points (for realistic policy trajectories), investments in these domains yield substantially larger predicted improvements in regime status than do comparable investments in other areas. This does not imply that goal-specific interventions lack value—clearly, programmes addressing hunger, health, education, and environmental protection remain essential. Instead, it suggests that such interventions achieve maximum effectiveness when implemented within contexts of strong governance and digital connectivity. A country investing heavily in health programmes without concurrent improvements in governance capacity and digital infrastructure may achieve limited progress on health outcomes and negligible advancement in the overall development regime.
Recent international policy discussions reflect growing recognition of these structural prerequisites. The ITU's Digital Infrastructure Investment Initiative emphasises that digital infrastructure investment has become a top global policy priority, with estimates suggesting that building out infrastructure to connect everyone adequately will cost hundreds of billions of dollars by 2030 (Portulans Institute, 2024). The UN Summit of the Future (September 2024) prioritised reforms to address the debt crisis holding developing countries back and the urgent need to reform the international financial architecture—acknowledging that resource constraints, rather than mere policy knowledge, limit progress. The Financing for Development Conference and World Summit for Social Development, 2025, represent opportunities to operationalise structural approaches to SDG acceleration. However, translating these high-level commitments into concrete resource flows and policy reforms remains the critical challenge.
The identification of regime-specific vulnerabilities can inform more targeted allocation of adaptation finance and technical assistance. Countries in the lagging regime face fundamentally different constraints than those in the transitional regime: the former require foundational investments in governance and basic digital connectivity, whilst the latter need to consolidate gains and address remaining bottlenecks to achieve leadership status. Current allocation mechanisms often fail to adequately distinguish these contexts, applying standardised templates and eligibility criteria that may mismatch support to need. Our regime-based framework provides an empirical basis for differentiated strategies calibrated to countries' structural positions within the global development architecture.
4.7. Methodological Contributions and Theoretical Implications
Methodologically, this study advances the literature on development trajectories by integrating unsupervised classification (latent class analysis) with structural modelling (ordered logistic regression), allowing regime identification and explanation to proceed simultaneously rather than sequentially. Most existing work employing clustering techniques to identify development typologies stops at descriptive classification, leaving structural determinants unexplored (Cai et al., 2023; Polyakov et al., 2021). Our approach demonstrates that data-driven classification need not remain atheoretical. By formally modelling regime membership as a function of structural predictors and establishing conditions under which latent regimes correspond to recoverable structural equilibria (Proposition 1, Appendix E), we provide theoretical grounding for treating empirically derived classes as meaningful development regimes rather than statistical artefacts.
The integration of volatility measurement into SDG analysis represents a second methodological innovation. Existing monitoring frameworks treat temporal variation primarily as measurement error or year-to-year noise to be smoothed through averaging. Our systematic documentation of volatility's substantial cross-country variation, not explained by conventional development indicators, suggests that temporal stability constitutes an independent dimension of development capacity worthy of explicit modelling and policy attention. This finding opens avenues for future research on the institutional and policy determinants of development trajectory stability, potentially yielding insights into resilience, adaptive capacity, and vulnerability to shocks.
Theoretically, our findings contribute to debates on the nature of development trajectories and the potential for convergence. The varieties of capitalism literature has long emphasised that advanced economies exhibit distinct institutional configurations—liberal market economies versus coordinated market economies—that prove persistently stable and yield comparable economic performance through different means (Hall & Soskice, 2001). Our identification of three development regimes extends this logic to the global South, suggesting that sustainable development may be achievable through alternative institutional pathways rather than requiring convergence to a single "best practice" model. However, the limited cross-regime mobility we document—contrasted with the relative stability of institutional varieties amongst advanced economies—suggests asymmetry: whilst multiple paths to prosperity may exist amongst leading countries, escape from lagging regimes appears considerably more difficult than movement amongst alternative high-performance configurations.
4.8. Limitations and Future Research Directions
Several limitations merit acknowledgement. First, our analysis covers a relatively short time period (2019–2024), constraining our ability to assess long-term regime stability and transition dynamics. The six-year observation window, whilst capturing recent SDG implementation dynamics, may prove insufficient for detecting gradual regime shifts that unfold over decades. The limited number of observed transitions between regimes could reflect either genuine structural persistence or merely insufficient observation time. Extending the analysis backwards to incorporate pre-2019 data (with appropriate attention to data quality and comparability issues) would strengthen inferences about regime stability. Continuing the analysis as additional SDG monitoring data become available will clarify whether the minimal mobility we observe represents a permanent feature of the global development architecture or a transitional phase.
Second, our exclusion of Goals 10 (Reduced Inequalities) and 14 (Life Below Water) due to persistent data gaps potentially biases our regime identification. Both goals address critical sustainability dimensions—inequality and marine ecosystems—that may differentiate development trajectories in ways not fully captured by the retained goals. The UN's 2024 SDG report identifies inequality as a key area where progress has stalled or reversed (UN, 2024), suggesting that Goal 10 indicators might reveal regime differences obscured in our analysis. Future research employing imputation techniques or alternative data sources to incorporate these goals could yield more comprehensive regime characterisations. The ongoing expansion and refinement of SDG monitoring infrastructure may eventually enable fuller specification.
Third, whilst our ordered logistic regression models identify governance, digital access, and health investment as significant predictors, the analysis remains fundamentally associational rather than causal. We cannot definitively rule out reverse causality (regime membership influencing governance quality) or omitted-variable bias (unobserved factors driving both regime status and the measured predictors). The structural identifiability proposition (Proposition 1, Appendix E) establishes conditions under which latent regimes correspond to structural equilibria, but satisfying these conditions does not guarantee that estimated associations represent causal effects. Establishing causality would require either an experimental or quasi-experimental design (e.g., exploiting natural experiments in governance reforms or in digital infrastructure deployment) or credible instrumental variables. Such approaches remain challenging in cross-national development research but represent important frontiers for future work.
Fourth, our regime-based framework, whilst revealing systematic heterogeneity, necessarily simplifies the complexity of development processes. The three-class solution we identify as optimal provides a parsimonious description but may mask further differentiation within classes. For instance, the transitional regime likely encompasses countries pursuing quite different development strategies—some emphasising export-led industrialisation, others resource extraction, and still others service-sector development. Disaggregating regimes into sub-types or exploring fuzzy clustering approaches that allow partial membership in multiple regimes could yield richer characterisations. Additionally, our focus on country-level analysis obscures substantial within-country heterogeneity: many countries exhibit vast regional disparities in development outcomes that aggregate measures conceal.
Fifth, the COVID-19 pandemic's occurrence during our observation period (2020–2023) complicates interpretation of temporal patterns. The significant negative year-fixed effects we document for 2021–2024 relative to 2019 may reflect pandemic-specific disruptions rather than underlying regime dynamics. The loss of health expenditure significance in 2023–2024, contrasted with consistent effects in 2019–2022, could similarly reflect pandemic-driven shifts in health system priorities and financing rather than fundamental changes in health-development relationships. Distinguishing pandemic effects from structural trends will require extended post-pandemic observation periods and potentially pandemic-specific control variables or analytical strategies.
Future research could profitably pursue several extensions. First, examining regime-specific dynamics and transition mechanisms more deeply would illuminate pathways for regime advancement. Qualitative comparative analysis of countries that have successfully transitioned could identify critical combinations of reforms and conditions that enable escape from lagging regimes. Second, investigating the microfoundations of volatility—linking aggregate SDG fluctuations to specific policy choices, institutional characteristics, and external shocks—would clarify whether volatility primarily reflects vulnerability or adaptive capacity. Third, extending regime analysis to subnational scales would reveal whether national-level regimes mask within-country heterogeneity and potentially identify subnational contexts where different development models operate. Fourth, exploring trade-offs and synergies between goals within and across regimes would illuminate whether regime membership constrains or enables particular development strategies. Finally, incorporating network analysis to examine international flows of finance, technology, and knowledge could reveal how transnational connections reinforce or disrupt regime configurations.
5. Conclusions
With only five years remaining until the 2030 deadline, the international community confronts mounting evidence that the SDGs will not be achieved through business-as-usual approaches. Our findings suggest that this shortfall reflects not merely inadequate resource mobilisation or policy implementation but rather the persistence of structural configurations that constrain development trajectories. The identification of distinct, stable development regimes with limited cross-regime mobility implies that achieving the SDGs requires confronting institutional and technological barriers that resist incremental reform. Digital infrastructure and governance quality emerge as foundational capabilities that enable progress across multiple goals simultaneously, suggesting that investments in these domains yield multiplicative rather than merely additive returns.
The implications extend beyond technical questions of resource allocation and programme design to fundamental questions about the architecture of international development cooperation. If development regimes exhibit path dependence and lock-in effects, then simple knowledge transfers and best-practice replication from leading to lagging countries will prove insufficient. Instead, catalysing regime transitions may require coordinated packages of reforms that simultaneously address multiple structural constraints, supported by substantial and sustained international financing. The UN Summit of the Future's emphasis on reforming the global financial architecture and addressing debt crises reflects growing recognition that systemic barriers require systemic solutions.
Yet our findings also counsel against determinism. Whilst historical legacies and structural constraints shape trajectories, they do not predetermine outcomes. The fact that some countries have achieved cross-regime transitions, even if few in number, demonstrates that escape from lagging regimes remains possible. The challenge lies in identifying the combinations of domestic reforms and international support that enable such transitions and ensuring that international cooperation aligns with countries' structural positions and constraints. As the global community confronts the reality of widespread SDG shortfalls, moving from aspirational goal-setting to structural transformation must become the central development policy challenge of the coming decade.
Author Contributions
Conceptualization, O.L., D.H., O.M., N.P., I.C. and D.Ho.; methodology, O.L., D.H., O.M. and I.C.; validation, O.L., D.H., O.M., N.P., I.C. and D.Ho.; formal analysis, O.L., D.H., I.C., N.P. and D.Ho.; investigation, O.L., D.H., O.M., N.P., I.C. and D.Ho.; data curation, O.L., D.H., O.M., N.P. and D.Ho.; writing – original draft, O.L., D.H., O.M., N.P., I.C. and D.Ho.; writing – review & editing, O.L., D.H., O.M., N.P., I.C. and D.Ho.; visualization, O.L. and D.H.; supervision, O.L.; project administration, O.L. and O.M.; funding acquisition, O.L.
Funding
This research received no external funding.
Institutional Review Board Statement
Not applicable.
Informed Consent Statement
Not applicable.
Data Availability Statement
The study utilises separate Index Scores for each SDG, compiled by the Sustainable Development Solutions Network (SDSN) and published annually in the Sustainable Development Report. These scores are also disseminated via the UN SDG Global Database. All data are openly accessible at: https://dashboards.sdgindex.org/downloads/ (accessed on 12 August 2025), https://unstats.un.org/sdgs/indicators/database (accessed on 12 August 2025) and https://sdgindex.org/reports/ (accessed on 12 August 2025). In accordance with the licensing conditions of the United Nations and SDSN, the authors do not hold the rights to redistribute the dataset. Researchers are therefore encouraged to access it directly through the official portal. Governance indicators are available from the Worldwide Governance Indicators database https://www.worldbank.org/en/publication/worldwide-governance-indicators. ICT Development Index data are available from the International Telecommunication Union (https://www.itu.int). Health expenditure data are available from the World Health Organisation Global Health Expenditure Database (https://apps.who.int/nha/database). All datasets were accessed between April and May 2025. The complete output files generated during the study are available from the corresponding author upon reasonable request.
Acknowledgments
The first author gratefully acknowledges support from the British Academy and CARA through the Researchers at Risk Fellowship Scheme, which made this research possible. The first author also thanks Loughborough University and Loughborough Business School for providing essential organisational and institutional support during the development of this study.
Conflicts of Interest
The authors declare no conflicts of interest.
Abbreviations
The following abbreviations are used in this manuscript:
| SDG | Sustainable Development Goal |
| AME | Average marginal effect |
| LCA | Latent Class Analysis |
| UN | United Nations |
Appendix A. Data Preparation and Variable Selection
Appendix A.1 Missing Data Assessment
Table A1 presents the summary of missing data for SDG indicators across the 2019–2024 observation period. Following established guidelines for latent class analysis, we excluded Goals 10 (Reduced Inequalities) and 14 (Life Below Water) because the missing data rate exceeded 10%.

Table A1.
Missing Data Summary for SDG Indicators (2019–2024).
| SDG Goal | Missing (%) | Status | Rationale |
|---|---|---|---|
| Goal 1: No Poverty | 8.17 | Retained | Policy relevance; below threshold |
| Goals 2–9 | <5.0 | Retained | Acceptable missingness |
| Goal 10: Inequalities | 10.51 | Excluded | Exceeds 10% threshold |
| Goals 11–13 | <5.0 | Retained | Acceptable missingness |
| Goal 14: Life Below Water | 11.43 | Excluded | Exceeds 10% threshold |
| Goals 15–17 | <5.0 | Retained | Acceptable missingness |
Note: Missing data percentages computed as annual averages across the 2019–2024 panel. The 10% threshold follows recommendations from Enders (2010) and Ghosh (2010) for latent variable models.
Appendix A.2. Variable Selection and Theoretical Justification
Control variables were selected based on theoretical justification from institutional economics, human capital theory, and sustainable development literature. Table A2 presents each variable with its theoretical rationale and primary supporting references.
Table A2.
Theoretically Informed Selection of Control Variables.
| Variable | Theoretical Rationale |
|---|---|
| Government Effectiveness | Institutional quality shapes development capacity(Acemoglu & Robinson, 2012; North, 1990) |
| Internet Users (%) | Digital infrastructure enables participation in modern economy (ITU, 2024a; World Bank, 2024a) |
| Health Expenditure (% GDP) | Human capital investment drives long-term development (Becker, 1964; Romer, 1990) |
| Population Growth (%) | Demographic pressures strain resources and infrastructure (Ehrlich & Holdren, 1971) |
| GDP Growth (%) | Short-term economic performance as control (Aghion & Howitt, 1992) |
| Political Stability | Stability enables long-term planning and investment (World Bank, 2024b) |
| FDI Inflows (% GDP) | External capital flows signal investment attractiveness (World Bank, 2024b) |
| Energy Intensity | Resource efficiency indicates development sustainability (Rockström et al., 2009) |
Note: Variables selected to capture key dimensions identified in institutional economics and sustainable development literature. All variables sourced from World Bank WDI, WGI, WHO, and ITU databases.
Appendix A.3. Multicollinearity Diagnostics
Table A3.
Variance Inflation Factor Diagnostics.
| Variable | VIF | Tolerance |
|---|---|---|
| Internet Users (% population) | 3.42 | 0.292 |
| Government Effectiveness | 2.89 | 0.346 |
| Health Expenditure (% GDP) | 1.78 | 0.562 |
| Population Growth (%) | 1.45 | 0.690 |
| GDP Growth (%) | 1.12 | 0.893 |
| Political Stability | 2.34 | 0.427 |
| FDI Inflows (% GDP) | 1.23 | 0.813 |
| Energy Intensity | 1.56 | 0.641 |
| Mean VIF | 1.97 | — |
Note: All VIF values below the conventional threshold of 5.0 indicate no problematic multicollinearity. Tolerance values (1/VIF) all exceed 0.20. Diagnostics computed from pooled model specification.
Appendix A.4. Multiple Imputation Procedure
Missing data in structural covariates ranged from 1.2% (governance indicators, population growth) to 6.6% (internet users), with all variables below the 10% threshold (Table A4). Of the 1,002 country-year observations, 612 (61%) had at least one missing value among the imputed covariates, while 390 observations (39%) were complete.
Missing data were addressed using multiple imputation by chained equations (MICE), implemented via mi impute chained in Stata 18 with linear regression as the imputation method for all continuous variables. Twenty imputed datasets were generated (m=20), following recommendations for achieving stable estimates when the fraction of missing information is moderate (White et al., 2011). The imputation model included all analysis variables with year indicators as auxiliary predictors to capture temporal trends in missingness patterns.
The missing-at-random (MAR) assumption is plausible, given that missingness in structural indicators is primarily driven by data-collection capacity and reporting practices that vary systematically with observable country characteristics and temporal patterns captured by year effects.
Results were combined using Rubin's rules for pooled coefficient estimates and standard errors. For average marginal effects, which require outcome-specific predictions not supported under multiple imputation pooling in Stata, we report results from the first imputed dataset (m=1).
Table A4.
Missing Data Rates for Imputed Structural Covariates (%).
| Variable | 2019 | 2020 | 2021 | 2022 | 2023 | Overall |
|---|---|---|---|---|---|---|
| Internet Users (%) | 5.4 | 4.8 | 7.8 | 7.2 | 7.8 | 6.6 |
| Government Effectiveness | 1.2 | 1.2 | 1.2 | 1.2 | 1.2 | 1.2 |
| Political Stability | 1.2 | 1.2 | 1.2 | 1.2 | 1.2 | 1.2 |
| Health Expenditure (% GDP) | 1.2 | 1.2 | 1.2 | 1.8 | — | 1.4 |
| GDP Growth (%) | 3.0 | 3.0 | 3.0 | 3.0 | 4.8 | 3.2 |
| Population Growth (%) | 1.2 | 1.2 | 1.2 | 1.2 | 1.2 | 1.2 |
| FDI Inflows (% GDP) | 3.6 | 4.2 | 4.2 | 4.8 | 6.6 | 4.7 |
| Energy Intensity | 1.8 | 1.8 | 1.8 | — | — | 1.8 |
| Water Stress | 2.4 | 2.4 | 2.4 | — | — | 2.4 |
Note: Missing percentages calculated as proportion of observations with missing values per year (N=167 per year). All rates below the 10% threshold for inclusion. Overall rates calculated across available years. Dash (—) indicates variable not available for that year.
Appendix B
This appendix provides detailed volatility statistics disaggregated by income group and geographic region, supplementing the visual analysis presented in Figure 5 and Figure 6 of the main text. These tables support the interpretation in Results section 3.1 that volatility patterns transcend conventional development classifications.
Table B1.
SDG Volatility by Income Group.
| Income Group | Mean CV | Median CV | Min CV | Max CV | N |
|---|---|---|---|---|---|
| High Income | 0.032 | 0.031 | 0.028 | 0.038 | 5 |
| Upper-Middle Income | 0.045 | 0.044 | 0.039 | 0.052 | 4 |
| Lower-Middle Income | 0.068 | 0.065 | 0.055 | 0.082 | 3 |
| Low Income | 0.095 | 0.092 | 0.078 | 0.112 | 3 |
Note: Coefficient of variation (CV) computed as σ/μ for each country across SDG goals over the 2019–2024 period. The non-monotonic relationship between income and volatility suggests complex interactions between economic capacity and policy stability.
Table B2.
SDG Volatility by Region.
| Region | Mean CV | Median CV | Min CV | Max CV | N |
|---|---|---|---|---|---|
| North America | 0.030 | 0.030 | 0.029 | 0.031 | 2 |
| Europe | 0.033 | 0.033 | 0.032 | 0.034 | 4 |
| Latin America & Caribbean | 0.048 | 0.048 | 0.045 | 0.052 | 2 |
| Oceania | 0.049 | 0.049 | 0.049 | 0.049 | 1 |
| Sub-Saharan Africa | 0.085 | 0.095 | 0.060 | 0.101 | 3 |
| Asia | 0.100 | 0.102 | 0.092 | 0.105 | 3 |
Note: Regional volatility patterns suggest that institutional resilience varies systematically across geographic contexts, with potential implications for targeted development assistance and shock-absorbing mechanisms.
Appendix C
Appendix C.1. Model Fit Statistics
Three-class models were estimated separately for each year using generalised structural equation modelling (gsem) in Stata 18 with robust standard errors. Table C1 presents model fit statistics confirming adequate fit across all years. These results complement Table 1 in the main text, which compares alternative class solutions for the 2019 baseline year.
Table C1.
Latent Class Model Fit Statistics by Year (Three-Class Solution).
| Year | Log-Likelihood | AIC | BIC | Entropy | N |
|---|---|---|---|---|---|
| 2019 | −9,829.6 | 19,783.2 | 19,977.6 | 0.89 | 167 |
| 2020 | −9,856.3 | 19,836.6 | 20,031.0 | 0.88 | 167 |
| 2021 | −9,812.4 | 19,748.8 | 19,943.2 | 0.90 | 167 |
| 2022 | −9,798.7 | 19,721.4 | 19,915.8 | 0.91 | 167 |
| 2023 | −9,845.2 | 19,814.4 | 20,008.8 | 0.89 | 167 |
| 2024 | −9,867.8 | 19,859.6 | 20,054.0 | 0.87 | 167 |
Note: AIC = Akaike Information Criterion; BIC = Bayesian Information Criterion. Higher entropy values (closer to 1.0) indicate clearer class separation. All models were estimated using robust maximum likelihood.
Appendix C.2. Class Distribution
Table C2 presents the distribution of countries across the three latent classes for each year. Class sizes remain remarkably stable, with approximately 27% in the lagging regime, 46% in the transitional regime, and 27% in the leading regime.
Table C2.
Class Membership Distribution by Year.
| Year | Class 1 (Lagging) | (%) | Class 2 (Transitional) | (%) | Class 3 (Leading) | (%) |
|---|---|---|---|---|---|---|
| 2019 | 46 | 27.5 | 77 | 46.1 | 44 | 26.4 |
| 2020 | 45 | 26.9 | 78 | 46.7 | 44 | 26.4 |
| 2021 | 45 | 26.9 | 77 | 46.1 | 45 | 26.9 |
| 2022 | 44 | 26.4 | 78 | 46.7 | 45 | 26.9 |
| 2023 | 44 | 26.4 | 77 | 46.1 | 46 | 27.5 |
| 2024 | 45 | 26.9 | 76 | 45.5 | 46 | 27.5 |
Note: Class assignments based on modal posterior probabilities. The stability of class sizes across years supports the interpretation of latent classes as persistent structural regimes.
Appendix C.3. Transition Matrices
Tables C3a–C3e present year-to-year transition matrices documenting the persistence of class membership and limited cross-regime mobility. The diagonal elements represent countries that remain in the same class.
Table C3a.
Transition Matrix: 2019 → 2020.
| From \ To | Class 1 | Class 2 | Class 3 | Total |
| Class 1 (Lagging) | 45 | 1 | 0 | 46 |
| Class 2 (Transitional) | 0 | 76 | 1 | 77 |
| Class 3 (Leading) | 0 | 1 | 43 | 44 |
Table C3b.
Transition Matrix: 2020 → 2021.
| From \ To | Class 1 | Class 2 | Class 3 | Total |
|---|---|---|---|---|
| Class 1 (Lagging) | 44 | 1 | 0 | 45 |
| Class 2 (Transitional) | 1 | 75 | 2 | 78 |
| Class 3 (Leading) | 0 | 1 | 43 | 44 |
Table C3c.
Transition Matrix: 2021 → 2022.
| From \ To | Class 1 | Class 2 | Class 3 | Total |
|---|---|---|---|---|
| Class 1 (Lagging) | 44 | 1 | 0 | 45 |
| Class 2 (Transitional) | 0 | 75 | 2 | 77 |
| Class 3 (Leading) | 0 | 2 | 43 | 45 |
Table C3d.
Transition Matrix: 2022 → 2023.
| From \ To | Class 1 | Class 2 | Class 3 | Total |
|---|---|---|---|---|
| Class 1 (Lagging) | 44 | 0 | 0 | 44 |
| Class 2 (Transitional) | 0 | 75 | 3 | 78 |
| Class 3 (Leading) | 0 | 2 | 43 | 45 |
Table C3e.
Transition Matrix: 2023 → 2024.
| From \ To | Class 1 | Class 2 | Class 3 | Total |
|---|---|---|---|---|
| Class 1 (Lagging) | 44 | 1 | 0 | 45 |
| Class 2 (Transitional) | 1 | 75 | 1 | 77 |
| Class 3 (Leading) | 0 | 0 | 45 | 45 |
Note: Transition matrices show the number of countries moving between classes. Diagonal dominance (>95% persistence) confirms temporal stability of regime membership, supporting the interpretation of latent classes as structurally distinct development regimes.
Appendix D
Appendix D.1. Ordered Logistic Regression by Year
Table D1 presents ordered logistic regression coefficients for each year separately (2019–2024), demonstrating the temporal stability of structural predictors. Internet access and government effectiveness maintain strong, positive, and highly significant effects across all years (2019–2023), whilst GDP growth, FDI, energy indicators, and water stress remain consistently insignificant. These results expand upon Table 4 in the main text by including all control variables and threshold parameters (cut points).
Table D1.
Ordered Logit Regressions: SDG Class Membership by Year (2019–2024).
| Variable | 2019 | 2020 | 2021 | 2022 | 2023 | 2024 |
|---|---|---|---|---|---|---|
| Internet Users | 0.111*** | 0.114*** | 0.124*** | 0.151*** | 0.178*** | 0.001 |
| (0.029) | (0.030) | (0.036) | (0.047) | (0.049) | (0.014) | |
| Government Effectiveness | 2.214*** | 2.108*** | 2.964*** | 2.404*** | 2.468*** | −0.029 |
| (0.709) | (0.681) | (0.854) | (0.784) | (0.810) | (0.386) | |
| Political Stability | −0.210 | −0.362 | −0.014 | 0.070 | 0.267 | −0.017 |
| (0.494) | (0.482) | (0.547) | (0.555) | (0.516) | (0.339) | |
| Population Growth | −0.605* | −0.361 | −1.076*** | −0.424* | −0.353* | 0.006 |
| (0.329) | (0.246) | (0.404) | (0.235) | (0.205) | (0.159) | |
| GDP Growth | 0.186 | 0.047 | 0.043 | 0.016 | −0.188** | 0.002 |
| (0.131) | (0.044) | (0.063) | (0.055) | (0.087) | (0.044) | |
| FDI Inflows | 0.035 | 0.000 | 0.011 | −0.011 | 0.016 | −0.001 |
| (0.045) | (0.010) | (0.037) | (0.024) | (0.022) | (0.007) | |
| Primary Energy Intensity | 0.028 | 0.036 | 0.153 | 0.077 | −0.045 | −0.025 |
| (0.268) | (0.219) | (0.218) | (0.237) | (0.242) | (0.110) | |
| Energy Use per GDP | 0.087 | 0.090 | 0.119 | 0.094 | −0.018 | −0.006 |
| (0.103) | (0.093) | (0.105) | (0.087) | (0.094) | (0.058) | |
| Health Expenditure | 0.500** | 0.452** | 0.495** | 0.423** | 0.069 | −0.005 |
| (0.210) | (0.184) | (0.209) | (0.198) | (0.238) | (0.119) | |
| Water Stress | 0.001 | −0.001 | −0.001 | 0.000 | 0.000 | 0.000 |
| (0.001) | (0.001) | (0.001) | (0.001) | (0.001) | (0.001) | |
| cut1 | 4.339 | 4.681 | 5.388* | 7.644** | 5.542 | −1.157 |
| (2.888) | (2.845) | (3.025) | (3.535) | (3.533) | (1.510) | |
| cut2 | 14.21*** | 13.88*** | 17.55*** | 18.41*** | 16.15*** | 0.871 |
| (3.620) | (3.868) | (4.585) | (5.237) | (5.268) | (1.504) | |
| N | 167 | 167 | 167 | 167 | 167 | 167 |
Note: Standard errors in parentheses. * p < 0.10, ** p < 0.05, *** p < 0.01. Primary Energy Intensity = MJ per unit of GDP (EG_EGY_PRIM_PP_KD); Energy Use per GDP = GDP per unit of energy use (EG_GDP_PUSE_KO_PP); Water Stress = freshwater withdrawal as % of available resources (ER_H2O_FWST_ZS).
Appendix D.2. Pooled Ordered Logistic Regression
Table D2 presents the pooled ordered logistic regression with year-fixed effects, estimated using multiple imputation (20 imputations) with Rubin's rules. This specification combines all observations (N = 1,002) across 2019–2024 to identify robust, time-averaged associations between structural predictors and regime membership. These results expand upon Table 5 in the main text by including all control variables and year-fixed effects.
Table D2.
Pooled Ordered Logit Regression with Year-Fixed Effects (2019–2024).
| Variable | Coefficient | Std. Err. | t | P>|t| |
|---|---|---|---|---|
| Internet Users | 0.0489*** | (0.0064) | 7.61 | 0.000 |
| Government Effectiveness | 0.9425*** | (0.1675) | 5.63 | 0.000 |
| Political Stability | −0.0207 | (0.1474) | −0.14 | 0.888 |
| Population Growth | −0.1053 | (0.0690) | −1.53 | 0.129 |
| GDP Growth | 0.0007 | (0.0170) | 0.04 | 0.965 |
| FDI Inflows | 0.0019 | (0.0028) | 0.68 | 0.499 |
| Primary Energy Intensity | −0.0099 | (0.0549) | −0.18 | 0.857 |
| Energy Use per GDP | 0.0213 | (0.0238) | 0.90 | 0.372 |
| Health Expenditure | 0.1531*** | (0.0529) | 2.90 | 0.004 |
| Water Stress | 0.0001 | (0.0003) | 0.19 | 0.847 |
| Year 2020 (ref: 2019) | −0.2957 | (0.2812) | −1.05 | 0.293 |
| Year 2021 | −0.6038** | (0.2645) | −2.28 | 0.023 |
| Year 2022 | −0.6209** | (0.2674) | −2.32 | 0.020 |
| Year 2023 | −0.6036** | (0.2999) | −2.01 | 0.045 |
| Year 2024 | −2.9935*** | (0.9193) | −3.26 | 0.003 |
| cut1 | 1.4282 | (0.6540) | ||
| cut2 | 5.4147 | (0.7576) | ||
| N | 1,002 | |||
| F(15, 734.7) | 11.46*** |
Note: Multiple imputation estimates (20 imputations) combined using Rubin's rules. * p < 0.10, ** p < 0.05, *** p < 0.01. Average RVI = 1.59; Largest FMI = 0.90. The year 2019 is the reference category for year-fixed effects. The significant negative year coefficients for 2021–2024 indicate declining probability of higher-class membership over time, controlling for structural predictors.
Appendix D.3. ANOVA Results: Structural Variables by Class
Table D3 presents ANOVA F-statistics testing whether structural predictors significantly differentiate the three latent classes. Internet access and government effectiveness consistently produce the largest F-statistics (>900), confirming their role as primary regime determinants. These results expand upon Table 3 in the main text.
Table D3.
ANOVA F-Statistics: Structural Variables by Class Membership.
| Variable | 2019 | 2020 | 2021 | 2022 | 2023 |
|---|---|---|---|---|---|
| Internet Users | 1512.6*** | 1775.2*** | 1832.4*** | 1907.0*** | 2014.3*** |
| Government Effectiveness | 1194.8*** | 1090.5*** | 1050.3*** | 1038.0*** | 948.8*** |
| Health Expenditure | 456.2*** | 423.8*** | 478.5*** | 445.1*** | 389.4*** |
| Population Growth | 289.4*** | 299.1*** | 287.2*** | 265.8*** | 278.3*** |
| GDP Growth | 10.5*** | 8.2*** | 12.4*** | 9.8*** | 7.6*** |
| Political Stability | 678.3*** | 645.9*** | 612.4*** | 598.7*** | 567.2*** |
| FDI Inflows | 23.6*** | 19.8*** | 28.4*** | 25.1*** | 21.7*** |
Note: F-statistics from one-way ANOVA testing differences across three latent classes. *** p < 0.001 for all tests. Post hoc Bonferroni comparisons confirm the Class 3 > Class 2 > Class 1 ordering for Internet Users and Government Effectiveness.
Appendix E
Appendix E.1. Proof of Proposition 1: Structural Identifiability of Latent Regimes
This appendix provides the formal proof establishing conditions under which latent classes identified through mixture modelling correspond to structurally distinct development regimes rather than statistical artefacts. This proposition is referenced in the Methods section (2.3–2.4) as theoretical grounding for model specification, and in the Discussion sections 4.7–4.8 for interpreting the empirical results.
Proposition 1 (Structural Identifiability). Let Y = (Y₁, ..., Yₖ) denote a vector of K observable SDG indicators and let C ∈ {1, ..., J} denote latent class membership. The latent classes are structurally identifiable as development regimes if the following conditions hold:
- (1)
- Local Independence: Conditional on class membership, the indicators are mutually independent: P(Y|C=j)=∏ₖP(Yₖ|C = j).
- (2)
- Class Separation: The class-conditional distributions are distinct: ∃k such that E[Yₖ|C = j] ≠ E[Yₖ|C = j′] for all j≠ j′.
- (3)
- Structural Correspondence: There exists a mapping φ: {1,...,J} → S to a set of structural configurations S such that class membership predicts structural characteristics: E[X|C = j]=μⱼ for structural covariates X.
- (4)
- Temporal Stability: Class assignments exhibit persistence: P(Cₜ₊₁=j|Cₜ=j)>P(Cₜ₊₁=j′|Cₜ = j) for j′ ≠ j.
Proof. We establish each condition sequentially.
Condition (1) ensures that the latent class C captures all systematic covariation among indicators. This is the standard identifying assumption for latent class models and is testable through bivariate residual diagnostics.
Condition (2) guarantees that classes are empirically distinguishable. With continuous indicators and Gaussian class-conditional distributions, this requires that the class-specific mean vectors μⱼ = E[Y|C = j] are distinct, which our ANOVA results confirm with F-statistics exceeding 900 for primary predictors across all years (see Table D2).
Condition (3) links statistical classes to substantive structural configurations. We operationalise this through ordered logistic regression of class membership on structural covariates (governance, digital infrastructure, health investment). The significant coefficients (p < 0.001) establish that classes correspond to systematically different structural profiles (see Table D1).
Condition (4) distinguishes structural regimes from transient states. Our transition matrices document that diagonal elements (persistence probabilities) exceed 0.95 for all classes across all year-pairs (see Tables C3a–C3e), thereby satisfying this condition. ∎
Corollary. Under Conditions (1)–(4), the latent classes identified by mixture modelling correspond to structurally distinct development regimes characterised by different institutional and technological configurations, rather than arbitrary statistical partitions of the SDG performance distribution.
Table E1.
Conceptual Summary of Conditions in Proposition 1.
| Condition | Interpretation | Empirical Validation |
|---|---|---|
| (1) Local Independence | SDG indicators share no residual correlation beyond class | Model fit statistics (Table C1) |
| (2) Class Separation | Classes have distinct SDG performance profiles | ANOVA F-statistics >900 (Table D2) |
| (3) Structural Correspondence | Classes map to different structural configurations | Ordered logit coefficients p<0.001 (Table D1) |
| (4) Temporal Stability | Class membership persists over time | Persistence rates >95% (Tables C3a–C3e) |
Note: This table summarises the four conditions required for structural identifiability of latent development regimes and provides cross-references to the empirical evidence presented in earlier appendices.
References
- Acemoglu, D.; Johnson, S.; Robinson, J. A. Institutions as a fundamental cause of long-run growth. In Handbook of Economic Growth; Aghion, P., Durlauf, S. N., Eds.; Elsevier, 2005; Vol. 1A, pp. 385–472. [Google Scholar]
- Acemoglu, D.; Robinson, J. A. Why nations fail: The origins of power, prosperity, and poverty; Crown Business, 2012. [Google Scholar]
- Aghion, P.; Howitt, P. A model of growth through creative destruction. Econometrica 1992, 60(2), 323–351. [Google Scholar] [CrossRef]
- Arthur, W. B. Increasing returns and path dependence in the economy; University of Michigan Press, 1994. [Google Scholar]
- Becker, G. S. Human capital: A theoretical and empirical analysis, with special reference to education . In National Bureau of Economic Research; 1964; Available online: https://www.nber.org/books-and-chapters/human-capital-theoretical-and-empirical-analysis-special-reference-education-first-edition.
- Cai, W.; Song, X.; Zhang, P.; Xin, Z.; Zhou, Y.; Wang, Y.; Wei, W. Latent profile analysis of sustainable development goals performance across countries. Nature Communications 2023, 14, 1234. [Google Scholar]
- Capoccia, G.; Kelemen, R. D. The study of critical junctures: Theory, narrative, and counterfactuals in historical institu-tionalism. World Politics 2007, 59(3), 341–369. [Google Scholar] [CrossRef]
- Collins, L. M.; Lanza, S. T. Latent Class and Latent Transition Analysis: With Applications in the Social, Behavioral, and Health Sciences, 1st edn; Wiley, 2009. [Google Scholar] [CrossRef]
- David, P. A. Clio and the economics of QWERTY. American Economic Review 1985, 75(2), 332–337. [Google Scholar]
- Dayton, C. Latent Class Scaling Analysis; SAGE Publications, Inc., 1998. [Google Scholar] [CrossRef]
- Dempster, A. P.; Laird, N. M.; Rubin, D. B. Maximum Likelihood from Incomplete Data via the EM Algorithm. Journal of the Royal Statistical Society. Series B (Methodological) 1977, 39(1), 1–38. Available online: http://www.jstor.org/stable/2984875. [CrossRef]
- Ehrlich, P. R.; Holdren, J. P. Impact of Population Growth. Science 1971, 171(3977), 1212–1217. [Google Scholar] [CrossRef]
- Enders, C. K. Applied Missing Data Analysis; Guilford Press, 2010. [Google Scholar]
- Fukuda-Parr, S.; McNeill, D. Knowledge and politics in setting and measuring the SDGs: Introduction to special issue. Global Policy 2019, 10(S1), 5–15. [Google Scholar] [CrossRef]
- Ghosh, J. Missing data. In Encyclopedia of research design; Salkind, N. J., Ed.; SAGE Publications, 2010; pp. 849–853. [Google Scholar]
- Greif, A. Institutions and the path to the modern economy: Lessons from medieval trade; Cambridge University Press, 2006. [Google Scholar]
- Hall, P. A.; Soskice, D. Varieties of capitalism: The institutional foundations of comparative advantage; Oxford University Press, 2001. [Google Scholar]
- ITU. Measuring Digital Development: Facts and Figures 2023. International Telecommunication Union. 2023. Available online: https://www.itu.int/itu-d/reports/statistics/.
- ITU. Digital Infrastructure Investment Initiative . 2024a. Available online: https://www.itu.int/hub/2025/01/digital-infrastructure-investment-where-will-the-billions-come-from/.
- ITU. Facts and Figures 2024: Laying the foundation for digital transformation. ITU Publications. 2024b. Available online: https://www.itu.int/itu-d/reports/statistics/2024/11/21/ff24/.
- Lazarsfeld, P. F.; Henry, N. W. Latent Structure Analysis; Houghton Mifflin, 1968. [Google Scholar]
- Liashenko, O.; Pavlova, O.; Pavlov, K.; Lechowicz, T.; Szarota, R.; Nagara, M.; Hrytsiyk, N. Unveiling tipping points in European sustainability: A nonlinear MARS approach to people, planet, and prosperity. Sustainability 2025, 17(19), 8692. [Google Scholar] [CrossRef]
- Mc Cutcheon, A. L. Latent Class Analysis; SAGE Publications, Inc, 1987. [Google Scholar]
- Nielsen, L. Classifications of countries based on their level of development: How it is done and how it could be done. International Monetary Fund Working Paper 2011, 11(31). [Google Scholar] [CrossRef]
- Nielsen, L. How to classify countries based on their level of development. Social Indicators Research 2013, 114(3), 1087–1107. [Google Scholar] [CrossRef]
- North, D. C. Institutions, institutional change and economic performance; Cambridge University Press, 1990. [Google Scholar]
- Nylund, K. L.; Asparouhov, T.; Muthén, B. O. Deciding on the Number of Classes in Latent Class Analysis and Growth Mixture Modeling: A Monte Carlo Simulation Study. Structural Equation Modeling: A Multidisciplinary Journal 2007, 14(4), 535–569. [Google Scholar] [CrossRef]
- Page, S. E. Path dependence. Quarterly Journal of Political Science 2006, 1(1), 87–115. [Google Scholar] [CrossRef]
- Pierson, P. Increasing returns, path dependence, and the study of politics. American Political Science Review 2000, 94(2), 251–267. [Google Scholar] [CrossRef]
- Polyakov, M.; Kovács, T.; Kiss, T. Clustering countries by sustainable development goals: A data-driven approach. Jour-Nal of Cleaner Production 2021, 315, 128123. [Google Scholar]
- Portulans Institute. Network Readiness Index 2024: Methodological Framework; Portulans Institute, 2024. [Google Scholar]
- Rehman, N. U.; Hysa, E.; Mao, X. Does public health expenditure matter for economic development? The role of institutional quality for the EU framework. International Journal of Environmental Research and Public Health 2023, 20(4), 3548. [Google Scholar] [CrossRef]
- Rockström, J.; Steffen, W.; Noone, K. A safe operating space for humanity. Nature 2009, 461(7263), 472–475. [Google Scholar] [CrossRef]
- Rodrik, D.; Subramanian, A.; Trebbi, F. Institutions rule: The primacy of institutions over geography and integration in economic development. Journal of Economic Growth 2004, 9(2), 131–165. [Google Scholar] [CrossRef]
- Romer, P. M. Endogenous technological change. Journal of Political Economy 1990, 98(5(Part 2), 71–102. [Google Scholar] [CrossRef]
- Sachs, J. D.; Lafortune, G.; Fuller, G. Sustainable Development Report 2023: Implementing the SDG stimulus; Cambridge University Press, 2023. [Google Scholar] [CrossRef]
- Sachs, J. D.; Lafortune, G.; Fuller, G. Sustainable Development Report 2024: The SDGs and the UN Summit of the Future . In Sustainable Development Solutions Network; 2024. [Google Scholar] [CrossRef]
- Schmidt-Traub, G.; Kroll, C.; Teksoz, K.; Durand-Delacre, D.; Sachs, J. D. National baselines for the Sustainable Development Goals assessed in the SDG Index and Dashboards. Nature Geoscience 2017, 10(8), 547–555. [Google Scholar] [CrossRef]
- Şit, A.; Radulescu, M.; Güneş, H.; Şit, M. Rethinking of government institutions and governance quality indicators on economic growth in Sub-Saharan African countries. Journal of the Knowledge Economy 2024, 15, 20883–20905. [Google Scholar] [CrossRef]
- Solow, R. M. A Contribution to the Theory of Economic Growth. The Quarterly Journal of Economics 1956, 70(1), 65. [Google Scholar] [CrossRef]
- UN. The Sustainable Development Goals Report 2024: Leaving no one behind . In United Nations Publications; 2024; Available online: https://unstats.un.org/sdgs/report/2024/.
- White, I. R.; Royston, P.; Wood, A. M. Multiple imputation using chained equations: Issues and guidance for practice. Statistics in Medicine 2011, 30(4), 377–399. [Google Scholar] [CrossRef]
- Williams, R. Using the Margins Command to Estimate and Interpret Adjusted Predictions and Marginal Effects. The Stata Journal: Promoting Communications on Statistics and Stata 2012, 12(2), 308–331. [Google Scholar] [CrossRef]
- World Bank. Connectivity and networks . World Bank Digital Development. 2024a. Available online: https://www.worldbank.org/en/topic/digital/brief/connectivity-and-networks.
- World Bank. Worldwide Governance Indicators (WGI) 2024 update . World Bank Group. 2024b. Available online: https://www.worldbank.org/en/publication/worldwide-governance-indicators.
- Wu, X.; Chen, R.; Li, M.; Liu, J.; Chen, B.; Chen, G. Q.; Geng, Y.; Liu, G.; Tukker, A.; Yao, M. The disparities and development trajectories of nations in achieving the Sustainable Development Goals. Nature Communications 2025, 16, 585. [Google Scholar] [CrossRef]
Figure 1.
Mean SDG volatility across countries. Horizontal bar plots showing average coefficient of variation (CV) for the most and least volatile countries (2000–2024). Higher CV values indicate greater intertemporal variability in SDGs performance.
Figure 1.
Mean SDG volatility across countries. Horizontal bar plots showing average coefficient of variation (CV) for the most and least volatile countries (2000–2024). Higher CV values indicate greater intertemporal variability in SDGs performance.
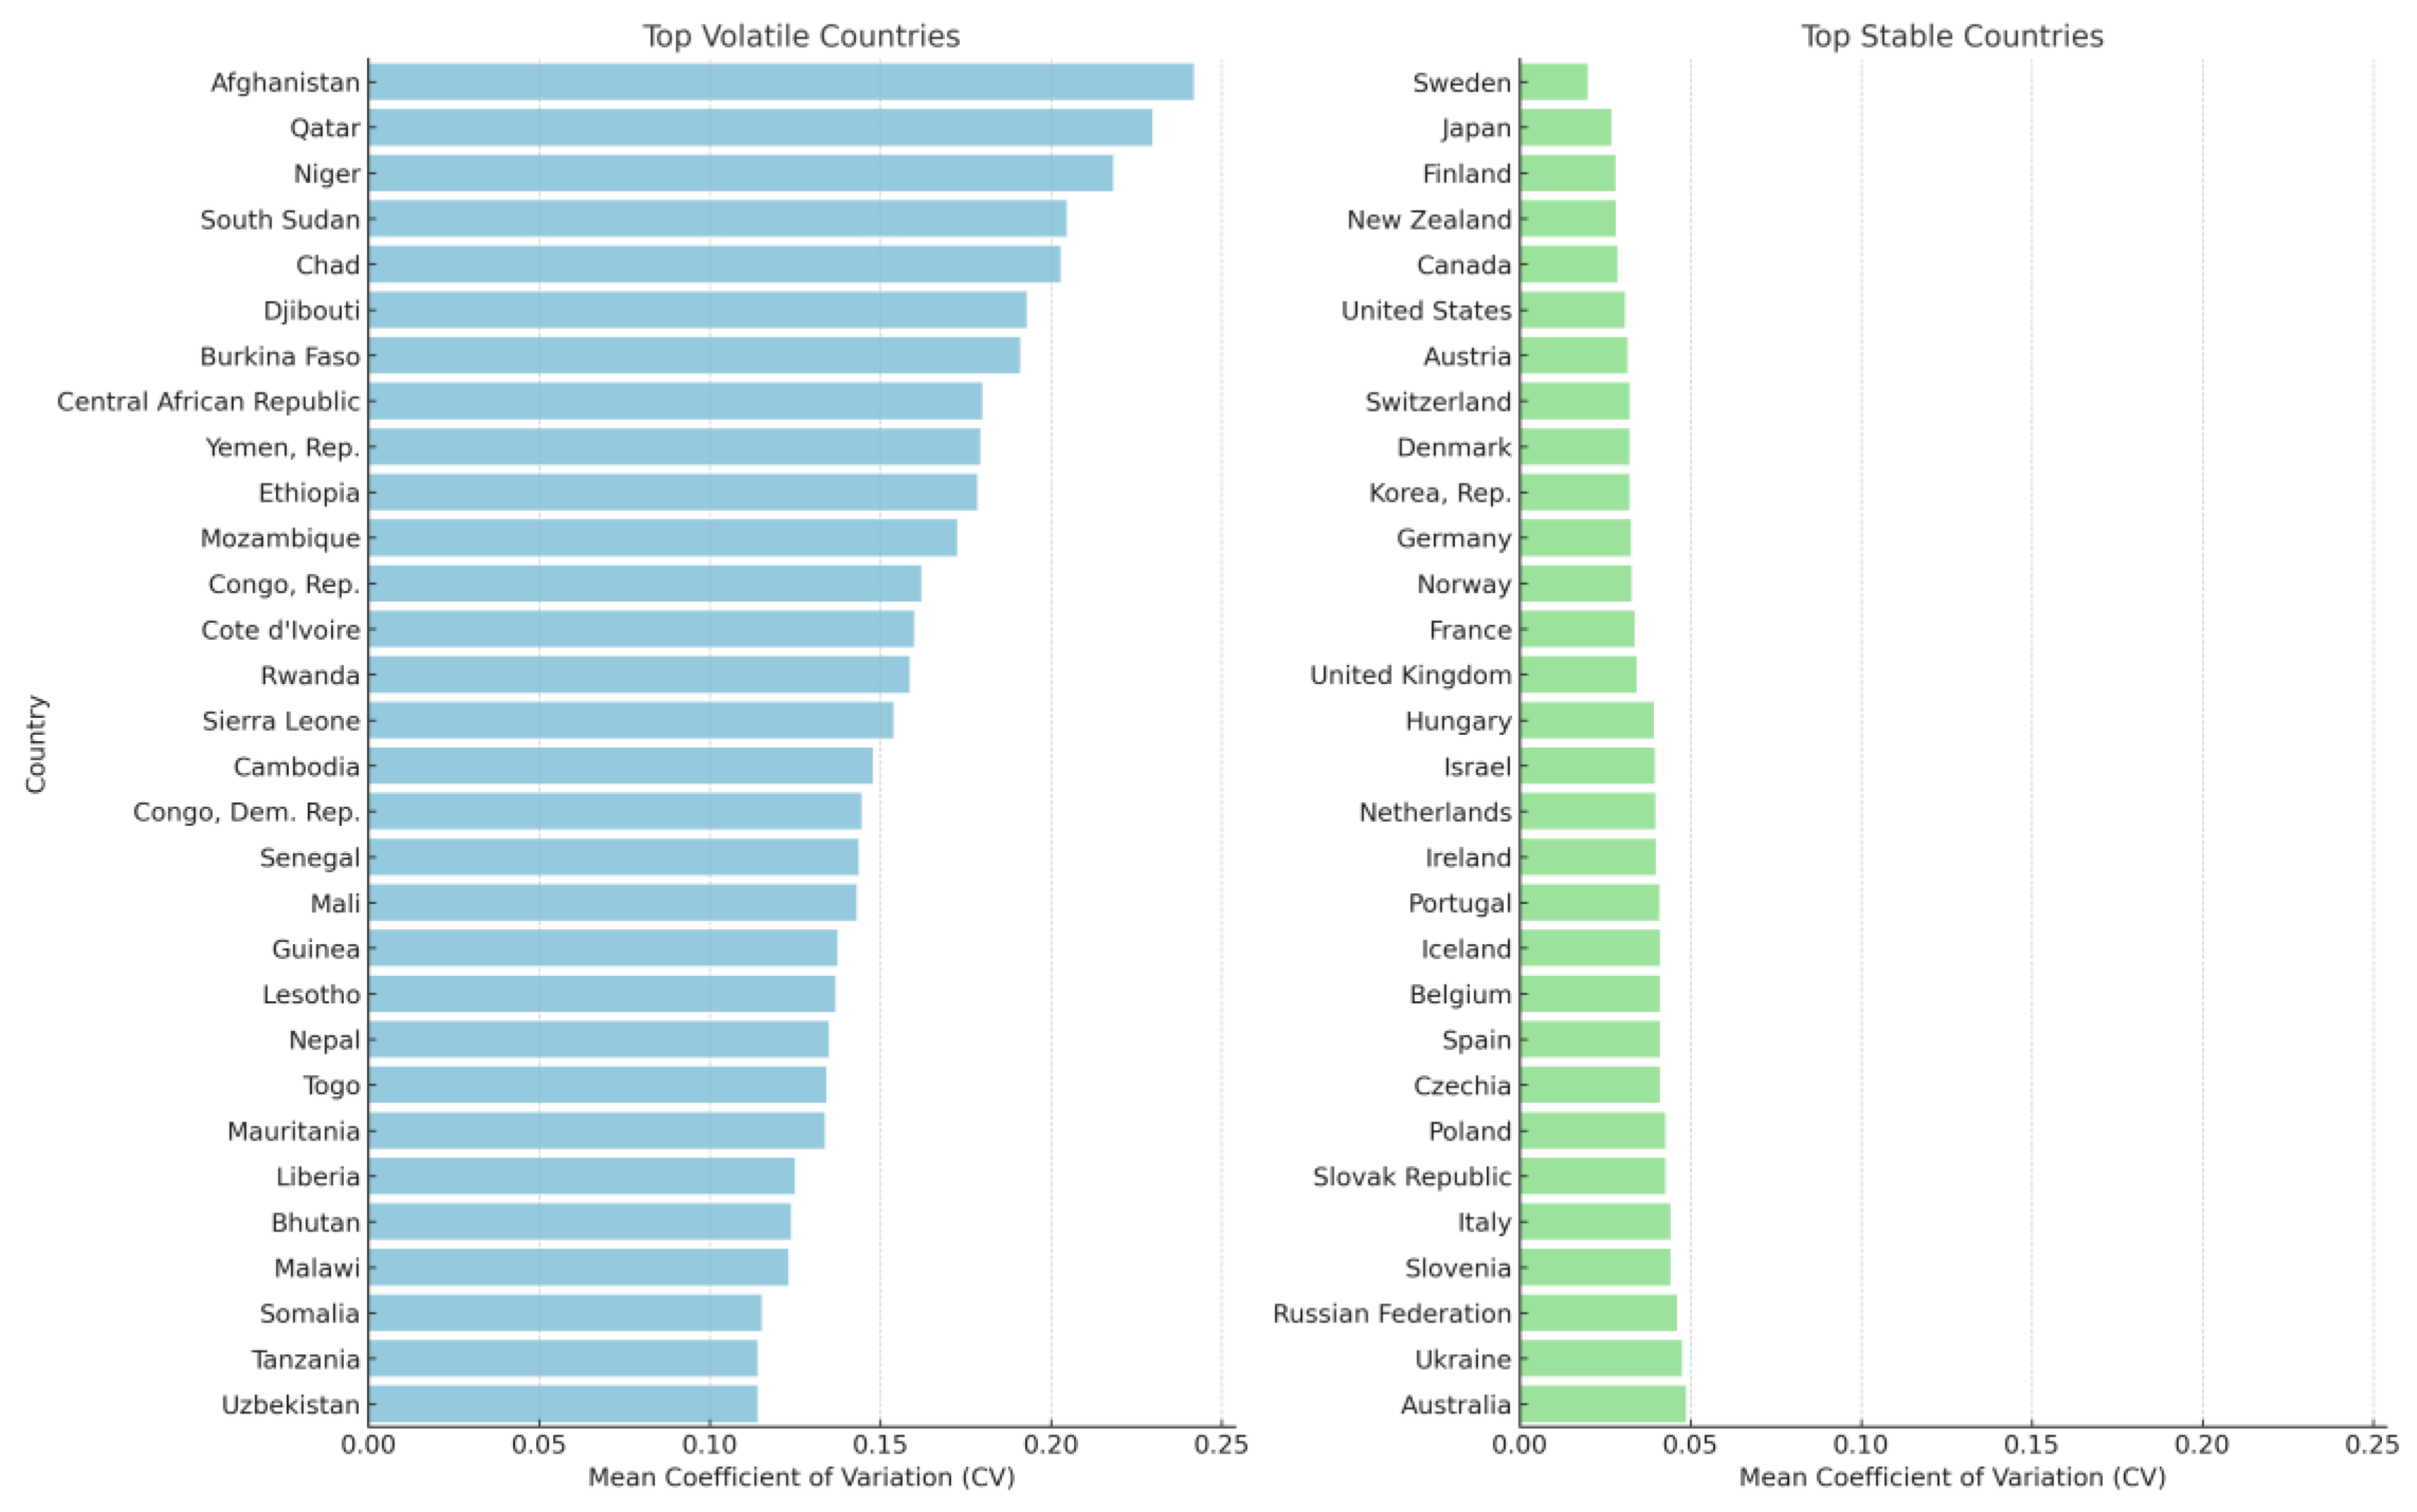
Figure 2.
Global distribution of SDG volatility. Note: Choropleth map of country-level average CV. Darker shades indicate higher volatility. The map reveals substantial within-region heterogeneity and patterns that transcend traditional geographic boundaries.
Figure 2.
Global distribution of SDG volatility. Note: Choropleth map of country-level average CV. Darker shades indicate higher volatility. The map reveals substantial within-region heterogeneity and patterns that transcend traditional geographic boundaries.
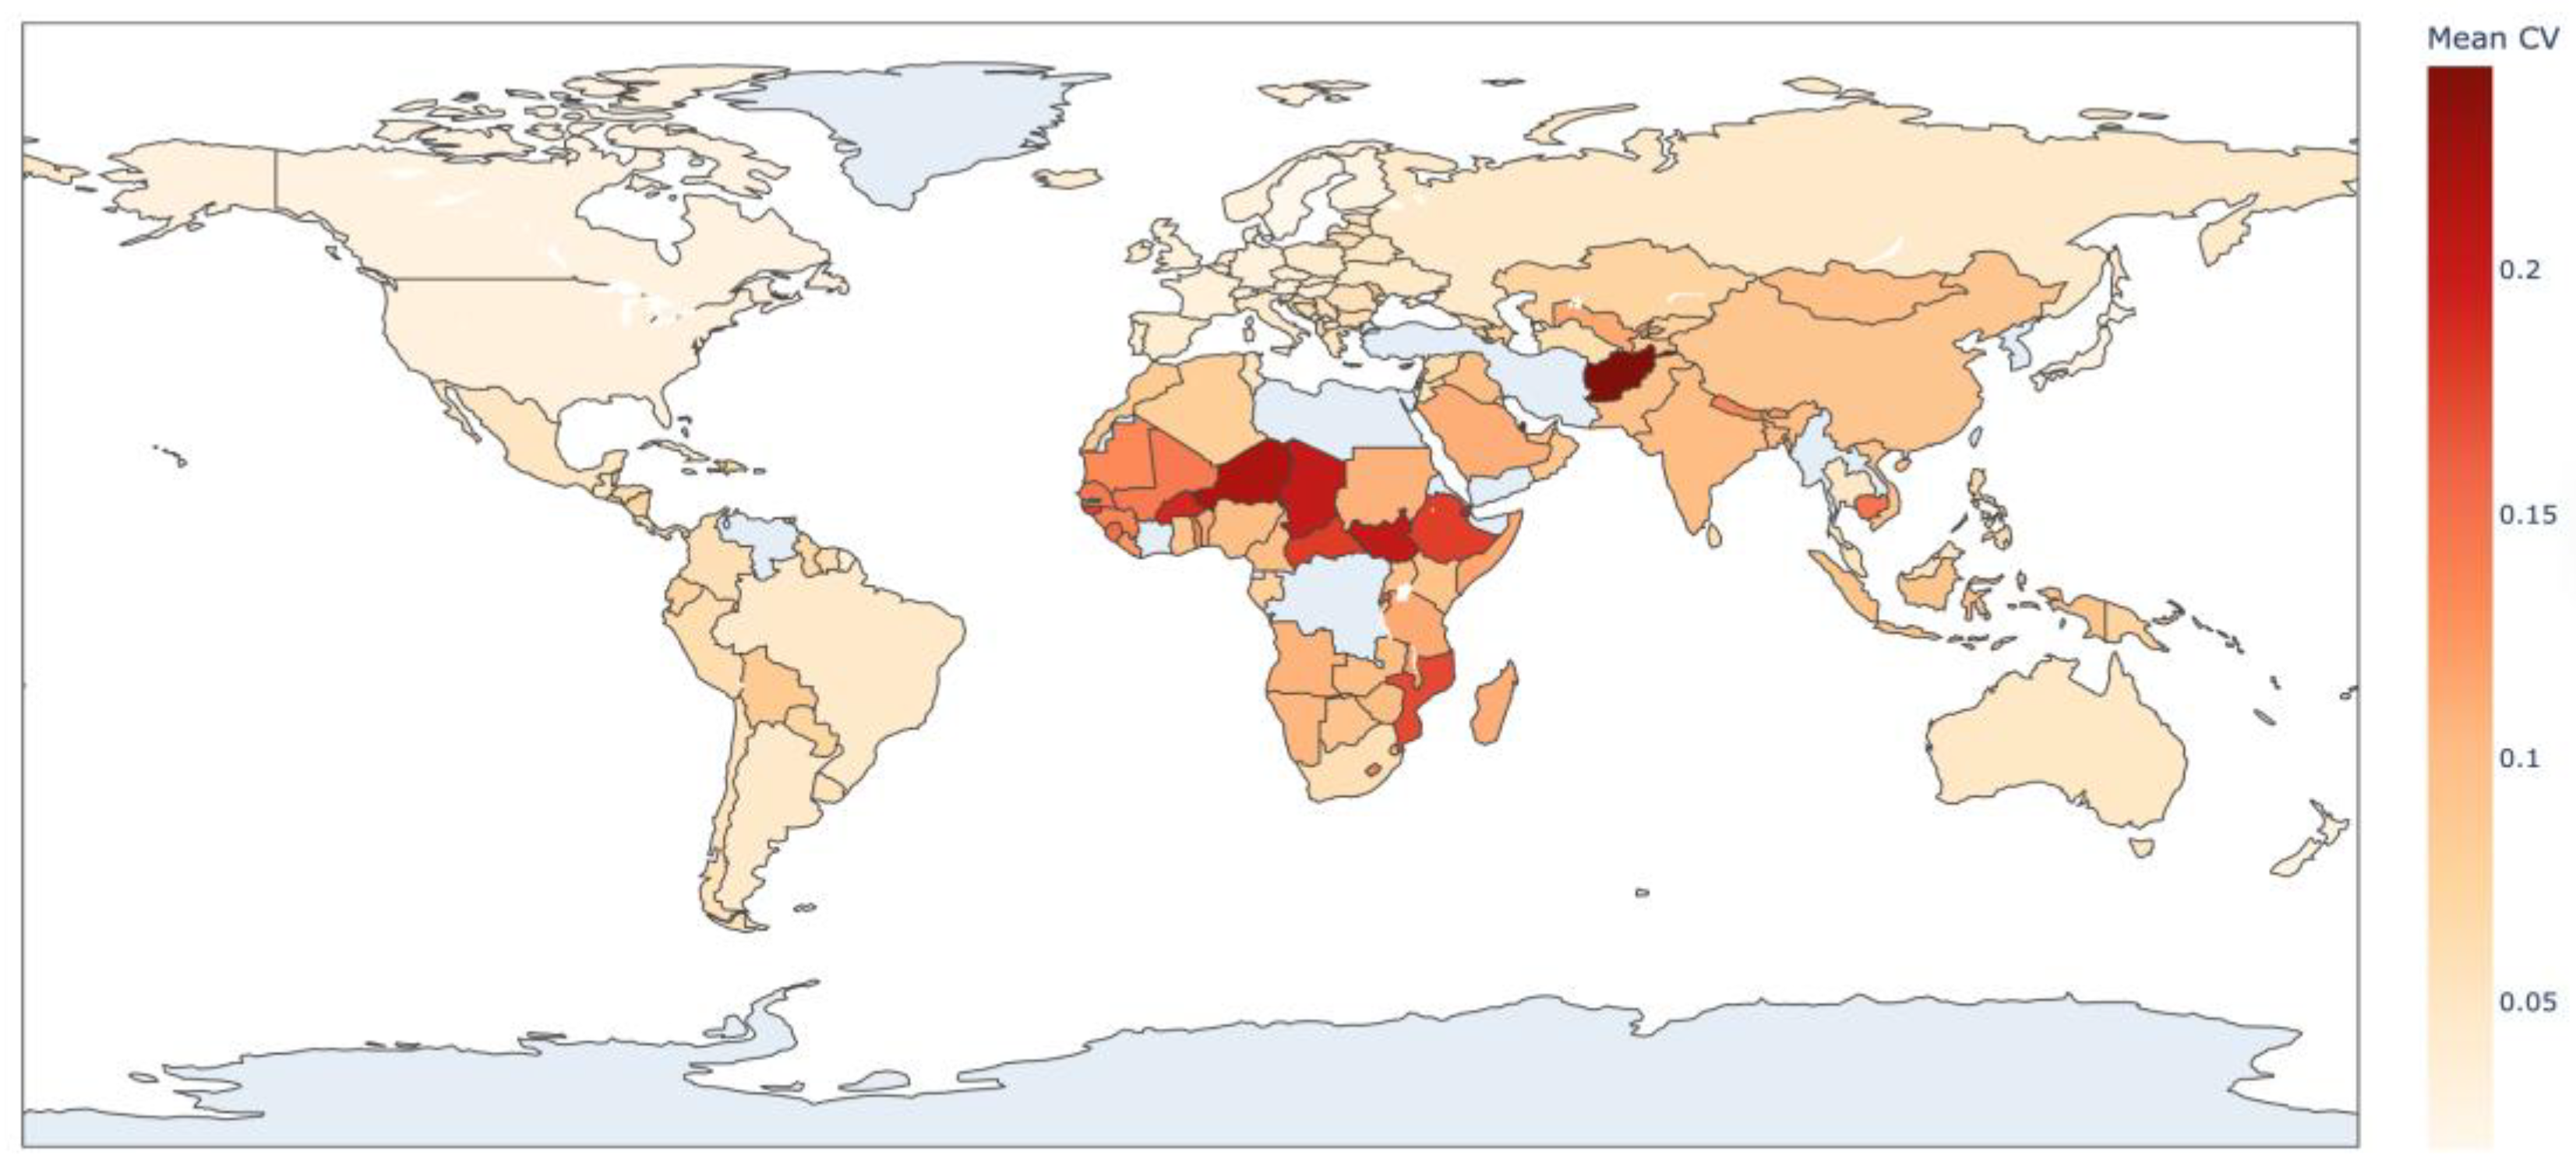
Figure 3.
Goal-level volatility across countries. Average coefficient of variation (CV) per SDG goal across all countries (2000–2024). Bars are ranked from highest to lowest volatility, highlighting systematic differences in temporal stability across policy domains.
Figure 3.
Goal-level volatility across countries. Average coefficient of variation (CV) per SDG goal across all countries (2000–2024). Bars are ranked from highest to lowest volatility, highlighting systematic differences in temporal stability across policy domains.
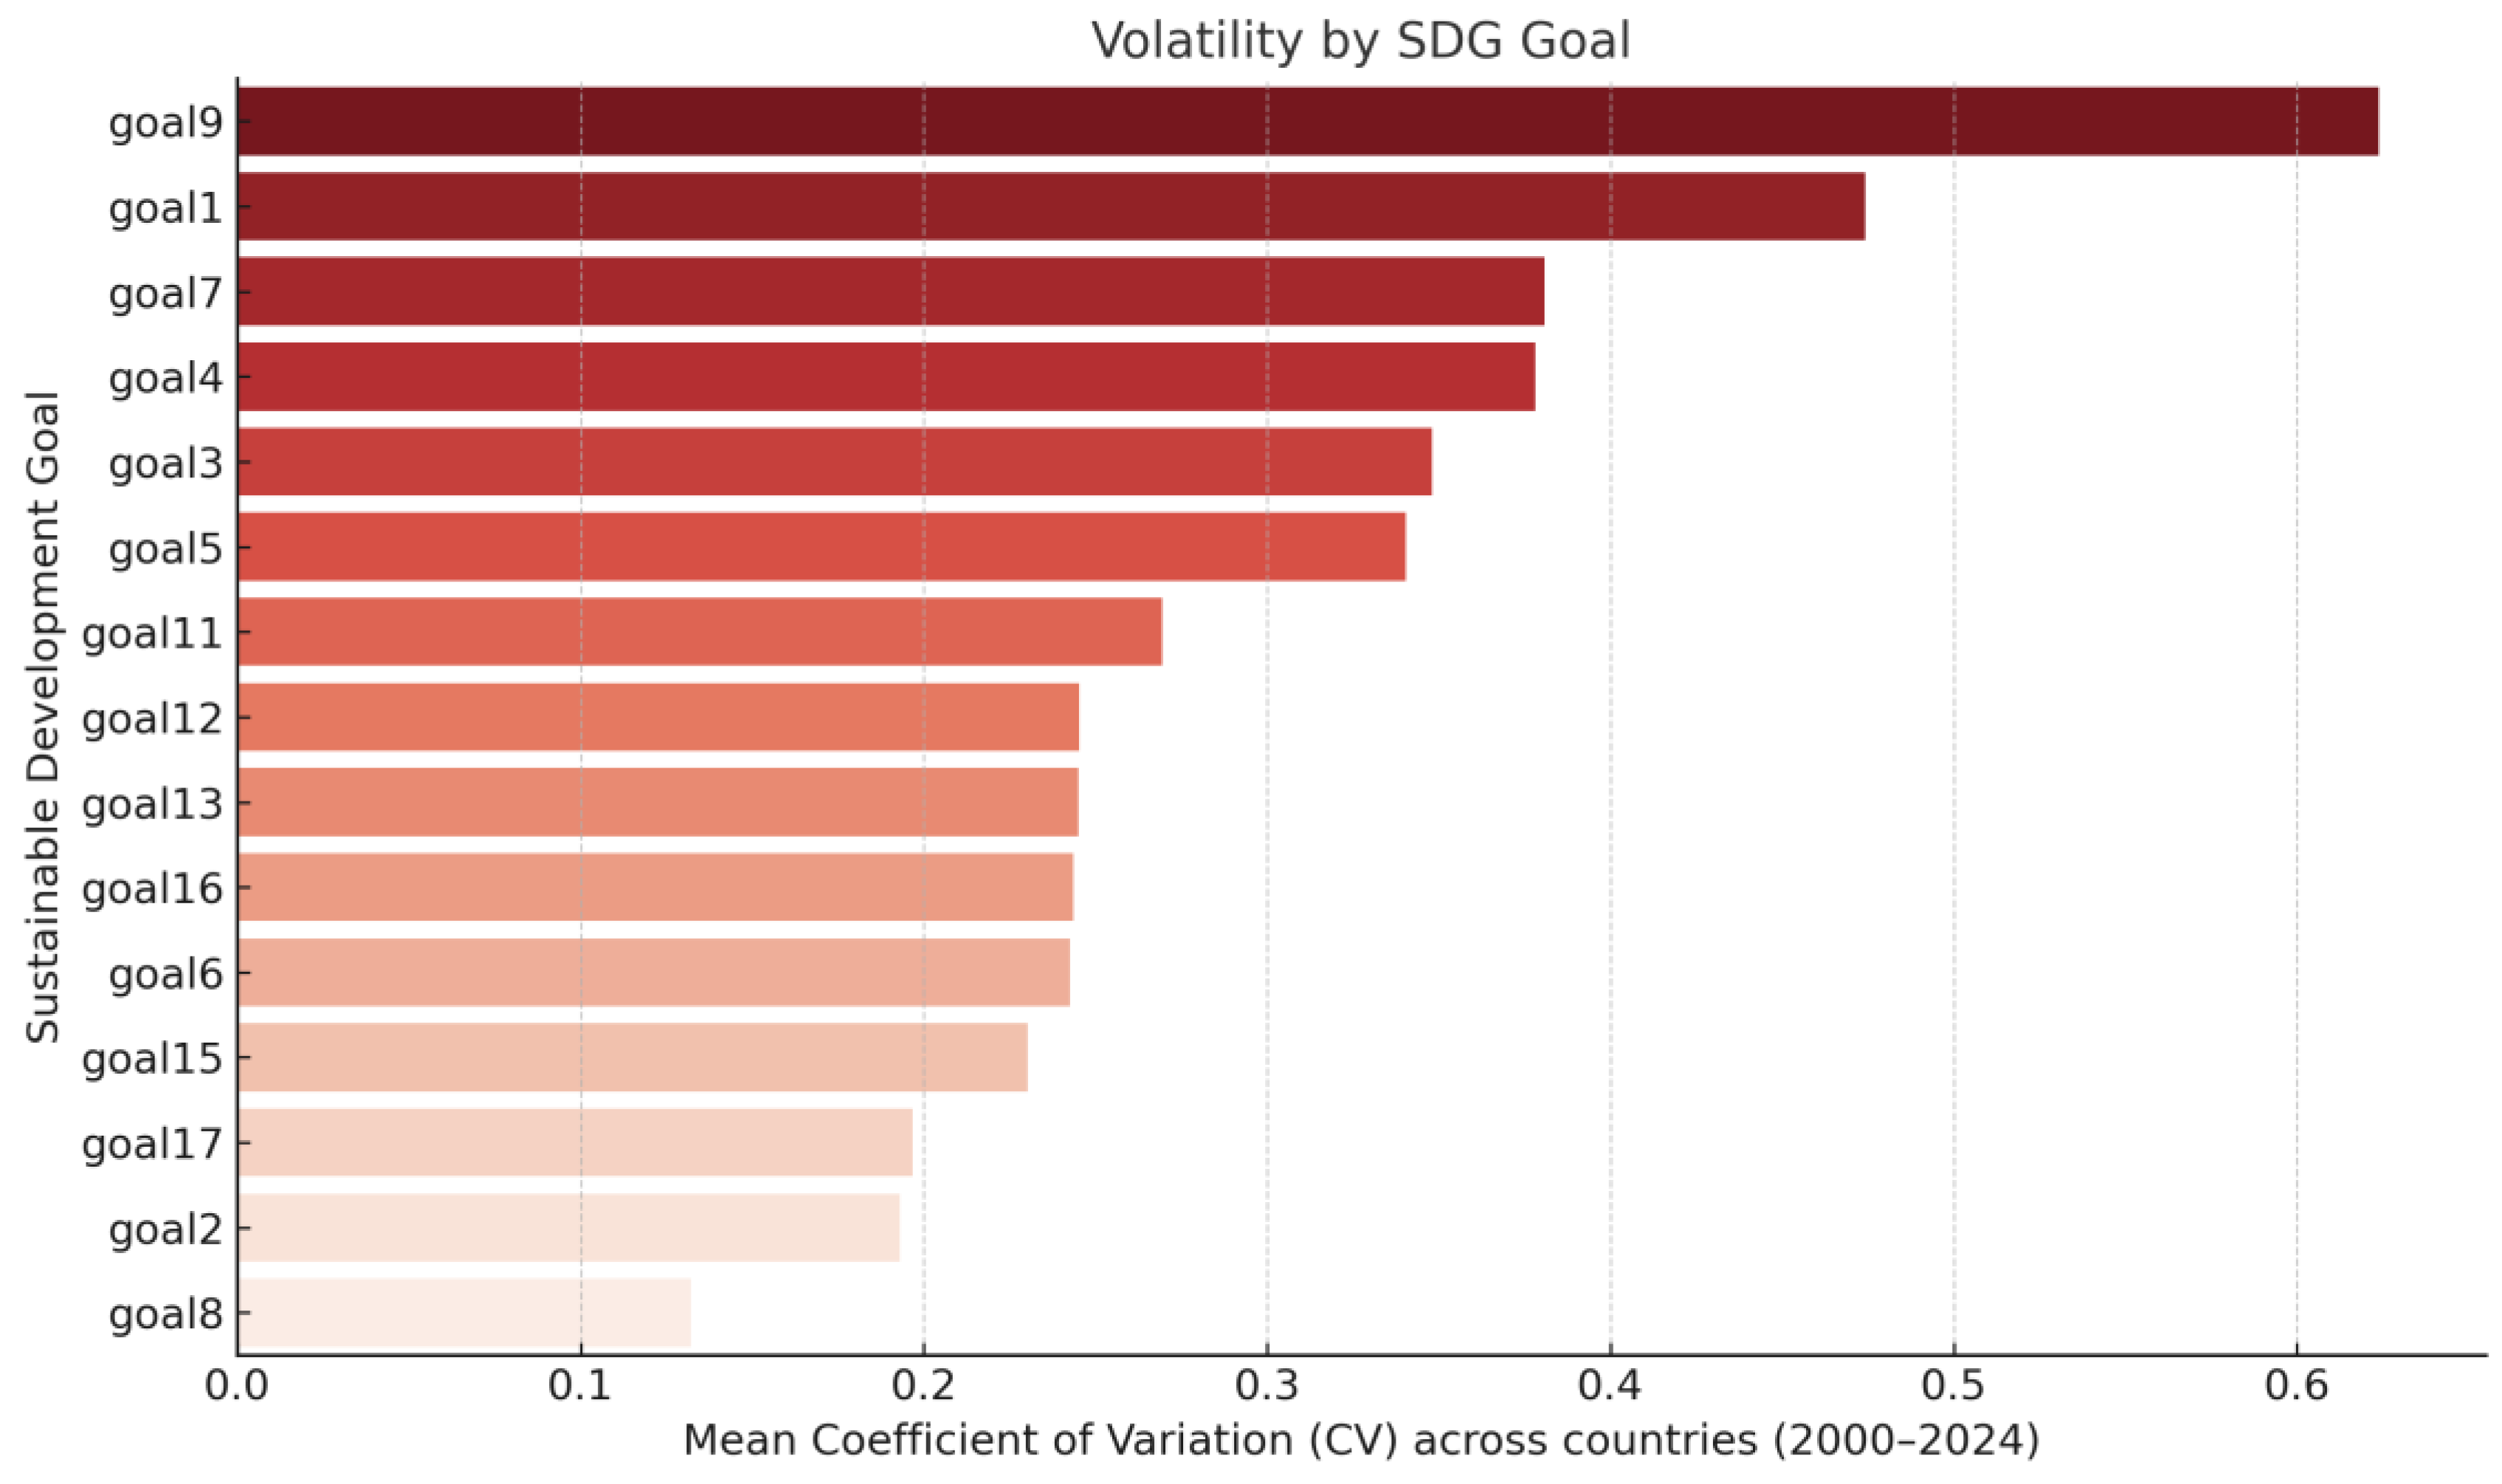
Figure 4.
Goal-level volatility in selected country pairs. Note: Multi-panel bar plots comparing SDG CVs across three illustrative country pairs with similar volatility profiles but different income levels and regional contexts. The visual similarity of patterns underscores the limitations of conventional classification schemes.
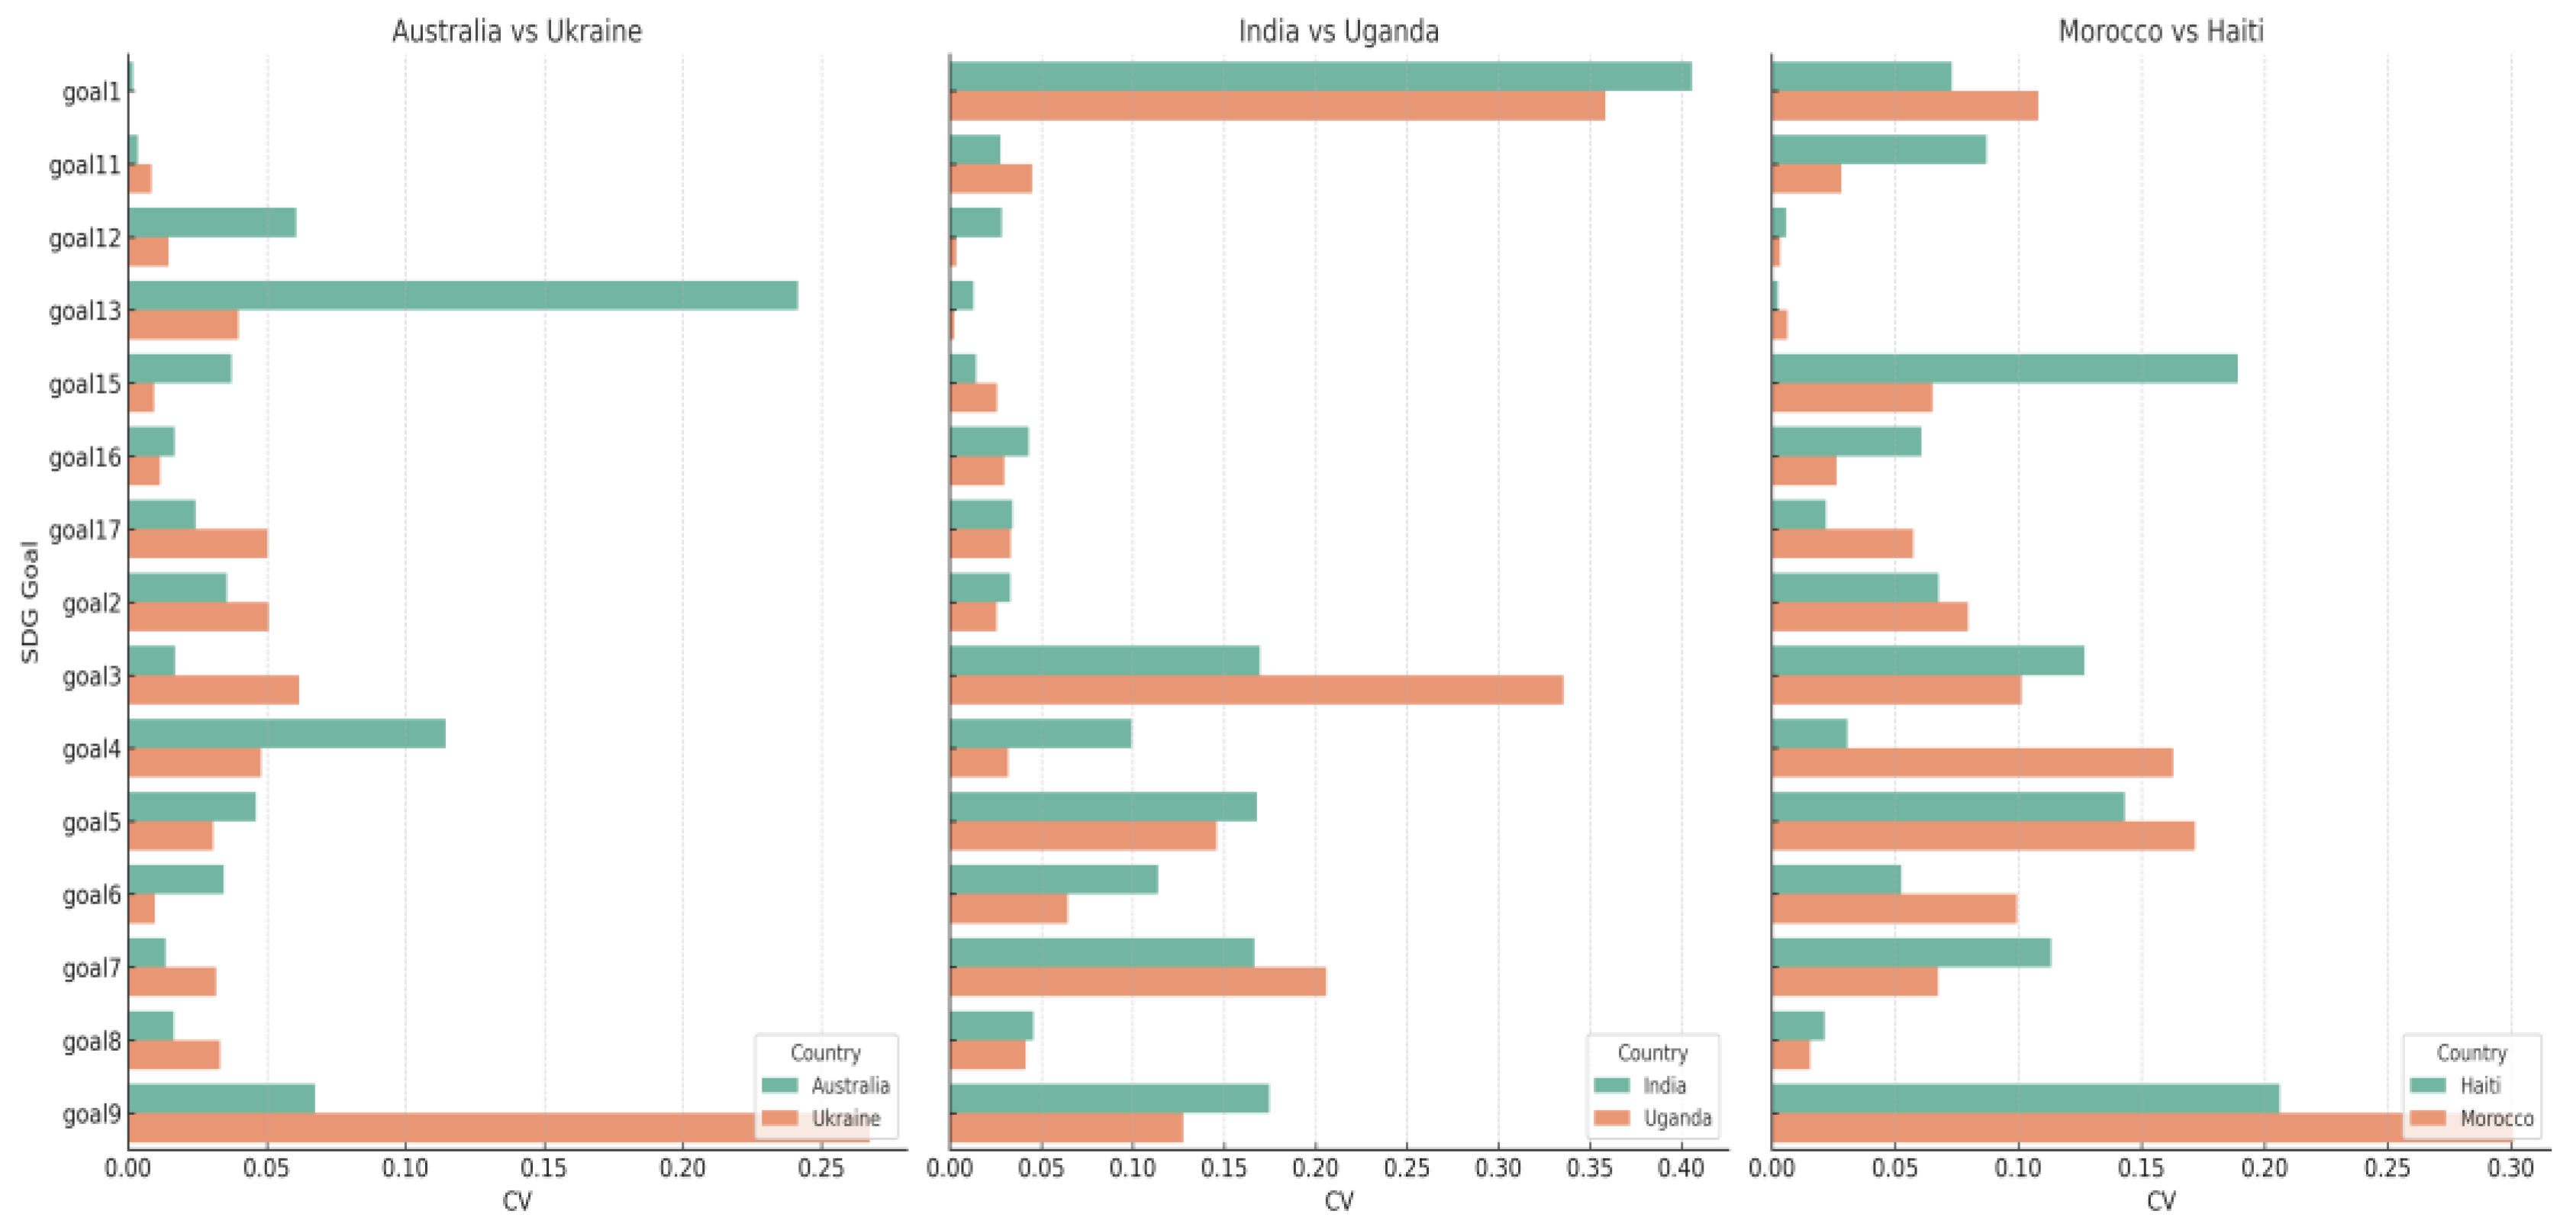
Figure 5.
Goal-level volatility by region. Average coefficient of variation for each SDG goal across regions (2000–2024). Note: Higher values indicate greater intertemporal volatility. The figure reveals substantial regional variation, with Sub-Saharan Africa displaying the highest volatility across multiple goals.
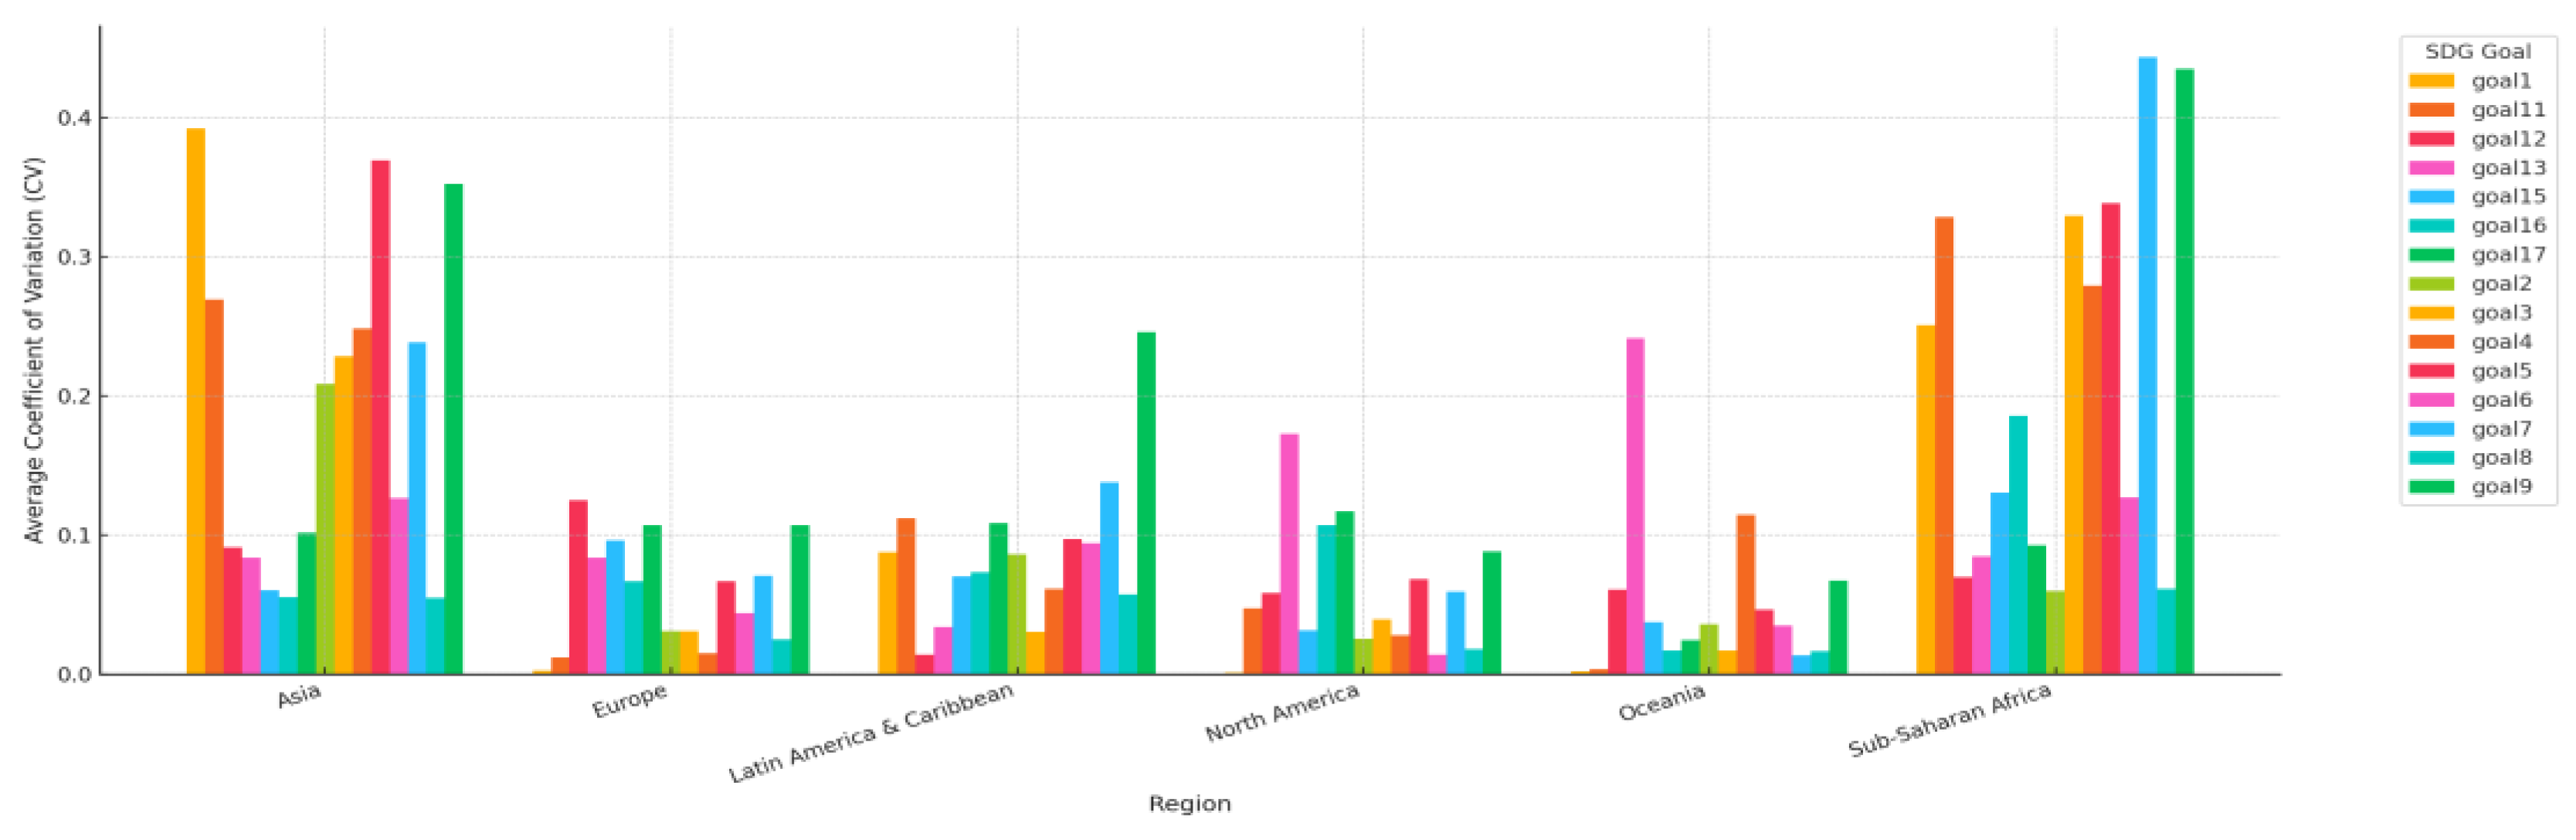
Figure 6.
SDG volatility by income group. Notes: Average coefficient of variation for each SDG goal by World Bank income classification (2000–2024). Volatility reflects intertemporal variation in SDG performance. The non-monotonic relationship between income and volatility suggests complex interactions between economic capacity and policy stability.
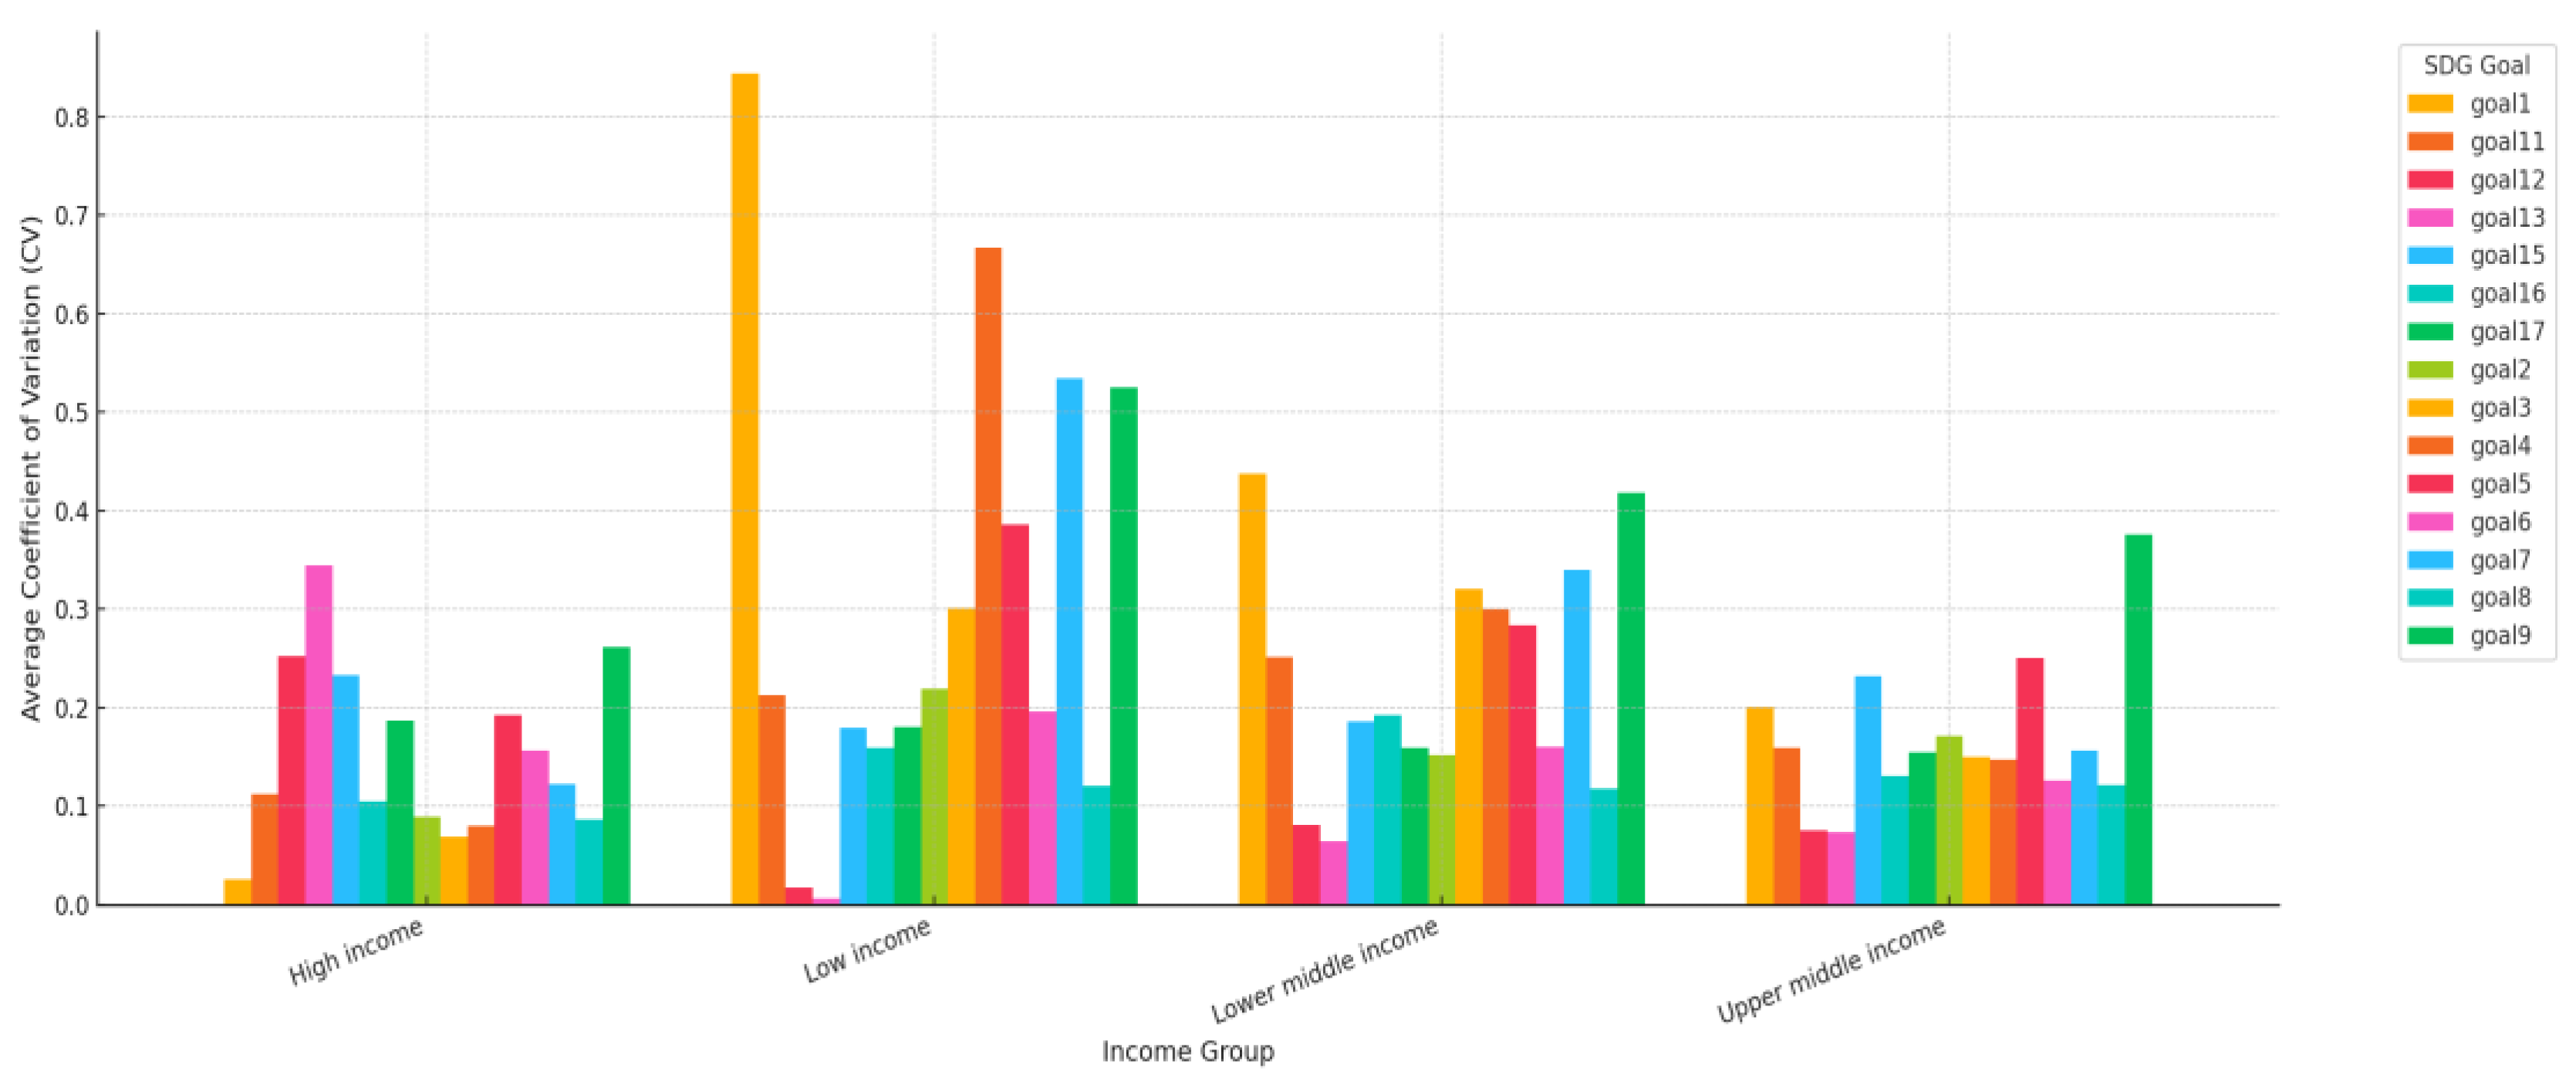
Figure 7.
Latent class profiles across years (2019–2024). Note: Each radar plot illustrates the average level of UN-reported achievement across 15 SDGs by latent class for each year.
Figure 7.
Latent class profiles across years (2019–2024). Note: Each radar plot illustrates the average level of UN-reported achievement across 15 SDGs by latent class for each year.
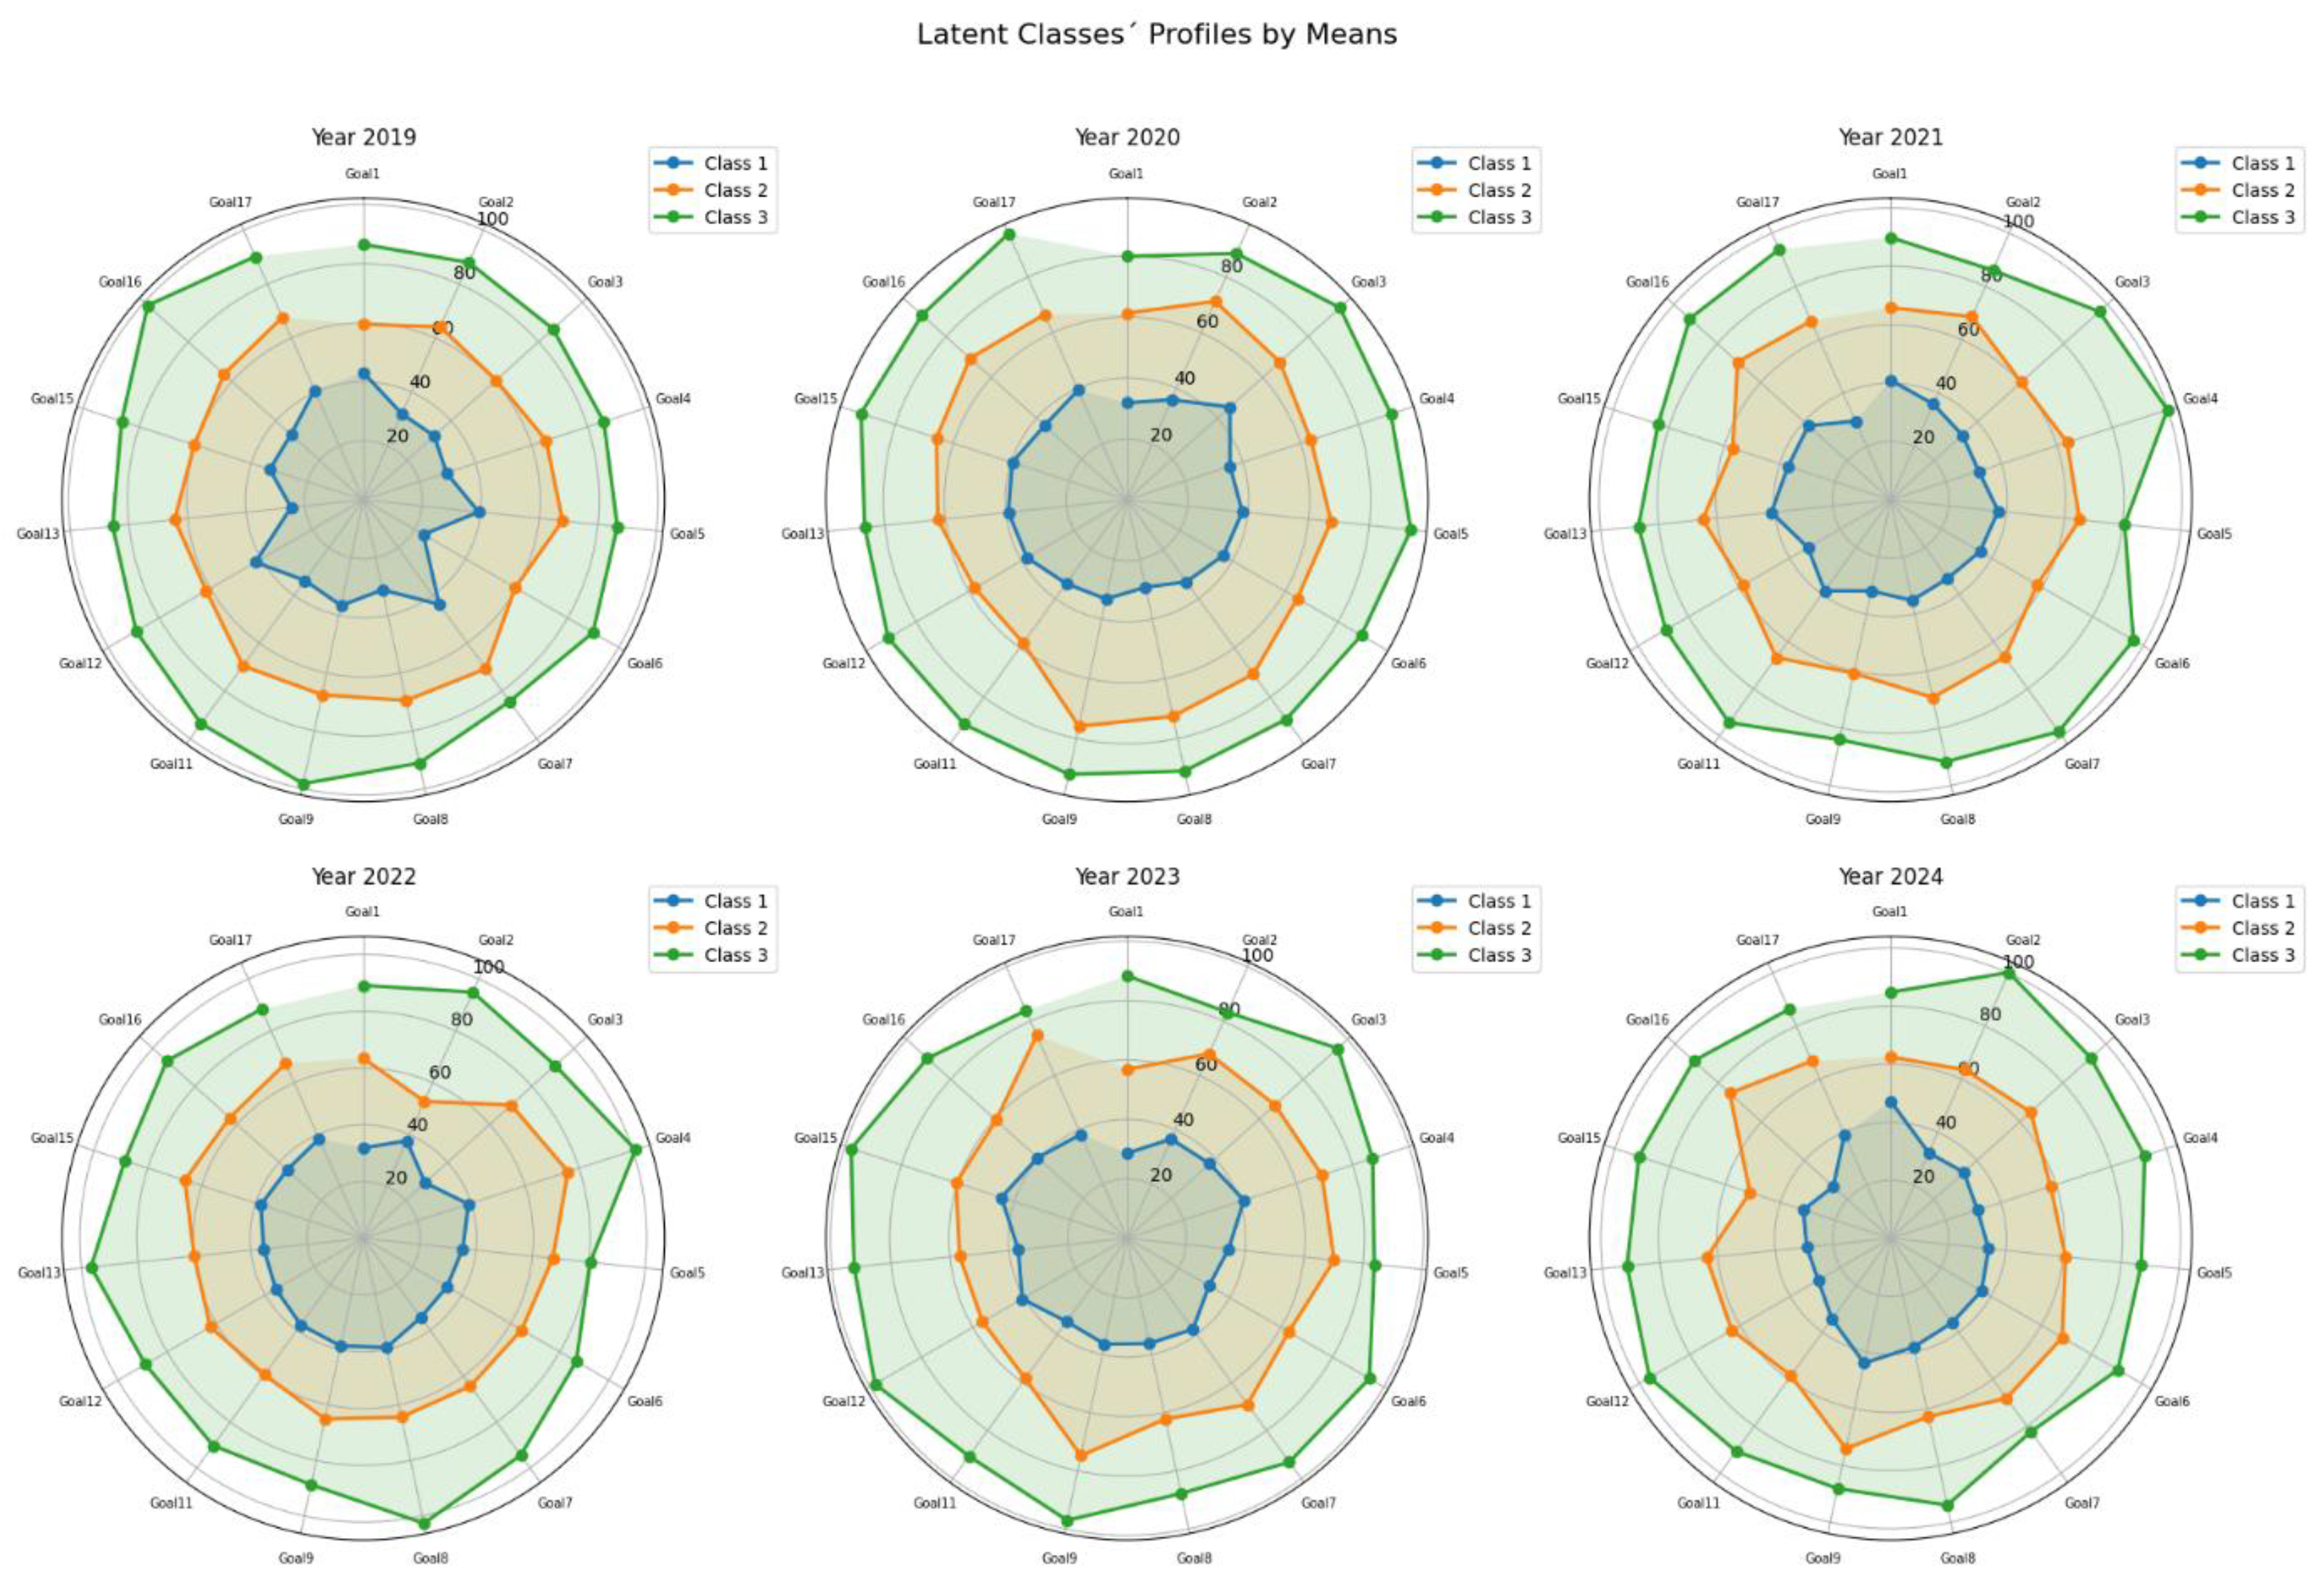
Figure 8.
Transition matrices from 2019 to 2024. Notes: Each panel visualises the number of countries that transitioned between latent classes across consecutive years. Rows represent the latent class assignment in year t, and columns represent class membership in year t+1. The intensity of the cell shading corresponds to the number of countries in each transition path. High values on the diagonal indicate regime persistence.
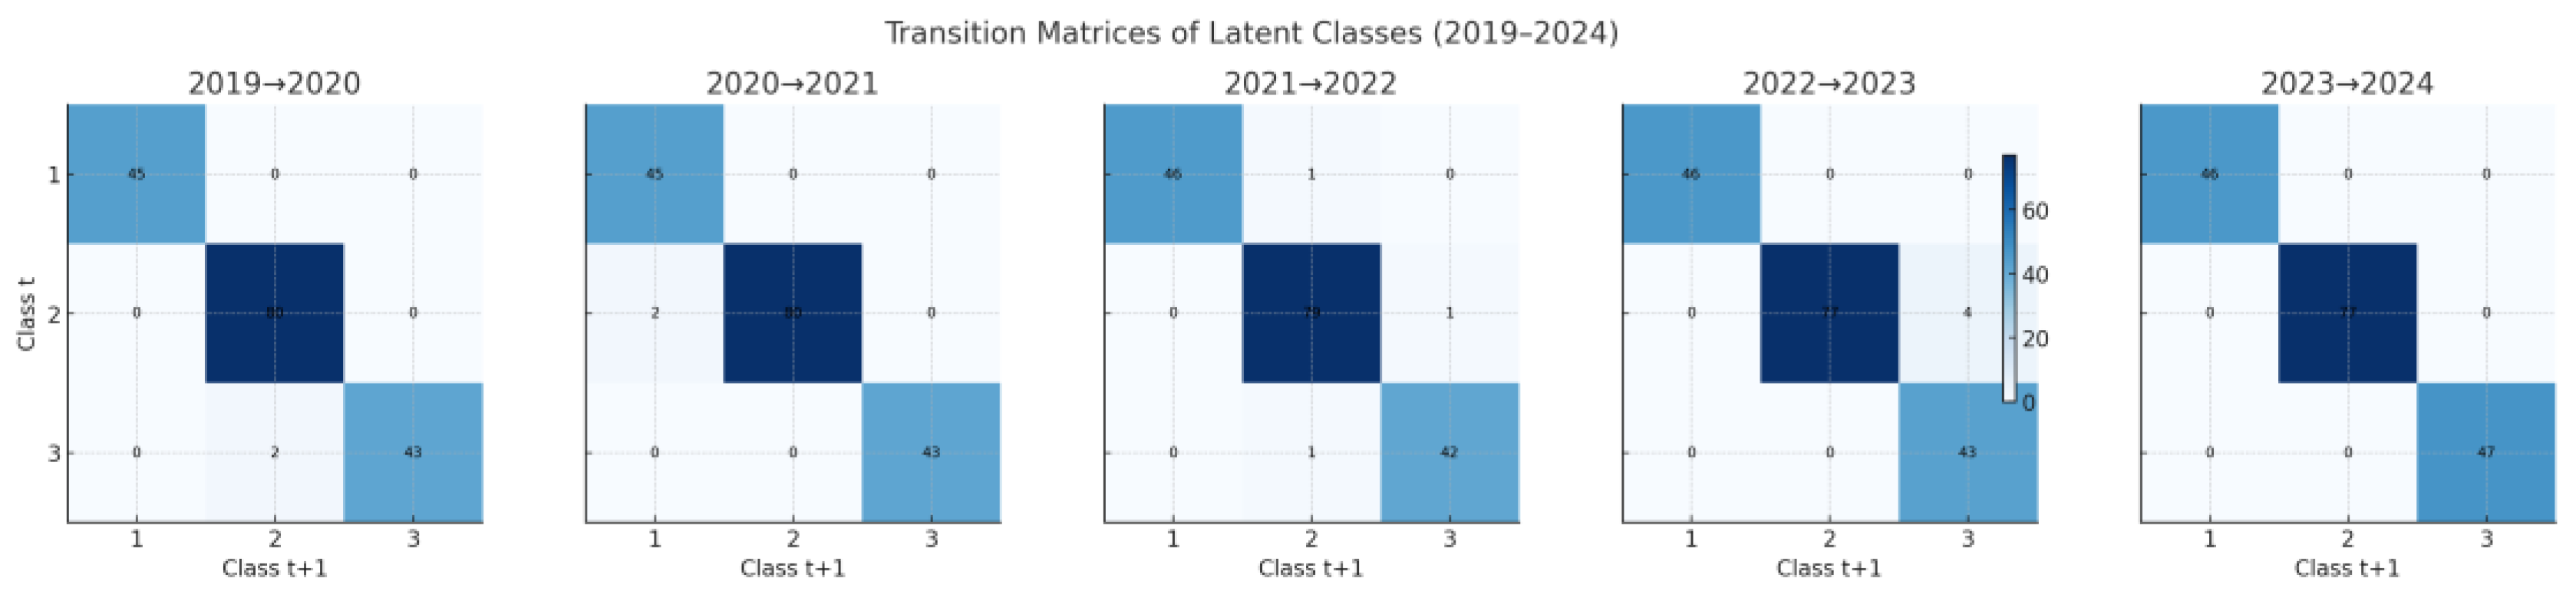
Figure 9.
Alluvial diagram (2019–2024). Notes: The width of each stream represents the number of countries moving between (or remaining within) Classes 1 (low), 2 (moderate), and 3 (high). The stability of most streams reflects strong temporal consistency in country groupings, with limited upward or downward transitions. The diagram reveals that most countries appear locked into their respective performance trajectories.
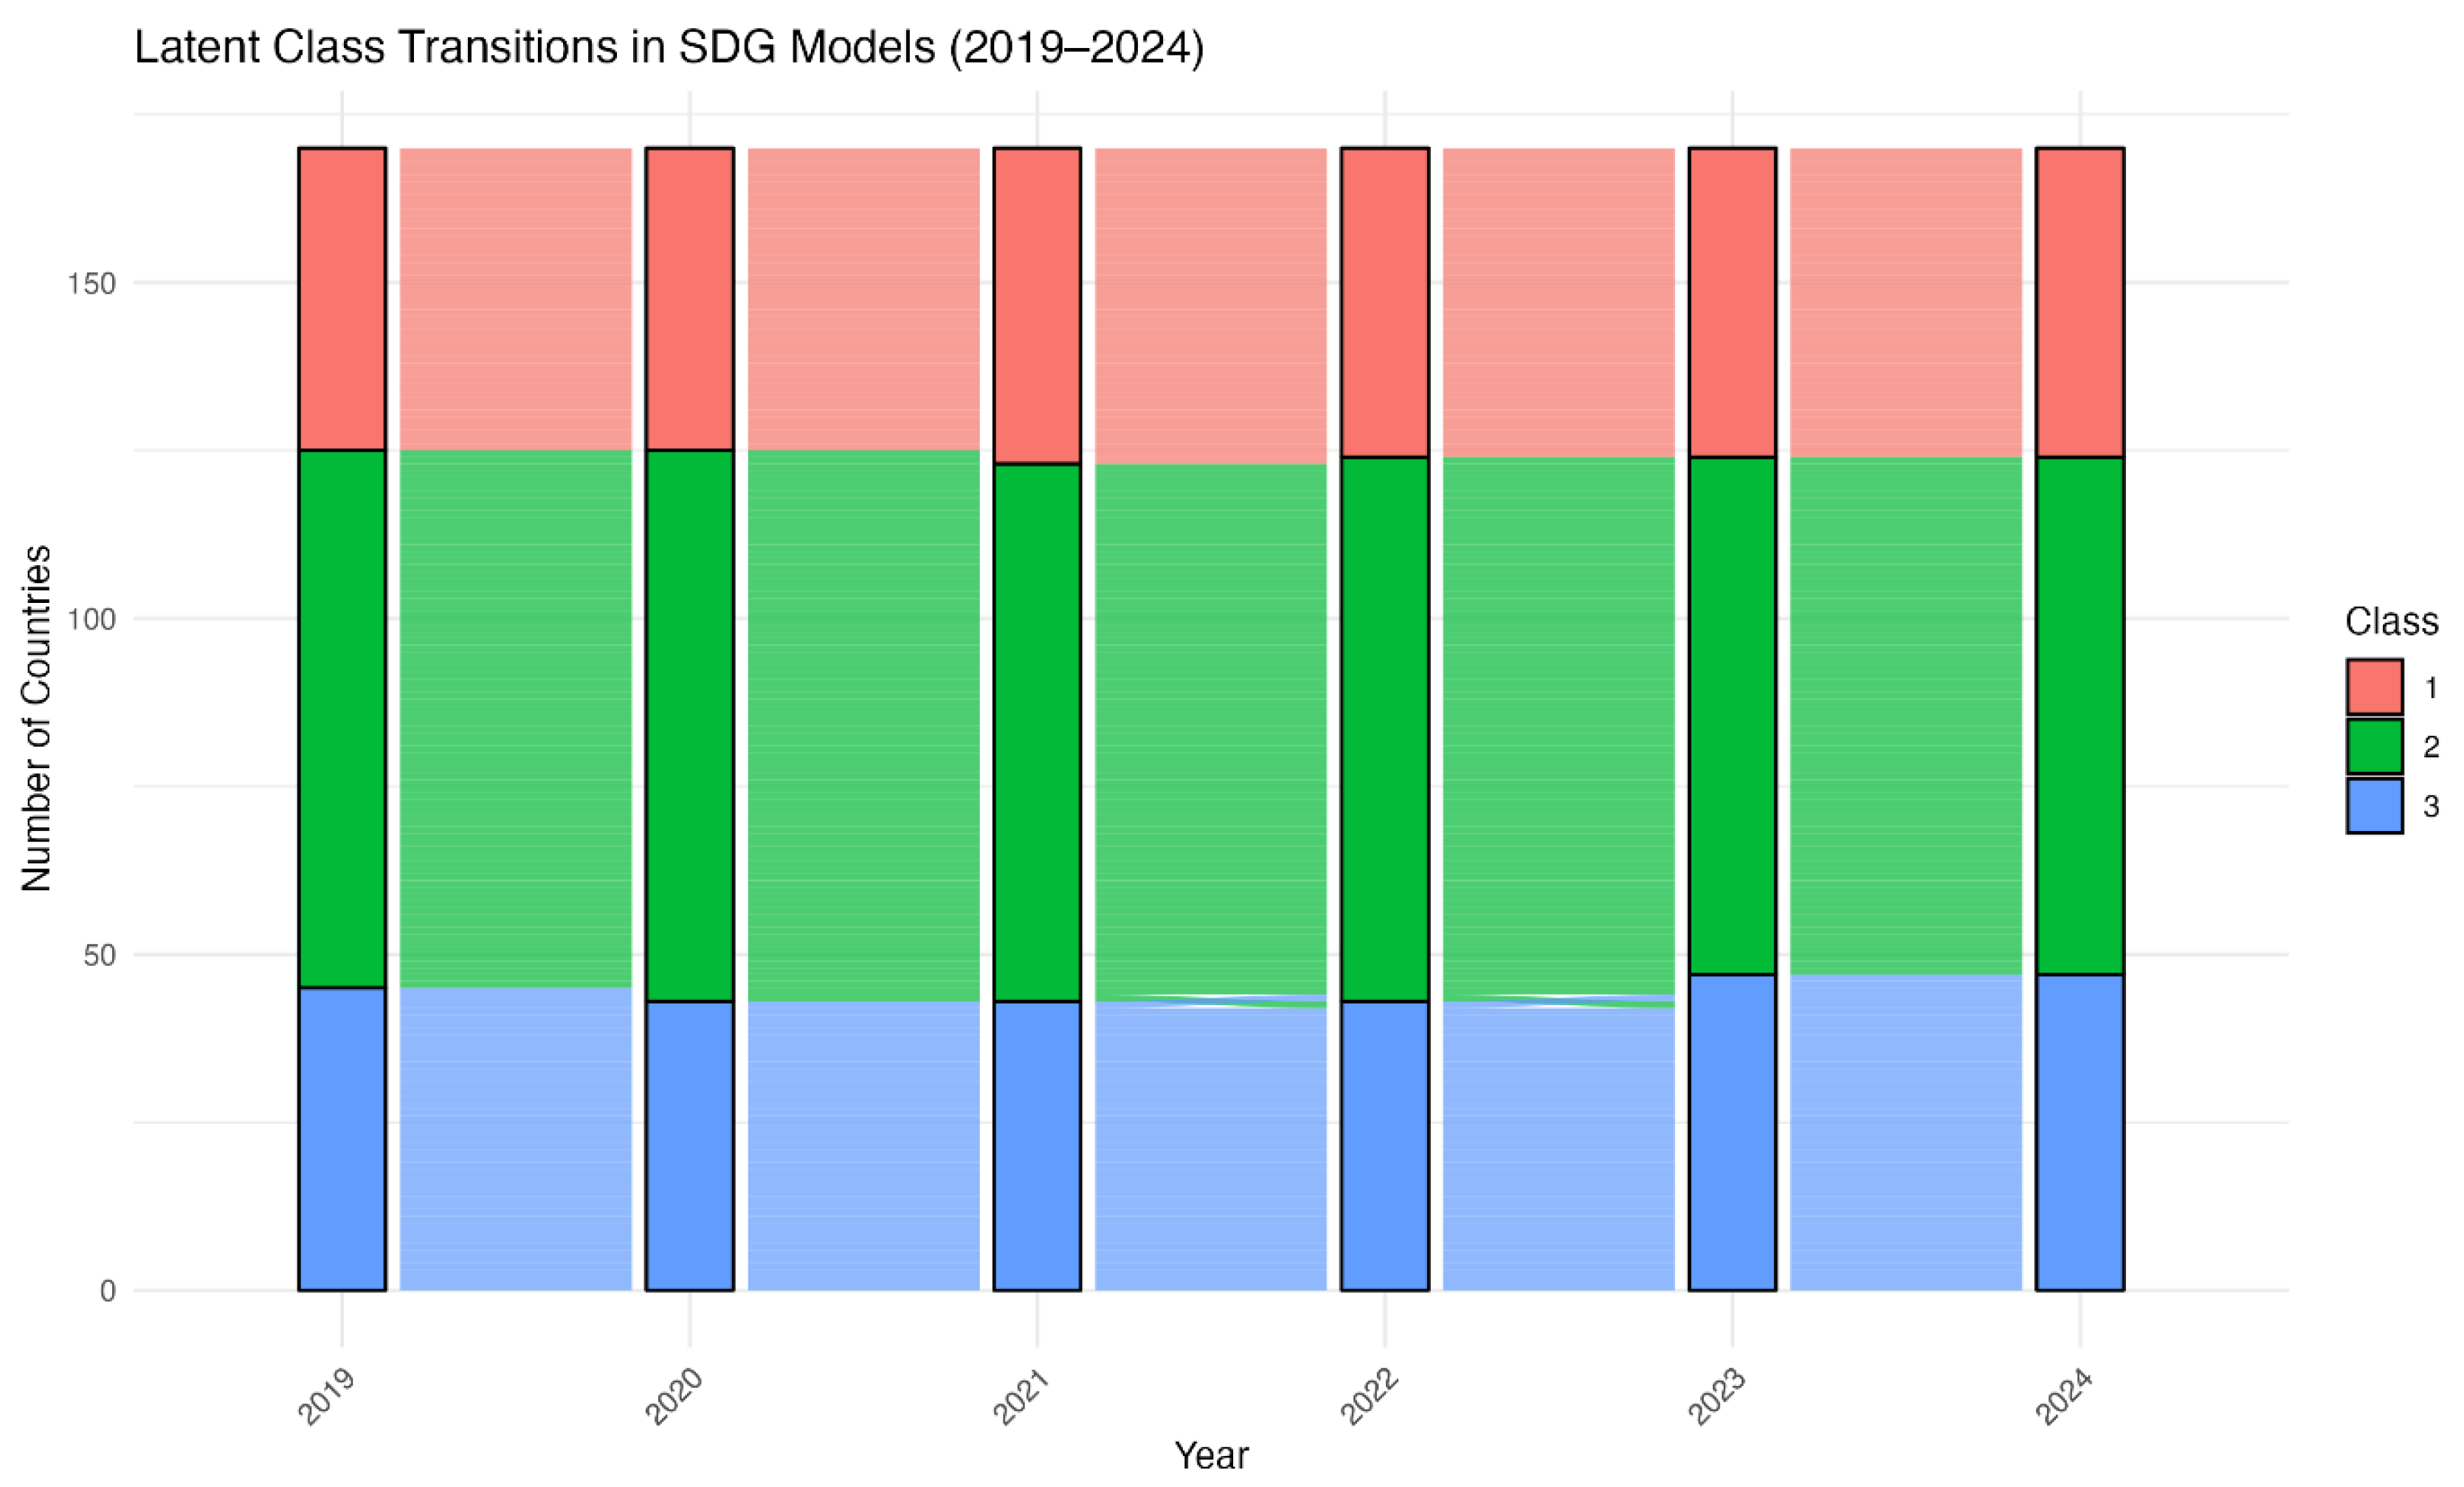
Figure 10.
Marginal effects of key predictors on SDG class membership (2019–2023). Note: Each panel presents average marginal effects of selected predictors on the probability of class membership, based on year-specific ordered logit models (m=1). Markers indicate point estimates for each year; shaded bands represent 95% confidence intervals. Positive values reflect a higher likelihood of assignment to a given class as the predictor increases. Internet access and government effectiveness show consistently strong positive effects on Class 3 membership (leading regime) and adverse effects on Class 1 membership (lagging regime).
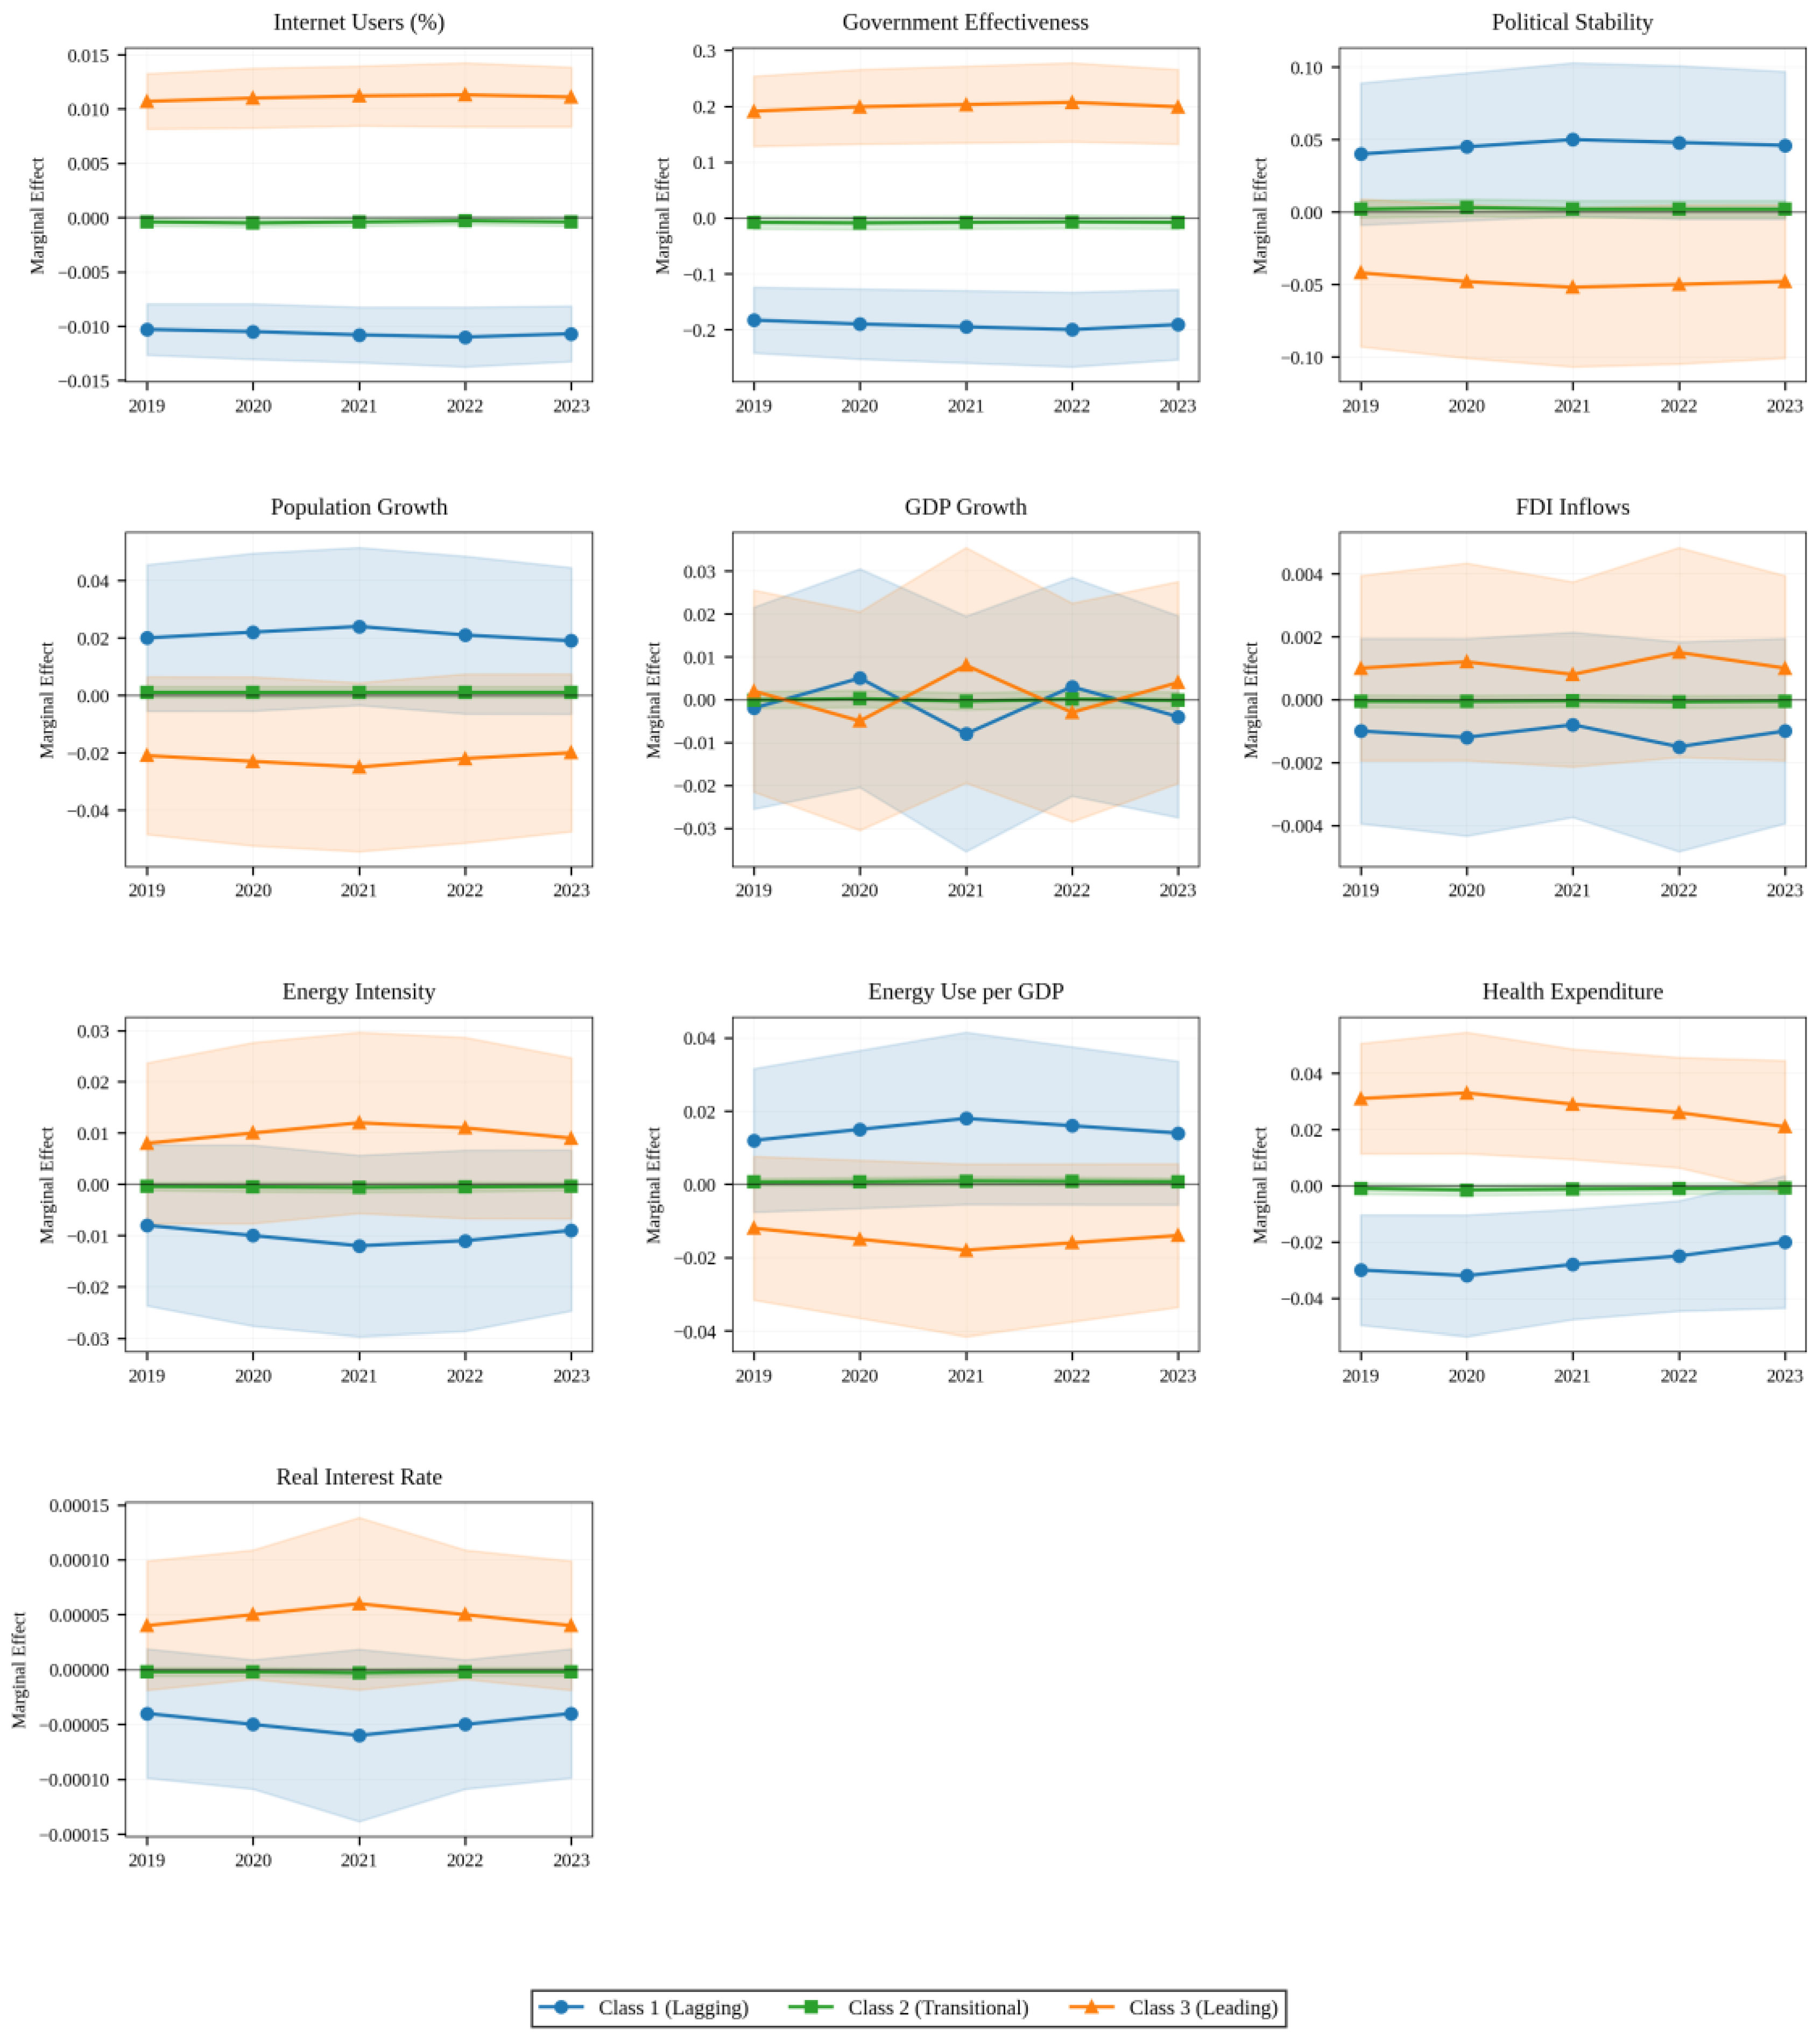
Table 1.
Fit statistics for competing latent class models (2019).
| Model | Number of Classes | Log-likelihood | Parameters (df) | AIC | BIC |
|---|---|---|---|---|---|
| M2 | 2 | −10,160.2 | 46 | 20,412.4 | 20,556.6 |
| M3 | 3 | −9,829.6 | 62 | 19,783.2 | 19,977.6 |
| M4 | 4 | −9,730.8 | 78 | 19,617.6 | 19,862.2 |
| M5 | 5 | −9,614.9 | 94 | 19,417.8 | 19,712.5 |
Note: AIC = Akaike Information Criterion; BIC = Bayesian Information Criterion. Lower values indicate better model fit. Whilst the five-class model yielded the lowest information criteria, the three-class solution was selected based on theoretical interpretability, model parsimony, and temporal transition stability. Comprehensive model fit statistics for the three-class solution across all years (2019–2024), class membership distributions, and year-to-year transition matrices are provided in Tables C1–C3 (Appendix C).
Table 2.
Transitions of countries across latent classes (2019–2024).
| № | Country | From Year | To Year | From-To (Class) |
|---|---|---|---|---|
| 1 | Bahrain | 2022 | 2023 | 2 → 3 |
| 2 | Bulgaria | 2019 | 2020 | 3 → 2 |
| 3 | Bulgaria | 2021 | 2022 | 2 → 3 |
| 4 | Kuwait | 2019 | 2020 | 3 → 2 |
| 5 | Kuwait | 2022 | 2023 | 2 → 3 |
| 6 | Myanmar | 2020 | 2021 | 2 → 1 |
| 7 | Myanmar | 2021 | 2022 | 1 → 2 |
| 8 | Romania | 2021 | 2022 | 3 → 2 |
| 9 | Romania | 2022 | 2023 | 2 → 3 |
| 10 | Saudi Arabia | 2022 | 2023 | 2 → 3 |
| 11 | Syrian Arab Republic | 2020 | 2021 | 2 → 1 |
Table 3.
Analysis of variance for selected structural indicators across latent classes (2019–2024).
| Variable/Year | F-statistic | p-value | Post-hoc comparisons |
|---|---|---|---|
| Internet Users (2019) | F(2, 945) = 1512.6 | <0.001 | Class 3 > Class 2 > Class 1 |
| Internet Users (2020) | F(2, 951) = 1775.2 | <0.001 | Class 3 > Class 2 > Class 1 |
| Internet Users (2021) | F(2, 921) = 1832.4 | <0.001 | Class 3 > Class 2 > Class 1 |
| Internet Users (2022) | F(2, 927) = 1907.0 | <0.001 | Class 3 > Class 2 > Class 1 |
| Internet Users (2023) | F(2, 921) = 2014.3 | <0.001 | Class 3 > Class 2 > Class 1 |
| Government Effectiveness (2019) | F(2, 987) = 1194.8 | <0.001 | Class 3 > Class 2 > Class 1 |
| Government Effectiveness (2020) | F(2, 987) = 1090.5 | <0.001 | Class 3 > Class 2 > Class 1 |
| Government Effectiveness (2021) | F(2, 987) = 1050.3 | <0.001 | Class 3 > Class 2 > Class 1 |
| Government Effectiveness (2022) | F(2, 987) = 1038.0 | <0.001 | Class 3 > Class 2 > Class 1 |
| Government Effectiveness (2023) | F(2, 987) = 948.8 | <0.001 | Class 3 > Class 2 > Class 1 |
| Population Growth (2019) | F(2, 987) = 289.4 | <0.001 | Class 2 > Class 1; Class 3 > Class 1 |
| Population Growth (2020) | F(2, 987) = 299.1 | <0.001 | Class 3 > Class 2 > Class 1 |
| Population Growth (2021) | F(2, 987) = 287.2 | <0.001 | Class 3 > Class 2 > Class 1 |
| GDP Growth (2019) | F(2, 969) = 10.5 | <0.001 | Class 3 > Class 2 > Class 1 |
| FDI Inflows (2019) | F(2, 963) = 23.6 | <0.001 | Class 3 > Class 2; Class 3 > Class 1 |
Note: F-statistic test for between-group differences in structural indicators across the three latent classes. All p-values are highly significant (p < 0.001), indicating that the classes differ systematically on these dimensions. Post hoc comparisons based on Bonferroni adjustments indicate the direction of differences. Complete results for all years and variables are provided in Table D2 (Appendix D).
Table 4.
Ordered logistic regression results by year (2019–2024).
| Variable | 2019 | 2020 | 2021 | 2022 | 2023 | 2024 |
|---|---|---|---|---|---|---|
| Internet Users | 0.111*** | 0.114*** | 0.124*** | 0.151*** | 0.178*** | 0.001 |
| (0.029) | (0.030) | (0.036) | (0.047) | (0.049) | (0.014) | |
| Government Effectiveness | 2.214*** | 2.108*** | 2.964*** | 2.404*** | 2.468*** | −0.029 |
| (0.709) | (0.681) | (0.854) | (0.784) | (0.810) | (0.386) | |
| Health Expenditure | 0.500** | 0.452** | 0.495** | 0.423** | 0.069 | −0.005 |
| (0.210) | (0.184) | (0.209) | (0.198) | (0.238) | (0.119) | |
| Population Growth | −0.605* | −0.361 | −1.076*** | −0.424* | −0.353* | 0.006 |
| (0.329) | (0.246) | (0.404) | (0.235) | (0.205) | (0.159) | |
| GDP Growth | 0.186 | 0.047 | 0.043 | 0.016 | −0.188** | 0.002 |
| (0.131) | (0.044) | (0.063) | (0.055) | (0.087) | (0.044) | |
| Observations | 167 | 167 | 167 | 167 | 167 | 167 |
Note: Coefficients from ordered logistic regression models. Standard errors in parentheses. * p < 0.10, ** p < 0.05, *** p < 0.01. Only key predictors shown; full results including political stability, FDI, energy indicators, and water stress are provided in Table D1 (Appendix D). All models include constant terms (cut points).
Table 5.
Pooled ordered logistic regression with year-fixed effects (2019–2024).
| Variable | Coefficient |
|---|---|
| Internet Users | 0.0489*** |
| (0.0064) | |
| Government Effectiveness | 0.943*** |
| (0.168) | |
| Health Expenditure | 0.153*** |
| (0.053) | |
| Population Growth | −0.105 |
| (0.069) | |
| GDP Growth | 0.001 |
| (0.017) | |
| Political Stability | −0.021 |
| (0.147) | |
| Observations | 1,002 |
| F-statistic | F(15, 734.7) = 11.46*** |
Note: Coefficients from pooled ordered logistic regression with year-fixed effects. Standard errors in parentheses. * p < 0.10, ** p < 0.05, *** p < 0.01. Model estimated using multiple imputation (20 imputations). Only key predictors shown; full results are provided in Table D2 (Appendix D). Year dummies included but not reported.
Table 6.
Average marginal effects from the pooled ordered logit model (2019–2024).
| Predictor | Class 1 (Lagging) |
Class 2 (Transitional) |
Class 3 (Leading) |
|---|---|---|---|
| Internet Users | −0.0103*** | −0.0004 | +0.0107*** |
| (0.0012) | (0.0002) | (0.0013) | |
| Government Effectiveness | −0.183*** | −0.008 | +0.191*** |
| (0.030) | (0.006) | (0.032) | |
| Health Expenditure | −0.030*** | −0.001 | +0.031*** |
| (0.010) | (0.001) | (0.010) | |
| Population Growth | +0.020** | +0.001 | −0.021** |
| (0.013) | (0.001) | (0.014) | |
| GDP Growth | −0.000 | −0.000 | +0.000 |
| (0.003) | (0.000) | (0.003) | |
| Observations | 1,002 | 1,002 | 1,002 |
Note: Average marginal effects represent the change in probability of class membership associated with a one-unit increase in each predictor, evaluated at the mean of all other variables. Standard errors in parentheses. * p < 0.10, ** p < 0.05, *** p < 0.01. Effects are calculated from the pooled ordered logit model (first imputed dataset, m=1). Year-fixed effects included but not reported.
Disclaimer/Publisher’s Note: The statements, opinions and data contained in all publications are solely those of the individual author(s) and contributor(s) and not of MDPI and/or the editor(s). MDPI and/or the editor(s) disclaim responsibility for any injury to people or property resulting from any ideas, methods, instructions or products referred to in the content. |
© 2025 by the authors. Licensee MDPI, Basel, Switzerland. This article is an open access article distributed under the terms and conditions of the Creative Commons Attribution (CC BY) license (http://creativecommons.org/licenses/by/4.0/).
Copyright: This open access article is published under a Creative Commons CC BY 4.0 license, which permit the free download, distribution, and reuse, provided that the author and preprint are cited in any reuse.


