Submitted:
08 December 2025
Posted:
09 December 2025
You are already at the latest version
Abstract
The composition of sunflower oil, rich in fatty acids, largely depends on the seed variety. Commercial sunflower oils are classified as low (SFO), medium (MOSFO), and high (HOSFO) oleic, distinguished by their oleic and linoleic acid content. Higher oleic acid levels enhance health benefits and oxidative stability. Due to their differing market values, ensuring the correct quality and authenticity of these oils is essential. Unsupervised chemometric methods have been applied to visualize the natural behaviour of sunflower oils while supervised models have been used for authentication based on Attenuated Total Reflection Fourier Transform Infrared Spectroscopy (ATR FTIR) fingerprints obtained from a benchtop spectrometer. Authentication of MOSFO is particularly challenging because of its wider oleic acid range (43.1 74.9%) and production via genetic modification or blending SFO/HOSFO. To address this, two multivariable PLS R regression models were developed using ATR FT IR and Fibre Optic Reflectance Spectroscopy (FORS) fingerprints, the latter obtained with a portable, cost-effective device. The results indicate that FORS could be used as a rapid quality control tool for on-site quantification. In contrast, ATR FT IR is a more accurate tool for confirmation and quantification, achieving excellent results (RPD = 7.09 and RER = 17.82).
Keywords:
sunflower oil
; high oleic sunflower oil
; ATR-FTIR
; FORS
; oleic acid
1. Introduction
Sunflower oil is cultivated in numerous regions globally, with approximately two-thirds of worldwide production concentrated in southern and eastern Europe. Other significant production areas include Argentina and certain regions of North America [1,2]. This oil is obtained from the seeds of Helianthus annuus L. [3] and is one of the most sought-after vegetable oils around the world.
There are different types of sunflower oil on the market; these are distinguished by their chemical composition, which is rich in fatty acids (FAs) [4]. Conventional sunflower oil (SFO) has been found to contain a higher percentage of linoleic acid (45.4-74.0%) in comparison to oleic acid (up to 43.0%) [5,6]. Conversely, high oleic sunflower oil (HOSFO) is characterised by its elevated oleic acid content (>75.0%) [5,6] and is derived from genetically modified Helianthus annuus L. seeds (GM-seeds) [7,8]. The most common process for modifying these seeds is the inactivation of the FAD2-1 gene, which encodes the enzyme responsible for converting oleic acid into linoleic acid (oleate desaturase) [9]. Mutations in this gene reduce the activity of the enzyme, leading to an increased concentration of oleic acid [10]. Finally, medium oleic sunflower oil (MOSFO) can be obtained from both GM-seeds [7,8,9,10,11] and through industrial blends of SFO and HOSFO in different proportions, with a variable oleic acid content ranging from 43.1% to 74.9% [5,6].
These characteristics give rise to two main problems: firstly, oils labelled as MOSFO or HOSFO may not meet the minimum oleic acid values established (43.1% and 75.0%, respectively) [5,6] due to variations in composition after the oil has been obtained from GM-seeds. Secondly, oils produced by blending SFO and HOSFO may not meet the minimum oleic acid content required for labelling. This may be due to insufficiently homogeneous blending, incorrect measurements of the oleic acid content of the base oils, or the economic interests of producers.
These facts pose significant challenges for the authentication and quality control of sunflower oils, especially considering that varieties with high oleic acid content are increasingly being cultivated due to their superior performance [1]. The accurate quantification of oleic acid is imperative, as this analyte not only delineates the nutritional value of the oil, but also serves as a pivotal marker for differentiating between diverse types of sunflower oil. Furthermore, an elevated oleic acid content confers several additional advantages, including enhanced oxidative stability, thereby improving the resistance of the oil to elevated temperatures during the frying process and prolonging its shelf life [11]. In addition to these benefits, oleic acid content provides significant health benefits [12].
To address these challenges, various chromatographic techniques have traditionally been used, including High Performance Liquid Chromatography (HPLC), Gas Chromatography (GC) and Thin Layer Chromatography (TLC). These techniques have official methods applied to the study of different fractions of vegetable oils, particularly olive oils [13,14,15]. They can be applied both using a quantitative approach and through the methodology of the instrumental fingerprinting [16,17]. However, these methods are not without their limitations, including high solvent consumption, the use of environmentally harmful reagents and solvents, extended analysis times, and the necessity for meticulous sample preparation. Consequently, there is an increasing focus on the development of more sustainable analytical methods, particularly those grounded in rapid and straightforward spectroscopic techniques, combined with chemometric tools, under the instrumental fingerprinting approach [18,19,20,21]. These methodologies offer the possibility of performing quality controls in situ, in contrast to conventional methods [22,23].
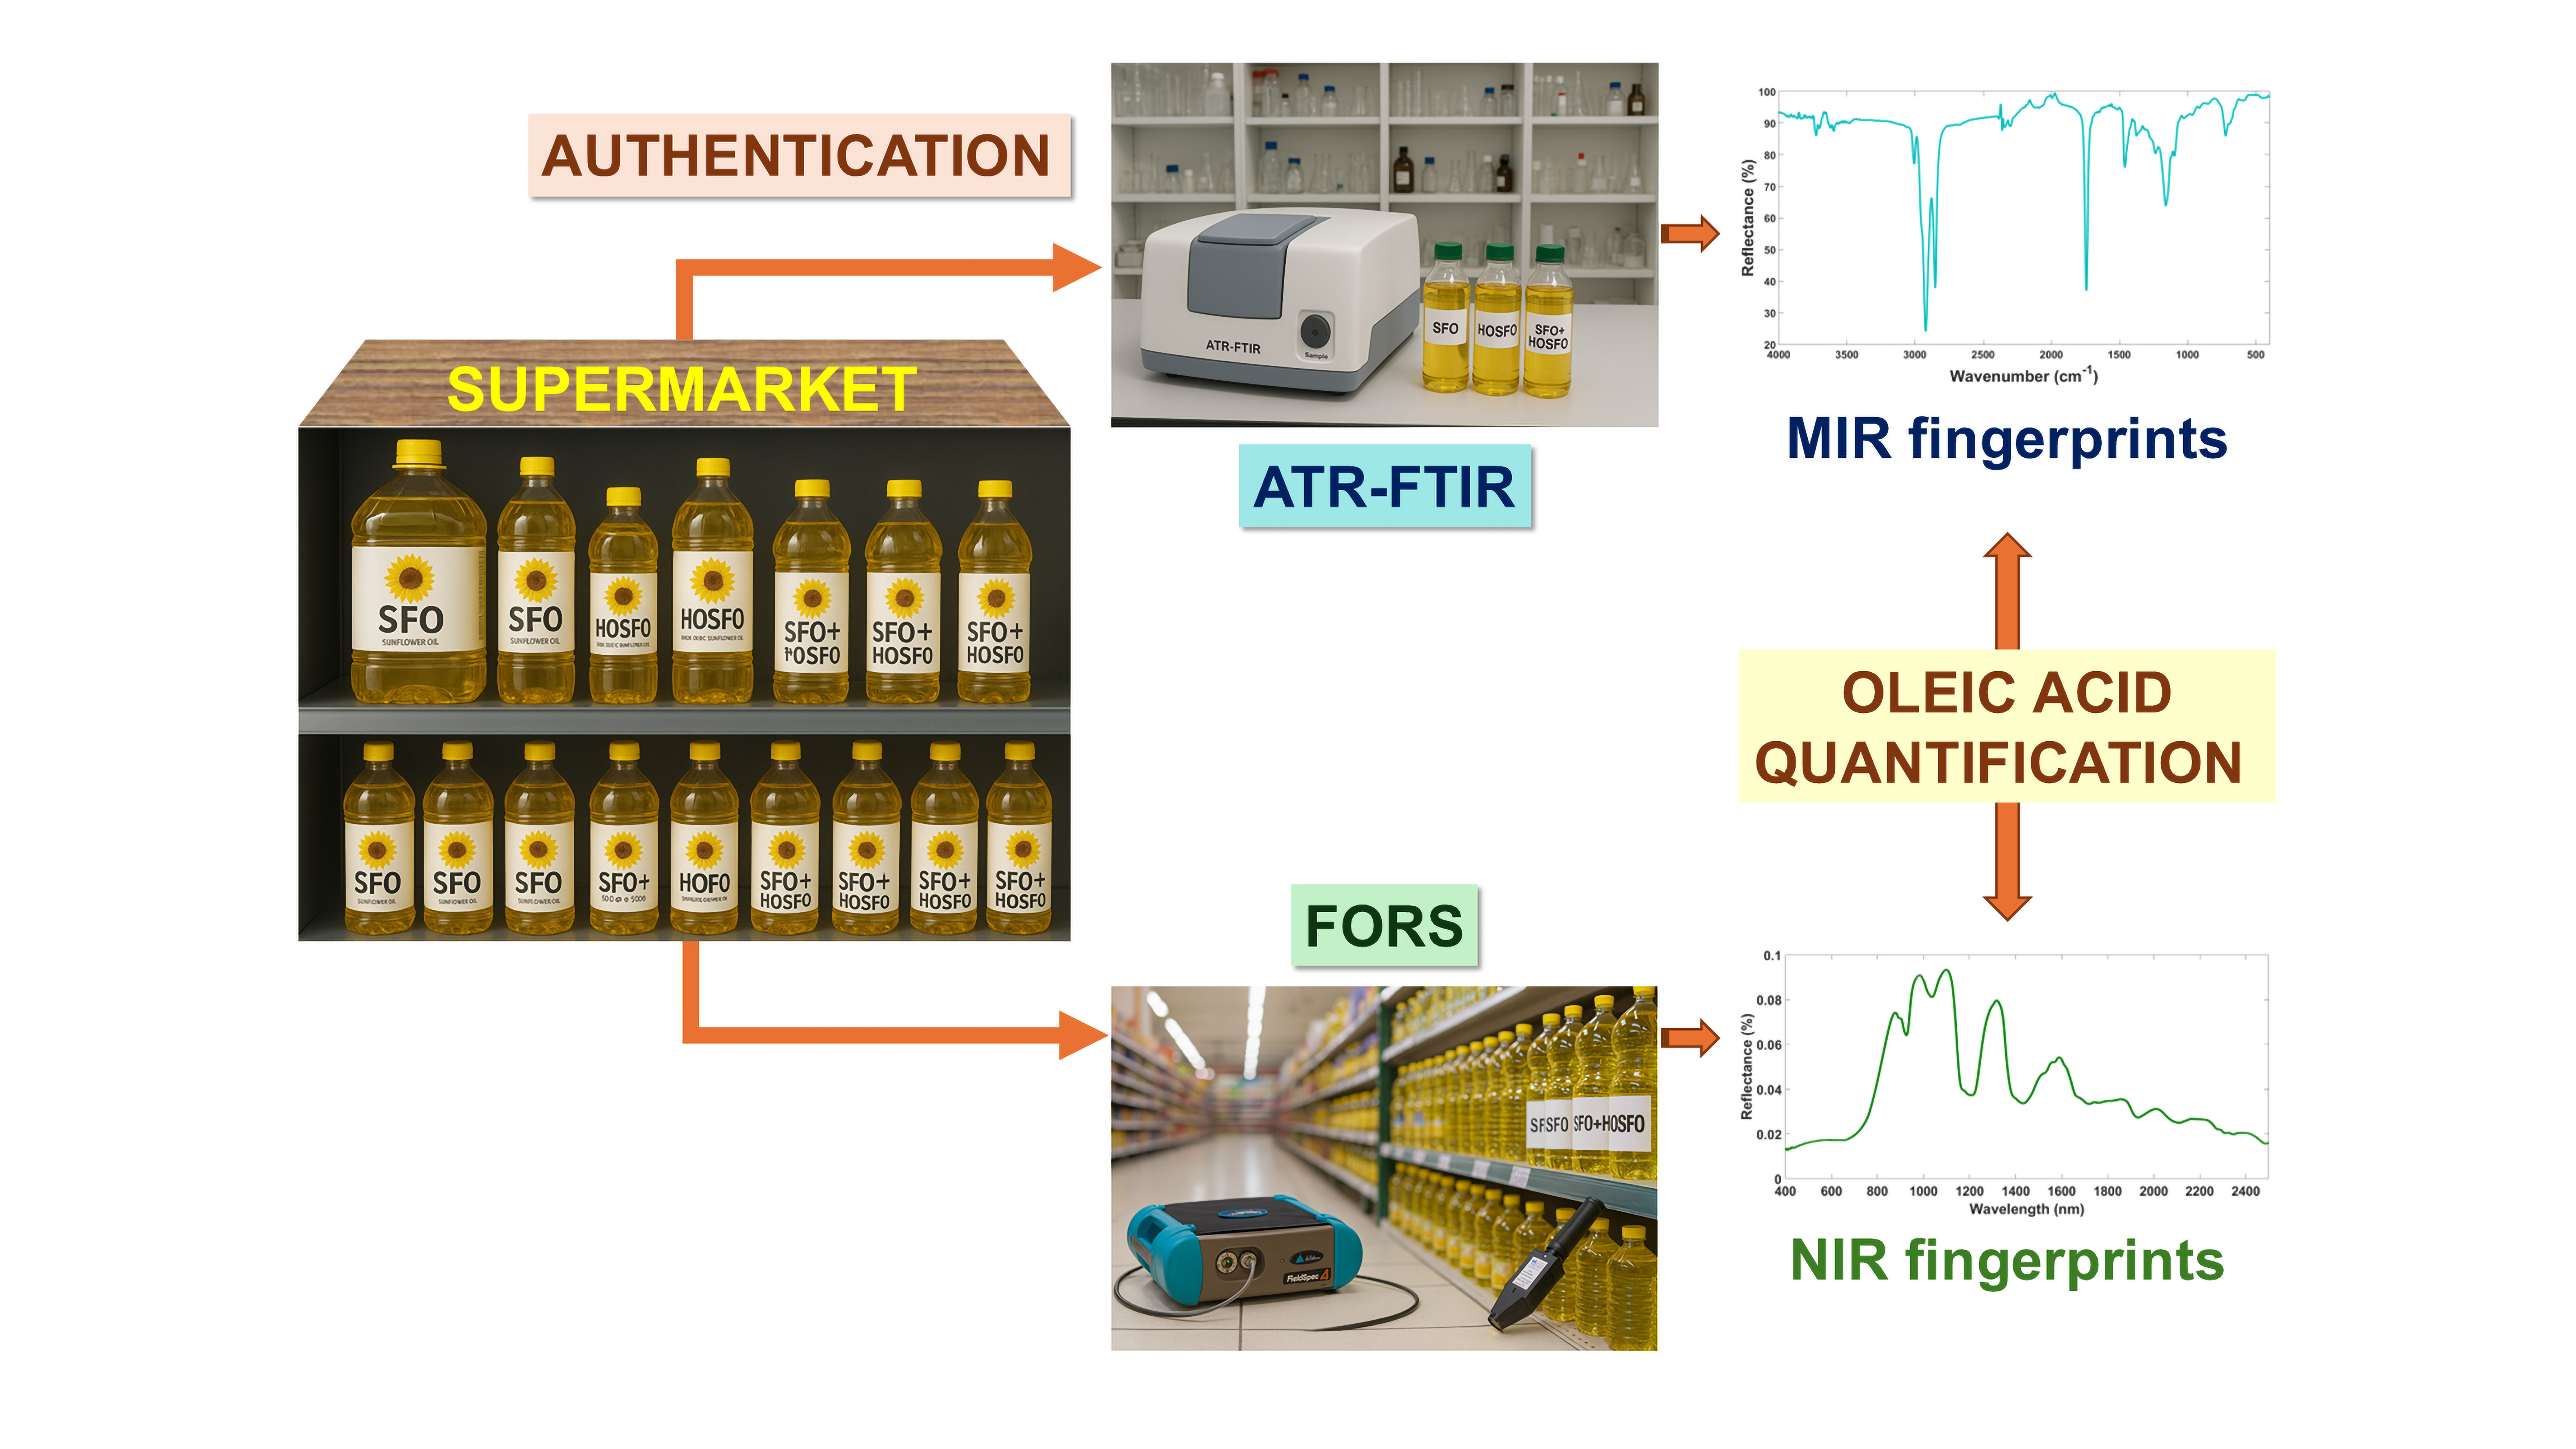
Among the most promising alternatives are Attenuated Total Reflection Fourier Transform Infrared Spectroscopy (ATR-FTIR) and Fibre Optic Reflectance Spectroscopy (FORS), which allow the instrumental fingerprints of oils to be obtained through rapid, non-destructive analysis. In the case of ATR-FTIR, spectral information is generated from the vibrations of the organic bonds present in the chemical composition of the oil [24]. In contrast, FORS spectra primarily reflect indirect absorptions associated with molecular vibrations, manifesting through overtones and combination bands [25,26]. The use of portable spectroscopic instruments, such as those based on FORS [27], Raman [21] or NIR (Near-Infrared) [22,23,25], renders them ideal tools for preliminary or screening evaluations of commercial samples. Conversely, benchtop instruments, particularly those grounded in ATR-FTIR, are more apt for comprehensive quality control, as they facilitate high-throughput analysis of food components with real-time measurements throughout all phases of production [28]. In the present article, it has been demonstrated that both spectral fingerprints provide unique, characteristic and unambiguous information about the chemical composition of each sample [29].
In this context, the main aim of this study was to develop an approach based on ATR-FTIR and FORS spectral instrumental fingerprints for the correct authentication of commercial sunflower oils and the quantification of oleic acid in commercial samples of the three types of sunflower oils covered by legislation [5,6]. This study makes a significant contribution to the field of quality control methodology, offering novel, rapid, non-destructive tools for the food and regulatory industries.
2. Materials and Methods
2.1. Sample Bank
2.1.1. Commercial Sunflower Oils
A total of 85 commercial sunflower oils were collected from local stores and supermarkets in Spain, primarily in Andalusia (south of Spain). The sample bank comprised two groups: the first group consisted of 24 samples of refined commercial HOSFO, whereas the second group comprised 61 samples, including 42 samples of refined SFO and 19 samples of refined SFO blended with refined HOSFO for formed MOSFO. Currently, there are no commercial samples of MOSFO available in Spain in which the class “medium” is declared on the label. The term that appears instead is “sunflower oil blended with high oleic sunflower oil”.
2.1.2. Binary Blends (SFO/HOSFO and MOSFO/HOSFO)
Nine of the 85 oils available 19 were randomly selected for analysis by Gas Chromatography with Flame Ionisation Detection (GC-FID), in accordance with the official International Olive Council (IOC) method for quantifying fatty acids [14]. From these 19 oils were selected 9 samples (4 SFOs, 4 HOSFOs and 1 MOSFOs), 100 binary blends were prepared, with varying concentrations, ranging from 5% to 95% of HOSFO blended with SFO or MOSFO (see Table S1).
The blends were prepared by gravimetrically weighing the required amounts of each oil into 19 mL glass vials with the temperature maintained at 22 °C. To ensure homogenisation, samples were subjected to oscillating agitation at 900-1000 oscillations per minute for 10 minutes, leaving a small air space in the vial to promote oil-oil interactions. The vials were subjected to a vortexing process at 2500 rpm for 30 seconds. Finally, binary blends were analysed using ATR-FTIR benchtop instrument and stored in darkness under refrigeration until further analysis with the FORS portable device.
2.2. GC-FID for the Determination of Oleic Acid Content in Commercial Sunflower Oils
To determine the oleic acid content in the 19 commercial sunflower oil samples, the reference method [14] was applied. This method is based on the conversion of the FAs presents in sunflower oils to their corresponding methyl esters (FAMEs).
2.2.1. Reagents and Solvents
Methanol (MeOH) (99.9%) and n-hexane (99%) were acquired by Panreac AppliChem (Darmstadt, Germany) while potassium hydroxide (KOH) (85%) was supplied by Panreac (Barcelona, Spain). A total of 2.8 g of KOH was dissolved in 25 mL of MeOH, with stirring, to prepare a 2 mol·L−1 solution (KOH/MeOH). As internal standard tridecanoic acid methyl ester ≥97% (GC) (Sigma Aldrich, St. Louis, Missouri, USA) was used.
2.2.2. Chromatographic Conditions
The chromatographic conditions established in the method were adapted and applied using a GC Varian CP 3800 gas chromatography system (Varian Inc., Palo Alto, CA, USA) equipped with a flame ionisation detector (FID) and a CTC PAL Autosampler (CombiPal; CTC Analytics, Zwingen, Switzerland).The elution process was carried out utilising an Agilent HP-INNOWAX capillary column (30 m × 0.25 mm × 0.25 μm). The carrier gas utilised was helium at a flow rate of 1.5 mL/min, and the injection volume was 1 μL. The injection mode was configured to execute a split with a ratio of 1:10 (v/v) and a split flow of 15 mL/min. The temperature of the injector was maintained at 250 °C. The temperature programme was initiated at 165 °C and was maintained at that level for a period of 8 minutes. The temperature was then increased to 210 °C at a rate of 1.5 °C/min and held at this value for a period of 2 minutes. Thus, the total analysis time was established at 40 minutes. The chromatographic conditions under consideration were adapted from reference method [14].
2.3. Instruments
2.3.1. ATR-FTIR Benchtop Instrument – Specifications and Methodology
The FT/IR-4X benchtop spectrophotometer (Jasco, Tokyo, Japan) was employed, equipped with a diamond ATR PRO 4X accessory (Jasco, Tokyo, Japan). Spectra were collected with 32 accumulations at a resolution of 8 cm−1 and an estimated acquisition time of 10 s, spanning a range from 400 to 4000 cm−1 (MIR region), using cosine apodisation. The infrared beam was incident on the ATR crystal at an angle of 45°, which determines the penetration depth of IR radiation into the liquid sample. The instrument did not necessitate any sample preparation; the samples were simply applied to the ATR crystal using a Pasteur pipette.
Prior to each analysis, a background spectrum integrated into the spectrophotometer was recorded and automatically subtracted from the sample spectrum, thereby eliminating any interference from ambient air. The measurement of samples was conducted on the same day and with the same background, thereby ensuring consistency. In change, for binary blends prepared at the laboratory scale, three replicates were measured on three separate days in random order to minimise preparation errors and potential experimental deviations. Furthermore, the mean spectrum of each sample was calculated.
2.3.2. FORS Portable Device - Specifications
A portable FieldSpec4STD spectroradiometer (Analytical Spectral Devices Inc., Boulder, CO, USA) was used to record the reflectance spectra of sunflower oils in the UV-A, VIS, NIR, and MIR regions, covering a total working range from 350 to 2500 nm. Before commencing the measurement process, the instrument underwent a 30-minute stabilisation period, followed by calibration using a 3.62″ Spectralon white reference with near 100% reflectance, incorporating a dark current correction (DCC). The white reference was recalibrated after every 25 spectra, in accordance with the instructions of the manufacturer. The contact probe A122307 (Analytical Spectral Devices Inc., Boulder, CO, USA) with a halogen light source and a measurement area of approximately 2 cm in diameter was employed. The spectral resolution was 3 nm at 700 nm and 10 nm between 1400 and 2100 nm, yielding a total of 2151 variables.
The measurements were conducted in a darkened room with the open vials positioned vertically inside a plastic box lined internally with graphite paper to minimize possible reflection of the vial walls. Three replicates were obtained for each sample. To ensure the reliability of the results, the vial was rotated approximately 90° prior to the recording of each replicate, and the resulting spectra were then averaged.
2.4. Spectroscopic Analysis
2.4.1. ATR-FTIR – Data Pre-Processing and Spectral Elucidation
For every commercial oils and binary blends, an IR spectrum of reflectance was acquired, saved by the software of the instrument (Spectra Analysis) in a .CSV (comma separated value) file. Each recorded .CSV file contained two columns of data: the wavenumber (cm−1) values and reflectance is scaled between 100-0%, since lower data obtained about 20%. These .CSV files were imported into MATLAB (version 9.3, Mathworks Inc., Natick, MA, USA), generating two data matrices representing instrumental ATR-FTIR fingerprints: i) Commercial sunflower oils matrix of dimensions 75 × 1869, which is conceived for resolved problems the authentication of different sunflower oil types and ii) ATR-FTIR blends oils matrix of dimensions 100 × 1869, which is formed for quantify the oleic acid.
For analysis of these spectroscopic fingerprints 3 steps were carried out: i) remove of irrelevant variables since too much noise against relevant information, ii) a normalisation applying a Standard Normal Variate (SNV) filter for reduce the difference in the baseline, this effect is very notorious when the spectrums were recorded in different days with diverse backgrounds and, iii) applying a Savitzky-Golay (SG) smoothing filter and the first derivative transformation (second order polynomial and 9-point window) to enhance signal resolution and correct for baseline drifts [30,31]. Finally, the two matrices of study (pure sunflower oils and blends) had dimensions of 75 × 375 and 100 × 375, respectively. The complete signal processing pipeline is illustrated in Figure S1.
The most informative variables are found in 3 regions (A, B and C) corresponding to variables 355-418 (region A), 624-727 (region B) and 1195-1401 (region C) directly associated with the wavenumbers 1081.87-1023.36 cm−1, 1600.63-1799.26 cm−1 and 2701.78-3099.05 cm−1 respectively. Region A contains information about tension vibrations in C-O ester groups (Peak 1 in Figure 1). Specifically, it is useful for differentiating subtle changes, as SFO and MOSFO have a band shifted slightly towards higher wave numbers with respect to HOSFO. Furthermore, HOSFO exhibits a band at approximately 1118 cm−1, the presence of which is not discernible in other types [32]. Region B is associated with changes in vibration of the bonds C=C in 1650 cm−1 [33] and tension vibration of carbonyl group (C=O) of the ester of the fatty acids represented an intensity band of triglycerides, which have a maximum peak in 1743 cm−1 (Peak 2 in Figure 1). Region C count with 3 informative bands, in 2853 cm−1 have found the asymmetric vibration of tension of the bond C-H (CH2) [34] due to alkyl rest of the triglycerides [33] which is found in higher proportions in the edible vegetable oils (Peak 3 in Figure 1). In 2922 cm−1 the same explanation but now for the asymmetric vibration of tension of the bond C-H (CH3) (Peak 4 in Figure 1). Finally, in 3003 cm−1 for HOSFO and 3008 cm−1 for SFO have found the tension vibration of the bond (C–H) (cis) (> C = CH-), a higher presence of unsaturation more displaced is this band, in fact, the MOSFOs count with band between the bands of HOSFO (3003 cm−1 ) and SFO (3008 cm−1) [35] (Peak 5 in Figure 1).
2.4.2. FORS – Data Pre-Processing and Spectral Elucidation
For each binary blend, a FORS spectrum was recorded and exported by the instrument software in a CSV file. Each file contained two data columns: wavelength (nm), spanning from 350 to 2500 nm, and reflectance, expressed as a percentage between 0 and 0.2%. These .CSV files were then imported into MATLAB (version 9.3, MathWorks Inc., Natick, MA, USA), generating a 100 × 2151 matrix representing the FORS spectral fingerprints of the binary blends. The objective of this analysis was to quantify the oleic acid content in commercial sunflower oils.
The spectroscopic data underwent a three-step processing procedure: i) Normalisation using a SNV filter to minimise baseline variations; ii) application of a SG smoothing and first-derivative transformation (second-order polynomial, 9-point window) to enhance spectral resolution and correct baseline drifts [35,36]; and iii) Mean Center for data standardisation. The complete signal processing process is shown in Figure S2.
Despite the initial hypothesis that the UV-A (350-400 nm) and Visible (VIS) (450-700 nm) regions would not provide relevant information for these samples, these regions were retained to account for possible variability in the spectral behaviour among oils. The most informative regions were identified as three spectral zones (A, B and C), corresponding to variable ranges of 350-850 nm (region A in NIR zone), 851-1650 nm (region B in NIR zone), and 1651-2151 nm (region C in NIR zone). These relate directly to wavelengths of 700-1200 nm (NIR zone), 1201-2000 nm (NIR zone), and 2201-2500 nm (NIR zone), respectively. Within the range of 800-1650 nm, the main spectral distinction was attributed to differences in reflectivity. The higher reflectance (lower absorption) regions are associated with overtone vibrations of C-H and O-H stretching bonds present in various molecular components of the oils [37].
The NIR region of the FORS spectrum covers the first, second, and third harmonics between 700 and 1900 nm [37]. The initial area of interest, illustrated in Figure 2 as Region A (930-980 nm), is associated with the second overtone of the O-H bond stretching. Beyond 1900 nm and up to 2500 nm, combination bands derived from one or more overtones become predominant. In edible vegetable oils, characteristic absorption peaks are observed around 1208, 1391, 1416, 1724, 1760, 2308, and 2348 nm (Regions B and C in Figure 2) [38]. In Region B, the band near 1215 nm corresponds to the second overtone of the C-H stretching vibration and is attributed to the presence of oleic acid, particularly in sunflower oils [37]. The absorptions observed within the 1391-1416 nm range are attributed to combined stretching and deformation modes of the same bond [39], while the band centred at 1450 nm corresponds to the first overtone of the O-H bond stretching. In a similar manner, the peaks observed in 1724, and 1760 nm are attributed to the first overtone of C-H vibrations present within methyl, methylene, and ethylene groups. In Region C (2000-2500 nm), the absorptions at 2308 and 2348 nm are attributed to combination bands associated with C-H stretching in fatty acids [40].
2.5. Chemometric Methodology
2.5.1. Authentication of All Types of Commercial Sunflower Oils
The interest of using the commercial sunflower oil dataset was to distinguish between the three existing types. Initially, an exploratory visualisation was performed using unsupervised methods subsequently, a range of supervised chemometric models were developed, including soft (Soft Independent Modelling of Class Analogies, SIMCA) and hard (Partial Least Squares Discriminant Analysis, PLS-DA, and Support Vector Machine, SVM) models. During development of discrimination/classification models, MOSFO samples were excluded and subsequently used as a prediction set. For the SFO and HOSFO samples, 75% of the data were used for model training and the remaining 25% for external validation, selected according to the Kennard-Stone (KS) algorithm [41] (see Figure 3).
2.5.2. Quantification of Oleic Acid in Commercial Sunflower Oils
Two multivariate PLS-R (Partial Least Squares Regression) models were developed, both based on 100 binary blends comprising 80 SFO/HOSFO and 20 MOSFO/HOSFO. The aim was to quantify the oleic acid content in commercial samples using two measurement techniques (ATR-FTIR and FORS). Both models were constructed using the same methodology: i) exploratory analyses were performed to identify and eliminate anomalous samples at an early stage, ii) models were calibrated and cross-validated using 75% of the binary blends and externally validated with the remaining 25% (21 and 24 samples for ATR-FTIR and FORS, respectively), this data split was performed by KS algorithm [41]. Finally, once both models had been established, their predictive capacity was evaluated using 10 commercial samples of the three types of sunflower oil. The oleic acid concentration of these 10 samples had previously been determined by the Tello Laboratory (Table S2), which is accredited for the application of the official method [14]. The laboratory belongs to the Tentamus Group, which is recognised worldwide as a leader in agri-food analysis, as illustrated in Figure 4.
The present study utilised error metrics that have been widely recognised and employed in previous research to ascertain the efficacy of chemometric multivariate regression models in determining the actual oleic acid content in commercial sunflower oil samples. The Standard Error of Prediction (SEP) parameter is regarded as adequate when it exhibits relatively low values. In a similar manner, the criterion adopted is that a Residual Predictive Deviation (RPD) greater than 3 indicates excellent performance, while values greater than 2 are considered acceptable [42,43]. Finally, for the Range Error Ratio (RER) parameter, values greater than 4 are considered appropriate for screening applications, values greater than 10 are considered adequate for quality control, and values greater than 15 indicate high quantitative capacity [44].
3. Results and Discussion
3.1. Unsupervised Pattern Recognition Methods of ATR-FTIR Sunflower Oil Fingerprints
3.1.1. Hierarchical Cluster Analysis (HCA)
The reduced ATR-FTIR data matrix underwent an HCA following the Ward’s method and Mahalanobis distance such as the linkage criterion and the distance measure between pairs of observations, respectively. The number of clusters was determined using Dlinkage = 2/3 of Dmax as the internal criterion. As shown in Figure 5, sunflower oils naturally cluster according to their primary raw material, oleic acid content and the oleic/linoleic ratio. Thus, two main clusters were identified: Group I comprised oils with higher oleic acid content, including all HOSFOs and one MOSFO with a priori high content of oleic acid, whereas Group II encompassed the remaining MOSFOs and all SFOs.
3.1.2. Principal Component Analysis (PCA)
The data matrix of pure sunflower oil was subjected to PCA, a process which yielded three principal components (PCs). Due to was observed that from the fourth PC onwards, the cross-validation (CV) error exhibited glow up. Collectively, these components accounted for 99.95% of the total variance observed in the dataset. Figure 6 displays the natural behaviour in the commercial sunflower oils in the PCA plot (PC1 vs. PC2). Therefore, samples are grouped according to their oleic acid content, consistent with the results of the HCA dendrogram (Figure 5). PC1 does not distinguish between the different types of sunflower oil. For PC2, HOSFOs obtained positive scores (Group I), whereas the low oleic sunflower oils received negative scores (Group II). Moreover, some of the medium oleic sunflower oils were grouped with the conventional sunflower oils, while a small subset of samples with positive PC2 scores appeared slightly separated from Group I.
3.2. Supervised Chemometric Models of ATR-FTIR Sunflower Oil Fingerprints
3.2.1. SIMCA Model for Authentication of All Sunflower oil Types
Three PCs were selected for the target class (HOSFO), and four PCs for the non-target classes (Not HOSFO), explaining 99.99% of the cumulative variance in both cases. Figure 7a and Figure 7b show the Cooman’s classification plots for the analysed samples. Region A corresponds to the HOSFO class, region B identifies samples that are neither HOSFO nor Not HOSFO (really not SFO), region C includes samples classified as both HOSFO and non-HOSFO, and region D comprises samples identified as Not HOSFO (certainly SFO). In Figure 7a, almost all HOSFO samples, with one exception, are correctly located within their class (region A). The remaining oils are appropriately assigned to their respective Not HOSFO class (region D), except for one sample that deviates slightly towards an atypical region (region B). This sample corresponds to an SFO with the lowest amount of oleic acid and the highest linoleic acid content.
Once the prediction set has been entered into the established model (see Figure 7b), there are different trends within the MOSFO group (green triangles). One of the samples evidently approaches region A, as was also the case in the unsupervised analyses (appearing to be HOSFO). Most of the group was in region B (neither HOSFO nor SFO), thus these samples are defined as true MOSFOs. Finally, a few samples were found to resemble conventional sunflower oils. It is plausible that these samples have a lower oleic/linoleic acid ratio, attributable to a lower oleic acid content than the minimal levels stipulated by the Spanish legislation and by the Food and Agriculture Organization of the United Nations (FAO) [5,6] (Region C).
3.2.2. PLS-DA Model for Authentication of All Sunflower Oil Types
The development of the PLS-DA model utilised three latent variables (LVs), accounting for 99.92% of the cumulative variance. The same criterion applied for the selection of principal components (PCs) in the PCA was followed. CV was performed using both the Leave-One-Out (LOO-CV) and Venetian Blinds (VB-CV) methods, with one sample per blind and ten data splits.
As demonstrated in Figure 8a and Figure 8b, a threshold of 0.8 is established, so that samples with scores above this value are classified as belonging to the ‘High oleic’ class. The intermediate or doubtful region that falls between 0.8 and 0.4, is defined by the inability of samples to be unequivocally assigned to either the HOSFO or SFO classes. Conversely, samples with scores below 0.4 are regarded as exhibiting a lower oleic acid content compared to linoleic acid, an inherent characteristic of conventional sunflower oils. The training set allows for complete discrimination between the classes, with no inconclusive samples. Conversely, the external validation set count two doubtful samples, each of a different type of sunflower oil, as illustrated in Figure 8a as happened in Figure 7a (SIMCA model). Finally, in Figure 8b, when MOSFOs are introduced to predict their behaviour, three clear trends can be distinguished again: one red triangle (HOSFO), eight green triangles (MOSFO) and six blue triangles (SFO).
Consequently, the model successfully distinguished higher-quality sunflower oils from the rest of the samples and is capable of visualising different trends along the MOSFO group. It was to be expected that the model would show greater variability for the MOSFOs due to the range (43.1-74.9%) of oleic acid permitted under Spanish legislation and international normative [5,6].
3.2.3. SVM Model for Authentication of All Sunflower Oil Types
The SVM model used the Kernel algorithm with a radial basis function (RBF) and was optimised with the cost = 100 and gamma = 0.032 parameters, employing 25 support vectors. For the calibration and external validation blocks (Figure 9a) and for the calibration and prediction blocks (Figure 9b).
All samples in the calibration set were correctly classified into their corresponding class. A single sample of SFO from the external validation set was found to be in the region of indecision, showing behaviour like that observed in the SIMCA and PLS-DA models. Regarding the prediction set, the results coincided with those obtained using PLS-DA, although a slight increase was observed in the distances between the true MOSFO and the MOSFO predicted as SFO.
In general, the three chemometric models developed demonstrate that the ATR-FTIR fingerprint allows highly effective discrimination between high oleic sunflower oil and conventional sunflower oil. However, these models identified a sample labelled as SFO that does not conform to the definition of SFO, as its oleic acid content exceeds the limits established [5,6].
Conversely, the SIMCA and PLS-DA models detected a sample labelled as HOSFO, which exhibited a lower oleic acid content compared to its class, thereby placing it in a region of indecision. Even the SVM model, despite ‘forcing’ its classification within the HOSFO class, clearly reflects that this sample differs from the rest of its group.
When medium oleic sunflower oils are incorporated into the models, their greater compositional variability becomes evident, with three distinct trends being observed: one sample with a composition close to HOSFO, the majority truly representative of MOSFO, and 6 of 15 samples whose chemical composition is more similar to that of SFO than to that of MOSFO.
In order to address this issue and comply more strictly with current legislation and normative, multivariate quantification models for oleic acid in sunflower oils were developed. The aim of this study is to elucidate, clarify and accurately distinguish those samples that gave rise to uncertainty during the development and prediction of the models.
3.3. Quantification of Oleic Acid in Commercial Sunflower Oils by PLS-R Model
Two multivariate regression models (PLS-R) were developed:
- i)
- Model 1: built with ATR-FTIR. MIR fingerprints
- ii)
- Model 2: built with FORS. NIR fingerprints
For the development of these models, two criteria for sample exclusion are established at all stages: Criteria for exclusion of outliers: > Residual value ± 5 ó > Residual studentized value ± 3, as described previously in Figure 4.
3.4.1. PLS-R Model 1 Built with ATR-FTIR. MIR Fingerprints
The ATR-FTIR blends matrix, which has dimensions of 100 × 1869, undergoes the same pre-processing stages as the pure oils matrix and ends up dimensions of 100 × 375.
3.4.1.1. Tuning 1: Exploratory PLS-R
The analysis employed four latent variables (LVs), accounting for 99.68% of the cumulative variance. The exploratory analysis presented Root Mean Square Error for calibration (RMSEC) and cross-validation (RMSECV) of 3.61 and 3.95, respectively. As illustrated in Figure S3a, the regression line fit (slope = 0.946), the coefficients of determination (R2Cal = 0.95 and R2CV = 0.93), and the bias values (~0) for the calibration and CV sets are demonstrated. Moreover, the plot shows the relationship between gravimetrically determined oleic acid content (x-axis) and model-predicted content (y-axis). Figure S3b shows the studentised residual plot, where no sample was considered an outlier according to this criterion. However, in Figure 10, 14 atypical samples (XATR FR-IR = 14) which were eliminated for the construction of the PLS-R Model 1.
3.4.1.2. Tuning 2: Establishment of the PLS-R Model 1
The PLS-R Model 1 was developed using the remaining 86 samples and the selection of 4 VLs resulted in an explanation of 99.99% of the cumulative variance. As illustrated in Figure 4, the division of data using the KS algorithm resulted in the separation of 65 and 21 samples for calibration and external validation blocks, respectively.
The RMSEs obtained were 2.33, 2.48 and 2.06, and the R2 were 0.98, 0.96 and 0.97 for the calibration, CV and external validation sets, respectively. Figure S4a provides a visual representation of the regression lines, with slopes of 0.976 (fit), 0.979 (calibration) and 0.963 (external validation), along with R2 values of 0.98 and bias (~0) in all blocks. As demonstrated in Figure S4b, the studentised residuals reveal an absence of outliers under this criterion. However, Figure 11 revealed the presence of 4 anomalous samples (YATR FR-IR = 4) in the calibration set, which were excluded from the final Model.
The evaluation of the prediction of externally validated samples is achieved by the utilisation of the SEP, RPD, and RER metrics [51,52], as illustrated in Table 1.
3.4.2. PLS-R Model 2 Development with FORS. NIR Fingerprints
The FORS blends matrix which has dimensions of 100×2151, was subjected to the pre-processing steps described in Figure S2 (applying SNV, SG filter, and Mean Center).
3.4.2.1. Tuning 1: Exploratory PLS-R
For this exploratory PLS-R, 8 LVs were used, accounting for 95.36% of the cumulative variance. This exploratory analysis yielded error metrics RMSEC and RMSECV of 1.99 and 3.99, respectively. Figure S5a shows the regression fit (slope = 0.984), the coefficients of determination (R2Cal = 0.98 y R2CV = 0.93) and the bias (~0) for both the calibration and CV blocks. The figure also displays the multivariate regression line plot. Figures S5b and S5c present the studentised residuals and residual plots, respectively, where analogous samples were excluded - two in this case (XFORS= 2).
3.4.2.2. Tuning 2: Establishment of the PLS-R Model 2
The PLS-R model was constructed using the remaining 98 samples and established with 6 LVs, explaining 95.00% of the cumulative variance. Data split carried out using KS algorithm as PLS-R Model 1 (see Figure 4).
The RMSEs obtained were 2.37, 3.03, and 2.58, with R2 values of 0.98, 0.96, and 0.97 for the calibration, CV and prediction (external validation) sets, respectively. In all cases, the bias values were found to be less than 1 and close to 0 (see Figure S6a). As shown in Figure S6b, the studentised residuals do not exclude any samples, while the residuals detect 3 outliers in the calibration set and 2 additional ones in the external validation set (YFORS= 5), as can be seen in Figure S6c.
Finally, the predictive capability of the externally validated samples was evaluated by means of the SEP, RPD, and RER metrics [51,52], whose values are presented in Table 2.
3.4.3. Evaluation of the Predictive Capability of the PLS-R Models
Once the model was developed, the prediction stage was performed using 10 samples of commercial sunflower oils (SFO, MOSFO, and HOSFO), in accordance with the scheme illustrated in Figure 4.
To predict the 10 unknown samples using both models, 4 VLs were utilised in each case. These accounted for 99.99% and 87.08% of the cumulative variance in the PLS-R Model 1 and PLS-R Model 2, respectively. It was ascertained that the RMSEs, the R2 and bias values, remained within the designated ranges in all blocks. The parameters, in conjunction with the adjustments of the multivariate regression lines, are presented in Figures S7a and S7b. The SEP, RER and RPD metrics, which evaluate the predictive power of PLS-R models 1 and 2, are shown in Table 3. The results of the determination of oleic acid content obtained using the developed PLS-R chemometric models are shown in Table S2.
In the case of PLS-R Model 1 (ATR-FTIR Model), the prediction of commercial sunflower oil samples was found to be highly successful, as evidenced by the low SEP value (3.07), the RPD value that significantly exceeded the threshold of 3 (7.09), and the RER value that was notably higher than 15 (17.82). Consequently, the model is deemed appropriate for the accurate quantification of unknown samples.
In the case of PLS-R Model 2 (FORS Model), the performance in predicting samples decreased considerably, especially for those corresponding to the SFO type. However, despite the higher error rate in comparison to the other PLS-R Model, it still exceeds the criterion of RPD > 3 (4.60), thus being considered and excellent model. Furthermore, with an RER greater than 10, it fulfils its objective as a FORS methodology combined with PLS-R, making it suitable for screening and quality control purposes in various scenarios. Due to its portability, it is suitable for application both in the laboratory and in-situ (factory, distributor, and final point of sale).
3.4.4. Quantification of Oleic Acid in MOSFOs and Inconclusive Samples of the Study of Authentication Using ATR FTIR Fingerprints
Once PLS-R models had been established based on the binary blends, its predictive capacity was evaluated using 10 reference samples, whose oleic acid content had been previously determined by GC-FID, following the official method [16].
Subsequently, PLS-R Model 1 is used for predictive the oleic acid content of an SFO sample and an HOSFO sample that were in ambiguous regions within the discrimination/classification models developed using SIMCA, PLS-DA and SVM was predicted, as well as the set of 15 MOSFO samples. Table 5 presents the oleic acid content prediction values were obtained using the PLS-R Model 1.
The findings derived from the PLS-R Model 1 corroborate the observations recorded in the discrimination/classification models. Specifically, a sample labelled as conventional sunflower oil was identified as actually corresponding to medium oleic sunflower oil and similarly, an oil classified as high oleic showed similar behaviour since really a MOSFO sample.
In the medium oleic sunflower oil group, the PLS-DA and SVM models also revealed the presence of 6 samples that corresponded to SFO, in the SIMCA model were 4 samples. However, PLS-DA and SVM models detect incorrectly sample MOSFO-50 as medium oleic since PLS-R Model 1, yes detected, although the difference from the SFO class was less than 1.7% error relative. In compared with SIMCA model, this model detect incorrectly sample coded as MOSFO-46 like MOSFO sample, since de relative error 1.37%.
4. Conclusions
Sunflower oil is cultivated and consumed in many regions globally, presenting considerable challenges for authentication and quality control. This is particularly pertinent given the increasing cultivation of types with higher oleic acid content, which are prized for their superior physicochemical and nutritional properties.
In this study, robust benchtop equipment based on ATR-FTIR was employed to record instrumental spectroscopic fingerprints, which were then combined with various chemometric tools. Unsupervised models (PCA and HCA) allowed the natural grouping of commercial sunflower oil to be observed, serving as a preliminary step to authentication of SFO, MOSFO and HOSFO constructing supervised models (SIMCA, PLS-DA and SVM).
Given the variability of the MOSFO group and the particular interest in oleic acid, which not only defines the nutritional value of the oil but also constitutes a key marker for differentiating between different types of sunflower oil, another portable spectroscopic technique (FORS) was employed alongside ATR FTIR (benchtop). A multivariate regression models were developed for each technique to quantify the acid oleic content in commercial sunflower oils and comply more strictly with current legislation and normative. It is shown that SFOs characteristics its higher linoleic acid content can, in some cases, have a higher oleic acid content than expected. Furthermore, not all MOSFO exhibit the same behaviour. It is also demonstrated that, in some instances, the GM-seeds do not reach the minimum oleic acid content required for MOSFO, and particularly for HOSFO.
The implementation of both techniques, using benchtop and portable instrument, demonstrated their efficacy in the recording of instrumental fingerprints of commercial oils and binary blends prepared at the laboratory level. It was determined that the portable FORS-based equipment is ideal for rapid screening and in situ quality control of oleic acid, while ATR-FTIR-based benchtop equipment is a suitable tool for comprehensive and demanding quantification, achieving outstanding results (RPD = 7.09 and RER = 17.82).
Supplementary Materials
The following supporting information can be downloaded at the website of this paper posted on Preprints.org.
References
- Murphy, D. J. Agronomy and Environmental Sustainability of the Four Major Global Vegetable Oil Crops: Oil Palm, Soybean, Rapeseed, and Sunflower. Agronomy 2025, 15(6), 1465. [Google Scholar] [CrossRef]
- Petrenko, V.; Topalov, A.; Khudolii, L.; Honcharuk, Y.; Bondar, V. Profiling and geographical distribution of seed oil content of sunflower in Ukraine. Oil crop sci. 2023, 8(2), 111–120. [Google Scholar] [CrossRef]
- Pilorgé, E. Sunflower in the global vegetable oil system: situation, specificities and perspectives. OCL 2020, 27(34). [Google Scholar] [CrossRef]
- Nakonechna, K.; Ilko, V.; Berčíková, M.; Vietoris, V.; Panovská, Z.; Doležal, M. Nutritional, utility, and sensory quality and safety of sunflower oil on the central European market. Agriculture 2024, 14(4), 536. [Google Scholar] [CrossRef]
- FAO. Standard for named vegetable oils CSX 210-1999. Codex Alimentarius (2025). Available online: https://www.fao.org/fao-who-codexalimentarius/sh-proxy/es/?lnk=1&url=https%253A%252F%252Fworkspace.fao.org%252Fsites%252Fcodex%252FStandards%252FCXS%2B210-1999%252FCXS_210e.pdf (accessed on 11 November 2025).
- Real Decreto 351/2025 (30th april) approving the quality standard for edible vegetable oils. Boletín Oficial del Estado, No. 119, of 17 May 2025; BOE A 2025 9738. Available online: https://www.boe.es/diario_boe/txt.php?lang=es&id=BOE-A-2025-9738.
- Soldatov, K. Chemical Mutagenesis in Sunflower Breeding. Proceedings of the 7th International Sunflower Conference, Krasnodar, USSR, International Sunflower Association, Vlaardingen, The Netherlands (1976), pp. 352-357.
- Dunford, N. T. Martínez-Force, E.; Salas, J. J. (2022). Chapter 5 – High-oleic sunflower seed oil. In High Oleic Oils. Flider, F. J. (Ed.), Development, Properties, and Uses (pp. 109-124). American Oil Chemist’s Society Press. [CrossRef]
- Uslu, Y. Z.; Ural, B. N.; Cebrailoglu, N.; Aydın, Y.; Ciftci, Y. O.; Uncuoglu, A. A. CRISPR/Cas9-mediated targeted mutagenesis of FAD2-1 gene for oleic acids composition in sunflower. G&A 2022, 6(2), 89–102. [Google Scholar] [CrossRef]
- Zambelli, A.; León, A.; Garcés, R. Mutagenesis in sunflower. In Sunflower; AOCS Press, 2015; pp. 27–52. [Google Scholar]
- Alvarez Graña, S.; Abarquero, D.; Claro, J.; Combarros-Fuertes, P.; Fresno, J.M.; Eugenia; Tornadijo, M. Behaviour of sunflower (Helianthus annuus L.) oil and high oleic sunflower oil during the frying of churros. Food Chem. Adv. 2025, 6, 100899. [Google Scholar] [CrossRef]
- Alvarez Graña, S.; Abarquero, D.; Claro, J.; Combarros-Fuertes, P.; Fresno, J.M.; Eugenia; Tornadijo, M. Behaviour of sunflower (Helianthus annuus L.) oil and high oleic sunflower oil during the frying of churros. Food Chem. Adv. 2025, 6, 100899. [Google Scholar] [CrossRef]
- COI/T.20/Doc. No 20/Rev. 4; Method of Analysis. Difference between Actual and Theoretical Content of Triacyclglycerols with ECN 42. International Olive Council: Madrid, Spain, 2017.
- COI/T.20/Doc. No 33/Rev.1 2017. Determination of fatty acid methyl esters by gas chromatography. Madrid: International Olive Council (IOC).
- COI/T.20/Doc. No 26/Rev. 4; Determination of the Sterol Composition and Content and Alcoholic Compounds by Capillary Gas Chromatography. International Olive Council: Madrid, Spain, 2018.
- Pointner, T.; Rauh, K.; Auñon-Lopez, A.; Veličkovska, S. K.; Mitrev, S.; Arsov, E.; Pignitter, M. Comprehensive analysis of oxidative stability and nutritional values of germinated linseed and sunflower seed oil. Food Chem. 2024, 454, 139790. [Google Scholar] [CrossRef]
- Jabeur, H.; Drira, M.; Bouaziz, M. Targeted authentication approach for the control of the contamination of refined olive oil by refined seeds oils using chromatographic techniques and chemometrics models. Eur. Food Res. Technol. 2021, 247(10), 2455–2472. [Google Scholar] [CrossRef]
- Du, Q.; Zhu, M.; Shi, T.; Luo, X.; Gan, B.; Tang, L.; Chen, Y. Adulteration detection of corn oil, rapeseed oil and sunflower oil in camellia oil by in situ diffuse reflectance near-infrared spectroscopy and chemometrics. Food Control 2021, 121, 107577. [Google Scholar] [CrossRef]
- Taous, F.; El Ghali, T.; Marah, H.; Laraki, K.; Islam, M.; Cannavan, A.; Kelly, S. Geographical classification of authentic Moroccan Argan oils and the rapid detection of soya and sunflower oil adulteration with ATR-FTIR spectroscopy and chemometrics. Food Anal. Methods 2022, 15(11), 3032–3044. [Google Scholar] [CrossRef]
- Haldar, S.; Srivastava, S.; Mishra, H. N.; Banerjee, S. Determination of curcumin content in sunflower oil by fourier transform near infrared spectroscopy. J. Food Meas. Charact. 2023, 17(1), 24–32. [Google Scholar] [CrossRef]
- Jiménez-Hernández, G.; Ortega-Gavilán, F.; González-Casado, A.; Bagur-González, M. G. Using a portable Raman-SORS spectrometer as an easy way to authenticate high oleic sunflower oil. Food Control 2025, 111443. [Google Scholar] [CrossRef]
- Chitra, J.; Ghosh, M.; Mishra, H. N. Rapid quantification of cholesterol in dairy powders using Fourier transform near infrared spectroscopy and chemometrics. Food Control 2017, 78, 342–349. [Google Scholar] [CrossRef]
- Mehany, T.; González-Sáiz, J. M.; Pizarro, C. The Quality Prediction of Olive and Sunflower Oils Using NIR Spectroscopy and Chemometrics: A Sustainable Approach. Foods 2025, 14(13), 2152. [Google Scholar] [CrossRef] [PubMed]
- Rodriguez-Saona, L. E.; Allendorf, M. E. Use of FTIR for rapid authentication and detection of adulteration of food. ARFST 2011, 2(1), 467–483. [Google Scholar] [CrossRef] [PubMed]
- Su, N.; Weng, S.; Wang, L.; Xu, T. Reflectance spectroscopy with multivariate methods for non-destructive discrimination of edible oil adulteration. Biosensors 2021, 11(12), 492. [Google Scholar] [CrossRef]
- García del Moral, L.F.; Morgado, A.; Esquivel, J.A. Espectroscopia de Reflectancia de Fibra Óptica (FORS) de las principales canteras de rocas silíceas de Andalucía y su aplicación a la identificación de la procedencia de artefactos líticos tallados durante la Prehistoria. Complutum 2022, 33, 35–67. [Google Scholar] [CrossRef]
- Pal, P.; Stephen, J.; Mathew, J. Fiber Optic Device for the Detection of Adulteration of Olive Oil With Palm Oil. Microw. Opt. Technol. Lett. 2025, 67(5), e70210. [Google Scholar] [CrossRef]
- Prieto, N.; Pawluczyk, O.; Dugan, M. E. R.; Aalhus, J. L. A review of the principles and applications of near-infrared spectroscopy to characterize meat, fat, and meat products. Appl. Spectrosc. 2017, 71(7), 1403–1426. [Google Scholar] [CrossRef] [PubMed]
- Medina, S.; Pereira, J. A.; Silva, P.; Perestrelo, R.; Câmara, J. S. Food Fingerprints – A Valuable Tool to Monitor Food Authenticity and Safety. Food Chem. 2019, 278, 144–162. [Google Scholar] [CrossRef] [PubMed]
- Savitzky, A.; Golay, M. J. E. Smoothing and Differentiation of Data by Simplified Least Squares Procedures. Anal. Chem. 1964, 36(8), 1627–1639. [Google Scholar] [CrossRef]
- Chen, J. M.; Pan, T.; Chen, X. D. Application of second derivative spectrum prepares in quantification measuring glucose-6-phosphate and fructose-6-phosphate using a FTIR/ATR method. Optics and Precision Engineering 2006, 14(1), 1–7. [Google Scholar]
- Bathini, V.; Kalakandan, S. K.; Pakkirisamy, M.; Ravichandran, K. Structural elucidation of peanut, sunflower and gingelly oils by using FTIR and 1H NMR spectroscopy. Phcog J. 2018, 10(4). [Google Scholar] [CrossRef]
- Poiana, M. A.; Mousdis, G.; Alexa, E.; Moigradean, D.; Negrea, M.; Mateescu, C. Application of FT-IR spectroscopy to assess the olive oil adulteration. J. Agroaliment. Process Technol. 2012, 18(4), 277–282. [Google Scholar]
- Yi, Y.; Yao, J.; Xu, W.; Wang, L. M.; Wang, H. X. Investigation on the quality diversity and quality-FTIR characteristic relationship of sunflower seed oils. RSC Adv. 2019, 9, 27347–27360. [Google Scholar] [CrossRef]
- Guillen, M.D.; Cabo, N. Usefulness of the frequencies of some Fourier transform infrared spectroscopic bands for evaluating the composition of edible oil mixtures. Lipids/fett 1999, 101(1), 71–76. [Google Scholar] [CrossRef]
- Xie, J.; Pan, T.; Chen, J.; Chen, H.; Ren, X. Joint optimization of Savitzky-Golay smoothing models and partial least squares factors for near-infrared spectroscopic analysis of serum glucose. Chin. J. Anal. Chem. 2010, 342–346. [Google Scholar] [CrossRef]
- Osborne, B. G.; Fearn, T.; Hindle, P. H. Practical NIR spectroscopy with applications in food and beverage analysis; 1993; 227. [Google Scholar]
- Hernández-Sánchez, N.; Gómez-Del-Campo, M. From NIR spectra to singular wavelengths for the estimation of the oil and water contents in olive fruits. Grasas Y Aceites 2018, 69(4), e278–e278. [Google Scholar] [CrossRef]
- Hourant, P.; Baeten, V.; Morales, M. T.; Meurens, M.; Aparicio, R. Oil and fat classification by selected bands of near-infrared spectroscopy. Appl. Spectrosc. 2000, 54(8), 1168–1174. [Google Scholar] [CrossRef]
- Garrido-Cuevas, M. M.; Garrido-Varo, A. M.; Marini, F.; Sánchez, M. T.; Pérez-Marín, D. Enhancing virgin olive oil authentication with Bayesian probabilistic models and near infrared spectroscopy. J Food Eng. 2025, 391, 112443. [Google Scholar] [CrossRef]
- Kennard, R.; Stone, L. Computer Aided Design of Experiments. Technometrics 1969, 11, 137–148. [Google Scholar] [CrossRef]
- Williams, P. C., & Sobering, D. C. (1996). How do we do it: a brief summary of the methods we use in developing near infrared calibrations. Near infrared spectroscopy: The future waves, 185-188.
- Guerrero, C.; Zornoza, R.; Perez-Belmonte, A.; Bejarano, J.; Mataix-Solera, J.; Gómez- Lucas, I.; García-Orenes, F. Uso de la espectroscopía en el infrarrojo cercano (NIR) para la estimación rápida del carbono orgánico y la respiración basalen suelos forestales. Cuad. Soc. Esp. Cienc. For. 2008, 25, 209–214. [Google Scholar]
- Sim, J.; McGoverin, C.; Oey, I.; Frew, R.; Kebede, B. Near-infrared reflectance spectroscopy accurately predicted isotope and elemental compositions for origin traceability of coffee. Food Chem. 2023, 427, 136695. [Google Scholar] [CrossRef] [PubMed]
Figure 1.
ATR-FTIR spectrum of a MOSFO sample coded as M7 with the spectral elucidation of the most informative peaks and regions.
Figure 1.
ATR-FTIR spectrum of a MOSFO sample coded as M7 with the spectral elucidation of the most informative peaks and regions.
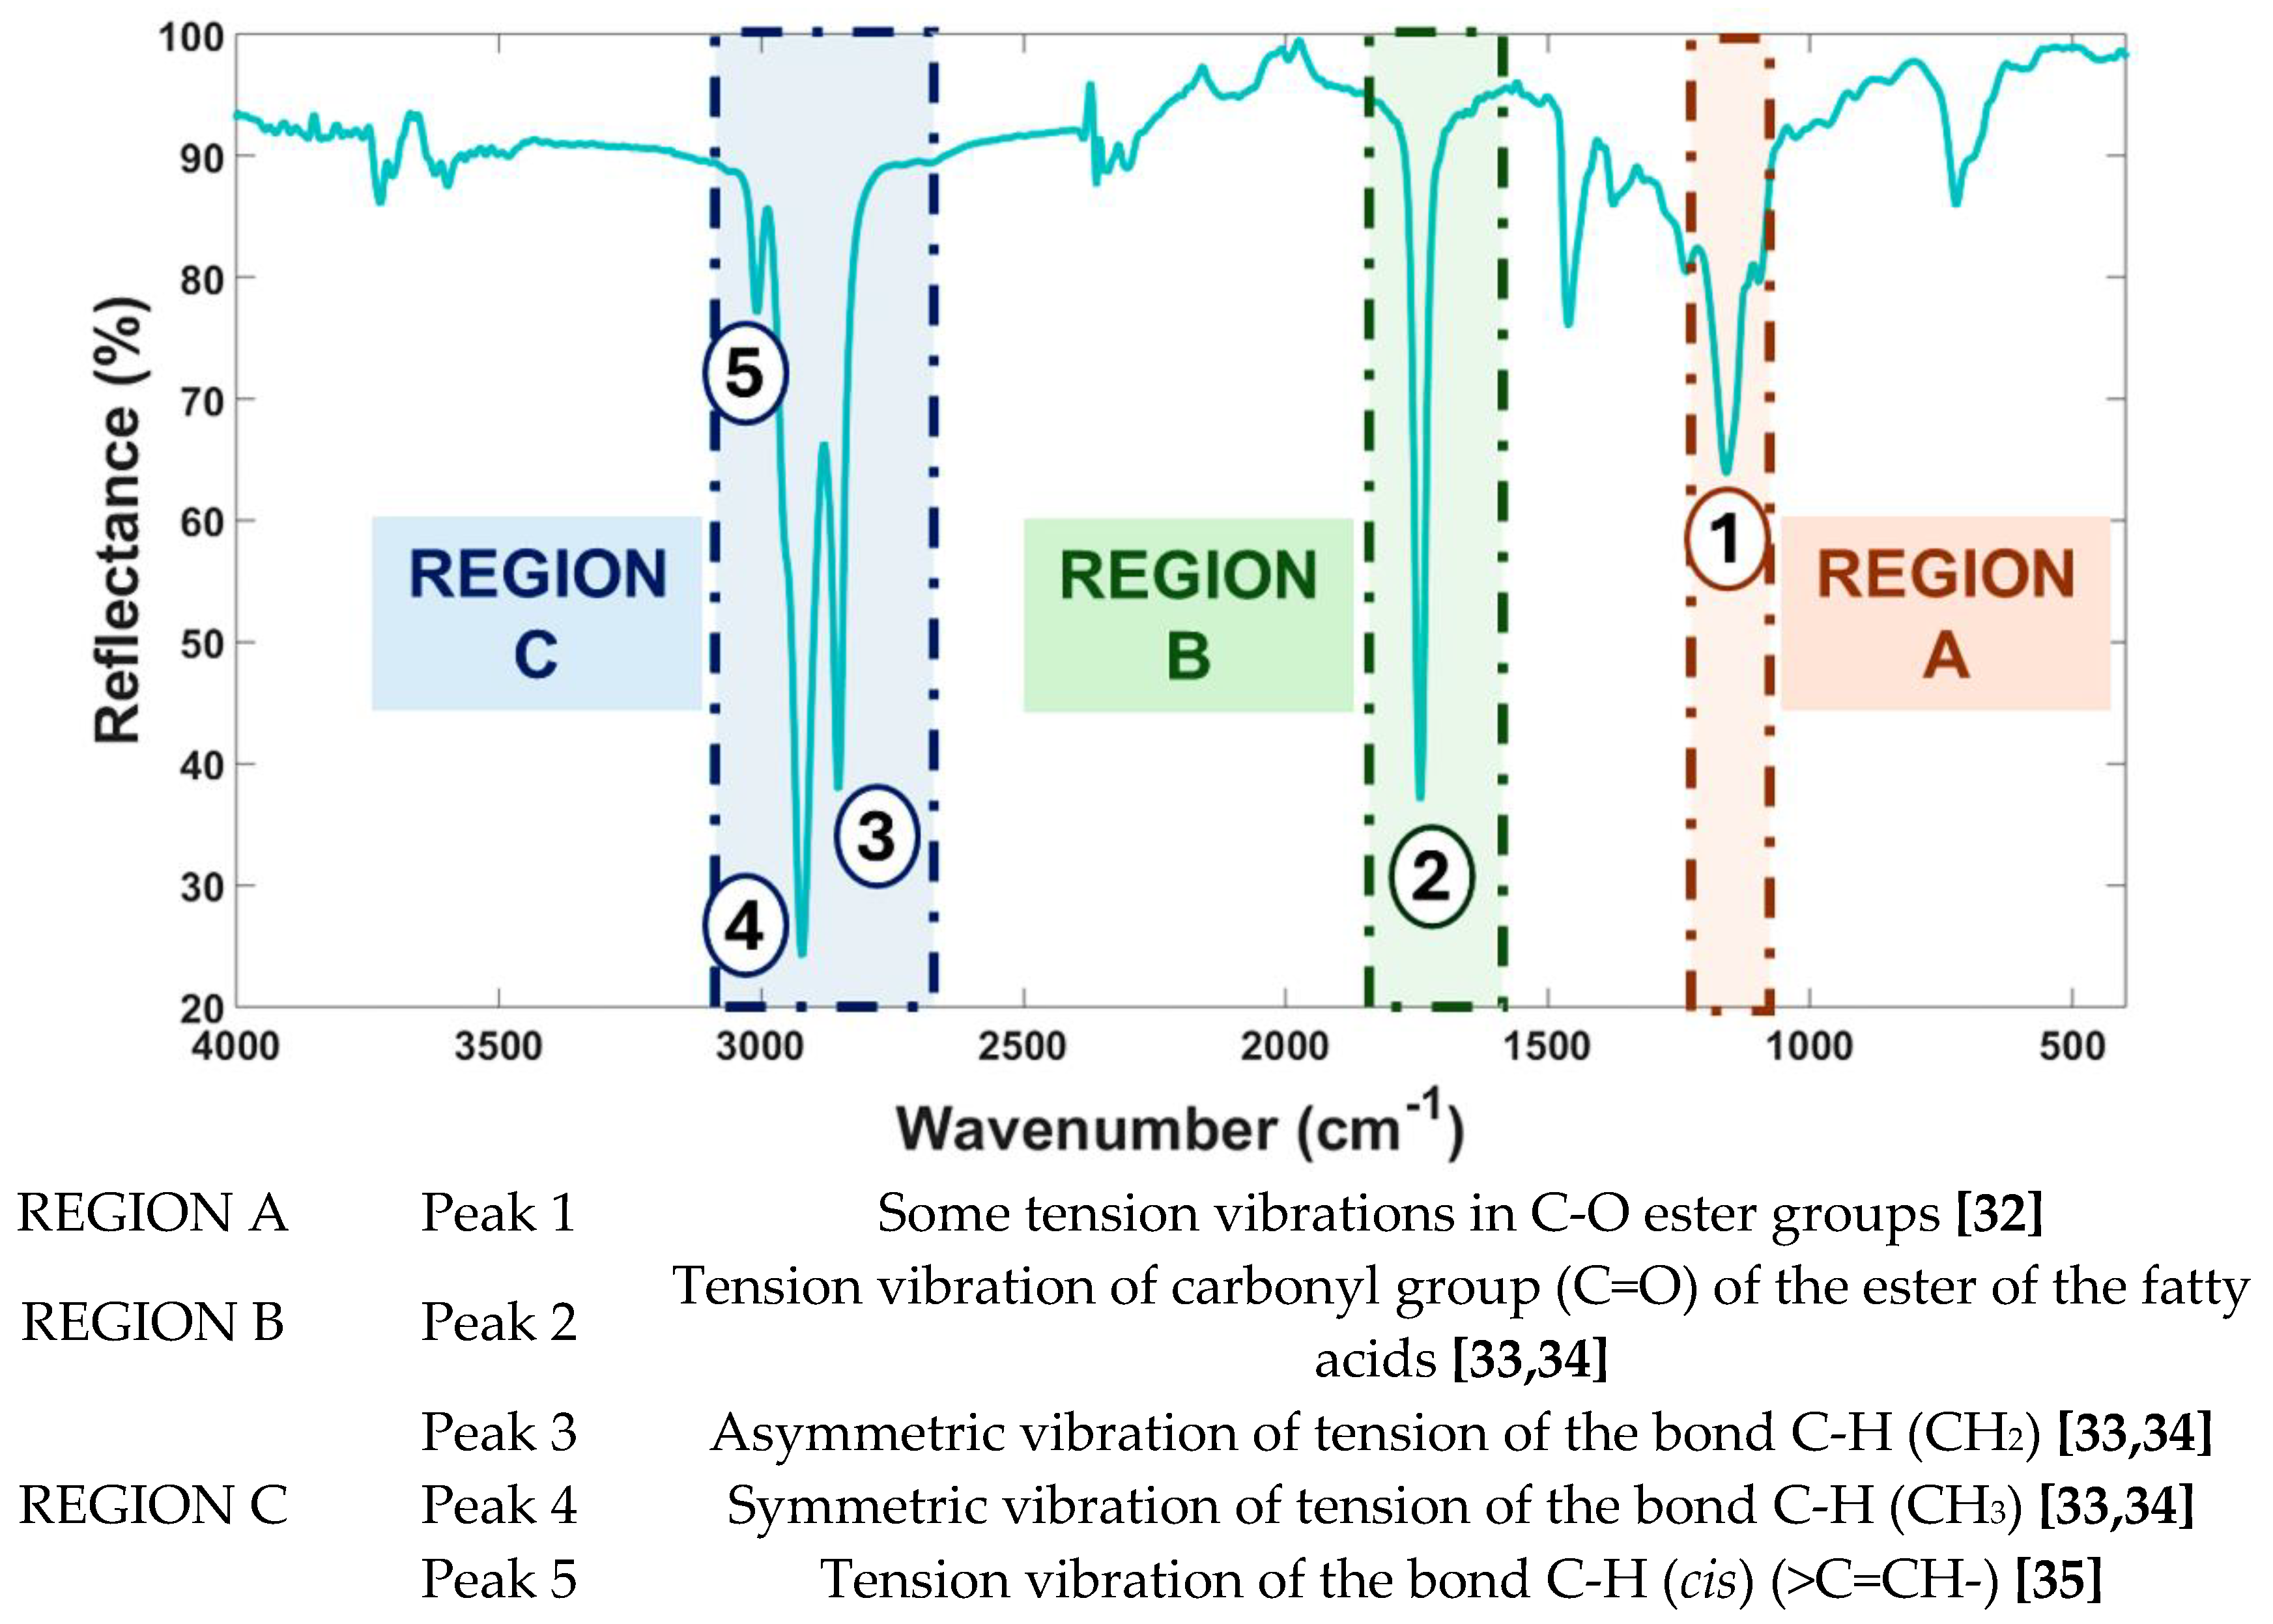
Figure 2.
FORS spectra with the spectral elucidation of the most informative peaks and regions.
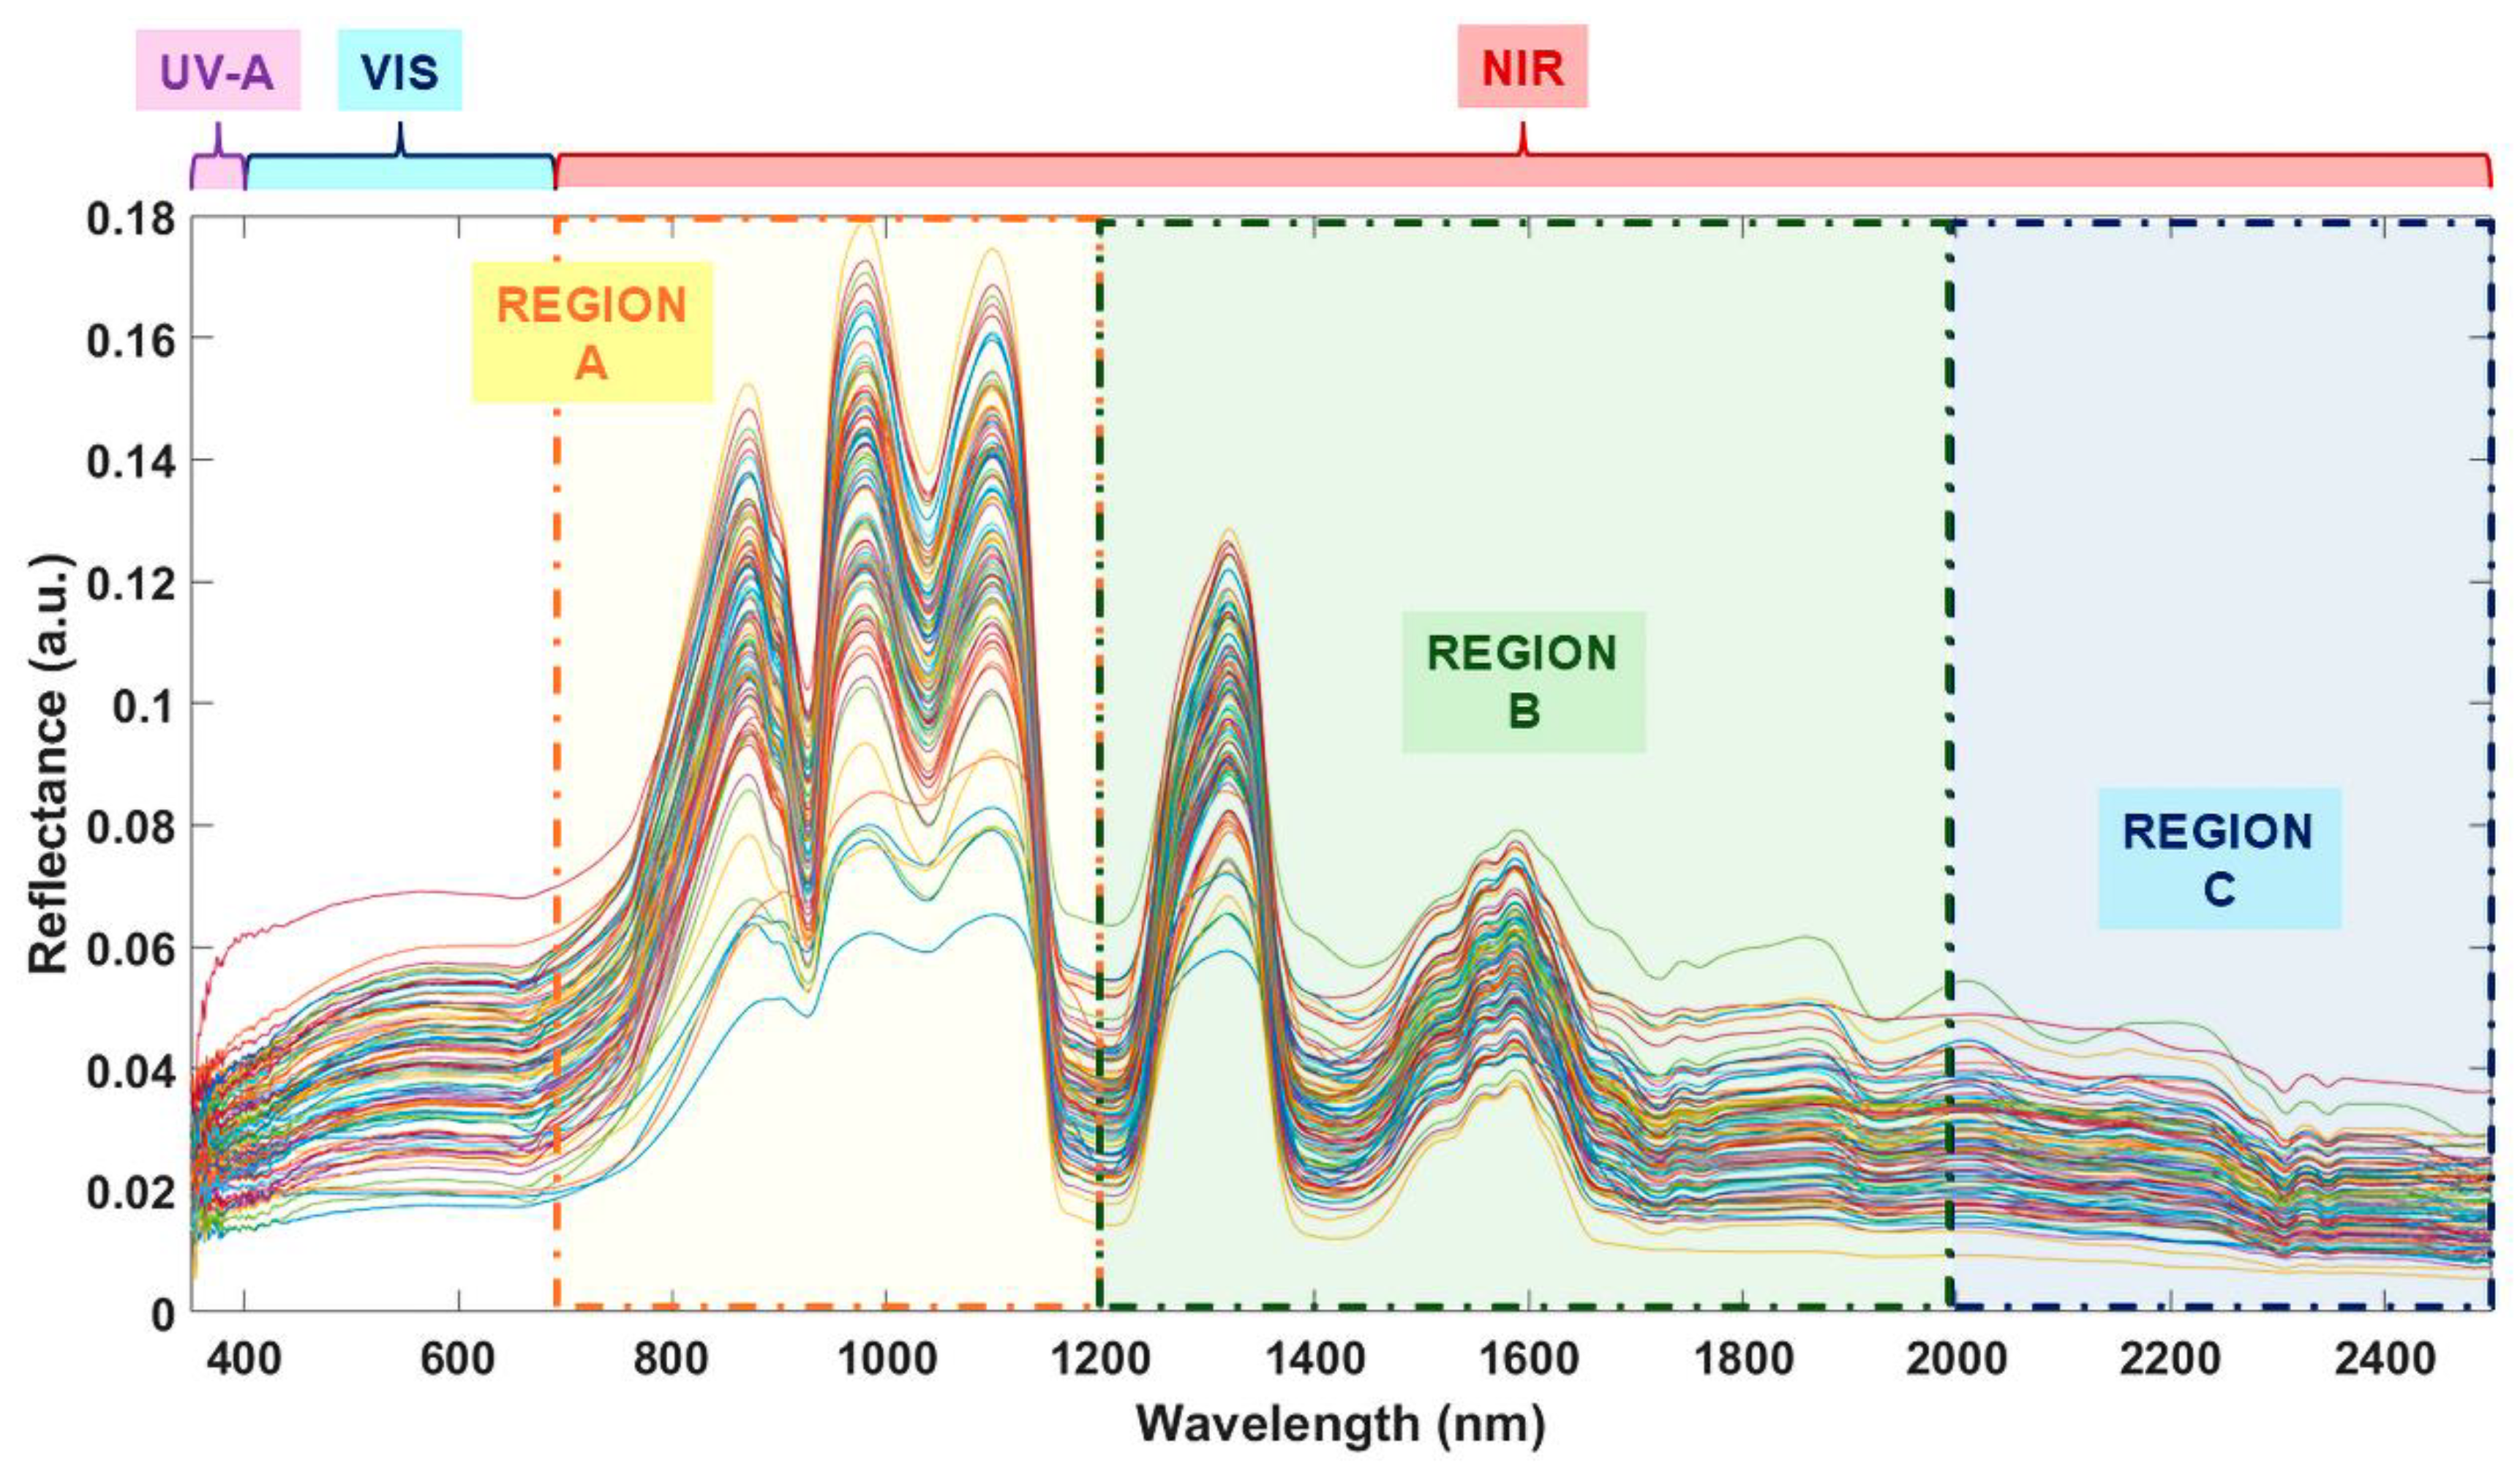
Figure 3.
Assignment of samples to each set in the chemometric models developed for the authentication of commercial sunflower oils from ATR-FTIR fingerprints.
Figure 3.
Assignment of samples to each set in the chemometric models developed for the authentication of commercial sunflower oils from ATR-FTIR fingerprints.
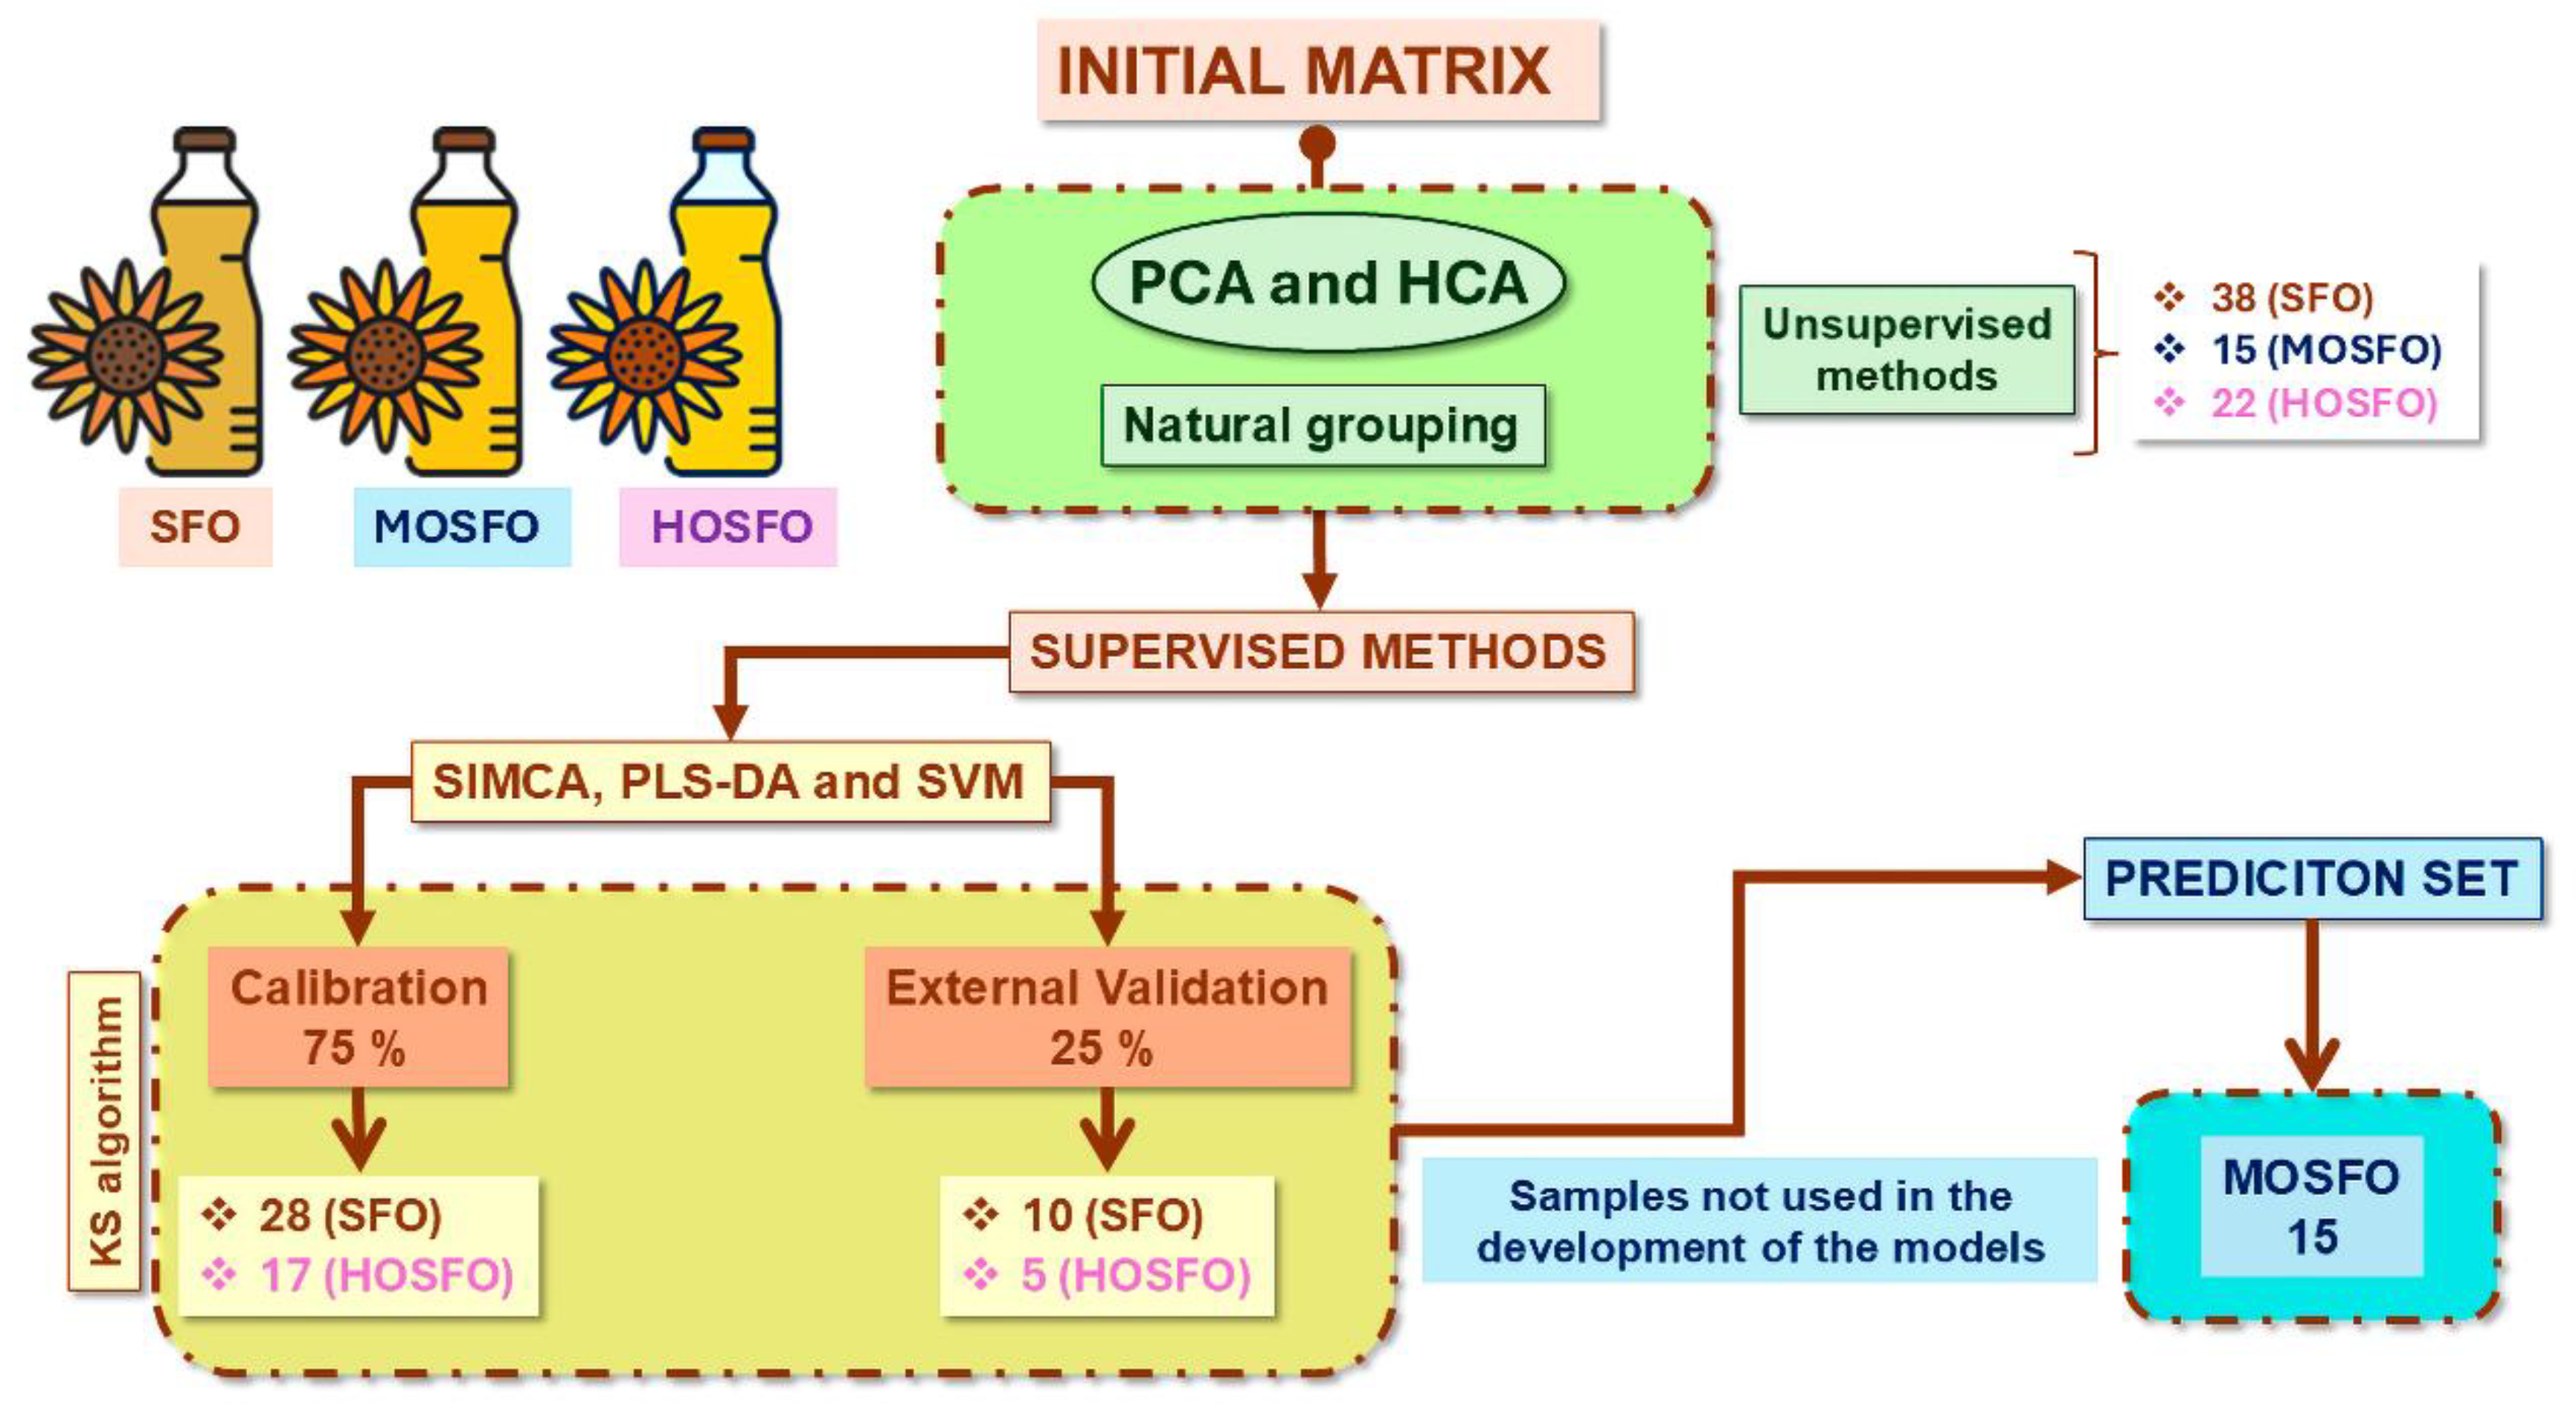
Figure 4.
Assignment of samples to each set in the chemometric models developed for the quantification of oleic acid in commercial sunflower oils using ATR-FTIR and FORS spectroscopic techniques in combination with PLS-R.
Figure 4.
Assignment of samples to each set in the chemometric models developed for the quantification of oleic acid in commercial sunflower oils using ATR-FTIR and FORS spectroscopic techniques in combination with PLS-R.
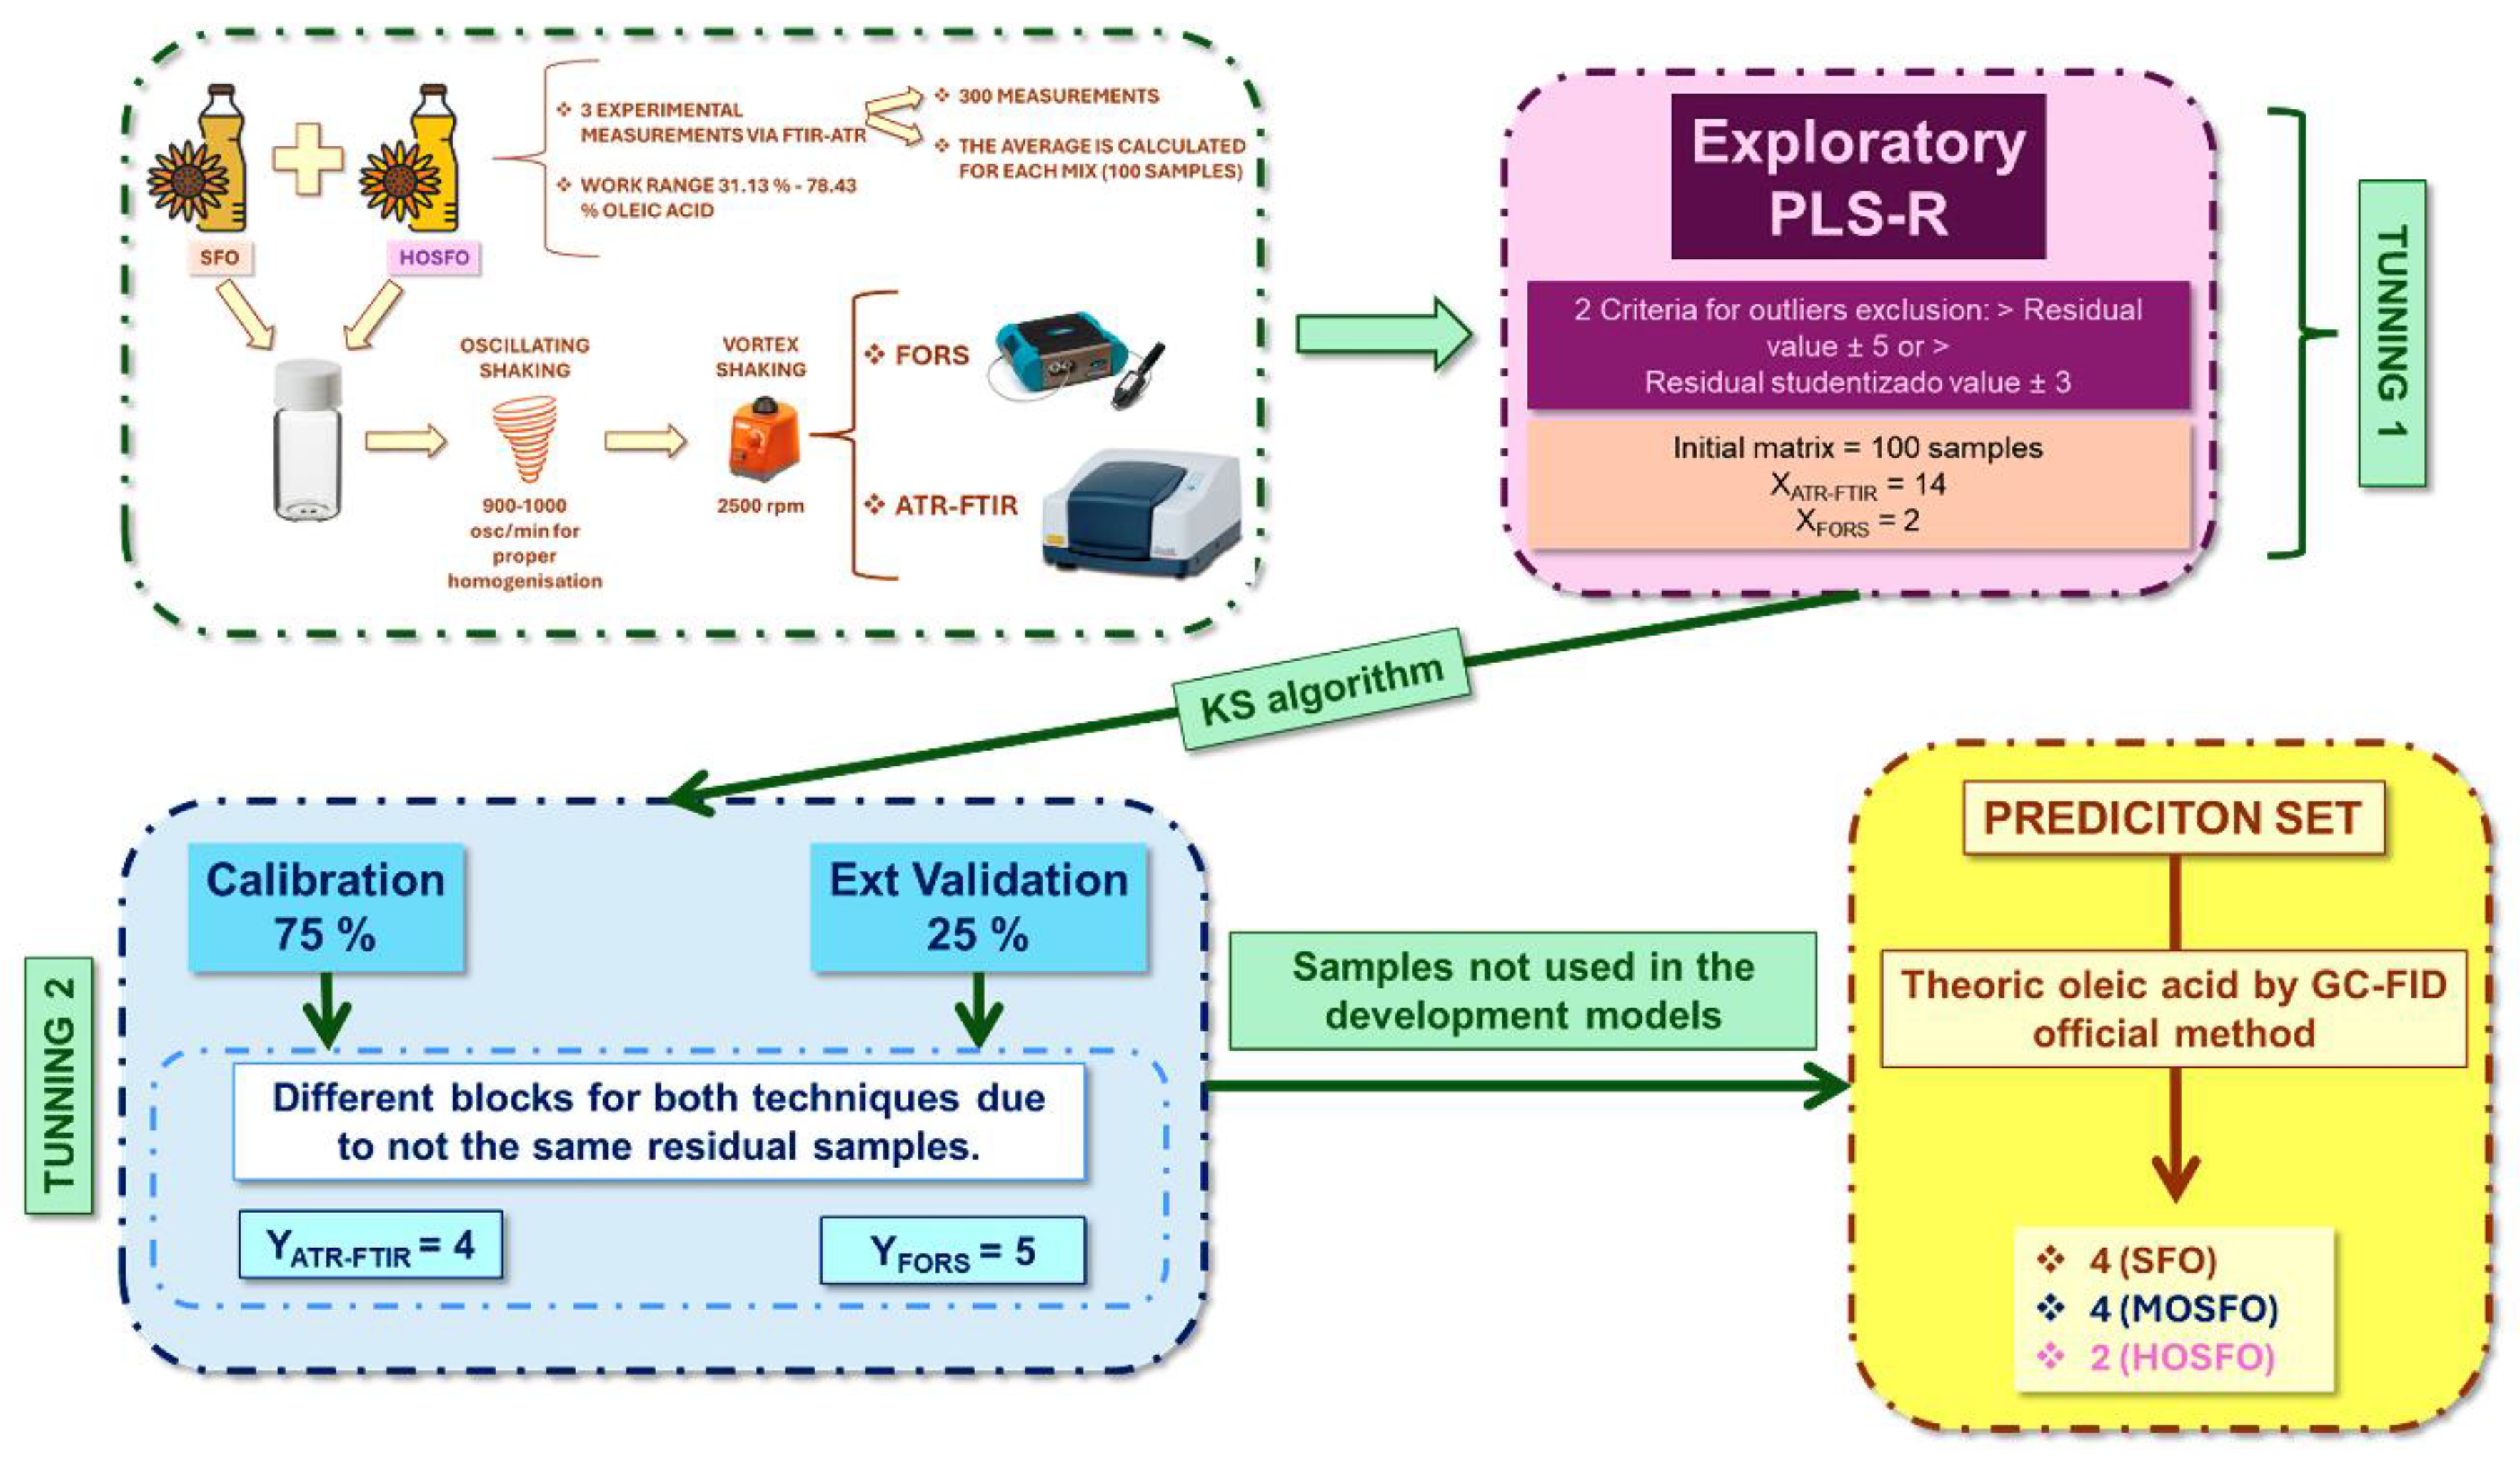
Figure 5.
Dendrograms obtained from hierarchical cluster analysis (HCA) of commercial sunflower oils analysed using ATR-FTIR spectroscopy.
Figure 5.
Dendrograms obtained from hierarchical cluster analysis (HCA) of commercial sunflower oils analysed using ATR-FTIR spectroscopy.
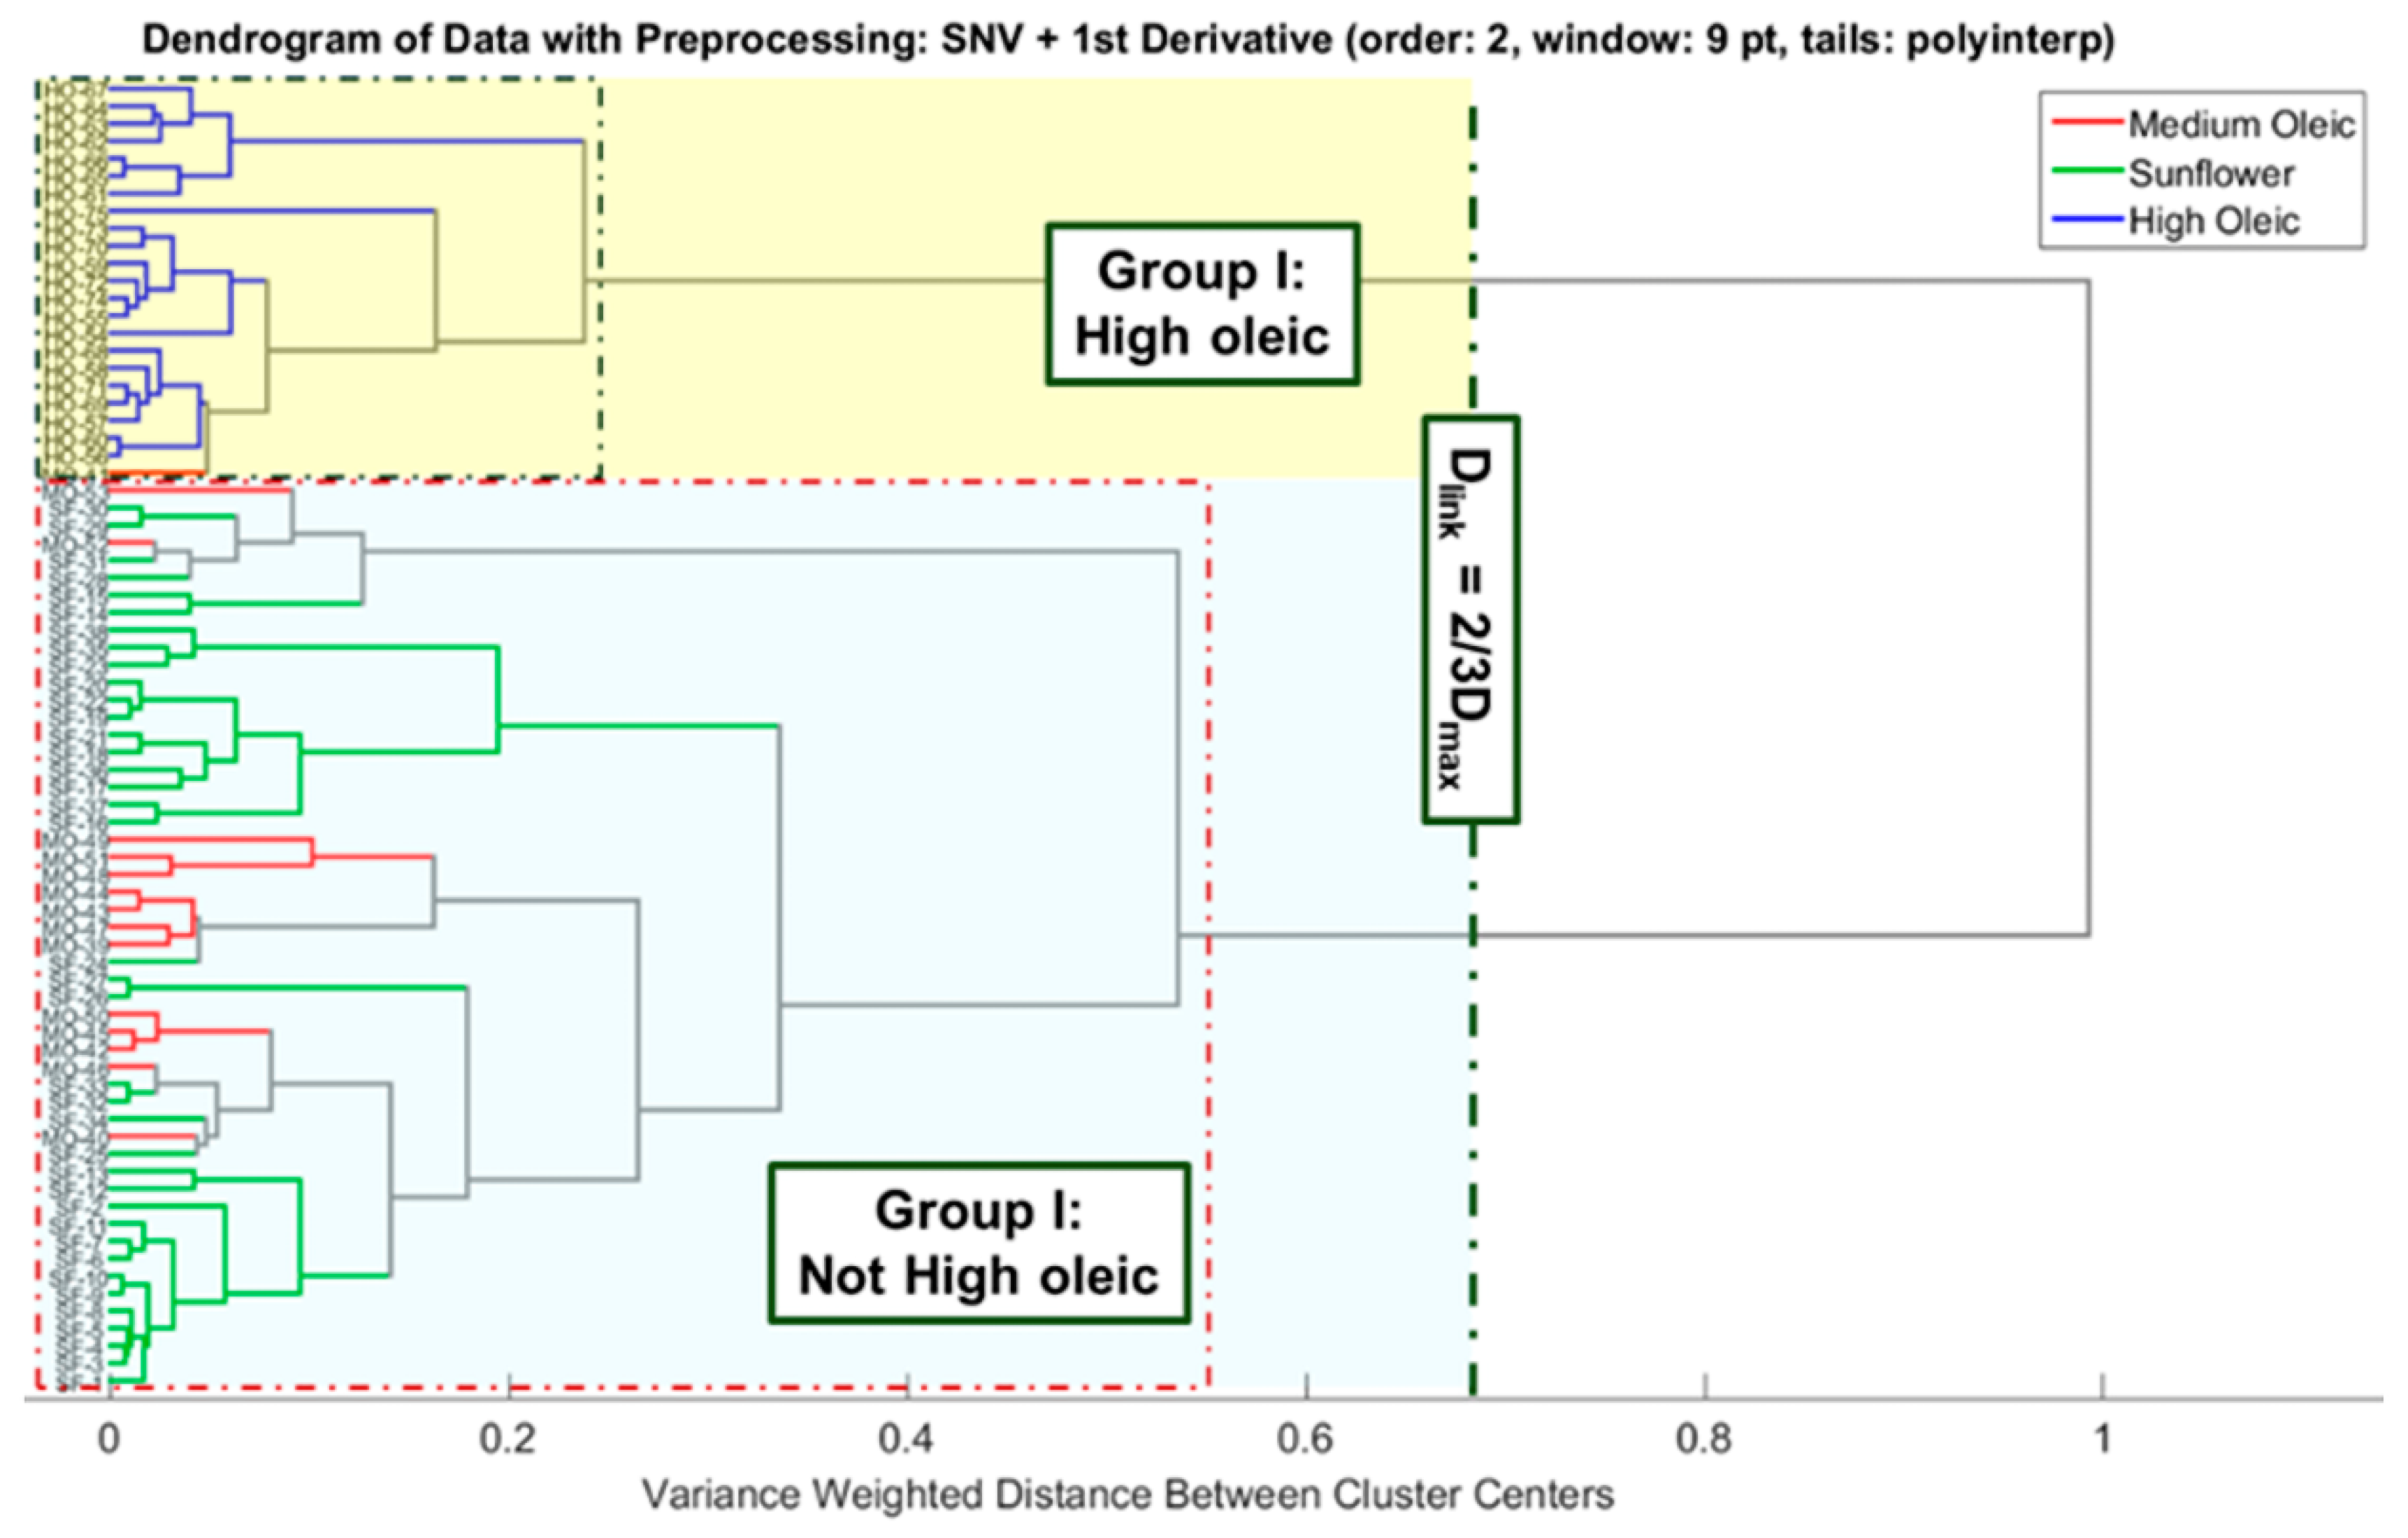
Figure 6.
PCA score plots defined by PC2 vs. PC1 for commercial sunflower oils analysed using ATR-FTIR equipment.
Figure 6.
PCA score plots defined by PC2 vs. PC1 for commercial sunflower oils analysed using ATR-FTIR equipment.
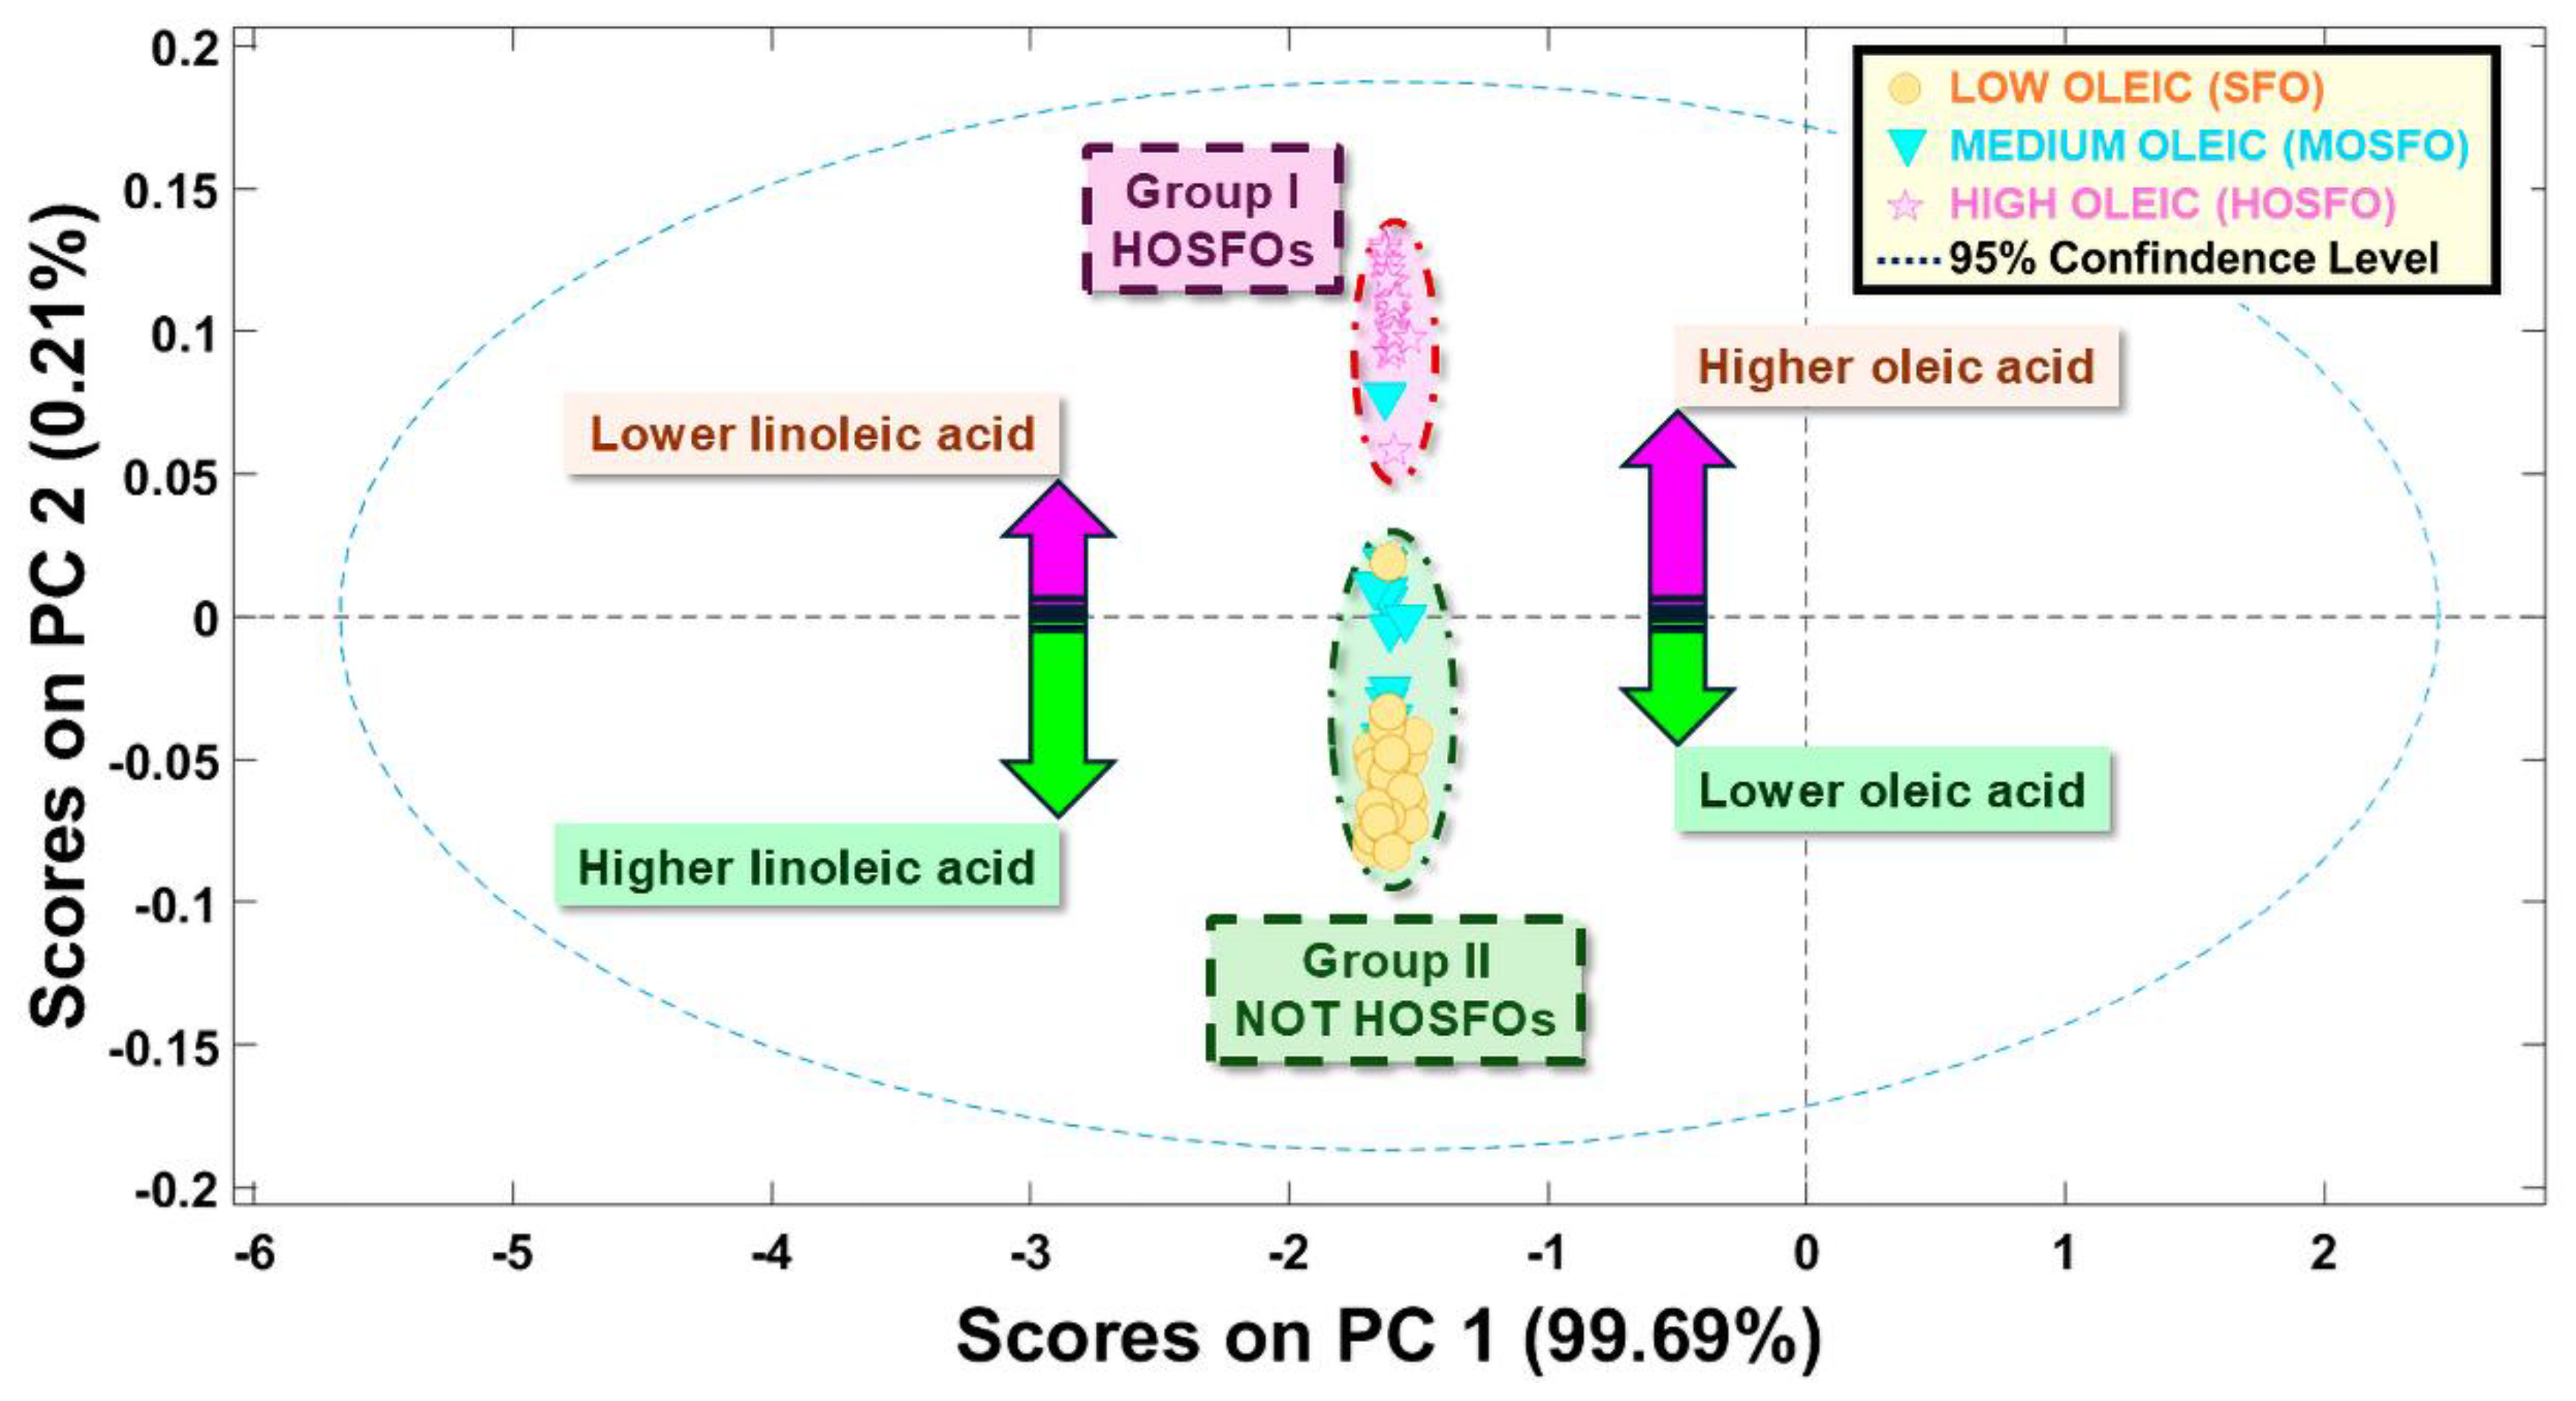
Figure 7.
Cooman’s plot by SIMCA model development with the calibration set and a) external validation set or b) prediction set.
Figure 7.
Cooman’s plot by SIMCA model development with the calibration set and a) external validation set or b) prediction set.
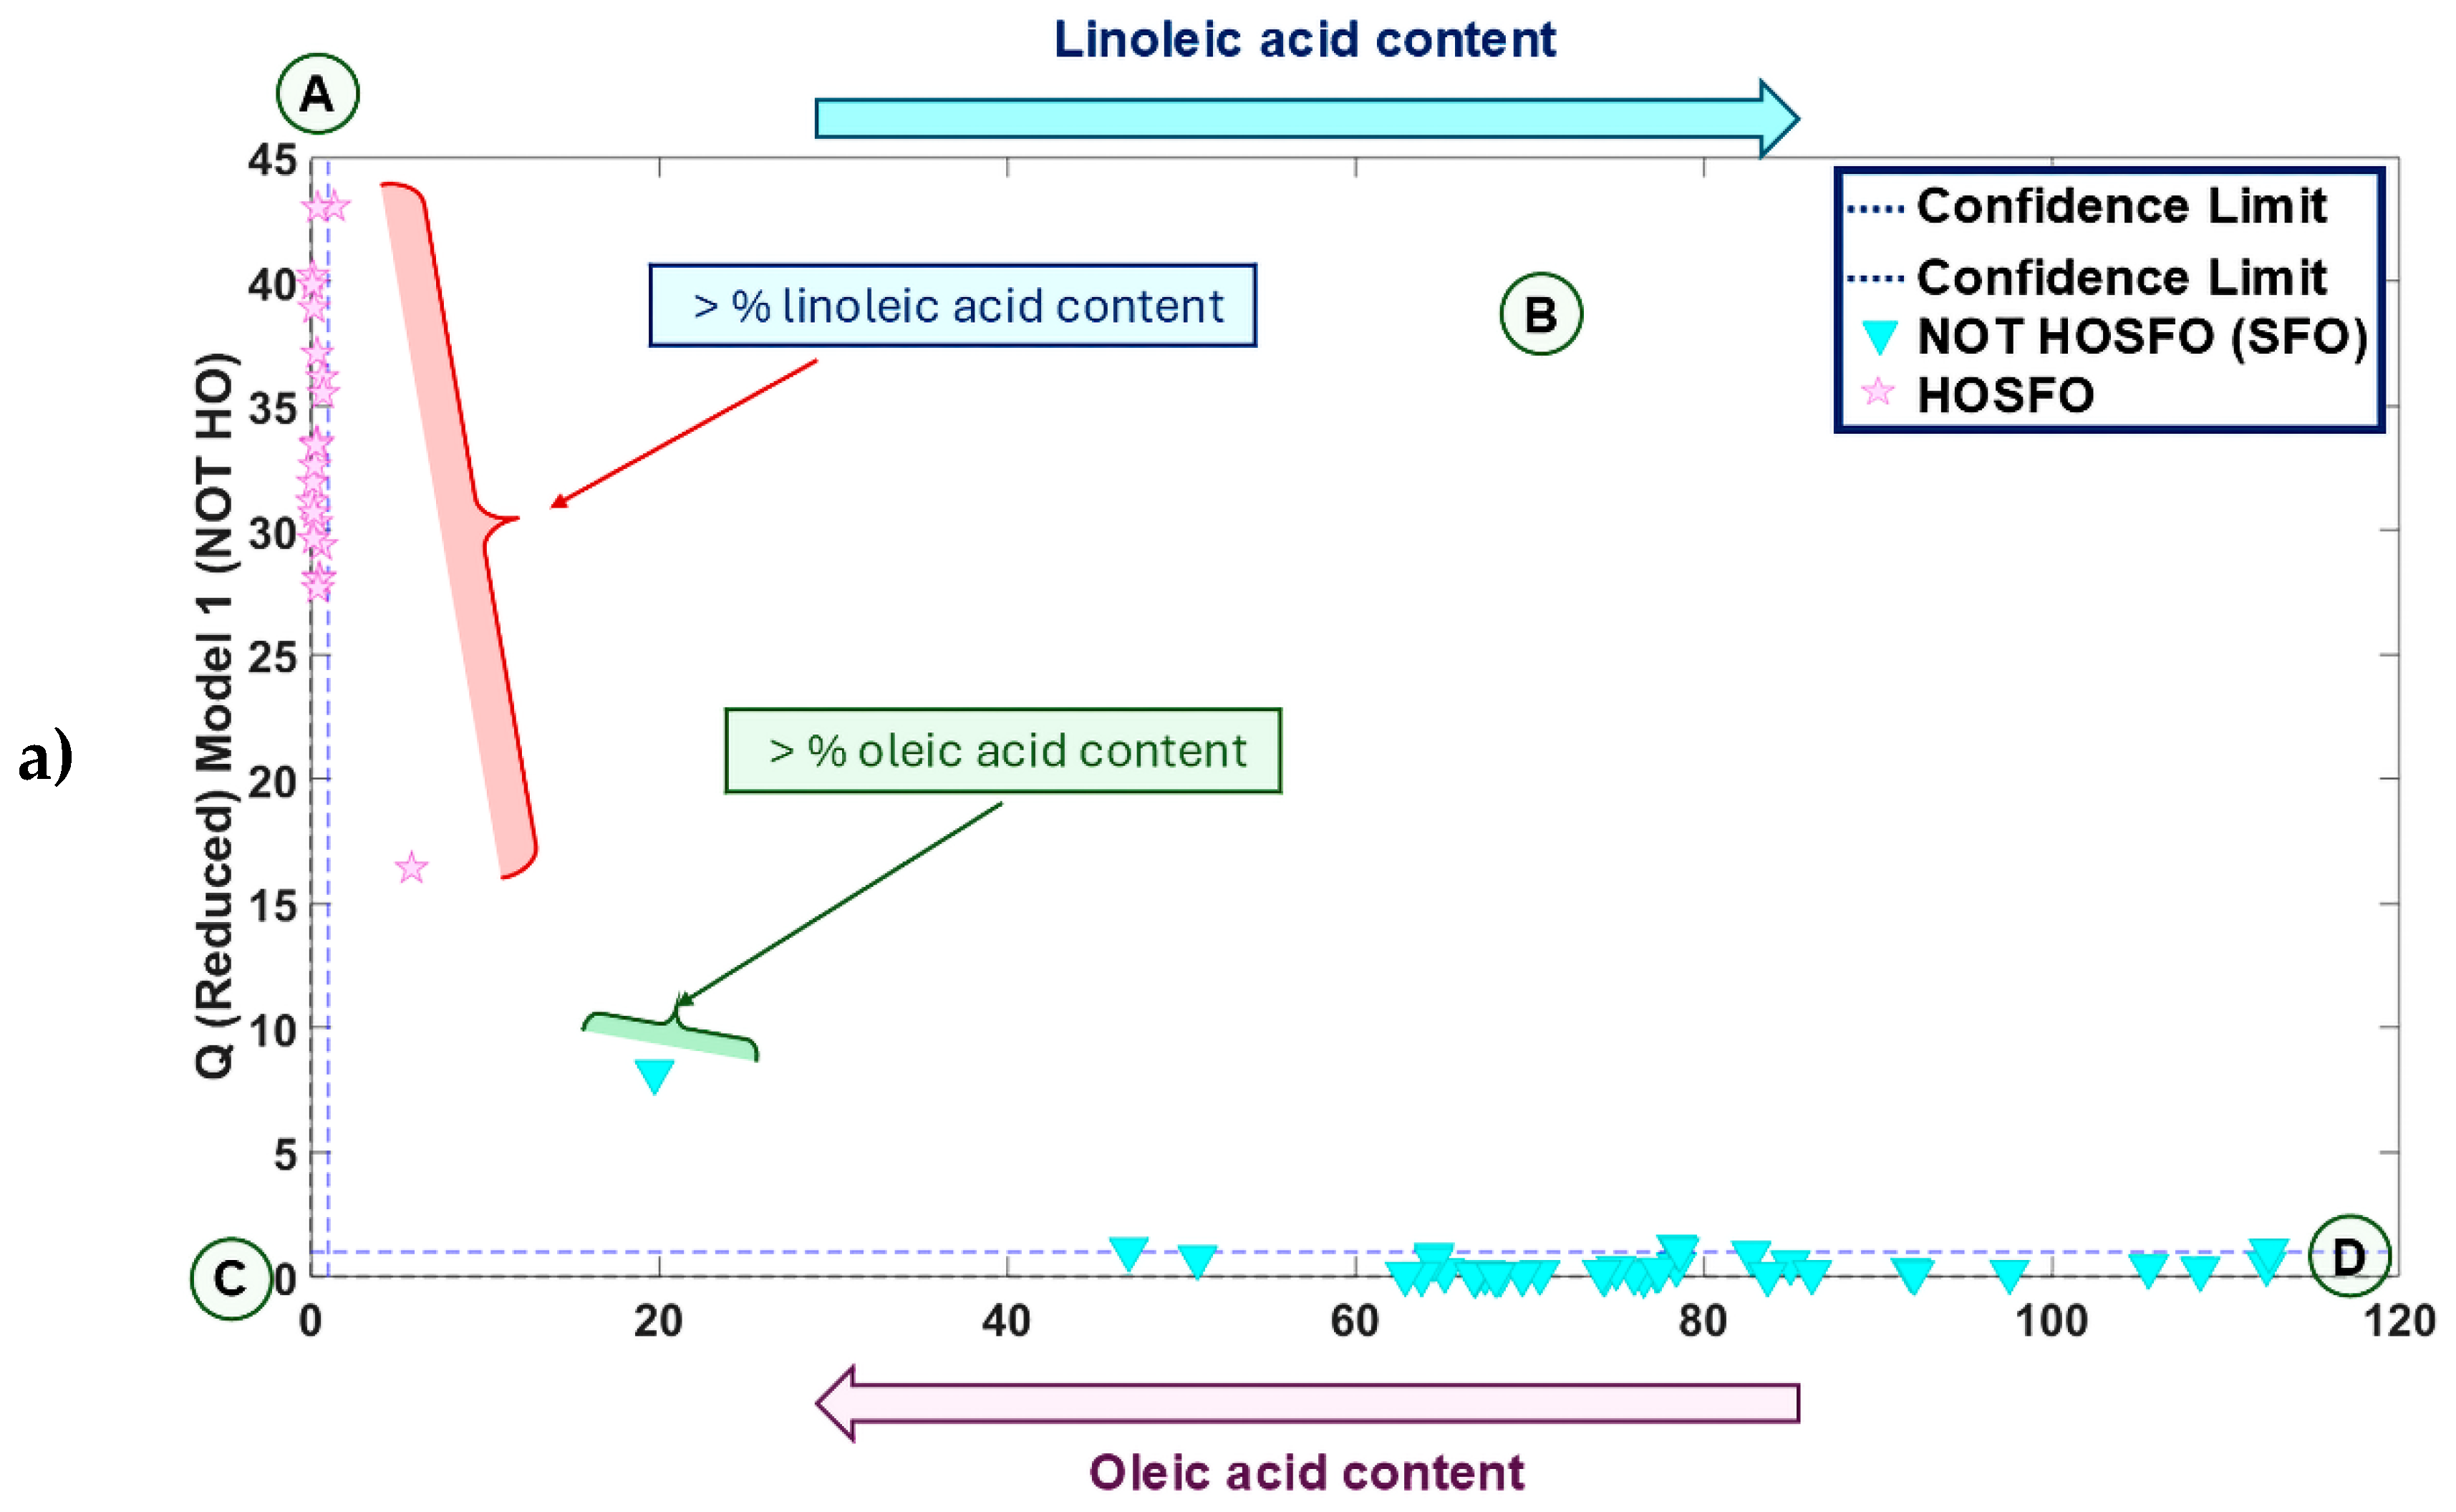
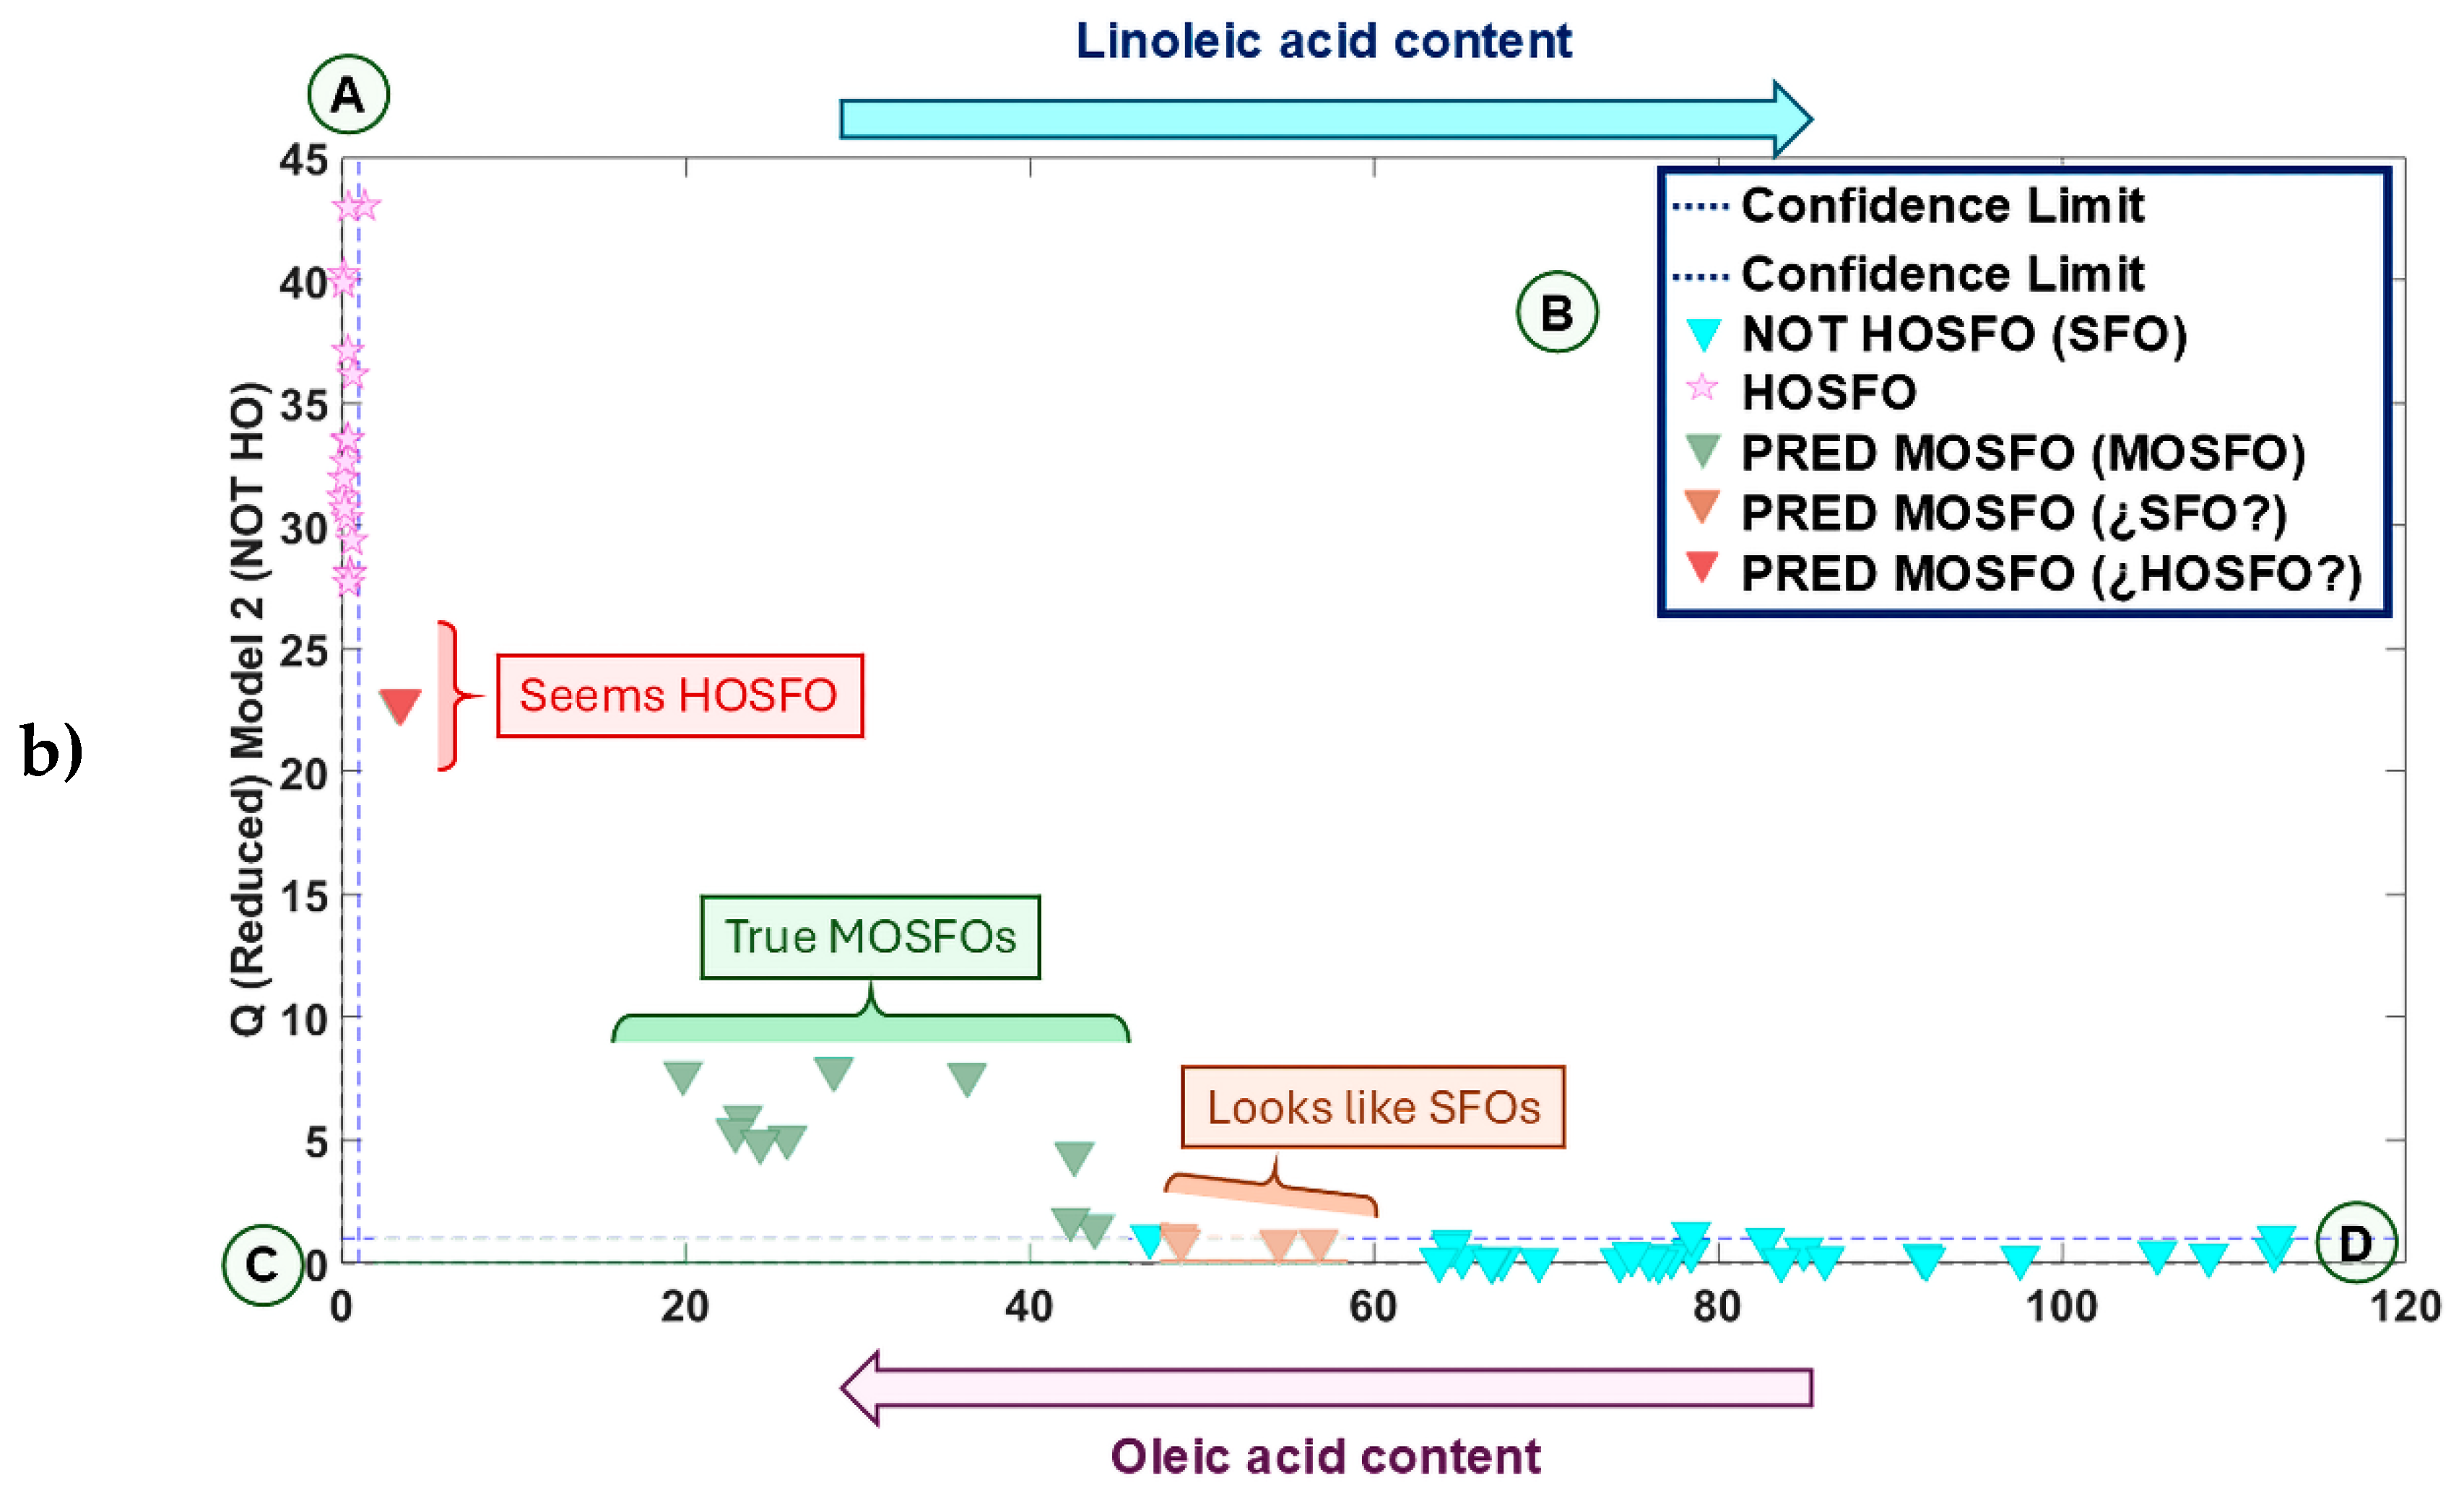
Figure 8.
Prediction plot obtained from the PLS-DA hard classification model. Dashed lines indicate class thresholds separating samples.
Figure 8.
Prediction plot obtained from the PLS-DA hard classification model. Dashed lines indicate class thresholds separating samples.
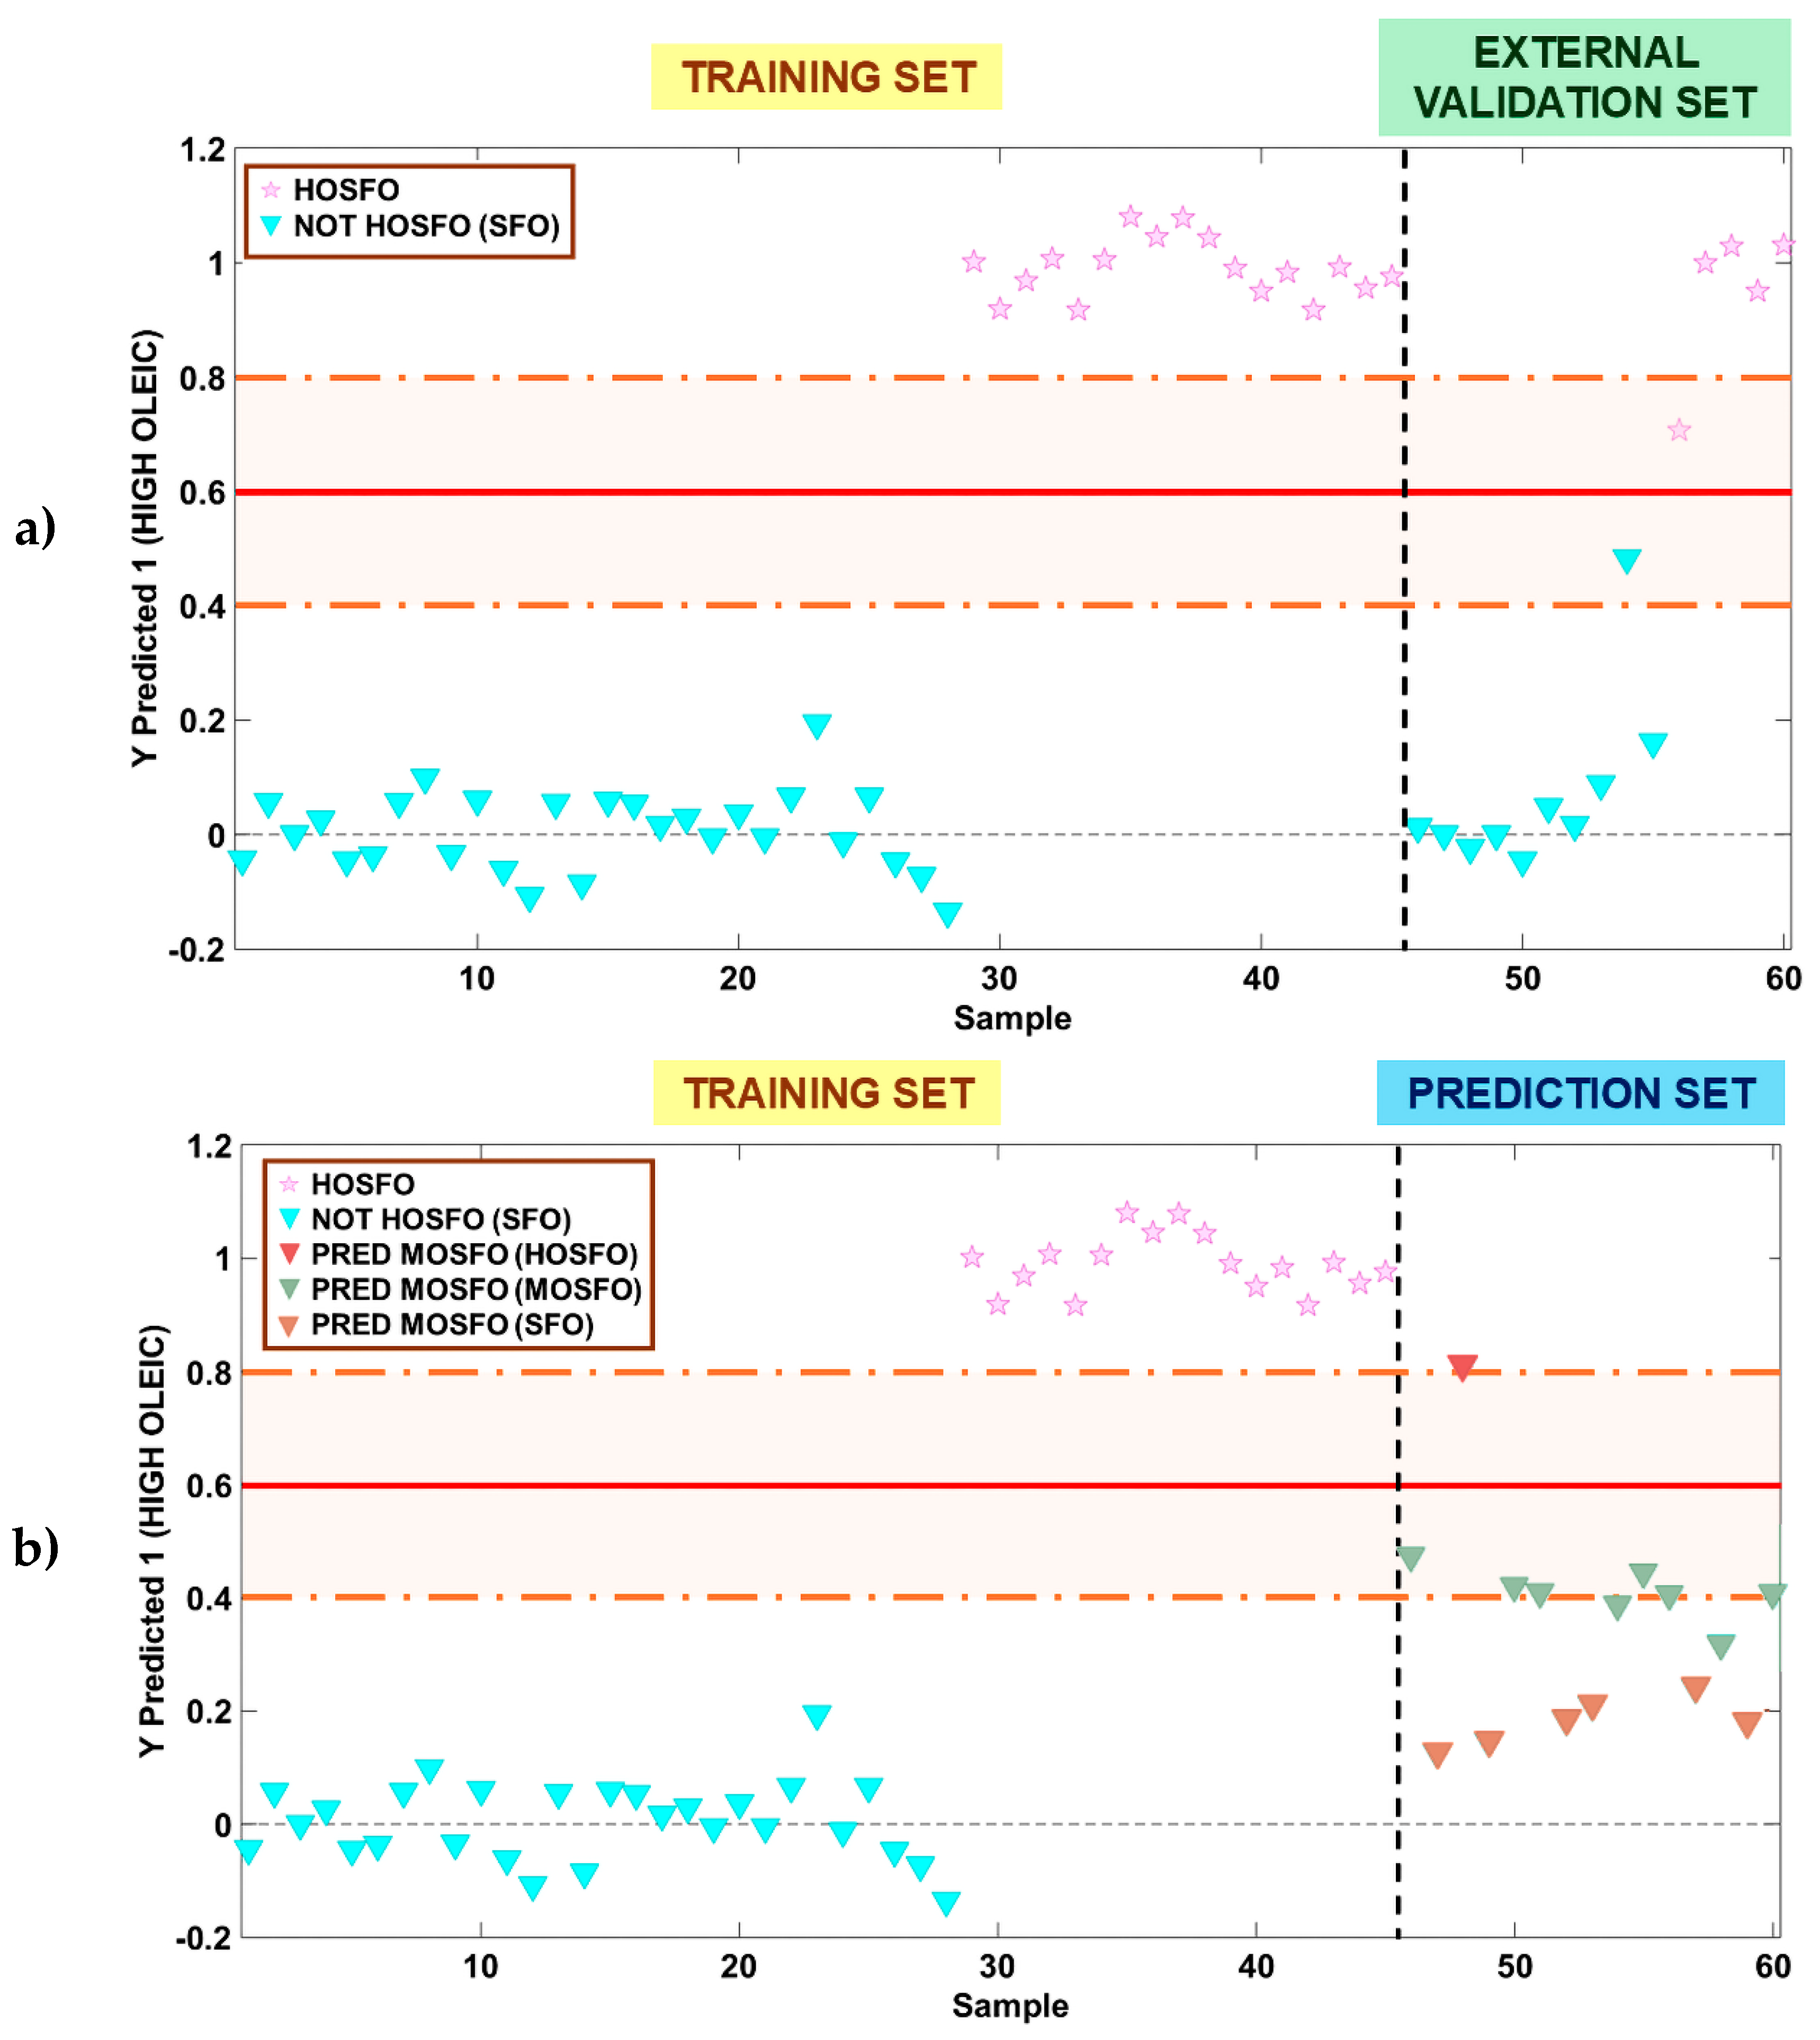
Figure 9.
Prediction plot obtained from the SVM hard classification model. Dashed lines indicate class thresholds separating samples.
Figure 9.
Prediction plot obtained from the SVM hard classification model. Dashed lines indicate class thresholds separating samples.
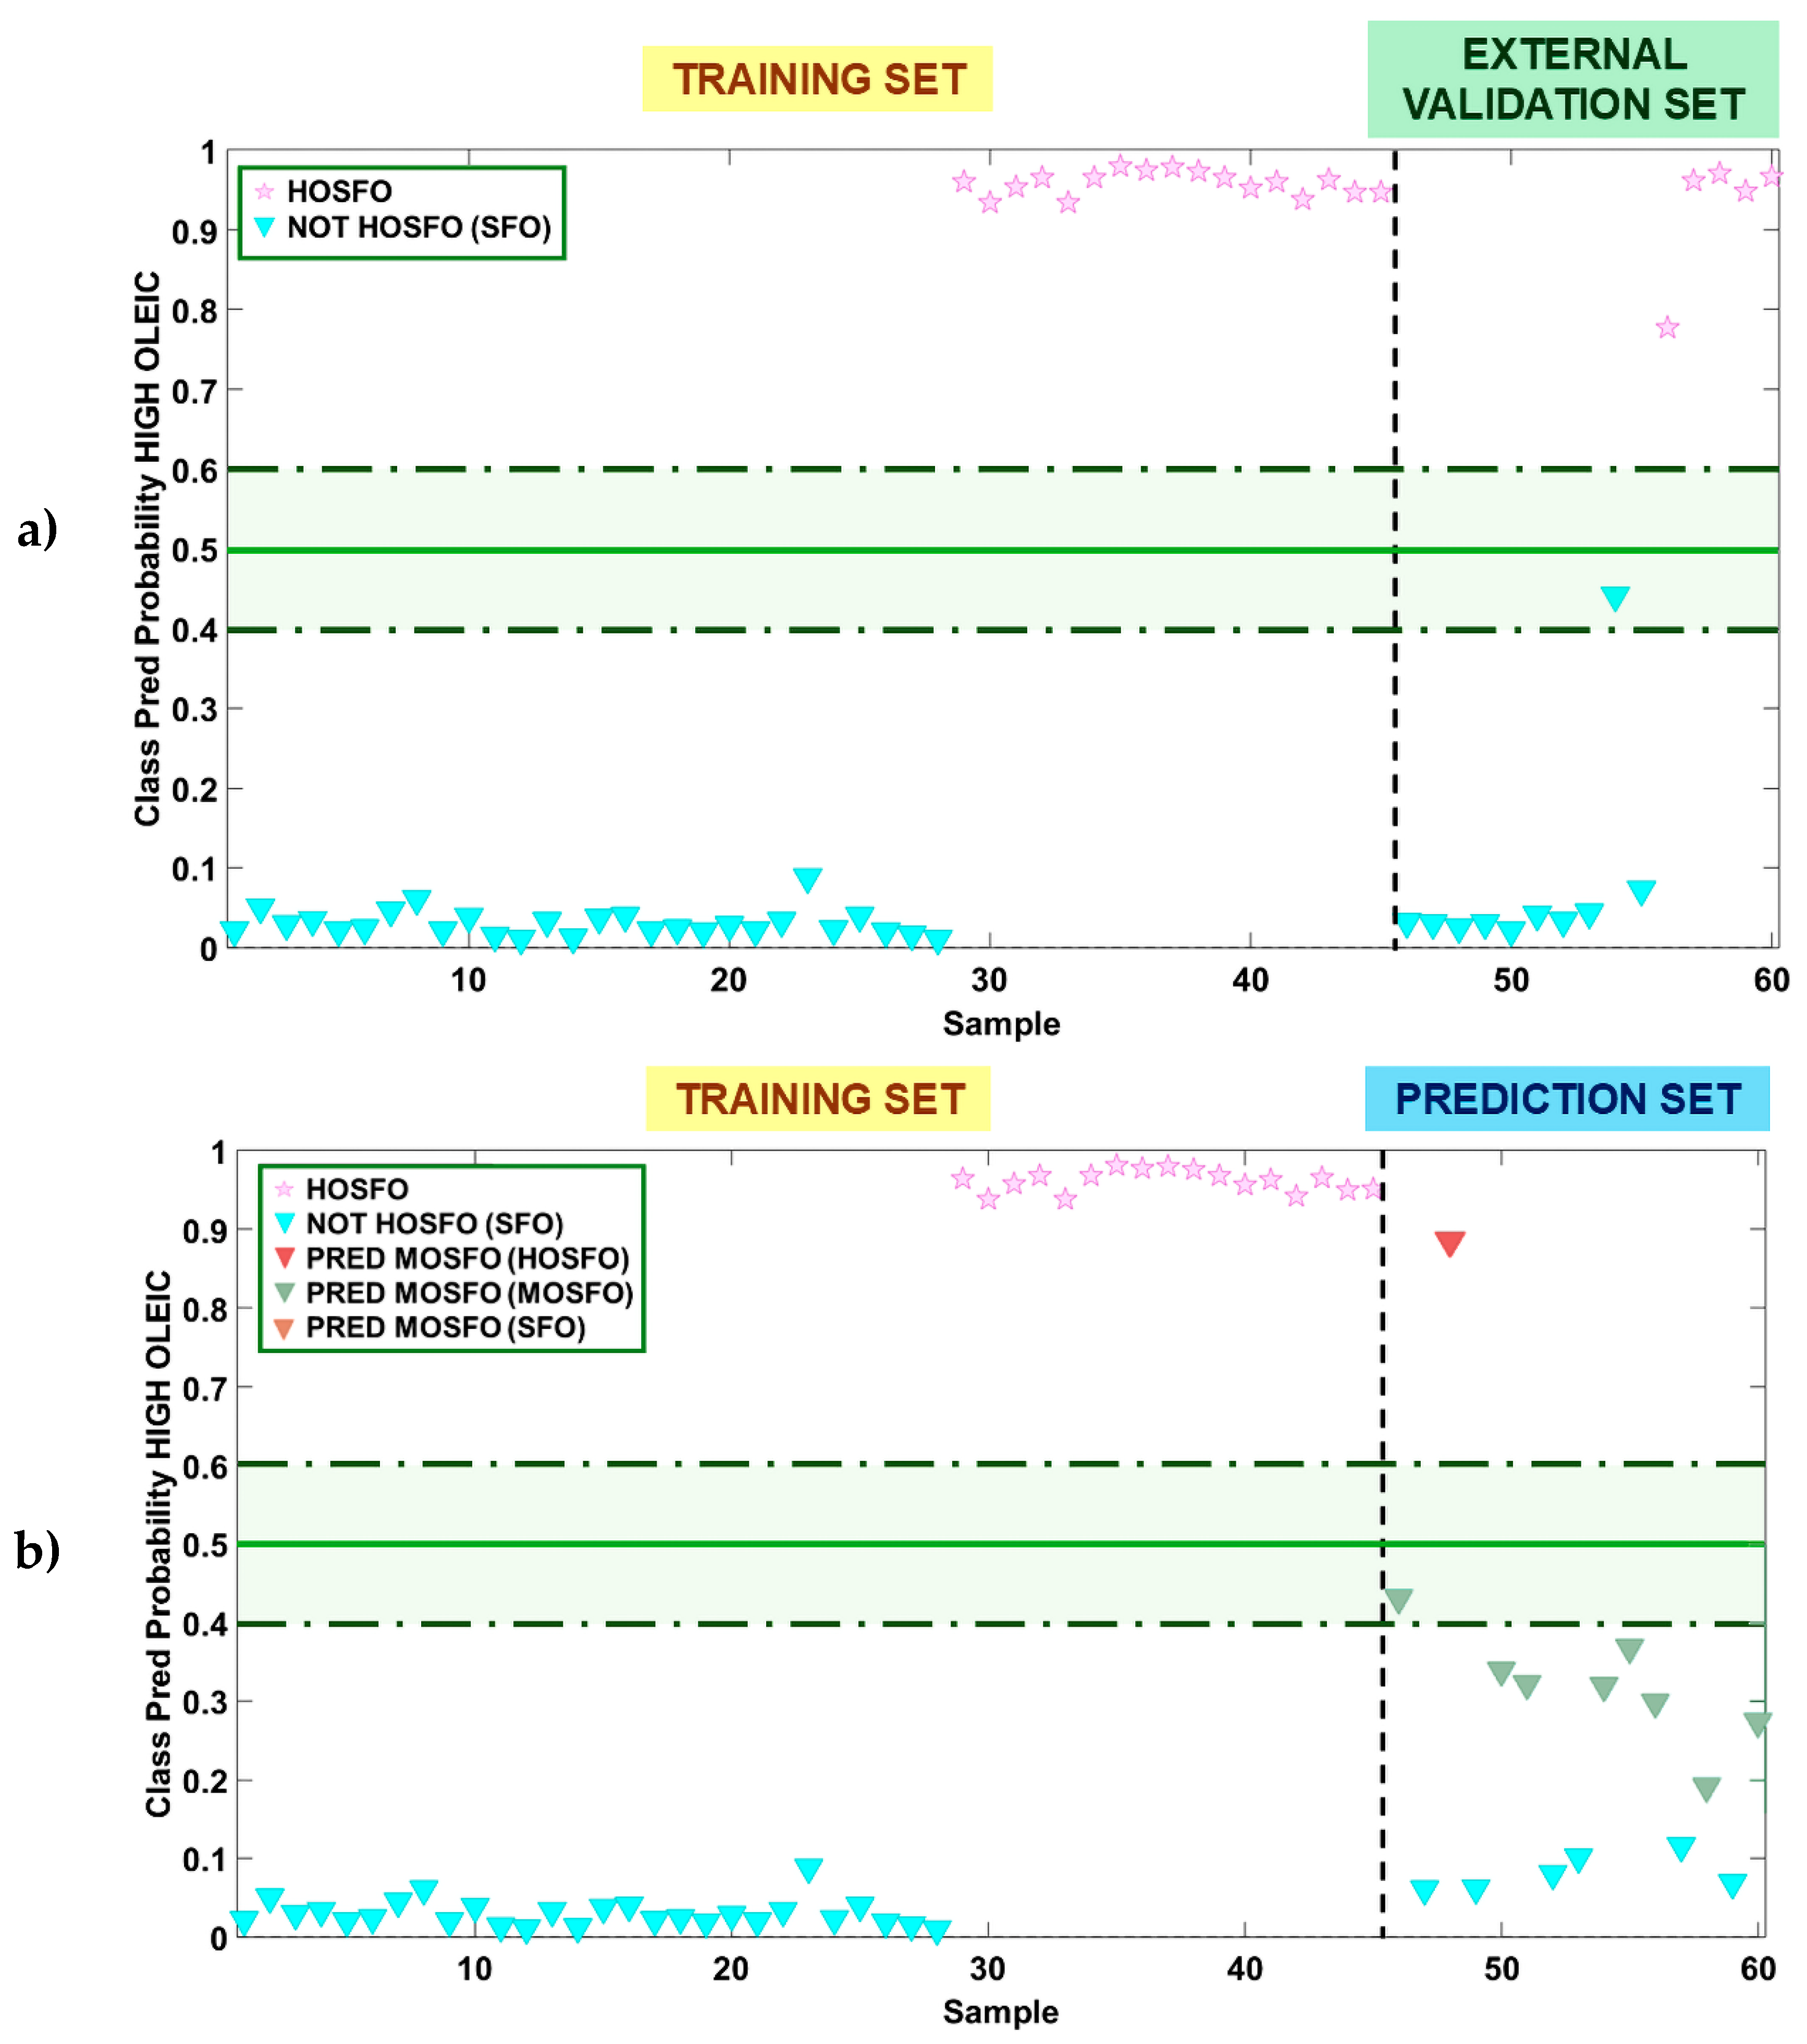
Figure 10.
The residuals of the exploratory analysis of the ATR-FTIR blend matrix are indicated by the red line, which delineates the outlier samples.
Figure 10.
The residuals of the exploratory analysis of the ATR-FTIR blend matrix are indicated by the red line, which delineates the outlier samples.
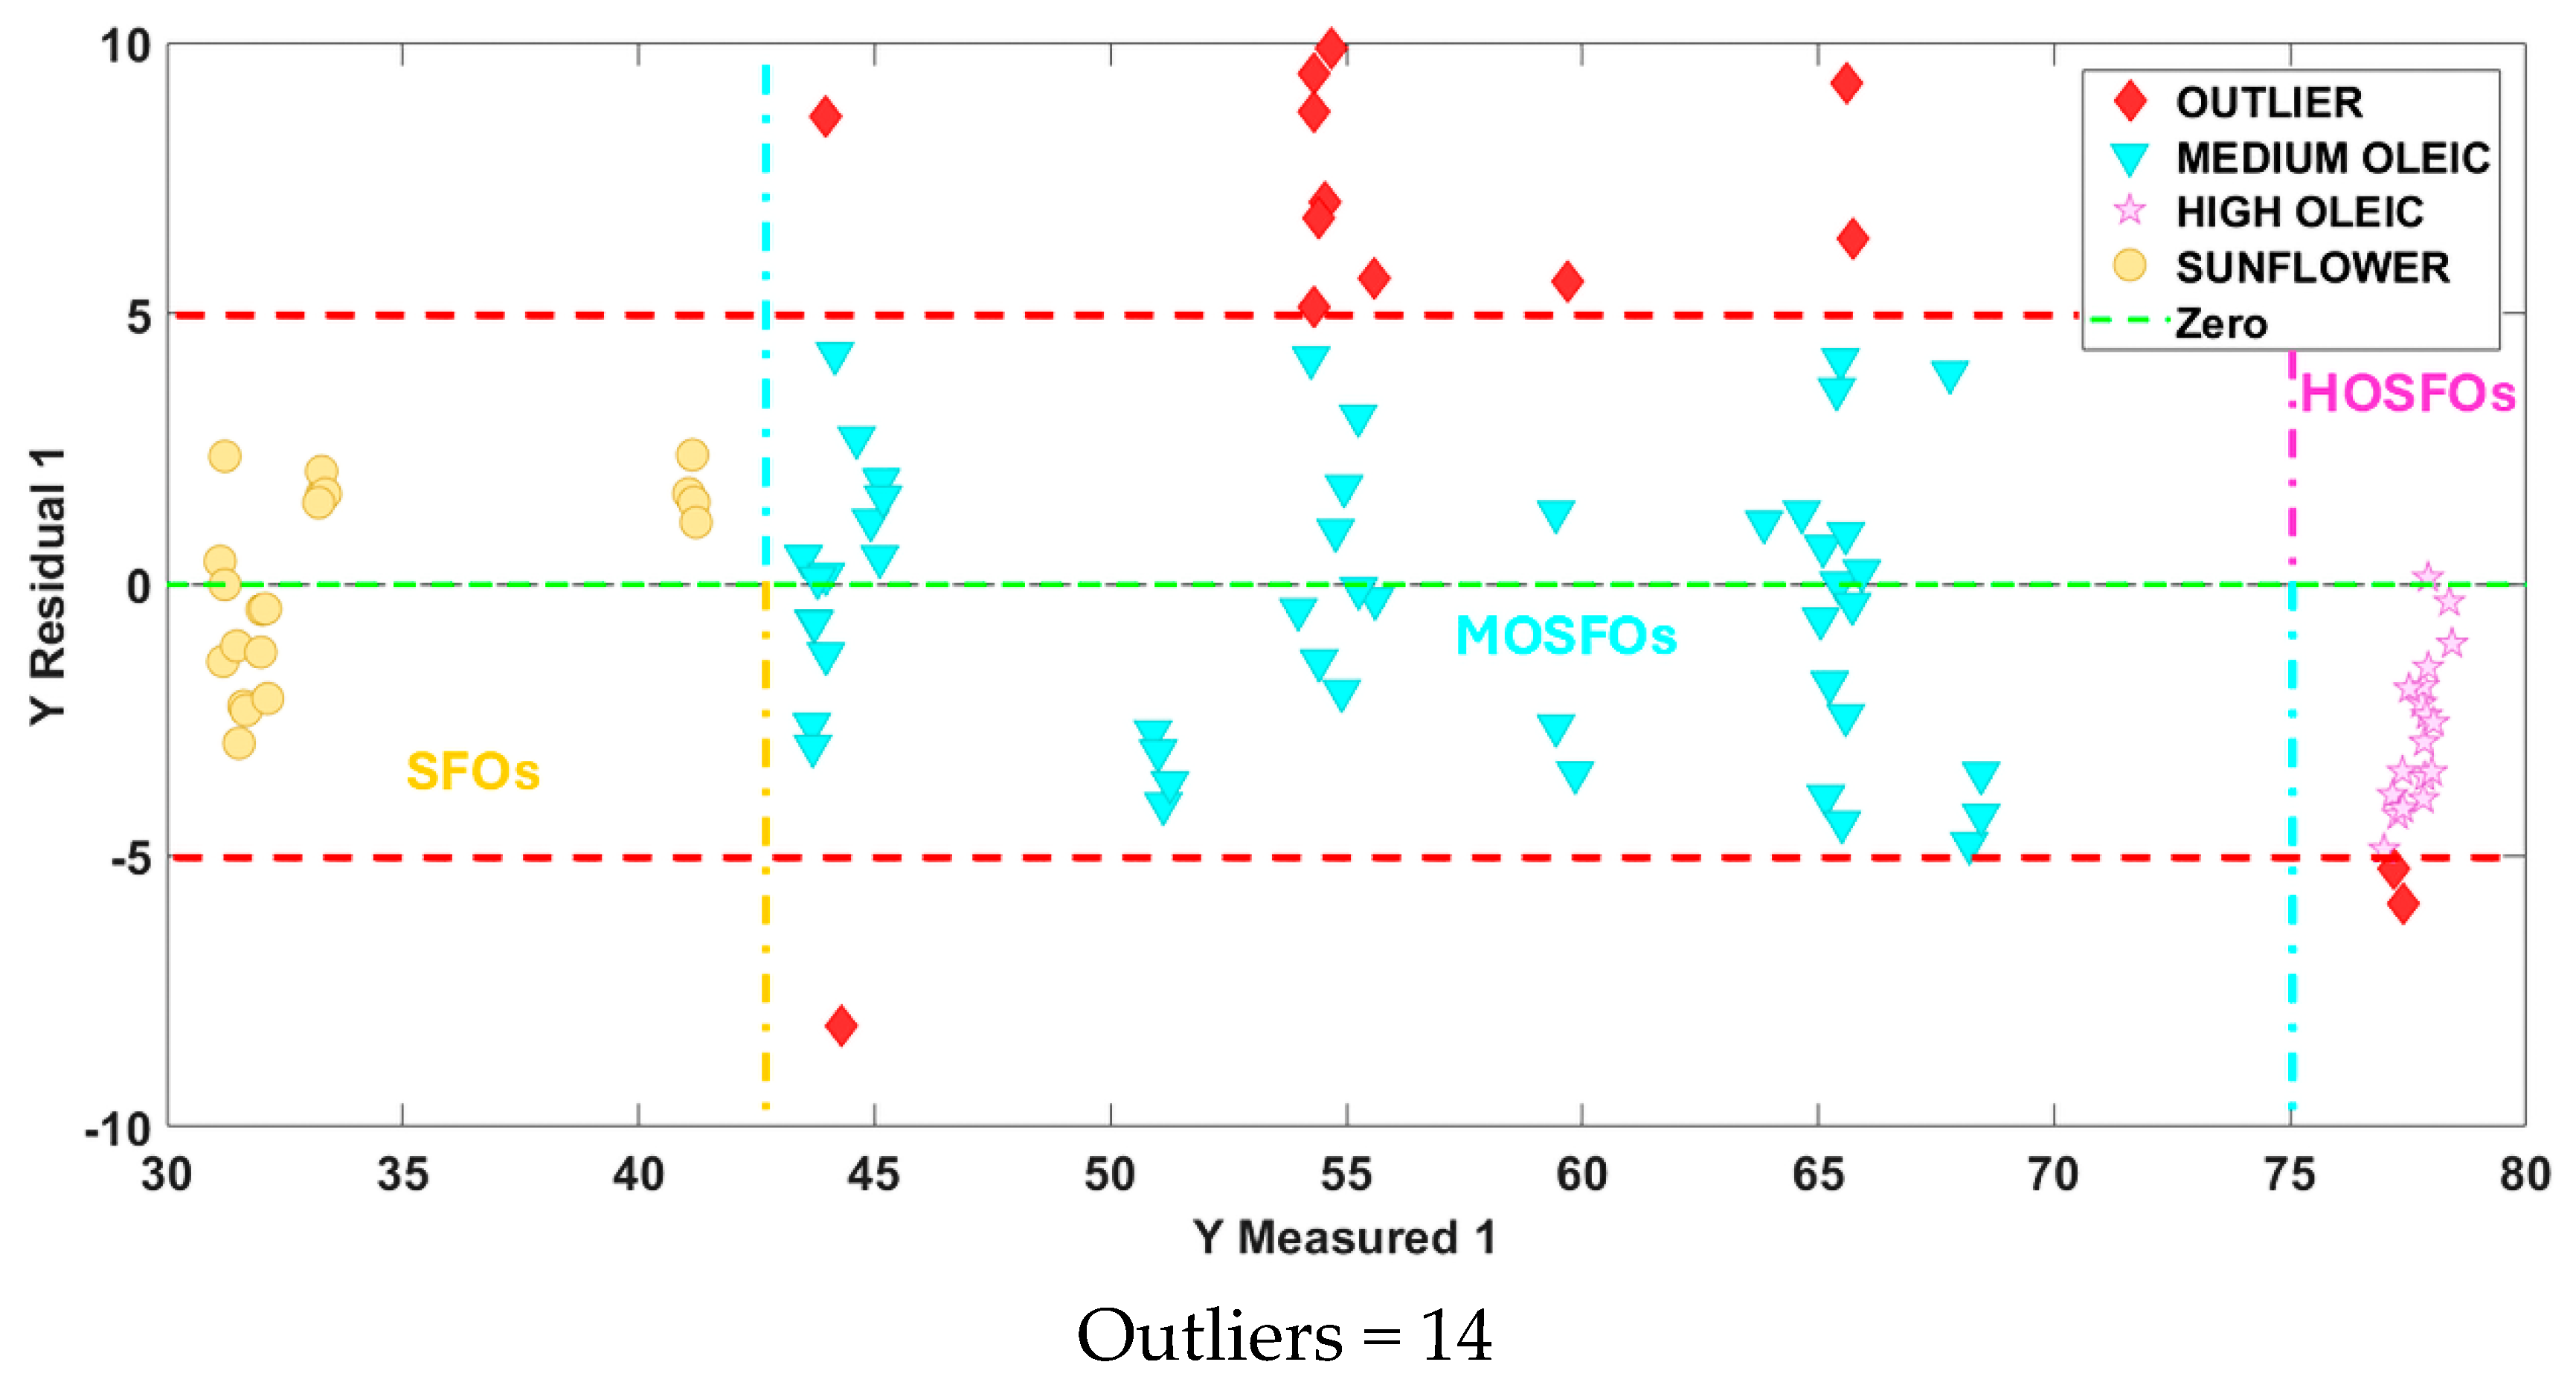
Figure 11.
The residuals of the Tuning 2 of the ATR-FTIR blend matrix are indicated by the red line, which delineates the outlier samples.
Figure 11.
The residuals of the Tuning 2 of the ATR-FTIR blend matrix are indicated by the red line, which delineates the outlier samples.
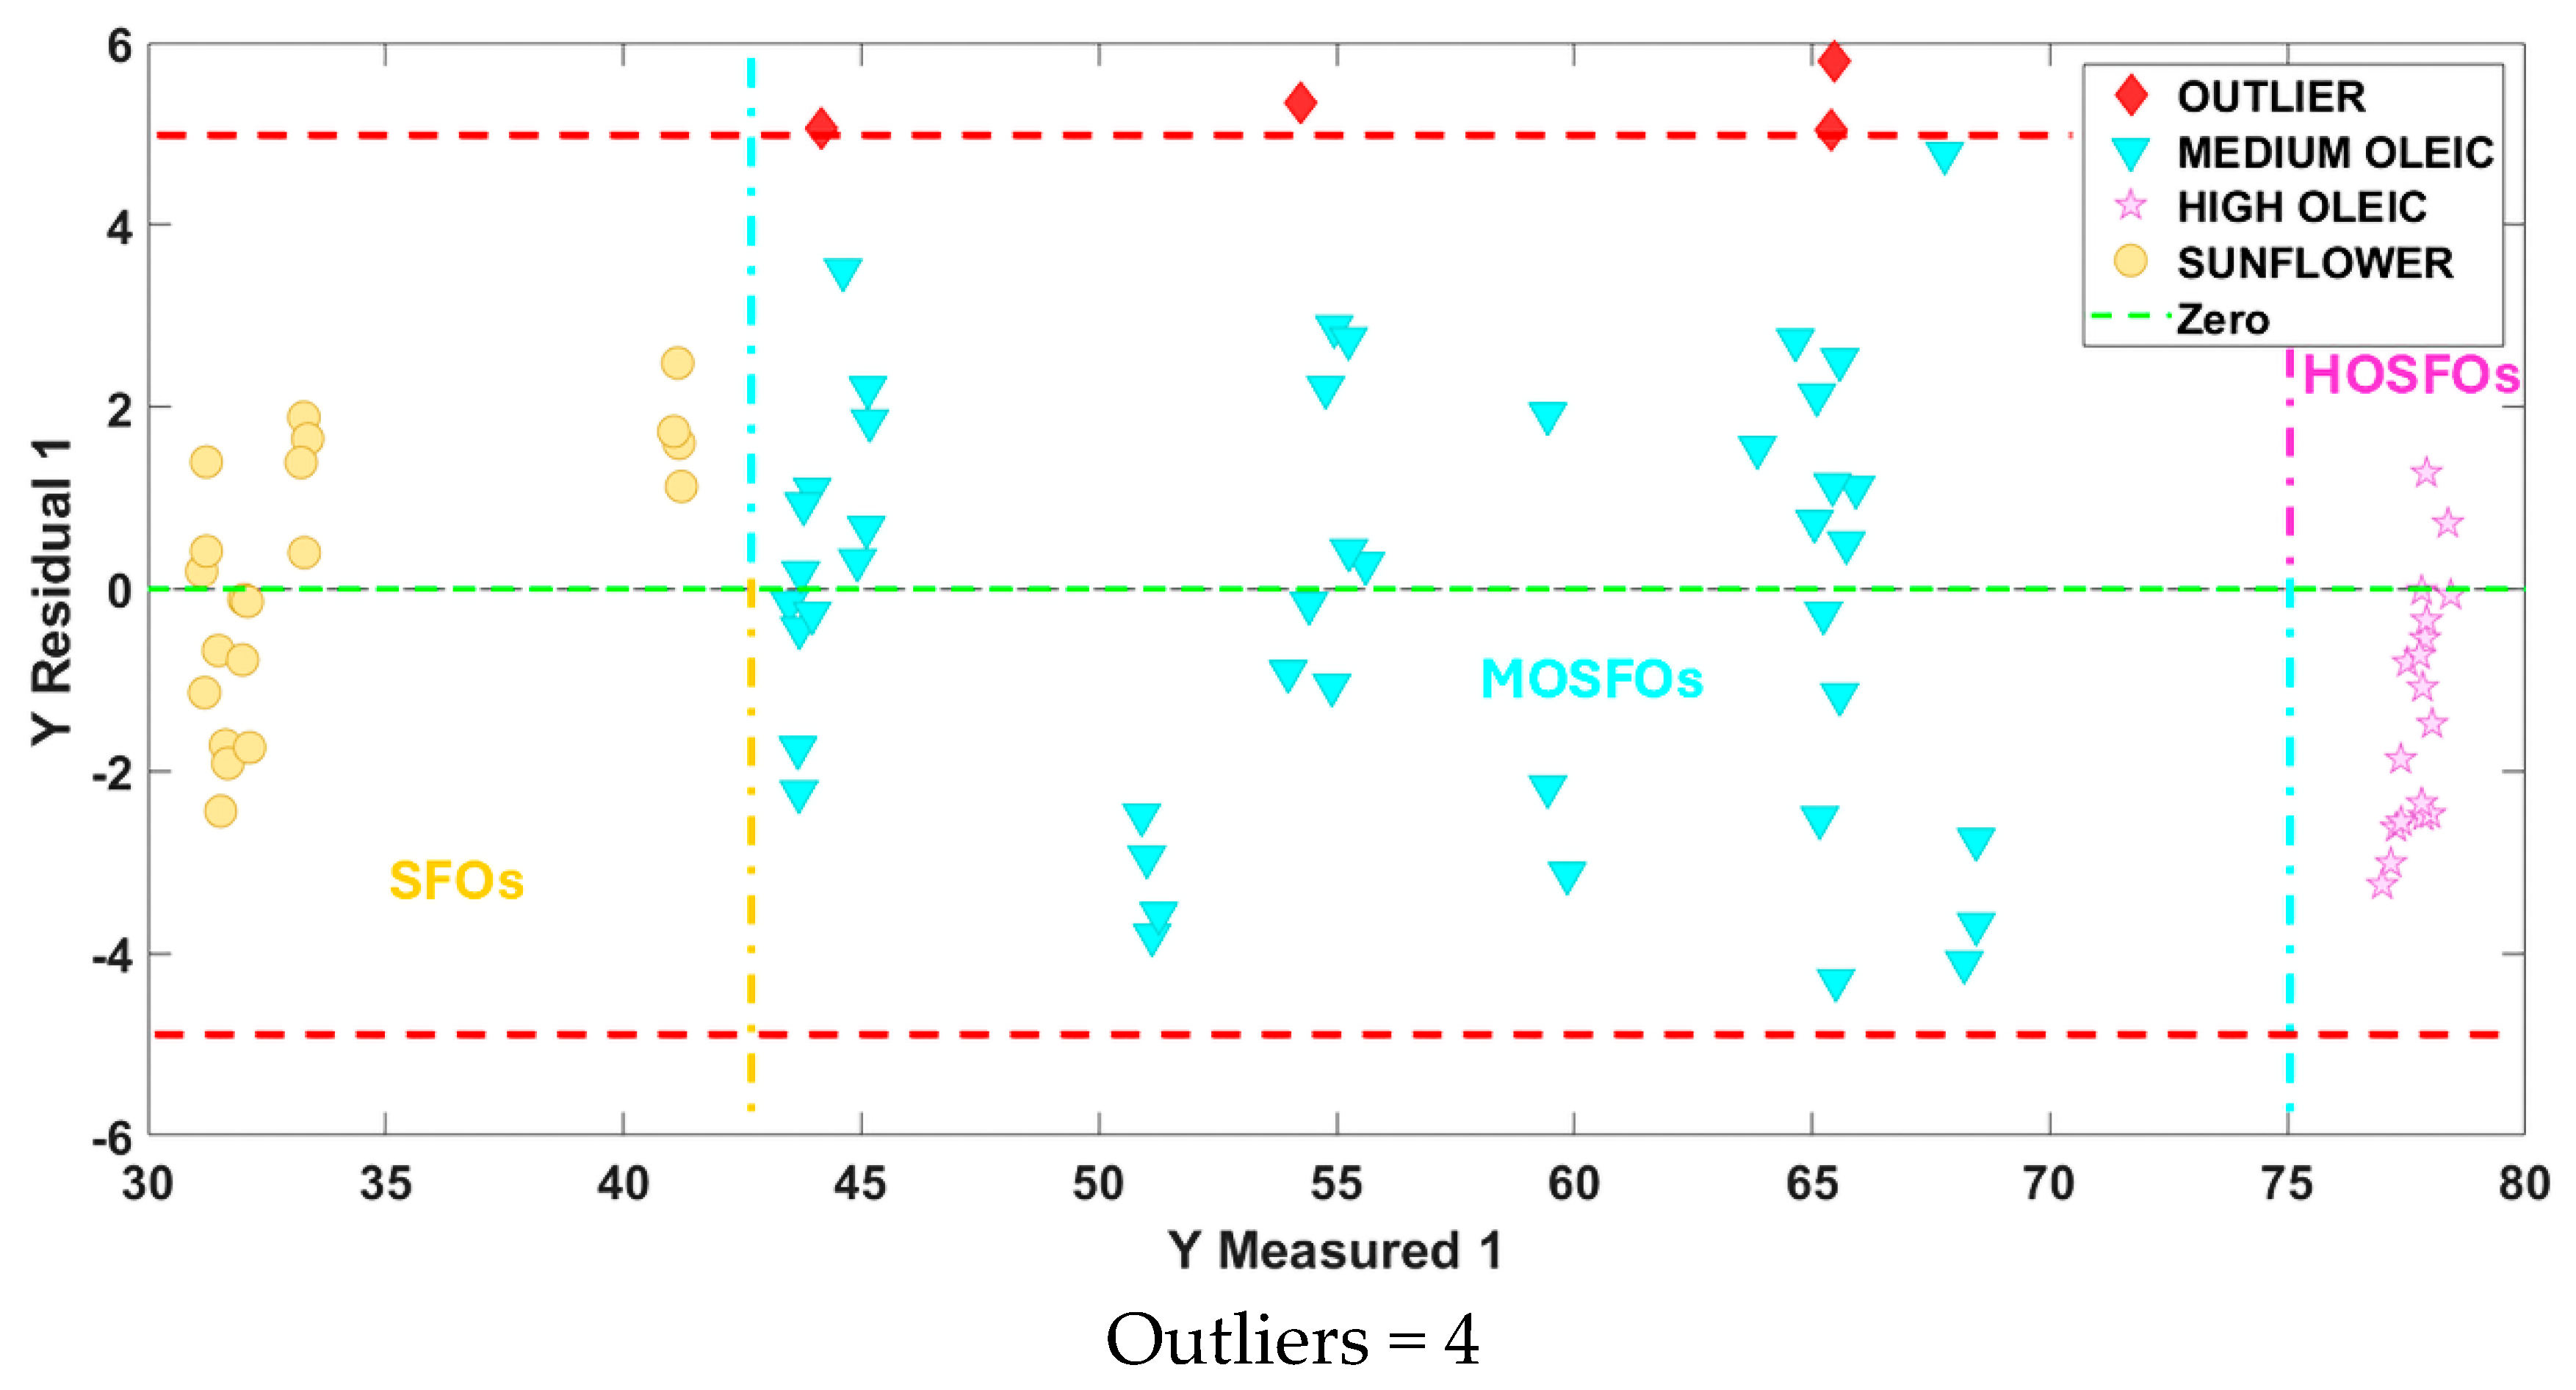

Table 1.
Error metrics calculated for the evaluation of external validation of the PLS-R Model 1.
| SEP | RPD | RER |
|---|---|---|
| 2.11 | 7.37 | 23.34 |
Table 2.
Error metrics calculated for the evaluation of external validation of the PLS-R Model 2.
| SEP | RPD | RER |
|---|---|---|
| 2.24 | 6.51 | 22.67 |
Table 3.
Error metrics calculated for the prediction set in the PLS-R Model 1 and 2.
| PLS-R | SEP | RPD | RER |
|---|---|---|---|
| ATR-FTIR (MODEL 1) | 3.07 | 7.09 | 17.82 |
| FORS (MODEL 2) | 4.73 | 4.60 | 11.58 |
Table 5.
Oleic acid content prediction in commercial sunflower oils using PLS-R Model 1.
| CODE | PREDICTED OLEIC ACID CONTENT (%) USING PLS-R MODEL 1 (ATR-FTIR) | SUNFLOWER OIL TYPE |
|---|---|---|
| SFO-24 | 56.02 | MOSFO |
| MOSFO-39 | 56.40 | MOSFO |
| MOSFO-40 | 39.19 | SFO |
| MOSFO-41 | 72.29 | MOSFO |
| MOSFO-42 | 39.19 | SFO |
| MOSFO-43 | 53.23 | MOSFO |
| MOSFO-44 | 52.40 | MOSFO |
| MOSFO-45 | 41.03 | SFO |
| MOSFO-46 | 42.51 | SFO |
| MOSFO-47 | 53.49 | MOSFO |
| MOSFO-48 | 56.91 | MOSFO |
| MOSFO-49 | 53.86 | MOSFO |
| MOSFO-50 | 43.83 | MOSFO |
| MOSFO-51 | 50.88 | MOSFO |
| MOSFO-52 | 39.45 | SFO |
| MOSFO-53 | 50.88 | MOSFO |
| HOSFO-54 | 67.32 | MOSFO |
Disclaimer/Publisher’s Note: The statements, opinions and data contained in all publications are solely those of the individual author(s) and contributor(s) and not of MDPI and/or the editor(s). MDPI and/or the editor(s) disclaim responsibility for any injury to people or property resulting from any ideas, methods, instructions or products referred to in the content. |
© 2025 by the authors. Licensee MDPI, Basel, Switzerland. This article is an open access article distributed under the terms and conditions of the Creative Commons Attribution (CC BY) license (http://creativecommons.org/licenses/by/4.0/).
Copyright: This open access article is published under a Creative Commons CC BY 4.0 license, which permit the free download, distribution, and reuse, provided that the author and preprint are cited in any reuse.


