Submitted:
07 December 2025
Posted:
09 December 2025
You are already at the latest version
Abstract
Background/Objectives: Multiple sclerosis (MS) is a chronic neurological disease characterized by demyelination, inflammation, and autoimmunity, leading to progressive physical and psychological impairments. Anxiety and depression are among the most prevalent neuropsychiatric comorbidities in MS, significantly impacting patients’ quality of life (QoL). This study aimed to assess the evolution of anxiety and depression in individuals with relapsing-remitting multiple sclerosis (RRMS) over a six-month follow-up period, identify associated factors, and explore predictive variables. Methods: A prospective observational study was conducted with 35 RRMS patients diagnosed at the Lucus Augusti University Hospital between January 2023 and March 2025. Psychological symptoms were assessed at baseline, 3 months, and 6 months using Goldberg Anxiety and Depression Scale (GADS), the Beck Depression Inventory (BDI), and the Beck Anxiety Inventory (BAI). Data were analyzed using non-parametric and parametric tests to account for the small sample size and distribution of variables. Results: Anxiety and depression were prevalent and persistent in the study population, with no significant changes in mean scores over time (p > 0.05). However, specific symptoms, such as pessimism and loss of pleasure, showed worsening trends, while sadness and guilt remained stable. Sociodemographic factors, including lower income and employment status, were significantly associated with higher anxiety and depression scores (p < 0.05). Additionally, clinical factors such as autoimmune comorbidities and a history of mononucleosis were linked to higher depressive symptoms. Baseline anxiety and depression scores emerged as strong predictors of future levels (p < 0.01), emphasizing the importance of early assessments. Conclusions: Anxiety and depression are prevalent and persistent in RRMS patients, with specific symptoms fluctuating over time. Sociodemographic and clinical factors play a significant role in psychological outcomes, highlighting the need for integrated care models that address both physical and psychosocial aspects of MS. Early psychological assessments and targeted interventions are critical to improving QoL and mitigating the long-term burden of mental health challenges in RRMS.
Keywords:
relapsing-remitting multiple sclerosis
; health assessment
; follow-up
; nursing
; autoimmune diseases
; health status indicators
; psychological distress
; emotional exhaustion
; anxiety
; depression
1. Introduction
Multiple sclerosis (MS) is a chronic neurological condition characterized by demyelination, inflammation, autoimmunity, and degeneration within the central nervous system, primarily affecting the brain and spinal cord. Despite significant advancements in research, the exact cause of MS remains unknown. Current evidence suggests a multifactorial etiology involving genetic predisposition, immune system dysregulation, and environmental influences [1,2,3,4]. The interaction of these factors underscores the complexity of the disease, presenting challenges for both scientific understanding and healthcare management globally [5,6]. While research has shed light on the mechanisms underlying MS, its unpredictable progression continues to complicate effective treatment and long-term care strategies [7,8].
The clinical presentation of MS is highly variable, often encompassing motor, sensory, visual, urinary, and cognitive impairments, as well as neuropsychiatric conditions such as anxiety and depression. These symptoms significantly impact on daily functioning, leading to reduced independence and diminished quality of life (QoL). Anxiety and depression are prevalent among individuals with MS, further exacerbated by social isolation and stigma, which limit social support and increase emotional distress. Early interventions targeting emotional and social dimensions have been shown to improve long-term outcomes, particularly in patients with relapsing-remitting MS (RRMS). The progressive decline in emotional and social functioning over time, emphasizing the importance of integrating psychosocial support into routine care. [9].
The clinical presentation of MS is highly variable and often debilitating, including motor, sensory, visual, urinary, and cognitive impairments, as well as neuropsychiatric conditions such as anxiety and depression. These symptoms significantly impact daily functioning, often leading to reduced independence and diminished quality of life (QoL) [10,11,12]. Furthermore, anxiety and depression, which are prevalent among individuals with MS, are exacerbated by social isolation and stigma, further limiting social support and increasing emotional distress. Studies suggest that early interventions addressing emotional and social factors can improve long-term outcomes in patients with RRMS [13,14,15]. Stigma has been identified as a barrier to open communication about the disease, further isolating individuals and restricting access to essential resources. Conversely, strong social networks have been shown to enhance patients perceived health and their ability to manage relapses and physical limitations, emphasizing the importance of community-based interventions and inclusive environments [2,16,17,18,19,20].
Globally, MS affects approximately 2.8 million people, with over 55,000 cases reported in Spain, corresponding to a prevalence of 80 to 180 cases per 100,000 inhabitants [21]. This rising prevalence is attributed to improved diagnostic methods, increased disease awareness, and better reporting, particularly in regions with historically lower detection rates [22,23,24]. In Galicia, prevalence rates range from 140 to 183 cases per 100,000 inhabitants, with an average age of onset of 29 years [21]. Women aged 20 to 40 years are predominantly affected, with a female-to-male ratio of approximately 2:1. Additionally, MS prevalence is higher in regions at higher latitudes, a disparity linked to environmental factors such as reduced sunlight exposure, which may lead to vitamin D deficiency, a potential risk factor for MS [3,4,25,26,27,28]. Viral infections and other immune-modulating factors are also believed to contribute to the disease's etiology, further supporting its multifactorial nature [28,29,30].
Clinically, MS is classified into four main types: RRMS, secondary progressive MS, primary progressive MS, and progressive-relapsing MS. RRMS is the most prevalent form, accounting for approximately 85% of cases [2,31]. It is characterized by episodes of neurological dysfunction or relapses, followed by periods of remission during which symptoms stabilize. The diagnosis of RRMS in this study was established using the 2017 McDonald criteria, which require evidence of dissemination in time and space of central nervous system lesions confirmed through clinical and radiological evaluations. These criteria were chosen for their high sensitivity and specificity, enabling early and accurate diagnosis [1].
The socioeconomic impact of MS is considerable, with direct healthcare costs associated with treatment and follow-up care ranging between €10,486 and €27,217 per individual annually, depending on the level of disability. Additionally, non-healthcare-related expenses, such as transportation, home modifications, informal caregiving, and work absences, can be added between 454 and €25,850 per year [26,32]. These costs place a significant financial burden on individuals and their families, particularly those with limited financial resources or unstable employment [33,34,35]. People with lower incomes or precarious job situations face greater challenges in accessing healthcare services, intensifying the emotional and social consequences of MS [26,32]. This economic inequality highlights the urgent need for policies that enhance access to affordable healthcare and provide comprehensive support systems for vulnerable populations [36,37].
To evaluate anxiety and depression, the BDI (Beck Depression Inventory), BAI (Beck Anxiety Inventory), and GADS (Goldberg Anxiety and Depression Scale) were selected due to their well-established validity and reliability in assessing psychological symptoms. These instruments are widely used in both clinical and research contexts to measure the severity of depressive and anxiety symptoms, offering robust psychometric properties and providing a comprehensive understanding of the emotional impact on individuals [38,39].
Anxiety and depression are significant psychological conditions that can severely affect individuals’ daily lives, with symptoms such as fatigue, sleep disturbances, and emotional distress. These conditions are often interrelated, creating a cycle that exacerbates the overall burden on individuals. Studies using the BDI, BAI, and GADS have demonstrated that these symptoms are highly prevalent across various populations, highlighting the importance of early detection and intervention [38,39,40].
The choice of these instruments aligns with recommendations from recent research emphasizing the use of validated tools tailored to the psychological assessment of individuals to ensure accurate evaluation and targeted interventions [39,40]. Anxiety and depression have been shown to significantly impair daily functioning, treatment adherence, and coping mechanisms, further impacting individuals’ emotional and social well-being [38;40].
Moreover, socioeconomic and clinical factors play a critical role in the prevalence and severity of anxiety and depression. Lower income levels, precarious employment, and limited access to healthcare services have been associated with higher rates of these conditions, emphasizing the need for equitable mental health policies and support systems [39].
Emerging evidence suggests that interventions targeting emotional and social dimensions, such as mindfulness-based therapies, can significantly improve outcomes for individuals experiencing anxiety and depression [41]. These findings underscore the importance of addressing not only clinical symptoms but also the broader psychosocial challenges faced by those affected.
Based on the above, the primary aim of this study was to evaluate the evolution of anxiety and depression in individuals diagnosed with RRMS over a six-month follow-up period. Additionally, the study sought to identify potential associations between anxiety and depression levels and various sociodemographic, clinical, and treatment-related variables. The specific objectives of the study were to analyze the prevalence and severity of anxiety and depression symptoms at baseline, at 3 months, and at 6 months post-diagnosis; to examine the relationship between anxiety and depression levels and sociodemographic factors.
2. Materials and Methods
Study Type
This research employs observational, analytical, and prospective design. It was carried out with individuals receiving care at the Neurology and Neurosurgery Unit or the neurology nursing clinic of the Lucus Augusti University Hospital (HULA) who were diagnosed with RRMS between January 2023 and March 2025.
Population, Sample, and Inclusion Criteria
The target population for this study comprised individuals newly diagnosed with RRMS who were treated by physicians from the Neurology and Neurosurgery Service at HULA. Located in the city of Lugo, HULA serves a population of 332,100 residents registered with a healthcare card as of February 2017.
For the sampling strategy, all eligible patients diagnosed with RRMS during the inclusion period were recruited, covering the entire accessible population. Randomization or stratification was not applicable due to the cohort's nature; however, additional literature was reviewed to enhance the methodological rigor and align with best practices in observational research.
This study employed a longitudinal design over a two-year period, during which participants were included at the time of diagnosis and followed up at baseline, 3 months, and 6 months. The psychological impact was assessed using the GADS for depression and anxiety, the BAI for anxiety, and the BDI for depression at diagnosis and during the 3- and 6-month follow-up visits. The sample consisted of a convenience group of individuals with RRMS, selected consecutively for the study.
Inclusion criteria required participants to be 18 years or older, residing in Galicia, and diagnosed with RRMS according to the 2017 McDonald criteria, which necessitate evidence of dissemination in space (lesions in at least two of four CNS regions: periventricular, cortical/juxtacortical, infratentorial, or spinal cord) and time [simultaneous presence of enhancing and non-enhancing lesions or new T2/enhancing lesions on follow-up magnetic resonance imaging (MRI)]. Participants were also required to provide informed consent and undergo regular clinical follow-up within the framework of the Integrated Care Process for MS in Galicia.
Exclusion criteria included individuals with other MS phenotypes (e.g., primary or secondary progressive MS), severe comorbidities that could interfere with the evaluation of the psychological impact, pregnancy or lactation, refusal to participate, withdrawal of consent before completing data collection, or loss to follow-up.
Justification and Sample Size Calculation:
RRMS diagnoses represent approximately 80% of all MS cases, with MS affecting around 0.1% of the population. Based on epidemiological data, the proportion (P) was set at 0.8, reflecting that RRMS accounts for many MS diagnoses. Consequently, within the Lugo healthcare area, there would be an estimated 332 individuals with MS, of whom 265 would have RRMS.
A 90% confidence interval was chosen to balance precision with the feasibility of conducting the study, considering its pilot nature and the operational constraints of the healthcare service. A 14% margin of error was selected to account for the expected variability in the population, given the small sample size and exploratory design of the research. The sample size was calculated using the formula:
Sample Size =
The study utilized a convenience sampling method, selecting individuals who were accessible and available from the Neurology and Neurosurgery Unit and the Neurology Clinic at HULA. This approach resulted in a high participation rate (>98%). However, the final sample size was limited to 35 participants due to logistical and time constraints. This reduction was attributed to the duration of the inclusion period, the availability of eligible individuals, and the operational limitations of the healthcare service during the pilot phase.
The final sample size is consistent with similar studies conducted in RRMS populations, considering the low prevalence of the disease and the strict inclusion criteria. Non-parametric statistical tests were employed to ensure reliable analysis despite the small sample size.
Variables
Socio–epidemiological factors: sex, age, ethnicity, education level, marital status, employment status, annual income.
Clinical factors: presence of family history, autoimmune diseases, previous mononucleosis, pregnancy planning, tobacco and alcohol consumption, ongoing treatment, initial symptoms.
Psychological factors: Probability of anxiety and depression (GADS), level of anxiety (BAI) and depression (BDI).
Instrument
GADS
GADS is a brief instrument designed to detect symptoms of anxiety and depression in both clinical and epidemiological settings. The scale comprises two subscales, one for anxiety and the other for depression, each consisting of nine items that assess both psychological and somatic symptoms. The first four items of each subscale serve as an initial screening, and if the patient scores positively on at least one of these items, the remaining five items are then administered. Each affirmative response is scored as 1 point, with total scores ranging from 0 to 9 for each subscale.
A score of 4 or higher on the anxiety subscale, or 2 or higher on the depression subscale, indicates a probable case of anxiety or depression, respectively. GADS is widely recognized for its simplicity and efficiency, requiring only a few minutes to complete, and is highly useful in both clinical practice and population-based research.
The Spanish version of the GADS was validated by Montón, Echevarría, and Campos [42] for the Spanish population. This adaptation demonstrated robust reliability and validity for detecting anxiety and depression disorders in this demographic.
BDI
The BDI, first introduced by Beck et al. in 1996 and later adapted for use in Spain, is a widely used instrument for evaluating the severity of depressive symptoms. It comprises 21 items that assess symptoms experienced over the past few weeks, with each item scored on a scale from 0 to 3, where 0 represents minimal severity and 3 represents maximum severity.
The total score ranges from 0 to 63, with a cutoff of 14 points indicating clinically significant depression. The administration of the scale typically takes about 10 minutes. Based on the overall score, depressive symptoms are categorized into four levels: no depression (0–13 points), mild depression (14–19 points), moderate depression (20–28 points), and severe depression (29–63 points) [19,20].
BAI
The BAI, developed by Beck et al., is a self-report instrument designed to measure the severity of anxiety symptoms. It consists of 21 items that evaluate physical and cognitive symptoms experienced over the past week, with each item scored on a four-point scale ranging from 0 ("not at all") to 3 ("severely"). The total score ranges from 0 to 63, and anxiety severity is categorized into four levels: minimal anxiety (0–7), mild anxiety (8–15), moderate anxiety (16–25), and severe anxiety (26–63). The BAI is widely recognized for its reliability and validity, particularly for its ability to distinguish anxiety symptoms from depression by focusing on somatic indicators. The inventory requires approximately 5–10 minutes to complete, making it practical for clinical and research use. The Spanish version of the BAI has been validated, demonstrating strong psychometric properties, including reliability, factor validity, and discriminant validity, in Spanish-speaking populations. [43]
Data Collection
The data for this study were collected exclusively by the principal investigator and were accessible only to them and the collaborative research team. No modifications to the data were permitted by individuals outside the research team. Data collection was conducted at three defined time points: at the initial diagnosis (in the Neurology Unit or Clinic), at three months, and at six months (in the Neurology Nursing Clinic).
To evaluate the psychological impact, the GADS, BDI, and BAI were administered. These instruments were applied by trained nursing staff, and the data were recorded in a collection notebook specifically designed for this study. All information was anonymized and reviewed to ensure its accuracy and consistency.
To maintain methodological rigor and standardization during data collection, all personnel involved underwent specialized training at the Faculty of Nursing and Faculty of Psychology, University of Santiago de Compostela. The training provided comprehensive instruction on the use, scoring, and interpretation of the instruments. Sessions combined theoretical knowledge with practical exercises, including trial applications, to ensure consistency in administration and data recording across all team members.
Handling of Missing Data
There were no instances of missing data in this study, as all participants successfully completed the entire data collection process. This outcome was ensured through the application of strict data monitoring protocols and consistent, effective communication with participants throughout the duration of the study.
Data Confidentiality and Ethical Considerations
This study was approved by the Santiago–Lugo Research Ethics Committee (Registration Code: 2022_388 on 15 December 2022). It was carried out in full compliance with the ethical principles established in the World Medical Association's Declaration of Helsinki (2024) and adhered to current Spanish legislation, including Organic Law 3/2018 on Personal Data Protection and Guarantee of Digital Rights, Law 41/2002 on Patient Autonomy, and Law 3/2005 on access to electronic medical records.
To safeguard participant privacy, clinical data were coded and dissociated, ensuring that no identifiable information was included in the database. Only the principal investigator had access to the key linking the data to individual participants, and all information was handled to maintain anonymity. Upon completion of the study, the data will either be destroyed or retained in an anonymized format, as specified in the informed consent provided by participants. The HULA is designated as the center responsible for data processing.
Data Analysis
A descriptive analysis was conducted to summarize the data. For quantitative variables, measures of central tendency, such as the mean (M), and measures of dispersion, such as the standard deviation (SD), were calculated. For qualitative variables, absolute frequencies and percentages were reported. The chi-square test was employed to evaluate the relationship between sociodemographic and clinical variables.
The normality of the data was assessed using the Shapiro-Wilk test. For non-parametric data, specifically the GADS scores, the Wilcoxon signed-rank test was applied. For parametric data (BDI and BAI scores), Levene's test was used to assess homogeneity of variances, followed by ANOVA for comparisons across multiple groups and Student's t-test for pairwise comparisons.
All statistical analyses were performed using PASW statistical software (version 23.0; SPSS Inc., Chicago, Illinois), with a bilateral significance level set at p < 0.05.
GenAI was used for superficial text editing.
3. Results
Sociodemographic Characteristics
The sample consisted of 35 participants with a mean age of 38.29 ± 10.38 years (range: 19–59 years). Of these, 57.1% were women, and 42.9% were men. Regarding age distribution, 20% were 28 years old or younger, 34.3% were between 29 and 38 years old, and 45.7% were over 39 years old. All participants were of Caucasian ethnicity. Concerning employment status, 42.9% were employed, 31.4% were self-employed, 22.9% were students, and 2.9% were retirees. More than half of the participants were married (54.3%), while 40% were single, and 5.7% were cohabiting.
In terms of educational level, 40% had a university degree, 22.9% had completed secondary education, 14.3% held advanced vocational training qualifications, 11.4% had intermediate vocational training, and 11.4% had a high school diploma. The average annual income was €17,062.86 ± €14,842.21, ranging from €0 to €60,000. Among the participants, 40% earned less than €12,450 annually, while 31.4% had an income between €20,200 and €35,200.
Regarding personal medical history, 20% reported relevant family medical history, 5.7% had a history of mononucleosis, and 17.1% had autoimmune diseases. Additionally, 22.9% were smokers, 8.6% consumed alcohol, and only 2.9% reported cannabis use. In terms of initial symptoms, 31.4% reported hypoesthesia, 20% reported visual disturbances or paresthesia, 17.1% reported diplopia, and 11.4% reported muscle weakness.
All participants underwent MRI, and the treatments received were varied. The most frequently administered treatments included ocrelizumab (20%), cladribine (14.3%), and natalizumab (14.3%). Other drugs, such as alemtuzumab, ponesimod, or ublituximab, were used in smaller proportions (2.9% each).
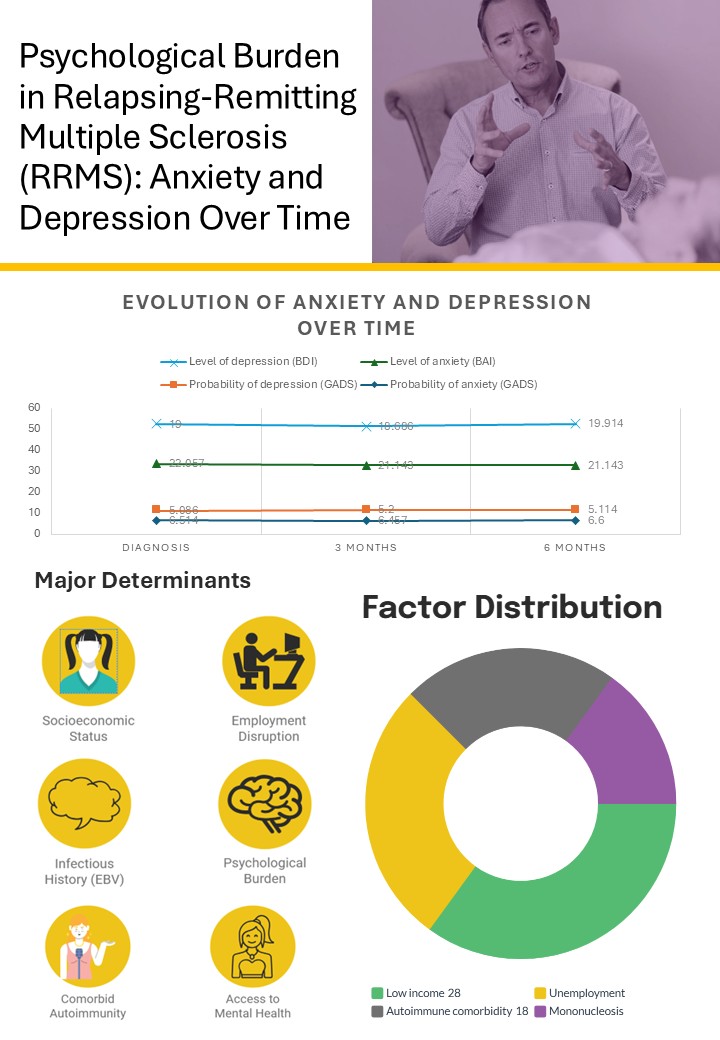
In the depression scales, significant associations were observed with several sociodemographic variables. On the GADS scale, participants with lower incomes (<€12,450) were predominantly classified as "Probable" at both 3 and 6 months. On the Beck scale, the highest categories (3 and 4) were associated with lower incomes and a history of previous mononucleosis. Furthermore, the most used treatments, such as cladribine, natalizumab, and ocrelizumab, were associated with a higher proportion of participants in the intermediate categories (2 and 3), while other treatments showed greater dispersion across categories (Figure 1).
Psychological Impact
In the anxiety scales, most participants were classified in the highest categories over time. On the GADS scale, 91.4% of participants were classified as “Probable” at baseline, 3 months, and 6 months, with no significant changes in distribution. On the Beck scale, a higher proportion of participants were classified in the highest categories (3 and 4) at 3 and 6 months, particularly among students and employed participants. In contrast, retirees and self-employed individuals were primarily distributed in the lower categories. Additionally, participants with autoimmune diseases tended to fall into the highest categories (3 and 4) on this scale.
The descriptive statistics provide the means and standard deviations of the probabilities and levels of anxiety and depression across the three evaluation points: diagnosis, 3 months, and 6 months. Regarding the probability of anxiety (GADS), the initial mean was 6.514 (SD = 2.2278), which remained relatively stable at 3 months (M = 6.457; SD = 2.0050) and 6 months (M = 6.600; SD = 1.8974). Similarly, the probability of depression (GADS) showed an initial mean of 5.086 (SD = 2.5710), with slight variations at 3 months (M = 5.200; SD = 2.2596) and 6 months (M = 5.114; SD = 2.1662). On the other hand, anxiety levels (BAI) had an initial mean of 22.057 (SD = 10.2640), with a slight decrease at 3 months (M = 21.143; SD = 8.9644), which remained consistent at 6 months (M = 21.143; SD = 8.5307). Finally, depression levels (BDI) showed an initial mean of 19.000 (SD = 9.0326), which slightly decreased at 3 months (M = 18.686; SD = 7.8207) but increased again at 6 months (M = 19.914; SD = 8.4344). (Figure 2).
The analysis of individual BDI symptoms over time reveals variations in their frequency between diagnosis, 3 months, and 6 months. For example, pessimism initially decreased at 3 months (57.1% of patients with a score of 1 vs. 42.9% at diagnosis) but increased by the score of 2 at 6 months (31.4% vs. 20.0% at 3 months). In the case of sadness, most patients consistently had a score of 1 overtime (65.7% at diagnosis and 3 months, 62.9% at 6 months). Conversely, symptoms such as failure and loss of pleasure showed a general trend toward higher scores (2 and 3) over time, suggesting a worsening in these specific aspects of depression. Guilt and feelings of punishment remained relatively stable, with a higher proportion of patients reporting low scores (0 and 1) across all three assessments. Regarding more severe symptoms, such as suicidal thoughts or ideation, most patients (82.9% at diagnosis and 77.1% at 6 months) did not report this symptom (score 0), although a small percentage (14.3% to 22.9%) reported scores of 1, indicating the need for continuous monitoring. (Table 1).
The analysis of individual BAI symptoms over time reveals interesting patterns in their frequency between diagnosis, 3 months, and 6 months. Some symptoms, such as tingling or numbness, show a progressive increase in higher scores (2 and 3), rising from 54.3% at diagnosis to 57.2% at 6 months, indicating a slight intensification of the symptom in some patients. On the other hand, symptoms such as feeling of heat and dizziness or lightheadedness remained relatively stable, with a high proportion of patients reporting low scores (0 and 1) across all three time points.
For more severe symptoms, such as fear of the worst happening, there was a decrease in higher scores (3), which dropped from 34.3% at diagnosis to 28.6% at 6 months, potentially indicating an improvement in this specific aspect of anxiety. However, other symptoms, such as inability to relax and nervousness, showed greater persistence, with high scores (3) reported by 28.6% and 45.7% of patients, respectively, at diagnosis, and only a slight decrease at 6 months (31.4% and 28.6%, respectively). (Table 2)
Conversely, symptoms such as pallor and facial flushing were reported less frequently, with most patients scoring 0, suggesting these symptoms were less prevalent in this sample. Finally, fear of dying showed a trend toward a decrease in higher scores (3), dropping from 17.1% at diagnosis to 2.9% at 6 months, which could reflect an improvement in coping with this symptom.
Depression
When comparing the probability of depression scores (GADS) with those obtained at 3 months, no statistically significant differences were found using the Wilcoxon test (Z = −0.470, p = 0.639). Similarly, the comparison between the initial scores and those at 6 months also showed no significant differences (Z = −0.099, p = 0.921). Finally, when comparing depression scores (GADS) between 3 and 6 months, no statistically significant differences were observed (Z = −0.041, p = 0.967).
Levene’s test for equality of variances between baseline depression levels (BDI) and those at 3 months was significant (F (21,13) = 5.116, p = 0.002), indicating that error variances were not homogeneous across groups. The corrected model was statistically significant (F (21,13) = 6.213, p = 0.001), explaining 90.9% of the variance in baseline depression levels (R2 = 0.909, adjusted R2 = 0.763). This suggests that the independent variable had a considerable impact on the depression scores assessed at 3 months. The intercept was also highly significant (F (1,13) = 690.605, p < 0.001), reflecting the importance of the overall mean values of the dependent variable. The analysis revealed a very large effect size (partial η2 = 0.909), confirming that the differences between groups were substantial. The estimated overall mean depression level at 3 months was 18.519 (95% CI), with a standard error of 0.705, providing a reliable estimate of the central tendency.
In the analysis of BDI scores at baseline and 3 months, a significant effect was observed between groups (F = 21.217; p = 0.001). Post hoc tests revealed that Group 4 had significantly higher scores compared to Groups 1, 2, and 3 (p < 0.05). Notably, the most pronounced differences were observed between Group 4 and Group 1 (p = 0.001), as well as between Group 4 and Group 2 (p = 0.003). Groups 1 and 2 tended to form subsets with lower scores, while Groups 3 and 4 were clustered into subsets with higher scores.
The equality of variance test between baseline depression levels and those at 6 months was not significant (F (21,13) = 1.756, p = 0.149), indicating that error variances were homogeneous across groups. The corrected model, however, was statistically significant (F (21,13) = 4.497, p = 0.004), explaining 87.9% of the variance in baseline depression scores (R2 = 0.879, adjusted R2 = 0.684). This suggests that the independent variable had a considerable impact on depression scores assessed at 6 months. The intercept was also highly significant (F (1,13) = 510.738, p < 0.001), reflecting the importance of the overall mean values of the dependent variable. The analysis revealed a very large effect size (partial η²=0.879), confirming substantial differences between groups. The estimated overall mean depression level at 6 months was 19.848 (95% CI), with a standard error of 0.878, providing a reliable estimate of the central tendency.
Similarly, significant differences between groups were identified when comparing depression scores at baseline and 6 months (F = 18.282, p = 0.001). Multiple comparisons indicated that Group 4 had significantly higher scores compared to Groups 1, 2, and 3 (p < 0.05). The most pronounced differences were observed between Group 4 and Group 1 (p = 0.001), as well as between Group 4 and Group 2 (p = 0.002). Tukey’s post hoc tests revealed consistent patterns in BDI scores at 6 months, with Groups 1 and 2 forming subsets with lower scores, while Groups 3 and 4 clustered into subsets with higher scores. Notably, Group 4 stood out as having the highest scores at both time points evaluated.
The equality of variance test between depression levels at 3 and 6 months was not significant (F (22,12) = 2.394, p = 0.060), suggesting that error variances were homogeneous across groups. The corrected model, however, was statistically significant (F (22,12) = 7.257, p = 0.001), explaining 93.0% of the variance in depression levels (R2 = 0.930, adjusted R2 = 0.802). This indicates that the scores at 3 months had a considerable impact on the depression scores assessed at 6 months. The intercept was also highly significant (F (1,12) = 804.532, p < 0.001), reflecting the importance of the overall mean values of the dependent variable. The analysis revealed a very large effect size (partial η2 = 0.930), confirming that the differences between groups were substantial. The estimated overall mean depression level at 6 months was 19.866 (95% CI), with a standard error of 0.700, providing a reliable estimate of the central tendency.
A one-way ANOVA was conducted to evaluate differences in depression scores between 3 and 6 months. The results indicated a significant effect between groups (F = 13.363, p < 0.001), suggesting significant variation in depression scores across the groups. Post hoc tests revealed significant differences between several groups. Group 4 had significantly higher scores compared to Groups 1 (p = 0.001), 2 (p = 0.028), and 3 (p = 0.330). Additionally, Group 3 also showed significantly higher scores compared to Group 1 (p = 0.001). However, no significant differences were observed between Groups 2 and 3 (p = 0.224). Tukey’s tests demonstrated that Groups 1 and 2 formed subsets with lower scores, while Groups 3 and 4 clustered into subsets with higher scores. Notably, Group 4 presented the highest scores in this measurement.
The initial mean depression score was 19.00 (SD = 9.03), while the mean score at 3 months was 18.69 (SD = 7.82). A high correlation was observed between these two measurements (r=0.829, p=0.000), although the difference in mean scores was not statistically significant (t (34) = 0.367, p = 0.716). Meanwhile, the mean depression score at 3 months (18.69, SD = 7.82) slightly increased to 19.91 (SD = 8.43) at 6 months, also showing a high correlation between the two measurements (r = 0.848, p = 0.001). However, the difference in mean scores between 3 and 6 months was not statistically significant (t (34) = −1.606, p = 0.117).
The equality of variance test for error between baseline depression levels and anxiety levels at 3 months was significant (F (21,13) = 4.098, p=0.006), indicating that error variances were not homogeneous across groups. This result should be considered a limitation when interpreting subsequent analyses. The corrected model was statistically significant (F (21,13) = 3.315, p = 0.015), explaining 84.3% of the variance in anxiety levels (R2 = 0.843, adjusted R2 = 0.588). This suggests that baseline depression levels had a significant impact on anxiety scores at 3 months. The intercept was also highly significant (F (1,13) = 388.216, p < 0.001), reflecting the importance of the overall mean values of the dependent variable. The analysis revealed a large effect size (partial η2 = 0.843), confirming the relevance of the differences between groups. The estimated overall mean anxiety level at 3 months was 20.973 (95% CI), with a standard error of 1.064, providing a reliable estimate of the central tendency.
For BAI scores at 3 months, a significant effect between groups was also observed in the ANOVA test (F = 6.493, p = 0.002). Post hoc tests revealed that Group 4 had significantly higher scores compared to Groups 1 (p = 0.001) and 3 (p = 0.305), while Group 3 showed significant differences compared to Group 1 (p = 0.023). No significant differences were found between Groups 2 and 3 (p = 0.754) or between Groups 2 and 4 (p = 0.103).
The analysis of homogeneous subsets indicated that anxiety scores at 3 months tend to be higher in groups with higher depression scores. Although no statistically significant differences were observed between the groups (p = 0.097), a trend was identified in which groups with higher depression levels (Group 3: M = 3.4167; Group 4: M = 3.3333) had higher anxiety scores compared to groups with lower depression levels (Group 1: M = 2.4444; Group 2: M = 2.6364).
Levene’s test for equality of variances between baseline depression levels and anxiety levels at 6 months was not significant (F (21,13) = 1.353, p = 0.291), indicating that error variances were homogeneous across groups. The corrected model was statistically significant (F (21,13) = 5.880, p = 0.001), explaining 90.5% of the variance in anxiety levels (R²=0.905, adjusted R²=0.751). This suggests that baseline depression levels had a considerable impact on anxiety scores at 6 months. The intercept was also highly significant (F (1,13) = 712.049, p < 0.001), reflecting the importance of the overall mean values of the dependent variable. The analysis revealed a very large effect size (partial η²=0.905), confirming that the differences between the groups were substantial. The estimated overall mean anxiety level at 6 months was 21.030 (95% CI), with a standard error of 0.788, providing a reliable estimate of the central tendency.
The equality of variance test for error between depression levels at 3 months and anxiety levels at 6 months was significant (F (22,12) = 16.890, p < 0.001), indicating that error variances were not homogeneous across groups. This result should be considered a limitation when interpreting subsequent analyses. The corrected model was not statistically significant (F (22,12) = 1.685, p = 0.176), explaining 75.5% of the variance in anxiety levels (R2 = 0.755, adjusted R2 = 0.307). This suggests that depression scores at 3 months did not have a significant impact on anxiety scores at 6 months. However, the intercept was highly significant (F (1,12) = 245.614, p < 0.001), reflecting the importance of the overall mean values of the dependent variable. The estimated overall mean anxiety level at 6 months was 20.764 (95% CI), with a standard error of 1.325, providing a reliable estimate of the central tendency.
In the analysis of BAI scores at 6 months, significant differences were identified between the groups (F = 11.528, p = 0.001). Post hoc tests indicated that Group 4 had significantly higher scores compared to Groups 1 (p = 0.001), 2 (p = 0.013), and 3 (p = 0.396). Similarly, Group 3 showed significantly higher scores compared to Group 1 (p = 0.001). Groups with higher depression levels at 3 months (Groups 3 and 4) presented significantly higher anxiety scores at 6 months compared to Groups 1 and 2. Specifically, Groups 3 and 4 (M = 3.6667) exhibited higher anxiety scores, while Groups 1 (M = 2.4444) and 2 (M = 2.8182) formed subsets with lower scores. However, no significant differences were found between Groups 3 and 4 (p = 0.111) or between Groups 1 and 2 (p = 0.733).
Anxiety
A non-parametric Wilcoxon signed-rank test was conducted to evaluate changes in the scores over time. When comparing probability anxiety scores (GADS) at 3 months with baseline scores, no statistically significant differences were observed (Z = −0.273, p = 0.785). Similarly, the comparison of probability anxiety scores (GADS) at 6 months with baseline scores also revealed no significant differences (Z = −0.493, p = 0.622).
These findings suggest that there were no significant changes in the probability of anxiety between baseline and the evaluations conducted at 3 and 6 months, indicating that the scores remained stable throughout the follow-up period.
Levene’s test for equality of error variances was applied to compare initial anxiety levels (BAI) with the measurements at 3 and 6 months, as well as with depression levels (BDI) across the different time points.
Regarding anxiety levels at 3 months, Levene's test was not significant (F (21,13) = 1.468, p = 0.240), indicating that error variances were homogeneous across the groups. The corrected model, however, was statistically significant (F (21,13) = 15.042, p < 0.001), explaining 96% of the variance in anxiety scores assessed at baseline (R2 = 0.960, adjusted R2 = 0.897). This suggests that the independent variable had a considerable impact on anxiety scores evaluated at 3 months. Furthermore, the intercept was highly significant (F (1,13) = 1903.820, p < 0.001), reflecting the importance of the overall mean values of the dependent variable. The analysis revealed a very large effect size (partial η2 = 0.960), confirming that the differences between groups were substantial. The estimated overall mean anxiety score at baseline compared to 3 months was 23.742 (95% CI), with a standard error of 0.544, providing a reliable estimate of the central tendency.
In relation to anxiety scores at baseline and 3 months, significant differences were observed between groups (F = 13.363, p < 0.001). Tukey’s post hoc tests indicated that Group 4 had significantly higher scores compared to Groups 1 (p = 0.001), 2 (p = 0.001), and 3 (p = 0.008). Similarly, Group 3 showed significantly higher scores compared to Groups 1 (p = 0.001) and 2 (p = 0.001). The analysis of homogeneous subsets revealed that Groups 1 and 2 formed a subset with lower scores (M = 1.6667 and 1.7500, respectively), while Groups 3 and 4 clustered into subsets with higher scores (M = 2.9375 and 3.5833, respectively). Although no significant differences were found between Groups 1 and 2 (p = 0.992) or between Groups 3 and 4 (p = 0.143), the highest anxiety scores at 3 months were observed in Group 4.
Regarding the comparison between initial anxiety levels and those at 6 months, Levene’s test was not significant (F (21,13) = 1.950, p = 0.108), indicating that error variances were homogeneous across groups. The corrected model, however, was statistically significant (F (21,13) = 8.010, p < 0.001), explaining 92.8% of the variance in baseline depression levels (R2 = 0.928, adjusted R2 = 0.812). This suggests that the independent variable had a considerable impact on anxiety scores evaluated at 6 months. Furthermore, the intercept was highly significant (F (1,13) = 1125.354, p < 0.001), reflecting the importance of the overall mean values of the dependent variable. The analysis revealed a very large effect size (partial η2 = 0.928), confirming that the differences between groups were substantial. The estimated overall mean anxiety level at 6 months was 23.402 (95% CI), with a standard error of 0.698, providing a reliable estimate of the central tendency.
In terms of anxiety scores at baseline and at 6 months, significant differences were also found between groups (F = 11.528, p < 0.001). Post hoc tests revealed that Group 4 had significantly higher scores compared to Groups 1 (p = 0.001), 2 (p = 0.001), and 3 (p = 0.001). Additionally, Group 3 showed significantly higher scores compared to Groups 1 (p = 0.001) and 2 (p = 0.041). The analysis of homogeneous subsets indicated that Groups 1 and 2 formed subsets with lower scores (M = 1.6667 and 2.2500, respectively), while Groups 3 and 4 clustered into subsets with higher scores (M = 3.0000 and 3.8333, respectively). Although no significant differences were found between Groups 1 and 2 (p = 0.202) or between Groups 3 and 4 (p = 1.000), the highest anxiety scores at 6 months were observed in Group 4.
Levene's test for equality of variances between anxiety levels at 3 and 6 months was not significant in the first analysis (F (21,13) = 1.950, p = 0.108), indicating that error variances were homogeneous across groups. However, in the second analysis, Levene's test was significant (F (21,13) = 3.559, p = 0.011), suggesting that variances were not homogeneous across groups when the 3-month scores were included as a factor.
The corrected model in the first analysis was statistically significant (F (21,13) = 8.010, p < 0.001), explaining 92.8% of the variance in anxiety levels at baseline (R2 = 0.928, adjusted R2 = 0.812). In the second analysis, the corrected model was also significant (F (21,13) = 5.658, p = 0.001), explaining 90.1% of the variance (R2 = 0.901, adjusted R2 = 0.742). This indicates that both the 6-month scores and the 3-month scores had a considerable impact on the variance in anxiety levels.
The intercept was highly significant in both analyses (F (1,13) = 1125.354, p < 0.001 in the first analysis and F (1,13) = 703.141, p < 0.001 in the second), reflecting the importance of the overall mean values of the dependent variable. Both analyses revealed a very large effect size (partial η2 = 0.928 and partial η2 = 0.901, respectively), confirming that the differences between groups were substantial.
In the first analysis, the estimated overall mean anxiety level at 6 months was 23.402 (95% CI), with a standard error of 0.698. In the second analysis, the estimated mean was 21.477 (95% CI), with a standard error of 0.810.
The analysis of anxiety scores at 3 and 6 months showed significant differences between the groups (F = 13.363, p < 0.001). Tukey’s post hoc tests revealed that Group 4 had significantly higher scores compared to Groups 1 (p = 0.001), 2 (p = 0.001), and 3 (p = 0.023). Similarly, Group 3 showed significantly higher scores compared to Groups 1 (p = 0.001) and 2 (p = 0.001). Additionally, Group 2 had higher scores than Group 1 (p = 0.233, not significant) but significantly lower scores than Groups 3 (p = 0.001) and 4 (p = 0.001).
The analysis of homogeneous subsets showed that Groups 1 and 2 formed subsets with lower scores (M = 1.5000 and 2.2857, respectively), while Groups 3 and 4 clustered into subsets with higher scores (M = 3.2222 and 3.8750, respectively). Although no significant differences were observed between Groups 1 and 2 (p = 0.093) or between Groups 3 and 4 (p = 0.205), the highest anxiety scores at 6 months were found in Group 4.
The initial mean scores at baseline were 22.06 (SD = 10.26) and decreased to 21.14 (SD = 8.96) at 3 months. A strong correlation was observed between the two measurements (r = 0.877; p = 0.001), but the difference between the means was not statistically significant (t (34) = 1.097; p = 0.28). Similarly, the initial mean scores and the scores at 6 months were 22.06 (SD = 10.26) and 21.14 (SD = 8.53), respectively, with a high and significant correlation (r = 0.847; p = 0.001), although the difference between the means was also not significant (t (34) = 0.990; p = 0.329). Finally, the mean anxiety scores at 3 and 6 months were identical (21.14), with a strong and significant correlation (r = 0.884; p = 0.001), and no significant differences were found between the means (t (34) = 0.001; p = 1.000).
4. Discussion
The findings of this study provide valuable insights into the psychological and sociodemographic characteristics of individuals with RRMS and their associations with anxiety and depression over a six-month follow-up period. These results align with and expand upon existing literature, highlighting the significant psychological burden associated with RRMS and the influence of sociodemographic and clinical variables.
Based on recent studies, the findings of this study align with existing literature on the prevalence and persistence of psychological symptoms in individuals with RRMS. Research has shown that anxiety and depression are common comorbidities in RRMS patients, with depression affecting up to 42.7% of individuals and generalized anxiety disorder affecting 26% of patients [44]. Another systematic review and meta-analysis highlighted that the prevalence of anxiety in RRMS patients is approximately 21.4%, while depression prevalence varies depending on the level of disability and disease progression. Furthermore, anxiety disorders have been reported in up to 35.6% of MS patients, underscoring the high psychological burden associated with the disease [45].
Furthermore, significant associations between higher levels of anxiety and depression and lower health-related quality of life (HRQoL) in RRMS patients were found, emphasizing the need for targeted psychological interventions. [9,46]
These findings are consistent with the current study, which also identified sociodemographic and clinical factors, such as lower income and the presence of autoimmune diseases, as contributors to higher levels of anxiety and depression.
The sociodemographic profile of the study sample aligns with trends observed in previous research. Our sample consisted of 57.1% women and 42.9% men, which is consistent with the well-documented higher prevalence of multiple sclerosis (MS) among women. Studies have shown that women are approximately 1.7 to 3 times more likely to develop MS than men, particularly in the relapsing-remitting form of the disease. [44]. Furthermore, the increasing incidence of MS among women has been noted over time, particularly in late-onset cases [47].
The mean age of participants in this study (38.29 years) also aligns with the typical age range of MS onset, which commonly occurs between the ages of 20 and 40 years. This finding is consistent with a study that reported an average age of onset at 30.3 years, with a range of 13 to 60 years [48]. Similarly, the high proportion of participants with a university degree (40%) reflects findings suggesting that MS tends to affect individuals with higher educational attainment, possibly due to the socioeconomic factors associated with healthcare access and diagnosis [46,49].
Employment status and income levels were found to have significant associations with anxiety and depression scores in this study. Specifically, participants with lower annual incomes (<€12,450) were more likely to be classified in the highest categories of anxiety and depression. This finding is supported by previous research, which has demonstrated that lower socioeconomic status (SES) is a significant risk factor for poor mental health outcomes in MS patients. A study reported that individuals with lower SES experienced significantly higher levels of anxiety, depression, and fatigue compared to those with higher SES [50].
Similarly, another study found that markers of lower SES, such as lower income and unemployment, were correlated with worse self-reported scores in depression and anxiety among MS patients [51]. Furthermore, unemployment and financial instability are among the strongest predictors of mental health challenges in MS patients, particularly in those with relapsing-remitting MS [50]. Where lower income and unemployment were strongly associated with higher rates of anxiety and depression in RRMS patients. [44].
The clinical characteristics of the sample, including personal medical history and initial symptoms, also played a role in the psychological outcomes observed. For instance, 17.1% of participants reported a history of autoimmune diseases, and these individuals were more likely to fall into the higher categories of anxiety and depression on the Beck scale. This finding aligns with research indicating that autoimmune diseases, such as multiple sclerosis, are strongly associated with elevated rates of depression and anxiety due to the chronic nature of the disease and its impact on quality of life [1]. Comorbid autoimmune diseases exacerbate the psychological burden in MS patients. [46].
Furthermore, a history of mononucleosis was associated with higher depression scores, which is consistent with studies suggesting that Epstein-Barr virus (the cause of mononucleosis) may play a role in MS pathogenesis and influence disease progression and psychological outcomes. The link between Epstein-Barr virus infection and the onset of MS, as well as its potential role in exacerbating psychiatric symptoms such as depression and anxiety. [44].
The most reported initial symptoms in our sample were hypoesthesia (31.4%), visual disturbances or paresthesia (20%), and diplopia (17.1%). These findings are in line with existing literature, which identifies sensory disturbances and visual impairments as common early symptoms of RRMS. Importantly, these symptoms can significantly impact quality of life and contribute to the development of anxiety and depression. The psychological toll of sensory and visual impairments in MS patients, noting their significant association with reduced mental health outcomes and increased emotional distress. [1,46]
The most used treatments in our sample were ocrelizumab (20%), cladribine (14.3%), and natalizumab (14.3%), which are all disease-modifying therapies (DMTs) widely used in RRMS management. These findings align with research highlighting the effectiveness of these treatments in reducing relapse activity. Ocrelizumab and natalizumab demonstrated superior efficacy in reducing relapses compared to cladribine, while all three treatments remain widely prescribed due to their disease-modifying properties. [52]. However, while DMTs are effective in reducing disease activity, they may not significantly alleviate psychological symptoms. In fact, the burden of treatment, including side effects and the stress of long-term therapy, has been associated with emotional distress in MS patients [53]. This is in line while DMTs are effective in reducing disease activity, they may not significantly alleviate psychological symptoms and, in some cases, may even contribute to emotional distress due to side effects or the burden of treatment. [46].
Interestingly, our study found that students and employed participants were more likely to be classified in the highest anxiety categories on the Beck scale, while retirees and self-employed individuals were primarily distributed in the lower categories. This may reflect the additional stressors faced by individuals who are balancing work or studies with the challenges of managing a chronic illness. Employed MS patients often report higher anxiety levels due to workplace stress and concerns about disease progression affecting job performance. [54]. Similarly, research has identified that the psychological burden of balancing employment with chronic illness management can exacerbate anxiety symptoms, particularly in younger and middle-aged individuals [53]. This may reflect the additional stressors faced by individuals who are balancing work or studies with the challenges of managing a chronic illness. Higher anxiety levels among employed MS patients, attributing this to workplace stress and concerns about disease progression affecting job performance. [46].
One of the key findings of this study is the relative stability of anxiety and depression levels over the six-month follow-up period. On the GADS scale, 91.4% of participants were classified as "Probable" for anxiety at baseline, 3 months, and 6 months, with no significant changes in distribution. Similarly, depression scores on the GADS and BDI scales showed no statistically significant changes over time. These results suggest that anxiety and depression are persistent issues in RRMS patients, which is consistent with findings from other studies. Anxiety and depression levels in MS patients remained stable over a one-year follow-up period, despite treatment and supportive care. [44]. Anxiety and depression are prevalent and persistent among MS patients. A systematic review and meta-analysis found that 44.5% of MS patients experience some level of anxiety or depression, with a significant proportion reporting persistent symptoms over time. [55]. Similarly, anxiety and depression levels in MS patients remained stable over a one-year follow-up period, even with treatment and supportive care [56].
Additionally, elevated anxiety and depression symptoms in MS patients are often resistant to treatment, further supporting the notion of their persistence over time [57].
The prevalence of anxiety and depression in our sample is higher than the rates reported in some studies but comparable to others. A study reported a prevalence of 26% for anxiety and 42.7% for depression in RRMS patients, which is slightly lower than the rates observed in our study. This discrepancy could be attributed to differences in sample characteristics, assessment tools, or cultural factors. [44].
Similarly, a meta-analysis reported pooled prevalence rates of 30.5% for depression and 22.1% for anxiety across various MS subtypes, with slightly lower rates in RRMS compared to progressive forms of the disease. These findings align with the observation that depression and anxiety are highly prevalent in MS populations, though variability in diagnostic criteria and study designs may lead to differences in reported rates. [55].
Furthermore, depression was the most reported psychiatric disorder among MS patients, with prevalence rates ranging from 37% to 54%, followed by anxiety disorders, which ranged from 14% to 41%. These findings are consistent with the high prevalence rates reported in our study and reinforce the importance of addressing these comorbidities in MS management [44].
The role of cultural and regional differences in the prevalence of mood disorders among MS patients, noting that countries with higher levels of stigma surrounding mental health often report lower rates of anxiety and depression. This underscores the importance of considering cultural factors when comparing prevalence rates across studies and populations. [45].
Additionally, our findings regarding the stability of anxiety and depression scores over time align with other study, which found no significant changes in psychological symptoms over a one-year follow-up period. However, our study provides new insights into the specific symptoms of anxiety and depression that fluctuate over time, such as pessimism and loss of pleasure, which were not addressed in previous research. [46].
The analysis of depressive symptoms in MS patients over time highlights the complexity of how specific symptoms evolve and persist. Research has consistently shown that depression is a common and significant comorbidity in MS, with its presentation often varying across different stages of the disease.
Depressive symptoms such as pessimism and loss of pleasure tend to worsen over time in MS patients, particularly as the disease progresses and physical disability increases. This aligns with findings that highlight the chronic nature of depressive symptoms in MS patients and the importance of monitoring specific aspects of depression, such as hopelessness and anhedonia, which may not respond consistently to treatment. [1].
Depressive symptoms like sadness and guilt often remain stable over time, with a significant proportion of patients reporting mild to moderate levels of these symptoms throughout follow-up periods. However, severe symptoms, such as suicidal ideation, were less commonly reported, though they still warrant continuous monitoring due to their potential impact on patient safety. [58].
Interestingly, a systematic review highlighted that while some symptoms of depression, such as feelings of worthlessness and guilt, tend to remain stable, others, like fatigue and loss of interest, frequently worsen as MS progresses. These findings suggest that the trajectory of depressive symptoms may vary based on both individual patient factors and the course of the disease. [13]
The analysis of individual BAI (Beck Anxiety Inventory) symptoms over time in MS patients provides valuable insights into the progression and persistence of anxiety-related symptoms. Anxiety is a common comorbidity in MS, with various studies highlighting its prevalence and diverse symptomatology.
Symptoms such as tingling and numbness are highly prevalent in MS patients and tend to worsen over time, particularly in those with higher levels of disease activity. This aligns with the observed progressive increase in higher scores for these symptoms in the BAI analysis, suggesting that physical symptoms of anxiety in MS may intensify as the disease progresses. [45].
Conversely, symptoms such as dizziness and lightheadedness, as well as feelings of heat, are often reported at low levels in MS patients. These symptoms are less commonly associated with anxiety in MS, and their stability over time may reflect their lower prevalence compared to other symptoms like nervousness or inability to relax. [59].
Regarding severe symptoms, such as fear of the worst happening or fear of dying, these symptoms often decrease over time in MS patients, especially with adequate psychological support and treatment. This finding is consistent with the trend observed in the analysis, where higher scores for these symptoms decreased over the six-month period. [60].
On the other hand, symptoms like nervousness and inability to relax are reported to be persistent in MS patients. These symptoms are among the most common and enduring manifestations of anxiety in MS, often requiring targeted interventions to improve long-term outcomes. Symptoms such as pallor and facial flushing were found to be less frequent in MS patients with anxiety, these symptoms are typically less prominent compared to other physical manifestations of anxiety. [61].
The relationship between depression and anxiety in MS has been extensively studied in recent years, consistently highlighting their high prevalence and significant interplay. A strong correlation between these conditions (r > 0.8, p < 0.001) supports the notion that baseline levels of depression can significantly influence anxiety at subsequent time points, as shown in multiple studies [1,62]. Depression and anxiety are among the most common neuropsychiatric comorbidities in MS, frequently co-occurring due to shared biological mechanisms such as dysregulation of the hypothalamic-pituitary-adrenal (HPA) axis and inflammatory processes. These mechanisms not only exacerbate psychological distress but also contribute to poorer disease outcomes, including increased fatigue and reduced quality of life. [1,13]
Furthermore, studies have shown that up to 50% of MS patients experience either depression or anxiety, with many individuals presenting both simultaneously. Patients with higher depression scores are significantly more likely to report elevated anxiety levels, reinforcing the bidirectional relationship between these conditions. This aligns with findings that baseline depression levels can predict future anxiety symptoms, emphasizing the importance of early detection and management [13,55]. Notably, effective treatment of depression at earlier stages could mitigate the progression or severity of anxiety over time, highlighting the need for integrated approaches to address these comorbidities. [13]
However, our findings also revealed that specific symptoms of anxiety and depression fluctuated over time. For instance, symptoms such as pessimism and loss of pleasure showed a general trend toward worsening over the six months, while symptoms like sadness and guilt remained relatively stable. This highlights the importance of monitoring individual symptoms rather than solely relying on overall scores, as certain aspects of mental health may require targeted interventions.
These findings underscore the need for long-term psychological support and interventions tailored to address the chronic nature of mental health challenges in MS patients.
Implications for Clinical Practice
The findings of this study have several important implications for clinical practice. First, the persistence of anxiety and depression in RRMS patients highlights the need for routine psychological assessments as part of comprehensive MS care. Early identification and management of these symptoms are crucial to improving patients' quality of life and overall well-being. Second, the associations between psychological symptoms and sociodemographic factors, such as income and employment status, underscore the importance of addressing social determinants of health in MS care. Providing financial and occupational support to patients could help mitigate some of the psychological burden associated with the disease. [9,46].
Third, the findings suggest that while DMTs are effective in managing disease activity, they may not adequately address psychological symptoms. This highlights the need for integrated care models that combine pharmacological treatments with psychological and social interventions. For example, cognitive-behavioral therapy (CBT) and mindfulness have been shown to be effective in reducing anxiety and depression in MS patients. (Zuo et al, 2023). [41,46]
Limitations and Future Research
While this study provides valuable insights, it is not without limitations. The small sample size (n = 35) limits the generalizability of the findings, and the lack of a control group makes it difficult to determine causality. Additionally, the reliance on self-reported measures of anxiety and depression may introduce bias, as participants may underreport or overreport their symptoms. Future research should aim to include larger, more diverse samples and consider using objective measures of psychological symptoms.
Another limitation is the relatively short follow-up period of six months. While this timeframe allowed for the identification of trends in anxiety and depression, longer follow-up studies are needed to better understand the long-term psychological impact of RRMS and its treatments. Additionally, future studies should explore the mechanisms underlying the associations between sociodemographic and clinical factors and psychological outcomes, as well as the potential role of interventions in mitigating these effects..
5. Conclusions
This study highlights the significant psychological burden associated with RRMS, with anxiety and depression persisting over time despite treatment. Sociodemographic and clinical factors, such as lower income and the presence of autoimmune diseases, were identified as significant contributors to higher levels of anxiety and depression. These findings underscore the importance of integrated care models that address not only the physical but also the psychological and social aspects of MS. Further research is needed to explore the long-term psychological impact of RRMS and to develop effective interventions to improve the quality of life for individuals living with this condition.
Author Contributions
Conceptualization, ERPP; MdRMA and LBL; methodology, ERPP; EGG; MINH; MFV and LBL; software, ERPP and LBL; validation, LBL., EGF and MdRMA; formal analysis, ERPP; investigation, ERPP, LBL, MdRMA, EGG, EGF, MINH and MFV; data curation, MdRMA and ERPP.; writing—original draft preparation, EGG, MdRMA and LBL; writing—review and editing, ERPP, MINH, LBL and MFV; visualization, ERPP, EGG and LBL; supervision, EGG and ERPP; project administration, LBL and ERPP. All authors have read and agreed to the published version of the manuscript.
Funding
This research was funded by Ilustre Colegio Oficial de Enfermería de Lugo and University of San-tiago de Compostela, grant number 2025-PO021” and “The APC was funded by the related proyect”. https://investigacion.usc.gal/proyectos/1482679/detalle.
Institutional Review Board Statement
The study was conducted in accordance with the Declaration of Helsinki and approved by the Research Ethics Committee of Santiago–Lugo (protocol code 2022–388 on 15th December of 2022).
Informed Consent Statement
All participants provided informed consent prior to enrollment in the study, in compliance with ethical standards.
Data Availability Statement
The datasets generated and/or analyzed during the current study are not publicly available but can be obtained from the corresponding author upon reasonable request, subject to privacy and ethical restrictions.
Conflicts of Interest
The authors declare no conflicts of interest.
Public Involvement Statement
No public involvement in any aspect of this research.
Guidelines and Standards Statement
This manuscript was drafted against the STROBE for Observational studies.
Use of Artificial Intelligence
The artificial intelligence (AI) was used for language editing and grammar.
References
- Margoni, M.; Preziosa, P.; Rocca, M.A.; Filippi, M. Depressive symptoms, anxiety and cognitive impairment: emerging evidence in multiple sclerosis. Psychiatry 2023, 13, 264. [Google Scholar] [CrossRef]
- Pouyanfard, S.; Mohammadpour, M.; ParviziFard, A.A.; Sadeghi, K. Effectiveness of mindfulness-integrated cognitive behavior therapy on anxiety, depression and hope in multiple sclerosis patients: a randomized clinical trial. Trends Psychiatry Psychother. 2020, 42, 55–63. [Google Scholar] [CrossRef]
- Wenger, A.; Calabrese, P. Comparing underlying mechanisms of depression in multiple sclerosis and rheumatoid arthritis. J. Integr. Neurosci. 2021, 20, 765–776. [Google Scholar] [CrossRef]
- Ghafoor, D.D.; Ahmed, D.O.; Al-Bajalan, S.J. Demographic, Clinical, and Molecular Determinants of Quality of Life and Oxidative Stress in Multiple Sclerosis: A Cross-Sectional Study from Sulaymaniyah, Iraq. J. Mol. Neurosci. 2025, 75, 95. [Google Scholar] [CrossRef]
- Péloquin, S.; Schmierer, K.; Leist, T.P.; Oh, J.; Murray, S.; Lazure, P. Challenges in multiple sclerosis care: Results from an international mixed-methods study. Mult. Scler. Relat. Disord. 2021, 50, 102854. [Google Scholar] [CrossRef]
- Safiri, S.; Jolfayi, A.G.; Mousavi, S.E.; Nejadghaderi, S.A.; Sullman, M.J.M.; Kolahi, A.-A. Global burden of multiple sclerosis and its attributable risk factors, 1990–2019. Front. Neurol. 2024, 15, 1448377. [Google Scholar] [CrossRef]
- Davis, B.E.; Lakin, L.; Binns, C.C.; Currie, K.M.; Rensel, M.R. Patient and Provider Insights into the Impact of Multiple Sclerosis on Mental Health: A Narrative Review. Neurol. Ther. 2021, 10, 99–119. [Google Scholar] [CrossRef]
- Han, X.; Liao, R.; Li, X.; Zhang, C.; Huo, S.; Qin, L.; Xiong, Y.; He, T.; Xiao, G.; Zhang, T. Mesenchymal stem cells in treating human diseases: molecular mechanisms and clinical studies. Signal Transduct. Target. Ther. 2025, 10, 262. [Google Scholar] [CrossRef]
- Pérez, E.R.P.; López, M.L.B.; Fernández, E.G.; Arnés, M.d.R.M.; Vázquez, M.F.; Hernández, M.I.N.; García, E.G. Predicting Quality of Life in Relapsing–Remitting Multiple Sclerosis: Clinical Burden Meets Emotional Balance in Early Disease. Neurol. Int. 2025, 17, 195. [Google Scholar] [CrossRef]
- Albanese, A.M.; Bartz-Overman, C.; Parikh, T.; Thielke, S.M. Associations Between Activities of Daily Living Independence and Mental Health Status Among Medicare Managed Care Patients. J. Am. Geriatr. Soc. 2020, 68, 1301–1306. [Google Scholar] [CrossRef]
- Maresova, P.; Krejcar, O.; Maskuriy, R.; Abu Bakar, N.A.; Selamat, A.; Truhlarova, Z.; Horak, J.; Joukl, M.; Vítkova, L. Challenges and opportunity in mobility among older adults – key determinant identification. BMC Geriatr. 2023, 23, 447. [Google Scholar] [CrossRef]
- Goodarzi, F.; Khoshravesh, S.; Ayubi, E.; Bashirian, S.; Barati, M. Psychosocial determinants of functional independence among older adults: A systematic review and meta-analysis. Heal. Promot. Perspect. 2024, 14, 32–43. [Google Scholar] [CrossRef]
- Hanna, M.; Strober, L.B. Anxiety and depression in Multiple Sclerosis (MS): Antecedents, consequences, and differential impact on well-being and quality of life. Mult. Scler. Relat. Disord. 2020, 44, 102261. [Google Scholar] [CrossRef]
- Topcu, G.; Mhizha-Murira, J.R.; Griffiths, H.; Bale, C.; Drummond, A.; Fitzsimmons, D.; Potter, K.-J.; Evangelou, N.; das Nair, R. Experiences of receiving a diagnosis of multiple sclerosis: a meta-synthesis of qualitative studies. Disabil. Rehabilitation 2022, 45, 772–783. [Google Scholar] [CrossRef]
- Wilkinson, H.R.; das Nair, R. The psychological impact of the unpredictability of multiple sclerosis: a qualitative literature meta-synthesis. Br. J. Neurosci. Nurs. 2013, 9, 172–178. [Google Scholar] [CrossRef]
- Pérez, A.S.; Casado, S.E.; Payero, M.Á.; Pueyo, Á.E.E.; Bernabé, Á.G.A.; Zamora, N.P.; Ruiz, P.D.; González, A.M.L. Tratamientos modificadores de la enfermedad en pacientes con esclerosis múltiple en España. Farm. Hosp. 2023, 47, 155–160. [Google Scholar] [CrossRef]
- Kołtuniuk, A.; Pawlak, B.; Krówczyńska, D.; Chojdak-Łukasiewicz, J. The quality of life in patients with multiple sclerosis – Association with depressive symptoms and physical disability: A prospective and observational study. Front. Psychol. 2023, 13, 1068421. [Google Scholar] [CrossRef]
- Eizaguirre, M.M.B.; Yastremiz, C.; Ciufia, N.; Roman, M.S.; Alonso, R.; Silva, B.A.; Garcea, O.; Cáceres, F.; Vanotti, S. Relevance and Impact of Social Support on Quality of Life for Persons With Multiple Sclerosis. Int. J. MS Care 25, 99–103. [CrossRef]
- Latinsky-Ortiz, E.M.; Strober, L.B. Keeping it together: The role of social integration on health and psychological well-being among individuals with multiple sclerosis. Heal. Soc. Care Community 2022, 30, E4074–E4085. [Google Scholar] [CrossRef]
- Acoba, E.F. Social support and mental health: the mediating role of perceived stress. Front. Psychol. 2024, 15, 1330720. [Google Scholar] [CrossRef]
- Méndez Barbosa, E.A.; Guancha Aza, L.J.; Ávila Gelvez, J.A.; Gómez Alfonzo, A.E. Calidad de vida en pacientes con esclerosis múltiple. RECIAMUC. 2021, 5, 4–12. [Google Scholar] [CrossRef]
- da Fonseca, L.G.; Izquierdo-Sanchez, L.; Hashizume, P.H.; Carlino, Y.; Baca, E.L.; Zambrano, C.; Sepúlveda, S.A.; Bolomo, A.; Rodrigues, P.M.; Riaño, I.; et al. Cholangiocarcinoma in Latin America: a multicentre observational study alerts on ethnic disparities in tumour presentation and outcomes. Lancet Reg. Heal. - Am. 2024, 40, 100952. [Google Scholar] [CrossRef]
- Martinez, L.; Warren, J.L.; Harries, A.D.; Croda, J.; A Espinal, M.; Olarte, R.A.L.; Avedillo, P.; Lienhardt, C.; Bhatia, V.; Liu, Q.; et al. Global, regional, and national estimates of tuberculosis incidence and case detection among incarcerated individuals from 2000 to 2019: a systematic analysis. Lancet Public Heal. 2023, 8, e511–e519. [Google Scholar] [CrossRef]
- Silva, M.J.A.; Brasil, T.P.; Silva, C.S.; Frota, C.C.; Sardinha, D.M.; Figueira, L.R.T.; Neves, K.A.S.; dos Santos, E.C.; Lima, K.V.B.; Ghisi, N.d.C.; et al. Comparative analysis of the leprosy detection rate regarding its clinical spectrum through PCR using the 16S rRNA gene: a scientometrics and meta-analysis. Front. Microbiol. 2024, 15, 1497319. [Google Scholar] [CrossRef]
- López, F.G.; García-Merino, A.; Alcalde-Cabero, E.; de Pedro-Cuesta, J. Incidencia y prevalencia de la esclerosis múltiple en España. Una revisión sistemática. Neurol. 2022, 39, 639–650. [Google Scholar] [CrossRef]
- Meca-Lallana, J.; Yélamos, S.M.; Eichau, S.; Llaneza, M.; Martínez, J.M.; Martínez, J.P.; Lallana, V.M.; Torres, A.A.; Torres, E.M.; Río, J.; et al. Documento de consenso de la Sociedad Española de Neurología sobre el tratamiento de la esclerosis múltiple y manejo holístico del paciente 2023. Neurol. 2024, 39, 196–208. [Google Scholar] [CrossRef]
- Waubant, E.; Lucas, R.; Mowry, E.; Graves, J.; Olsson, T.; Alfredsson, L.; Langer-Gould, A. Environmental and genetic risk factors for MS: an integrated review. Ann. Clin. Transl. Neurol. 2019, 6, 1905–1922. [Google Scholar] [CrossRef]
- Gombash, S.E.; Lee, P.W.; Sawdai, E.; Lovett-Racke, A.E. Vitamin D as a Risk Factor for Multiple Sclerosis: Immunoregulatory or Neuroprotective? Front. Neurol. 2022, 13, 796933. [Google Scholar] [CrossRef]
- Pantazou, V.; Schluep, M.; Du Pasquier, R. Environmental factors in multiple sclerosis. 2015, 44, e113–e120. [Google Scholar] [CrossRef]
- Vitturi, B.K.; Cellerino, M.; Boccia, D.; Leray, E.; Correale, J.; Dobson, R.; van der Mei, I.; Fujihara, K.; Inglese, M. Environmental risk factors for multiple sclerosis: a comprehensive systematic review and meta-analysis. J. Neurol. 2025, 272, 1–16. [Google Scholar] [CrossRef]
- Ghaffary, E.M.; Panah, M.Y.; Vaheb, S.; Ghoshouni, H.; Shaygannejad, A.; Mazloomi, M.; Shaygannejad, V.; Mirmosayyeb, O. Clinical and psychological factors associated with fear of relapse in people with multiple sclerosis: A cross-sectional study. J. Clin. Neurosci. 2025, 135, 111210. [Google Scholar] [CrossRef]
- Hernández, M.; Mora, S. Evaluación de la calidad de vida mediante cuestionario PRIMUS en población española de pacientes con esclerosis múltiple. Neurol. 2013, 28, 340–347. [Google Scholar] [CrossRef]
- Morrissey, T.W.; Cha, Y.; Wolf, S.; Khan, M. Household economic instability: Constructs, measurement, and implications. Child. Youth Serv. Rev. 2020, 118, 105502–105502. [Google Scholar] [CrossRef]
- Zeineddine, M.; Ismail, G.; Issa, M.; El-Hajj, T.; Tfaily, H.; Dassouki, M.; Assaf, E.; Abboud, H.; Salameh, P.; Al-Hajje, A.; et al. Quality of life and access to treatment for patients with multiple sclerosis during economic crisis: the Lebanese experience. Qual. Life Res. 2025, 34, 2293–2303. [Google Scholar] [CrossRef]
- Cech, E.A.; Hiltner, S. Unsettled Employment, Reshuffled Priorities? Career Prioritization among College-Educated Workers Facing Employment Instability during COVID-19. Socius: Sociol. Res. a Dyn. World 2022, 8. [Google Scholar] [CrossRef]
- Park, S.; Fung, V. Health Care Affordability Problems by Income Level and Subsidy Eligibility in Medicare. JAMA Netw. Open 2025, 8, e2532862. [Google Scholar] [CrossRef]
- Chen, A.M. Barriers to health equity in the United States of America: can they be overcome? Int. J. Equity Heal. 2025, 24, 1–7. [Google Scholar] [CrossRef]
- Snodgrass, M.A.; Bieu, R.K.; Schroeder, R.W. Development of a Symptom Validity Index for the Beck Anxiety Inventory. Clin. Neuropsychol. 2025, 39, 1944–1959. [Google Scholar] [CrossRef]
- Terlizzi, EP; Zablotsky, B. Symptoms of Anxiety and Depression Among Adults: United States, 2019 and 2022. Natl Health Stat Report 2024, (213), CS353885. [Google Scholar] [CrossRef]
- Okutucu, F.T.; Ceyhun, H.A. The impact of anxiety and depression levels on the Big Five personality traits. PLOS ONE 2025, 20, e0321373. [Google Scholar] [CrossRef]
- Zuo, X.; Tang, Y.; Chen, Y.; Zhou, Z. The efficacy of mindfulness-based interventions on mental health among university students: a systematic review and meta-analysis. Front. Public Heal. 2023, 11, 1259250. [Google Scholar] [CrossRef]
- Montón, C.; Pérez Echevarría, M.J.; Campos, R.; García Campayo, J.; Lobo, A. Escalas de ansiedad y depresión de Goldberg: una guía de entrevista eficaz para la detección del malestar psicológico. Atención Primaria 1993, 12, 345–349. [Google Scholar]
- Sanz, J.; Navarro, M.E.; Vázquez, C. Adaptación española del Inventario de Ansiedad de Beck (BAI) en estudiantes universitarios. Ansiedad y Estrés. 2003, 9, 59–84. [Google Scholar]
- Alswat, A.M.; Altirkistani, B.A.; Alserihi, A.R.; Baeshen, O.K.; Alrushid, E.S.; Alkhudair, J.; Aldbas, A.A.; Wadaan, O.M.; Alsaleh, A.; Al Malik, Y.M.; et al. The prevalence of major depression and generalized anxiety disorder in patients with multiple sclerosis in Saudi Arabia: a cross-sectional multicentered study. Front. Psychiatry 2023, 14, 1195101. [Google Scholar] [CrossRef]
- Knowles, L.M.; Tingey, J.L.; Newman, A.K.; von Geldern, G.; Alschuler, K.N. A comparison of anxiety symptoms and correlates of anxiety in people with progressive and relapsing-remitting multiple sclerosis. Mult. Scler. Relat. Disord. 2022, 63, 103918. [Google Scholar] [CrossRef]
- Özbek, M.; Arıkanoğlu, A.; Aluçlu, M.U. Depression, Anxiety, and MSQOL-54 Outcomes in RRMS Patients Receiving Fingolimod or Cladribine: A Cross-Sectional Comparative Study. Medicina 2025, 61, 1409. [Google Scholar] [CrossRef]
- Habbestad, A.; Willumsen, J.S.; Aarseth, J.H.; Grytten, N.; Midgard, R.; Wergeland, S.; Myhr, K.M.; Torkildsen, Ø. Increasing age of multiple sclerosis onset from 1920 to 2022: a population-based study. J. Neurol. 2024, 271, 1610–1617. [Google Scholar] [CrossRef]
- Ghachem, I.; Kacem, A.B.H.; Romdhane, I.; Younes, S. Variation in the prevalence of multiple sclerosis according to gender and year of birth: 70 cases. J. Neurol. Sci. 2023, 455. [Google Scholar] [CrossRef]
- Sagici, O.; Karakas, H.; Kaya, E. Demographic and Clinical Characteristics of Persons with Multiple Sclerosis with Psychiatric Disorders. J. Mult. Scler. Res. 2023, 3, 14–17. [Google Scholar] [CrossRef]
- Maldonado, D.A.P.; Eusebio, J.R.; Amezcua, L.; Vasileiou, E.S.; Mowry, E.M.; Hemond, C.C.; (Pizzolato), R.U.; Morales, I.B.; Radu, I.; Ionete, C.; et al. The impact of socioeconomic status on mental health and health-seeking behavior across race and ethnicity in a large multiple sclerosis cohort. Mult. Scler. Relat. Disord. 2022, 58, 103451–103451. [Google Scholar] [CrossRef]
- Wang, Y.; Tian, F.; Fitzgerald, K.C.; Bhattarai, J.“.; Naismith, R.T.; Hyland, M.; Calabresi, P.A.; Mowry, E.M. Socioeconomic status and race are correlated with affective symptoms in multiple sclerosis. Mult. Scler. Relat. Disord. 2020, 41, 102010. [Google Scholar] [CrossRef]
- Roos, I.; Sharmin, S.; Malpas, C.; Ozakbas, S.; Lechner-Scott, J.; Hodgkinson, S.; Alroughani, R.; Madueño, S.E.; Boz, C.; van der Walt, A.; et al. Effectiveness of cladribine compared to fingolimod, natalizumab, ocrelizumab and alemtuzumab in relapsing-remitting multiple sclerosis. Mult. Scler. J. 2024, 30, 1163–1175. [Google Scholar] [CrossRef]
- Arisi, I.; Malimpensa, L.; Manzini, V.; Brandi, R.; di Sturmeck, T.G.; D’aMelio, C.; Crisafulli, S.; Ferrazzano, G.; Belvisi, D.; Malerba, F.; et al. Cladribine and ocrelizumab induce differential miRNA profiles in peripheral blood mononucleated cells from relapsing–remitting multiple sclerosis patients. Front. Immunol. 2023, 14, 1234869. [Google Scholar] [CrossRef]
- Zhu, C.; Zhou, Z.; Roos, I.; Merlo, D.; Kalincik, T.; Ozakbas, S.; Skibina, O.; Kuhle, J.; Hodgkinson, S.; Boz, C.; et al. Comparing switch to ocrelizumab, cladribine or natalizumab after fingolimod treatment cessation in multiple sclerosis. J. Neurol. Neurosurg. Psychiatry 2022, 93, 1330–1337. [Google Scholar] [CrossRef]
- Boeschoten, R.E.; Braamse, A.M.J.; Beekman, A.T.F.; Cuijpers, P.; van Oppen, P.; Dekker, J.; Uitdehaag, B.M. Prevalence of depression and anxiety in Multiple Sclerosis: A systematic review and meta-analysis. J. Neurol. Sci. 2017, 372, 331–341. [Google Scholar] [CrossRef]
- Kwon, S.; Han, K.-D.; Jung, J.H.; Bin Cho, E.; Chung, Y.H.; Park, J.; Choi, H.L.; Jeon, H.J.; Shin, D.W.; Min, J.-H. Risk of depression and anxiety in multiple sclerosis and neuromyelitis optica spectrum disorder: A nationwide cohort study in South Korea. Mult. Scler. J. 2024, 30, 714–725. [Google Scholar] [CrossRef]
- Dogan, S.; Yildiz, S.; Kılıçaslan, A.K.; Emir, B.S.; Kurt, O.; Sehlikoğlu, S. Does anxiety, depression, and sleep levels affect the quality of life in patients diagnosed with multiple sclerosis? 2024, 28, 1306–1313. [Google Scholar] [CrossRef]
- Sullivan, A.B.; Davis, B.; Kidd, J.; Chiong-Rivero, H. Understanding Depression in People Living with Multiple Sclerosis: A Narrative Review of Recent Literature. Neurol. Ther. 2025, 14, 681–710. [Google Scholar] [CrossRef]
- Zhang, X.; Song, Y.; Wei, Z.; Chen, X.; Zhuang, X.; Yi, L. The prevalence and risk factors of anxiety in multiple sclerosis: A systematic review and meta-analysis. Front. Neurosci. 2023, 17. [Google Scholar] [CrossRef]
- Wang, H.; Wang, R.; Zhao, R.; Zhang, G.; Zhang, G.; Zhao, X. Fatigue and its correlation with anxiety and depression in patients with multiple sclerosis in China. Front. Neurol. 2025, 16, 1604540. [Google Scholar] [CrossRef]
- Askari, F.; Ghajarzadeh, M.; Mohammadifar, M.; Azimi, A.; Sahraian, M.A.; Owji, M. Anxiety in patients with multiple sclerosis: association with disability, depression, disease type and sex. 2014, 52, 889–892. [Google Scholar]
- Davenport, R.A.; Krug, I.; Rickerby, N.; Dang, P.L.; Forte, E.; Kiropoulos, L. Personality and cognitive factors implicated in depression and anxiety in multiple sclerosis: A systematic review and meta-analysis. J. Affect. Disord. Rep. 2024, 17, 100832. [Google Scholar] [CrossRef]
Figure 1.
Significant results for Chi-square test between sociodemographic and clinical variables.
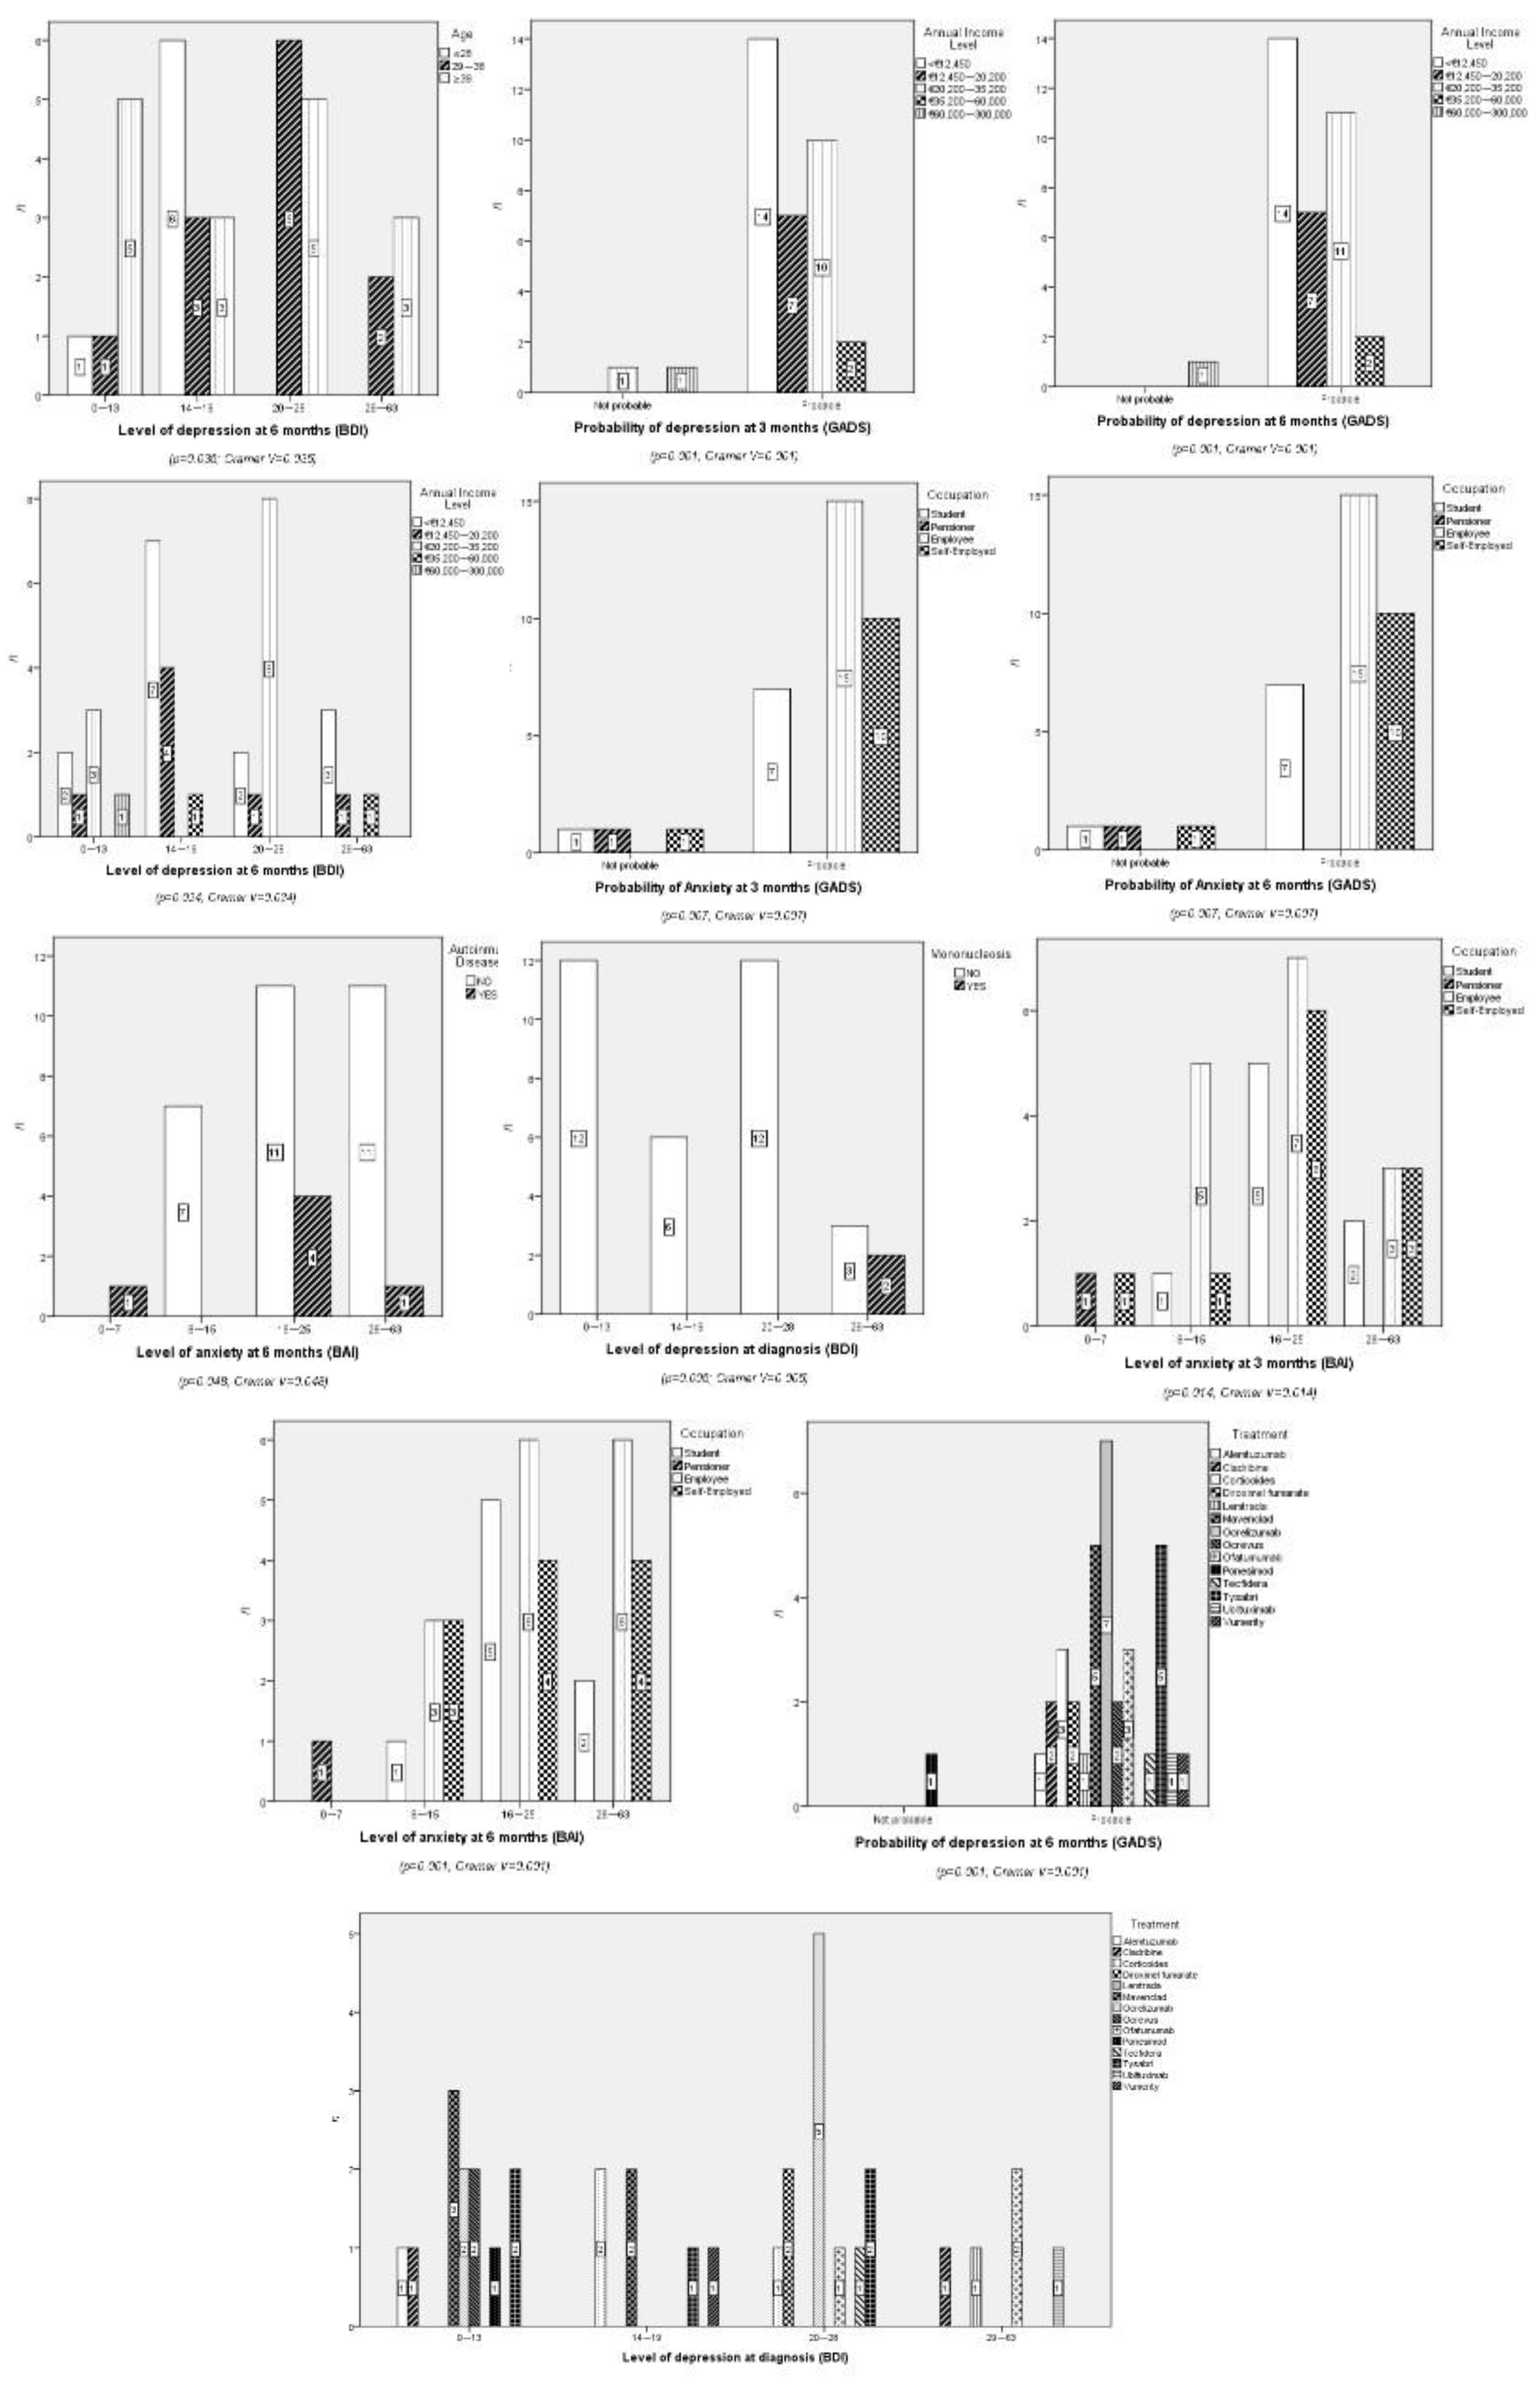
Figure 2.
Evolution of probability and levels of anxiety and depression.
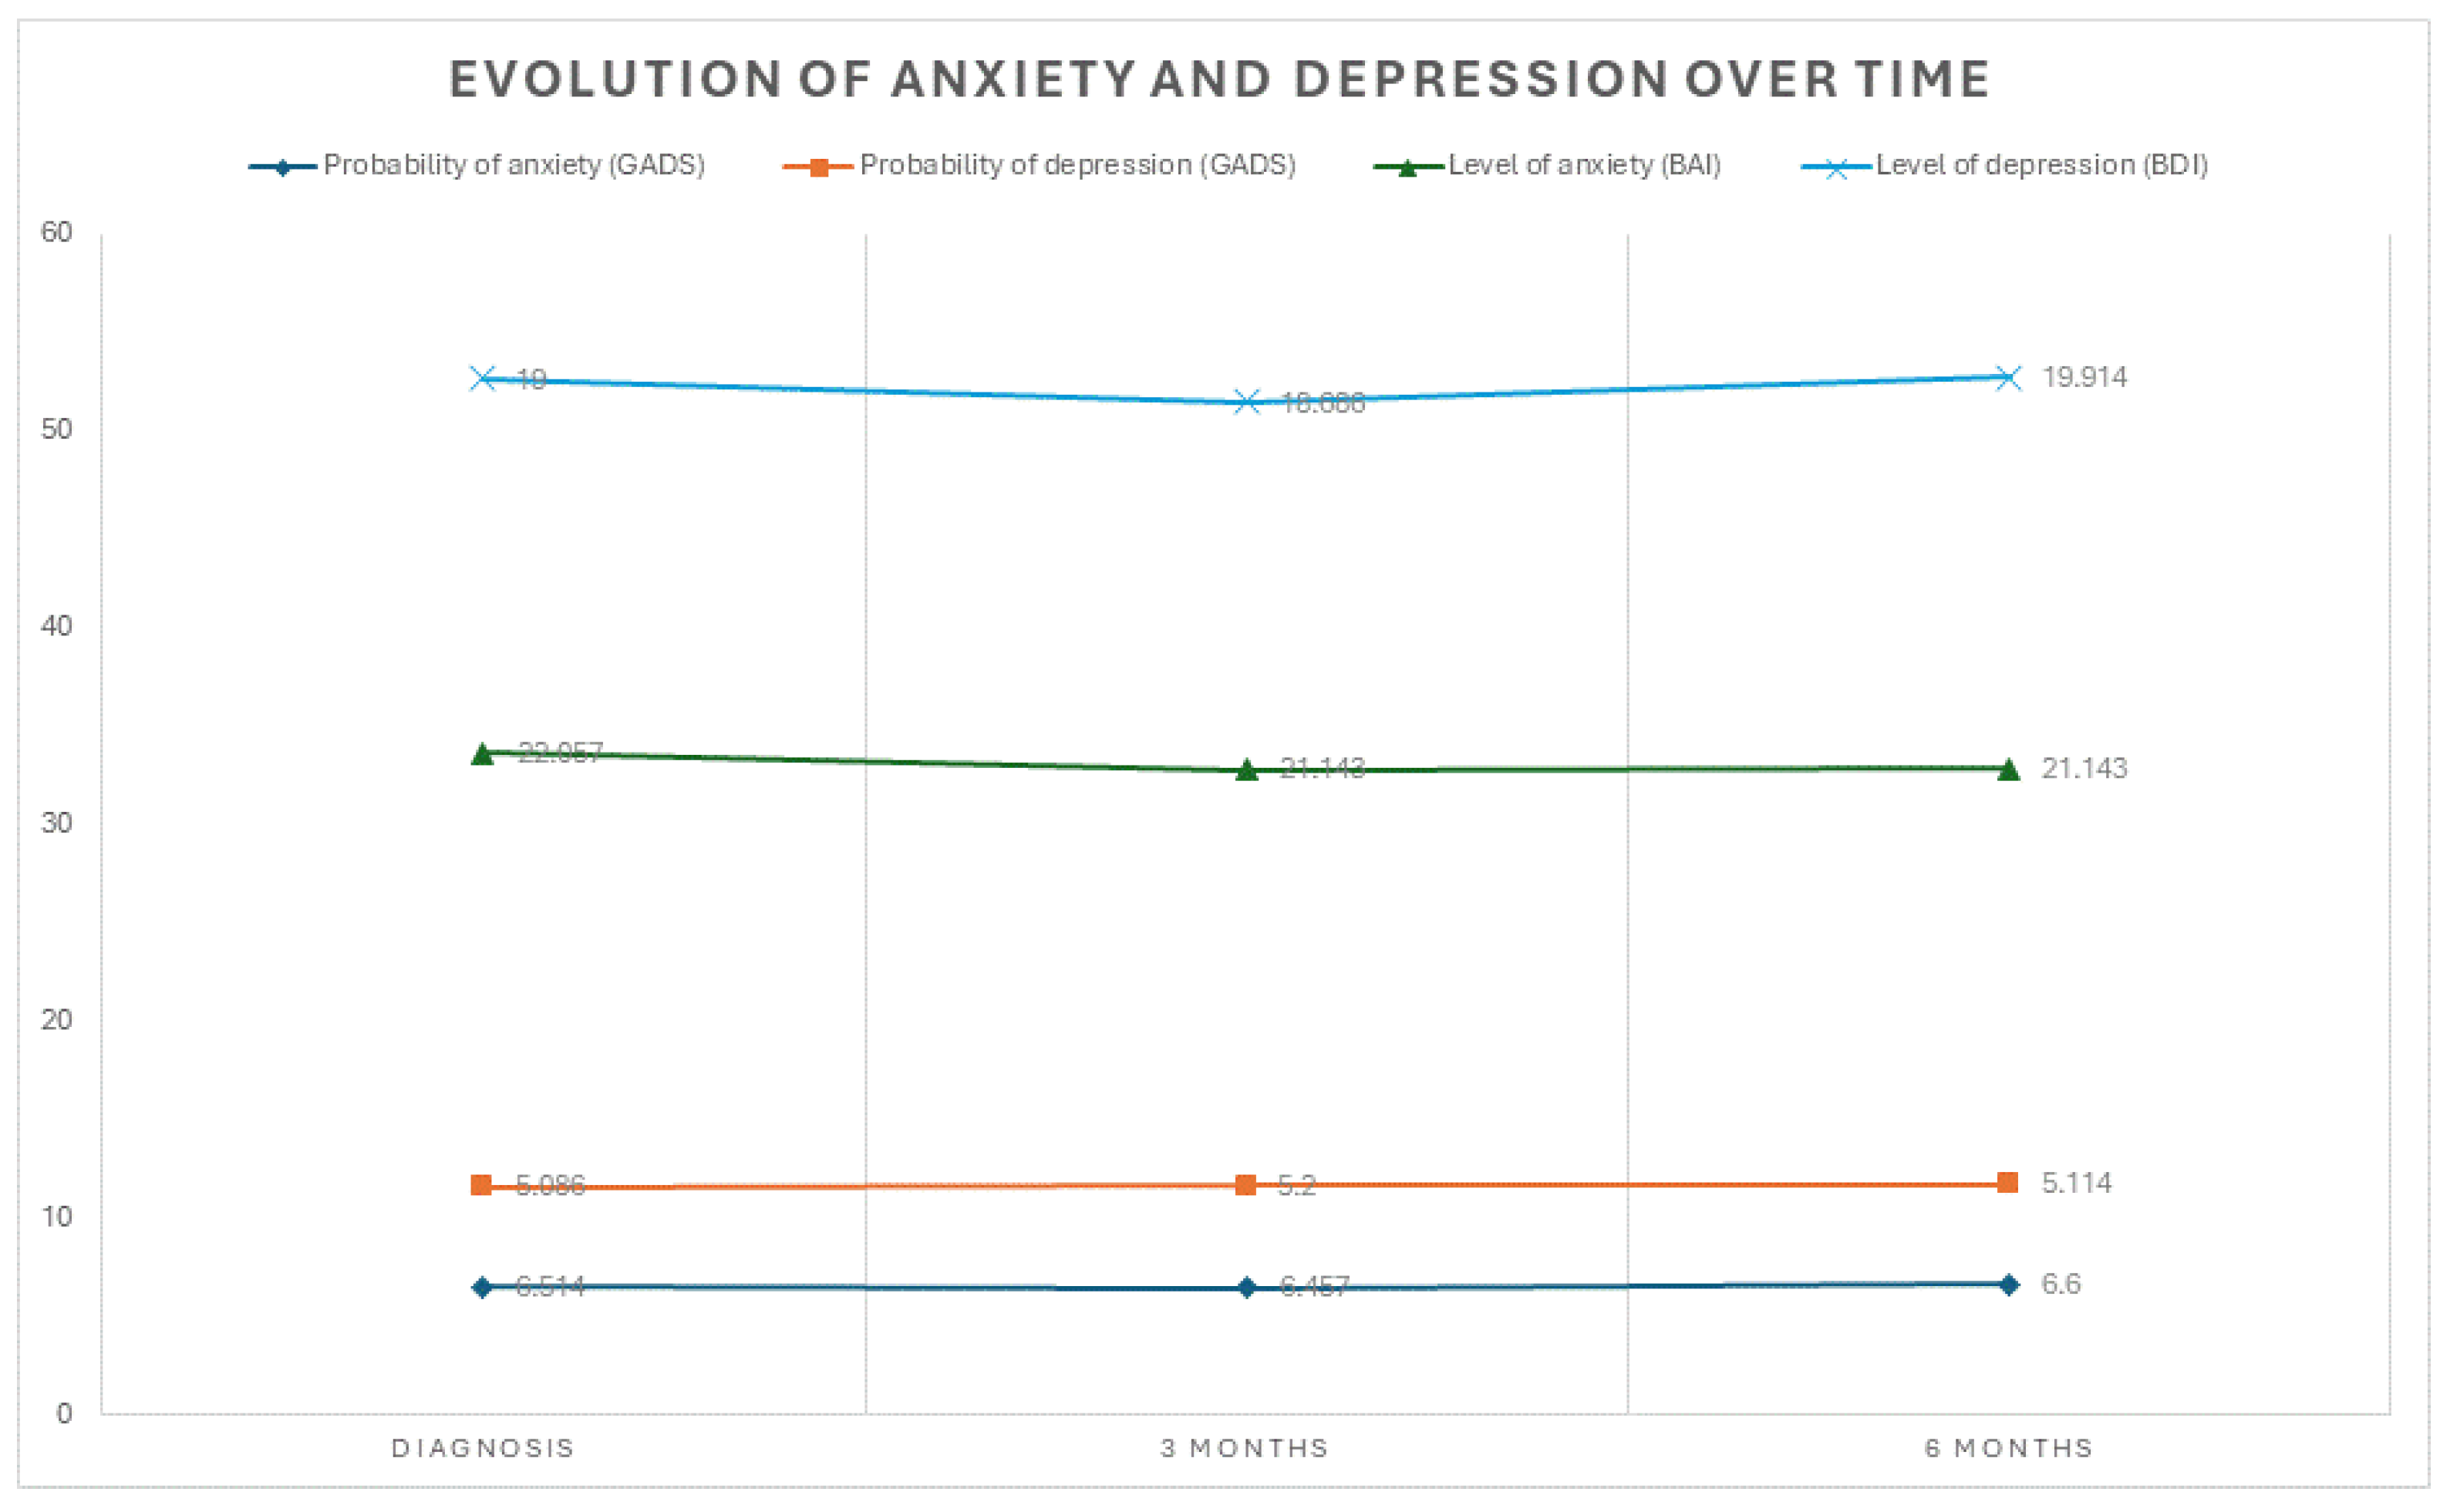

Table 1.
Frequency and distribution of BDI symptoms at diagnosis and at 3 and 6 months.
| Item Number | Symptom | Diagnosis | 3 months | 6 months | ||||
|---|---|---|---|---|---|---|---|---|
| Frecuency | n | % | n | % | n | % | ||
| 1 | Pessimism | 0 | 8 | 22.9 | 7 | 20 | 8 | 22.9 |
| 1 | 15 | 42.9 | 20 | 57.1 | 16 | 45.7 | ||
| 2 | 12 | 34.3 | 7 | 20 | 11 | 31.4 | ||
| 3 | 0 | 0 | 1 | 2.9 | 0 | 0 | ||
| 2 | Mood | 0 | 7 | 20 | 9 | 25.7 | 9 | 25.7 |
| 1 | 23 | 65.7 | 23 | 65.7 | 22 | 62.9 | ||
| 2 | 4 | 11.4 | 3 | 8.6 | 4 | 11.4 | ||
| 3 | 1 | 2.9 | 0 | 0 | 0 | 0 | ||
| 3 | Failure | 0 | 24 | 68.6 | 22 | 62.9 | 23 | 65.7 |
| 1 | 7 | 20 | 12 | 34.3 | 10 | 28.6 | ||
| 2 | 4 | 11.4 | 1 | 2.9 | 2 | 5.7 | ||
| 3 | 0 | 0 | 0 | 0 | 0 | 0 | ||
| 4 | Dissatisfaction | 0 | 10 | 28.6 | 5 | 14.3 | 4 | 11.4 |
| 1 | 15 | 429 | 23 | 65.7 | 22 | 62.9 | ||
| 2 | 8 | 22.9 | 7 | 20 | 9 | 25.7 | ||
| 3 | 2 | 5.7 | 0 | 0 | 0 | 0 | ||
| 5 | Feelings of guilt | 0 | 21 | 60 | 20 | 57.1 | 18 | 51.4 |
| 1 | 12 | 34.3 | 12 | 34.3 | 12 | 34.3 | ||
| 2 | 2 | 5.7 | 3 | 8.6 | 5 | 14.3 | ||
| 3 | 0 | 0 | 0 | 0 | 0 | 0 | ||
| 6 | Feelings of punishment | 0 | 25 | 71.4 | 24 | 68.6 | 24 | 68.6 |
| 1 | 9 | 25.7 | 9 | 25.7 | 9 | 25.7 | ||
| 2 | 1 | 2.9 | 0 | 0 | 1 | 2.9 | ||
| 3 | 0 | 0 | 2 | 5.7 | 1 | 2.9 | ||
| 7 | Self-disapproval | 0 | 12 | 34.3 | 10 | 28.6 | 9 | 25.7 |
| 1 | 17 | 48.6 | 23 | 65.7 | 19 | 54.3 | ||
| 2 | 5 | 14.3 | 2 | 5.7 | 6 | 17.1 | ||
| 3 | 1 | 2.9 | 0 | 0 | 1 | 2.9 | ||
| 8 | Self-criticism | 0 | 15 | 42.9 | 15 | 42.9 | 7 | 20 |
| 1 | 17 | 48.6 | 15 | 42.9 | 20 | 57.1 | ||
| 2 | 3 | 8.6 | 4 | 11.4 | 8 | 22.9 | ||
| 3 | 0 | 0 | 1 | 2.9 | 0 | 0 | ||
| 9 | Suicidal thoughts or ideas | 0 | 29 | 82.9 | 26 | 74.3 | 27 | 77.1 |
| 1 | 5 | 14.3 | 9 | 25.7 | 8 | 22.9 | ||
| 2 | 1 | 2.9 | 0 | 0 | 0 | 0 | ||
| 3 | 0 | 0 | 0 | 0 | 0 | 0 | ||
| 10 | Crying | 0 | 7 | 20 | 8 | 22.9 | 9 | 25.7 |
| 1 | 15 | 42.9 | 15 | 42.9 | 13 | 37.1 | ||
| 2 | 12 | 34.3 | 10 | 28.6 | 10 | 28.6 | ||
| 3 | 1 | 2.9 | 2 | 5.7 | 3 | 8.6 | ||
| 11 | Fatigability | 0 | 7 | 20 | 5 | 14.3 | 5 | 14.3 |
| 1 | 15 | 42.9 | 18 | 51.4 | 17 | 48.6 | ||
| 2 | 12 | 34.3 | 11 | 31.4 | 13 | 37.1 | ||
| 3 | 1 | 2.9 | 1 | 2.9 | 0 | 0 | ||
| 12 | Social withdrawal | 0 | 15 | 42.9 | 8 | 22.9 | 5 | 14.3 |
| 1 | 12 | 34.3 | 23 | 65.7 | 21 | 60 | ||
| 2 | 8 | 22.9 | 4 | 11.4 | 9 | 25.7 | ||
| 3 | 0 | 0 | 0 | 0 | 0 | 0 | ||
| 13 | Indecisiveness | 0 | 11 | 31.4 | 10 | 28.6 | 6 | 17.1 |
| 1 | 17 | 48.6 | 18 | 51.4 | 22 | 62.9 | ||
| 2 | 6 | 17.1 | 7 | 20 | 6 | 17.1 | ||
| 3 | 1 | 2.9 | 0 | 0 | 1 | 2.9 | ||
| 14 | Changes in physical appearance | 0 | 15 | 42.9 | 12 | 34.3 | 15 | 42.9 |
| 1 | 15 | 42.9 | 18 | 51.4 | 12 | 34.3 | ||
| 2 | 5 | 14.3 | 5 | 14.3 | 8 | 22.9 | ||
| 3 | 0 | 0 | 0 | 0 | 0 | 0 | ||
| 15 | Loss of energy | 0 | 3 | 8.6 | 4 | 11.4 | 2 | 5.7 |
| 1 | 14 | 40 | 14 | 40 | 12 | 34.3 | ||
| 2 | 15 | 42.9 | 16 | 45.7 | 21 | 60 | ||
| 3 | 3 | 8.6 | 1 | 2.9 | 0 | 0 | ||
| 16 | Changes in sleep patterns | 0 | 7 | 20 | 7 | 20 | 7 | 20 |
| 1 | 15 | 42.9 | 15 | 42.9 | 17 | 48.6 | ||
| 2 | 11 | 31.4 | 13 | 37.1 | 11 | 31.4 | ||
| 3 | 2 | 5.7 | 0 | 0 | 0 | 0 | ||
| 17 | Irritability | 0 | 10 | 28.6 | 8 | 22.9 | 6 | 17.1 |
| 1 | 15 | 42.9 | 17 | 48.6 | 20 | 57.1 | ||
| 2 | 10 | 28.6 | 10 | 28.6 | 9 | 25.7 | ||
| 3 | 0 | 0 | 0 | 0 | 0 | 0 | ||
| 18 | Loss of appetite | 0 | 18 | 51.4 | 22 | 62.9 | 25 | 71.4 |
| 1 | 11 | 31.4 | 6 | 17.1 | 6 | 17.1 | ||
| 2 | 6 | 17.1 | 7 | 20 | 4 | 11.4 | ||
| 3 | 0 | 0 | 0 | 0 | 0 | 0 | ||
| 19 | Difficulty concentrating | 0 | 7 | 20 | 7 | 20 | 5 | 14.3 |
| 1 | 16 | 45.7 | 17 | 48.6 | 16 | 45.7 | ||
| 2 | 10 | 28.6 | 10 | 28.6 | 13 | 37.1 | ||
| 3 | 2 | 5.7 | 1 | 2.9 | 1 | 2.9 | ||
| 20 | Fatigue or tiredness | 0 | 6 | 17.1 | 3 | 8.6 | 3 | 8.6 |
| 1 | 13 | 37.1 | 19 | 54.3 | 14 | 40 | ||
| 2 | 11 | 31.4 | 12 | 34.3 | 17 | 48.6 | ||
| 3 | 5 | 14.3 | 1 | 2.9 | 1 | 2.9 | ||
| 21 | Loss of libido | 0 | 10 | 28.6 | 11 | 31.4 | 11 | 31.4 |
| 1 | 13 | 37.1 | 15 | 42.9 | 18 | 51.4 | ||
| 0 | 11 | 31.4 | 8 | 22.9 | 5 | 14.3 | ||
| 3 | 1 | 2.9 | 1 | 2.9 | 1 | 2.9 | ||
n=35.
Table 2.
Frequency and distribution of BAI symptoms at diagnosis and at 3 and 6 months.
| Number of item | Symptom | Diagnosis | 3 months | 6 months | ||||
|---|---|---|---|---|---|---|---|---|
| Frecuency | n | % | n | % | n | % | ||
| 1 | Tingling or numbness | 0 | 7 | 20 | 7 | 20 | 7 | 20 |
| 1 | 9 | 25.7 | 10 | 28.6 | 8 | 22.9 | ||
| 2 | 8 | 22.9 | 11 | 31.4 | 12 | 34.3 | ||
| 3 | 11 | 31.4 | 7 | 20 | 8 | 22.9 | ||
| 2 | Feeling of heat | 0 | 15 | 42.9 | 16 | 45.7 | 15 | 42.9 |
| 1 | 11 | 31.4 | 10 | 28.6 | 12 | 34.3 | ||
| 2 | 6 | 17.1 | 6 | 17.1 | 6 | 17.1 | ||
| 3 | 3 | 8.6 | 3 | 8.6 | 2 | 5.7 | ||
| 3 | Leg tremors | 0 | 23 | 65.7 | 19 | 54.3 | 21 | 60 |
| 1 | 5 | 14.3 | 7 | 20 | 6 | 17.1 | ||
| 2 | 6 | 17.1 | 7 | 20 | 5 | 14.3 | ||
| 3 | 1 | 2.9 | 2 | 5.7 | 3 | 8.6 | ||
| 4 | Inability to relax | 0 | 8 | 22.9 | 6 | 17.1 | 5 | 14.3 |
| 1 | 7 | 20 | 9 | 25.7 | 9 | 25.7 | ||
| 2 | 10 | 28.6 | 8 | 22.9 | 10 | 28.6 | ||
| 3 | 10 | 28.6 | 12 | 34.3 | 11 | 31.4 | ||
| 5 | Fear of the worst happening | 0 | 5 | 14.3 | 7 | 20 | 9 | 25.7 |
| 1 | 8 | 22.9 | 9 | 25.7 | 7 | 20 | ||
| 2 | 10 | 28.6 | 12 | 34.3 | 9 | 25.7 | ||
| 3 | 12 | 34.3 | 7 | 20 | 10 | 28.6 | ||
| 6 | Dizziness or lightheadedness | 0 | 22 | 62.9 | 21 | 60 | 21 | 60 |
| 1 | 9 | 25.7 | 12 | 34.3 | 10 | 28.6 | ||
| 2 | 2 | 5.7 | 0 | 0 | 2 | 5.7 | ||
| 3 | 2 | 5.7 | 2 | 5.7 | 2 | 5.7 | ||
| 7 | Palpitations or tachycardia | 0 | 22 | 62.9 | 18 | 51.4 | 22 | 62.9 |
| 1 | 8 | 22.9 | 15 | 42.9 | 11 | 31.4 | ||
| 2 | 5 | 14.3 | 1 | 2.9 | 1 | 2.9 | ||
| 3 | 0 | 0 | 1 | 2.9 | 1 | 2.9 | ||
| 8 | Feeling of instability or physical insecurity | 0 | 7 | 20 | 3 | 8.6 | 5 | 14.3 |
| 1 | 9 | 25.7 | 9 | 25.7 | 9 | 25.7 | ||
| 2 | 9 | 25.7 | 14 | 40 | 12 | 34.3 | ||
| 3 | 10 | 28.6 | 9 | 25.7 | 9 | 25.7 | ||
| 9 | Terrifying thoughts | 0 | 9 | 25.7 | 7 | 20 | 7 | 20 |
| 1 | 6 | 17.1 | 8 | 22.9 | 11 | 31.4 | ||
| 2 | 10 | 28.6 | 13 | 37.1 | 8 | 22.9 | ||
| 3 | 10 | 28.6 | 7 | 20 | 9 | 25.7 | ||
| 10 | Nervousness | 0 | 2 | 5.7 | 2 | 5.7 | 1 | 2.9 |
| 1 | 10 | 28.6 | 10 | 28.6 | 12 | 34.3 | ||
| 2 | 7 | 20 | 14 | 40 | 12 | 34.3 | ||
| 3 | 16 | 45.7 | 9 | 25.7 | 10 | 28.6 | ||
| 11 | Feeling of suffocation | 0 | 15 | 42.9 | 19 | 54.3 | 16 | 45.7 |
| 1 | 9 | 25.7 | 7 | 20 | 12 | 34.3 | ||
| 2 | 6 | 17.1 | 6 | 17.1 | 5 | 14.3 | ||
| 3 | 5 | 14.3 | 3 | 8.6 | 2 | 5.7 | ||
| 12 | Hand tremors | 0 | 26 | 74.3 | 26 | 74.3 | 25 | 71.4 |
| 1 | 4 | 11.4 | 4 | 11.4 | 4 | 11.4 | ||
| 2 | 2 | 5.7 | 2 | 5.7 | 4 | 11.4 | ||
| 3 | 3 | 8.6 | 3 | 8.6 | 2 | 5.7 | ||
| 13 | Generalized trembling | 0 | 10 | 28.6 | 11 | 31.4 | 8 | 22.9 |
| 1 | 5 | 14.3 | 9 | 25.7 | 9 | 25.7 | ||
| 2 | 8 | 22.9 | 5 | 14.3 | 15 | 42.9 | ||
| 3 | 12 | 34.3 | 10 | 28.6 | 3 | 8.6 | ||
| 14 | Fear of losing control | 0 | 14 | 40 | 12 | 34.3 | 16 | 45.7 |
| 1 | 10 | 28.6 | 9 | 25.7 | 9 | 25.7 | ||
| 2 | 6 | 17.1 | 11 | 31.4 | 8 | 22.9 | ||
| 3 | 5 | 14.3 | 3 | 8.6 | 2 | 5.7 | ||
| 15 | Difficulty breathing | 0 | 24 | 68.6 | 23 | 65.7 | 24 | 68.6 |
| 1 | 4 | 11.4 | 7 | 20 | 4 | 11.4 | ||
| 2 | 5 | 14.3 | 3 | 8.6 | 4 | 11.4 | ||
| 3 | 2 | 5.7 | 2 | 5.7 | 3 | 8.6 | ||
| 16 | Fear of dying | 0 | 19 | 54.3 | 20 | 57.1 | 21 | 60 |
| 1 | 4 | 11.4 | 9 | 25.7 | 8 | 22.9 | ||
| 2 | 6 | 17.1 | 3 | 8.6 | 5 | 14.3 | ||
| 3 | 6 | 17.1 | 3 | 8.6 | 1 | 2.9 | ||
| 17 | Startling | 0 | 9 | 25.7 | 6 | 17.1 | 4 | 11.4 |
| 1 | 7 | 20 | 11 | 31.4 | 9 | 25.7 | ||
| 2 | 8 | 22.9 | 13 | 37.1 | 17 | 48.6 | ||
| 3 | 11 | 31.4 | 5 | 14.3 | 5 | 14.3 | ||
| 18 | Digestive or abdominal discomfort | 0 | 23 | 65.7 | 22 | 62.9 | 19 | 54.3 |
| 1 | 8 | 22.9 | 9 | 25.7 | 10 | 28.6 | ||
| 2 | 3 | 8.6 | 2 | 5.7 | 4 | 11.4 | ||
| 3 | 1 | 2.9 | 2 | 5.7 | 2 | 5.7 | ||
| 19 | Pallor | 0 | 33 | 94.3 | 33 | 94.3 | 34 | 97.1 |
| 1 | 2 | 5.7 | 2 | 5.7 | 1 | 2.9 | ||
| 20 | Facial flushing | 0 | 25 | 71.4 | 27 | 77.1 | 24 | 68.6 |
| 1 | 5 | 14.3 | 3 | 8.6 | 6 | 17.1 | ||
| 2 | 4 | 11.4 | 3 | 8.6 | 3 | 8.6 | ||
| 3 | 1 | 2.9 | 2 | 5.7 | 2 | 5.7 | ||
| 21 | Sweating (not due to heat) | 0 | 19 | 54.3 | 19 | 54.3 | 18 | 51.4 |
| 1 | 7 | 20 | 7 | 20 | 8 | 22.9 | ||
| 0 | 7 | 20 | 7 | 20 | 7 | 20 | ||
| 3 | 2 | 5.7 | 2 | 5.7 | 2 | 5.7 | ||
n=35
Disclaimer/Publisher’s Note: The statements, opinions and data contained in all publications are solely those of the individual author(s) and contributor(s) and not of MDPI and/or the editor(s). MDPI and/or the editor(s) disclaim responsibility for any injury to people or property resulting from any ideas, methods, instructions or products referred to in the content. |
© 2025 by the authors. Licensee MDPI, Basel, Switzerland. This article is an open access article distributed under the terms and conditions of the Creative Commons Attribution (CC BY) license (http://creativecommons.org/licenses/by/4.0/).
Copyright: This open access article is published under a Creative Commons CC BY 4.0 license, which permit the free download, distribution, and reuse, provided that the author and preprint are cited in any reuse.


