
Submitted:
17 September 2025
Posted:
18 September 2025
You are already at the latest version
Abstract
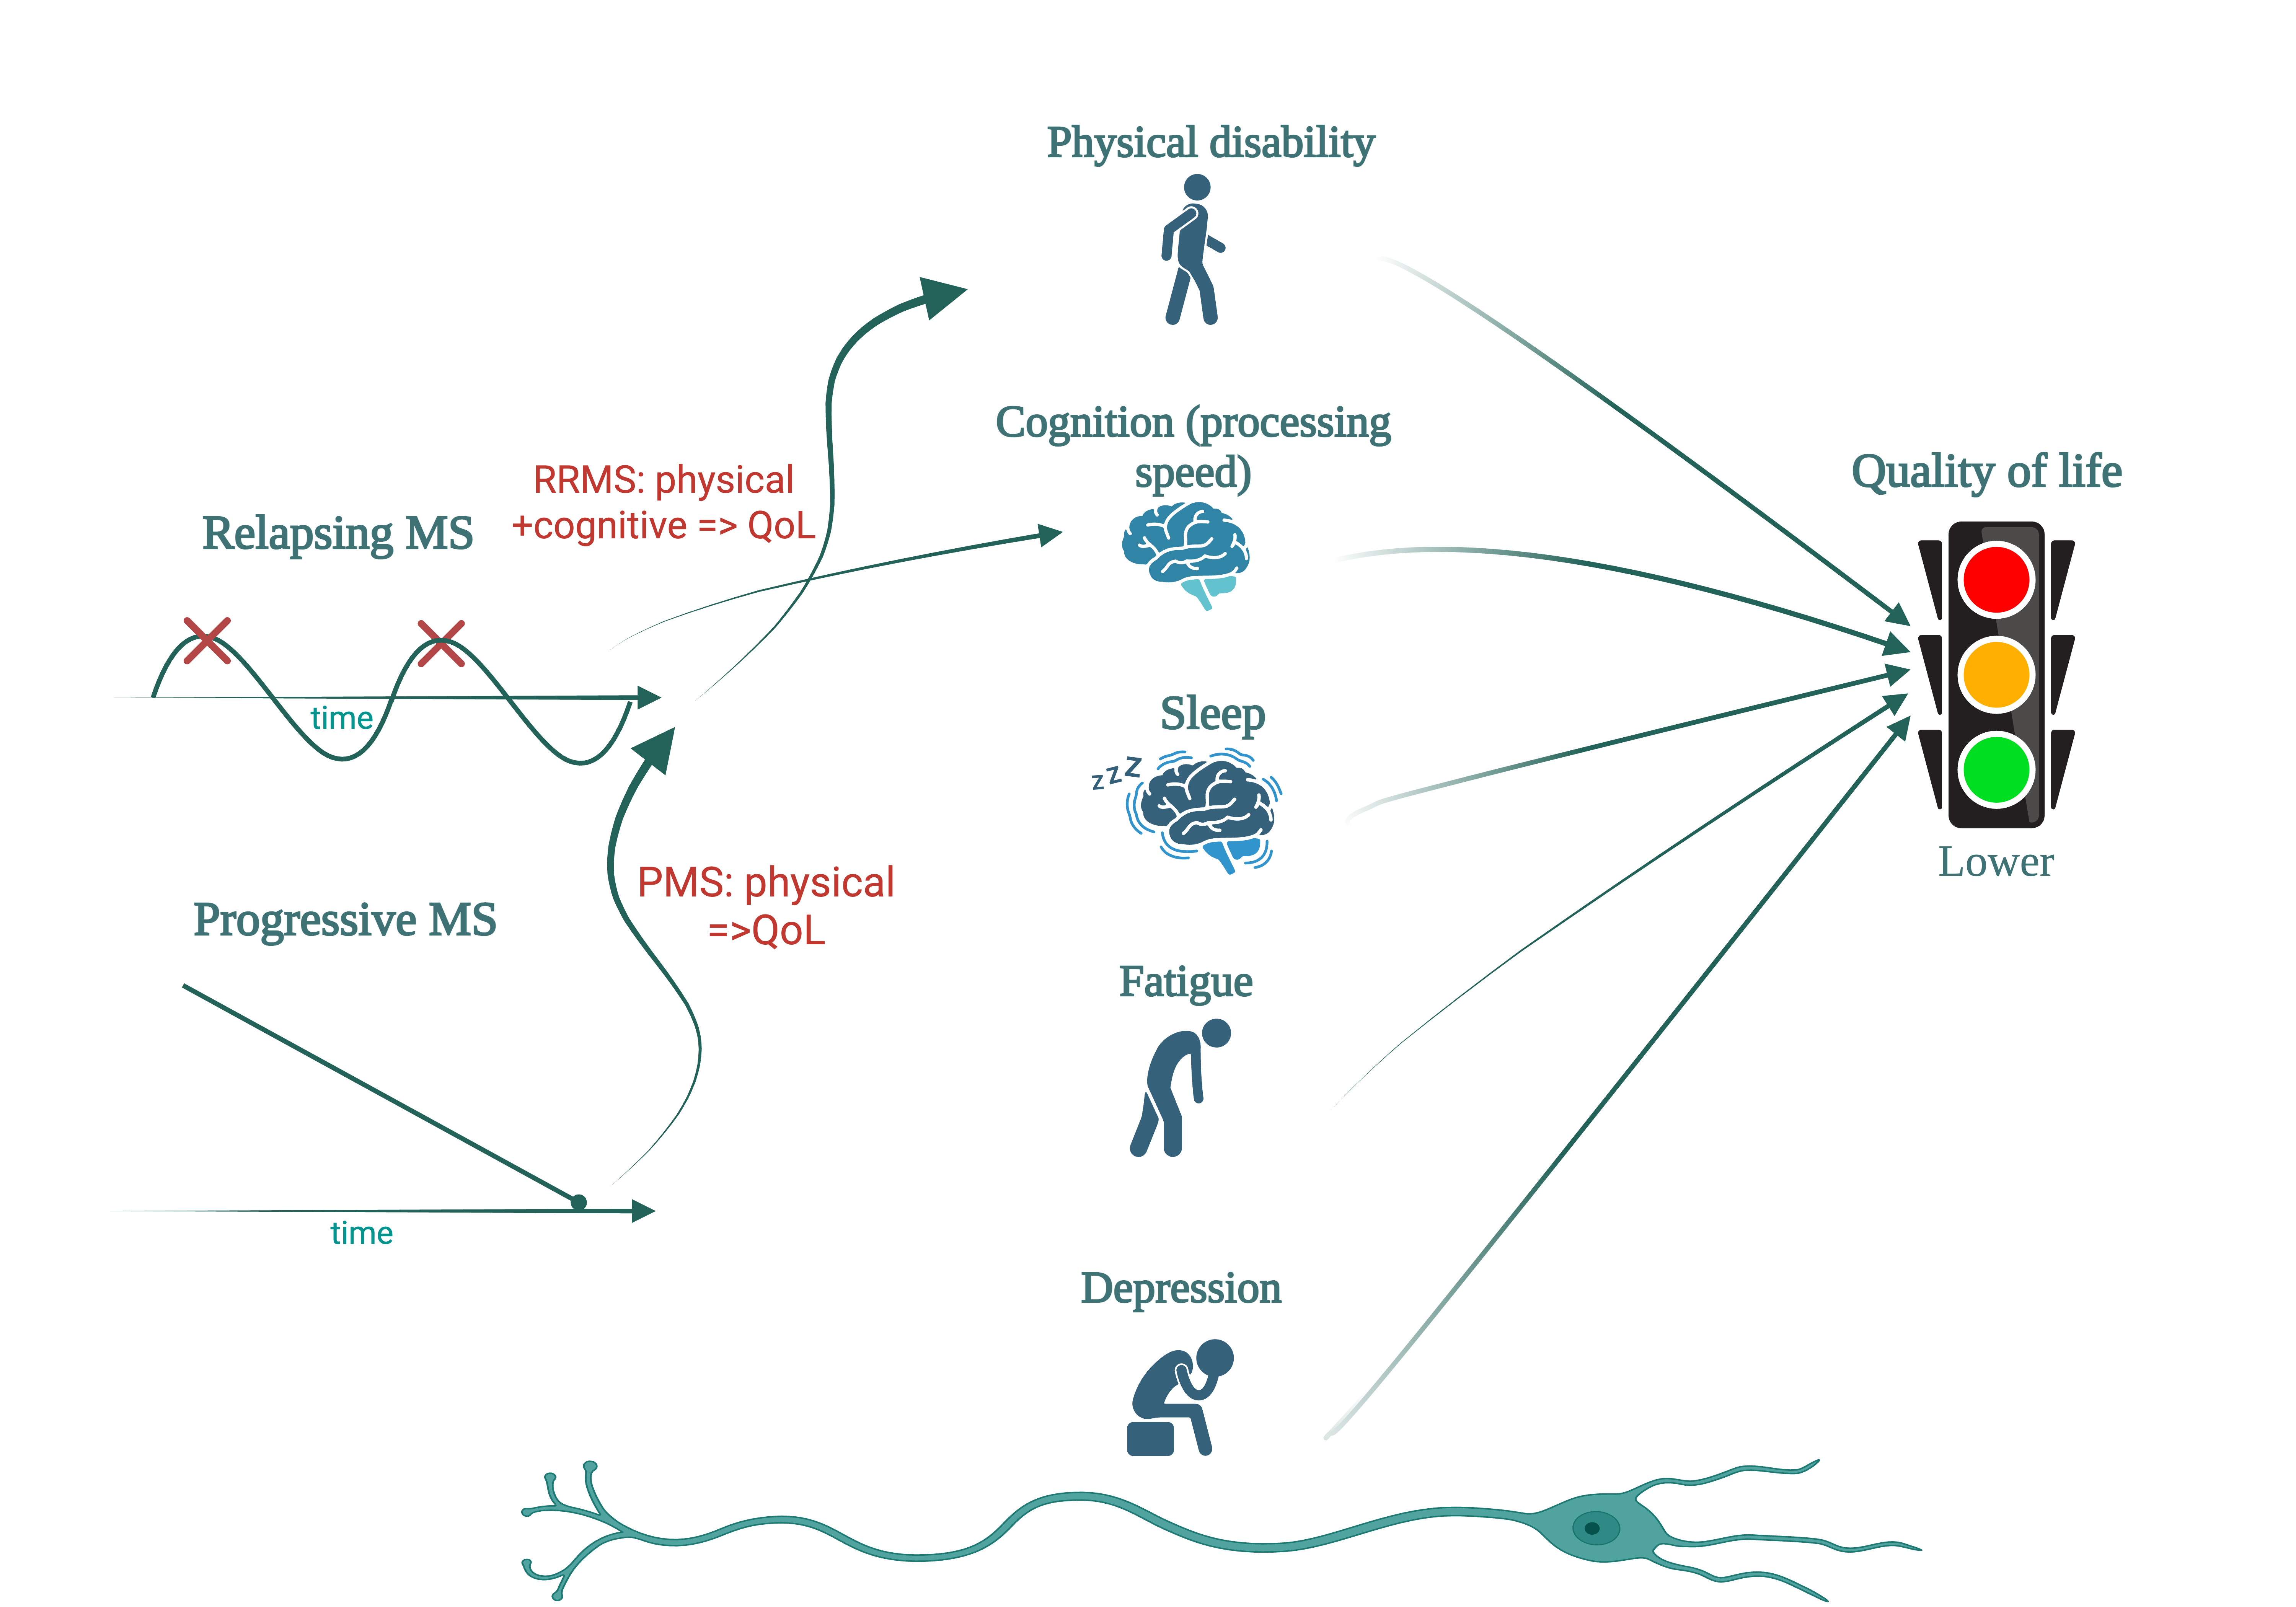
Background: Multiple sclerosis (MS) is a chronic inflammatory disease of the central nervous system, that can lead to physical and cognitive disability, fatigue, depression, and sleep disturbance, all of which may impair quality of life (QoL). While physical disability is well known influencing the QoL, the relative contributions of cognitive impairment, fatigue, and sleep quality remain incompletely defined.
Objectives: To evaluate the relationship between QoL, physical and cognitive disability, sleep quality, fatigue, and depression in people with MS (PwMS), and to explore phe-notype-specific differences between relapsing and progressive forms.
Methods: In this monocentric cross-sectional study, 112 PwMS (77 women, mean age 38.1 years) underwent physical assessment (EDSS, MSFC), cognitive testing (SDMT, PASAT, MoCA, MMSE), and QoL evaluation (MSIS-29, EQ-5D, EQ-VAS, MSNQ). A subgroup of 29 patients also completed the Pittsburgh Sleep Quality Index (PSQI), Epworth Sleepiness Scale (ESS), Modified Fatigue Impact Scale (MFIS), and Beck Depression Inventory (BDI). Correlation, group analyses were performed.
Results: Progressive MS patients showed greater physical disability (mean EDSS 5.8 vs. 2.6, p< 0.001), poorer cognitive performance, and lower QoL. Across the cohort, QoL strongly correlated with physical disability (EDSS) and cognitive performance (SDMT), physical measures showing stronger associations. In relapsing MS, physical and cognitive impairment were linked to reduced QoL, whereas in progressive MS, physical disability predominated. In the sleep subgroup, poorer PSQI scores, longer sleep latency, and greater daytime sleepiness correlated with higher fatigue (MFIS), depressive symptoms (BDI), and reduced QoL (MSIS-29, EQ-5D).
Conclusions: QoL in MS reflects the combined burden of physical disability, cognitive impairment, fatigue, depression, and poor sleep quality, with phenotype-specific patterns. While physical disability is the main QoL determinant in progressive MS, cognitive deficits with slowed processing speed play an important role in relapsing MS. Com-prehensive, multidimensional assessment, including sleep and mood screening, may support individualized management strategies in MS.
Keywords:
multiple sclerosis
; quality of life
; cognitive impairment
; physical disability
; fatigue
; sleep quality
; depression
; patient-reported outcomes
1. Introduction
The concept of quality of life reflects the significance and evaluation of life by an individual. It can result from a personal and holistic assessment of one’s own life, and depends on the harmonious fulfillment of human needs, including health. In medicine, quality of life refers to an individual's physical, psychological, and social well-being, as well as their ability to carry out daily activities [1].
Multiple sclerosis (MS) is a chronic inflammatory disease of the central nervous system and is the most common neurological disease in the young adults, with onset most frequently occurring between the second and forth decades of life [2]. MS leads to both physical and cognitive disability in this population [3], with a significant impact on individual life and society [4]. Axonal loss is an important component of disease progression, a phenomenon underlying disability in this condition. Therefore, evaluating the quality of life of this population is important, as it reflects the extent of the disease’s impact on an individual level [5].
The incidence and prevalence of MS have increased in recent years, even in regions previously considered low risk. This trend is associated with improvements in paraclinical evaluation techniques essential to the diagnostic process [6], as well as improved recognition capabilities and revision of diagnostic criteria [7].
To quantify neurological damage, clinical scales are used to measure the degree of clinical impairment and to asses therapeutic response (especially in clinical studies) [8]. The most widely used clinical scale is the EDSS (Expanded Disability Status Scale), developed by J. Kurtzke in 1983, after the clinical experience with the veterans of World War II, measuring disability across different functional scales [9].
However, the EDSS inadequately capture cognitive impairment, present in over 40% of MS patients, prompting the development of a more multidimensional scale in 1999: the MSFC (Multiple sclerosis Functional Composite) [10].
The MSFC consists of three subscales assessing lower limb function (Timed 25 Foot Walk, T25FW), upper limb function (Nine Hole Peg Test, 9HPT), and cognitive performance regarding atention, working memory and mathematical calculation domains (Passed Auditory Serial Addition Test, PASAT) [11].
Early clinical observations of frequent cognitive dysfunction in MS [12], led to the development of more specific tools to assess various cognitive domains. One such tool is the BICAMS (Brief International Cognitive Assessment for MS), composed of Symbol Digit Modalities Test (SDMT), the California Verbal Learning Test – II (CVLT-II), and the Brief Visuospatial Memory Test – Revised (BVMT-R) [13].
Cognitive impairment in MS often begins with deficits in attention and information processing speed, and can progress to difficulties in working memory, planning, and decision-making [14]. These deficits tend to worsen as the disease progresses, correlating with disease duration, increased physical disability, and reduced cognitive reserve [15,16].
Objective tools like the Montreal Cognitive Assessment (MoCA) [17], have demonstrated utility in identifying cognitive dysfunction in MS across several studies [18]. MoCA is widely validated and used in multiple neurological conditions [19,20].Another frequently used screening tool is the Mini-Mental State Examination (MMSE), which provides a general assessment of cognitive status by evaluating orientation, attention, memory, language, and visuospatial skills. Although MMSE is less sensitive than MoCA in detecting subtle cognitive deficits - particularly in early or mild cases of MS - it remains a commonly used instrument in clinical settings due to its simplicity and familiarity [21].
Subjective changes in cognition, can also be captured by self-report tools like the Multiple Sclerosis Neuropsychological (MSNQ), which evaluates patient-perceived changes in cognitive status over the previous three months [22].
Quality of life in MS is typically assessed using self-reported questionnaires, aiming to capture the multiple deficits associated with the disease. Among the most commonly used are the Multiple Sclerosis Impact Scale (MSIS), and the Modified Fatigue Impact Scale (MFIS). MSIS- 29 evaluates the patient’s perceived impact of MS on daily life over the past two weeks, with a total score between 29 and 145 [23]. MFIS assesses fatigue experienced in the past four weeks, covering physical, cognitive, and psychosocial dimensions, with a total score ranging from 0 to 84 [24].
In addition to MS-specific tools, the EuroQol five-dimension index score (EQ-5D), a general health-related quality of life questionnaire developed by the EuroQol group, is also used. It evaluates five health dimensions with different levels of impairment (3-5 levels): mobility, self-care, usual activities, pain/discomfort, and anxiety/depression[25]. Along with these questions, the patient gives himself a grade from 0 to 100, the limits being lower as the worst state of health and higher as the best state of health – EuroQol VAS (EQ VAS) scale [26,27].
Sleep, as essential component of daily well-being [28], is frequently disrupted in individuals with MS, particularly in association with fatigue, a commonly reported symptom. Recent studies support the presence of impaired sleep patterns in PwMS [29,30].
Sleep quality is defined by the individual’s subjective satisfaction with their sleep experience. It includes parameters such as sleep efficiency, latency, duration, and frequency of awakenings after sleep onset [31]. The Pittsburgh Sleep Quality Index (PSQI), a validated self-report instrument, is widely used to assess these aspects of sleep [32,33]. The daytime consequences of poor sleep are captured using the Epworth Sleepiness Scale (ESS), a self-report questionnaire which measures daytime somnolence. Its score ranges from 0 to 24, with score above 13 indicating moderate, and score above 16 indicating severe daytime sleepiness [34].
Depression is closely related with both sleep disturbance and fatigue in PwMS, each of these symptoms being capable to be influenced and amplified one by another. This triad often creates a complex, that significantly can impact quality of life. Among the available tools, the Beck Depression Inventory (BDI), is one of the most practical and widely self-report instruments for assessing the severity of depressive symptoms in PwMS. It provides a quick, standardized, and sensitive measure of depression, facilitating its recognition and correlation with other symptoms such as fatigue and poor sleep quality [35,36].
Importantly, all these features - physical disability, cognitive dysfunction, fatigue, sleep disturbance, depression, and impaired quality of life - are ultimately linked to the underlying neuropathological hallmark of multiple sclerosis: axonal injury [37]. Axonal damage, resulting from inflammatory demyelination and neurodegenerative processes, represents the key driver of clinical symptoms and long-term neurological disability in MS. Therefore, assessing quality of life and cognitive function in MS not only reflects symptomatic burden but also indirectly captures the extent of axonal injury and disease progression [38,39].
2. Materials and Methods
2.1. Study Objectives
The primary objective of the study was to evaluate the self-reported quality of life in patients with multiple sclerosis (PwMS), specifically in relation to cognitive impairment as assessed by multiple neuropsychological tests. We aimed to determine whether differences in quality of life could be identified between cognitive and physical disability across different clinical phenotypes of the disease.
To this end, we conducted an exhaustive and objective evaluation of a representative cohort of PwMS. Physical disability was quantified using the Expanded Disability Status Scale (EDSS) and the physical subscales of the Multiple Sclerosis Functional Composite (MSFC), while cognitive impairment was assessed using standardized tests such as the Symbol Digit Modalities Test (SDMT), Paced Auditory Serial Addition Test (PASAT), Montreal Cognitive Assessment (MoCA), and Mini-Mental State Examination (MMSE).
A second objective of the study was to assess the impact of MS on sleep quality using the Pittsburgh Sleep Quality Index (PSQI) and daytime sleepiness using the Epworth Sleepiness Scale (ESS). Additionally, we investigated correlations between specific components of sleep disturbance and relevant clinical factors. Fatigue and its subcomponents were assessed using the Modified Fatigue Impact Scale (MFIS), while depressive symptoms were evaluated with the Beck Depression Inventory (BDI).
We conducted a quantitative and qualitative assessment of the sleep in PwMS by analyzing sleep parameters over the last month, including sleep and wake times, total sleep duration, sleep latency, and nighttime disturbances (e.g. pain or nicturia). These variables were evaluated alongside physical and cognitive disability, depression severity, daytime sleepiness, and fatigue level, all measured using validated and dedicated scales.
2.2. Ehical Considerations and Data Collections
All clinical evaluations were part of the patient annual follow-up and all data were collected from patients records of the National Program for Multiple Sclerosis. Neurological assessments and questionnaire completion were performed outside of any clinical relapse and in the absence of corticosteroid treatment, ensuring that results reflected a stable phase of the disease.
2.3. Methods
Study Poplulation
To address the multiple aspects of quality of life in PwMS, a disease with a highly heterogeneous clinical presentation, we analyzed clinical and demographic data from the database of the Multiple Sclerosis Center of Elias University Emergency Hospital, a monocentric cohort. The evaluations were conducted in two phases.
At the initial assessment, patients underwent thorough a clinical evaluation, including measurement of physical disability, using EDSS score. Motor function was evaluated through physical subtests of MSFC, specifically the T25FW for lower limbs functions and the 9HPT for the upper limbs function (dominant and non-dominant hand).
Cognitive assesment included both general and MS specific tool. General cognitive function was screened using the MoCA and the MMSE scores. To specifically capture the cognitive domains frequently affected in MS, we also administered the PASAT and the SDMT scores.
To evaluate quality of life, we used different self-report questionnaires. General health-related quality of life was assessed using the EQ-5D index score and the EQ VAS scale. The disease specific impact on quality of life was measured with the MSIS-29 scale. To identify self-perceived cognitive difficulties, patients completed the MSNQ questionnaire.
Patients were classified according to clinical phenotype into two main categories: relapsing forms including clinically isolated syndrome (CIS) and relapsing-remitting multiple sclerosis (RRMS), and progressive forms including secondary progressive multiple sclerosis (SPMS) and primary progressive multiple sclerosis (PPMS).
In total, 112 patients were included in the study: 77 females and 35 males. Of these, 87 were classified as having relapsing forms and 25 as having progressive forms in MS.
Sleep Sub-Study
The assess sleep quality, a subgroup of 29 of MS patients was selected. These patients completed the PSQI index and ESS scale. Additional asssessments included the MFIS scale and Beck Depression Inventory (BDI), in order to better define the link between sleep quality, fatigue and depression in MS.
2.4. Data Analysis
Data acquisition, centralization, and the statistical analysis were performed with Statistical Package for the Social Sciences (version 26.0, SPSS Inc, Chicago), while the manuscript was drafted using Office Microsoft Word 2020.
The following analytical and descriptive statistical methods were applied: Pearson correlation coefficient - to evaluate direct or inverse proportional relationship between two sets of quantitative variables,, Levene two sample t test – to compare means between two groups, and ANOVA parametric test - to analyze the relationship between dependent variable and multiple categories of independent variables.
3. Results
3.1. Demographic and Clinical Characteristics
The study included 112 patients diagnosed with MS: 77 women (68.7%) with a mean age of 40.1 years and 35 men (31.3%) with a mean age of 33.6 years. The average age across the cohort was 38.1 years. Most patiens (n=87, 77.7%) were diagnosed with relapsing MS forms (CIS or RRMS), while 25 patients (22.3%) had progressive MS forms (SPMS and PPMS).
As shown in Table 1, women were more frequently affected in both relapsing and progressive subgroups. However, men were proportionally more represented in the progressive group (40%) compared to the relapsing group (28.7%).
The mean EDSS score across the cohort was 3.34 (range: 0-7.0), with women showing a slighty higher mean EDSS (3.4) compared om en (3.3). Among clinical subtypes, patients with relapsing forms had a mean EDSS of 2.6, while those with progressive forms had a significantly higher mean EDSS of 5.8.
3.2. Cognitive Performance and Quality of Life Assessements
The results from cognitive assessment (SDMT, PASAT, MoCA, MMSE) and quality of life questionnaires (MSIS-29, MSNQ, EQ-5D index, EQ VAS) for the whole cohort and sub-groups, are summarized in Table 2. Patients with progressive MS had consistently lower scores on all cognitive measures and reported grater impairment in quality of life compared to those with relapsing forms (p<0.001 – Levene t test).
3.3. Correlations Between Physical Disability and Cognitive Function Measures
We made correlations after the clinical evaluation. Significant negative correlations were found between EDSS and cognitive test scores across the entire cohort (p=0.0001) indicating that increased physical disability is associated with poorer cognitive performance. The strongest correlation was observed between EDSS and SDMT (r= -0,587), followed by PASAT (r= -0.466), MMSE (r= -0.400), and MoCA (r= -0.390) (Table 3). Patients showed changes in the information processing speed and impairment of the working memory in particular.
3.4. Correlations Between MSIS-29 and Quality of Life Measures
MSIS-29 scores showed statistically significat positive correlations with MSNQ score (r=0.622, p=0.0001) and EQ-5D index score (r= 0.825, p=0.0001). In contrast, a strong negative correlation was found between MSIS-29 and EQ VAS scale (r= -0.774, p= 0.0001), indicating that a higher self-perceived disease burden is associated with a lower subjective health (Table 4).
3.5. Correlations Between Quality of Life scores, Cognitive Function and Physical Disability Measures
Across the whole cohort, MSIS-29, EQ-5D index score and EQ VAS scores were significatly correlated with both cognitive and physical disability measures (Table 5). Physical disability score (EDSS, T25FW, 9HPT) showed stronger correlations with quality of life measures than cognitive tests. Cognitive performance (particulary SMDT and PASAT) also showed significant correlations with quality of life outcomes, but with slightly lower coefficients. We noted that for the entire cohort, that while both physical and cognitive impairments affect quality of life, physical disability may exert a stronger influence overall (r coefficient values are higher for the physical disability scales). The correlations were negative between the EQ VAS scores and physical disability measures, and positive between the EQ VAS scores and cognitive functions measures.
3.6. Subgroup Analysis: Relapsing vs Progressive Forms – Quality of Life, Physical Disability and Cognitive Function
After dividing the cohort into two sub-groups, regarding the clinical form, relapsing and progressive forms, we performed correlations for every sub-group. In the relapsing MS group (1), there were significant negative correlations between EDSS and cognitive test scores particularly SDMT (r= -0.488, p=0.0001), PASAT (r= -0.361, p=0.001), MMSE (r= -0,294, p=0.006), and with MoCA showed a trend (p=0.053), not reaching a statistical significance (Table 6).
In the progressive MS group (2), although negative correlations were also noted between EDSS and cognitive test scores, they did not reach statistical significance – possible due to the smaller sample size.
We continued the analysis of the quality of life for the two subgroups, making correlations between the quality of life score (MSIS-29, EQ-5D index and EQ VAS), cognitive tests scores (SDMT, PASAT, MoCA, MMSE) and physical disability measures (EDSS, T25FW, 9HPT). Quality of life scores (MSIS-29, EQ-5D, EQ VAS) in the relapsing MS group correlated significantly with both cognitive and physical disability measures. In the progressive MS group, only MSIS-29 and EQ-5D index scores were significantly correlated with EDSS (p = 0.003 and p = 0.02), with no significant correlations observed for cognitive scores (Table 7).
3.7. Subgroup Analysis: Sleep Quality
A subgroup of 29 patients (representing 32.48% of the group, 21F/8 B, mean EDSS=2.4), with relapsing MS forms, completed additional questionnaires to evaluate sleep quality (PSQI), daytime sleepiness (ESS), fatigue (MFIS), as well as depression (BDI).
There were statistically significant correlations between the quality-of-life assessment tests (MSIS-29, EQ5D score and EQ VAS score), and physical disability (EDSS, 9HPT, T25FWT) and cognitive function tests (SMDT, PASAT, MoCA, MMSE), as well as with those that assess fatigue, depression, daytime sleepiness, and sleep quality (MFIS, BDI, ESS and PSQI).
MSIS-29 scores in this subgroup correlated significantly with EQ-5D index and EQ VAS scores (p < 0.00001), MFIS total score (p = 0.0002), physical (p = 0.001), and cognitive subscales (p = 0.0003), BDI (p < 0.001), ESS (p < 0.001), sleep latency (p = 0.0009), PSQI total score (p = 0.005).
These results show the ability of the MSIS-29 to highlight multiple aspects of the quality-of-life in PwMS.
EQ VAS scores showed negative correlations with fatigue MFIS scores, physical MFIS (p = 0.002, r = -0.556), cognitive MFIS (p < 0.001, r = -0.690), indicating the importance of declared fatigue, both physical and cognitive, in the quality of life perceived by patients. (Table 8)
Depressive symptoms were associated with, longer sleep latency (p = 0.002), earlier bedtimes (p < 0.0001), increased daytime sleepiness (p = 0.003), and increased fatigue (p < 0.0001).
Daytime sleepiness (ESS) correlated positively with PSQI (p = 0.0001, r = 0.55), MFIS total (p = 0.0001, r = 0.65), and MFIS physical and cognitive subscales (p < 0.0001, r = 0.70 and p = 0.009, r = 0.58, respectively). The declared fatigue, both physical and cognitive, correlates positively, statistically significant with the quality of sleep, PSQI score (p<0.0001).
Sleep latency also correlated with the PSQI score (p = 0.0006), highlighting its impact on perceived sleep quality.
3.8. ANOVA Analysis of Sleep Disturbance
Further ANOVA analysis was performed on responses from the PSQI related to sleep initiation and maintenance (no event, under 1 event, 1-2 events, 3 or more events per week during the last month). Patients who had difficulty falling asleep ≥3 times per week reported significantly higher scores on MSIS-29 (p=0.0005), BDI (p=0.0006), ESS (p=0.003), and MFIS (physical -p=0.003 and cognitive -p=0.0002 components) (Table 8a). Thus, patients with sleep disturbances and prolonged sleep latency report greater depression, fatigue, and reduced quality of life in the context of multiple sclerosis.
Nocturnal awakenings also correlated with increased depression (BDI, p = 0.0007) and fatigue (MFIS total, p = 0.0001) (Table 8b). In most cases, these awakenings were attributed to nighttime disturbances such as pain or nocturia. Sleep maintenance disorders, characterized by nocturnal awakenings, are associated with increased depression and fatigue in PwMS.
Table 9 PSQI: sleep latency/awakenings during night - ANOVA statistical analysis with quality of life, depression and fatigue measurements

Table 9.
a—Prolonged sleep latency - first 30 min.
| Group | Nr | MSIS 29 | BDI | ESS | MFIS p | MFIS c |
| NO | 13 | 39.9 | 5.3 | 5.3 | 16.6 | 12.6 |
| <1/Week | 11 | 47.5 | 4.8 | 5.2 | 9.8 | 7.6 |
| 1,2/Week | 1 | 106 | 20 | 12 | 39 | 29 |
| >=3/Week | 4 | 77 | 22 | 13.25 | 36.5 | 30.75 |
| p | 0.000572 | 0.000604 | 0.003256 | 0.000364 | 0.000212 |
Abbreviations: MSIS 29 - Multiple Sclerosis Impact Scale 29, MFIS – Modified Fatigue Impact Scale, p physical, c – cognitive, BDI – Beck Depression Inventory, ESS – Epworth Sleepiness Scale, PSQI – Pittsburg Sleep Quality Index.
Table 9.
b—Awakenings during night.
| Group | Nr | BD | MFIS t |
|
NO |
4 |
2.5 |
14 |
|
<1/Week |
12 | 2.3 | 16.4 |
|
1,2/Week |
4 | 16.26 | 47 |
|
>=3/Week |
9 | 14.1 | 51.3 |
| p | 0.000734 | 0.000146 |
Abbreviations: MFIS – Modified Fatigue Impact Scale, t – total, BDI – Beck Depression Inventory.
4. Discussion
The demographic and clinical characteristics of our study group are consistent with known epidemiological patterns in MS [40]. Women represented the majority of cases, with a female-to-male ratio of 2.2:1 and a mean age of 38.1 years. This aligns with global data showing a higher incidence in women, especially in relapsing forms of the disease [41]. Notably, a higher proportion of men was observed in the progressive MS subgroup (40%) compared to the relapsing group (28.7%), reinforcing prior observations that male sex may be associated with a more aggressive disease course and worse prognosis [42]. The mean EDSS score of 3.3, reflects a population with moderate physical disability. Subgroup analysis revealed a significantly higher disability burden in patients with progressive MS (mean EDSS = 5.8) compared to those with relapsing MS forms (mean EDSS = 2.6), consistent with expected disease trajectories and previously published data [43,44,45,46].
Our findings demonstrate that quality of life (QoL) in MS patients is influenced by both physical and cognitive disability, regardless of the self-report tools used - whether general measurements like EQ-5D (including the VAS score) or disease-specific tools such as MSIS-29 and MSNQ [47,48]. This is consistent with prior studies, yet our analysis distinguishes itself through the comprehensive and objective evaluation of both physical (EDSS, MSFC) and cognitive (SDMT, PASAT, MoCA, MMSE) function, and their correlation with patient perceived QoL. In contrast to other studies focusing on one dimension, our approach offers a multifaceted perspective, incorporating both clinician and patient-reported outcomes [49,50,51].
Importantly, we observed that in relapsing MS forms, QoL is significantly impacted by both physical and cognitive deficits [52], particularly by early cognitive changes such as reduced information processing speed and impaired working memory [53]. In progressive forms, however, physical disability remains the dominant determinant of QoL [54]. These findings support the clinical relevance of distinguishing between MS phenotypes in patient management and rehabilitation strategies [55].
The impact of non-motor symptoms, such as sleep disturbances, fatigue, and depression, in QoL is well recognized [56]. In our study, sleep quality (assessed by using the PSQI and ESS in a subgroup) was found to be impaired, consistent with recent evidence [57]. Although the analysis was limited by the small sample size, we identified a multifactorial origin of poor sleep quality, involving pain, nocturia, fatigue, and mood disturbances. As shown in prior research, lesion location and axonal damage in sleep-regulating brain regions (e.g., hypothalamus, brainstem) likely contribute to this clinical picture [58,59].
The MSIS-29 proved especially valuable, as it incorporates dimensions often omitted by traditional disability scales, such as fatigue, sleep impairment, and depressive symptoms [60]. This supports its utility as a comprehensive QoL measure in clinical and research settings [61].
In line with previous literature, depressive symptoms were more prevalent in patients reporting daytime sleepiness and higher levels of physical and cognitive fatigue [62]. Depression not only affects QoL directly but also serves as a significant mediator of poor sleep quality, leading to sleep fragmentation and prolonged sleep latency [51,63]. Our findings emphasize the need for routine assessment and management of mood and sleep disorders in MS care.
The study’s strengths include its broad, multidimensional design, integrating objective clinical tests (EDSS, MSFC, cognitive batteries) with validated self-report questionnaires (EQ-5D, MSIS-29, MFIS, PSQI, MSNQ) [64]. This allowed for phenotype-specific analysis, distinguishing the relative contributions of cognitive and physical disability to QoL in relapsing vs. progressive MS forms. Furthermore, the use of multiple cognitive instruments (including MoCA and MMSE) strengthens the reliability of the cognitive assessment. However, several limitations must be acknowledged. First, data on sleep, fatigue, and depression were not available for all patients, limiting the power of subgroup analyses. Second, the sleep-focused analysis was conducted on a small subset of 29 patients, which reduces the statistical power for analyzing sleep-related correlations and may limit the interpretation of those results. Third, the cross-sectional nature of the study without longitudinal follow-up may limit the ability to assess causal relationships or long-term progression of symptoms. Fourth, the single-center design may limit the possibility to generalize to broader or more diverse populations with different care settings, ethnic backgrounds, or health systems.
Additionally, the absence of neuroimaging data is a limitation, as it prevents direct correlation between lesion burden, axonal injury, and clinical symptoms.
Nonetheless, the observed associations between cognitive and physical disability and reduced QoL due to the presence of fatigue or sleep disturbance, are likely mediated by both inflammatory and neurodegenerative mechanisms, particularly axonal injury, which plays a central role in the progression of MS-related disability. Axonal damage underlies both physical disability and cognitive decline, reinforcing the need for neuroprotective strategies in MS management [61].
5. Conclusions
This study highlights the complex and interdependent relationships between physical disability, cognitive impairment, depression, fatigue, and sleep quality in multiple sclerosis. Quality of life in MS is not determined by a single factor but rather reflects the cumulative burden of multiple domains of dysfunction. While physical disability remains the primary determinant in progressive MS, cognitive deficits, particularly reduced information processing speed, play a more significant role in relapsing forms.
A contributor to these symptoms is axonal damage, which occurs early in the disease and underlies both motor and cognitive decline. Axonal degeneration, driven by inflammation and demyelination, is a key pathological hallmark of MS and correlates with irreversible neurological disability. It represents the biological basis through which physical and cognitive impairment contribute to poorer quality of life.
Given the multifactorial burden of MS, we recommend the routine use of comprehensive assessment tools such as the MSIS-29 and EQ-5D, supplemented by cognitive screening, sleep, and fatigue evaluation. Recognizing and addressing these interrelated factors can guide more personalized, multidisciplinary care strategies aimed to improve the lives of PwMS.
Author Contributions
Conceptualization, S.P. and M.M.D.M.; methodology, S.P., M.M.D.M., C.A.P.; software, M.M.D.M.; validation, S.P. and C.A.P.; formal analysis, S.P. and M.M.D.M.; investigation, S.P. , M.M.D.M., and C.A.P.; resources, S.P., M.M.D.M., and C.A.P.; data curation, S.P. and M.M.D.M. writing—original draft preparation, S.P. and M.M.D.M; writing—review and editing, M.M.D.M.; visualization, M.M.D.M.; supervision, S.P., C.A.P; project administration, S.P. We, the authors, are the only persons responsible for the content of the article. All authors have read and agreed to the published version of the manuscript.
Funding
The publication of this research was funded by Foundation of the Romanian Society of Neurology.
Institutional Review Board Statement
Ethical review and approval were waived in accordance with national regulations, as this study involved retrospective analysis of routinely collected clinical data. All clinical evaluations were part of patients’ routine annual follow-up, and data were obtained from the National Program for Multiple Sclerosis. The study was conducted in accordance with the principles of the Declaration of Helsinki.
Informed Consent Statement
Patient consent was waived because only anonymized data were analyzed and no interventions beyond standard clinical care were performed.
Data Availability Statement
The data used to support the findings of this study are included within the article.
Acknowledgments
The authors have reviewed and edited the output and take full responsibility for the content of this publication.
Conflicts of Interest
The authors declare no conflicts of interest.
References
- Daundasekara, S.S.; Arlinghaus, K.R.; Johnston, C.A. Quality of Life: The Primary Goal of Lifestyle Intervention. Am J Lifestyle Med 2020, 14, 267. [Google Scholar] [CrossRef]
- Compston, A.; Coles, A. Multiple sclerosis. The Lancet 2008, 372, 1502–1517. [Google Scholar] [CrossRef]
- Gil-González I, Martín-Rodríguez A, Conrad R, Pérez-San-Gregorio MÁ. Quality of life in adults with multiple sclerosis: a systematic review. BMJ Open 2020, 10, e041249. [Google Scholar] [CrossRef]
- Hermann, B.P.; Vickrey, B.; Hays, R.D.; et al. A comparison of health-related quality of life in patients with epilepsy, diabetes and multiple sclerosis. Epilepsy Res 1996, 25, 113–118. [Google Scholar] [CrossRef]
- Yalachkov, Y.; Soydaş, D.; Bergmann, J.; et al. Determinants of quality of life in relapsing-remitting and progressive multiple sclerosis. Mult Scler Relat Disord 2019, 30, 33–37. [Google Scholar] [CrossRef]
- Siger, M. Magnetic Resonance Imaging in Primary Progressive Multiple Sclerosis Patients: Review. Clin Neuroradiol 2022, 32, 625. [Google Scholar] [CrossRef] [PubMed]
- Thompson, A.J.; Banwell, B.L.; Barkhof, F.; et al. Diagnosis of multiple sclerosis: 2017 revisions of the McDonald criteria. Lancet Neurol 2018, 17, 162–173. [Google Scholar] [CrossRef] [PubMed]
- Baumstarck, K.; Boyer, L.; Boucekine, M.; Michel, P.; Pelletier, J.; Auquier, P. Measuring the Quality of Life in Patients with Multiple Sclerosis in Clinical Practice: A Necessary Challenge. Mult Scler Int 2013, 2013, 524894. [Google Scholar] [CrossRef] [PubMed]
- Kurtzke, J.F. Rating neurologic impairment in multiple sclerosis: An expanded disability status scale (EDSS). Neurology 1983, 33, 1444–1452. [Google Scholar] [CrossRef]
- Fischer, J.S.; Rudick, R.A.; Cutter, G.R.; Reingold, S.C. The multiple sclerosis functional composite measure (MSFC): An integrated approach to MS clinical outcome assessment. Multiple Sclerosis 1999, 5, 244–250. [Google Scholar] [CrossRef]
- Meyer-Moock, S.; Feng, Y.S.; Maeurer, M.; Dippel, F.W.; Kohlmann, T. Systematic literature review and validity evaluation of the Expanded Disability Status Scale (EDSS) and the Multiple Sclerosis Functional Composite (MSFC) in patients with multiple sclerosis. BMC Neurol 2014, 14. [Google Scholar] [CrossRef]
- De Meo, E.; Portaccio, E.; Giorgio, A.; et al. Identifying the Distinct Cognitive Phenotypes in Multiple Sclerosis. JAMA Neurol 2021, 78, 1. [Google Scholar] [CrossRef]
- Corfield, F.; Langdon, D. A Systematic Review and Meta-Analysis of the Brief Cognitive Assessment for Multiple Sclerosis (BICAMS). Neurol Ther 2018, 7, 287–306. [Google Scholar] [CrossRef]
- Leavitt, V.M.; Tosto, G.; Riley, C.S. Cognitive phenotypes in multiple sclerosis. J Neurol 2018, 265, 562–566. [Google Scholar] [CrossRef] [PubMed]
- Benedict, R.H.B.; Amato, M.P.; DeLuca, J.; Geurts, J.J.G. Cognitive impairment in multiple sclerosis: clinical management, MRI, and therapeutic avenues. Lancet Neurol 2020, 19, 860–871. [Google Scholar] [CrossRef]
- Potticary, H.; Langdon, D. A Systematic Review and Meta-Analysis of the Brief Cognitive Assessment for Multiple Sclerosis (BICAMS) International Validations. J Clin Med 2023, 12. [Google Scholar] [CrossRef] [PubMed]
- Dagenais, E.; Rouleau, I.; Demers, M.; et al. Value of the MoCA test as a screening instrument in multiple sclerosis. Can J Neurol Sci 2013, 40, 410–415. [Google Scholar] [CrossRef] [PubMed]
- Borkowska, A.R.; Daniluk, B.; Adamczyk, K. Significance of the diagnosis of executive functions in patients with relapsing-remitting multiple sclerosis. Int J Environ Res Public Health 2021, 18. [Google Scholar] [CrossRef]
- Gomez-Moreno, S.M.; Cuadrado, M.L.; Cruz-Orduña, I.; et al. Validation of the Spanish-language version of the Montreal Cognitive Assessment as a screening test for cognitive impairment in multiple sclerosis. Neurología (English Edition) 2022, 37, 726–734. [Google Scholar] [CrossRef]
- Hoops, S.; Nazem, S.; Siderowf, A.D.; et al. Validity of the MoCA and MMSE in the detection of MCI and dementia in Parkinson disease. Neurology 2009, 73, 1738. [Google Scholar] [CrossRef]
- Truong, Q.C.; Cervin, M.; Choo, CC.; et al. Examining the validity of the Mini-Mental State Examination (MMSE) and its domains using network analysis. Psychogeriatrics 2024, 24, 259–271. [Google Scholar] [CrossRef]
- Van Laethem, D.; De Cock, A.; Van Schependom, J.; Benedict, R.H.B.; Nagels, G.; D’hooghe, M. Correlates of patient-reported cognitive performance with regard to disability. Sci Rep 2022, 12. [Google Scholar] [CrossRef]
- Hobart, J.; Lamping, D.; Fitzpatrick, R.; Riazi, A.; Thompson, A. The multiple sclerosis impact scale (MSIS-29) a new patient-based outcome measure. Brain 2001, 124, 962–973. [Google Scholar] [CrossRef] [PubMed]
- Tur, C. Fatigue Management in Multiple Sclerosis. Curr Treat Options Neurol 2016, 18. [Google Scholar] [CrossRef]
- Eriksson, J.; Kobelt, G.; Gannedahl, M.; Berg, J. Association between Disability, Cognition, Fatigue, EQ-5D-3L Domains, and Utilities Estimated with Different Western European Value Sets in Patients with Multiple Sclerosis. Value in Health 2019, 22, 231–238. [Google Scholar] [CrossRef] [PubMed]
- Jones, K.H.; Ford, D.V.; Jones, P.A.; et al. How People with Multiple Sclerosis Rate Their Quality of Life: An EQ-5D Survey via the UK MS Register. PLoS One 2013, 8. [Google Scholar] [CrossRef]
- Hawton, A.; Green, C.; Telford, C.; Zajicek, J.; Wright, D. Using the multiple sclerosis impact scale to estimate health state utility values: Mapping from the MSIS-29, version 2, to the EQ-5D and the SF-6D. Value in Health 2012, 15, 1084–1091. [Google Scholar] [CrossRef]
- Matsui, K.; Yoshiike, T.; Nagao, K.; et al. Association of subjective quality and quantity of sleep with quality of life among a general population. Int J Environ Res Public Health 2021, 18. [Google Scholar] [CrossRef]
- Jerković, A.; Mikac, U.; Matijaca, M.; et al. Psychometric Properties of the Pittsburgh Sleep Quality Index (PSQI) in Patients with Multiple Sclerosis: Factor Structure, Reliability, Correlates, and Discrimination. J Clin Med 2022, 11. [Google Scholar] [CrossRef]
- Kołtuniuk, A.; Kazimierska-Zajacą, M.; Pogłódek, D.; Chojdak-łukasiewicz, J. Sleep Disturbances, Degree of Disability and the Quality of Life in Multiple Sclerosis Patients. Int J Environ Res Public Health 2022, 19. [Google Scholar] [CrossRef]
- Billings, M.E.; Hale, L.; Johnson, D.A. Physical and Social Environment Relationship With Sleep Health and Disorders. Chest 2020, 157, 1304–1312. [Google Scholar] [CrossRef]
- Yi, H.; Shin, K.; Shin, C. Development of the Sleep Quality Scale. J Sleep Res 2006, 15, 309–316. [Google Scholar] [CrossRef]
- Buysse, D.J.; Reynolds, C.F.; Monk, T.H.; Berman, S.R.; Kupfer, D.J. The Pittsburgh sleep quality index: A new instrument for psychiatric practice and research [Índice de calidad del sueño de Pittsburgh: un nuevo instrumento para la práctica y la investigación psiquiátrica]. Psychiatry Res 1989, 28, 193–213. [Google Scholar] [CrossRef]
- Rosenberg, R.; Babson, K.; Menno, D.; et al. Test–retest reliability of the Epworth Sleepiness Scale in clinical trial settings. J Sleep Res 2022, 31. [Google Scholar] [CrossRef]
- Solaro, C.; Trabucco, E.; Signori, A.; et al. Depressive Symptoms Correlate with Disability and Disease Course in Multiple Sclerosis Patients: An Italian Multi-Center Study Using the Beck Depression Inventory. PLoS One 2016, 11, e0160261. [Google Scholar] [CrossRef]
- Degraeve, B.; Lenne, B.; Norberciak, L.; Massot, C.; Donze, C. A comparative analysis of depression screening tools in multiple sclerosis: Implications for diagnosis and prevalence. Mult Scler Relat Disord 2025, 93, 106220. [Google Scholar] [CrossRef]
- Mey, G.M.; Mahajan, K.R.; DeSilva, T.M. Neurodegeneration in multiple sclerosis. WIREs Mechanisms of Disease 2023, 15, e1583. [Google Scholar] [CrossRef]
- Stavrogianni, K.; Giannopapas, V.; Kitsos, D.K.; et al. Cognitive Impairment in Newly Diagnosed Patients with Multiple Sclerosis: A Systematic Review of Related Molecular Biomarkers and a Meta-Analysis of Associated Demographic and Disease-Related Characteristics. J Clin Med 2025, 14, 2630. [Google Scholar] [CrossRef] [PubMed]
- Medana, I.M.; Esiri, M.M. Axonal damage: a key predictor of outcome in human CNS diseases. Brain 2003, 126, 515–530. [Google Scholar] [CrossRef] [PubMed]
- Khan, G.; Hashim, M.J. Epidemiology of Multiple Sclerosis: Global, Regional, National and Sub-National-Level Estimates and Future Projections. J Epidemiol Glob Health 2025, 15, 1–11. [Google Scholar] [CrossRef]
- Luetic, G.G.; Menichini, M.L.; Vrech, C.; et al. Clinical and demographic characteristics of male MS patients included in the national registry-RelevarEM. Does sex or phenotype make the difference in the association with poor prognosis? Mult Scler Relat Disord 2022, 58, 103401. [Google Scholar]
- Correale, J.; Rush, C.A.; Barboza, A. Are highly active and aggressive multiple sclerosis the same entity? Front Neurol 2023, 14, 1132170. [Google Scholar] [CrossRef]
- Purmonen, T.; Hakkarainen, T.; Tervomaa, M.; Ruutiainen, J. Impact of multiple sclerosis phenotypes on burden of disease in Finland. J Med Econ 2020, 23, 156–165. [Google Scholar] [CrossRef]
- Lublin, F.D.; Häring, D.A.; Ganjgahi, H.; et al. How patients with multiple sclerosis acquire disability. Brain 2022, 145, 3147–3161. [Google Scholar] [CrossRef]
- Inojosa, H.; Schriefer, D.; Ziemssen, T. Clinical outcome measures in multiple sclerosis: A review. Autoimmun Rev 2020, 19. [Google Scholar] [CrossRef]
- Uitdehaag, B.M.J. Clinical outcome measures in multiple sclerosis. Handb Clin Neurol 2014, 122, 393–404. [Google Scholar]
- Højsgaard Chow, H.; Schreiber, K.; Magyari, M.; et al. Progressive multiple sclerosis, cognitive function, and quality of life. Brain Behav 2018, 8. [Google Scholar] [CrossRef]
- Sehanovic, A.; Kunic, S.; Ibrahimagic, O.C.; et al. Contributing Factors to the Quality of Life in Multiple Sclerosis. Med Arch 2020, 74, 368–373. [Google Scholar] [CrossRef] [PubMed]
- Ernstsson, O.; Tinghög, P.; Alexanderson, K.; Hillert, J.; Burström, K. The External Validity of Mapping MSIS-29 on EQ-5D Among Individuals With Multiple Sclerosis in Sweden. MDM Policy Pract 2017, 2. [Google Scholar] [CrossRef] [PubMed]
- Nociti, V.; Losavio, F.A.; Gnoni, V.; et al. Sleep and fatigue in multiple sclerosis: A questionnaire-based, cross-sectional, cohort study. J Neurol Sci 2017, 372, 387–392. [Google Scholar] [CrossRef]
- Tarasiuk, J.; Kapica-Topczewska, K.; Czarnowska, A.; Chorąży, M.; Kochanowicz, J.; Kułakowska, A. Co-occurrence of Fatigue and Depression in People With Multiple Sclerosis: A Mini-Review. Front Neurol 2022, 12. [Google Scholar] [CrossRef] [PubMed]
- Gois LCde, P.; Pimentel-Silva, L.R.; Damasceno, B.P.; Damasceno, A. Associations between cognitive and clinical disability across MS subtypes: The role of the underlying brain damage. Mult Scler Relat Disord 2021, 48, 102701. [Google Scholar] [CrossRef]
- Migliore, S.; Ghazaryan, A.; Simonelli, I.; et al. Cognitive Impairment in Relapsing-Remitting Multiple Sclerosis Patients with Very Mild Clinical Disability. Behavioural Neurology 2017, 2017, 7404289. [Google Scholar] [CrossRef]
- Højsgaard Chow, H.; Schreiber, K.; Magyari, M.; et al. Progressive multiple sclerosis, cognitive function, and quality of life. Brain Behav 2018, 8, e00875. [Google Scholar] [CrossRef]
- Portaccio, E.; Magyari, M.; Havrdova, EK.; et al. Multiple sclerosis: emerging epidemiological trends and redefining the clinical course. The Lancet Regional Health - Europe 2024, 44, 100977. [Google Scholar] [CrossRef]
- Yeni, K.; Tulek, Z.; Ozer, A.; Terzi, M. The effect of fatigue, sleep quality and depression on quality of life in patients with multiple sclerosis: A serial mediation model. Mult Scler Relat Disord 2025, 93, 106211. [Google Scholar] [CrossRef]
- Moradi, A.; Ebrahimian, A.; Sadigh-Eteghad, S.; Talebi, M.; Naseri, A. Sleep quality in multiple sclerosis: A systematic review and meta-analysis based on Pittsburgh Sleep Quality Index. Mult Scler Relat Disord 2025, 93. [Google Scholar] [CrossRef] [PubMed]
- Foschi, M.; Rizzo, G.; Liguori, R.; et al. Sleep-related disorders and their relationship with MRI findings in multiple sclerosis. Sleep Med 2019, 56, 90–97. [Google Scholar] [CrossRef]
- Braley, T.J.; Boudreau, E.A. Sleep disorders in multiple sclerosis. Curr Neurol Neurosci Rep 2016, 16. [Google Scholar]
- Strijbis, E.M.M.; Repovic, P.; Mostert, J.; et al. The MSIS-29 and SF-36 as outcomes in secondary progressive MS trials. Multiple Sclerosis Journal 2022, 28, 1606–1619. [Google Scholar] [CrossRef] [PubMed]
- Miller, D.H. Biomarkers and Surrogate Outcomes in Neurodegenerative Disease: Lessons from Multiple Sclerosis. NeuroRx 2004, 1, 284. [Google Scholar] [CrossRef] [PubMed]
- Patten, S.B.; Marrie, R.A.; Carta, M.G. Depression in multiple sclerosis. International Review of Psychiatry 2017, 29, 463–472. [Google Scholar] [CrossRef] [PubMed]
- Sparasci, D.; Gobbi, C.; Castelnovo, A.; et al. Fatigue, sleepiness and depression in multiple sclerosis: defining the overlaps for a better phenotyping. J Neurol 2022, 269, 4961–4971. [Google Scholar] [CrossRef] [PubMed]
- Pardo, G.; Coates, S.; Okuda, D.T. Outcome measures assisting treatment optimization in multiple sclerosis. J Neurol 2021, 269, 1282. [Google Scholar] [CrossRef]
Table 1.
Demographic and clinical data.
| N | F (N, p%) | M (N, p%) | EDSS (mean, min-max) | |
| Total | 112 | 77 (68.7%) |
35 (31.3%) |
3.339 (0-7.0) |
|
Average date (mim-max) |
38.11 (16-60) |
40.16 (18-60) |
33.60 (16-55) |
|
| Relapsing forms group | 87 (77.7%) |
62 (71.3%) |
25 (28.7%) |
2.609 (0-6.0) |
| Progressive forms group | 25 (22.3%) |
15 (60%) |
10 (40%) |
5.880 (3.0-7.0) |
Abbreviations: N – number, p% - percent, EDSS –Expanded Disability Status Scale.
Table 2.
The results obtained from the cognitive evaluations and the reporting scales of the quality of life (Levene test p<00.1).
Table 2.
The results obtained from the cognitive evaluations and the reporting scales of the quality of life (Levene test p<00.1).
|
Group 1 Relapsing forms |
Group 2 Progressive forms |
p value (95% confidence interval) | ||
| Total N | 112 | 87 | 25 | |
|
SDMT (mean) PASAT (mean) MoCA (mean) MMSE (mean) |
38.25 (2-65) 43.32 (8-60) 23.62 (5-30) 27.96 (16-30) |
41.61 46.05 24.67 28.44 |
25.52 33.84 19.96 26.28 |
<0.001 <0.001 <0.001 0.004 |
|
MSIS 29 (mean) MSNQ (mean) EQ-5D index (mean) EQ VAS (mean) |
59.67 15.89 2.32 71.04 |
51.91 13.92 1.69 76.21 |
86.24 22.68 4.48 53.24 |
<0.001 0.009 <0.001 <0.001 |
Abbreviations: SDMT - Symbol Digit Modalities Test, PASAT - Passed Auditory Serial Addition Test, MoCA – Montreal Cognitive Assessment, MMSE – Mini Mental State Examination, MSIS 29 - Multiple Sclerosis Impact Scale 29, MSNQ- Multiple Sclerosis Neuropsychological, EQ-5D- EuroQol five-dimension index score, EQ-VAS- EuroQol Visual Analogue Scale.
Table 3.
EDSS correlation with cognitive tests (Pearson correlation p<0.001).
| SDMT |
PASAT (60) |
MoCA (30) |
MMSE (30) |
||
|
EDSS |
p | 0.0001 | 0.0001 | 0.0001 | 0.0001 |
| r | -0,587 | -0.466 | -0.390 | -0.400 |
Abbreviations: SDMT - Symbol Digit Modalities Test, PASAT -Passed Auditory Serial Addition Test, MoCA – Montreal Cognitive Assessment, MMSE – Mini Mental State Examination.
Table 4.
Correlation between MSIS and self-report scales (Pearson correlation p<0.001).
| MSNQ (60) | EQ-5D index (score) | EQ (VAS score) | ||
|
MSIS – 29 (145) |
p | 0.0001 | 0.0001 | 0.0001 |
| r | 0.622 | 0.825 | -0.774 |
Abbreviations: MSIS 29 - Multiple Sclerosis Impact Scale 29, MSNQ- Multiple Sclerosis Neuropsychological, EQ-5D- EuroQol five-dimension index score, EQ-VAS- EuroQol Visual Analogue Scale.
Table 5.
MSIS, EQ5D correlations with cognitive functions and physical disability measures (Pearson correlation p<0.001).
Table 5.
MSIS, EQ5D correlations with cognitive functions and physical disability measures (Pearson correlation p<0.001).
| SDMT | PASAT (60) | MoCA (30) | MMSE (30) | EDSS |
9HPT DH |
9HPT NDH |
T25FW | |||
|
MSIS – 29 (145) |
p | 0.0001 | 0.0001 | 0.001 | 0.0001 | 0.0001 | 0.0001 | 0.0001 | 0.0001 | |
| r | -0.544 | -0.520 | -0.314 | -0.491 | 0.686 | 0.579 | 0.610 | 0.547 | ||
|
EQ-5D index (score) |
p | 0.0001 | 0.0001 | 0.0001 | 0.0001 | 0.0001 | 0.0001 | 0.0001 | 0.0001 | |
| r | -0.574 | -0.524 | -0.375 | -0.511 | 0.683 | 0.593 | 0.589 | 0.526 | ||
|
EQ (VAS score) |
p | 0.0001 | 0.0001 | 0.0001 | 0.0001 | 0.0001 | 0.0001 | 0.0001 | 0.0001 | |
| r | 0.524 | 0.471 | 0.336 | 0.402 | -0.683 | -0.518 | -0.542 | -0.515 |
||
Abbreviations: SDMT - Symbol Digit Modalities Test, PASAT - Passed Auditory Serial Addition Test, MoCA – Montreal Cognitive Assessment, MMSE – Mini Mental State Examination, MSIS 29 - Multiple Sclerosis Impact Scale 29, EQ-5D- EuroQol five-dimension index score, EQ-VAS- EuroQol Visual Analogue Scale, EDSS – Expanded Disability Status Scale, 9HPT – 9 Hole Peg Test, DH - Dominant Hand, NDH- Non-Dominant Hand, T25FW -25 Foot Walk Test.
Table 6.
Correlations between EDSS and cognitive functions tests (Pearson correlation).
| SDMT |
PASAT (60) |
MMSE (30) |
MoCA (30) |
|||
|
1 |
EDSS |
p | 0.0001 | 0.001 | 0.006 | 0.053 |
| r | -0.488 | -0.361 | -0.294 | -0.208 | ||
|
2 |
EDSS |
p | 0.491 | 0.012 | 0.035 | 0.061 |
| r | -0.151 | -0.492 | -0.422 | -0.380 |
Abbreviations: SDMT - Symbol Digit Modalities Test, PASAT -Passed Auditory Serial Addition Test, MoCA – Montreal Cognitive Assessment, MMSE – Mini Mental State Examination, EDSS –Expanded Disability Status Scale,.
Table 7.
Correlations between quality of life questionnaires and cognitive tests, physical disability scores for group 1 - relapsing forms and group 2 - progressive forms (Pearson correlation).
Table 7.
Correlations between quality of life questionnaires and cognitive tests, physical disability scores for group 1 - relapsing forms and group 2 - progressive forms (Pearson correlation).
| SDMT |
PASAT (60) |
MoCA (30) |
MMSE (30) |
EDSS |
9HPT DH |
9HPT NDH |
T25FW | |||
|
1 |
MSIS-29 (145) | p | 0.0001 | 0.0001 | 0.173 | 0.0001 | 0.0001 | 0.0001 | 0.0001 | 0.0001 |
| r | -0.496 | -0.464 | -0.148 | -0.485 | -0.583 | 0.423 | 0.500 | 0.492 | ||
| EQ-5D index (score) | p | 0.0001 | 0.0001 | 0.056 | 0.0001 | 0.0001 | 0.0001 | 0.0001 | 0.0001 | |
| r | -0.476 | -0.427 | -0.207 | -0.455 | 0.528 | 0.443 | 0.431 | 0.462 | ||
| EQ VAS (score) | p | 0.0001 | 0.0001 | 0.086 | 0.003 | 0.0001 | 0.0001 | 0.0001 | 0.0001 | |
| r | 0.488 | 0.380 | 0.186 | 0.312 | -0.602 | -0.408 | -0.419 | -0.499 | ||
|
2 |
MSIS – 29 (145) |
P | 0.587 | 0.194 | 0.449 | 0.258 | 0.003 | 0.202 | 0.087 | 0.108 |
| r | -0.122 | -0.269 | -0.159 | -0.235 | 0.576 | 0.264 | 0.349 | 0.391 | ||
|
ED-5D (score) |
p | 0.186 | 0.086 | 0.087 | 0.050 | 0.002 | 0.089 | 0.029 | 0.519 | |
| r | -0.286 | -0.350 | -0.349 | -0.397 | 0.595 | 0.347 | 0.438 | 0.163 | ||
|
EQ VAS (score) |
p | 0.951 | 0.221 | 0.307 | 0.209 | 0.092 | 0.969 | 0.317 | 0.763 | |
| r | -0.014 | 0.254 | 0.213 | 0.260 | -0.344 | 0.008 | -0.208 | -0.076 |
Abbreviations: SDMT - Symbol Digit Modalities Test, PASAT - Passed Auditory Serial Addition Test, MoCA – Montreal Cognitive Assessment, MMSE – Mini Mental State Examination, MSIS 29 - Multiple Sclerosis Impact Scale 29, EQ-5D- EuroQol five-dimension index score, EQ-VAS- EuroQol Visual Analogue Scale, EDSS – Expanded Disability Status Scale, 9HPT – 9 Hole Peg Test, DH - Dominant Hand, NDH- Non-Dominant Hand, T25FW -25 Foot Walk Test.
Table 8.
Correlations between quality of life questionnaires, cognitive tests, physical disability, fatigue, depression, daytime sleepiness, and sleep quality scores (Pearson correlation).
Table 8.
Correlations between quality of life questionnaires, cognitive tests, physical disability, fatigue, depression, daytime sleepiness, and sleep quality scores (Pearson correlation).
| SDMT |
PASAT (60) |
MoCA (30) |
MMSE (30) |
EDSS |
9HPT DH |
9HPT NDH |
T25FW | MFIS p | MFIS c | MFIS t | BDI | ESS | PSQI | ||
| MSIS-29 (145) | p | 0.715 | 0.004 | 0.815 | 0.077 | 0.032 | 0.067 | <0.001 | 0.064 | 0.001 | 0.0003 | 0.0002 | <0.001 | <0.001 | 0.005 |
| r | -0.071 | -0.517 | -0.045 | -0.333 | 0.400 | 0.345 | 0.631 | 0.348 | 0.578 | 0.619 | 0.625 | 0.725 | 0.297 | 0.505 | |
| EQ 5D (score) | p | 0.378 | 0.009 | 0.301 | 0.146 | 0.012 | 0.093 | 0.002 | 0.021 | 0.045 | 0.013 | 0.014 | 0.005 | 0.652 | 0.147 |
| r | -0.170 | -0.474 | -0.199 | -0.277 | 0.458 | 0.318 | 0.550 | 0.426 | 0.376 | 0.454 | 0.415 | 0.504 | 0.078 | 0.276 | |
| EQ VAS (score) | p | 0.180 | 0.069 | 0.010 | <0.001 | 0.008 | 0.179 | 0.005 | 0.104 | 0.002 | <0.001 | <0.001 | 0.029 | 0.115 | 0.049 |
| r | 0.256 | 0.342 | 0.472 | 0.629 | -0.482 | -0.408 | -0.504 | -0.308 | -0.556 | -0.690 | -0.663 | -0.406 | -0.22 | -0.36 |
Abbreviations: SDMT - Symbol Digit Modalities Test, PASAT - Passed Auditory Serial Addition Test, MoCA – Montreal Cognitive Assessment, MMSE – Mini Mental State Examination, MSIS 29 - Multiple Sclerosis Impact Scale 29, EQ-5D- EuroQol five-dimension index score, EQ-VAS- EuroQol Visual Analogue Scale, EDSS – Expanded Disability Status Scale, 9HPT – 9 Hole Peg Test, DH - Dominant Hand, NDH- Non-Dominant Hand, T25FW -25 Foot Walk Test, MFIS – Modified Fatigue Impact Scale, p physical, c – cognitive, t- total, BDI – Beck Depression Inventory, ESS – Epworth Sleepiness Scale, PSQI – Pittsburg Sleep Quality Index.
Disclaimer/Publisher’s Note: The statements, opinions and data contained in all publications are solely those of the individual author(s) and contributor(s) and not of MDPI and/or the editor(s). MDPI and/or the editor(s) disclaim responsibility for any injury to people or property resulting from any ideas, methods, instructions or products referred to in the content. |
© 2025 by the authors. Licensee MDPI, Basel, Switzerland. This article is an open access article distributed under the terms and conditions of the Creative Commons Attribution (CC BY) license (http://creativecommons.org/licenses/by/4.0/).
Copyright: This open access article is published under a Creative Commons CC BY 4.0 license, which permit the free download, distribution, and reuse, provided that the author and preprint are cited in any reuse.


