
Submitted:
07 December 2025
Posted:
09 December 2025
You are already at the latest version
Abstract
Dairy herd decisions about replacement, herd size, reproduction and capital investments have long-lasting consequences for herd structure and farm cash flow. Yet most planning tools emphasize static budgets rather than the dynamic evolution of animal numbers and cash availability. The Dairy Herd Structure Simulation and Cash Flow tool is a web-based decision support system, available through the Dairy Management Decision Support Tools website, designed to simulate these dynamics under alternative management strategies. The model operates in monthly time steps using a Markov-chain framework in which transition probabilities among animal states are driven by user-specified parameters such as culling, reproduction and heifer management. Calves, heifers and cows are tracked by age and lactation group, and starting conditions can be entered as herd-level summaries or via individual-animal spreadsheets. Economic components include milk income, variable costs, cull-cow income, heifer purchases or sales, miscellaneous costs and loan amortization. For each scenario, the tool projects monthly cash flow and income over variable cost per cow, together with graphical summaries of herd structure. An example application compares a baseline steady-state herd with a heifers-driven herd growth scenario, illustrating how replacement strategies influence herd composition and net cash flow, supporting more informed dairy herd planning and risk management.
Keywords:
dairy farm management
; herd dynamics
; Markov‐chain model
; economic simulation
; replacement and reproduction decisions
; scenario analysis
; decision support system
; risk management
; dairy management decision support tools (DairyMGT)
1. Introduction
Modern dairy farms are complex, dynamic enterprises in which biological processes, management choices, and market conditions interact over long time horizons. Decisions about culling, replacement, reproduction, and herd size affect not only short-term cash flow but also the future distribution of cows, heifers, and calves in the herd and, ultimately, whole-farm profitability.
In response to this complexity, a large suite of computerized decision-support tools has been developed to assist dairy producers and advisors in making data-driven economic and management decisions, particularly within the Dairy Management Decision Support Tools (DairyMGT.info) platform at the University of Wisconsin–Madison [1]. These tools typically focus on specific questions such as cow replacement value, heifer-raising costs, or ration optimization, and many are designed as relatively static calculators that compare alternative scenarios at a fixed point in time [1].
Whole-farm or system-level tools have more recently begun to couple herd dynamics with sustainability and economic metrics in user-friendly interfaces. For example, the DairyPrint model simulates herd demographics together with feed, manure, and greenhouse gas emissions to evaluate management and mitigation strategies at the farm scale [2]. These developments illustrate how dynamic simulation can be embedded in practical tools that help producers and other stakeholders explore “what-if” scenarios.
Parallel advances in integrated decision-support systems (IDSS) and data integration infrastructures, such as the Dairy Brain initiative, aim to connect continuous on-farm data streams with analytical modules and dashboards, moving decision-support closer to real time and embedding it into daily management workflows [3,4,5]. These efforts highlight both the opportunity and the challenge: to translate increasingly rich data and sophisticated models into tools that are transparent, interpretable, and aligned with the practical questions producers face.
Within this broader decision-support landscape, Markov-chain and dynamic programming methods have played a central role in modeling dairy cow replacement and reproductive decisions. Markov-chain formulations have been used to compute cow value and optimal replacement policies [6], to construct daily herd models that compare reproductive programs combining timed artificial insemination and estrus detection [7], and to quantify how reproductive performance affects herd value when integrated with dynamic programming [8]. Recent work has synthesized the range of mathematical methods applied to the cow replacement problem and underscored the link between model structure and the types of decisions that can be supported [9].
However, most research-oriented replacement and reproductive models focus on steady-state herd performance or long-run economic metrics under a fixed set of policies [6,7,8,9]. In practice, dairy producers face questions that are inherently transitional and time-bound, such as how a chosen expansion strategy will reshape herd structure over the next several years, how aggressive culling or changes in heifer-raising capacity will affect the supply of replacements, and how these biological dynamics will interact with cash flow, capital investments, and debt service at a monthly resolution. Existing tools rarely provide an integrated view of these herd-structure and financial trajectories in a form that remains intuitive for non-specialists.
At the same time, recent work on data integration and analytics in the dairy industry emphasizes the need for tools that are not only methodologically sound but also operationalizable in commercial environments, with clear inputs, interpretable outputs, and the ability to interface with other components of a broader decision-support ecosystem [1,2,3,4,5,10]. This context motivates decision-support tools that explicitly link herd structure, replacement and expansion strategies, and cash flow projections in a way that can be readily adopted by producers and consultants.
The objective of this paper is to describe the design and application of a web-based Dairy Herd Structure Simulation and Cash Flow decision-support tool. The tool is implemented as a monthly Markov-chain simulator that uses user-specified transition probabilities and management parameters to project herd structure—cows, heifers, and calves—and associated cash flows up to 400 months into the future. It links biological states (parity, months in milk, pregnancy status, and heifer age) with revenues, operating costs, investment decisions, and loan schedules, allowing users to explore scenarios such as stable production, gradual or rapid expansion using raised or purchased replacements, and planned heifer sales. By framing these projections within an accessible interface integrated into the DairyMGT.info ecosystem, the tool is intended to support strategic and tactical decision-making about herd structure, replacement, and expansion while remaining transparent about the underlying assumptions and model mechanics.
2. Materials and Methods
2.1. Decision Problem and Overall Design
The Dairy Herd Structure Simulation and Cash Flow tool was designed to support medium- and long-term planning decisions related to herd structure, replacement, reproduction, and capital investments on dairy farms. It focuses on questions such as how different culling and replacement strategies, reproductive performance levels, or expansion plans will affect the number of animals in each age and lactation group and the resulting monthly cash flow over time. The tool is implemented as a web-based application within the Dairy Management Decision Support Tools (DairyMGT.info) platform at the University of Wisconsin–Madison [1], with all computations performed on the server and results returned as interactive tables and graphs in the user’s web browser.
The model operates in discrete monthly time steps and can project up to 400 months into the future, allowing users to examine both transitional dynamics and long-run trajectories. The core of the herd-structure module is a Markov-chain representation of transitions among animal states, similar in spirit to earlier applications in cow replacement and reproductive modeling [6,7,8], but adapted here to generate explicit herd inventories and to link these to detailed cash-flow calculations. The general design philosophy follows previous decision-support and integrated decision-support efforts that emphasize transparent biological assumptions, explicit economic components, and user-friendly interfaces for farm-level decision-making [1,2,3,4,5,10].
2.2. Herd Structure and Markov-Chain Formulation
Animals are grouped into biologically and managerially relevant states. Cows are classified by parity (first and later lactations), months in milk, and pregnancy stage, while heifers are classified by age in months. Calves can be treated as a separate group or as the earliest heifer age class, depending on user-defined management. Within each monthly time step, animals can transition among these states according to probabilities that reflect calving, conception, pregnancy loss, culling, death, and aging, as is common in Markov-chain representations of dairy herds [6,7,8].
Formally, the herd structure at month is represented by a state vector whose elements correspond to the number of animals in each state (e.g., heifers of a given age, cows in a given parity–month-in-milk–pregnancy class). The evolution of follows
where is a transition probability matrix derived from user-specified rates (e.g., conception probability, voluntary waiting period, culling rate), and is a vector of exogenous entries such as purchased heifers or externally specified calf inflows. This structure mirrors previous Markov-chain models for cow value and reproductive programs [6,7,8] but is simplified for monthly rather than daily time steps and oriented toward simulation rather than optimization, consistent with the broader family of replacement models reviewed in Palma et al. [9].
Initial conditions can be specified in two ways. Users may (i) enter a set of herd-level summary values, such as total cows by parity and average days in milk, from which the tool constructs an approximate starting state vector, or (ii) upload a spreadsheet with individual-animal data. The template file allows entry of cow identification, lactation number, and days in milk for each cow, as well as identification and age for each heifer. The uploaded file is parsed and aggregated into the internal state vector , ensuring that the simulated herd closely reflects the current herd structure of a specific farm.
In addition, the tool offers a “From steady state” option. When this box is selected, the model iteratively applies the transition matrix until the distribution of animals among states changes negligibly from one month to the next, and the simulation horizon presented to the user begins at this approximate equilibrium. This mode represents herds that are already operating under long-run demographic conditions implied by the chosen biological parameters and is useful for exploring generic or “typical” herds. When the option is not selected, the simulation starts directly from the user-specified initial structure, allowing explicit study of transitional dynamics as the herd moves toward or away from equilibrium.
2.3. Economic and Cash-Flow Components
The economic module aggregates revenues and costs for each monthly time step by linking the simulated herd structure to user-defined economic parameters. This approach is consistent with earlier decision-support tools that combine biological models with farm-level economic calculations to evaluate management strategies [1,2,6,7,8]. Key revenue components include milk income, calculated as the product of milk yield per cow (by parity and stage of lactation) and milk price, and income from the sale of cull cows and surplus heifers. Variable costs include feed and labor for each animal group, heifer-raising costs, and miscellaneous operating expenses. Users specify these parameters in the “Forecast Inputs” and “Herd Structure Simulation” tabs, where over 30 editable inputs capture herd-specific prices, quantities, and technical coefficients.
Milk production is modeled as expected yield per cow for each parity and month in milk, scaled by the number of cows in each state. Feed consumption and labor requirements are similarly parameterized per animal group. The way replacements are handled depends on a user-selectable checkbox labeled “Heifers → Cows.”
- Default mode (checkbox off). The adult herd is maintained at a user-specified target number of cows. Shortages of home-raised heifers are automatically compensated with purchased animals, whereas surplus heifers can be sold. In this mode, heifer purchases and sales act as balancing items that keep the milking herd close to its target size, and associated cash inflows and outflows are included in the monthly cash flow.
- Heifers-driven mode (checkbox on). The model assumes that only heifers raised on the farm enter the adult herd and that no replacements are purchased or sold. Adult herd size becomes an outcome of the simulated reproduction, mortality, culling, and heifer-rearing parameters rather than a fixed target. The resulting projections reveal whether the specified management and biological performance would, by themselves, cause the herd to gradually expand, remain stable, or shrink over the planning horizon.
The tool allows users to specify additional investments and associated bank loans, including principal, interest rate, and amortization schedule. Loan payments are incorporated into monthly cash outflows. For each month, the tool computes total revenues, total variable and fixed costs (including loan payments), net cash flow, and income over variable cost per cow. These monthly outcomes are stored over the full planning horizon, enabling users to visualize the temporal pattern of cash surpluses or deficits under each scenario. Results can be viewed as tables, time-series plots, and summary indicators, and exported as spreadsheets for further analysis.
3. Results and Example Scenarios
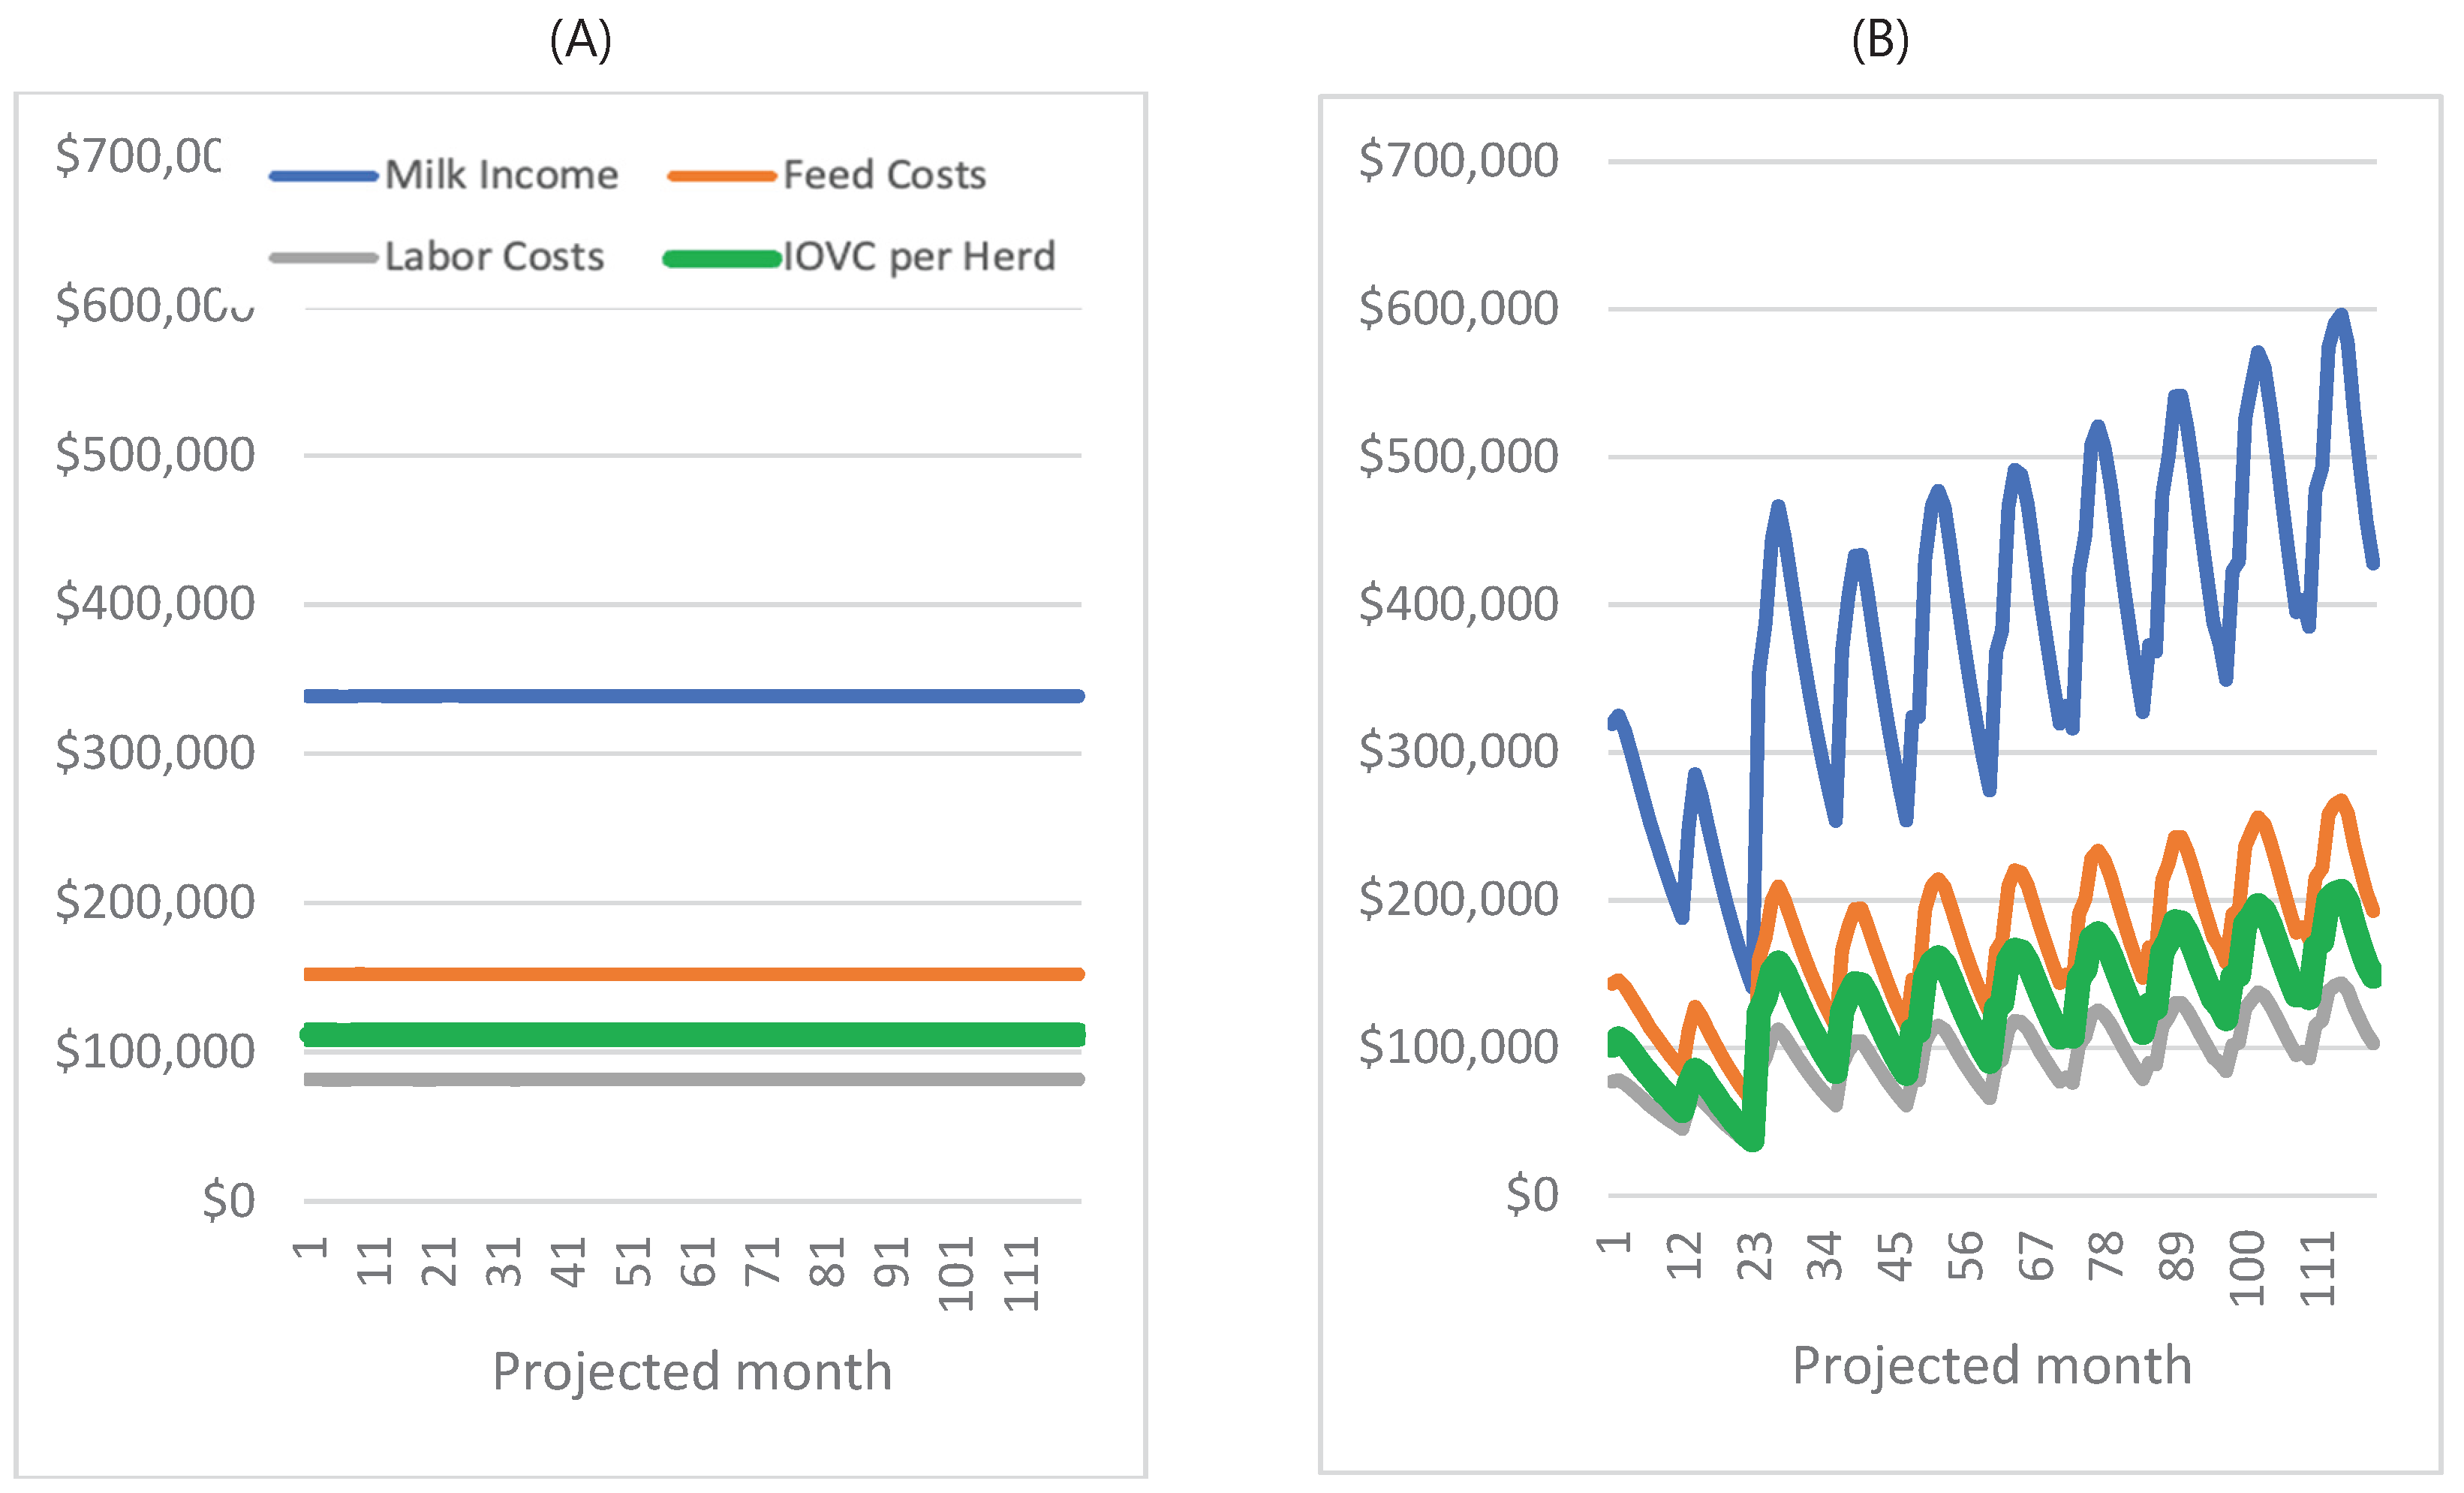
To illustrate the use of the Dairy Herd Structure Simulation and Cash Flow tool, two example scenarios were constructed for a 1000-cow Holstein herd over a 120-month horizon. Both scenarios used the same biological and economic parameters (Figure 1), including a 24-month age at first calving, a 13-month calving interval, and a 35% annual cow replacement rate. The scenarios differ in how replacements are handled and in the initial conditions (steady state versus a user-defined starting structure). In Table 1, income over variable cost (IOVC) is reported as the mean total monthly value for the herd, whereas Figure 3 presents IOVC as total monthly IOVC for the herd over time.
3.1. Scenario 1: Baseline Steady-State Herd with Target Size
In the baseline scenario, the “From steady state” option was activated and the number of adult cows was fixed at 1000. Replacement needs were automatically met by purchasing or selling heifers as required (the “Heifers → Cows” option was unchecked). Under these assumptions, the simulated herd structure was essentially constant over the 10-year projection (Figure 2A). The number of adult cows remained at 1000 throughout, and the heifer inventory showed only minor month-to-month variation.
Cash-flow outputs were correspondingly stable (Figure 3A, Table 1). Mean monthly milk income was about USD 338,600, and mean IOVC for the herd remained nearly constant at approximately $111,500 over the horizon. This scenario illustrates how the tool can characterize the long-run herd structure and cash-flow pattern of an established herd operating under current management.
Figure 3.
Monthly cash-flow most critical components and income over variable cost (IOVC) per herd for the two scenarios. (A) Scenario 1: baseline steady-state herd, showing nearly constant monthly milk income, feed, labor and heifer-raising costs, and relatively stable IOVC. (B) Scenario 2: heifers-driven herd growth, showing larger variation and upward trends in milk income and cost components, and a wider range of IOVC reflecting the transient dynamics and subsequent expansion of the herd. IOVC = milk income + cull cow income + heifer sales – feed costs – labor costs – raising heifer costs – heifer purchases – loan amortization – miscellaneous expenses.
3.2. Scenario 2: Heifers-Driven Herd Growth Without Steady State
The second scenario used the same biological and economic parameters but was designed to show how herd size and cash flow respond when replacements must come entirely from within the herd. In this case, the “From steady state” option was not selected, and the simulation started from a user-defined initial herd structure with 1000 adult cows and a corresponding heifer inventory. The “Heifers → Cows” option was activated so that all heifers raised on the farm entered the adult herd and no replacement animals were purchased or sold.
Under these conditions, the model predicted a marked transient followed by sustained herd growth (Figure 2B). Adult cow numbers fell to about 500 during the first two years as existing cows were culled faster than home-raised heifers could enter the milking herd, then increased steadily, reaching roughly 1356 cows by month 120. On average, the herd contained about 1143 cows over the 10-year period, 14% more than in the baseline scenario (Table 1). Milk income increased in proportion to the larger herd size, but raising-heifer (not shown), feed, and labor costs also increased and became more variable. IOVC remained positive but exhibited a wider range over time than in the steady-state scenario (Figure 3B, Table 1). This example shows how the tool can diagnose whether a given combination of reproductive performance, culling rate, and heifer-rearing strategy would, in the absence of purchases, cause the herd to shrink, remain stable, or grow, and how these dynamics translate into cash-flow risk.
3.3. Other Applications
Beyond the two scenarios presented here, the same framework can be used to evaluate loan-financed expansions or infrastructure improvements by specifying loan amount, interest rate, amortization period, and start of payments. Loan amortization then appears as an additional monthly cost in the cash-flow outputs, allowing users to visualize how financed investments affect IOVC and net cash flow over time.
4. Discussion
This Technical Note describes a web-based decision support tool that combines a Markov-chain representation of dairy herd dynamics with a monthly cash-flow model in a form that is directly usable by producers, consultants and Extension professionals. The Dairy Herd Structure Simulation and Cash Flow tool builds on previous decision-support efforts within the DairyMGT.info platform [1] and complements whole-farm sustainability tools such as DairyPrint [2] and emerging integrated decision-support systems and data-integration infrastructures, including the Dairy Brain initiative [3,4,5,10]. By explicitly linking herd structure, replacement strategies and cash flow in monthly time steps over long planning horizons, the tool is designed to fill a gap between research-oriented herd models [6,7,8,9] and the practical, scenario-based questions that producers face.
The example scenarios highlight several ways in which this type of tool can support decision-making. In the steady-state scenario, the tool provides a transparent description of a “business-as-usual” herd, clarifying the implicit steady-state herd structure implied by a given combination of reproduction, culling and heifer-rearing parameters and translating this into a smooth cash-flow trajectory. Such baseline simulations are useful for benchmarking current performance, communicating with lenders and advisors, and setting expectations before contemplating changes in management or scale. When the “Heifers → Cows” option is engaged and the model is not started from steady state, the second scenario shows how the same biological parameters can lead to substantial transient behavior and long-term growth when the herd is forced to rely solely on internally raised replacements. The initial decline in cow numbers, followed by gradual expansion beyond the original herd size, underscores how replacement strategies affect not only long-run capacity but also the timing of cash surpluses and deficits.
These scenarios also demonstrate the value of explicitly tracking IOVC and other cash-flow measures at a monthly resolution. For example, Scenario 2 shows that relying exclusively on home-raised replacements can increase long-run milk income and IOVC but may expose the farm to periods of lower cash availability while the replacement pipeline is being built. The ability to visualize such patterns is particularly important when planning herd expansions, adjusting reproductive programs, or considering changes in culling policies. Although loan-financed investments were not explored in detail here, the model’s loan module offers a straightforward way to examine how debt service interacts with these biological dynamics, which is a recurring concern in conversations between producers and financial institutions.
Like any model-based tool, the Dairy Herd Structure Simulation and Cash Flow tool has limitations that should be recognized when interpreting its outputs. The current implementation is deterministic and operates at a monthly time step; it does not capture day-to-day variability in production, price volatility, or stochastic health events, nor does it quantify uncertainty in user-specified parameters. The model does not impose explicit constraints on facilities, labor availability or environmental regulations, so users must judge whether simulated herd sizes and cash flows are feasible in their specific context. Furthermore, the tool is designed for scenario analysis rather than optimization: it does not search for “optimal” policies but instead provides a consistent framework for comparing user-defined alternatives.
Despite these limitations, the tool offers several advantages for Extension and teaching. Its web-based implementation, parameter-driven structure and graphical outputs make it suitable for workshops, classroom exercises and one-on-one consultations, where users can quickly explore “what-if” questions and see the consequences of different assumptions. The same Markov-chain and economic framework can also serve as a building block for more advanced applications, including integration into data-driven IDSS architectures [3,4,5,10] or coupling with optimization and reinforcement-learning approaches to suggest candidate management strategies. Future work could focus on tighter integration with farm data streams, validation with longitudinal herd records and expansion of the interface to support batch scenario runs and automated reporting.
5. Conclusions
The Dairy Herd Structure Simulation and Cash Flow tool provides a practical, web-based implementation of a Markov-chain herd model linked to a monthly cash-flow calculator for dairy farms. By allowing users to specify herd structure, reproduction and culling parameters, heifer-rearing strategies, and economic conditions, and then projecting herd composition and cash flows up to 400 months into the future, the tool offers an accessible way to explore the medium- and long-term consequences of management and investment decisions.
The example scenarios presented here demonstrate how the tool can represent both stable, steady-state herds and transitional dynamics when herds rely solely on internally raised replacements. Differences in herd size, milk income and IOVC between scenarios illustrate how replacement strategies shape both biological trajectories and financial risk. Although the model is simplified and intended for scenario analysis rather than precise prediction, it can support producers, consultants and Extension professionals in benchmarking current performance, evaluating alternative herd-structure strategies and preparing for expansion or other major changes in herd management.
Funding
This research received no external funding and was supported by internal funds from the Dairy Management Decision Support Tools program, Department of Animal and Dairy Sciences, University of Wisconsin–Madison.
Institutional Review Board Statement
The study did not involve humans or animals.
Informed Consent Statement
Not applicable. The study did not involve humans or animals.
Data Availability Statement
No new data were created or analyzed in this study. The simulation outputs shown in the example scenarios can be reproduced using the Dairy Herd Structure Simulation and Cash Flow tool available at DairyMGT.info (https://dairymgt.info).
Acknowledgments
The author thanks the Dairy Management Decision Support Tools program and the Department of Animal and Dairy Sciences at the University of Wisconsin–Madison for their continued support in the development and maintenance of the DairyMGT.info platform. The author also acknowledges the valuable feedback from dairy producers and Extension colleagues who have used preliminary versions of the Dairy Herd Structure Simulation and Cash Flow tool in workshops and farm visits. During the preparation of this manuscript, the author used ChatGPT (GPT-5.1, OpenAI) for assistance with manuscript organization and language editing. The author has reviewed and edited the output and takes full responsibility for the content of this publication.
Conflicts of Interest
The author is responsible for the development and maintenance of the Dairy Herd Structure Simulation and Cash Flow tool and of the Dairy Management Decision Support Tools (DairyMGT.info) platform at the University of Wisconsin–Madison. The author declares no commercial or financial interest in the tool beyond its use for research and Extension activities. The funders had no role in the design of the study; in the collection, analyses, or interpretation of data; in the writing of the manuscript; or in the decision to publish the results.
Abbreviations
The following abbreviations are used in this manuscript:
| IDSS | Integrated decision support system |
| DairyMGT | Dairy Management Decision Support Tools (DairyMGT.info) |
| IOVC | Income over variable cost |
References
- Cabrera, V.E. Invited review: Helping dairy farmers to improve economic performance utilizing data-driving decision support tools. Animal 2018, 12, 134–144. [Google Scholar] [CrossRef] [PubMed]
- da Silva, T.E.; Cabrera, V.E. The DairyPrint model: A decision-support model to help dairy farmers and other stakeholders towards improved sustainability. J. Dairy Sci. 2024, 107, 10998–11015. [Google Scholar] [CrossRef] [PubMed]
- Cabrera, V.E.; Fadul-Pacheco, L. Future of dairy farming from the Dairy Brain perspective: Data integration, analytics, and applications. Int. Dairy J. 2021, 121, 105069. [Google Scholar] [CrossRef]
- Baldin, M.; Breunig, T.; Cue, R.; De Vries, A.; Doornink, M.; Drevenak, J.; Fourdraine, R.; George, R.; Goodling, R.; Greenfield, R.; et al. Integrated Decision Support Systems (IDSS) for dairy farming: A discussion on how to improve their sustained adoption. Animals 2021, 11, 2025. [Google Scholar] [CrossRef] [PubMed]
- Wangen, S.R.; Zhang, F.; Fadul-Pacheco, L.; da Silva, T.E.; Cabrera, V.E. Improving farm decisions: The application of data engineering techniques to manage data streams from contemporary dairy operations. Livest. Sci. 2021, 250, 104602. [Google Scholar] [CrossRef]
- Cabrera, V.E. A simple formulation and solution to the replacement problem: A practical tool to assess the economic cow value, the value of a new pregnancy, and the cost of a pregnancy loss. J. Dairy Sci. 2012, 95, 4683–4698. [Google Scholar] [CrossRef] [PubMed]
- Giordano, J.O.; Kalantari, A.S.; Fricke, P.M.; Wiltbank, M.C.; Cabrera, V.E. A daily herd Markov-chain model to study the reproductive and economic impact of reproductive programs combining timed artificial insemination and estrus detection. J. Dairy Sci. 2012, 95, 5442–5460. [Google Scholar] [CrossRef] [PubMed]
- Kalantari, A.S.; Cabrera, V.E. The effect of reproductive performance on the dairy cattle herd value assessed by integrating a daily dynamic programming model with a daily Markov chain model. J. Dairy Sci. 2012, 95, 6160–6170. [Google Scholar] [CrossRef] [PubMed]
- Palma, O.; Plà-Aragonés, L.M.; Mac Cawley, A.; Albornoz, V.M. Mathematical methods applied to the problem of dairy cow replacements: A scoping review. Animals 2025, 15, 970. [Google Scholar] [CrossRef] [PubMed]
- Cabrera, V.E.; Bewley, J.; Breunig, M.; Breunig, T.; Cooley, W.; De Vries, A.; Fourdraine, R.; Giordano, J.O.; Gong, Y.; Greenfield, R.; et al. Data Integration and Analytics in the Dairy Industry: Challenges and Pathways Forward. Animals 2025, 15, 329. [Google Scholar] [CrossRef] [PubMed]
Figure 1.
Input parameters for the example herd. Forecast input screen of the Dairy Herd Structure Simulation and Cash Flow tool for the 1000-cow Holstein herd, showing key biological and economic parameters (rolling herd average milk yield, feed and labor costs, heifer-rearing costs, cull cow value, miscellaneous expenses, and milk price), as well as loan amortization fields.
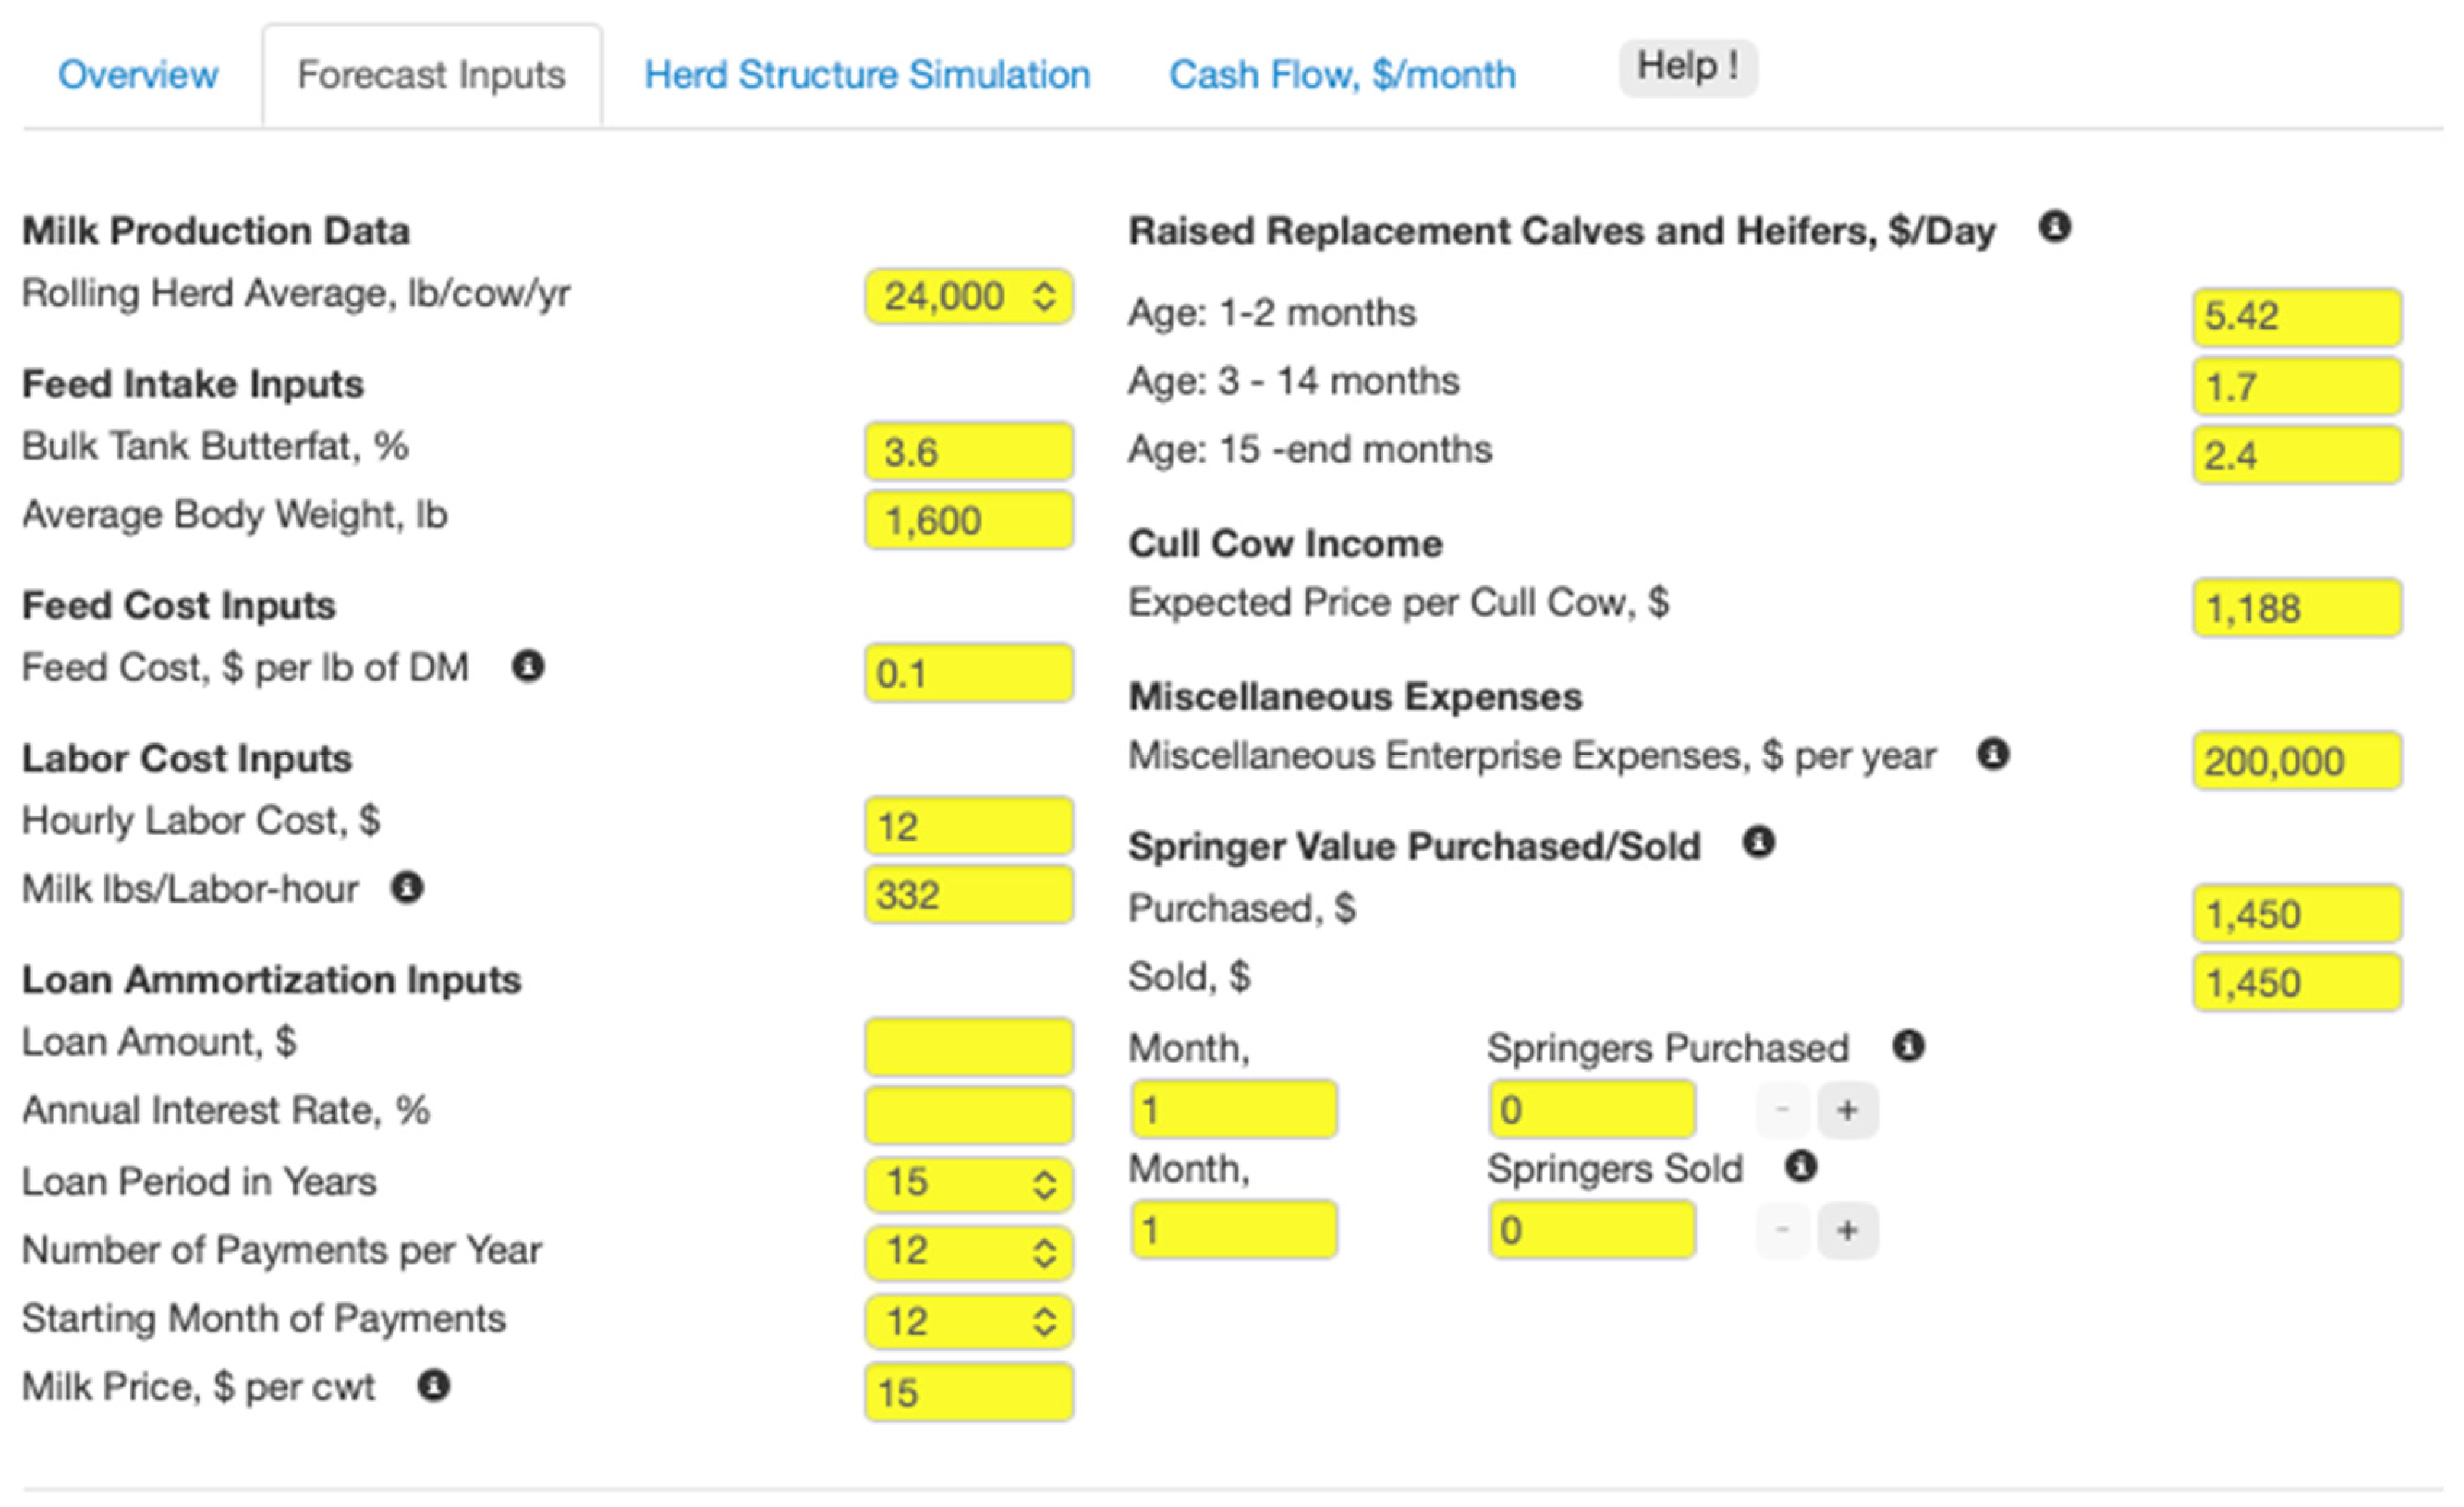
Figure 2.
Simulated herd structure over 120 months for two replacement strategies. (A) Scenario 1: baseline steady-state herd with a fixed target of 1000 adult cows (“From steady state” option selected; “Heifers → Cows” unchecked), showing essentially constant numbers of heifers and cows by parity and the final herd inventory. (B) Scenario 2: heifers-driven herd growth starting from a user-defined initial structure (“From steady state” not selected; “Heifers → Cows” checked), illustrating the initial decline and subsequent expansion in cow numbers and the build-up of older heifer age classes over the 120-month horizon.
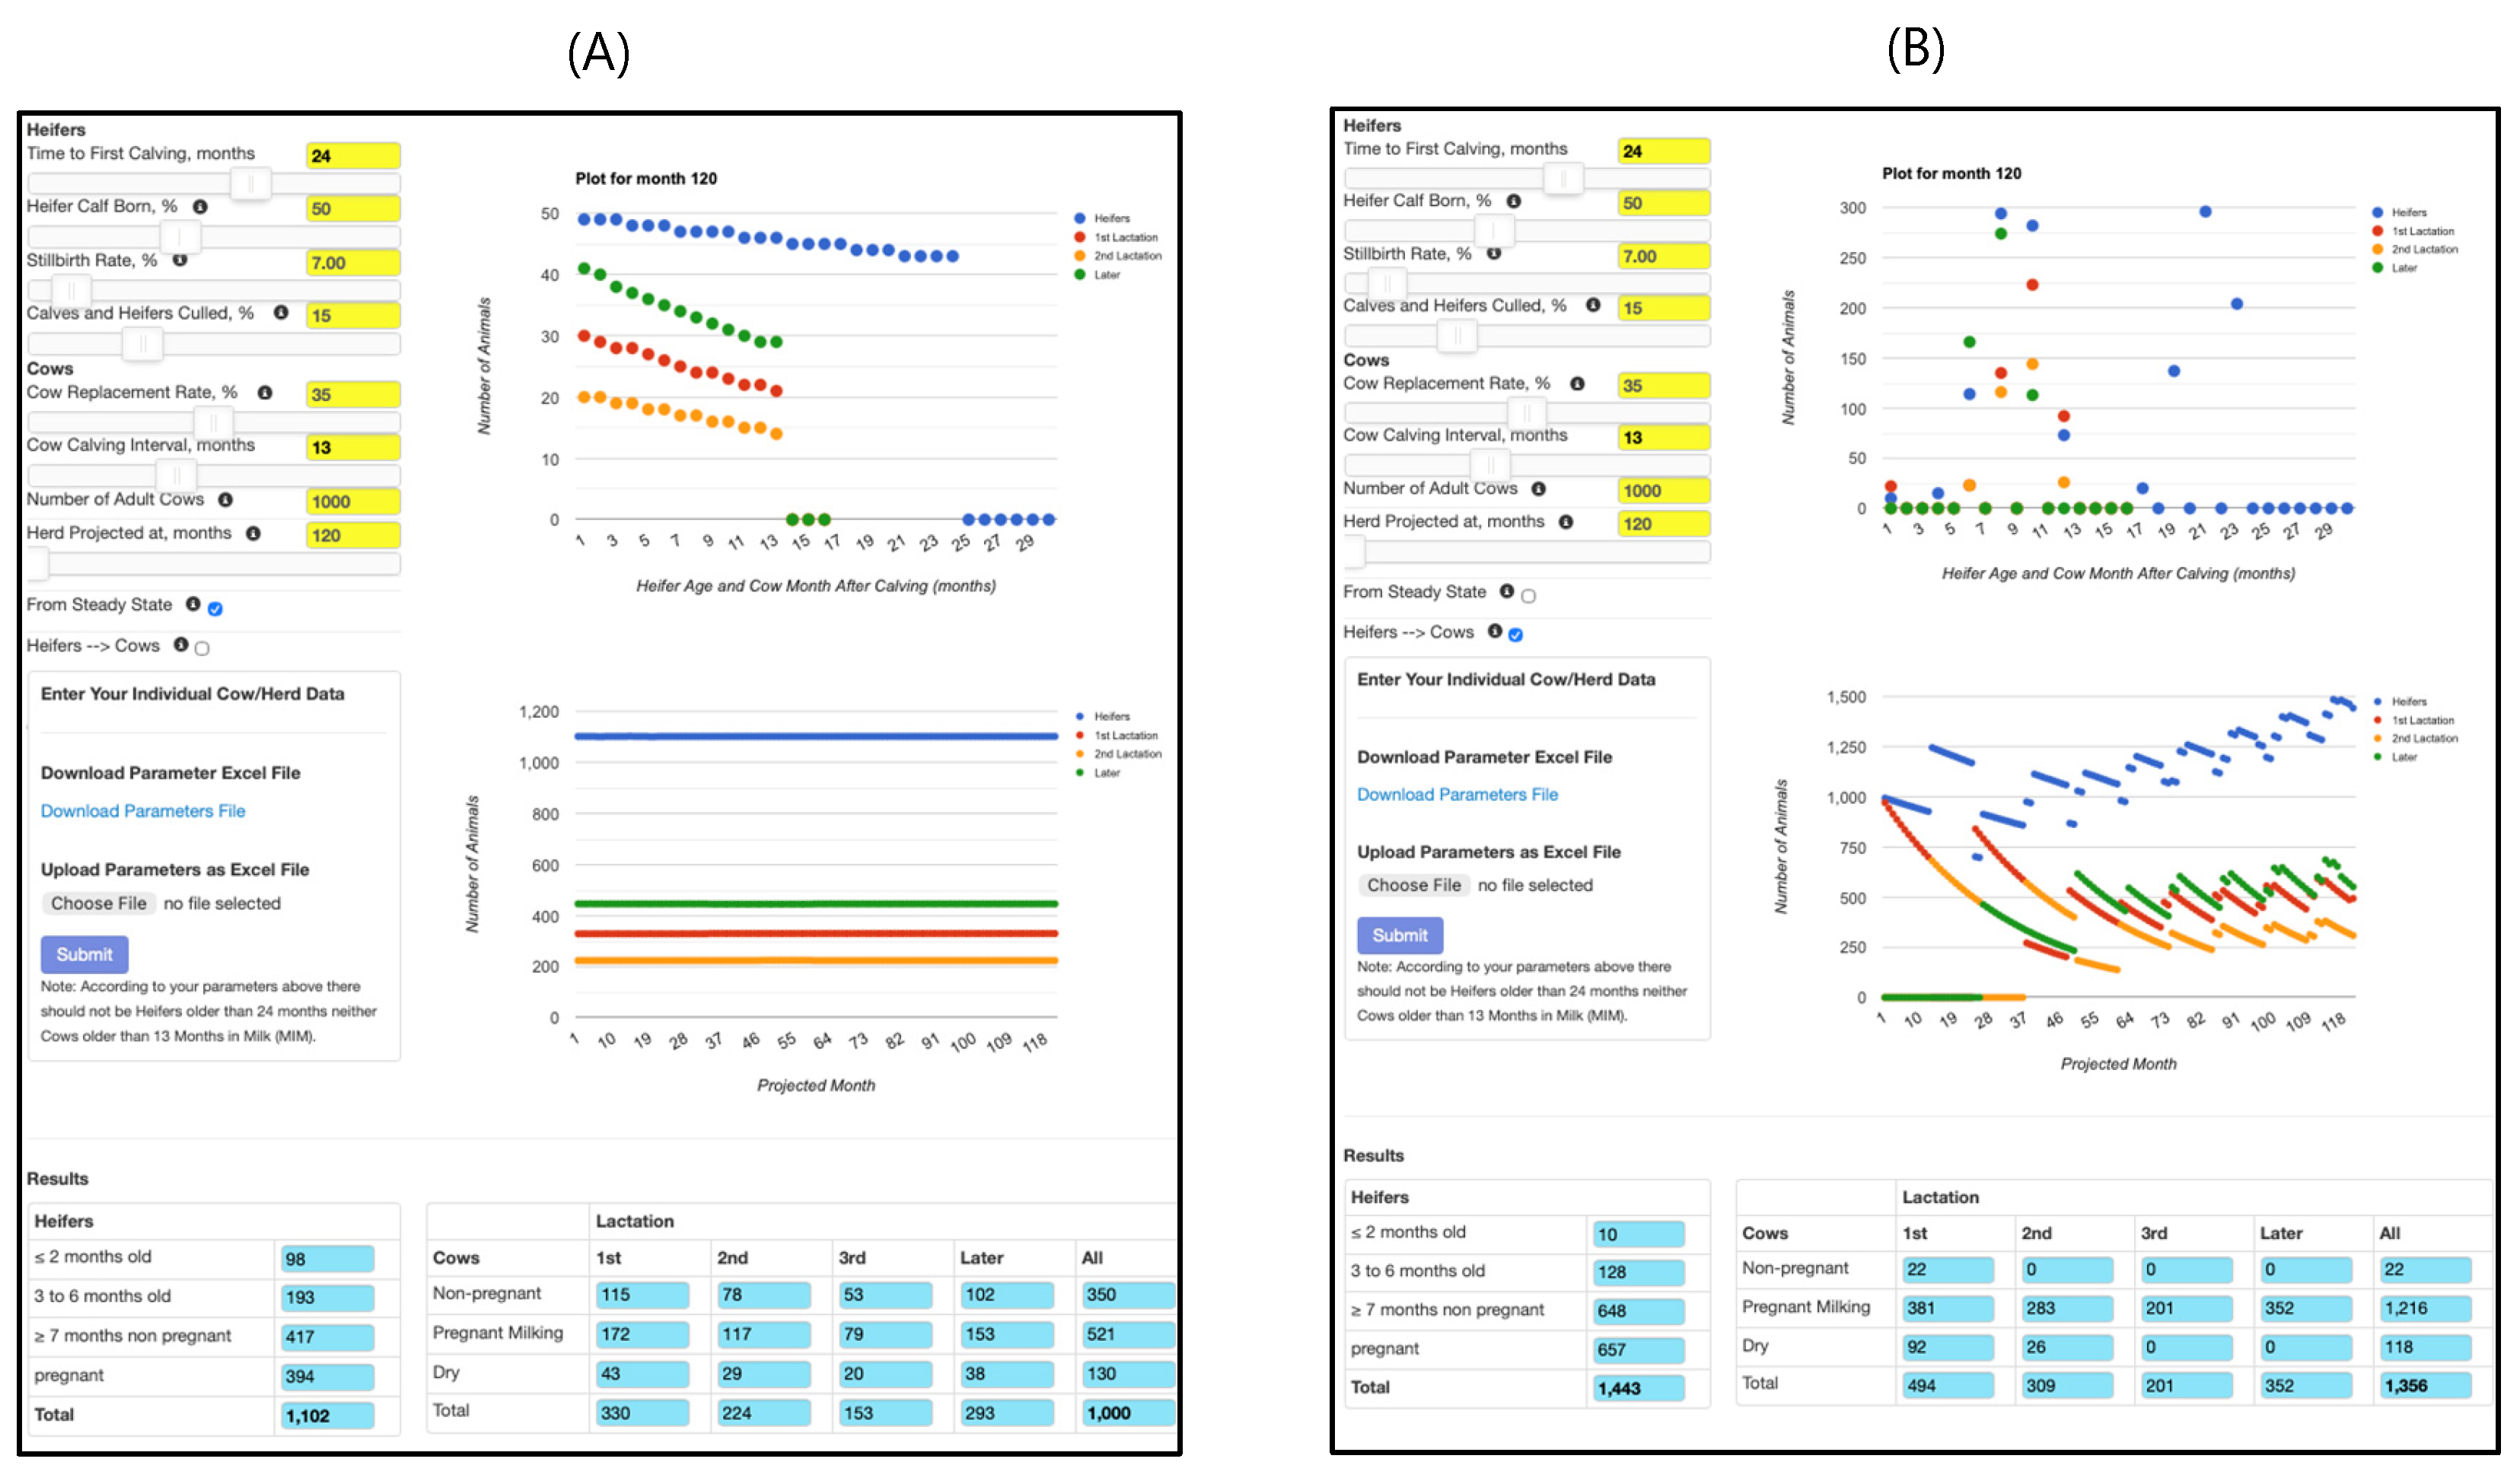

Table 1.
Summary statistics from the two example scenarios for a 1000-cow Holstein herd simulated over 120 months.
Table 1.
Summary statistics from the two example scenarios for a 1000-cow Holstein herd simulated over 120 months.
| Scenario | Cows, Month 1 | Cows, Month 120 | Mean Cows | Milk Income, Month 120 (USD/Month) | Feed Costs, Month 120 (USD/Month) |
IOVC1, Month 120 (USD/Month) |
|---|---|---|---|---|---|---|
| Baseline steady-state herd | 1000 | 1000 | 1000 | 338,589 | 152,179 | 111,450 |
| Heifers-driven herd growth | 971 | 1356 | 1143 | 427,909 | 192,619 | 148,197 |
1 Income over variable cost = milk income + cull cow income + heifer sales – feed costs – labor costs – raising heifer costs – heifer purchases – loan amortization – miscellaneous expenses.
Disclaimer/Publisher’s Note: The statements, opinions and data contained in all publications are solely those of the individual author(s) and contributor(s) and not of MDPI and/or the editor(s). MDPI and/or the editor(s) disclaim responsibility for any injury to people or property resulting from any ideas, methods, instructions or products referred to in the content. |
© 2025 by the authors. Licensee MDPI, Basel, Switzerland. This article is an open access article distributed under the terms and conditions of the Creative Commons Attribution (CC BY) license (http://creativecommons.org/licenses/by/4.0/).
Copyright: This open access article is published under a Creative Commons CC BY 4.0 license, which permit the free download, distribution, and reuse, provided that the author and preprint are cited in any reuse.


