
Submitted:
07 December 2025
Posted:
19 December 2025
You are already at the latest version
Abstract
This article discusses the process of spreading harmful impurities from traffic congestion. The process of spreading harmful impurities is considered by a three-dimensional model. The simulation of the spread of harmful impurities from traffic congestion is given, and algorithms for solving the three-dime nsional diffusion problem by the recurrent operator method are also given. In previous studies, we also used the recurrent operator method. The solution of the three-dimensional linear differential diffusion equation is sought in the form of a series. Where this series is inserted into each term of the linear differential equation, then making the indices shift in accordance with the recurrent operator method and taking out the common multiplier, we obtain the recurrent equation. Based on this recurrent equation, the coefficients of the series are searched for. Turning to the procedures for finding the coefficients of a series in the Maple software environment, the calculation of finding the coefficients was performed. Next, inserting the found coefficients into a series, we get the sum, which leads to a simpler solution convenient for differentiation. Further, partial derivatives in spatial coordinates are found based on software procedures in Maple. With this approach, the general solutions are expressed in terms of arbitrary functions and are not related to the solution of another equation. The obtained simulation results are shown in tables and illustrated in figures which are also obtained in the Maple software environment.
Keywords:
pollution
; harmful impurities
; spread of harmful impurities
1. Introduction
The problem of air pollution is one of the main problems of the city of Almaty, as harmful impurities are released from transports located in the congestion of the road transport network of the city of Almaty. Transport is the main link in the city's transportation network. In addition to the transport network, there is no communication in the city that could connect the network to one end of the city and to the other end, because of this, the main population of the city is faced with the problem of traffic congestion, which results in emissions of harmful impurities, which is harmful to the health of the population of Almaty. With the development of the city and urban infrastructure, the task of managing the transport system is an urgent problem. The city has a metro with a length of 8.56 km, but this does not solve the problems with traffic congestion and the emission of harmful impurities by transport, which create traffic jams at every intersection in Almaty. To control the traffic of the transport network of cities, control systems and algorithms are widely used, the work of which is based on traffic flow models. Without transport modelling, it is impossible to plan the construction of new and modernization of existing transport facilities, housing and business construction facilities, traffic management schemes, emergency response, and solving a number of other practical tasks [1], 83-89p]. The modern pace of development of the city and urban communication requires more and more powerful and industrial facilities, as well as the construction of roads and interchanges to improve the movement of vehicles in the urban transport communication network. The increasing saturation in the transport network is manifested precisely during rush hour at the beginning of the working day and by the end of the working day. Clusters at the intersections of the city's road transport network and the congestion of a large number of cars, on the one hand, emit a large amount of harmful impurities into the city's atmosphere, and on the other hand, they are looking for ways out of congestion and here, like the physical process of diffusion, the accumulated huge amount of transport is dispersed and this process can be attributed to the distribution of these impurities [2], 47p.].
In Almaty, 700 transport units, including public transports, pass through the intersection of large streets on average per hour during rush hour. Each car moving around the city emits an average of 0.001522 g/m3 of carbon monoxide into the atmosphere per second, 0.0000771 g/m3 of nitrogen oxide, 0.000385 g/m3 of various hydrocarbons. These accumulated transports emit a large amount of harmful impurities into the atmosphere. These harmful impurities are heavy in their structure, polluting the earth's surface and soil, and in the process of spreading in the atmosphere they enter into chemical reactions with water vapor and other components of the atmosphere or pass from one chemical state to another. If the impurities released into the air consist of large particles, then spreading in the atmosphere, they begin to descend under the influence of gravity at a certain constant speed according to Stokes' law. Naturally, almost all impurities eventually settle on the earth's surface, and heavy ones mainly under the influence of the gravitational field, and light ones as a result of the diffusion process. The legal basis of the environmental protection base has been created and is constantly being improved in the republic [3], 16p].
The work of the authors Naimanova A. Zh and Beketaeva A.O. [4], 88p] provides studies of vortex structures behind a transverse jet in a supersonic flow at a pressure ratio from moderate to high. Numerical simulation is performed using three-dimensional Favre-averaged Navier-Stokes equations associated with the turbulence model, which are solved using an algorithm based on a high-order non-oscillatory circuit (ENO).
In the work of the authors Makasheva A. and Naimanova A.Zh. [5], 481 p.], numerical studies of a quasi-two-dimensional supersonic turbulent mixing layer of gas and particles are performed using 2D DNS (Direct numerical modeling). The system of Navier-Stokes equations for a multi-species flow is solved using the ENO scheme of the third order of accuracy.
In the work of the authors Beketaeva A. O., Moiseeva Yu. S., Naimanova A. Zh. [6], 101 p.], provides a numerical study of a supersonic turbulent multi-species flow with a transverse jet injector. Based on the developed model, the picture of the formation of a vortex system is studied in detail. As a result, new vortices formed in the recirculation zone in front of the jet are revealed, as well as their effect on the mixing layer.
A number of domestic scientists Naimanova A. Zh., Beketaeva A.O., Makasheva A., Belyaev E. K., as well as a number of other scientists are engaged in solving the Navier-Stokes equations. It should be noted here that the works of these scientists solve nonlinear problems of turbulent transport of the Navier-Stokes equation. In their works, they considered the turbulent transfer of liquid and gas flow using the ENO scheme, WENO and DVD schemes.
The author's work [7], 3p] considers the developed mathematical model of turbulent transport, which describes the process of environmental pollution of urban tunnels. The solution of the developed model of emissions of harmful impurities from exhaust gases by cars is considered by TVD schemes after averaging by Favre.
The work of the authors [8] examines air pollution and provides an assessment of air pollution in Kazakhstan, which is caused by many factors and poses a serious threat to public health. Air pollution related to mining and processing of minerals, oil and gas production, gasoline and diesel fuel production by motor vehicles, industrial enterprises. The results of atmospheric air monitoring, which was carried out in 26 cities. The degree of air pollution was assessed based on the results of analysis and processing of air samples taken at stationary observation posts.
The work of the authors [9] provides approaches to the ecological distribution of traffic flow in the transport network in terms of carbon dioxide content. The paper proposes a mathematical model of the ecological distribution of traffic flow in the network, as well as a definition of how the amount of harmful emissions for railway transport will be calculated (based on the amount of energy required for movement, calculated by the circumference of the wheels).
The work of the authors [10] presents three-dimensional computational studies of airflow transport in nasal cavity models for normal inhalation velocity under various environmental conditions. The three-dimensional numerical measurement results are compared with experimental data and calculations by other authors.
The work of the authors [11], a computer simulation of the spread of pollutants formed during fuel combustion at Ekibastuzskaya GRES-1 and their chemical reaction in the atmosphere was presented. Using the example of a real thermal power plant (Ekibastuzskaya GRES- 1), the dispersion of NO, NO2, CO and products of NO2, HNO3, and CO2 during a chemical reaction with oxygen was modeled. The numerical method was verified by solving three test problems, and the obtained computational solutions were compared with measurement data and calculated data from other authors.
2. Materials and methods of research.
In this paper, the linear equation is solved using recurrent operator methods. Determine how long it takes for harmful impurities to be distributed from traffic jams during rush hour at intersections. A three-dimensional diffusion problem is considered, which describes the process of spreading both harmful impurities and diffusion [12,13], p36-43, [14].
here
here, the terms of equation (1) are rolled up into operators
here - are the diffusion coefficients along the coordinate axes, the Laplace operator, - are the transfer rates of harmful impurities along the coordinate axes. the gradient of the function. Решение уравнения (1) ищем виде ряда (5)
Substituting the series (5) into equation (1) and making an offset, respectively, in each term of the equation and taking out the total multiplier we obtain the following recurrent equation
здесь ;
We find the coefficients of the series from the recurrence relation (6), provided [15] -8p, [16]
applying a software procedure to calculate the coefficients of the series, using a software procedure for solving the problem using the recurrent operator method, provided that we obtain the following solutions [17, 182p.]
After obtaining the solution, we substitute the initial and boundary conditions in the program procedure [17]
Where where Vol-the volume of the parallelepiped in question;
The volume of the considered live section is equal to , , , l=2450m3, diffusion coefficients along coordinate axes ; ; , [ table 1] based on the wind speed of 15 m/s, we find the distribution of the emission of harmful impurities. The necessary data for modeling and forecasting are given in the table 1. The data in Table 1. are taken from the Newsletter on the state of the environment of Almaty and Almaty region [18, 5p.].
Here – the transfer rates of harmful impurities along the oh axis. nonconservative coefficients (s-1 ), some additions have been made in this article to clarify the units of measurement.
This unit of measurement is characteristic of substances whose impurities are rapidly destroyed in nature and includes the elements listed in Table 1. The exponential decay function is chosen to simulate emissions of harmful impurities. It should also be noted that if our model has an exponential decay function, this means that after 1.009 seconds the concentration will decrease by about e≈2.718 times, that is, after 3 seconds the substance will almost completely disappear.
3. Results and discussion
The obtained results of the study of modeling the distribution of emissions of harmful impurities from traffic congestion are shown in Figure 1 from a to d. The distribution of harmful impurities at the initial moment of time is shown in Figure 1a, where the initial moment of time at t=10s , emissions of harmful impurities are spreading along the ox axis. Also in Table 2. a calculation is given with respect to time, at t=10.20.30 s. Further, Figure 1b shows the spread of emissions of harmful impurities at t=20s; on the earth's surface at z=1.5 m; on the ox axis, x=0..1000, y=0..300; it is shown here that after passing a little time, the process of spreading harmful impurities increases slightly relative to the initial moment of time. But after a certain time, it begins to dissolve. Further, also in Figure 1c and Figure 1d, the results obtained with respect to the initial and final boundaries of the calculation of modeling processes along the coordinate axis oy, oz are also presented, the tables from show the results of modeling the spread of harmful impurities in the initial boundary and at the end of the volume of the living area under consideration. Figure 1d shows the process of resorption of emissions of harmful impurities closer to the final boundary, and here the particles of harmful impurities are dispersed over the surface at a distance of 50 cm from the ground, in 6 minutes.
4. Conclusions
The study revealed the need to adapt Almaty's road infrastructure to the pace of urban expansion. Many roads built in the 1990s, such as the section along Zhandosov Street to the intersection with Manas Street, do not meet modern standards. Narrow roadways and unregulated parking along the roads lead to serious congestion and increased pollutant emissions during peak hours. To address these issues, city authorities should prioritize road expansion in both existing and new areas, as well as implement stricter parking regulations. Implementing these measures will reduce traffic congestion, reduce air pollution, and improve the quality of the urban environment.
Conflict of interest statement
The authors declare that they have no conflict of interest inrelation to this research, whether financial, personal, authorship or otherwise, that could affect the research and its results presented in this paper
References
- Gasnikov, A.V.; Klenov, S.L.; Nurminsky, E.A.; Kholodov, Ya.A.; Shamray, N.B. Introduction to mathematical modeling of traffic flows: A textbook, 2nd edition; Moscow Publishing House of the ICNMO-2013; p. 215.
- Minkov, L.L.; Schrager, E.R. Basic approaches to the numerical solution of one-dimensional equations of gas dynamics. In The textbook; STT. Tomsk-2016.
- Tarasevich, Yu.Yu. Finding and visualizing self-similar solutions partial differential equations by means of Maple; Astrakhan, 2010; 23 p. [Google Scholar]
- Beketaeva, A.; Naimanova, A.; Zh. Flow structure of the transverse jet interaction with supersonic flow for moderate to high pressure ratios. International Journal of Mechanics Cited 10 times. 12, 88–95.
- Makasheva, A.P.; Naimanova, A.Z. Numerical simulation of a multicomponent mixing layer with solid particles. Thermophysics and Aeromechanics Cited 4 times. 2019, 26(4), 481–497. [Google Scholar] [CrossRef]
- Moisseyeva, Y.; Naimanova, A.; Beketaeva, A. Computation of transverse injection into supersonic crossflow with various boundary layer thickness. International Journal of Mechanics 11, 101–106.
- Smirnova, M.N.; Nikitin, V.F.; Pestov, D.A.; Zhu, Zuojin. Mathematical modeling of air pollution in city tunnels and evaluating mitigation strategies. Transportation Research Interdisciplinary Perspectives Volume 2020, 4, 100086. [Google Scholar] [CrossRef]
- Kenessary, D.; Kenessary, A.; Adilgireiuly, Z.; Akzholova, N.; Erzhanova, A.; Dosmukhametov, A.; Syzdykov, D.; Masoud†, Abdul-Razak; Saliev, Timur. Air Pollution in Kazakhstan and Its Health Risk Assessment. Annals of Global Health 2019, 85(1), 133, 1–9. [Google Scholar] [CrossRef] [PubMed]
- Piotr, Goł˛ebiowski, Jolanta ˙Zak and Ilona Jacyna-Gołda Approach to the Proecological Distribution of the Traffic Flow on the Transport Network from the Point of View of Carbon Dioxide. Sustainability 2020, 12, 6936.
- Issakhov, Alibek; Zhandaulet, Yeldos; Abylkassymova, Aizhan; Issakhov, Assylbek. A numerical simulation of air flow in the human respiratory system for various environmental conditions. [CrossRef] [PubMed]
- Issakhov, Alibek; Alimbek, Aidana; Issakhov, Assylbek. A numerical study for the assessment of air pollutant dispersion with chemical reactions from a thermal power plant. Engineering applications of computational fluid mechanics 2020, 14(№ 1), 1035–1061. [Google Scholar] [CrossRef]
- Pirniazova, P.M.; Koshanova, D. Mathematical Modeling to Estimate the Diffusion of Traffic–Related Air Pollutants in Almaty City. 2023 IEEE Smart Information Systems and Technologies (SIST) 4-, Astana, Kazakhstan, 6 May, 2023. [Google Scholar]
- Pirniazova, P. M. Mathematical modeling of environmentally unfavorable pollution foci: Monograph; Publishing house “Aitumar” Almaty, 2020; ISBN 978-601-332-842-3. [Google Scholar]
- Bondarenko, B. A.; Pirniazova, P. M. Normalized systems of functions and their applications to solving problems for diffusion equations. He will calculate the questions and applied mathematics; Tashkent–, 2009; Volume 119, pp. 39–49. [Google Scholar]
- Frolov, V.N. Special classes of functions in the anisotropic theory of elasticity; FAN Publishing House: Tashkent, 1981; p. 221. [Google Scholar]
- Spivakov, Yu.L. Special classes of solutions of linear differential equations and their applications to the anisotropic theory of elasticity; FAN Publishing House: Tashkent, 1986; p. 186. [Google Scholar]
- Kachiashvili, K. I.; Gordeziani, D. G.; Melikjanyan, D.I. Modern modeling and computer technologies for the study and quality of river water; GTU: Tbilisi, 2007; p. 251p. [Google Scholar]
- Newsletter on the state of the environment of the city of Almaty and Almaty region, Zhetisu region.
Figure 1.
The process of spreading emissions of harmful impurities along the x,y, z coordinate axes.
Figure 1.
The process of spreading emissions of harmful impurities along the x,y, z coordinate axes.
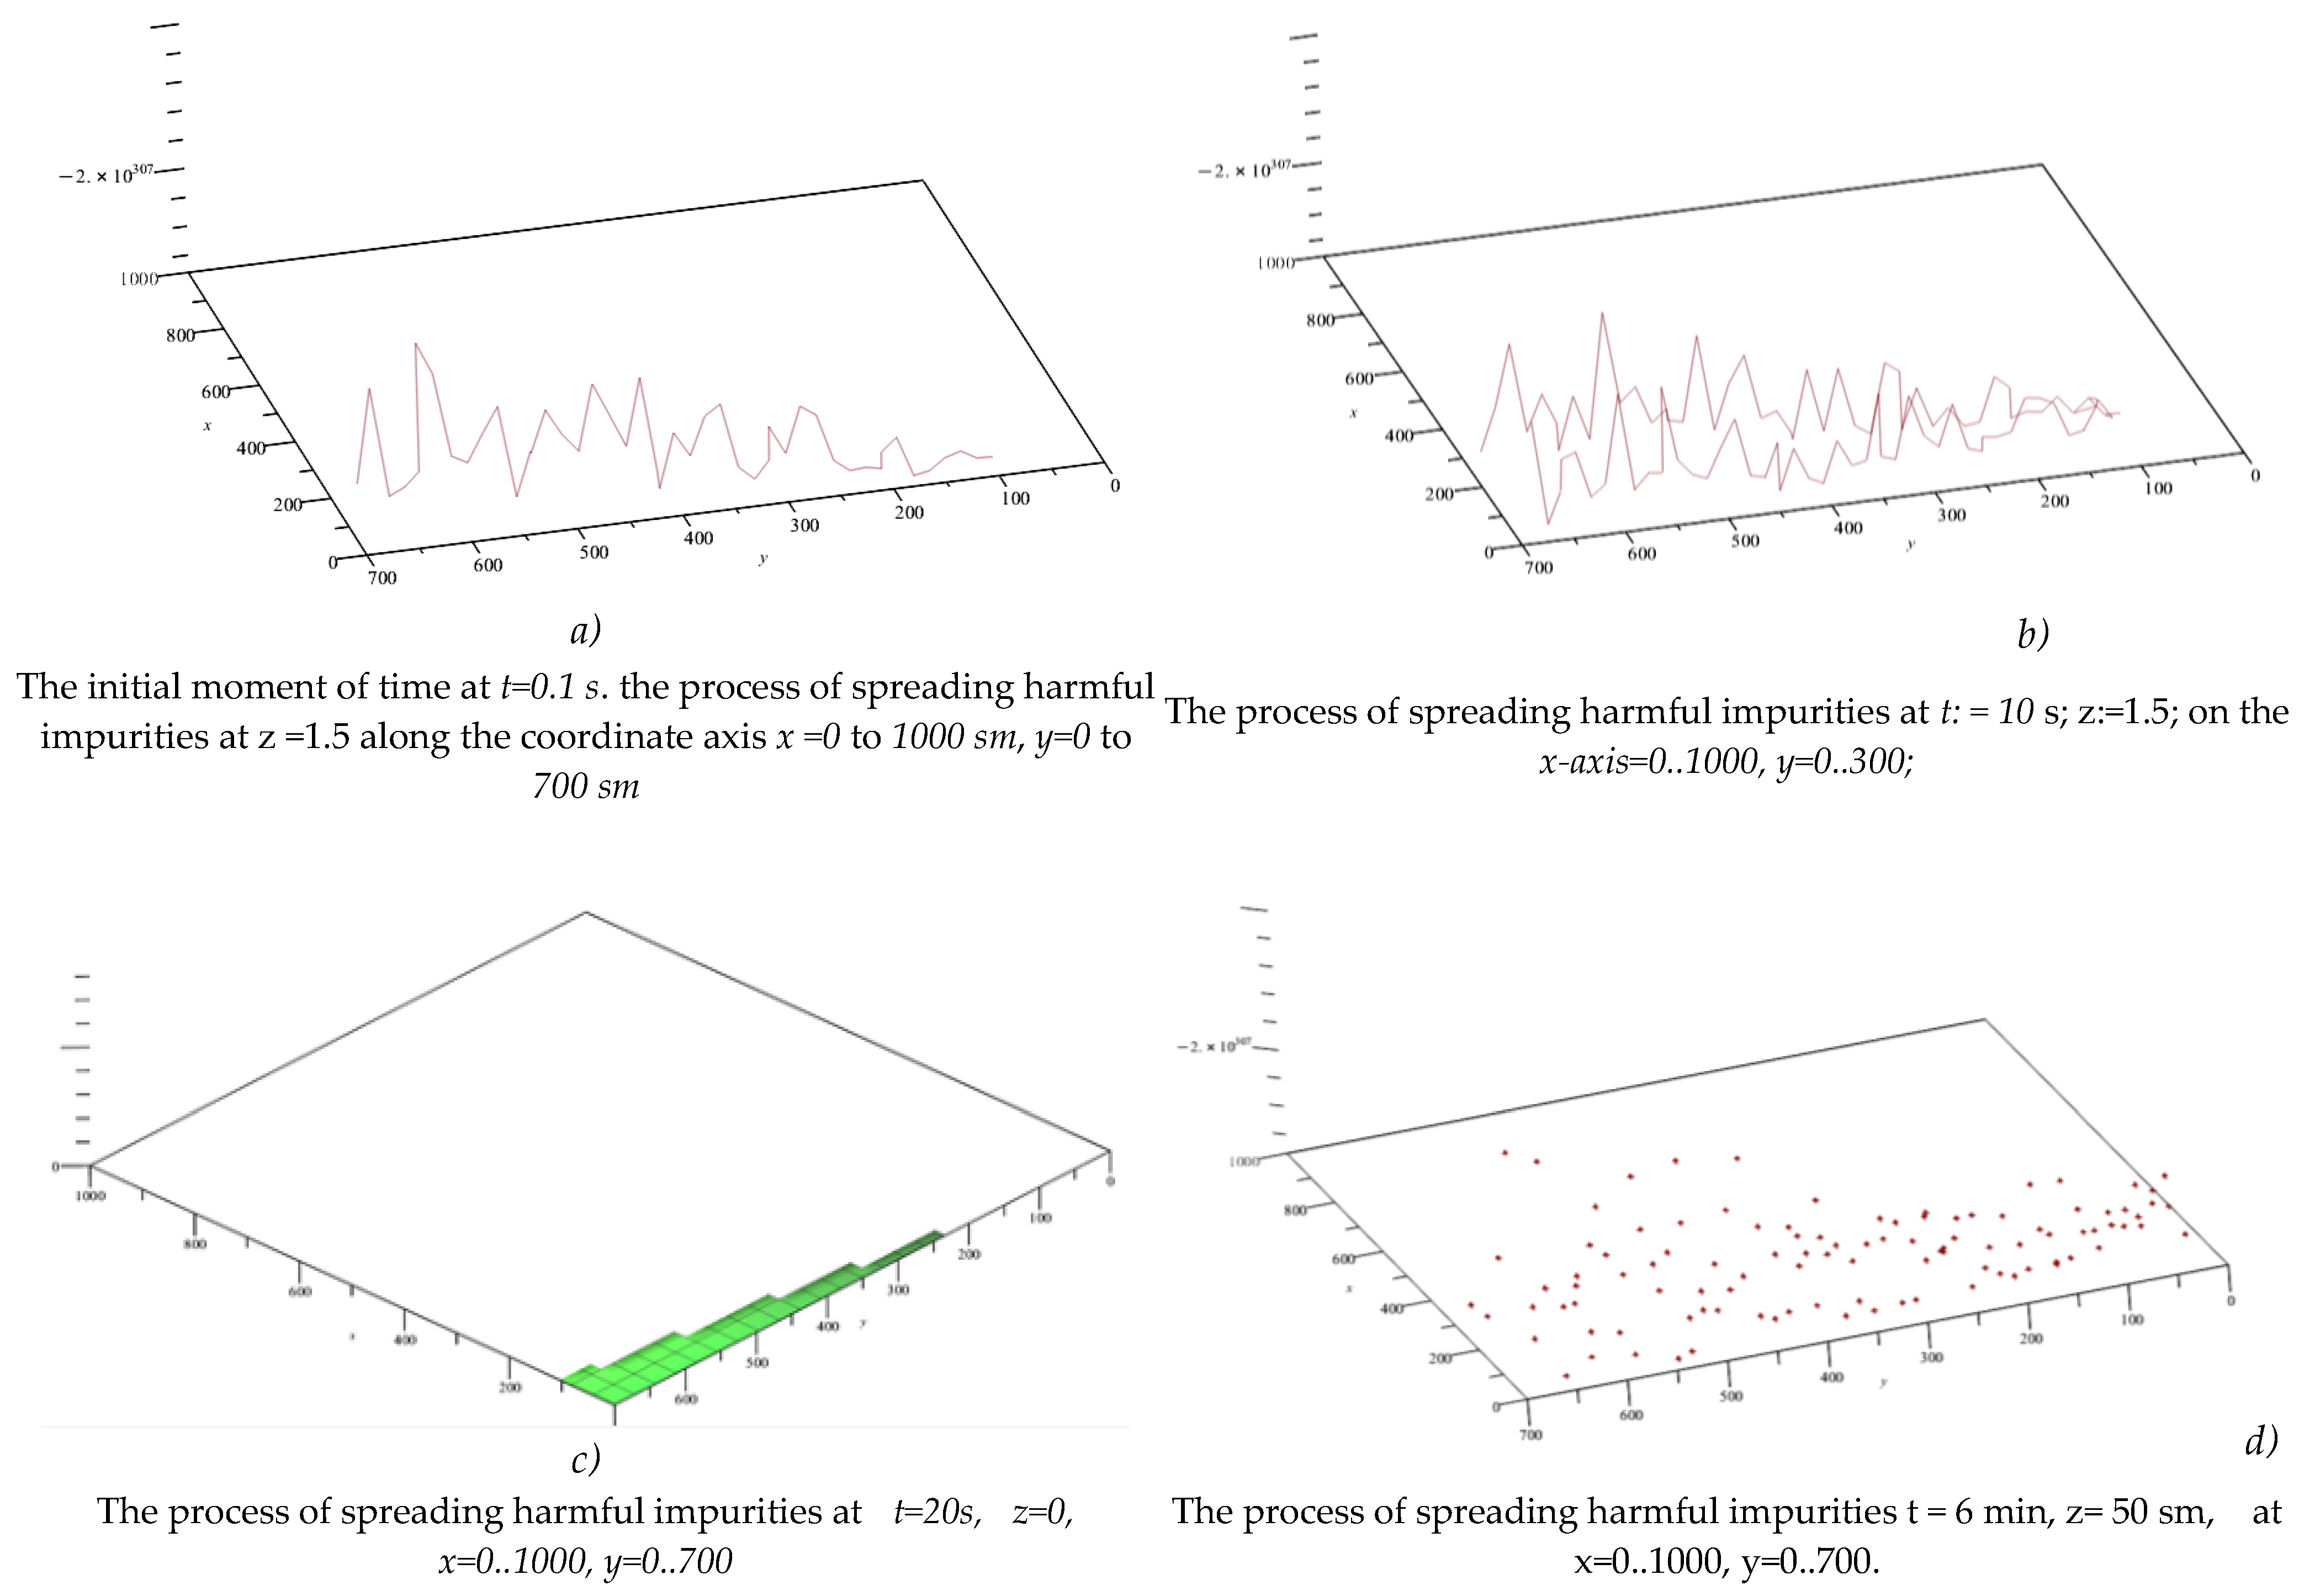

Table 1.
Concentration.
| Impurity | mg/m3 | The multipl. of MPC | mg/m3 | The multipl. of MPC |
|---|---|---|---|---|
| Carbon monoxide | 0.54 | 0.18 | 13.03 | 2.6 |
| Sulfur dioxide | 0.02 | 0.46 | 0.32 | 0.6 |
| Nitrogen dioxide | 0.04 | 1.3 | 0.86 | 4.3 |
| Nitric oxide | 0.003 | 0.55 | 0.68 | 0.68 |
Table 2.
Distribution of harmful impurities at the initial time.
| t,s | x·103, m | y·103, m | z·103m | q, mg/m3s |
|---|---|---|---|---|
| Study of the process at the initial moment of time | ||||
| 10 | 3 | 3 | 1.5 | |
| Study of a process with boundary conditions along the x-axis | ||||
| 10 | 0 | 3 | 1.5 | |
| 20 | 0 | 3 | 1.5 | |
| 20 | 3 | 3 | 1.5 | |
| 30 | 5 | 3 | 2 | |
| Study of a process with boundary conditions along the y-axis | ||||
| 10 | 1 | 0 | 1 | |
| 10 | 1 | 0 | 1.5 | |
| 20 | 3 | 0 | 1.3 | |
| 20 | 5 | 5 | 1.7 | |
| 30 | 5 | 7 | 2 | |
| Study of a process with boundary conditions along the z-axis | ||||
| 10 | 1 | 1 | 0 | |
| 10 | 1 | 3 | 0 | |
| 20 | 3 | 5 | 1 | |
| 20 | 5 | 5 | 1.5 | |
| 30 | 5 | 7 | 2.5 | |
Disclaimer/Publisher’s Note: The statements, opinions and data contained in all publications are solely those of the individual author(s) and contributor(s) and not of MDPI and/or the editor(s). MDPI and/or the editor(s) disclaim responsibility for any injury to people or property resulting from any ideas, methods, instructions or products referred to in the content. |
© 2025 by the authors. Licensee MDPI, Basel, Switzerland. This article is an open access article distributed under the terms and conditions of the Creative Commons Attribution (CC BY) license (http://creativecommons.org/licenses/by/4.0/).
Copyright: This open access article is published under a Creative Commons CC BY 4.0 license, which permit the free download, distribution, and reuse, provided that the author and preprint are cited in any reuse.


