
Submitted:
05 December 2025
Posted:
05 December 2025
You are already at the latest version
Abstract
Background: Non-coding RNAs (ncRNAs) have emerged as promising biomarkers for prostate cancer (PCa), yet evidence remains dispersed across heterogeneous studies and their regulatory context is seldom analyzed in an integrated manner. This study systematically maps ncRNAs reported as diagnostic biomarkers for PCa and characterizes their molecular interactions through in silico analyses. Methods: A comprehensive evidence-mapping strategy across major bibliographic databases identified 693 studies, of which 58 met eligibility criteria. Differentially expressed ncRNAs were extracted and classified by RNA type. Subsequently, miRNA–target prediction, miRNA–protein interaction network construction, and functional enrichment analyses were performed to explore the regulatory landscape of miRNA-associated proteins. Results: The final dataset included 4,500 participants (2,871 PCa cases and 2,093 controls) and reported 94 differentially expressed miRNAs, eight lncRNAs, and several circRNAs, snoRNAs, snRNAs, and piRNAs. In silico analyses predicted 13,493 miRNA–mRNA interactions converging on 4,916 unique target genes, with an additional 2,481 prostate tissue–specific targets. The miRNA–protein network comprised 845 nodes and 2,335 edges, revealing highly connected miRNAs (e.g., hsa-miR-16-5p, hsa-miR-20a-5p) and protein hubs (QKI, YOD1, TBL1XR1; prostate-specific CDK6, ACVR2B). Enrichment analysis showed strong overrepresentation of metabolic process–related GO terms and cancer-associated KEGG pathways. Conclusions: These findings refine the list of promising ncRNA biomarkers and highlight candidates for future clinical validation.
Keywords:
prostate cancer
; non-coding RNA
; miRNA
; lncRNA
; circRNA
; snoRNA
; piRNA
; diagnostic biomarkers
; in silico analysis
; miRNA–protein interaction network
1. Introduction
Prostate cancer (PCa) represents a major global health challenge, ranking as the second most common malignancy among men. In 2022, an estimated 1,467,854 new cases were diagnosed worldwide, and PCa-related mortality reached 7.3% in men [1]. Projections indicate that global incidence will increase by 64.9% by 2045 [2]. This accelerating burden is driven largely by population aging, genetic susceptibility, and environmental factors [3]. Consequently, the need for diagnostic tools capable of accurately identifying clinically relevant tumors continues to grow. Although PSA testing and related clinical evaluations have facilitated earlier detection, these methods still struggle to reliably discriminate between indolent and aggressive disease, often resulting in unnecessary biopsies and overtreatment [4].
Advances in precision oncology have driven the exploration of new biomarkers that could complement, refine, or surpass traditional diagnostic strategies. Among these, non-coding RNAs (ncRNAs) have emerged as powerful regulators of gene expression, influencing pathways associated with proliferation, androgen signaling, genomic instability, and cellular plasticity [5]. A notable example is PCA3, one of the first lncRNAs to be incorporated into clinical practice as a urinary biomarker, through the PROGENSA® PCA3 Assay, which was approved by the U.S. Food and Drug Administration on 13 February 2012 [6,7].
Despite their potential, the landscape of ncRNA biomarkers reported for PCa remains fragmented. Studies frequently differ in their methodological approaches, nomenclature, definitions of biomarker positivity, and criteria for clinical utility [8,9]. Moreover, the functional interactions linking ncRNAs with their downstream targets, particularly miRNA–mRNA and miRNA–protein regulatory axes, are rarely examined in a comprehensive or comparative manner. This limits the integration of existing findings into biologically coherent models and hinders the identification of high-priority candidates suitable for clinical translation.
The present study addresses these gaps through a two-step strategy. First, we conducted a systematic mapping of all ncRNAs reported as diagnostic biomarkers for PCa, consolidating evidence from original research across multiple platforms and sample types. Second, we performed a series of in silico analyses, including miRNA–target prediction, miRNA–protein interaction network, and functional enrichment analysis, to characterize the regulatory landscape associated with ncRNAs currently linked to PCa. This work provides a comprehensive overview of ncRNA-based biomarkers and their molecular context, offering new insights into their diagnostic potential and guiding future validation efforts.
2. Materials and Methods
2.1. Literature-driven biomarker selection
This literature search was conducted following the recommendations proposed by the Preferred Reporting Items for Systematic Reviews and Meta-Analysis (PRISMA 2020) statement [10] and the methodology was the same used for Albarracín-Navas et. al. 2024 [11].
2.1.1. Eligibility criteria
The include criteria were: samples of cases and controls in the adult population, men over 18 years of age with prostate cancer, that reported ncRNAs with differential expression associated with the diagnosis of this disease. In the case of articles that include transcriptomics data, only those that have their validation cohort were included. The exclude criteria were: In vivo, in vitro and in silico studies without validation cohort (only studies with a high level of evidence were included, excluding those lacking a validation cohort for the reported results); Gray literature, clinical trial protocols, systematic and other reviews, consensus documents, short communications, opinion pieces, letters to the editor, posters, conference proceedings, series, and case reports were excluded; Method studies, and bioinformatics tools were also excluded; Articles on patients with metastases, or treatment interventions; Differentially expressed genes related to risk, progression, recurrence; Proteing-coding genes were included in a previous study, thus excluded in this review. When the full text of the study was not available online, attempts were made to contact the corresponding author and libraries, and when this was not possible, the study was excluded. The selected primary articles, were published up to 09/24/2023.
2.1.2. Information sources and search strategy
The systematic search was carried out in bibliographic databases Medline (by PubMed), Web of Science, Scopus and Embase. Additionally, a broader search was performed, and the term diagnosis was deleted, this along with the manual search in the references of the selected articles, allowed to include related articles not found in the initial search. The search strategy in the bibliographic databases included free and controlled terms (MeSH), descriptors (DeSH), and Boolean operators AND, OR, and NOT (see Supplementary file, Sheet 1. Search Strategy).
2.1.3. Selection of articles
Authors (L.A.-N., and A.L.R.-C.) carried out an absolute, specific, independent and masked search in the bibliographic databases, discrepancies that arose were resolved by consensus. Duplicate articles were identified and removed (see supplementary file, Sheet 2). Subsequently, the researchers (L.A.-N., and E.G.) performed the selection by screening the title and abstract of the articles, according to the inclusion criteria, discarding those that did not meet at least one of these. When a discrepancy arose between the two reviewers, a third party (A.L.R.-C.) participated and determined the final status of the article. Subsequently, two reviewers (L.A.-N., and M.A.-B.) read the full text and any disagreements were resolved by a seventh reviewer (A.L.R.-C.), who issued the final decision.
2.1.4. Data collection process
A digital form was created using Microsoft Excel (version 15.24; 2016 Microsoft Corporation), and the relevant information from the articles with the variables under study was incorporated (see Supplementary file, sheet 6).
The following variables were studied: The design of the article, the country where the study was carried out, statistical methods, RNA analysis technique, biological sample and surgical treatment performed on the participants. A summary was prepared with the information from each article and among the extracted data were the digital object identifier (DOI), author, year of publication, p-value, Fold Change, population characteristics (number of cases, controls and total number of patients), age and the gene symbol. The information was retrieved independently by three reviewers (L.A.-N., M.A.-B., and A.L.R.-C.) and differences were resolved by two other reviewers (J. H.A.-R., and N.I.L.-S.).
2.2. In silico analysis
2.2.1. miRNA Target Predictions.
The miRNA obtained in the primary studies were searched in the Gene database from NCBI [12] for the official gene symbol identification (supplementary file sheet 7). Some primary studies did not identified the 5p or 3p miRNA origin, thus these information were searched in the supplementary data or deducted by the primers used in method section.
The web-based tools miRDB [13], TargetScan v8.0 [14] and miRTarBase v9.0 [15] were used for identifying the gene targets of the miRNAs reported, selecting only the target predicted in common by all tools (see supplementary file sheet 8). The filter Tissue Prostate was used in miRTarBase for the identification of tissue specific targets (see supplementary file sheet 9). The TargetScan (http://www.targetscan.org/vert_72/); miRDB (http://mirdb.org/); and miRTarBase (https://mirtarbase.cuhk.edu.cn/~miRTarBase/miRTarBase_2022/php/search.php), were accessed on 21 June 2025.
2.2.2. The miRNA–mRNA target interaction network analysis.
The miRNAs its target genes were included in STRING database v12 [16]. The STRING database provides a confidence score (from 0 to 1), which estimates the likelihood that an annotated interaction between a pair of proteins is biologically meaningful, specific and reproducible. In this case, a confidence score of 0.9 or greater were included, selecting the interaction type experimentally determined. The network was analyzed and displayed using the yFiles organic layout with Cytoscape v3.9.1 [17].
2.2.3. Network enrichment analysis.
3. Results
3.1. Evidence Mapping
A total of 693 articles were identified (Figure 1, supplementary file sheet 2). Of these, 161 duplicates articles were excluded. Others 363 articles did not meet the eligibility criteria during the screening of titles and abstracts (supplementary file sheet 3). The remaining 169 articles were analyzed by reading the full text, and 120 did not meet the eligibility criteria and were excluded (supplementary file sheet 4). Nine relevant articles were added from the manual search (supplementary file sheet 5), which raised the final count to 58 articles (supplementary file sheet 6).
Most of the articles did not report their study design (n = 54); the remaining were described as pilot (n = 2), case–control (n = 1), and retrospective (n = 1) studies. Although the majority did not specify an experimental design, they included both tumor and control samples. Most studies originated from Asia (n = 25) and Europe (n = 22), followed by North America (n = 7), South America (n = 2), and Africa (n = 2). The dataset comprised 4,500 participants (mean age = 65.0 ± 7.18 years), including 2,871 case samples (57.8%) and 2,093 control samples (42.1%). In certain studies, paired tumor and adjacent non-tumor tissues from the same patient were analyzed. Reported treatments comprised radical prostatectomy (n = 21) and simple prostatectomy (n = 4); in 33 studies, treatment information was not provided.
The samples used to detect differential expression included prostate tissue (n = 25), urine (n = 12), whole blood (n = 7), and serum (n = 4). In seven studies, two types of biological samples among those mentioned above were analyzed.
The most frequently used technique for differential expression analysis was reverse transcription followed by real-time quantitative polymerase chain reaction (RT-qPCR, also referred to as RT-PCR or qPCR) (n = 55), followed by microarray (n = 1) and NanoString (n = 1), while one study did not report the technique used.
The statistical methods used to assess differential expression included Student’s t-test (n = 24), the Mann–Whitney U test (n = 12), ANOVA (n = 6), logistic regression models (n = 4), Wilcoxon test (n = 3), Kruskal–Wallis test (n = 3), chi-square test (n = 2), and ROC analysis (n = 1). The remaining three studies did not specify the statistical method used.
The newly identified ncRNA molecular diagnostic biomarkers comprised microRNAs (miRNAs), long non-coding RNAs (lncRNAs), circular RNAs (circRNAs), small nucleolar RNAs (snoRNAs), and PIWI-interacting RNAs (piRNAs), which were reported in 32, 19, 4, 1, and 1 studies, respectively. One study reported more than one type of RNA biomarker (small nuclear RNA [ARNsn] and miRNAs).
3.2. The miRNA-based molecular diagnostic biomarkers
A total of 94 miRNAs showing significant differential expression (p < 0.05) were identified across 32 studies focused exclusively on miRNAs and one studies that analyzed both RNA types. The top five most significant miRNAs were miR-183-5p (p=4,33e-10), miR-205 (p=9,10e-10), miR-32-5p (p=8,5e-08), miR-187-3p (p=4,03e-07), and miR-9-5p (p=1,2e-06). In the case of fold change, the top five upregulated miRNAs (FC > 2) were miR-9-5p (FC = 8.8), miR-9-3p (FC = 6.29), miR-183-5p (FC = 6.2), miR-487b-3p (FC = 6.06), and miR-221-3p (FC = 5.47). Conversely, the top five downregulated miRNAs (FC < –2) were miR-181b-5p (FC = –19), miR-494-3p (FC = –5.22), miR-320a (FC = –4.2), miR-32-5p (FC = –4.11), and miR-3128 (FC = –4.06).
miR-145 was the most frequently reported miRNA, identified in five articles. It was followed by miR-141, miR-21-5p, and miR-32, each reported in four studies; miR-125b, miR-221, miR-16, and miR-375 were reported in three studies; while four miRNAs (miR-20a, miR-182-5p, miR-205, and miR-454) were reported in two articles. The remaining 59 miRNAs were mentioned in only one study (supplementary file sheet 6).
3.3. The lncRNA-based molecular diagnostic biomarkers
A total of eight lncRNA biomarkers showing significant differential expression (p < 0.05) were reported across 19 articles. All biomarkers were measured using RT-qPCR-based approaches. Among these, MYU (p = 0.0001) was detected in urine samples from 100 Chinese participants (59 cases and 41 controls); MIR22HG (p < 0.001) in tissue samples from 22 Chinese participants (13 cases and 9 controls); FR0348383 (p ≤ 0.001) in urine samples from 213 Chinese participants (72 cases and 141 controls); NEAT1 (p = 0.009, FC = 2.1) in plasma samples from 60 Romanian participants (37 cases and 23 controls); PCAT-1 (p ≤ 0.03) in plasma samples from 80 Iranian participants (40 cases and 40 controls), GAS5 (p=0.05) in tissue samples from 25 Chinese participants (14 cases and 11 controls); UCA1 (p=0.05, FC=18) in tissue samples from 10 Korean participants (10 tumor and 10 adjacent tissue) (supplementary file sheet 6).
Only PCA3 was reported in more than one article (n=12). The lncRNA PCA3 was measured in urine, blood, and tissue, showing significant differential expression in all cases (p≤0.05) and a fold change greater than 1 in the studies reporting it (n = 5). This up-regulation was consistently observed in prostate cancer cohorts from the United Kingdom, Italy, Brazil, the United States, Ukraine, Finland, Spain, and China, involving a total of 1357 participants (799 cases and 645 controls).
3.4. Other ncRNA-based molecular diagnostic biomarkers
Six studies reported circular RNAs (circRNAs), small nucleolar RNAs (snoRNAs), small nuclear RNAs (snRNAs), and PIWI-interacting RNAs (piRNAs). All biomarkers were validated in human samples using RT-qPCR-based methods and showed statistically significant differential expression (p < 0.05) (supplementary file sheet 6).
Among the circRNAs, circATXN10 (p = 0.0001), circSTIL (p = 0.003), circNFIA (p = 0.001; FC = 2.0), circZNF561 (p = 0.01; FC = -2.0), circABCC4 (p = 0.0001; FC = 2.31), circZNF577 (p = 0.037; FC = 1,56), circFAT3 (p = 0.0001; FC = -3.79), circITGA7 (p = 0.0001; FC = -2.96), and circATRNL1 (p = 0.0001; FC = -5,54) were identified across four studies, mainly using plasma and urine samples from Asian cohorts. In addition, the snoRNA SNORD78 (p < 0.0001) and its fragment sd78-3 (p = 0.0003) were found significantly up-regulated in prostate cancer tissue samples. One study also described the small nuclear RNA RNU1A-1 (p= < 0.030) as differentially expressed in tumor versus adjacent prostate tissue. In addition, one study reported four PIWI (piARN) as potential biomarkers, including piRNA002468 (p= 0.0068), piRNA349843 (p = 0.0151), piRNA382289 (p= 0.0084), and piRNA158533 (p= 0.0383), all of which were significantly up-regulated in prostate cancer tissue compared to controls (supplementary file sheet 6).
3.5. miRNA–mRNA target prediction
Of the 94 miRNAs identified across the primary studies, 66 had sufficient annotation to be included in the downstream in silico analysis, and 56 were successfully matched within the miRNA–target prediction platforms (Supplementary File, Sheet 7). A total of 13,493 miRNA–mRNA interactions were predicted in common by miRDB, TargetScan v8.0, and miRTarBase v9.0, corresponding to 4,916 unique target genes (Supplementary File, Sheet 8). In addition, 4,669 interactions were common identified as prostate tissue–specific, yielding 2,481 unique predicted targets (Supplementary File, Sheet 9).
3.6. The miRNA–Protein interaction network
We conducted a miRNA–protein interaction network analysis using the protein-coding gene targets of the miRNAs reported as differentially expressed in patients with PCa. A total of 4,916 + 2,481 predicted targets were used as input for the STRING database. Non-protein-coding targets and non-connected nodes (after restricting the network to experimentally validated interactions with a confidence score ≥ 0.9) were removed from subsequent analyses. This filtering resulted in 1,014 and 641 protein-target nodes in the unfiltered analysis (Supplementary File, Sheet 8) and the prostate tissue–specific analysis (Supplementary File, Sheet 9), respectively, yielding 1,311 unique protein targets in total. These unique proteins were subsequently re-entered into STRING to obtain the final interaction data. (Supplementary File, Sheet 10).
The resulting protein interaction network contained 1051 nodes and 1676 edges, comprising a main connected component with 738 nodes and 1398 edges, along with several smaller disconnected sub-networks. For downstream analyses, only the nodes belonging to the main connected component were retained (Supplementary File, Sheet 10). The information for the miRNAs targeting the proteins included in the network was retrieved, and a miRNA–protein interaction network was subsequently generated.
The miRNA–protein interaction network comprised 845 nodes and 2335 edges (Figure 2, and Supplementary File, Sheet 11 and 12). The most highly connected miRNA in the network was hsa-miR-16-5p (142 edges), followed by hsa-miR-20a-5p, hsa-miR-96-5p, hsa-miR-181b-5p, hsa-miR-32-5p, hsa-miR-182-5p, hsa-miR-454-3p, and hsa-miR-200c-3p, all of which displayed more than 100 edges.
3.7. Network enrichment analysis.
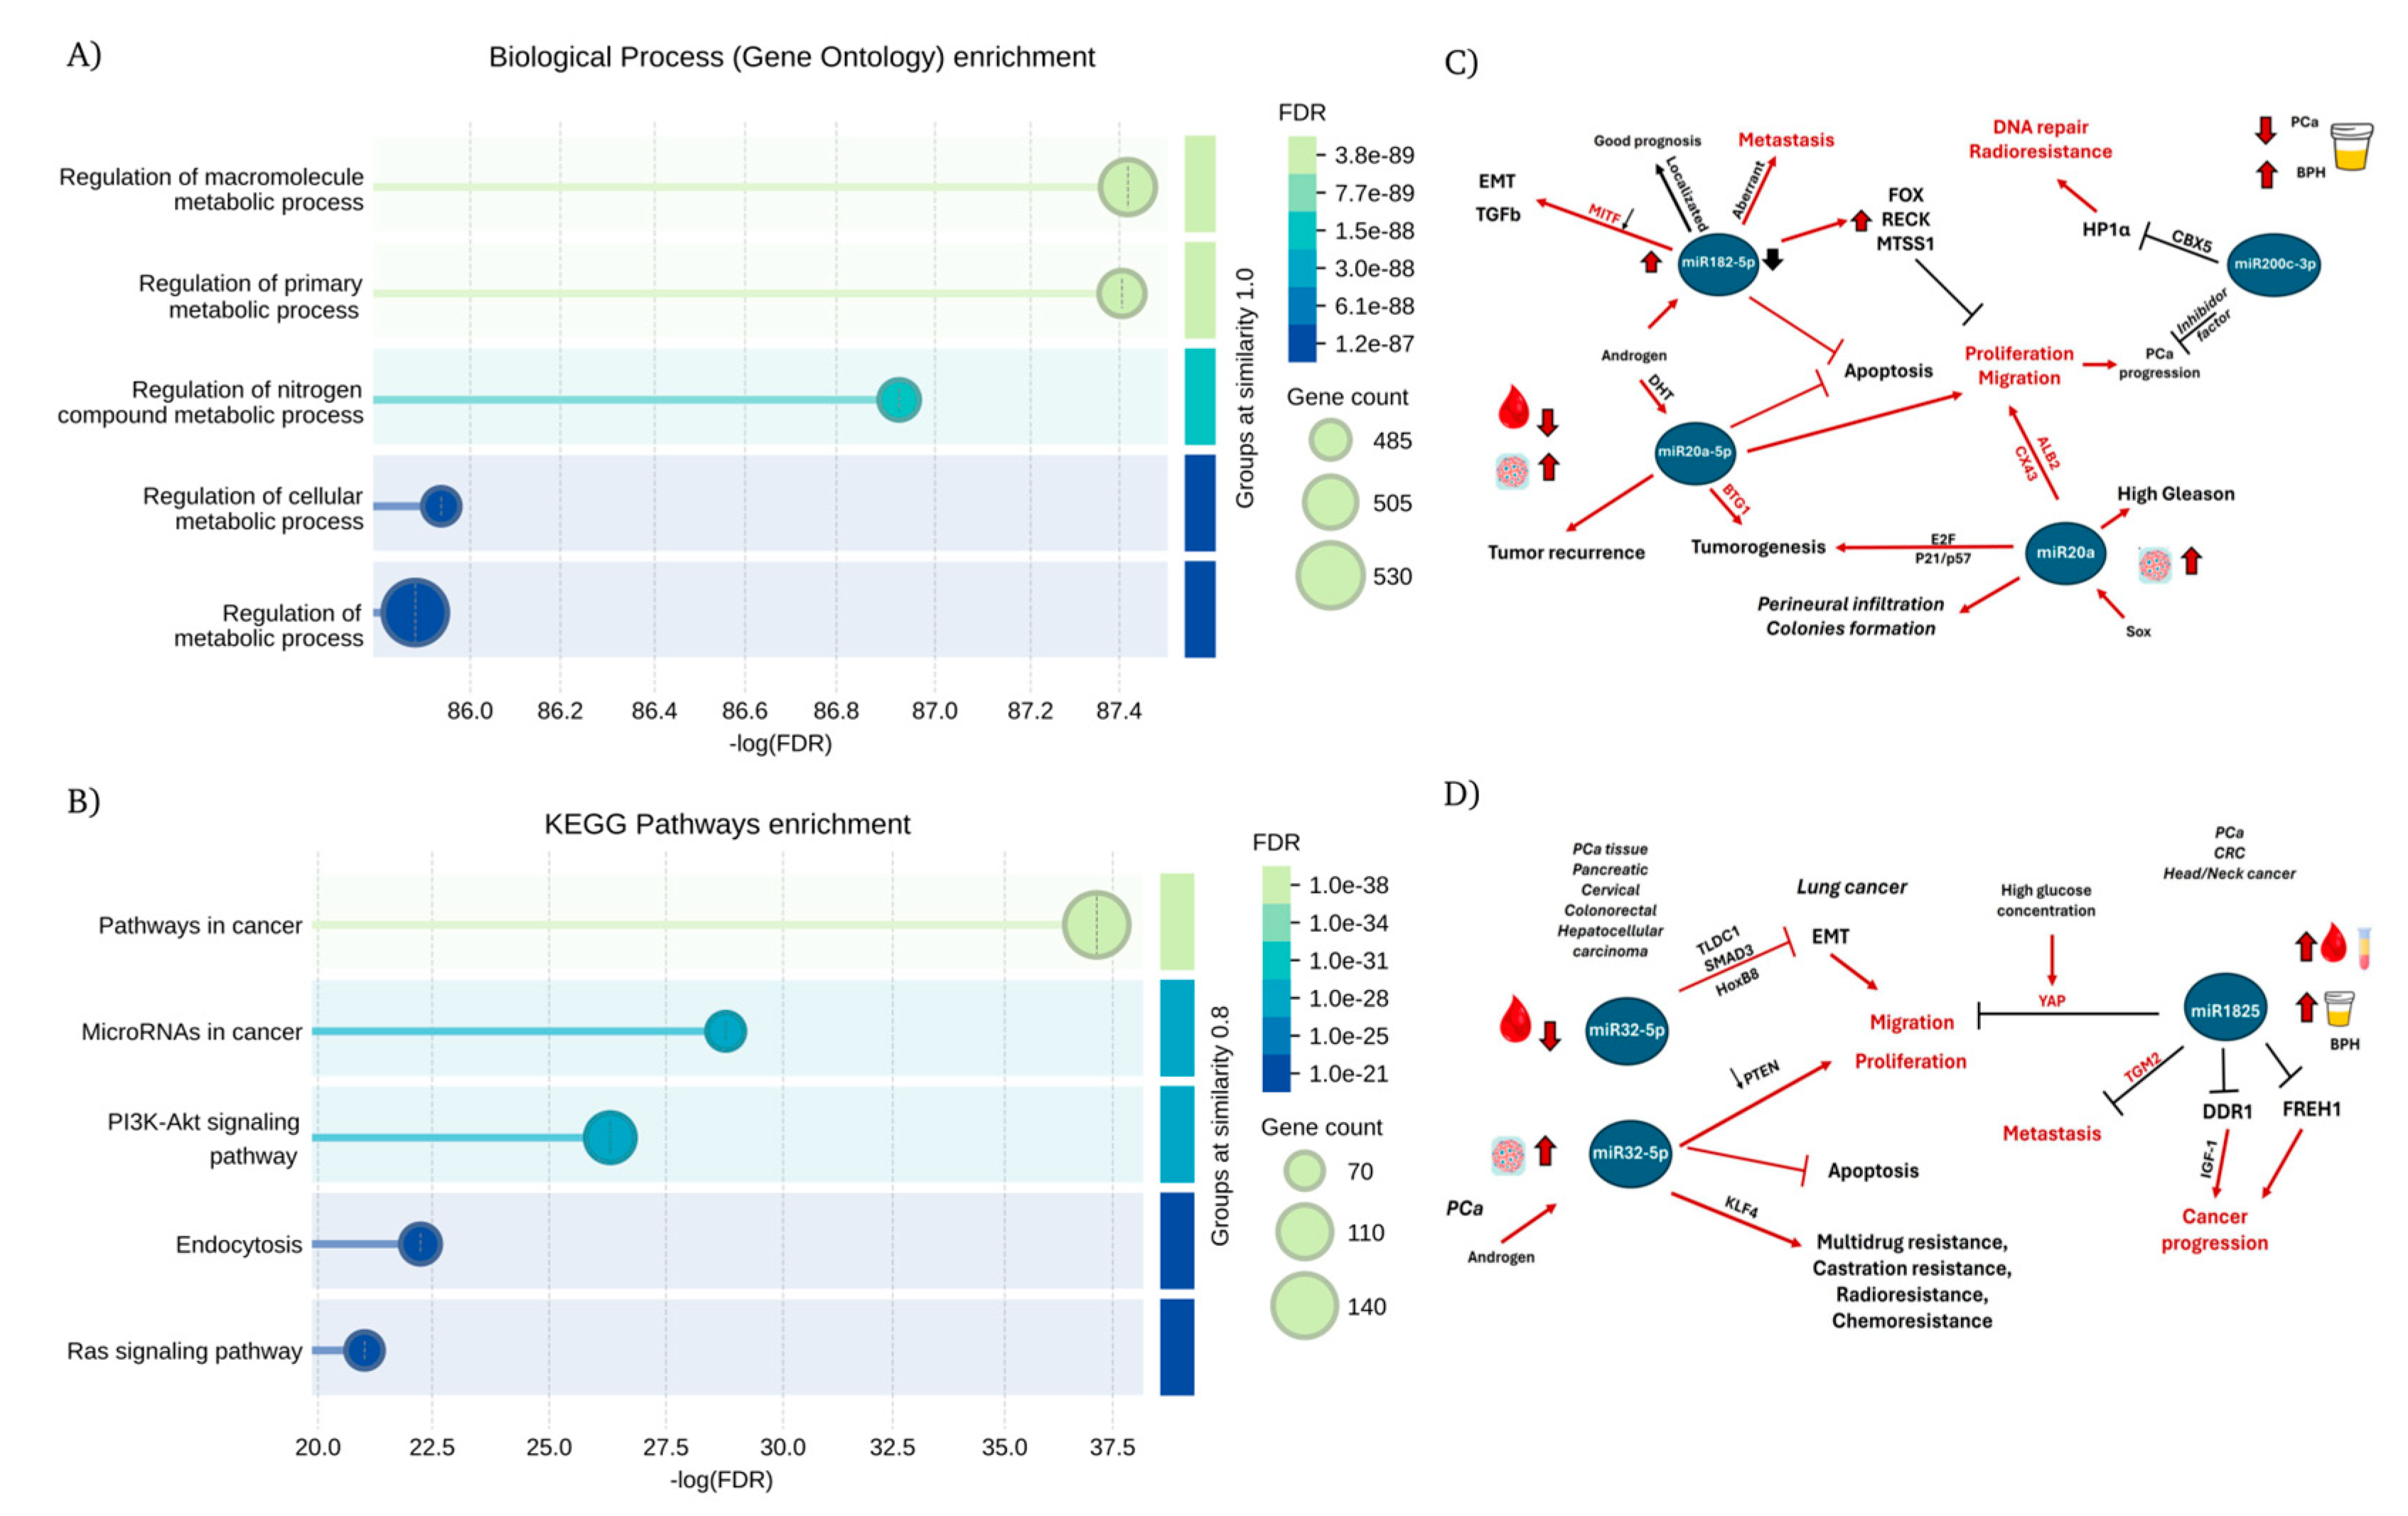
A total of 1,311 unique protein targets were submitted to the STRING database for network enrichment analysis, yielding a highly significant PPI enrichment p-value < 1.0 × 10⁻¹⁶ (Supplementary File, Sheet 13). A total of 2,342 Gene Ontology (GO) terms were significantly enriched (FDR < 0.05), including 1,808 Biological Process, 311 Cellular Component, and 223 Molecular Function terms. Among these, metabolic process–related GO categories were the most prominently enriched (Figure 2 A). In the KEGG pathway analysis, 174 KO terms were significantly up-regulated (FDR < 0.05), with miRNA in cancer, and cancer-associated pathways ranked among the top five enriched categories (Figure 2 B).
4. Discussion
This study provides an integrated overview of non-coding RNAs proposed as diagnostic biomarkers for prostate cancer, combining evidence mapping with an in silico analysis of the miRNA regulatory landscape. From 58 primary studies, we identified 94 differentially expressed miRNAs, representing the most extensively studied ncRNA class, along with eight lncRNAs, of which PCA3 showed the greatest consistency across sample types. Other ncRNA categories remain less explored. By integrating validated miRNAs with their predicted targets, we identified the miRNAs with the strongest influence within biological networks and highlighted key protein targets that may represent promising candidates for future clinical biomarker studies.
Most studies originated from Asia and Europe, which means the current ncRNA biomarker landscape does not fully reflect the global molecular profile of prostate cancer. This geographic concentration may influence the patterns observed, since population-specific genetic and environmental factors can affect ncRNA expression [20]. Regions such as Africa and South America remain underrepresented, underscoring the need for broader sampling to develop diagnostic signatures that are applicable across diverse populations. Most studies also included small sample sizes, which restricts the generalization of the reported ncRNA biomarkers. Furthermore, only a few articles reported diagnostic metrics such as specificity, sensitivity, or AUC values, making it difficult to assess the true clinical performance of these candidates. Larger and better standardized studies are needed to confirm their diagnostic value.
In this context, and given that most of the available evidence is concentrated on miRNAs, our findings help prioritize candidates for future clinical validation. The 8 miRNAs emerged as central nodes in the interaction network, suggesting that they may play key regulatory roles and represent high-priority biomarkers for subsequent diagnostic studies.
The most connected node in the network was miR-16, validated in three different populations. In South African patients (24 PCa and 10 BPH), the miR-194-5p/miR-16-5p ratio correlated with disease severity and was proposed as a diagnostic biomarker [21]. A small U.S. study also found significant differences in miR-16 expression between normal and PCa epithelium (p < 0.05) and between normal epithelium and stromal tissue (p < 0.01), miR-16 was down-regulated in PCa epithelium and up-regulated in stroma [22]. In German serum samples from 55 patients, miR-16 was upregulated in PCa and decreased significantly after radical prostatectomy [23]. Despite these findings, miR-16 is still commonly used as an endogenous qPCR normalizer [24], even though PCa cell studies show marked down-regulation of miR-16-5p and functional targeting of AR and EGFR, both closely linked to prostate cancer biology [25].
In addition, hsa-miR-20a-5p was the second most connected node in the network. Its validation has been reported in two independent studies. In a U.S. cohort, hsa-miR-20a-5p was down-regulated in blood samples from 28 prostate cancer patients compared to 12 healthy controls [26]. In contrast, a study from Iran found increased serum levels of hsa-miR-20a-5p in 40 PCa patients compared to 40 non-cancerous volunteers, with a significant reduction after surgery [27]. These findings suggest that the direction of change may depend on sample type and clinical context of the studied population. Finally, the third most connected node was hsa-miR-96-5p, which has been validated in tissue samples in a single study from Poland involving 23 prostate cancer and 22 benign prostatic hyperplasia cases. In this cohort, hsa-miR-96-5p was down-regulated in PCa and showed a negative correlation with Gleason score [28].
An important observation is that the miRNAs most frequently reported in clinical studies did not necessarily correspond to the most influential nodes in the interaction network. Of the 12 miRNAs validated in more than one study, only four (miR-16, miR-20a, miR-182-5p, and miR-454) showed more than 100 network connections. The remaining four highly connected hubs appeared in only a single study. This mismatch shows that clinical replication and network centrality represent different dimensions of biomarker relevance and highlights the need to integrate both types of evidence when prioritizing miRNAs for future diagnostic validation.
In the proteins predicted as miRNA targets, the most highly connected prostate-associated protein in the network was CDK6, a catalytic subunit of the cyclin-dependent kinase complex that regulates G1 phase progression and the G1/S cell cycle transition. Altered expression of CDK6 has been reported in several human cancers [29]. In our interaction network, CDK6 was targeted by 14 miRNAs validated in prostate cancer, including the network hub hsa-miR-16-5p. Other highly connected proteins included ACVR2B (13 edges) and CRKL (12 edges), which were linked to most of the miRNA hubs, but currently have limited evidence supporting a specific role in prostate cancer. In the case of the top ten non–prostate-specific protein targets with the highest connectivity in the network, ITGB8, YOD1, and RNF38 were also identified as targets of several miRNA hubs. Although these proteins have limited evidence linking them to prostate cancer (Table S1), their strong network connectivity suggests that they may represent novel candidates for future investigation.
Regarding the results of the network enrichment analysis, the predicted protein targets of the validated miRNAs showed significant enrichment in pathways such as miRNAs in cancer, PI3K–Akt signaling, and androgen-related pathways. These pathways are central to prostate tumorigenesis [30]. The PI3K–Akt axis and androgen receptor signaling interact extensively during prostate cancer progression, influencing cell proliferation, survival, and metabolic adaptation. Several of the miRNA hubs identified in our network have previously been associated with these regulatory circuits. Overall, these findings indicate that the most influential miRNAs converge on biological processes known to promote tumor growth and metabolic reprogramming in prostate cancer, reinforcing their potential relevance as diagnostic biomarkers.
In this way, the functional implications of these miRNA hubs are further illustrated in Figure 3 C, and D. These diagrams summarize the pathway-level effects of the most influential miRNAs identified in the network, showing whether their activity leads to pathway activation or inhibition. Together, these visual maps highlight how miR-20a-5p [31], miR-1825p [32-36], miR-182-5p [37,38], miR-200c-3p [39-41], and miR-32-5p [26,42-44] converge on key oncogenic circuits including proliferation, migration, apoptosis resistance, EMT, and therapy resistance, by modulating targets such as PTEN, E2F, FOX, RECK, and DDR1, complementing the enrichment analysis and reinforcing their potential biological relevance in PCa.
Several authors have reported both proto-oncogenic and tumor-suppressive activities for different miRNAs, underscoring their dual roles in different cancer, whereas their concentration and localization (blood or tissue) could induce a differential response not only as indicators of disease severity but also as candidates for identifying therapeutic vulnerabilities that may help guide more precise diagnostic and therapeutic strategies [30-44]. Overall, the visual maps complement the enrichment analysis by revealing how these miRNA hubs orchestrate key molecular circuits involved in tumor progression, recurrence, and therapeutic resistance, highlighting their potential as both mechanistic indicators and targets for precision-based interventions in prostate cancer.
Clinically, our findings support the development of multimarker diagnostic panels that integrate the most influential miRNAs with established indicators such as PSA to improve specificity and reduce unnecessary biopsies. The convergence of miRNA hubs on key prostate cancer pathways also highlights the potential of biologically informed panels over single biomarkers. To advance these candidates toward clinical implementation, future research should rely on large, multicenter and multiethnic cohorts and apply standardized analytical and reporting frameworks. Such efforts will be crucial to validate the robustness and generalization of ncRNA-based diagnostics.
This study has several limitations. The in silico analyses depend on database annotations and prediction algorithms, so the identified interactions require experimental confirmation. We did not perform laboratory validation, which limits the direct biological verification of the predicted targets. In addition, the primary studies included showed considerable variability in analytical platforms, sample processing, and normalization methods, which may introduce heterogeneity and batch effects. These factors, together with the generally small sample sizes, reduce comparability across studies and highlight the need for standardized approaches in future research.
5. Conclusions
This study provides a comprehensive integration of clinical evidence and in silico analyses to characterize non-coding RNAs associated with prostate cancer diagnosis. By synthesizing data from 58 primary studies, we identified 94 validated miRNAs, eight lncRNAs, and other minority additional ncRNA classes. The network-based analysis revealed eight miRNAs with high regulatory centrality and identified key protein targets and enriched pathways that align with known mechanisms of prostate tumorigenesis. Together, these results help refine the list of promising biomarker candidates and highlight potential new molecules and pathways for investigation. Future work should focus on validating these candidates c and on evaluating their performance in biologically informed multimarker panels that complement existing diagnostic tools such as PSA.
Supplementary Materials
The following supporting information can be downloaded at the websitew of this paper posted on Preprint.org. Figure S1: Protein–Protein Interaction Network derived from miRNA predicted target genes; Table S1. The top ten connected proteins in the network ordered by degree; Table 2. The top ten highly connected prostate-associated proteins in the network ordered by degree; References_Systematic_Review.pdf; Supplementary File.xlsx; ncRNA_Prostate.cys.
Author Contributions
Literature-driven methodology L.A.-N., E.G., M.A.-B., J. H.A.-R., N.I.L.-S, and A.L.R.-C. In silico methodology, J. H.A.-R., N.I.L.-S, and A.L.R.-C.; data curation, J. H.A.-R., N.I.L.-S; writing—original draft preparation, A.L.R.-C.; writing—review and editing, L.A.-N., M.A.-B., J. H.A.-R., N.I.L.-S, and A.L.R.-C. Conceptualization, supervision, project administration, and funding acquisition, A.L.R.-C. All authors have read and agreed to the published version of the manuscript.
Funding
ANID FONDAP 152220002 (CECAN).
Institutional Review Board Statement
“Not applicable”.
Informed Consent Statement
“Not applicable.”.
Data Availability Statement
Data Availability Statements are available in section “MDPI Research Data Policies” at https://www.mdpi.com/ethics.
Conflicts of Interest
“The authors declare no conflicts of interest.”.
Abbreviations
The following abbreviations are used in this manuscript:
| ACVR2B | Activin A receptor type IIB |
| ANOVA | Analysis of Variance |
| AUC | Area Under the Curve |
| BPH | Benign Prostatic Hyperplasia |
| CDK6 | Cyclin-Dependent Kinase 6 |
| circRNA | Circular RNA |
| DDR1 | Discoidin Domain Receptor 1 |
| EMT | Epithelial–Mesenchymal Transition |
| FG | Fold Change |
| FDR | False Discovery Rate |
| FOX | Forkhead Box Transcription Factors |
| GO | Gene Ontology |
| KEGG | Kyoto Encyclopedia of Genes and Genomes |
| lncRNA | Long Non-Coding RNA |
| miRNA | microRNA |
| ncRNA | Non-Coding RNA |
| PCa | Prostate Cancer |
| PCA3 | Prostate Cancer Antigen 3 |
| PI3K | Phosphoinositide 3-Kinase |
| piRNA | PIWI-Interacting RNA |
| PRISMA | Preferred Reporting Items for Systematic Reviews and Meta-Analyses |
| PSA | Prostate-Specific Antigen |
| PTEN | Phosphatase and Tensin Homolog |
| qPCR | Quantitative Polymerase Chain Reaction |
| RT-qPCR | Reverse Transcription Quantitative Polymerase Chain Reaction |
| QKI | Quaking Homolog |
| RNU1A-1 | RNA, U1 Small Nuclear 1A |
| ROC | Receiver Operating Characteristic |
| snoRNA | Small Nucleolar RNA |
| snRNA | Small Nuclear RNA |
| STRING | Search Tool for the Retrieval of Interacting Genes/Proteins |
| TBL1XR1 | Transducin Beta-Like 1 X-Linked Receptor 1 |
| UCA1 | Urothelial Cancer Associated 1 |
References
- Bray, F.; Laversanne, M.; Sung, H.; Ferlay, J.; Siegel, R. L.; Soerjomataram, I.; amp; Jemal, A. Global cancer statistics 2022: GLOBOCAN estimates of incidence and mortality worldwide for 36 cancers in 185 countries. CA: a cancer journal for clinicians 2024, 74, 229–263. [Google Scholar] [CrossRef]
- International Agency for Research on Cancer. GLOBOCAN 2022: Estimated Cancer Incidence, Mortality and Prevalence Worldwide in 2022; IARC: Lyon, France, 2022; Available online: https://gco.iarc.who.int (accessed on 25 October 2025).
- Bergengren, O.; Pekala, K.R.; Matsoukas, K.; Fainberg, J.; Mungovan, S.F.; Bratt, O.; Bray, F.; Brawley, O.; Luckenbaugh, A.N.; Mucci, L.; Morgan, T.M.; Carlsson, S.V. 2022 Update on Prostate Cancer Epidemiology and Risk Factors-A Systematic Review. European urology 2023, 84, 191–206. [Google Scholar] [CrossRef]
- Raychaudhuri, R.; Lin, D.W.; Montgomery, R.B. Prostate Cancer: A Review. JAMA 2025, 333, 1433–1446. [Google Scholar] [CrossRef]
- Abdelmonem, H.B.; Kamal, L.T.; Wardy, L.W.; Ragheb, M.; Hanna, M.M.; Elsharkawy, M.; Abdelnaser, A. Non-Coding RNAs: Emerging Biomarkers and Therapeutic Targets in Cancer and Inflammatory Diseases. Front. Oncol. 2025, 15, 1534862. [Google Scholar] [CrossRef]
- Ahamed, Y.; Hossain, M.; Baral, S.; Al-Raiyan, A.U.; Ashraf, S.B.; Sun, W. The Research Progress on Diagnostic Indicators Related to Prostate-Specific Antigen Gray-Zone Prostate Cancer. BMC Cancer 2025, 25, 1264. [Google Scholar] [CrossRef]
- U.S. Food and Drug Administration. P100033: PROGENSA PCA3 Assay—Premarket Approval. Available online: https://www.accessdata.fda.gov/cdrh_docs/pdf10/P100033A.pdf (accessed on 10 June 2025).
- Bijnsdorp, I.V.; van Royen, M.E.; Verhaegh, G.W.; Martens-Uzunova, E.S. The Non-Coding Transcriptome of Prostate Cancer: Implications for Clinical Practice. Mol. Diagn. Ther. 2017, 21, 385–400. [Google Scholar] [CrossRef] [PubMed]
- Li, Y.; Tang, X.; Wang, B.; Chen, M.; Zheng, J.; Chang, K. Current Landscape of Exosomal Non-Coding RNAs in Prostate Cancer: Modulators and Biomarkers. Noncoding RNA Res. 2024, 9, 1351–1362. [Google Scholar] [CrossRef] [PubMed]
- Page, M.J.; McKenzie, J.E.; Bossuyt, P.M.; Boutron, I.; Hoffmann, T.C.; Mulrow, C.D.; Shamseer, L.; Tetzlaff, J.M.; Akl, E.A.; Brennan, S.E.; et al. The PRISMA 2020 Statement: An Updated Guideline for Reporting Systematic Reviews. BMJ 2021, 372, n71. [Google Scholar] [CrossRef] [PubMed]
- Albarracín-Navas, L.; Almonte-Becerril, M.; Guerrero, E.; Rivadeneira, J.; Telechea-Fernández, M.; Guzmán, E.; Calderón, F.; Hernández-Leal, M.J.; Otzen, T.; Manterola, C.; Duque, G.; Riffo-Campos, Á.L. Differential Protein-Coding Gene Expression Profile in Patients with Prostate Cancer. Biomedicines 2024, 12, 2509. [Google Scholar] [CrossRef]
- Gene Database. Available online: https://www.ncbi.nlm.nih.gov/gene/ (accessed on 3 November 2025).
- Chen, Y.; Wang, X. miRDB: An Online Database for Prediction of Functional microRNA Targets. Nucleic Acids Res. 2020, 48, D127–D131. [Google Scholar] [CrossRef]
- Agarwal, V.; Bell, G.W.; Nam, J.W.; Bartel, D.P. Predicting Effective microRNA Target Sites in Mammalian mRNAs. eLife 2015, 4, e05005. [Google Scholar] [CrossRef] [PubMed]
- Huang, H.Y.; Lin, Y.C.; Li, J.; Huang, K.Y.; Shrestha, S.; Hong, H.C.; Tang, Y.; Chen, Y.G.; Jin, C.N.; Yu, Y.; et al. miRTarBase 2020: Updates to the Experimentally Validated microRNA–Target Interaction Database. Nucleic Acids Res. 2020, 48, D148–D154. [Google Scholar] [CrossRef] [PubMed]
- Szklarczyk, D.; Kirsch, R.; Koutrouli, M.; Nastou, K.; Mehryary, F.; Hachilif, R.; Gable, A.L.; Fang, T.; Doncheva, N.T.; Pyysalo, S.; et al. The STRING Database in 2023: Protein–Protein Association Networks and Functional Enrichment Analyses for Any Sequenced Genome of Interest. Nucleic Acids Res. 2023, 51, D638–D646. [Google Scholar] [CrossRef] [PubMed]
- Shannon, P.; Markiel, A.; Ozier, O.; Baliga, N.S.; Wang, J.T.; Ramage, D.; Amin, N.; Schwikowski, B.; Ideker, T. Cytoscape: A Software Environment for Integrated Models of Biomolecular Interaction Networks. Genome Res. 2003, 13, 2498–2504. [Google Scholar] [CrossRef]
- The Gene Ontology Consortium. Expansion of the Gene Ontology Knowledgebase and Resources. Nucleic Acids Res. 2017, 45, D331–D338. [Google Scholar] [CrossRef]
- Kanehisa, M.; Furumichi, M.; Sato, Y.; Matsuura, Y.; Ishiguro-Watanabe, M. KEGG: Biological Systems Database as a Model of the Real World. Nucleic Acids Res. 2025, 53, D672–D677. [Google Scholar] [CrossRef]
- Kabassum, R.; Nath, A.; Preininger, M.; Gibson, G. Geographical, Environmental and Pathophysiological Influences on the Human Blood Transcriptome. Curr. Genet. Med. Rep. 2013, 1, 203–211. [Google Scholar] [CrossRef]
- Temilola, D.O.; Wium, M.; Paccez, J.; Salukazana, A.S.; Otu, H.H.; Carbone, G.M.; Kaestner, L.; Cacciatore, S.; Zerbini, L.F. Potential of miRNAs in Plasma Extracellular Vesicle for the Stratification of Prostate Cancer in a South African Population. Cancers 2023, 15, 3968. [Google Scholar] [CrossRef]
- Nonn, L.; Vaishnav, A.; Gallagher, L.; Gann, P.H. mRNA and micro-RNA Expression Analysis in Laser-Capture Microdissected Prostate Biopsies: Valuable Tool for Risk Assessment and Prevention Trials. Exp. Mol. Pathol. 2010, 88, 45–51. [Google Scholar] [CrossRef]
- Mahn, R.; Heukamp, L.C.; Rogenhofer, S.; von Ruecker, A.; Müller, S.C.; Ellinger, J. Circulating microRNAs (miRNA) in Serum of Patients with Prostate Cancer. Urology 2011, 77, 1265.e9–1265.e16. [Google Scholar] [CrossRef]
- Lange, T.; Stracke, S.; Rettig, R.; Lendeckel, U.; Kuhn, J.; Schlüter, R.; Rippe, V.; Endlich, K.; Endlich, N. Identification of miR-16 as an Endogenous Reference Gene for the Normalization of Urinary Exosomal miRNA Expression Data from CKD Patients. PLoS ONE 2017, 12, e0183435. [Google Scholar] [CrossRef] [PubMed]
- Rezaei, S.; Jafari Najaf Abadi, M.H.; Bazyari, M.J.; Jalili, A.; Kazemi Oskuee, R.; Aghaee-Bakhtiari, S.H. Dysregulated microRNAs in Prostate Cancer: In Silico Prediction and In Vitro Validation. Iran J. Basic Med. Sci. 2024, 27, 611–620. [Google Scholar] [CrossRef] [PubMed]
- Daniel, R.; Wu, Q.; Williams, V.; Clark, G.; Guruli, G.; Zehner, Z. A Panel of MicroRNAs as Diagnostic Biomarkers for the Identification of Prostate Cancer. Int. J. Mol. Sci. 2017, 18, 1281. [Google Scholar] [CrossRef] [PubMed]
- Mohammadi Torbati, P.; Asadi, F.; Fard-Esfahani, P. Circulating miR-20a and miR-26a as Biomarkers in Prostate Cancer. Asian Pac. J. Cancer Prev. 2019, 20, 1453–1456. [Google Scholar] [CrossRef]
- Pełka, K.; Klicka, K.; Grzywa, T.M.; Gondek, A.; Marczewska, J.M.; Garbicz, F.; Szczepaniak, K.; Paskal, W.; Włodarski, P.K. miR-96-5p, miR-134-5p, miR-181b-5p and miR-200b-3p Heterogeneous Expression in Sites of Prostate Cancer versus Benign Prostate Hyperplasia—Archival Samples Study. Histochem. Cell Biol. 2021, 155, 423–433. [Google Scholar] [CrossRef]
- Goel, S.; Bergholz, J.S.; Zhao, J.J. Targeting CDK4 and CDK6 in Cancer. Nat. Rev. Cancer 2022, 22, 356–372. [Google Scholar] [CrossRef]
- He, Y.; Xu, W.; Xiao, Y.T.; et al. Targeting Signaling Pathways in Prostate Cancer: Mechanisms and Clinical Trials. Signal Transduct. Target. Ther. 2022, 7, 198. [Google Scholar] [CrossRef]
- Stoen, M.J.; Andersen, S.; Rakaee, M.; Pedersen, M.I.; Ingebriktsen, L.M.; Donnem, T.; Lombardi, A.P.G.; Kilvaer, T.K.; Busund, L.R.; Richardsen, E. Overexpression of miR-20a-5p in Tumor Epithelium Is an Independent Negative Prognostic Indicator in Prostate Cancer—A Multi-Institutional Study. Cancers 2021, 13, 4096. [Google Scholar] [CrossRef]
- Kolokotronis, T.; Majchrzak-Stiller, B.; Buchholz, M.; Mense, V.; Strotmann, J.; Peters, I.; Skrzypczyk, L.; Liffers, S.T.; Menkene, L.M.; Wagner, M.; Glanemann, M.; Betsou, F.; Ammerlaan, W.; Schmidt, R.; Schröder, C.; Uhl, W.; Braumann, C.; Höhn, P. Differential miRNA and Protein Expression Reveals miR-1285, Its Targets TGM2 and CDH-1, as Well as CD166 and S100A13 as Potential New Biomarkers in Patients with Diabetes Mellitus and Pancreatic Adenocarcinoma. Cancers 2024, 16, 2726. [Google Scholar] [CrossRef]
- Guo, X.; Han, T.; Hu, P.; et al. Five MicroRNAs in Serum as Potential Biomarkers for Prostate Cancer Risk Assessment and Therapeutic Intervention. Int. Urol. Nephrol. 2018, 50, 2193–2200. [Google Scholar] [CrossRef]
- Haj-Ahmad, T.A.; Abdalla, M.A.; Haj-Ahmad, Y. Potential Urinary miRNA Biomarker Candidates for the Accurate Detection of Prostate Cancer among Benign Prostatic Hyperplasia Patients. J. Cancer 2014, 5, 182–191. [Google Scholar] [CrossRef]
- Capik, O.; Gundogdu, B.; Tatar, A.; Sahin, A.; Chen, F.; Creighton, C.J.; Karatas, O.F. Oncogenic miR-1825 Promotes Head and Neck Carcinogenesis via Targeting FREM1. J. Cell. Biochem. 2023, 124, 1628–1645. [Google Scholar] [CrossRef] [PubMed]
- Sun, J.; Luo, J.; Liu, J.; Wu, H.; Li, Y.; Xu, Y.; Liu, L.; Liu, X.; Zhang, Q. Cancer-Secreted Exosomal miR-1825 Induces Angiogenesis to Promote Colorectal Cancer Metastasis. Cancer Cell Int. 2025, 25, 63. [Google Scholar] [CrossRef] [PubMed]
- Baumann, B.; Acosta, A.M.; Richards, Z.; Deaton, R.; Sapatynska, A.; Murphy, A.; Kajdacsy-Balla, A.; Gann, P.H.; Nonn, L. Association of High miR-182 Levels with Low-Risk Prostate Cancer. Am. J. Pathol. 2019, 189, 911–923. [Google Scholar] [CrossRef] [PubMed]
- Stafford, M.Y.C.; McKenna, D.J. miR-182 Is Upregulated in Prostate Cancer and Contributes to Tumor Progression by Targeting MITF. Int. J. Mol. Sci. 2023, 24, 1824. [Google Scholar] [CrossRef]
- Danarto, R.; Astuti, I.; Umbas, R.; Haryana, S.M. Urine miR-21-5p and miR-200c-3p as Potential Non-Invasive Biomarkers in Patients with Prostate Cancer. Turk. J. Urol. 2019, 46, 26–30. [Google Scholar] [CrossRef]
- Labbé, M.; Chang, M.; Saintpierre, B.; Letourneur, F.; de Beaurepaire, L.; Véziers, J.; Deshayes, S.; Cotinat, M.; Fonteneau, J.F.; Blanquart, C.; Potiron, V.; Supiot, S.; Fradin, D. Loss of miR-200c-3p Promotes Resistance to Radiation Therapy via the DNA Repair Pathway in Prostate Cancer. Cell Death Dis. 2024, 15, 751. [Google Scholar] [CrossRef]
- Zhang, J.; Zhang, H.; Qin, Y.; Chen, C.; Yang, J.; Song, N.; Gu, M. MicroRNA-200c-3p/ZEB2 Loop Plays a Crucial Role in the Tumor Progression of Prostate Carcinoma. Ann. Transl. Med. 2019, 7, 141. [Google Scholar] [CrossRef]
- Zhang, J.X.; Yang, W.; Wu, J.Z.; Zhou, C.; Liu, S.; Shi, H.B.; Zhou, W.Z. MicroRNA-32-5p Inhibits Epithelial–Mesenchymal Transition and Metastasis in Lung Adenocarcinoma by Targeting SMAD Family 3. J. Cancer 2021, 12, 2258–2267. [Google Scholar] [CrossRef]
- Yuan, P.; Tang, C.; Chen, B.; Lei, P.; Song, J.; Xin, G.; Wang, Z.; Hui, Y.; Yao, W.; Wang, G.; Zhao, G. miR-32-5p Suppresses the Proliferation and Migration of Pancreatic Adenocarcinoma Cells by Targeting TLDC1. Mol. Med. Rep. 2021, 24, 752. [Google Scholar] [CrossRef]
- Ambrozkiewicz, F.; Karczmarski, J.; Kulecka, M.; Paziewska, A.; Cybulska, M.; Szymanski, M.; Dobruch, J.; Antoniewicz, A.; Mikula, M.; Ostrowski, J. Challenges in Cancer Biomarker Discovery Exemplified by the Identification of Diagnostic MicroRNAs in Prostate Tissues. Biomed Res. Int. 2020, 2020, 9086829. [Google Scholar] [CrossRef]
Figure 1.
Flow diagram of the selection process and exclusion criteria for primary studies in the literature-driven identification of ncRNA biomarkers validated in prostate cancer patients. References for 58 primary articles were included in the supplementary material.
Figure 1.
Flow diagram of the selection process and exclusion criteria for primary studies in the literature-driven identification of ncRNA biomarkers validated in prostate cancer patients. References for 58 primary articles were included in the supplementary material.
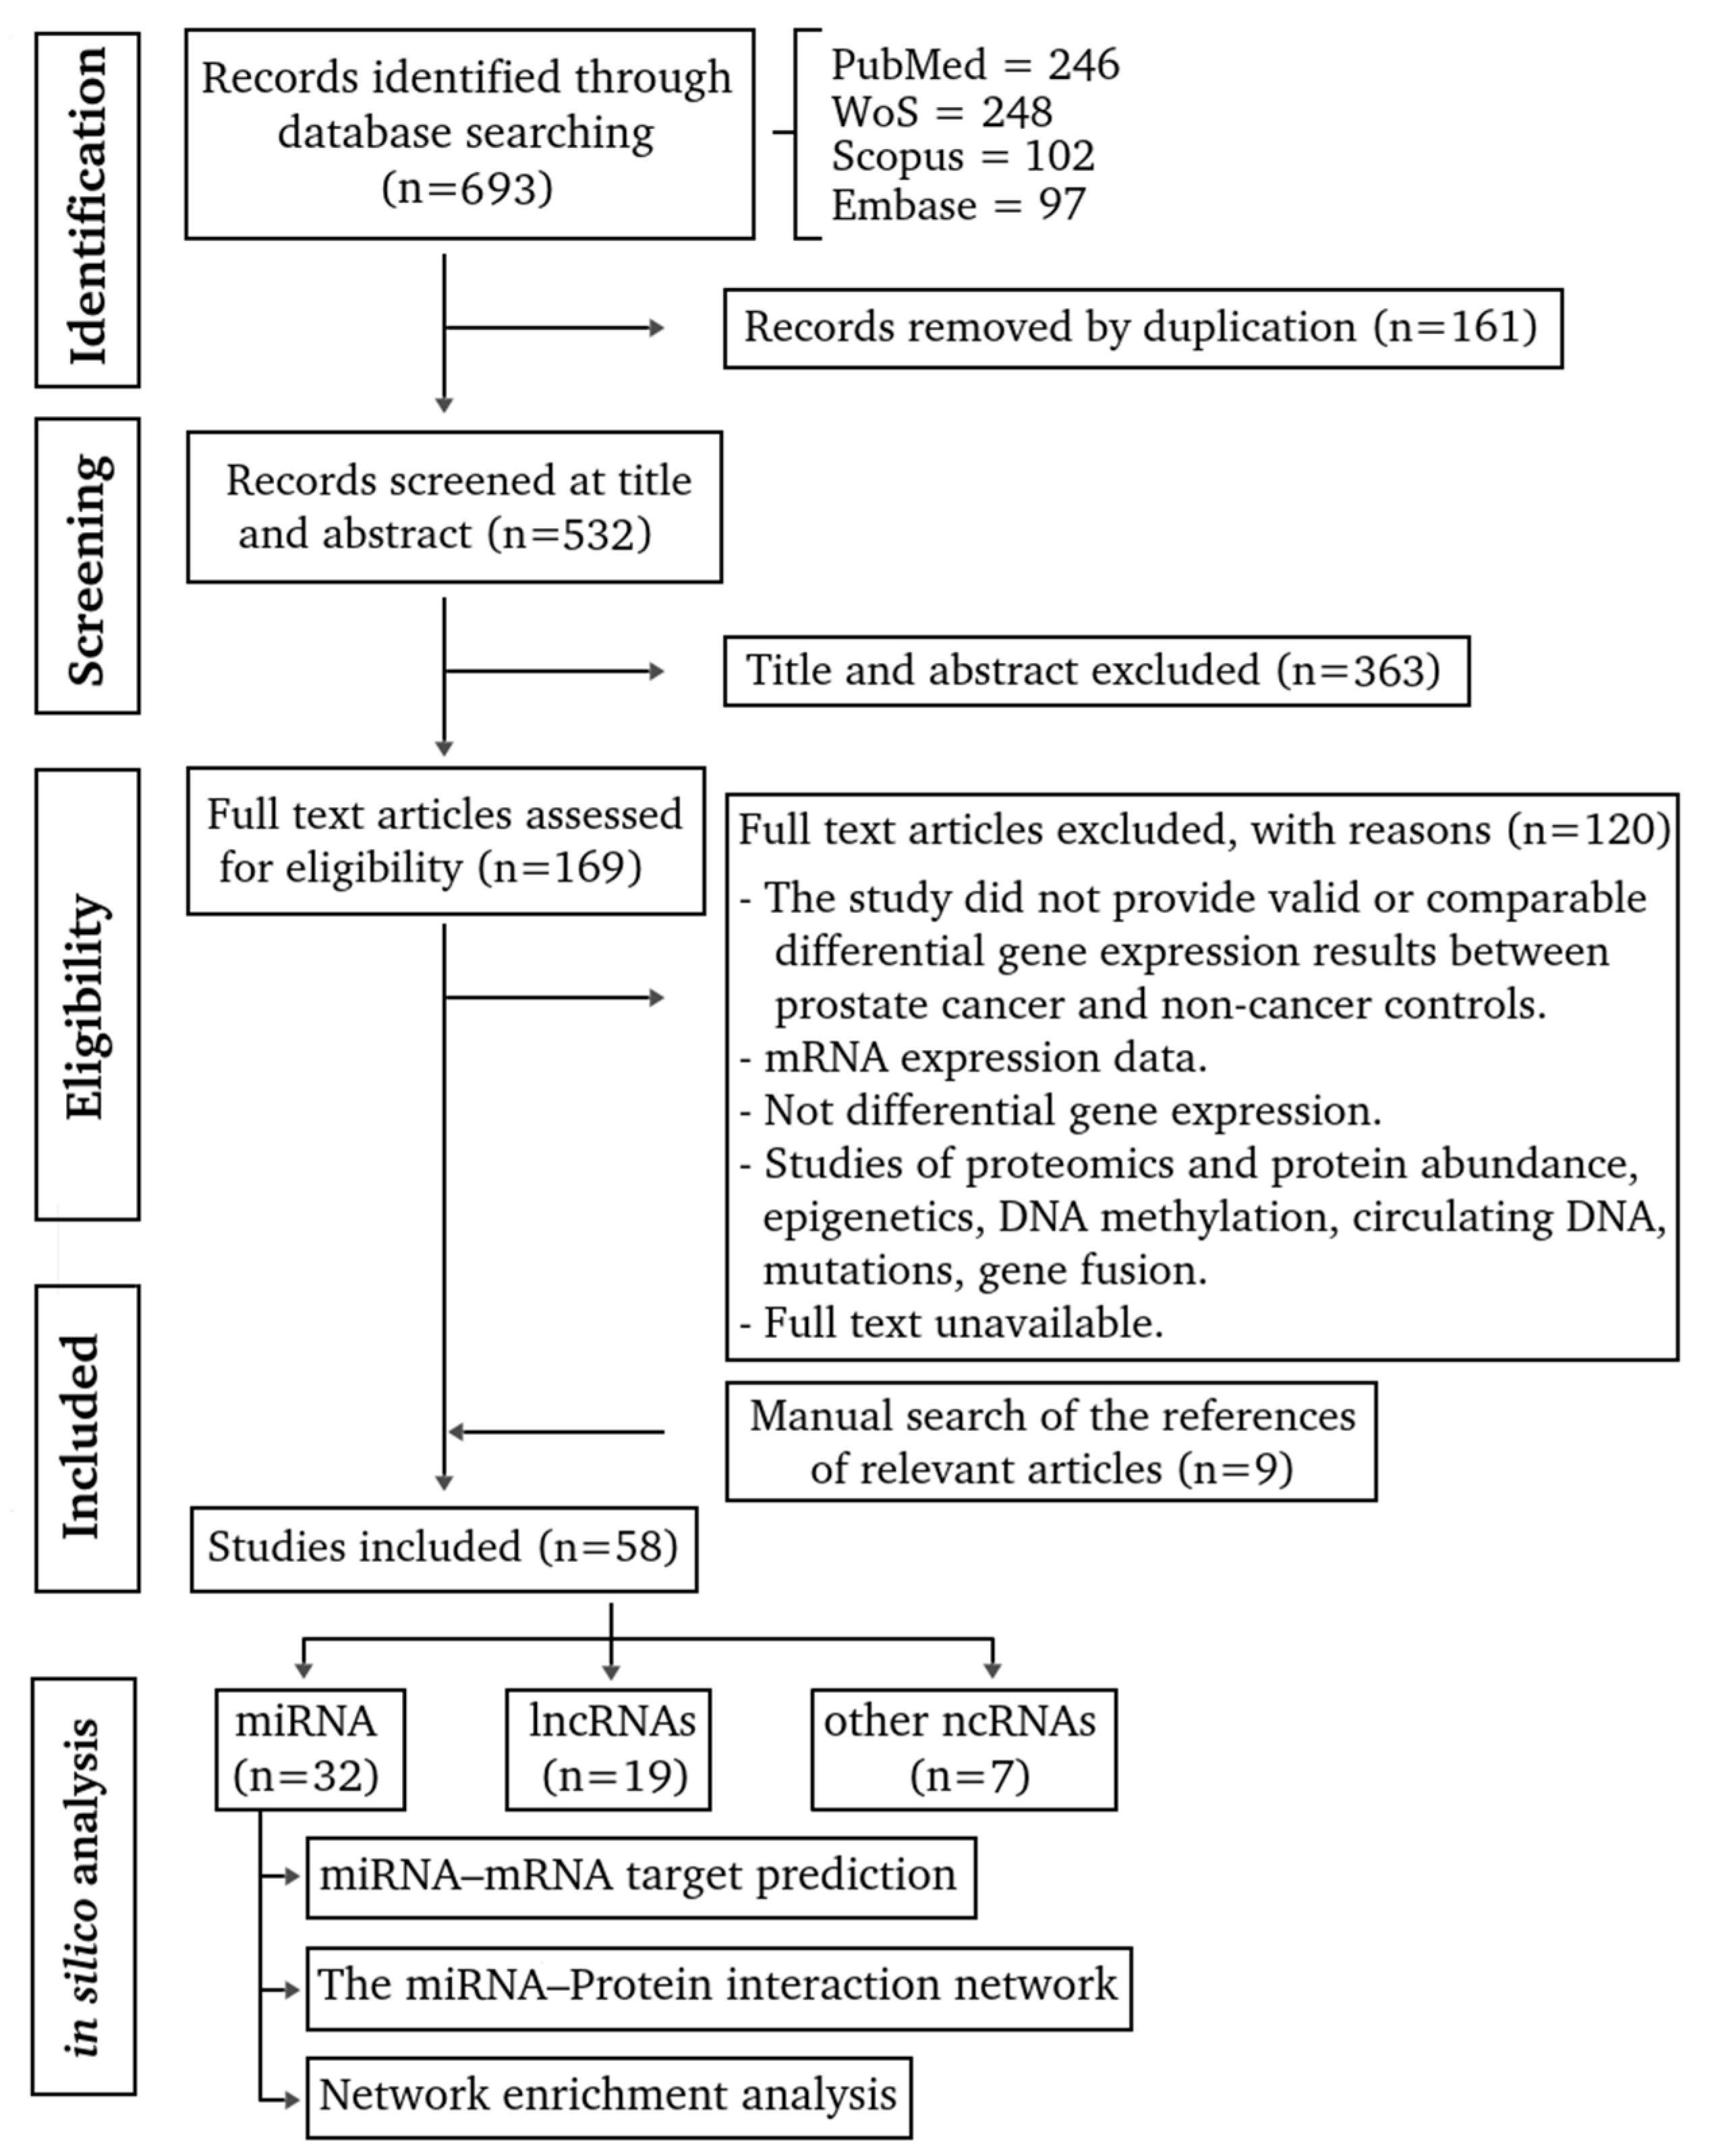
Figure 2.
miRNA-protein interaction network. The network is displayed by Cytoscape and contains 845 nodes and 2235 edges. The yellow diamonds represent the miRNAs, the blue circles denote the predicted protein targets, and the red circles correspond to the protein targets with prostate tissue–specific expression. The size of the nodes is proportional to the number of interactions (degree).
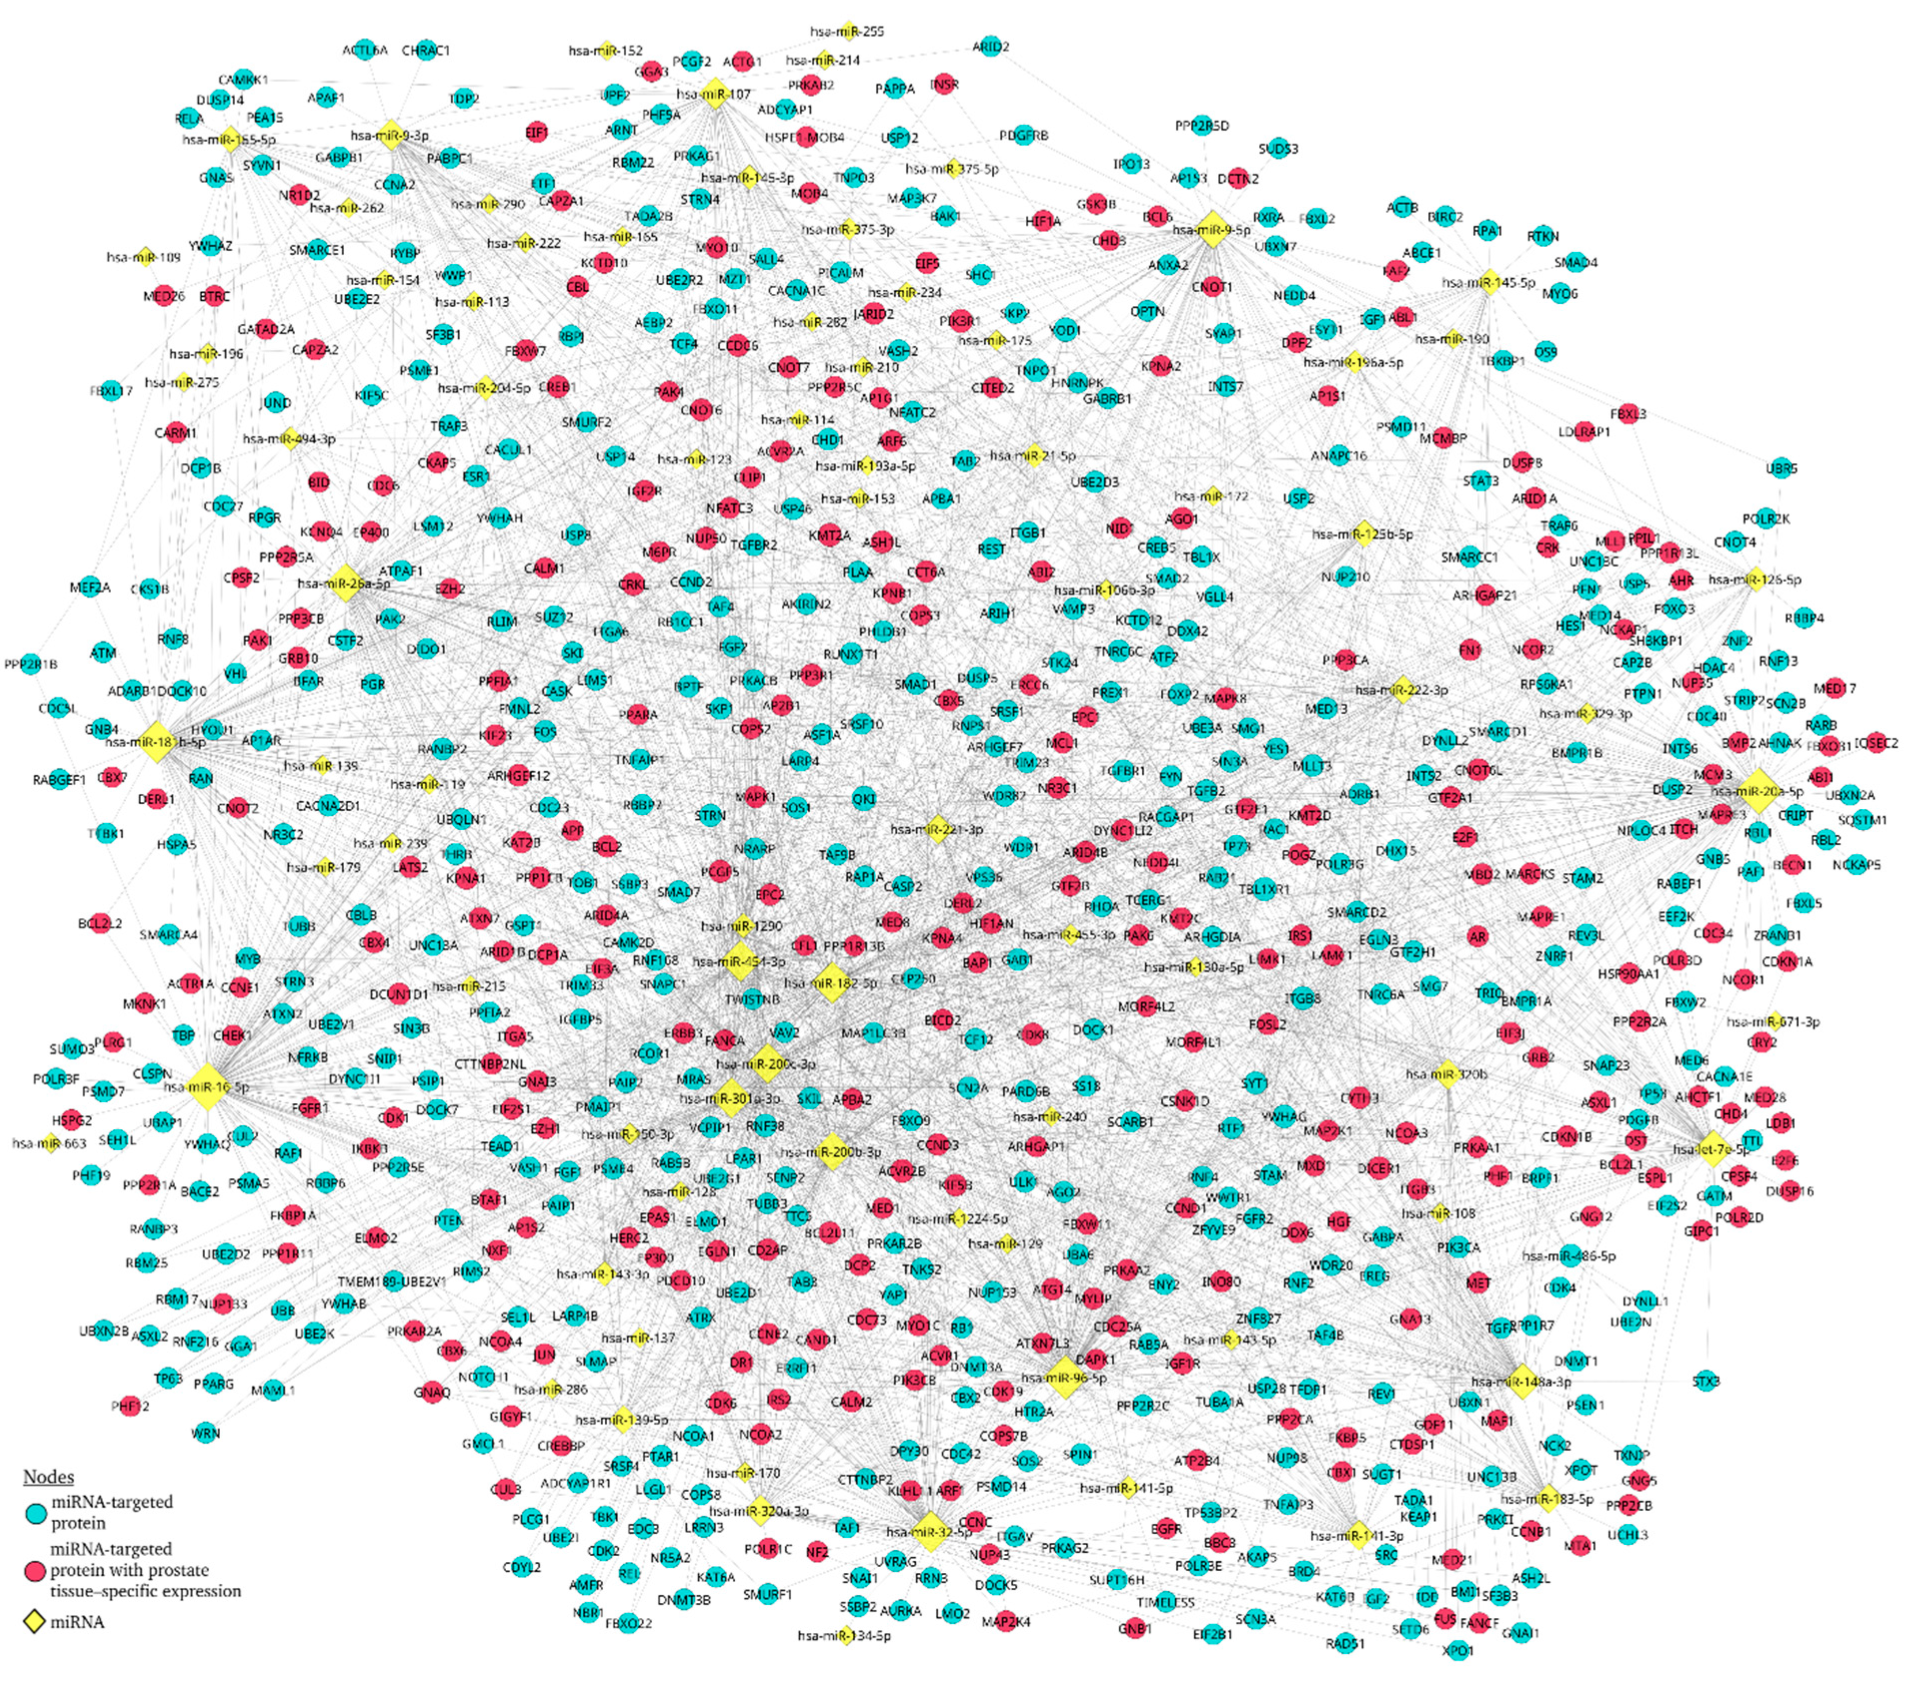
Figure 3.
Functional enrichment results of miRNA-associated protein targets. A) Top five Gene Ontology (GO) terms, ranked according to the most significant false discovery rate (FDR) values. B) Top five KEGG Orthology (KO) pathways, ranked according to the most significant FDR values. Node size is proportional to the number of significantly enriched genes within each group. C) Differences in the enriched pathways associated with up-regulated versus down-regulated miR20a, miR182-5p and miR200c-3p. D) Differential regulation by miR-32-5p and miR1825 in blood, tissue and urine samples. Red arrows indicate induction of pro-tumorigenic routes, whereas black lines inhibitory effects, indicating pathways or molecules that are suppressed. Color-coded molecule labels distinguish inhibited nodes (red) from direct miRNA targets (black).
Disclaimer/Publisher’s Note: The statements, opinions and data contained in all publications are solely those of the individual author(s) and contributor(s) and not of MDPI and/or the editor(s). MDPI and/or the editor(s) disclaim responsibility for any injury to people or property resulting from any ideas, methods, instructions or products referred to in the content. |
© 2025 by the authors. Licensee MDPI, Basel, Switzerland. This article is an open access article distributed under the terms and conditions of the Creative Commons Attribution (CC BY) license (http://creativecommons.org/licenses/by/4.0/).
Copyright: This open access article is published under a Creative Commons CC BY 4.0 license, which permit the free download, distribution, and reuse, provided that the author and preprint are cited in any reuse.


