Submitted:
04 December 2025
Posted:
05 December 2025
You are already at the latest version
Abstract
Translationally silent ribosomes have become an important focus in RNA biology. Lacking mRNAs, they represent a hibernating ribosome state. Their quantification remains challenging. This protocol outlines how to measure silent ribosome induction under diverse conditions by analyzing RNA from polysome-profiling fractions in yeast and mammalian cells, using RNA-seq with detection and removal of anomalously amplified rRNAs, complemented by qPCR for validation. For an example of the execution of this protocol, please refer to Rahaman, et. al [1].
Keywords:
monosome
; macrophage
; 5S rRNA
Before You Begin
Translationally silent ribosomes are induced during short- or long-term starvation and under defined stress conditions, representing dormant ribosome states. Although such ribosomes have long been known in prokaryotes, their discovery in eukaryotes lagged behind, partly because they possess few distinctive features detectable by standard analytical methods [2].
This protocol describes how to obtain accurate mRNA and rRNA measurements from polysome-profiling fractions—using both low- and high-throughput methods—to quantify silent ribosome induction under diverse stress conditions. A central aspect of the procedure is the detection and exclusion of anomalously amplified rRNA. We previously optimized this workflow in yeast and now validate it in mammalian cells, demonstrated here using a macrophage cell line.
The following preparations must be completed before starting the protocol:
- Prepare the sucrose solutions needed for polysome gradient formation.
Although full recipes are provided in Materials and Equipment Setup, 80% (w/v) sucrose solutions must be prepared in advance so they reach the correct temperature and consistency, by mixing the appropriate amount of pure (>99%) sucrose in nuclease free water. Use of hot water aids dissolution.
Note: Complete dissolution of sucrose is essential for generating smooth and reproducible gradients.
- 2.
- Grow yeast cultures to mid-log phase.
Yeast must be collected during exponential growth to ensure well-defined polysome profiles.
Note: mid-log phase cultures are appropriate for the study of short-term starvation and heat-stress.
- 3.
- Culture mammalian cells to 70%–80% confluence.
This protocol has been validated in a macrophage cell line; similar confluence levels are suitable for other adherent cell types.
Note: Cell density strongly influences translational activity and must be consistent across experimental replicates.
Innovation
Our protocol introduces methodological improvements in both major stages of the workflow: polysome profiling and RNA quantification.
In the polysome-profiling stage, we address two key challenges. First, because silent ribosomes are induced under starvation or stress, rapid arrest of translation is essential to preserve the in vivo ribosome distribution. We therefore implemented fast cooling procedures that ensure immediate translation shutdown even following heat stress. Second, sample homogeneity must be maintained, as sucrose—the core component of polysome gradients—reduces RNA yield, particularly from polysomal fractions. To improve yield and measurement precision, we dilute pooled polysomal fractions to lower sucrose concentrations before RNA extraction.
In the RNA-quantification stage, accurate estimation of silent ribosomes requires detection and removal of anomalous rRNA amplification. In our earlier yeast work, we identified substantial overamplification of 5S rRNA in RNA-seq datasets. Here, we extend this analysis to mammalian cells, specifically macrophages, and observe a similar artifact. Inclusion of all rRNAs leads to a nearly tenfold underestimation of active monosomes under heat stress. After excluding 5S rRNA, the corrected mRNA-to-rRNA ratios reveal that approximately 20% of monosomes remain active in macrophages under these conditions.
Preparation of 5x PGB
Timing: [30min]
- Prepare the 5x Polysome Gradient Buffer (yPGB or mPGB) solution as described in the Materials and Equipment section.
- Filter through a 0.22mm syringe filter.
CRITICAL: This ensures that there is no debris that may impact the gradient.
[Optional] Designing Primers for qPCR-Based Quantification
Timing: [Variable, up to 1week with quality control]
Optional: Only for the qPCR-based quantification.
- 3.
- Design forward and reverse qPCR primers against 25S rRNA.
Note: rRNA has numerous repetitive sequences and it will be necessary to carry out melt curve test to make sure that no primer dimers and spurious products are formed.
- 4.
- Identify genes of interest as a set of at least 15 mRNAs that are highly expressed under both standard and stress conditions.
- 5.
- Design forward and reverse qPCR primers specific to the mRNAs of interest in such a way that the forward primer contains the start codon on the mRNA.
Preparation of Sucrose Gradients
Timing: [24h]
- 6.
- Prepare light (eg. 10% w/v) and heavy (eg. 50% w/v) solutions of sucrose by mixing 80% (w/v) sucrose with 5x PGB (mPGB or yPGB depending on cells used, final concentration 1x) and diluting with an appropriate volume of water and mix for 2-3h at 4 °C with gentle rocking.
Note: The gradients can be adjusted to get a better resolution of particular ribosomal peaks. Make sure to keep the difference between the heavy and light solutions of sucrose to a minimum of 30% to avoid gradient collapse during ultracentrifugation.
- 7.
- Degas the solutions by centrifugation at 1500g for 10min.
- 8.
- Mark the half-way point on the 13.2mL ultracentrifuge tube with the help of the marker block
- 9.
- Pour the light solution till the mark.
- 10.
- With a broad-gauge syringe, layer the heavy solution at the bottom of the tube up to the halfway mark. Follow STAR Protocol #4182 for a detailed video [3].
- 11.
- Then place the appropriate caps on the tubes and remove excess liquid that may have collected in the cap.
- 12.
- Use the Gradient Master part of the Gradient Station Machine to make the gradient. Use the appropriate programs corresponding to the gradient used.
- 13.
- Keep at 4 °C overnight until it is time to load the samples.
CRITICAL: Do not introduce bubbles or shake the gradient; even minor disruptions can negatively affect polysome profile resolution.
Key Resources Table
| REAGENT or RESOURCE | SOURCE | IDENTIFIER |
| Chemicals, peptides, and recombinant proteins | ||
| Cycloheximide | Thermo Scientific | Cat#357420050 |
| GlycoBlue | Thermo Scientific | Cat#AM9516 |
| RNasIN Plus | Promega | Cat#N2615 |
| SuperScript IV | Thermo Scientific | Cat#18090200 |
| Nuclease Free Water | Thermo Scientific | Cat#AM9932 |
| Random hexamers | Promega | Cat#C1181 |
| oligodT15 | Promega | Cat#C1101 |
| KAPA SYBR Fast | Sigma Aldrich | Cat#KK4611 |
| Tris-HCl pH 8.0 | Thermo Scientific | Cat#AM9856 |
| MgCl2 | Thermo Scientific | Cat#AM9530G |
| DTT | Thermo Scientific | Cat#707265ML |
| KCl | Thermo Scientific | Cat#AM9640G |
| Cycloheximide (RNA grade) | Thermo Scientific | Cat#J66004-XF |
| cOmplete EDTA free Protease Inhibitor | Sigma Aldrich | Cat#COEDTAF-RO |
| Sucrose | Thermo Scientific | Cat#036508-30 |
| Phenol (pH 4.5) | Sigma Aldrich | Cat#P4682-400ML |
| Chloroform-Isoamyl Alcohol (24:1) | Sigma Aldrich | Cat#25666-500ML |
| Absolute Ethanol | Sigma Aldrich | Cat#1009831000 |
| Triton X-100 | Sigma Aldrich | Cat#T9284 |
| Phosphate buffered saline (PBS) | Sigma Aldrich | Cat#D8537 |
| Critical commercial assays | ||
| RNeasy MinElute Cleanup Kit | Qiagen | Cat#74204 |
| RNA Clean and Concentrator | Zymo | Cat#R1013 |
| Qiaseq Fastselect Yeast Kit | Qiagen | Cat#334217 |
| SMART-Seq Stranded | TaKaRa | Cat#634444 |
| TranscriptAid T7 High Yield Transcription Kit | Thermo Scientific | Cat#K0441 |
| TruSeq Stranded kit | Illumina | Cat#20020599 |
| Deposited data | ||
| Polysome profiling of murine macrophages without rRNA depletion, at 37° C (Control) and 42° C (Heat-shock) | This paper | GEO: GSE311393 |
| Experimental models: Cell lines | ||
| Mouse: J774A.1 Murine macrophages | Laboratory of Prof. Dr. Jean Pieters | ATCC: TIB-67 |
| Experimental models: Organisms/strains | ||
| S. cerevisiae: Strain background: BY4743 | EUROSCARF | Y20000 |
| Oligonucleotides | ||
| Sc_RDN25-1_qPCR_ForwardPrimer | AATCTCGCATTTCACTGGGC | 9608 |
| Sc_RDN25-1_qPCR_ReversePrimer | TTGACTTACGTCGCAGTCCT | 9614 |
| Mm_RN28S1_qPCR_ForwardPrimer | GGGTTTAGACCGTCGTGAGA | 10133 |
| Mm_RN28S1_qPCR_ReversePrimer | CTCAGCCAAGCACATACACC | 10139 |
| Other | ||
| Zirconia/Silica beads | Biospec | Cat#11079105z |
| Ultracentrifuge tubes 13.2mL | Beckman Coulter | Cat#C14293 |
| Caps for Ultracentrifuge tubes | BioComp | Cat#105-414-1 |
| SW41-Ti Ultracentrifuge Rotor | Beckman Coulter | Cat#331362 |
| Lysing Matrix Y | MPBio | Cat#116960050-CF |
| Teenprep™ Lysing Matrix Y tubes | MPBio | Cat#116975050 |
| Lightcycler 480 | Roche | RRID:SCR_018626 |
| Gradient Station | BioComp | Cat#153 |
| Marker Block (for SW41-Ti Rotor) | BioComp | Cat#105-614A |
| 23G syringe | B Braun | Cat#4665635 |
| 5mL microfuge tube (DNA Lobind) | Eppendorf | Cat#0030108310s |
| 2mL microfuge tube (DNA Lobind) | Eppendorf | Cat#0030108078 |
Materials and Equipment
5x mammalian Polysome Gradient Buffer (mPGB)
| Reagent | Final concentration |
| Tris-HCl pH 8.0 | 100mM |
| MgCl2 | 50mM |
| KCl | 250mM |
| Dithiothreitol (DTT) | 5mM |
| Cycloheximide (RNA grade) | 1mg/mL |
| cOmplete EDTA free Protease Inhibitor | 1 tab/10mL |
| RNasIN RNase Inhibitor | 80U/mL |
| Nuclease Free Water | n/a |
Store at 4 °C for up to 1 week.
5x yeast Polysome Gradient Buffer (yPGB)
| Reagent | Final concentration |
| Tris-HCl pH 8.0 | 100mM |
| MgCl2 | 50mM |
| Dithiothreitol (DTT) | 5mM |
| Cycloheximide (RNA grade) | 1mg/mL |
| cOmplete EDTA free Protease Inhibitor | 1 tab/10mL |
| RNasIN RNase Inhibitor | 40U/mL |
| Nuclease Free Water | n/a |
Store at 4 °C for up to 1 week.
CRITICAL: Cycloheximide is acutely toxic as it is a eukaryotic translation inhibitor. Be careful not to come in contact with it directly.
1x Polysome Lysis Buffer PLB (mPLB or yPLB)
| Reagent | Final concentration |
| 5x PGB (mPGB or yPGB) | 1x |
| Triton X-100 | 1% |
| Nuclease Free Water | N/A |
Store at 4 °C for up to 1 day.
Yeast cell collection media
| Reagent | Final concentration |
| Cycloheximide | 300µg/mL |
| Yeast culturing media (eg. CSM Complete) | N/A |
Store at 4 °C for up to 1 day.
Mammalian cell collection media
| Reagent | Final concentration |
| Cycloheximide | 200µg/mL |
| 1x PBS | N/A |
Store at 4 °C for up to 1 day.
Step-by-Step Method Details
Collection and Lysis of Cells
Timing: [1h]
-
Collect the cells as follows:
-
Option 1: Yeast cells (use at least 2x10⁸ cells):
-
Add 1x volume of yeast culture (e.g. 30mL) to 2x volume of Yeast cell collection media (e.g. 60mL). Immediately mix by inversion and cool in a 50% Ethanol bath at -20 °C for 2 minutes.CRITICAL: Use of ice-cold collection media and cooling in a -20 °C Ethanol bath helps stop translation process immediately by dropping the temperature in the tube to <10 °C, as opposed to stopping it in a gradual manner, which would potentially lead to ribosomal run-off [4].
- Centrifuge at 1500g for 10min in a pre-cooled centrifuge at 4 °C.
- Completely remove supernatant and proceed to lysis.
-
-
Option 2: Mammalian Cells (use at least 1x10⁷ cells):
- Remove media by aspiration and immediately place the culture dish on ice
- Add Mammalian cell collection media cooled to 4 °C. to the culture dish and scrape the cells.
- Collect the cells in an appropriate tube and centrifuge at 1500g for 10min in a pre-cooled centrifuge at 4 °C.
- Completely remove supernatant and proceed to lysis.
-
-
Lyse the cells as follows:
-
Option 1: Yeast cells:
- Re-suspend the cells in 600µL of 1x yPLB on ice.
- Add the mixture to 2mL microfuge tubes containing 500µL Zirconia/Silica beads
- Lyse at 4 °C in a Thermomixer by intermittent vortexing at 2000rpm, 30s on 30s off, 20 cycles.
-
Option 2: Mammalian cells:
- Re-suspend the cells in 600µL of 1x mPLB on ice.
- Pass the mixture 10 times through a sterile 23G needle.
- Carry out passive lysis by incubating on ice for 10min.
- Pass the mixture 10 times through a sterile 23G needle.
- Centrifuge at 4 °C, 10000g for 10min and collect the supernatant.
-
Measure A260 using a spectrophotometer.Note: Due to the presence of RNase Inhibitors, Protease Inhibitors and detergents in PLB, all of which absorb in the UV range, it will be necessary to dilute the sample at least 10-fold in water for A260 measurement.Pause point: Samples may be immediately used for polysome profiling or flash frozen in liquid nitrogen and stored at -80 °C for several months. Thaw slowly on ice or a metal block and resuspend before polysome profiling.
-
Ultracentrifugation and Polysome Profiling
Timing: [3-5h]
- 3.
- Pre-cool the ultracentrifuge to 4 °C.
- 4.
- Layer 2-5 A260 units of the lysate on the top of the sucrose gradients in the ultracentrifuge tube.
CRITICAL: Be careful to layer slowly and not disrupt the gradient.
Note: Too little sample added can lead to less defined peaks, as can overloading the tube with too much sample (Troubleshooting 1).
- 5.
- Weigh the ultracentrifuge tubes along with the buckets and make sure they are balanced
Note: Here due to the high forces during ultracentrifugation, it is necessary that the tubes are balanced to a maximum difference of 10mg in weight.
- 6.
- Load the buckets containing the tubes into the rotor and carry out the ultracentrifugation at 275000g (equivalent to 40,000 rpm in an SW41Ti rotor) for 2h.
Note: The ultracentrifugation speed and time can be adjusted to get a better resolution of particular ribosomal peaks (Troubleshooting 2).
- 7.
- When the ultracentrifugation is about to finish (<10min left), switch on the Gradient Station machine and carry out the cleaning, blanking and general quality control steps as instructed in the TRIAX program in the computer attached to the Gradient Station.
- 8.
- Load 2mL tubes in the fractionation rack (code 19) as instructed and place it in the Gilson collector unit.
- 9.
- Carefully take out the rotor from the ultracentrifuge and keep the buckets with the tubes at 4 °C without disturbing the gradients.
- 10.
- Carefully take out the ultracentrifuge tube from the bucket and place it in the tube holder from the Gradient station machine under the piston.
- 11.
- Fractionate the gradient, collect the fractionated samples and save the polysome profile trace generated by the TRIAX program.
- 12.
- Keep the fractions in ice if used immediately or store at -80 °C.
Note: for a detailed account of how to use the Gradient Station machine, follow the manufacturer’s instructions or refer to STAR Protocols #4182 [5]
Pause point: The fractions can be stored at -80 °C for several months.
RNA Extraction
Timing: [2-3days]
General outline is given in Figure 1.
- 13.
- Prepare Phenol:Chloroform:Isoamyl Alcohol = 25:24:1 mix by mixing equal volumes of acid phenol (pH = 4.5) and chloroform:isoamyl alcohol (24:1) and keep at 37 °C.
- 14.
- From the polysome profile trace, identify the fractions (collected in step 11) corresponding to a particular mRNA-ribosome complexation state (e. Free, 40S, 60S, Monosome (80S), Disome, etc.)
- 15.
- Pool the fractions corresponding to each particular mRNA-ribosome complexation state together in a 5mL microfuge tube and add equal volumes of spike-in RNAs to each pool.
Note: The spike ins can be prepared by in-vitro translation (IVT) or may be purchased as ready to use mixes (e.g. ERCC).
Critical: The amount of spike-in RNAs to be added needs to be standardized in a prior experiment, to ensure that they are in the detectable range while measuring the final readout with qRT-PCR or RNA-Seq.
- 16.
- If any pool exceeds 1200 µL, divide it into multiple 5-mL microfuge tubes as needed. Add nuclease free water to a final volume of 1200µL.
- 17.
- If any tube contains a pooled sample with a sucrose concentration >30%, split into multiple 5mL microfuge tubes as needed. Add nuclease free water to a final volume of 1200µL.
Note: Here the concentration of sucrose in the tube can be inferred from the location of the corresponding peak in the polysome profile assuming a linear gradient of sucrose and taking into account the dilution due to water addition in the tube. Too high sucrose concentration can reduce RNA yield (Troubleshooting 3).
- 18.
- Add 1200µL of the hot phenol-chloroform-isoamyl alcohol mix (prepared in step 13) to each 5mL microfuge tube containing 1200µL of sample. Mix by vortexing and let stand for 1min.
Note: In this step, the effect of temperature in ensuring the separation of RNA into the aqueous phase outweighs the potential damage to RNA.
- 19.
- Centrifuge the 5mL microfuge tubes at 40 °C for 10min at a speed of 16000g.
- 20.
- Pipet out 1mL of the upper (aqueous) phase into a fresh 5mL microfuge tube.
- 21.
- Add 100µL of Sodium acetate (pH = 5.0), 2µL of glycoblue and 3.3mL of absolute ethanol.
- 22.
-
Vortex the tubes and keep at -80 °C overnight for precipitation.Pause point: The tubes can be stored at -80 °C for up to a year.
- 23.
- Prepare 75% ethanol and keep chilled in ice.
- 24.
- Centrifuge the tubes at 4 °C for 1h at a speed of 20000g.
- 25.
- Discard the supernatant while taking care to not disturb the pellet (blue)
- 26.
- Add 2mL of 75% ethanol and vortex to wash the pellet.
- 27.
- Centrifuge at 4 °C for 10min at a speed of 20000g.
- 28.
- Completely remove any traces of ethanol and let dry for 1min on the bench.
- 29.
- Reconstitute the pellets from each pool in warm nuclease free water (at 50 °C). For pools which have been separated into multiple tubes, dissolve one pellet first and then use the resulting solution to dissolve the next one from the same pool.
Note: At this point, the RNA from each pool corresponding to a particular mRNA-ribosome complexation state is reconstituted in 100µL of nuclease free water.
Pause point: The RNA can be stored at -80 °C for several months.
- 30.
- Further purify this RNA using column-based cleanup (e.g. RNeasy Minelute) including the on-column DNase digestion step. Elute in 30µL of nuclease free water.
CRITICAL: The use of the on-column DNase digestion ensures the removal of DNA which is a common contaminant.
Alternatives: RNeasy MinElute kit contains columns that select for RNA >200 nucleotides. This is helpful to deplete 5S rRNA which can lead to spurious reads in the RNA-Seq as well as anomalous amplification of 5S rRNA in the qPCR [1]. If RNA species with lengths <200nt are to be studied, Zymo RNA Clean and Concentrator can be used.
Quantification
Timing: [2days for qPCR option, variable for RNA-Seq option]
- 31.
-
Measure the RNA intensities as follows:
-
Option 1: qPCR: Scheme in Figure 2.
- Set up a reverse transcription reaction with 5µL of the eluted RNA using SuperScript IV. Use oligo(dT)15, 25S rRNA reverse primer as well as the reverse primers for the spike-in RNAs as the RT primers.
- Carry out reverse transcription at 50 °C for 1h.
- Probe the cDNA generated in step i. for the genes of interest by qPCR using primers flanking the start codon as described in preparation step “Designing primers for qPCR-based quantification,” while also measuring the spike-in RNAs as control.
-
Dilute the cDNA generated in step i. 1:1000 and probe for 25S rRNA by qPCR, while also measuring the spike-in RNAs as control.Note: 25S rRNA (present in the large ribosomal subunit) rather than the 18S rRNA (present in the small subunit) was used in order to prevent signal from the scanning 40S ribosomal subunits that could be associated with mRNAs in each peak of the polysome profile (Troubleshooting 4).CRITICAL: If this heavy dilution is not carried out, the rRNA Ct values will be too low to be measured correctly.
- Normalize both the mRNAs of interest (j) and the 25S rRNA to the spike-in RNA intensities for each pool (i) to get mRNAi,j and rRNAj respectively.
- Calculate mRNA relative to rRNA for each mRNA of interest in each pool as follows:
-
For each mRNA, normalize the ratio of mRNA to rRNA in monosome relative to tetrasome, as follows:Note: Here 1 refers to the monosome, 4 to the tetrasome (4 ribosomes) and j is the species of mRNA.
-
Compute the relative fold change (rFC) in monosomal mRNA/rRNA ratios between stress (e.g., heat shock) and control conditions for each mRNA species j:Note: A lower rFC monosome value indicates a higher prevalence of silent ribosomes.
-
Option 2: RNA-Seq: Scheme in Figure 3.
- Quantify the eluted RNA from step 30 using Qubit or any other fluorescence-based measurement technique. Troubleshooting 5.
-
Carry out library preparation on the RNA using SMART-Seq Stranded kit if using yeast samples and TruSeq Stranded kit if using mammalian samples. Follow the kit instructions for library preparation and downstream quality control.CRITICAL: Since here we are using the rRNA levels as a readout for ribosomes and using this to calculate silent ribosomes, it is imperative that no mRNA enrichment or rRNA depletion step is carried out.
- Carry out RNA-Seq on the prepared libraries.
- Trim the reads from the RNA-Seq using TrimGalore and map them onto the respective transcriptome (along with the spike-ins) using Salmon [5].
- Express the reads as transcripts-per-million (TPM) and normalize them to the spike-in values.
- For each pool, calculate mRNA relative to rRNA as follows:Note: 5S rRNA has been seen to display anomalous amplification which may be linked to its small size. As a result, it is not used as a readout for rRNA levels [1].
- Normalize the ratio of mRNA to rRNA in monosome (1) relative to tetrasome (4) as follows:
- Compute the relative fold change (rFC) in monosomal mRNA/rRNA ratios between stress (e.g., heat shock) and control conditions:
-
Expected Outcomes
Polysome Profile Quality and RNA Yield
Successful polysome profiling should yield a trace with well-defined and well-separated peaks (Figure 1). Under optimal conditions in yeast, peaks corresponding to mRNAs associated with up to 9-10 ribosomes can typically be resolved. Adding cycloheximide 2 min before harvesting prevents ribosome run-off and stabilizes polysomes. In addition, rapid cooling is required to arrest translation. This step becomes more challenging after heat shock, as high-temperature medium must be cooled immediately; this can be achieved by placing the culture – collection media mix in a 50% ethanol bath at -20 °C for 2 minutes (See step 1.a.i).
RNA yields from individual pooled fractions corresponding to one or more ribosome peaks should exceed 30 ng as measured by Qubit. Spike-in RNA intensities should display low variability (CV < 1.0) across fractions. Variability can be reduced by diluting RNA precipitates to lower the effective sucrose concentration, which otherwise compromises RNA recovery from sucrose-rich fractions (Figure 4).
Such dilution is not required if each fraction is precipitated, purified, and sequenced individually [6], although this approach is more cost-intensive. When fractions are not pooled, the amount of the sucrose in individual 1.5 ml tubes is less and thus precipitation is likely less inhibited.
For calculating silent ribosome induction, the critical fractions are those representing the monosome and the polysomal fractions containing four ribosomes. If the four-ribosome (tetrasome) fraction does not provide sufficient RNA, higher polysomal fractions (up to 7–10 ribosomes) should be included in the pool.
Comparison of mRNA Distribution and Absorbance Profiles
As a first step, the mRNA distribution across fractions is measured to characterize the translation apparatus. Several additional parameters can be assessed to evaluate ribosome distribution, including protein abundance of ribosomal and associated factors (proteomics), rRNA quantification by qPCR or RNA-seq [1,7], and the A₂₆₀ absorbance profile, which reflects total RNA and proteins in and associated with the ribosome
Because absorbance peaks are inherently obtained during polysome profiling, it is convenient to analyze these first to determine whether the expected patterns are present. In both yeast and macrophages, stress conditions typically produce an increase in the monosome absorbance peak accompanied by a reduction in polysomal peaks (Figure 5).
However, the mRNA distribution does not always mirror these changes. In yeast, mRNAs do not shift toward monosomes—whether quantified by monosome:polysome ratios or polysome propensity [1]. Thus, monosome accumulation is not accompanied by increased monosome-associated mRNA, representing the first evidence for silent ribosome induction.
Detection and Correction of Anomalous 5S rRNA Amplification
In the second step, mRNAs and rRNAs are quantified by RNA-seq. Because rRNA is prone to anomalous amplification, it must be examined first. In our previous yeast work, 5S rRNA appeared strongly overrepresented under heat stress, although this increase was artefactual as confirmed by gel electrophoresis [1]. Our macrophage data demonstrate that this artifact is conserved in mammalian cells (Figure 6). The mouse genome encodes numerous 5S rRNA variants (Rn5S, n-R5s2 to n-R5s195), which together constitute 80–90% of total RNA TPMs (Data S1).
The Rn5S:Rn28S1 ratio typically remains stable across fractions at 37 °C but increases sharply in monosomes (and more modestly in disomes) at 42 °C, which suggests that anomalous amplification is specific to the stress conditions (Figure 6). This parallels our yeast findings and confirms that the extreme enrichment of 5S rRNA is spurious. Therefore, all 5S rRNA species are excluded from total rRNA calculations (see Step 30.b.vi). After this correction, the ratio is calculated for each fraction.
Quantitative Estimation of Active vs. Silent Monosomes
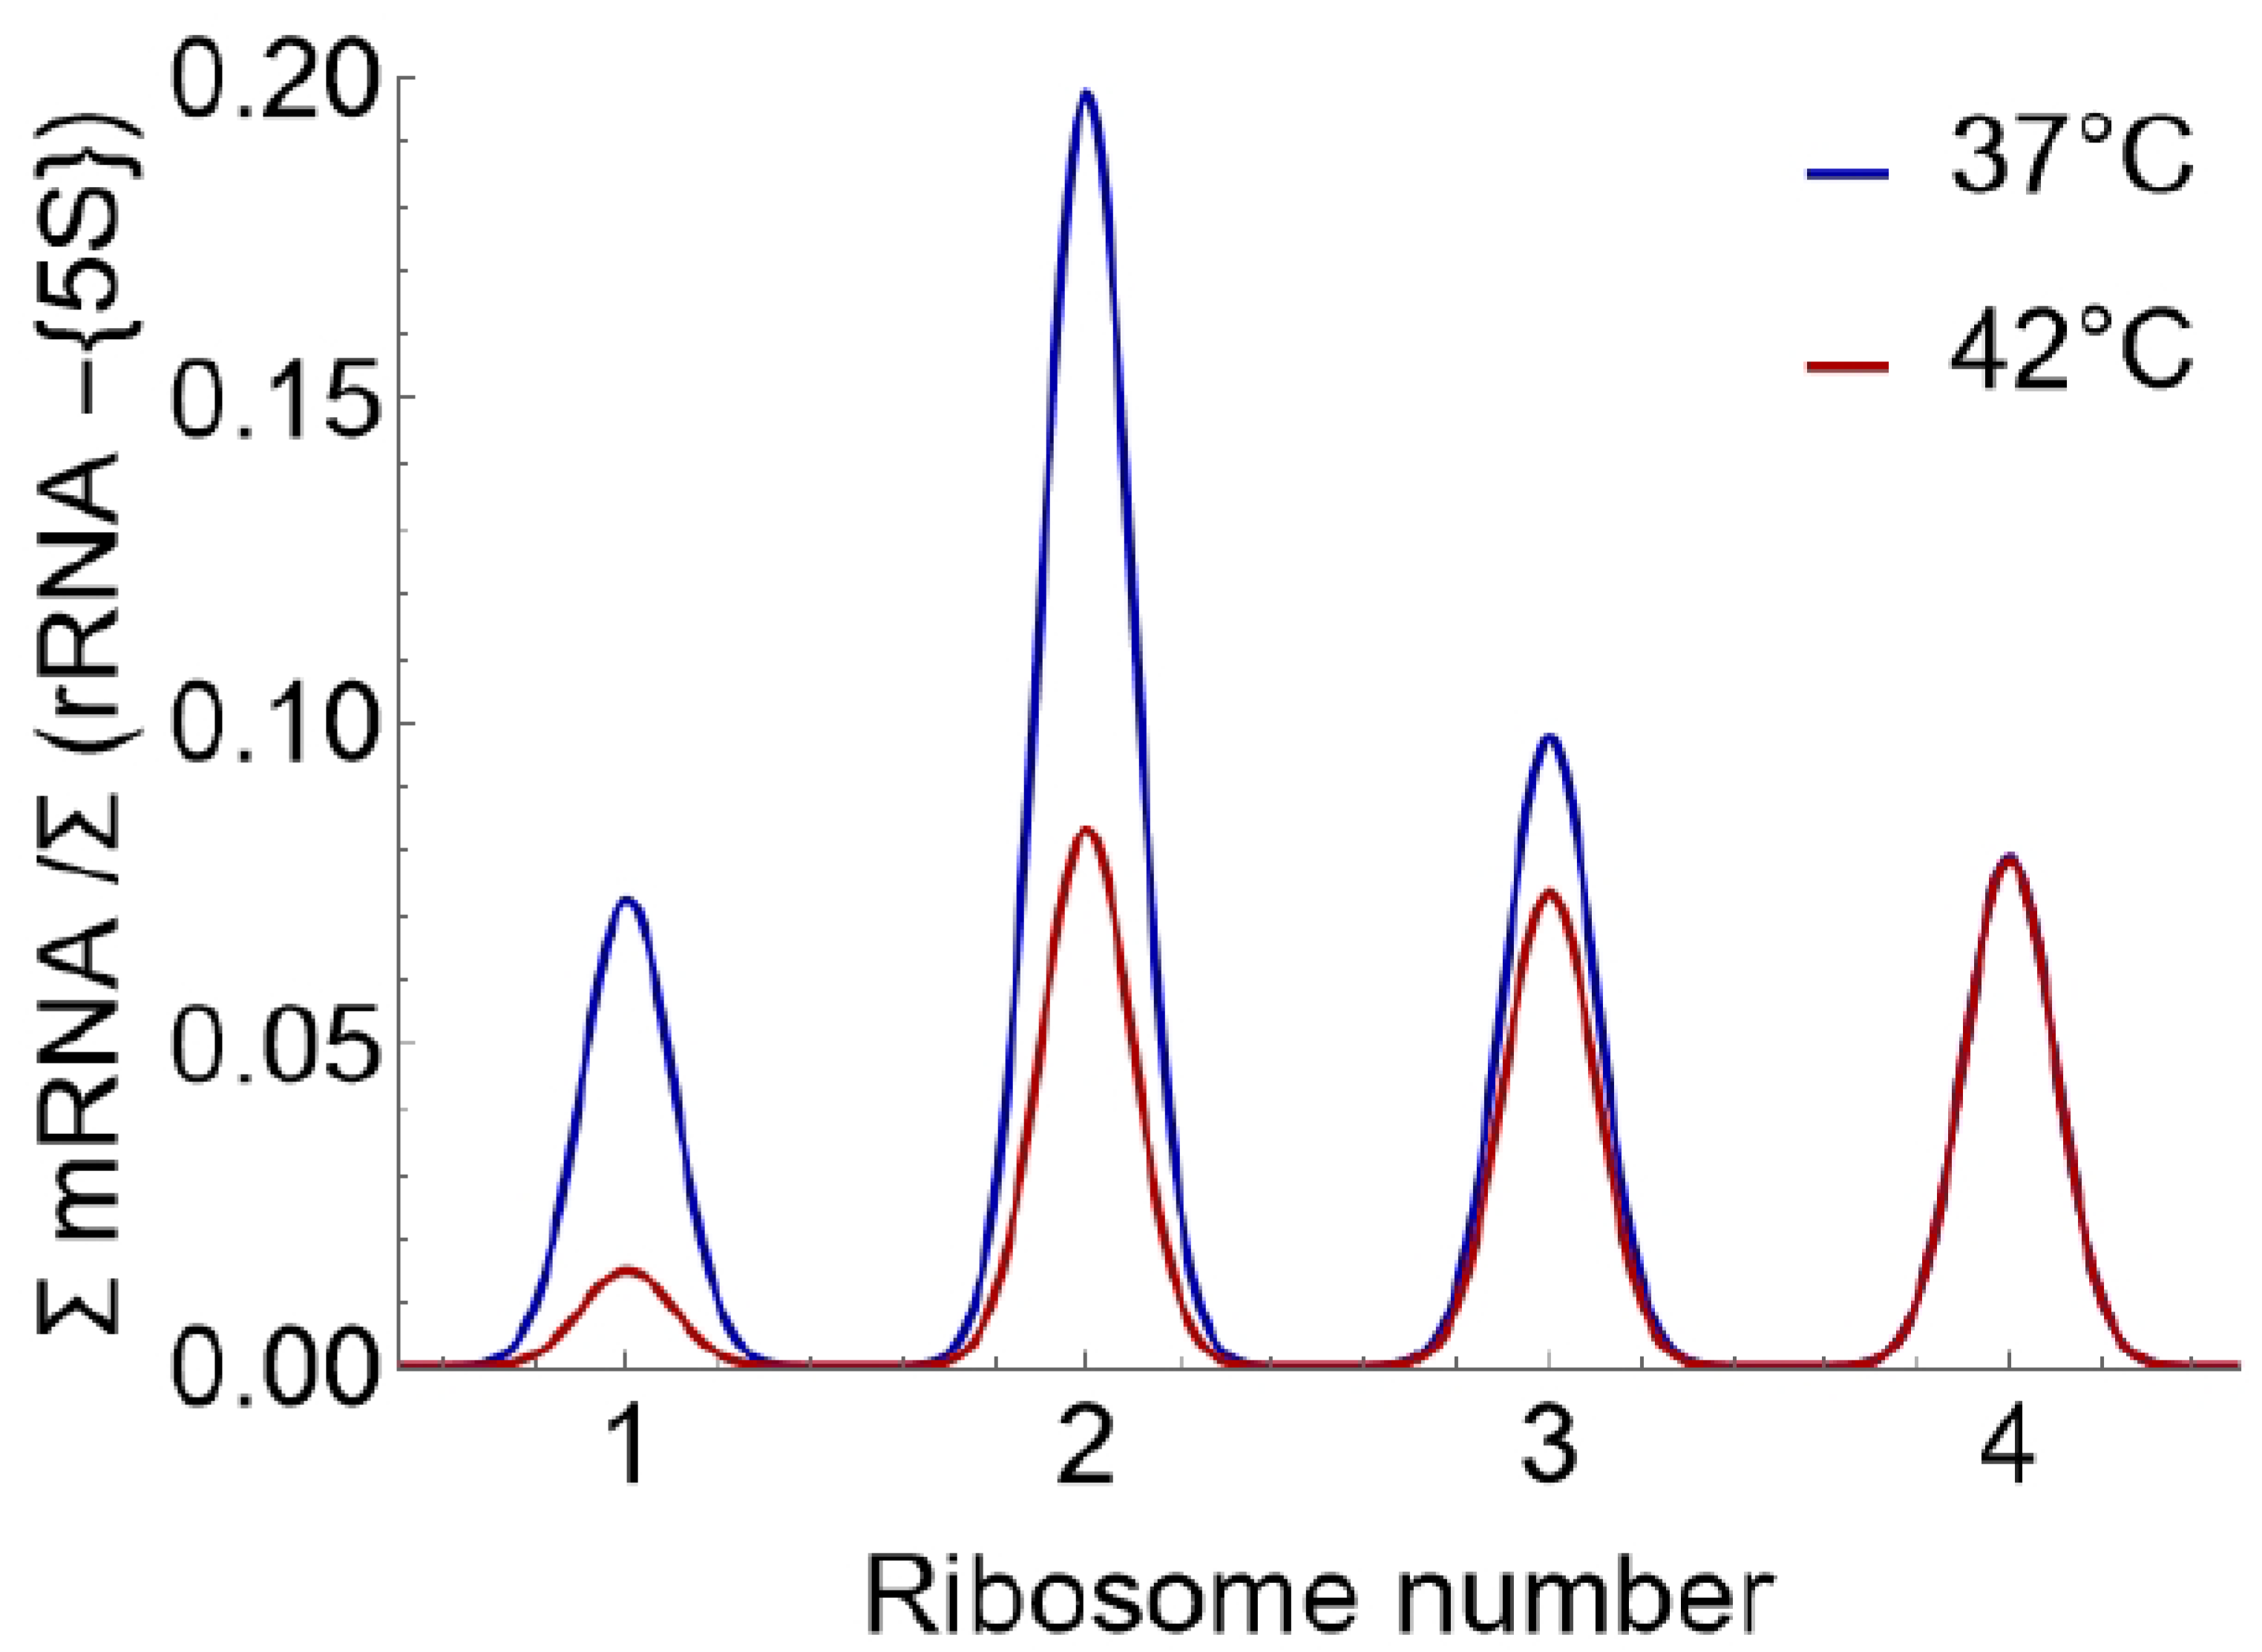
The corrected ratio is typically lower in monosomes under stress (Figure 7). To estimate the percent of active monosomes, the ratio must be compared with that of a stable polysomal reference—usually the tetrasome fraction. In both yeast and macrophages, the tetrasome ratios are highly similar (Figure 7) [1], allowing the estimation formula (see Step 30.b.viii) to simplify so that it becomes a function of only the monosome and ratios.
Applying this approach, macrophages retain ~20% active monosomes after heat stress. This estimate is similar to that obtained in yeast under heat stress. In yeast, qPCR was also used as a rapid alternative to RNA-seq for estimating silent ribosome levels under additional conditions. Accurate measurement using the qPCR option requires careful selection of a set of mRNAs (at least ten) that are highly expressed under both standard and stress conditions. Using such a set, we obtained a narrow spread of silent ribosome estimates, which both validated the RNA-seq results and enabled the use of qPCR as a faster alternative for estimating silent ribosome induction under other stress conditions [1]. A larger gene set will likely be needed for mammalian cells, as silent ribosome induction may coincide with an elongation block (see next section).
Integrating estimation of silent ribosomes with other parameters
In macrophages, mRNAs shift somewhat toward monosomes under heat stress [1]. This raises the possibility of an additional regulatory layer often attributed to stress-induced slowing or blocking of elongation, making ribosome-position analyses particularly informative. Several studies indeed report ribosome accumulation near the start codon, consistent with altered elongation dynamics [8,9]. Ribosome footprinting can reveal such features because, unlike polysome profiling, it uses RNase to digest unprotected regions of mRNA, thereby mapping ribosome positions and indicating potential elongation blocks. However, when both positional information and estimates of silent ribosome formation are required, a stoichiometric analysis becomes necessary. A method based on stoichiometric mRNA:rRNA ratios after digestion has been used to estimate silent ribosome levels under normal conditions [10]. The results in mammalian cells presented here support the use of such analyses under standard growth conditions, but stress-dependent adjustments may be required to develop a method that takes into account possible rRNA amplification. It is important to note that RNase I digests not only mRNA but also parts of rRNA, potentially altering the degree of anomalous rRNA amplification.
Finally, silent ribosome induction can be complemented by proteomic analyses [1], which may reveal additional signatures of translational dormancy.
Limitations
This protocol measures the fold change in silent ribosomes across conditions; it does not provide the absolute number or percentage of silent ribosomes under any specific condition.
Polysome profile traces may vary across cell types or experimental conditions. In such cases, standardization of ultracentrifugation parameters—including run speed, run time, and gradient composition—may be required.
Troubleshooting
Problem 1: Peaks Are Not Well Defined.
Potential Solution:
This may be due to loading too little sample. If too little sample is loaded, there are essentially a low amount of RNA and ribosomes that are ultracentrifuged. Since the gradient solution itself absorbs at 260nm, too little sample may lead to the absorbance of some or all peaks to not be enough to be noticeably above the background
Another (albeit counterintuitive) reason might be due to adding too much sample. Too much sample if added will not pass through the sucrose gradient during the ultracentrifugation run and will thus lead to peaks with low resolution.
We found that using an amount of sample corresponding to 2-5 A260 units leads to a polysome profile with adequate resolution.
Problem 2: Peaks Are Too Congested for Fractionation.
The polysome profile is dependent among other things, on the type of cells used and the conditions. For a particular gradient and a particular speed as well as runtime of centrifugation, different cells will give different polysome profile traces as will different conditions for the same type of cells. Under these circumstances, some fractions might encompass more than one peak or one peak might get split across two fractions.
Potential Solution:
This will require some degree of standardization. The speed of the ultracentrifugation can be varied as can its runtime. The gradient can also be changed.
A higher speed and/or runtime of the ultracentrifugation will push the contents of the cell lysate further up the gradient (i.e. towards the bottom of the tube). This will have the effect of essentially pushing the gradient towards the right.
Changing the gradient will have a different effect. Increasing the sucrose % in both the light and heavy sucrose solutions will lead to the lighter peaks (free, 40S, 60S, etc) to be compressed while the heavier peaks will have greater resolution, while decreasing the sucrose % will have the opposite effect. Decreasing the difference in sucrose % between the light and heavy solutions will lead to the peaks in the middle of the polysome profile (80S, disome, trisome) to be more compressed.
Note: If the gradient is changed, a different program will need to be used in the gradient station machine to prepare the gradients. The gradient station machine has numerous different preset gradients that the user can make.
Problem 3: Spike in Levels Show a Large Deviation Across Pools.
Since equal quantities of the spike-in RNAs were added to each pool, they should have equal intensities at the end. Them having a large deviation (we used the cutoff of CV > 1.0) is indicative of RNA loss.
Potential Solution:
This loss in RNA generally happens due to sucrose which can inhibit the pelleting of RNA in the ethanol precipitation. Generally, the fractions with higher sucrose concentration show higher loss (Figure 7). The solution to this is to dilute the pools as described in steps 15-17. If the final sucrose concentration is below 25%, it should not have a negative effect on the RNA extraction.
Problem 4: Low Ct Value of 25S rRNA
rRNA constitutes more than 95% of the transcriptome. Being a structural part of the large subunit of the ribosome, 25S rRNA is highly expressed in the cell which can lead to low Ct values (i.e., very early amplification that compromises precision) in qRT-PCR. In addition, rRNA has highly repetitive sequences which might lead to spurious amplification due to self-priming during qRT-PCR, leading to low Ct values.
Potential Solution:
We recommend at least a 1:1000 dilution of the cDNA resulting from the RT reaction to get Ct values for 25S rRNA in the quantifiable range. Depending on the resulting Ct values, the cDNA might need to be diluted further. Primers for 25S rRNA will also need to be carefully designed and validated through primer efficiency measurements to ensure there is no self-priming.
Problem 5: Low RNA Yield
This can happen due to either using too little starting sample (we recommend the sample to be equivalent to 2-5 A260 units), loss of sample during RNA extraction, or degradation of RNA.
Potential Solution:
Gradients, samples, RNA must be handled in a sterile manner with RNase free reagents and at 4 °C, unless otherwise stated.
Resource Availability
Lead Contact
Further information and requests for resources and reagents should be directed to and will be fulfilled by the lead contact, Attila Becskei (attila.becskei@unibas.ch).
Technical Contact
Technical questions on executing this protocol should be directed to and will be answered by the technical contact, Sayanur Rahaman (sayanur.rahaman@unibas.ch).
Materials Availability
This protocol did not generate any new unique reagents.
Data and Code Availability
RNA-seq data are deposited at the GEO database of the NCBI for polysome profiling of J774A.1 macrophage samples at 37 °C and 42 °C without rRNA depletion (GEO: GSE311393).
Author Contributions
S.R. and A.B designed the experiments, S.R and N.S carried out the experiments, S.R., A.B. and S.M. analyzed the data, S.R. and A.B wrote the manuscript.
Acknowledgments
We thank Phillippe Demougin (Genomics Facility, University of Basel/BSSE) for the preparation of Illumina libraries and Nitish Mittal for experimental assistance. J774A.1 murine macrophage cells were provided by Jean Pieters. This work was supported in part by the Swiss National Science Foundation (310030_185001).
Declaration of Interests
Authors declare no conflicts of interest.
References
- Rahaman, S., Schiffelholz, N., Mittal, N., Frohlich, K.E., Zavolan, M., and Becskei, A. (2025). Heat shock induces silent ribosomes and reorganizes mRNA turnover. Cell Rep 44, 116447. [CrossRef]
- Delaney, C.E., Becskei, A. (2025). Detection and Function of the Eukaryotic Vacant Ribosome. Preprints. [CrossRef]
- De Siqueira, M.K., Nouhi, Z., Zhao, Y., Wang, S., Xiao, X., Yang, X., Hulea, L., and Villanueva, C.J. (2025). Protocol to perform polysome profiling in primary differentiating murine adipocytes. STAR Protoc 6, 103799. [CrossRef]
- Masek, T., Valasek, L., and Pospisek, M. (2011). Polysome analysis and RNA purification from sucrose gradients. Methods Mol Biol 703, 293–309. [CrossRef]
- Patro, R., Duggal, G., Love, M.I., Irizarry, R.A., and Kingsford, C. (2017). Salmon provides fast and bias-aware quantification of transcript expression. Nat Methods 14, 417–419. [CrossRef]
- Rahaman, S., Faravelli, S., Voegeli, S., and Becskei, A. (2023). Polysome propensity and tunable thresholds in coding sequence length enable differential mRNA stability. Sci Adv 9, eadh9545. [CrossRef]
- Jaquet, V., Wallerich, S., Voegeli, S., Turos, D., Viloria, E.C., and Becskei, A. (2022). Determinants of the temperature adaptation of mRNA degradation. Nucleic Acids Res 50, 1092–1110. [CrossRef]
- Shalgi, R., Hurt, J.A., Krykbaeva, I., Taipale, M., Lindquist, S., and Burge, C.B. (2013). Widespread Regulation of Translation by Elongation Pausing in Heat Shock. Molecular Cell 49, 439–452. [CrossRef]
- Liu, B., Han, Y., and Qian, S.B. (2013). Cotranslational response to proteotoxic stress by elongation pausing of ribosomes. Mol Cell 49, 453–463. [CrossRef]
- Liu, B., and Qian, S.B. (2016). Characterizing inactive ribosomes in translational profiling. Translation (Austin) 4, e1138018. [CrossRef]
Figure 1.
Scheme for RNA extraction from fractions generated from polysome profile. The fractions generated from the polysome profile were first pooled as shown and a unit volume of spike-in RNAs added to each pool. The pools were then diluted into multiple tubes using the considerations explained in steps 15-17. Following this, the RNA was cleaned up by phenol-chloroform and ethanol precipitation and then the diluted tubes from each pool were merged. Finally, a second, column-based cleanup was carried out for each pool.
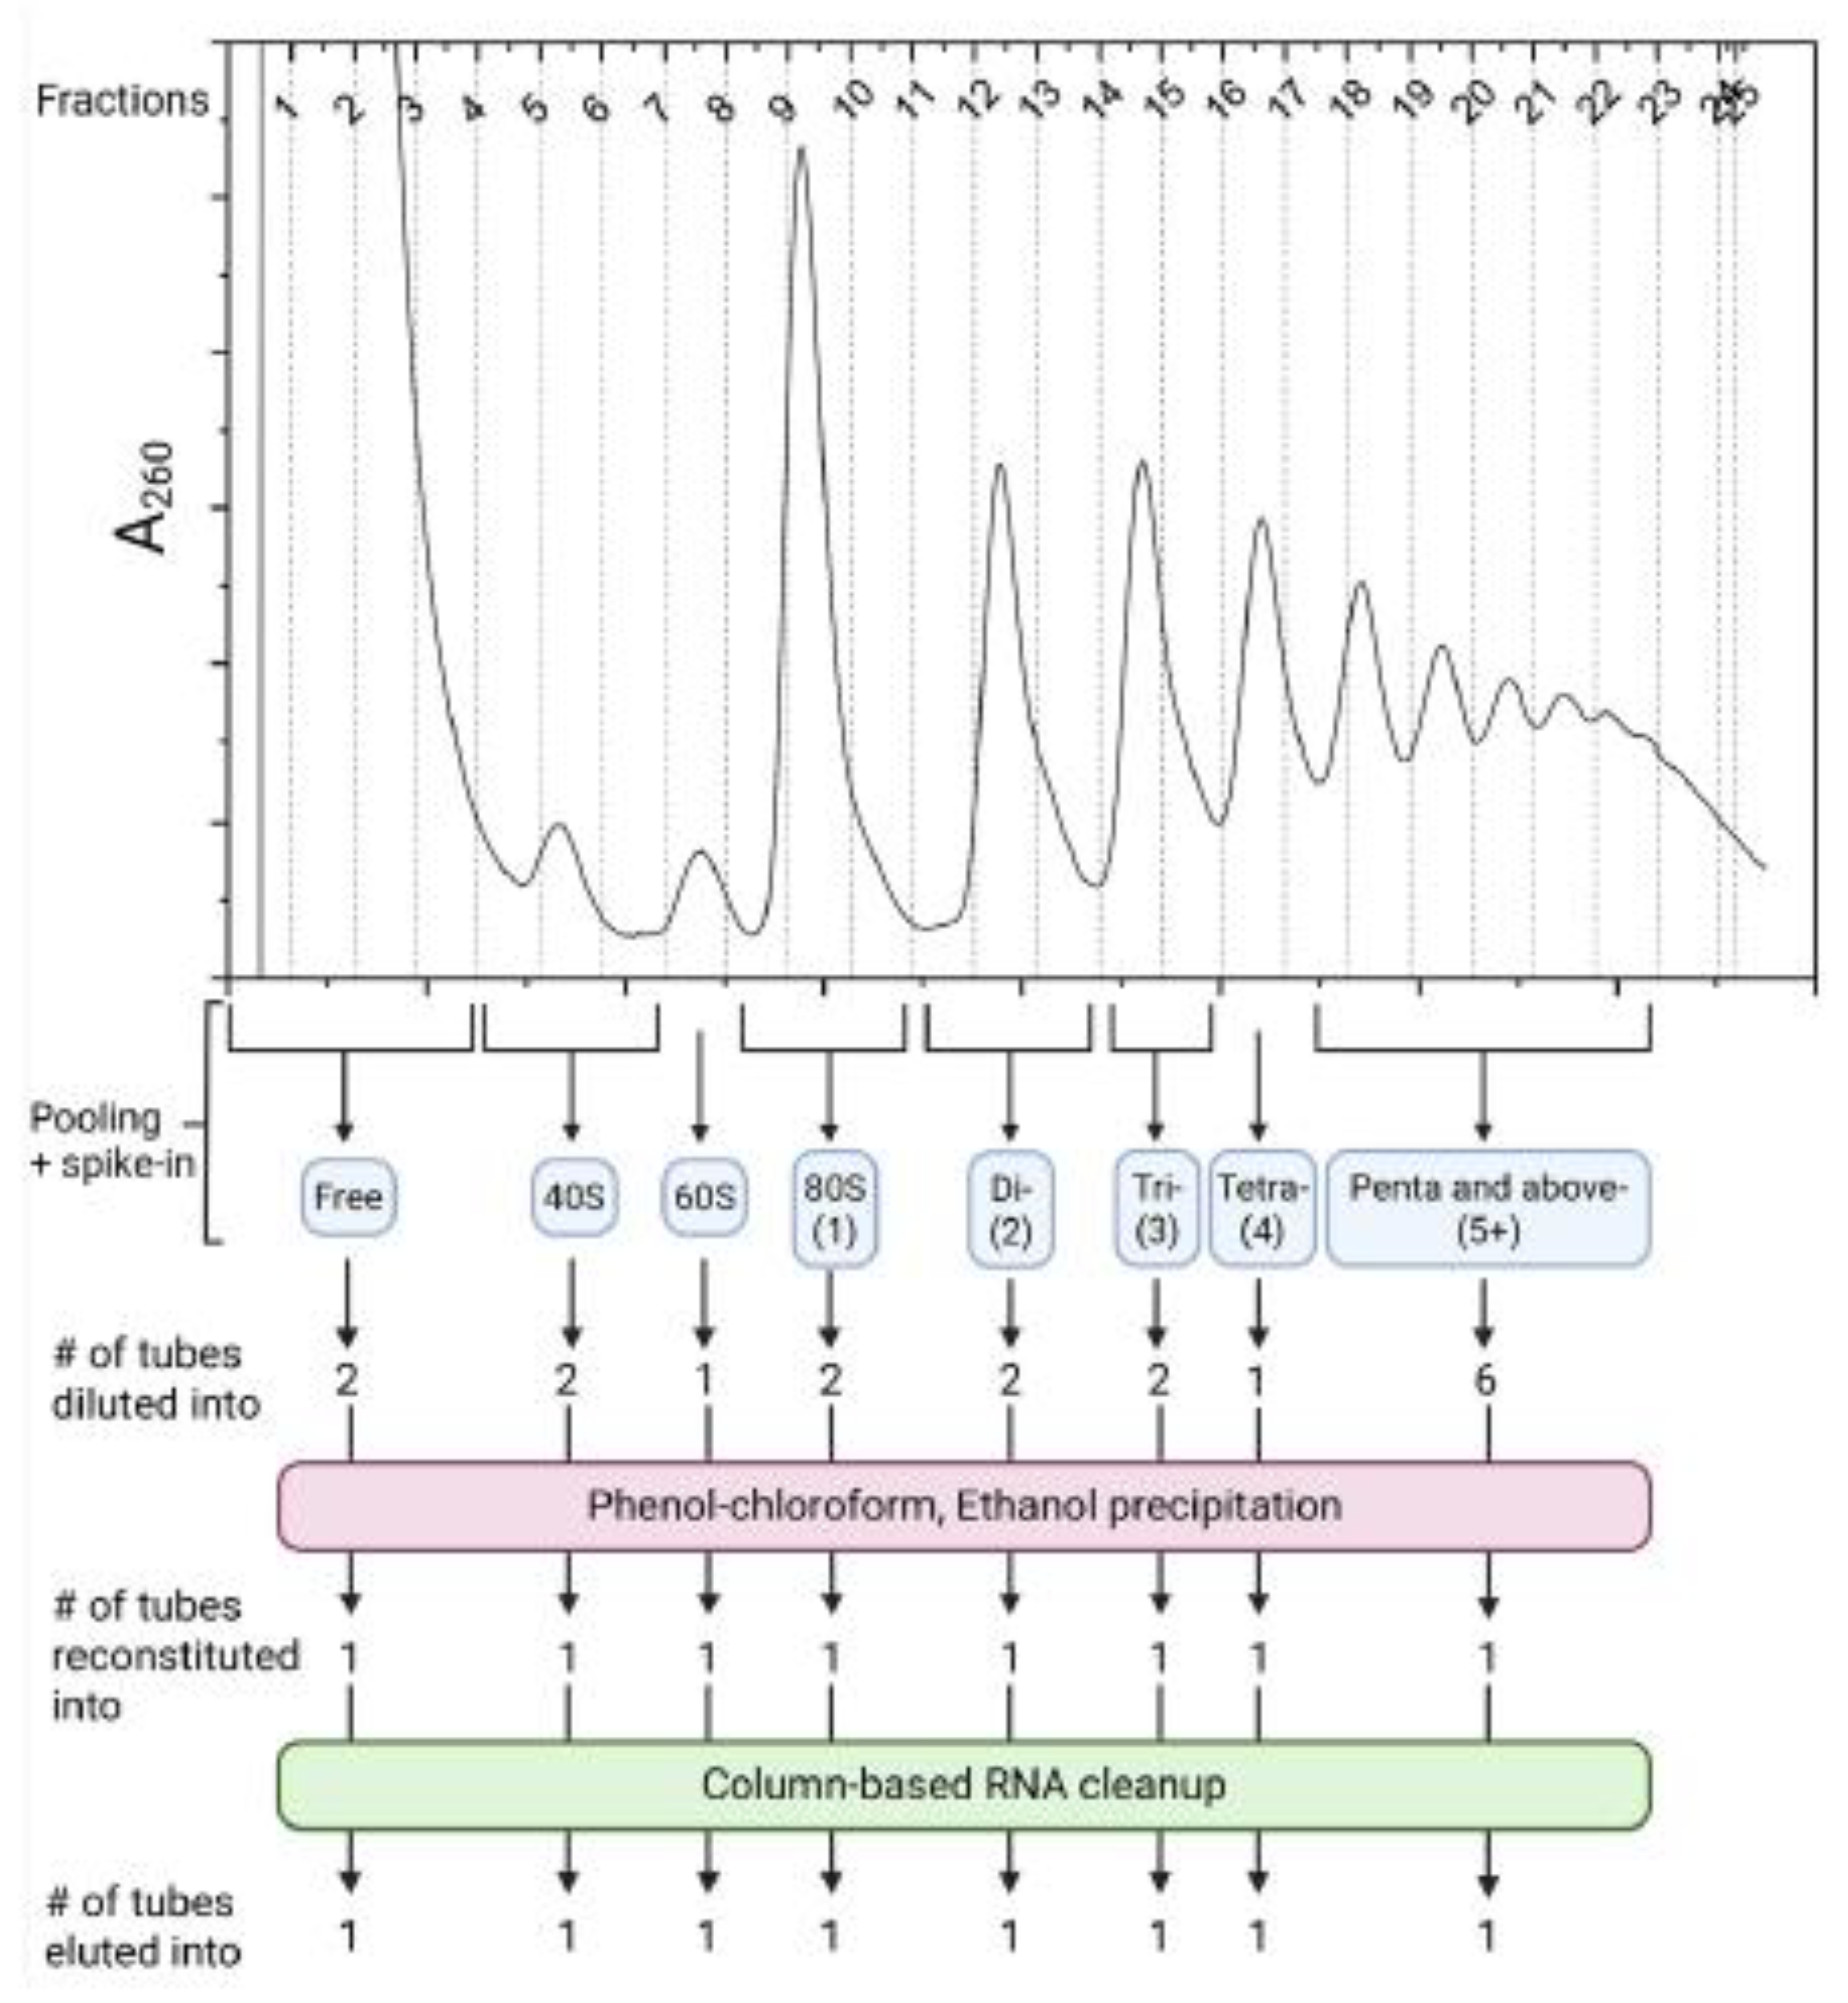
Figure 2.
Scheme for quantifying silent ribosome induction by qPCR. Scheme shows an outline of the processes detailed in step 31.a.
Figure 2.
Scheme for quantifying silent ribosome induction by qPCR. Scheme shows an outline of the processes detailed in step 31.a.
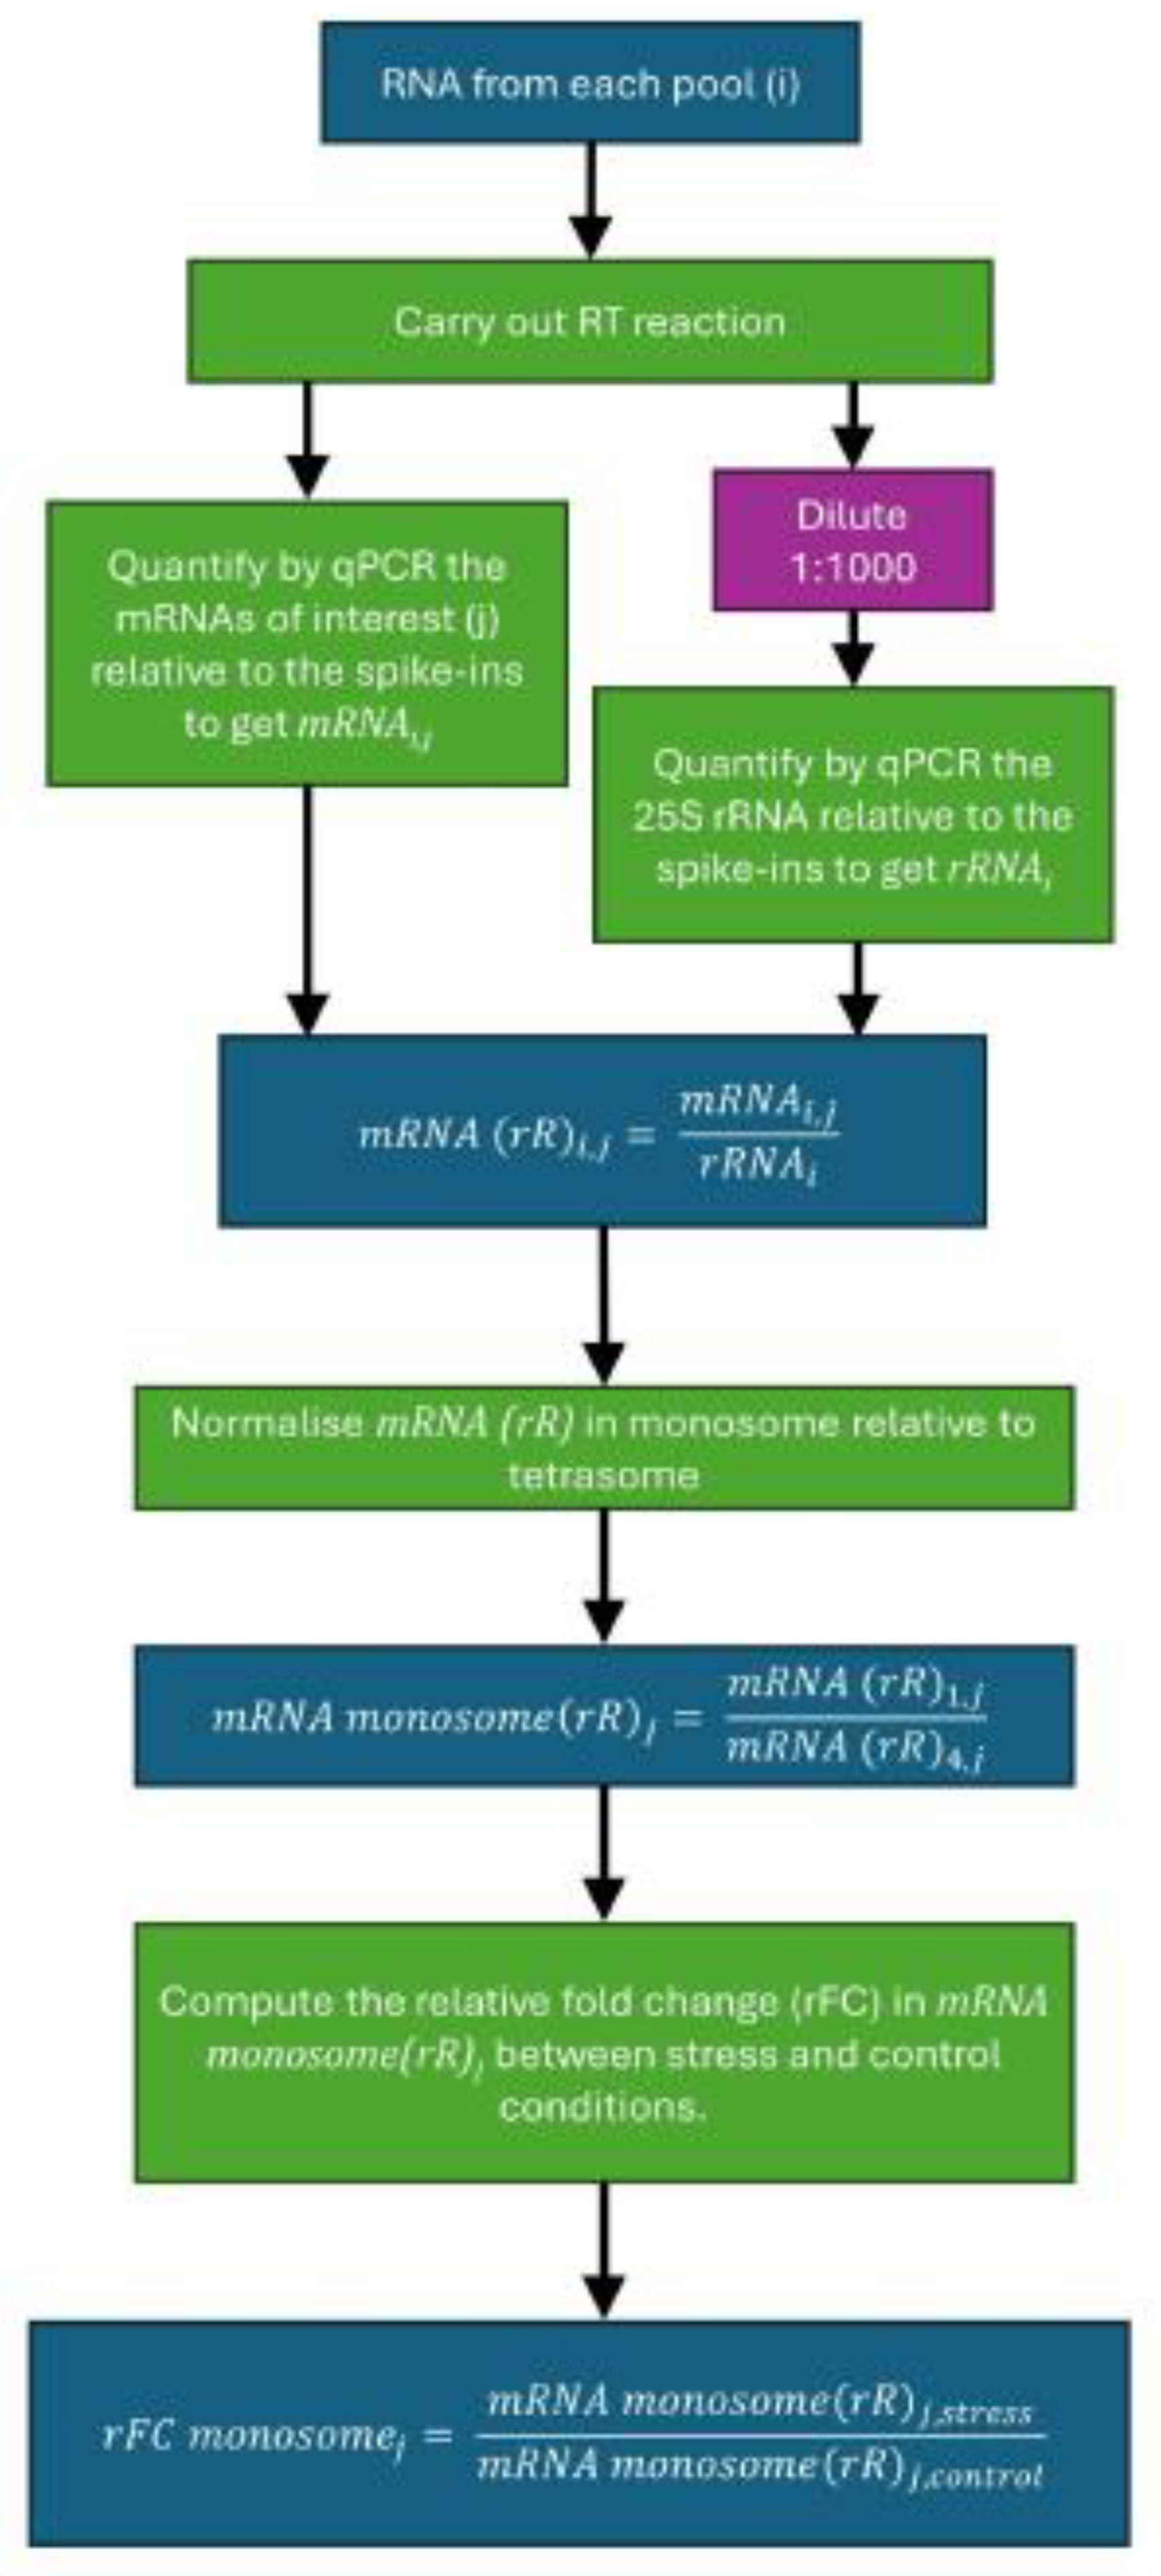
Figure 3.
Scheme for quantifying silent ribosome induction by RNA-Seq. Scheme shows an outline of the processes detailed in step 31.b.
Figure 3.
Scheme for quantifying silent ribosome induction by RNA-Seq. Scheme shows an outline of the processes detailed in step 31.b.
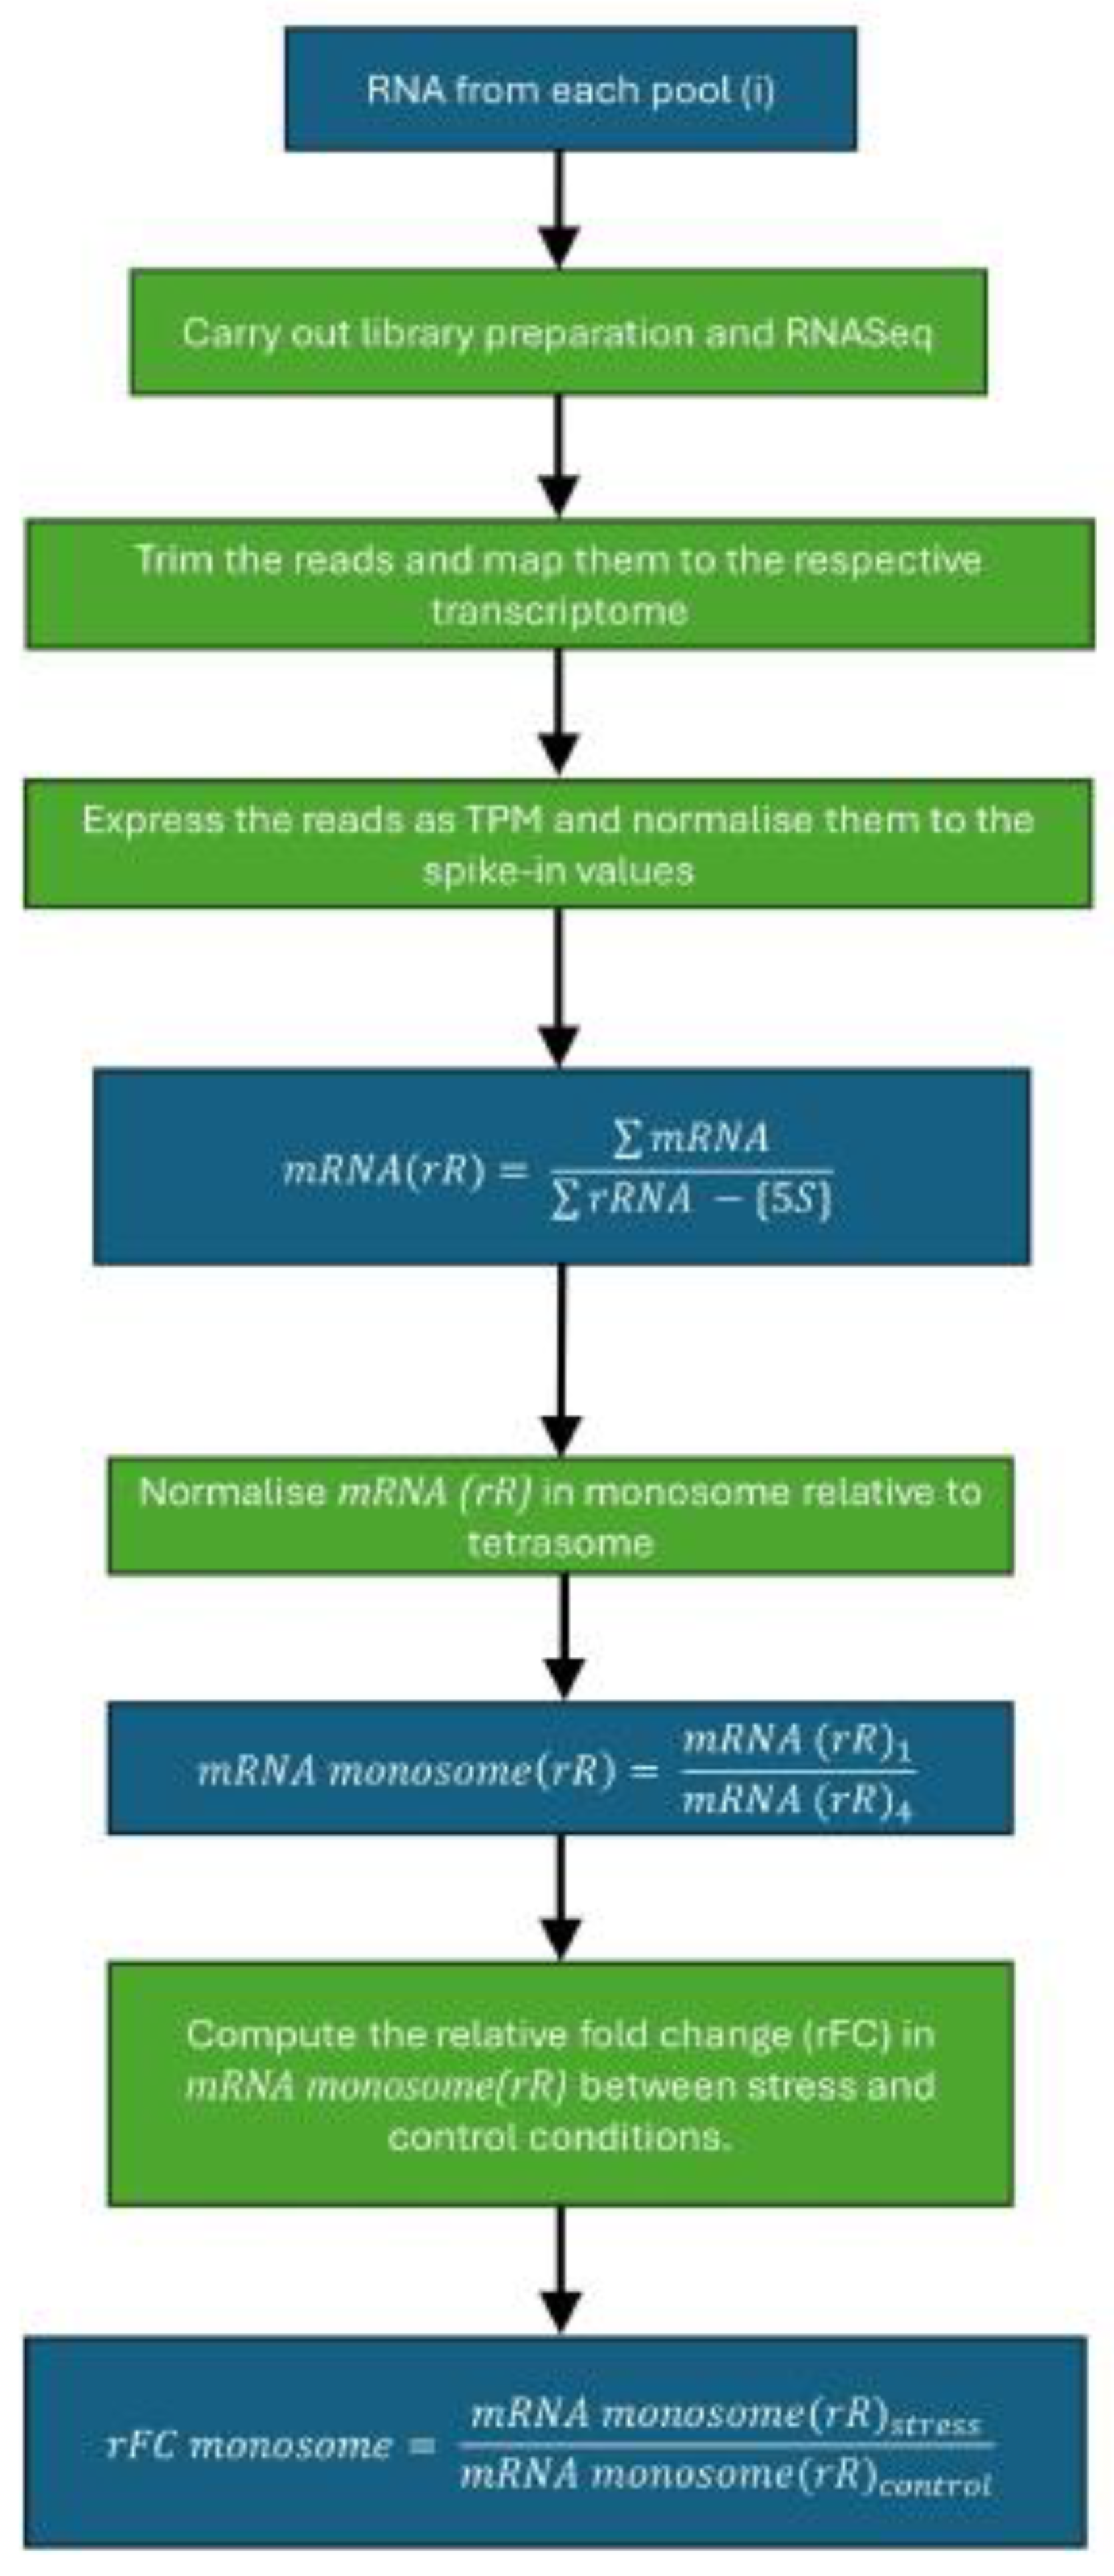
Figure 4.
Dilution of the polysome profiling fractions leads to consistent RNA extraction. (A) Comparison of two similar polysome profiling experiments which differed only in the fact that in one, the fractions were pooled and diluted as described in this paper and in the other, they were extracted without dilution. We see that in the non-diluted sample there is a greater variation in the spike-in intensities and especially the heavier polysomes which would have higher sucrose yield lesser RNA. (B) The mean CV of the spike-in RNAs across all pools/ fractions, calculated for two different spike-ins, for the experiments in which the fractions were diluted (red) and non-diluted (blue). Error bars show SEM, N=2 replicates.
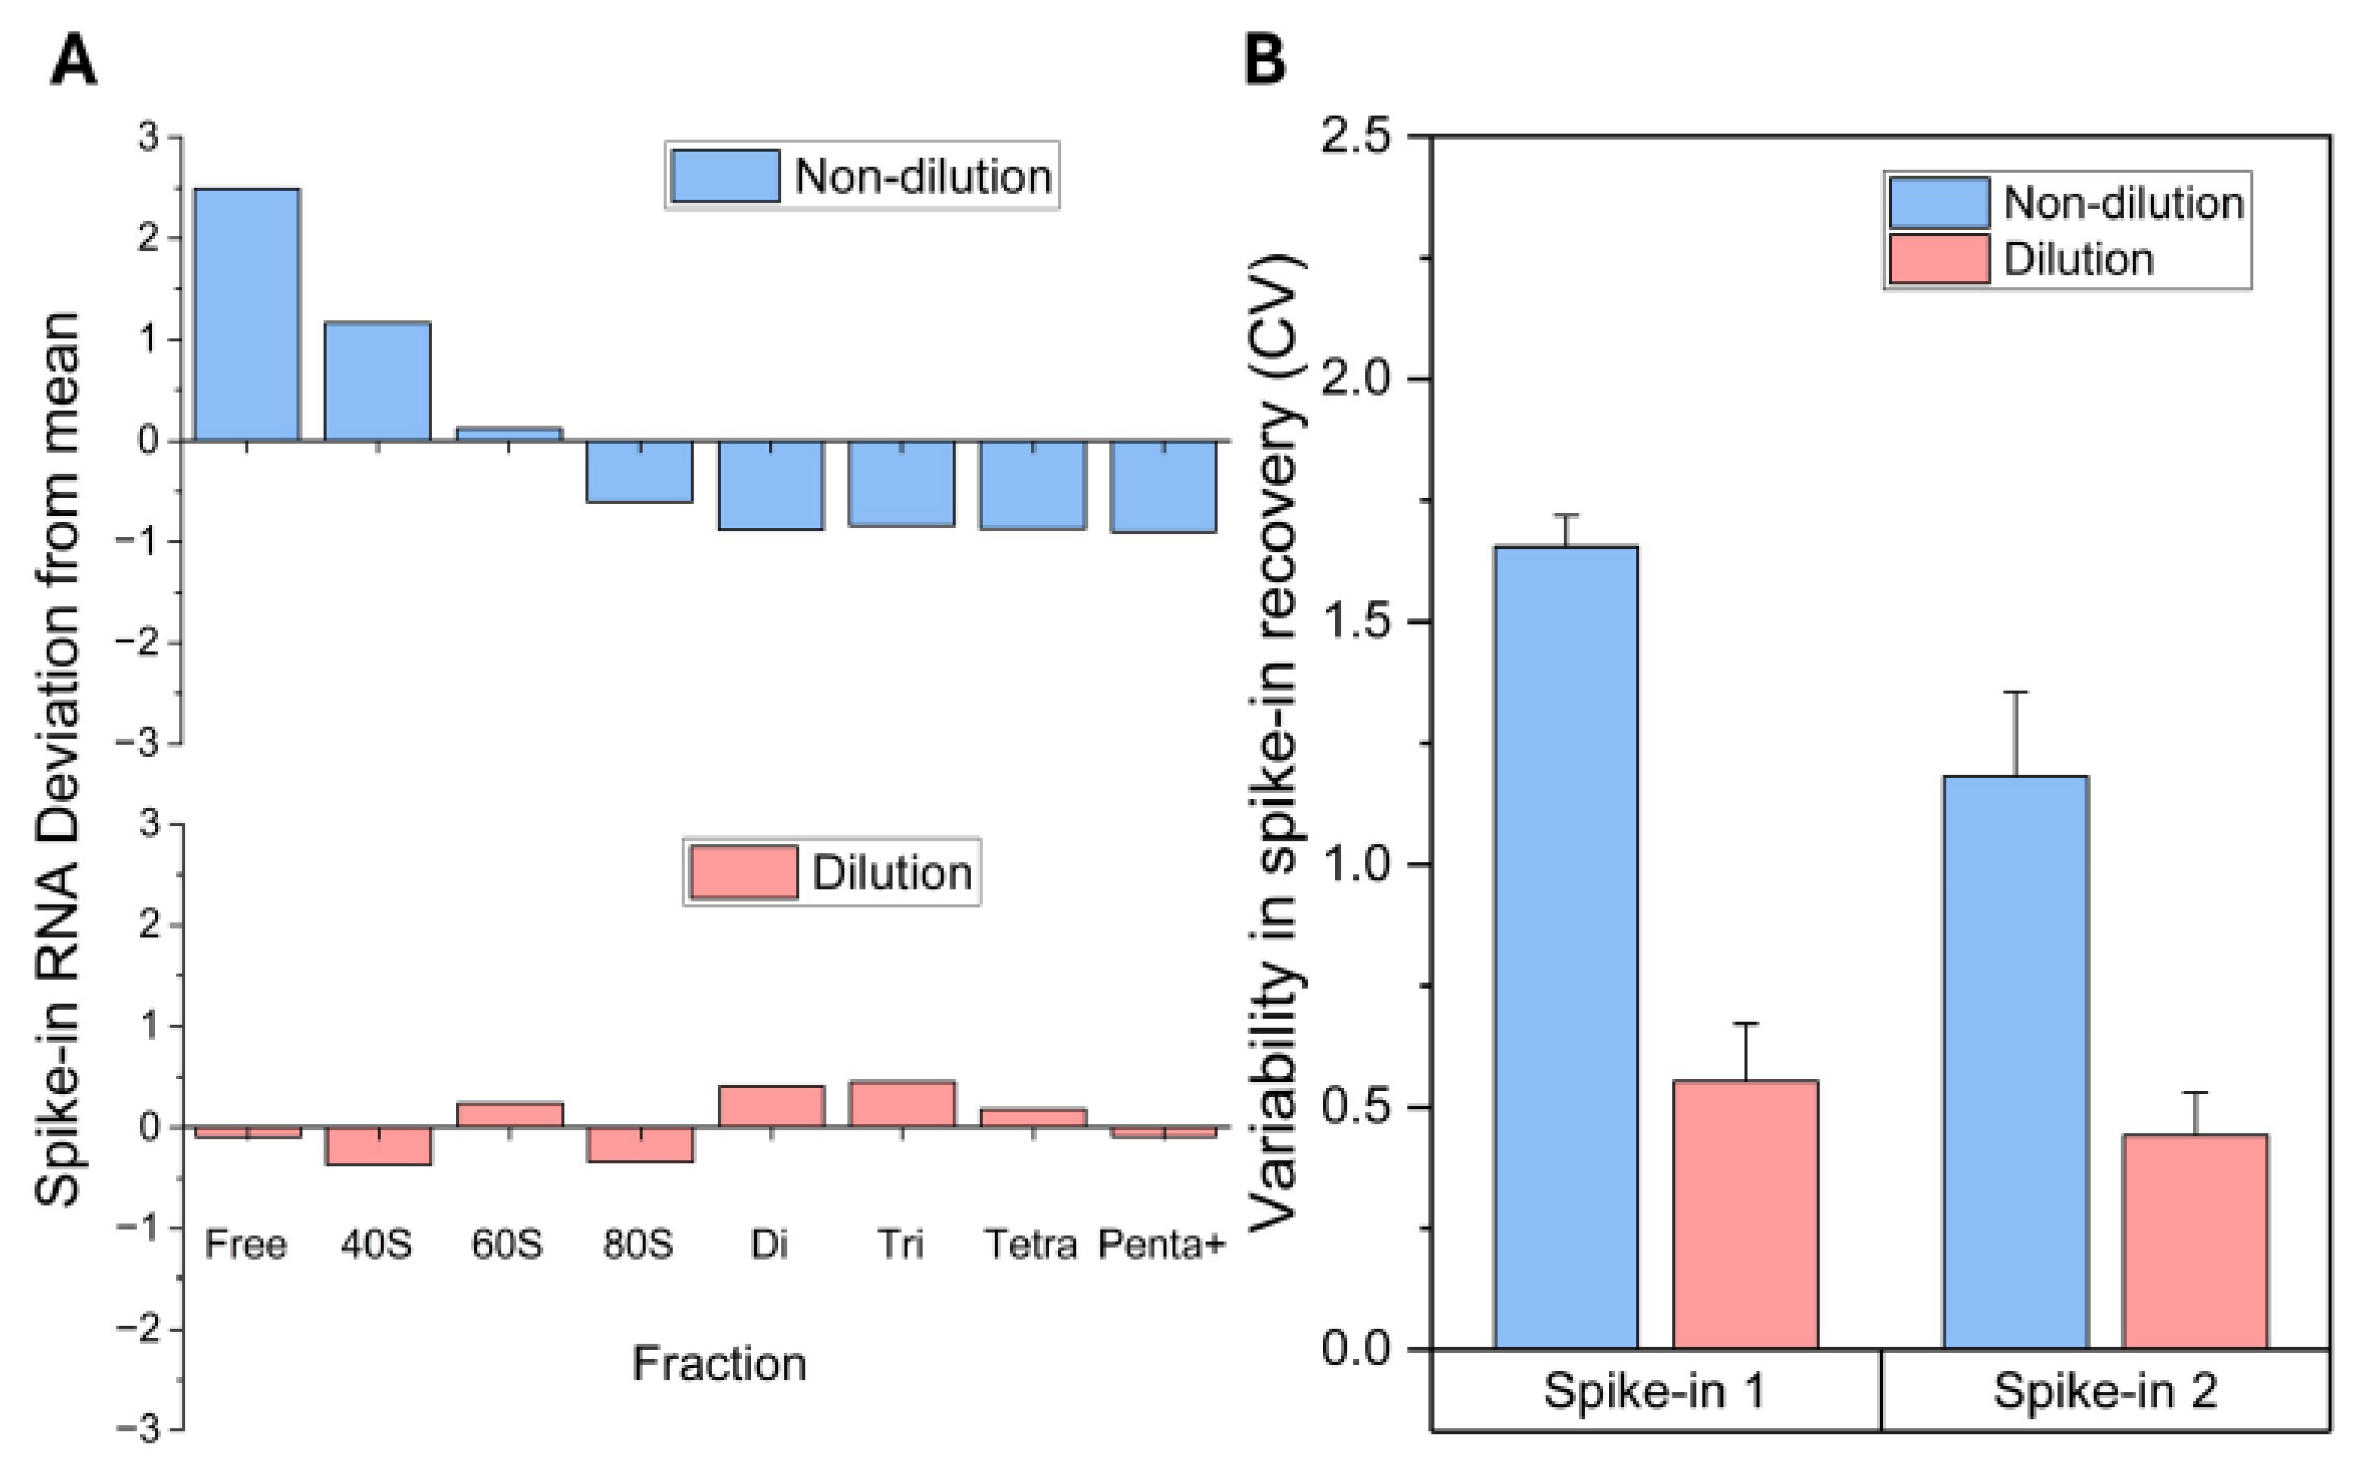
Figure 5.
Polysome profile under standard and stress conditions. Polysome profile traces of BY4743 cells under standard conditions (2% glucose, black solid line), ethanol stress (12% EtOH, 20min, red dashed line), and glucose depletion stress (0% glucose, 20min, blue dashed line).
Figure 5.
Polysome profile under standard and stress conditions. Polysome profile traces of BY4743 cells under standard conditions (2% glucose, black solid line), ethanol stress (12% EtOH, 20min, red dashed line), and glucose depletion stress (0% glucose, 20min, blue dashed line).
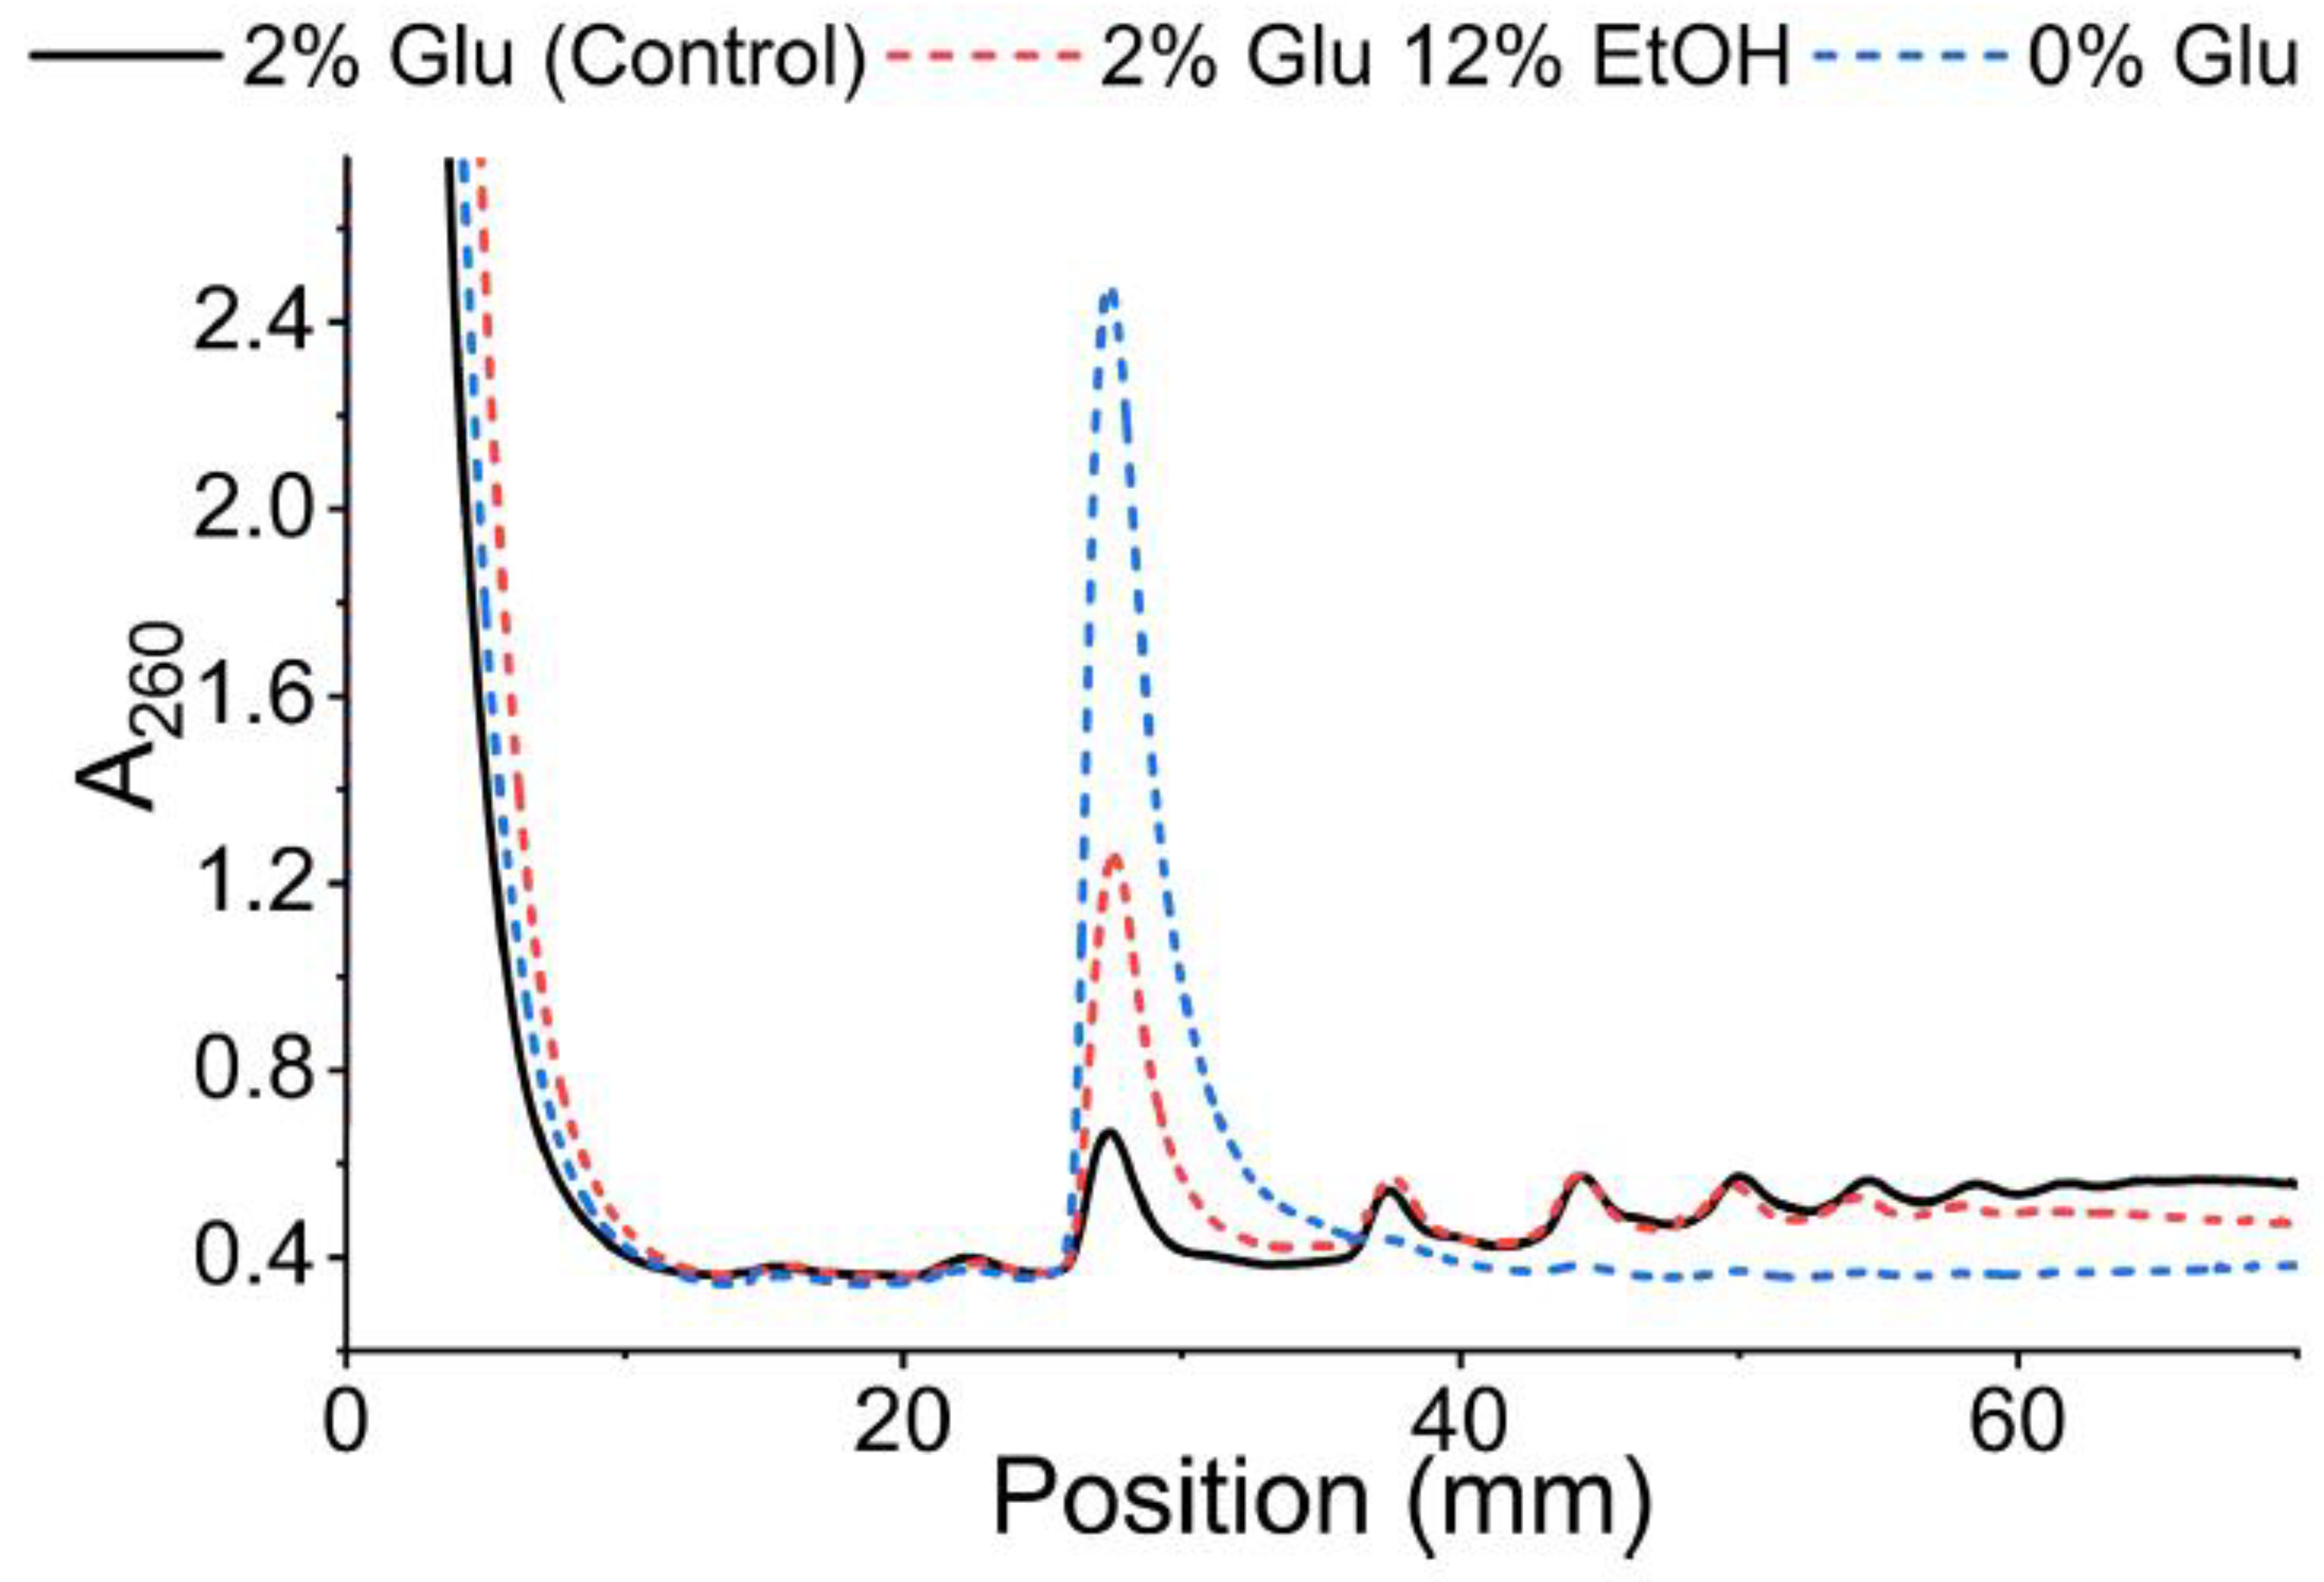
Figure 6.
Consistency of the 5S / 28S (Rn5S / Rn28S1) rRNA ratios measured with RNA-seq in macrophages. The non-depleted RNA samples isolated from the polysome profiling fractions are shown with the indicated ribosome numbers. No additional column-based purification was performed to remove 5S rRNA. The thick dark and the thin light lines denote the mean and standard deviation (n = 3 biological replicates) of the ratios.
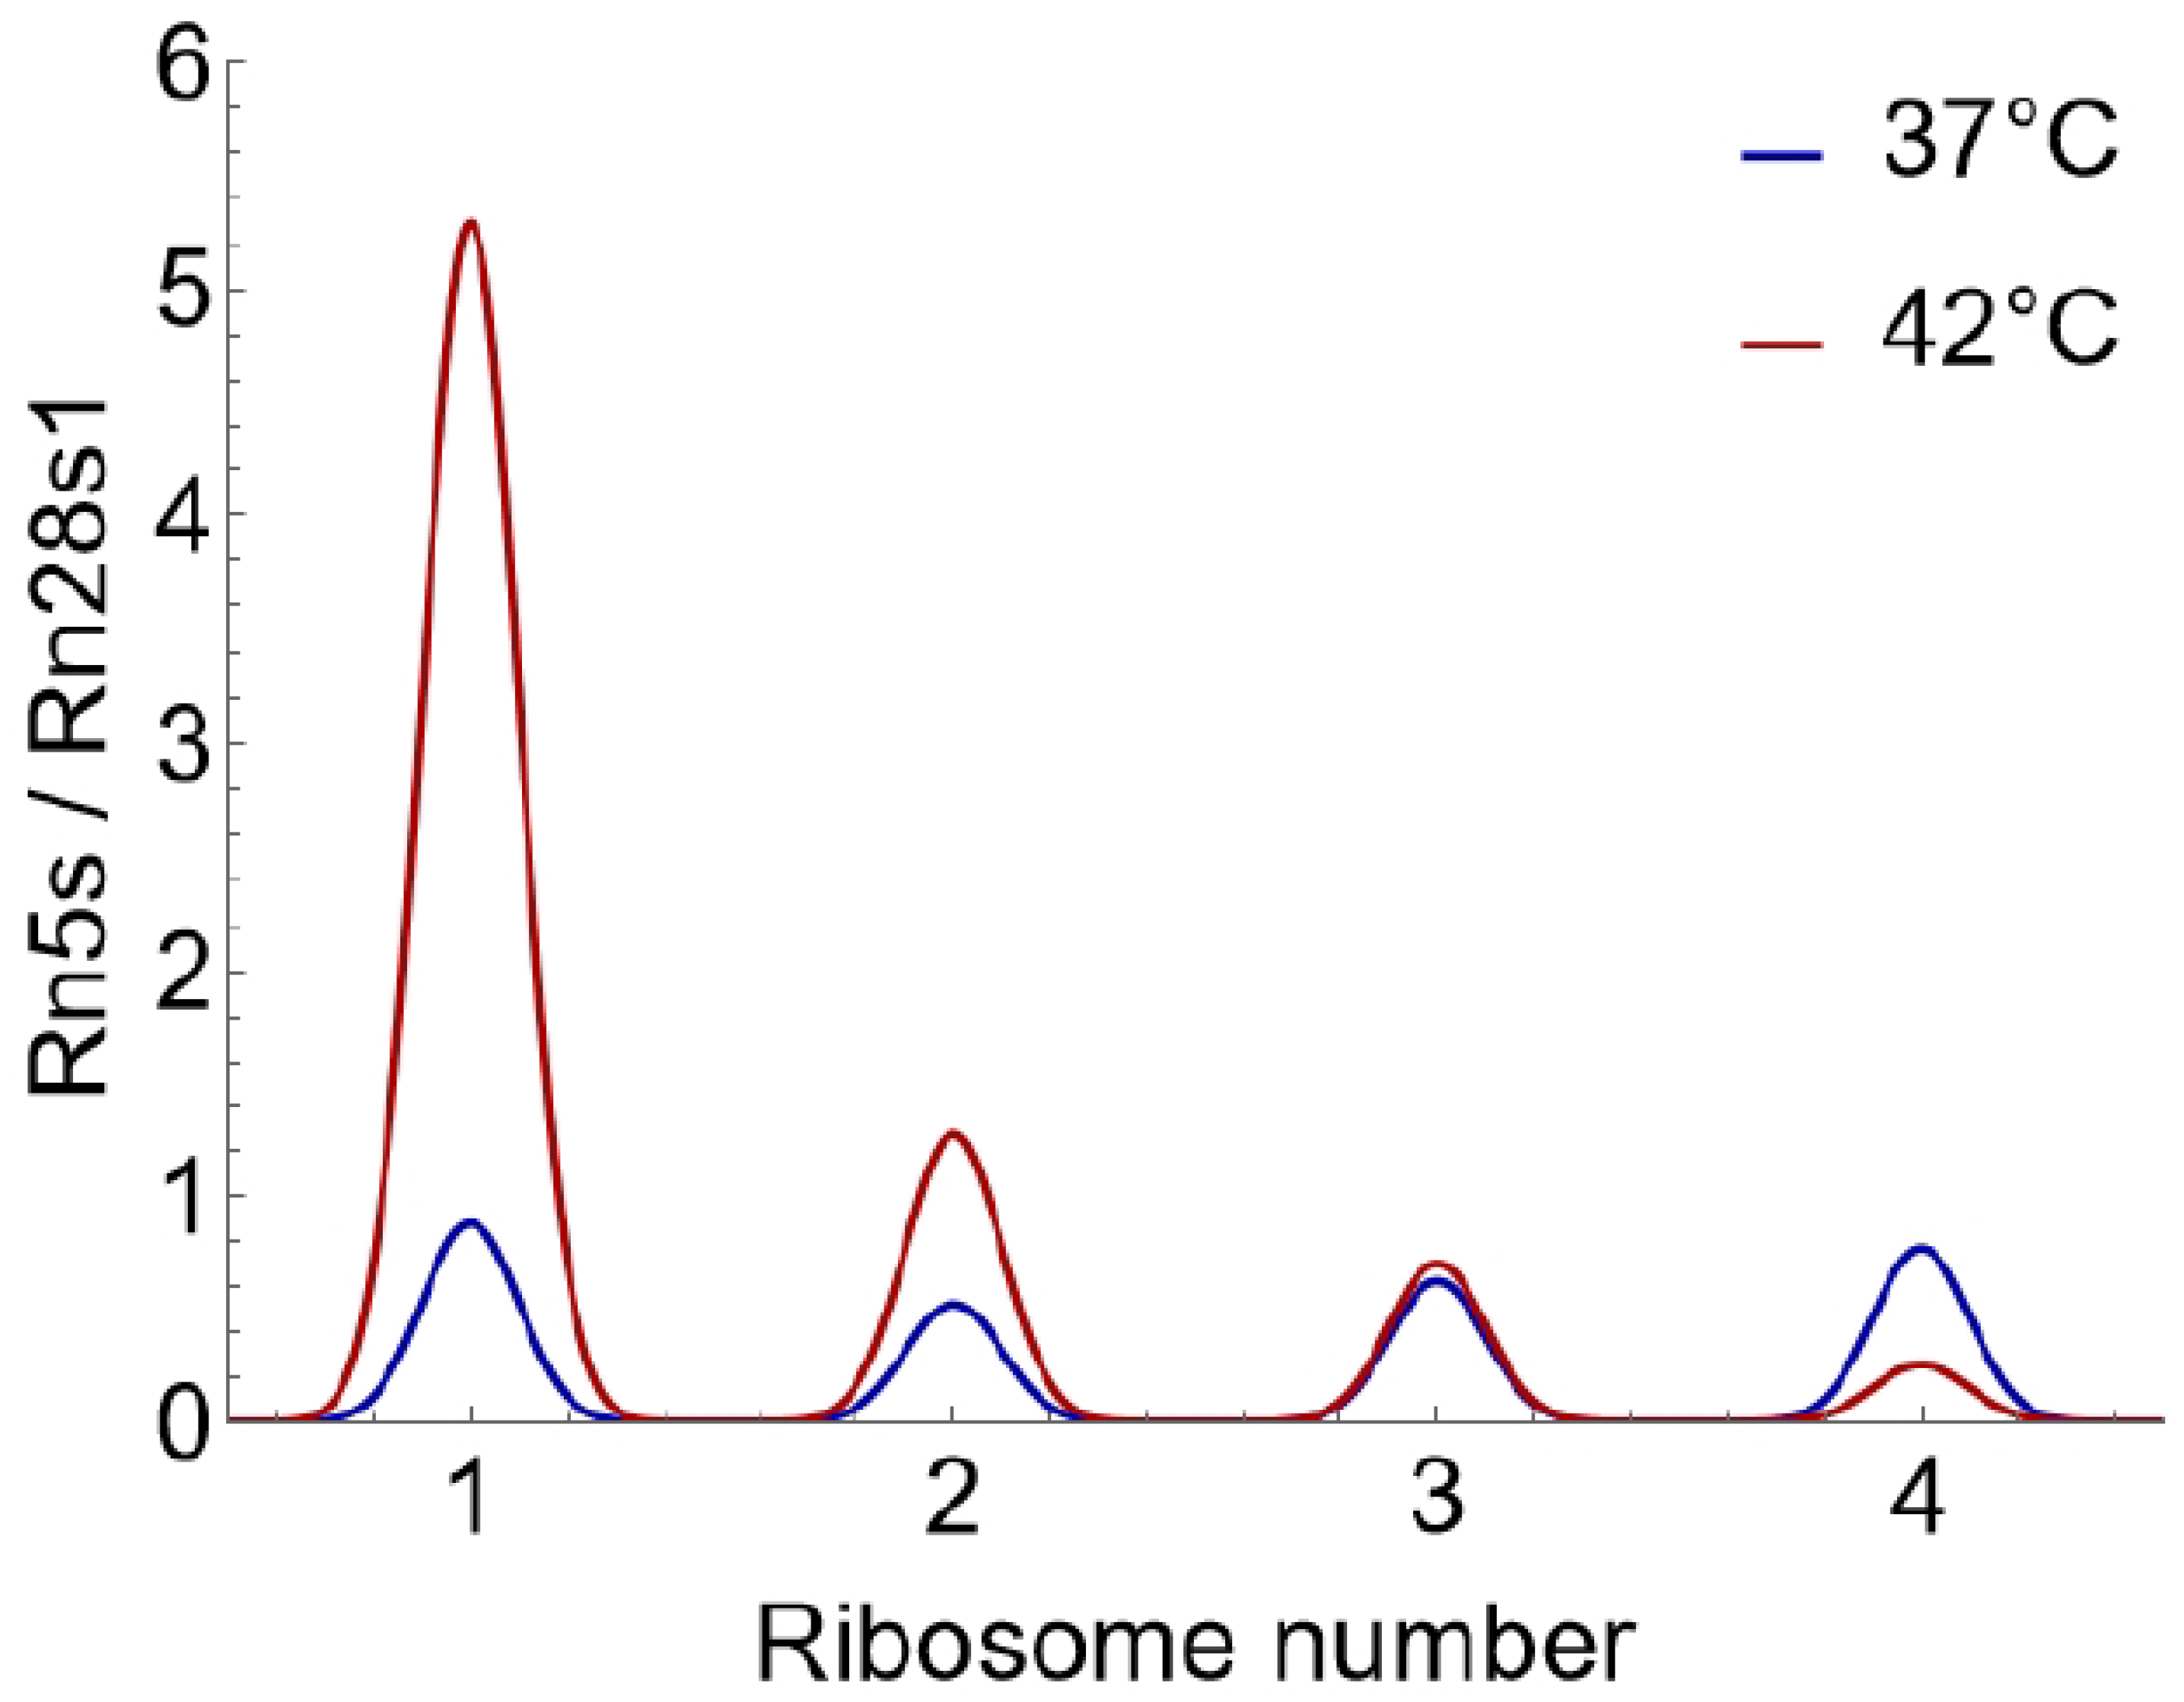
Figure 7.
Estimation of the silent ribosomes using RNA-seq in macrophages. RNA-seq data obtained from RNA samples in which rRNA was not depleted. mRNAs and rRNAs (5.8S, 18S, and 25S) levels were summed in TPM units to calculate the ∑mRNA/∑(rRNA-{5S}) ratio. The peak values of the bell-shaped curves denote the ratios at 37°C (control) and 42°C (heat stress).
Disclaimer/Publisher’s Note: The statements, opinions and data contained in all publications are solely those of the individual author(s) and contributor(s) and not of MDPI and/or the editor(s). MDPI and/or the editor(s) disclaim responsibility for any injury to people or property resulting from any ideas, methods, instructions or products referred to in the content. |
© 2025 by the authors. Licensee MDPI, Basel, Switzerland. This article is an open access article distributed under the terms and conditions of the Creative Commons Attribution (CC BY) license (http://creativecommons.org/licenses/by/4.0/).
Copyright: This open access article is published under a Creative Commons CC BY 4.0 license, which permit the free download, distribution, and reuse, provided that the author and preprint are cited in any reuse.


